in cellulo structure determination of a novel cypovirus
TRANSCRIPT
research papers
Acta Cryst. (2014). D70, 1435–1441 doi:10.1107/S1399004714004714 1435
Acta Crystallographica Section D
BiologicalCrystallography
ISSN 1399-0047
In cellulo structure determination of a novelcypovirus polyhedrin
Danny Axford,a Xiaoyun Ji,b
David I. Stuarta,b and Geoff
Suttonb*
aDiamond Light Source Ltd, Harwell Oxford,
Didcot OX11 0DE, England, and bDivision of
Structural Biology, The Welcome Trust Centre
for Human Genetics, University of Oxford,
Oxford OX3 7BN, England
Correspondence e-mail: [email protected]
This work demonstrates that with the use of a microfocus
synchrotron beam the structure of a novel viral polyhedrin
could be successfully determined from microcrystals within
cells, removing the preparatory step of sample isolation and
maintaining a favourable biological environment. The data
obtained are of high quality, comparable to that obtained from
isolated crystals, and enabled a facile structure determination.
A small but significant difference is observed between the
unit-cell parameters and the mosaic spread of in cellulo and
isolated crystals, suggesting that even these robust crystals are
adversely affected by removal from the cell.
Received 24 November 2013
Accepted 1 March 2014
PDB references: OpbrCPV18,
in cellulo, 4otv; isolated, 4ots
1. Introduction
In vivo crystallization, despite producing long-recognized
cases of biological self-assembly, has typically been regarded
as anomalous behaviour (Doye et al., 2004) and as such has
received relatively little attention in the structural biology
community. This is especially remarkable when contrasted
with the effort that has gone into in vitro protein crystal-
lization for structural studies. Notable biological processes
that involve in vivo crystallization include protein storage in
seeds (Colman et al., 1980), secretion of the hormone insulin
(Dodson & Steiner, 1998), numerous cases of pathological
overexpression (Wang et al., 2012), toxin production by
Bacillus thuringiensis (Schnepf et al., 1998) and encapsulation
in certain genera of insect viruses (Anduleit et al., 2005).
Crystallization of heterologous protein has also been seen in
Chinese hamster ovary (CHO) cells engineered to overexpress
immunoglobulin (Hasegawa et al., 2011). Another engineered
expression system, the baculovirus–Sf9 system, exploits the
ability of the virus to induce the expression of the protein
required for the production of viral inclusion bodies within
insect cells. With the use of this method, in vivo crystallization
has been seen to occur when the expression cassette encodes
a related polyhedrin (Zhou et al., 1998), a chimera of a poly-
hedrin and the protein of interest (Ijiri et al., 2009), and, in
isolated cases, polyhedrin-free protein (Fan et al., 1996;
Koopmann et al., 2012). One limiting factor in the harnessing
of in vivo crystallization for structural studies is the typically
small size that crystals grow to, as constrained by the contents
and dimensions of the cell. Recently, in vivo protein crystal-
lization has been presented as a suitable method for the
production of samples for structural studies with X-ray free-
electron lasers (XFELs; Koopmann et al., 2012). The XFEL
technique of serial femtosecond crystallography (SFX) is
achieved with a large number of small samples passed
sequentially through a pulsed, ultrabrilliant X-ray beam
(Chapman et al., 2011). As a proof of principle of this, struc-
ture determination of the non-polyhedrin protein cathepsin
from Trypanosoma brucei has been accomplished via SFX
(Redecke et al., 2013), utilizing baculovirus expression to
trigger in vivo crystallization, followed by purification of
crystals. Microfocus beamlines at third-generation synchro-
tron sources have also proven to be capable of successful
structure solution from in vivo-produced polyhedra (Couli-
baly et al., 2007, 2009; Ji et al., 2010). In all of these structural
studies, in vivo-grown crystals have been isolated and purified
from the host cells prior to data collection. In this work, we
present a novel approach whereby crystals are investigated
in cellulo by mounting frozen live cells directly in the X-ray
beam. We use as an exemplar the successful structure deter-
mination of a novel polyhedrin from a cytoplasmic poly-
hedrosis virus (CPV) which infects the winter moth
Operophtera brumata from our ongoing studies into polyhedra
from insect viruses. Not only does the in cellulo approach
reduce the time and effort required, it also maintains the
samples in a biologically relevant environment, e.g. in the
presence of other cellular components and under cellular ionic
conditions. The workflow enabling the structure determina-
tion is both time-efficient and sample-efficient, and has
produced high-quality data from significantly fewer crystals
of only 4–5 mm in diameter, representing a crystal volume
roughly an order of magnitude smaller than that of the crystals
used for previous analyses (Coulibaly et al., 2007, 2009; Ji et al.,
2010).
2. Materials and methods
2.1. Infection/expression
The polyhedrin gene for O. brumata CPV18 (OpbuCPV18)
was synthesized by GeneArt (Life Technologies) based on
research papers
1436 Axford et al. � Cypovirus polyhedrin Acta Cryst. (2014). D70, 1435–1441
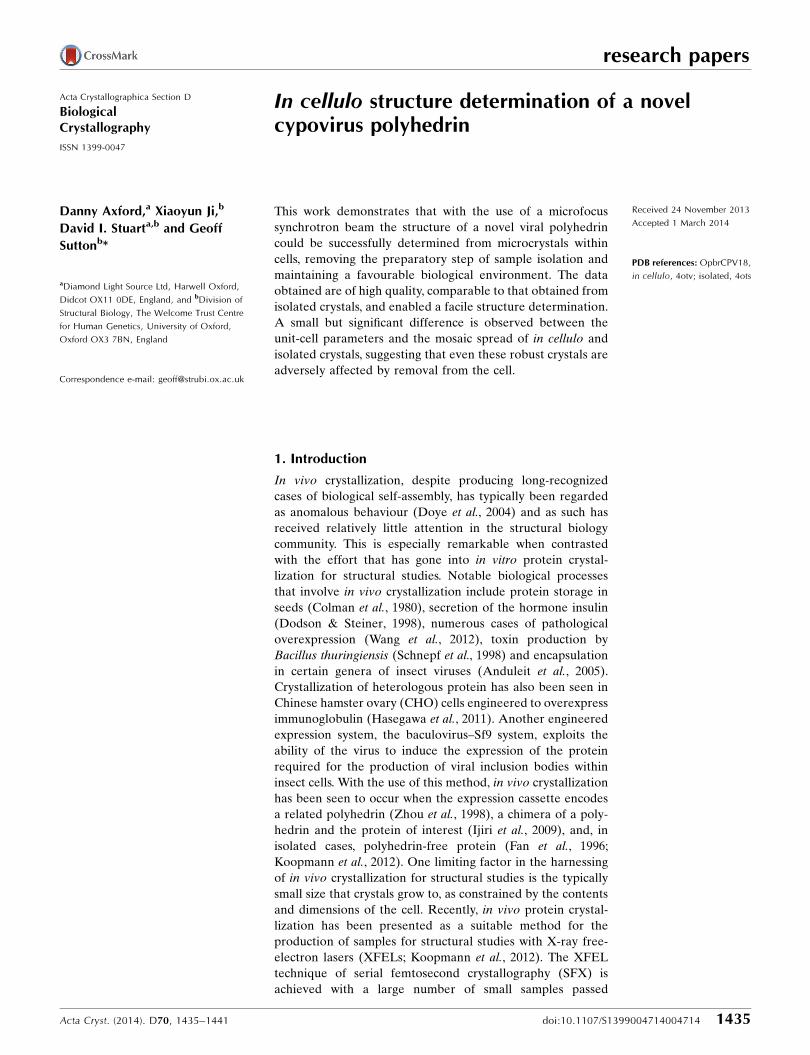
Figure 1(a) Uninfected cells. (b) Infected cells. (c) Isolated crystals loaded onto a 25 mm mesh, pictured with an on-axis sample view on the beamline during datacollection. (d) Infected cells loaded onto a 25 mm mesh, pictured with an on-axis sample view on the beamline during data collection; the inset shows aclose-up of a single cell with two crystals visible. All panels are shown on the same scale. Red arrows indicate polyhedra crystals.
GenBank sequence DQ192250 (Graham et al., 2007). The
polyhedrin gene was amplified and inserted into the transfer
vector pBacPAK9 (Clontech). Recombinant baculovirus was
produced by co-transfection of linearized baculovirus DNA
and the transfer vector following a standard protocol (Zhao et
al., 2003). Expression and purification of polyhedra followed
the protocol described in Anduleit et al. (2005). Figs. 1(a) and
1(b) show a comparison between non-infected Spodoptera
frugiperda (Sf9) cells (Fig. 1a) and those infected with baculo-
virus expressing OpbrCPV18 polyhedrin (Fig. 1b). Polyhedra
are clearly visible as white dots in the majority of infected
cells.
2.2. Data collection
For in cellulo data collection, infected Sf9 cells were
harvested 3 d post-infection and concentrated by centrifuga-
tion at 43g for 90 s. The cells were resuspended in media,
mixed in a 1:1 ratio with the cryoprotectant ethylene glycol
and allowed to equilibrate for 60 s. Cells in cryoprotectant
were applied onto a MicroMesh mount (MiTeGen, Ithaca,
USA) and were allowed to settle for 30 s before excess liquid
was wicked away. The sample was flash-cooled in a stream of
nitrogen gas at 100 K. The isolated crystals were treated with
cryoprotectant and cooled in the same way. Examples of
isolated crystals and polyhedra within cells cooled on grids
imaged on-axis at the beamline are shown in Figs. 1(c) and
1(d). All manipulations of the cells were performed with care
so as not to disrupt them. The integrity of the cells was
checked at each step and no cell disruption or free polyhedra
crystals were observed.
The standard optical configuration of the I24 beamline
uses two pairs of Kirkpatrick–Baez focusing mirrors: the first
accepting monochromatic X-rays and producing a secondary
source, and the second further demagnifying the X-ray beam
to 10 � 10 mm at the sample with 1.5 � 1012 photons s�1.
However, in this work the best data were obtained with a 6 �
6 mm beam of �2 � 1011 photons s�1 at 12.8 keV, achieved by
reducing the size of the secondary source with beam-defining
slits, which gave an estimated dose to each crystal of
�1.4 MGy s�1. The detector used to record the in cellulo data
was a PILATUS3 6M (DECTRIS, Baden, Switzerland). Once
mounted onto the sample position, crystals within the cells
could not be easily resolved visually, so they were located by
fast raster scans of the sample loop (Aishima et al., 2010). The
sample loop was orientated perpendicular to the X-ray beam.
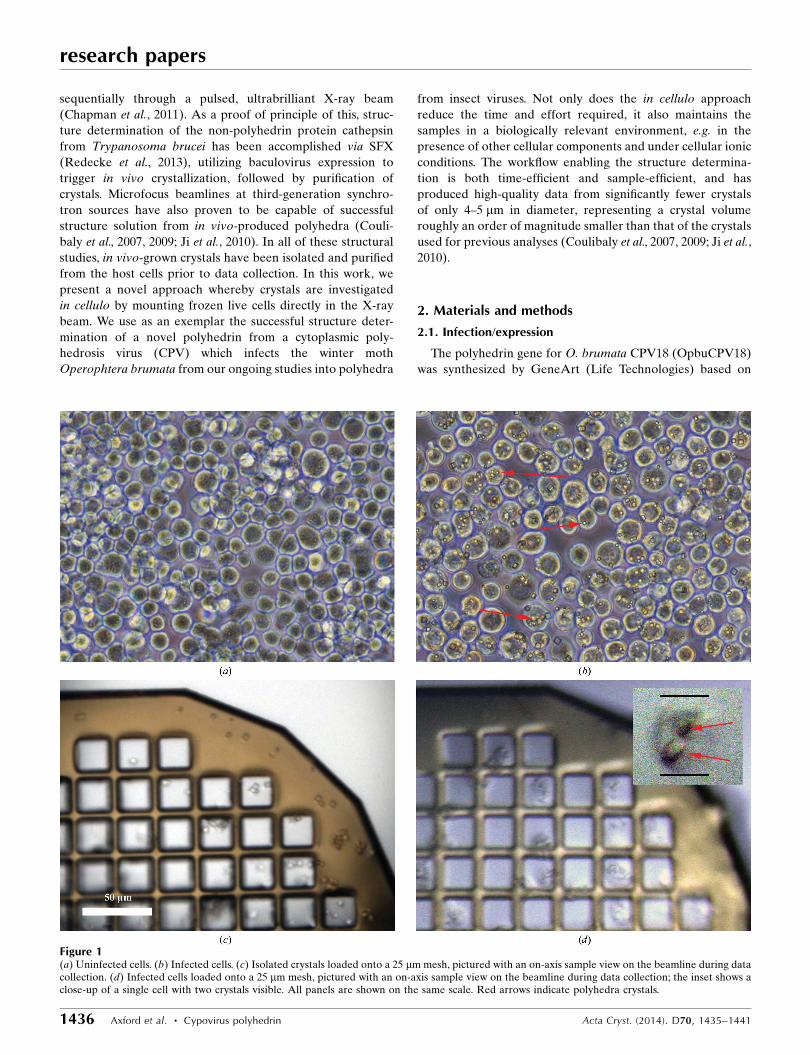
An example scan is shown in Fig. 2, consisting of a 22 � 18
array of 396 points with a spacing of 5 � 5 mm covering
�10 000 mm2. Exposures were still images of 0.2 s with 100%
flux and with the edge of detector set to 2.5 A. Individual
frames from the scan were automatically analysed with the
software package DISTL (Zhang et al., 2006) and were scored
to produce the contour plot. From the results of this scan, 12
data-collection points were selected. At each of these points a
sweep of data was collected consisting of 40 images of 0.05�
oscillation with an exposure of 0.5 s, with the edge of the
detector set to record 1.8 A Bragg spacing. Seven of these
‘hits’ were included in the final complete data set. In total,
three grid scans and 40 wedges, each of 2� of data, were
recorded with the spindle rotation range centred on the value
used for the grid scan. Each grid scan took around 2.5 min to
collect and a total of approximately 75 min elapsed time was
required to collect the data used for structure determination.
Data from isolated crystals were recorded at an earlier date
with a PILATUS 6M detector installed on the beamline.
Although isolated crystals could be seen visually, a similar
procedure of crystal detection via a grid scan was used to
ensure optimum alignment of the sample with the beam. In
total, 26 partial data sets of 3� consisting of 30 images with 0.1�
oscillations were recorded with an exposure time of 0.25 s per
image. A 6 � 6 mm beam size was again used. Data from
isolated crystals were processed in a similar way to that
described below for the data from cells.
2.3. Data processing
Each partial data set was integrated using the Diamond
automated pipeline FastDP (G. Winter, unpublished work;
Winter & McAuley, 2011). Data wedges where FastDP iden-
tified the correct space group (I23) were fed to the software
package BLEND for data merging and scaling (Foadi et al.,
2013). BLEND compares the unit-cell parameters across
separate partial data sets and clusters data sets on the basis of
how isometric they are. POINTLESS and AIMLESS are used
to merge and scale the clustered data and the user is able to
compare, on the basis of R value and completeness, clusters
expanding in size from pairs of data wedges up to the entirety
of the integrated data. The resolution cutoff was determined
by AIMLESS with a CC1/2 of >0.5 for the highest resolution
shell (Evans, 2011).
2.4. Structure determination and refinement
Merged and scaled intensities were converted to structure
factors with the program CTRUNCATE. OpbrCPV18
polyhedrin has 83.5% sequence identity to BmCPV1 (Graham
research papers
Acta Cryst. (2014). D70, 1435–1441 Axford et al. � Cypovirus polyhedrin 1437
Figure 2Results of a grid scan from in cellulo data collection shown as a contourplot of the DISTL output ‘good Bragg candidates’.

et al., 2007), making the structure of the latter (PDB entry
2oh6; Coulibaly et al., 2007) a good search model for molecular
replacement using Phaser (McCoy et al., 2007). The model
was then rebuilt and refined using Coot, REFMAC and
PHENIX (Emsley et al., 2010; Murshudov et al., 2011; Adams
et al., 2010). This whole process was performed independently
for the data from isolated particles and from crystals in
cells.
3. Results and discussion
3.1. Crystallographic details of in cellulo OpbrCPV18
From a total of 40 in cellulo crystals identified from grid
scans, 20 were integrated successfully by FastDP with the
correct space group assigned. Inspection of the images indi-
cated that crystals not achieving automated data reduction
were either misaligned (i.e. rotating in and out of the beam) or
research papers
1438 Axford et al. � Cypovirus polyhedrin Acta Cryst. (2014). D70, 1435–1441
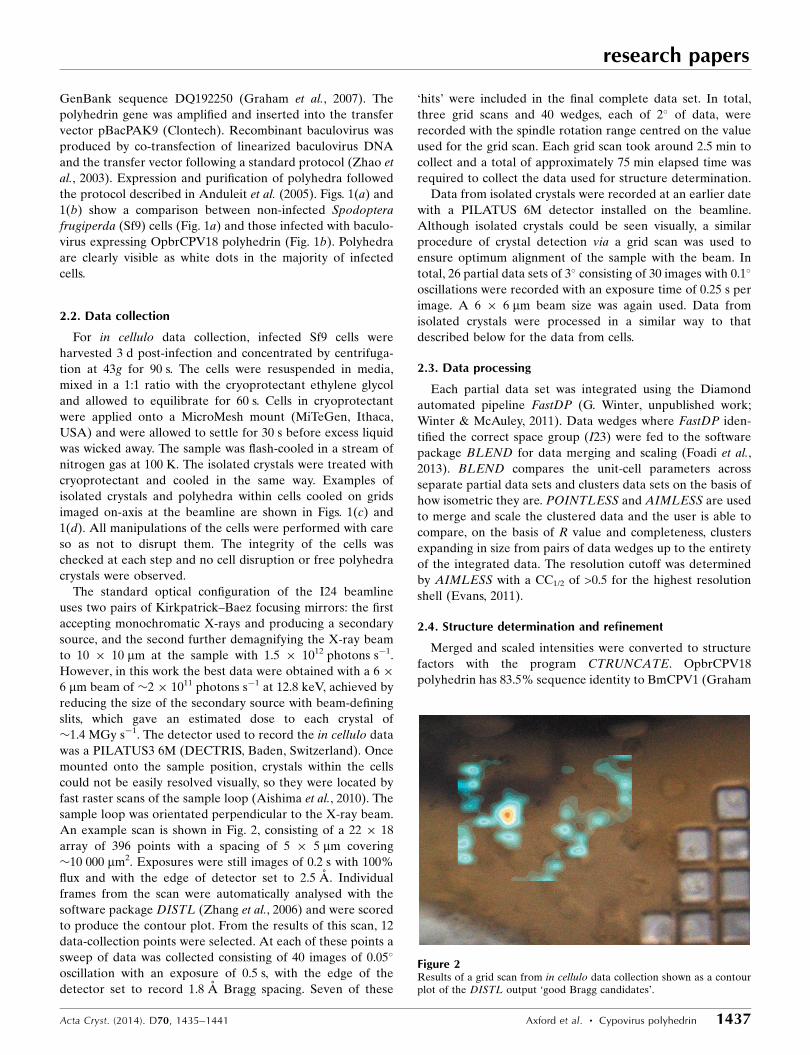
Figure 3Images of the hk0 central sections of intensity-weighted reciprocal lattices. (a) and (b) show the unreduced indices, whilst (c) and (d) are after applyingcrystallographic symmetry. (a) and (c) are for the in cellulo merged data set, while (b) and (d) are for the isolated crystal merged data set. The imageswere generated by ViewHKL (CCP4). The completeness and multiplicity were 91% and 3.7 and 97% and 9.9, respectively.
simply diffracted too weakly, with too few observed reflections
for correct indexing. There was little indication of multiple
lattices. The 20 selected crystals displayed similar unit-cell
parameters a = b = c = 103.04 A, with a standard deviation of
just 0.1 A. BLEND was used to compare the unit-cell para-
meters across separate partial data sets and to cluster data sets
assessed to be isometric. BLEND then used POINTLESS and
AIMLESS to merge and scale all clusters. The merged data
set with the lowest Rmeas with a completeness sufficient for
molecular replacement (>90%) was selected. BLEND deter-
mined that the inclusion of all crystals of a standard sufficient
for automatic data integration produced an optimum data set
in terms of both completeness and R value. Since BLEND
uses unit-cell parameter similarity as a discriminator for data
merging, this reflects the consistency of the measured cell
across samples. Fig. 3 shows that there is no obvious tendency
for the crystals to adopt a preferred alignment in the amor-
phous ice film, although we cannot rule out such an effect for
less isometric crystals.
As expected, the structure of OpbrCPV18 polyhedrin is
very similar (r.m.s.d. of 0.23 A for all 248 C� atoms) to that
of BmCPV1, although there are several notable differences
which will be reported elsewhere (Ji et al., in preparation).
3.2. Comparison of in cellulo and isolated data
Table 1 compares the two methods of data collection, and
there is very little difference in terms of the effective resolu-
tion extent and Rmeas. The results show no significant reduc-
tion in signal-to-noise level in moving from isolated samples
to direct measurements within cells, despite the additional
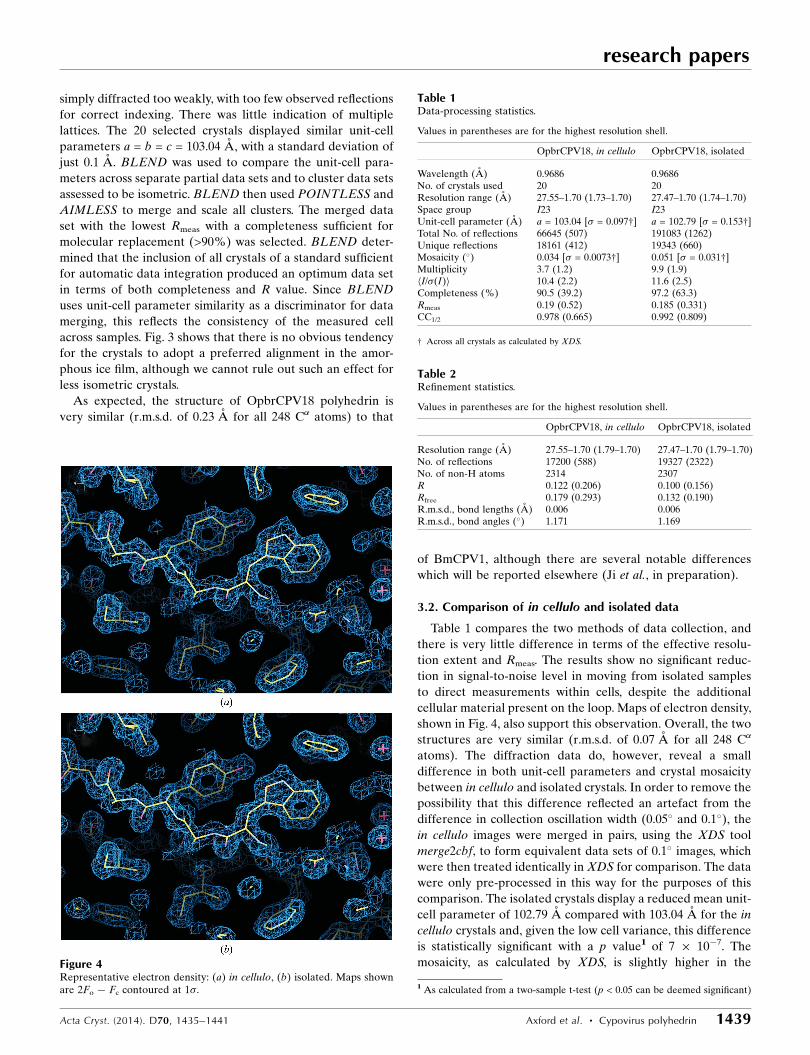
cellular material present on the loop. Maps of electron density,
shown in Fig. 4, also support this observation. Overall, the two
structures are very similar (r.m.s.d. of 0.07 A for all 248 C�
atoms). The diffraction data do, however, reveal a small
difference in both unit-cell parameters and crystal mosaicity
between in cellulo and isolated crystals. In order to remove the
possibility that this difference reflected an artefact from the
difference in collection oscillation width (0.05� and 0.1�), the
in cellulo images were merged in pairs, using the XDS tool
merge2cbf, to form equivalent data sets of 0.1� images, which
were then treated identically in XDS for comparison. The data
were only pre-processed in this way for the purposes of this
comparison. The isolated crystals display a reduced mean unit-
cell parameter of 102.79 A compared with 103.04 A for the in
cellulo crystals and, given the low cell variance, this difference
is statistically significant with a p value1 of 7 � 10�7. The
mosaicity, as calculated by XDS, is slightly higher in the
research papers
Acta Cryst. (2014). D70, 1435–1441 Axford et al. � Cypovirus polyhedrin 1439
Table 1Data-processing statistics.
Values in parentheses are for the highest resolution shell.
OpbrCPV18, in cellulo OpbrCPV18, isolated
Wavelength (A) 0.9686 0.9686No. of crystals used 20 20Resolution range (A) 27.55–1.70 (1.73–1.70) 27.47–1.70 (1.74–1.70)Space group I23 I23Unit-cell parameter (A) a = 103.04 [� = 0.097†] a = 102.79 [� = 0.153†]Total No. of reflections 66645 (507) 191083 (1262)Unique reflections 18161 (412) 19343 (660)Mosaicity (�) 0.034 [� = 0.0073†] 0.051 [� = 0.031†]Multiplicity 3.7 (1.2) 9.9 (1.9)hI/�(I)i 10.4 (2.2) 11.6 (2.5)Completeness (%) 90.5 (39.2) 97.2 (63.3)Rmeas 0.19 (0.52) 0.185 (0.331)CC1/2 0.978 (0.665) 0.992 (0.809)
† Across all crystals as calculated by XDS.
Figure 4Representative electron density: (a) in cellulo, (b) isolated. Maps shownare 2Fo � Fc contoured at 1�.
Table 2Refinement statistics.
Values in parentheses are for the highest resolution shell.
OpbrCPV18, in cellulo OpbrCPV18, isolated
Resolution range (A) 27.55–1.70 (1.79–1.70) 27.47–1.70 (1.79–1.70)No. of reflections 17200 (588) 19327 (2322)No. of non-H atoms 2314 2307R 0.122 (0.206) 0.100 (0.156)Rfree 0.179 (0.293) 0.132 (0.190)R.m.s.d., bond lengths (A) 0.006 0.006R.m.s.d., bond angles (�) 1.171 1.169
1 As calculated from a two-sample t-test (p < 0.05 can be deemed significant)
isolated crystals, 0.05� in comparison to 0.03�, and this differ-
ence, although not as marked, is statistically significant, with a
p value of 0.03. The variance of both unit-cell parameters and
mosaic spread is higher in the isolated crystals. These obser-
vations suggest that removal of the crystals from the regulated
environment of the cell induces systematic changes in the
crystal lattice, even in these CPV polyhedrin crystals, which
are unusually robust (Anduleit et al., 2005). For the in cellulo
polyhedrin the compartmentalization of the crystals within the
cell means that we do not know the effective concentration of
ethylene glycol, and indeed the cellular components may act
as the primary cryoprotectant. The slightly worse R factor for
the in cellulo data (Table 2) reflects the somewhat lower
completeness and multiplicity to which the data were
measured.
Data were also collected using the full-flux 10 � 10 mm
beam. Although we were able to record data of a quality
suitable for structure solution, it was clearly inferior to the
smaller beam, with a the resolution of the data set reduced
from 1.7 to 2.2 A and Rmeas elevated from 0.19 to 0.32.
4. Conclusions and outlook
We have determined the structure of a novel cypovirus poly-
hedrin via in cellulo crystallography. In a comparison with
isolated crystals, the data quality does not suffer significantly,
despite the presence of additional material from the cell.
Notwithstanding the recognized robustness of CPV crystals,
we observe a statistically significant difference in calculated
unit-cell parameters and mosaicity between in cellulo and
isolated crystals. The isolated crystals display a slightly smaller
cell which exactly matches that observed from the structure
determination of BmCPV1 obtained with isolated crystals
(Coulibaly et al., 2007). The isolated crystals also display a
greater variance in cell length and mosaicity. A clear benefit
of the in cellulo method is the reduction in crystal handling,
which minimizes manual effort and preserves the sample in a
favourable and stable environment, as suggested by the unit-
cell parameter observations. Additionally, we observe that the
process of sample isolation and purification is more likely to
produce aggregations of crystals and the complications of
recording diffraction from multiple lattices.
Koopmann and coworkers highlighted the potential for in
vivo-grown crystals and serial crystallography at an XFEL
source in structural biology (Koopmann et al., 2012). Our
study makes a logical progression in showing that sample
purification and isolation are not necessary and that samples
can be directly addressed within the cells that produced them.
At the same time, the method becomes more generally
applicable with the demonstration that it can be achieved on
a microfocus synchrotron beamline. It should be noted that
here, in comparison to the cathepsin B example, a larger
diffracting volume has been examined (�100 versus �10 mm2)
and with a lower solvent content (24 versus 61%). In terms of
the protein volume contributing to Bragg spots, these together
represent a factor of 20 and hence an expected factor of 201/2
in signal to noise. In practice, signal to noise is comparable, at
11.9 for the cathepsin and 10.4 for the in cellulo CPV, although
in the highest resolution bin of the cathepsin data the hI/�(I)i
is 2.1, whilst at this resolution the value for CPV is 13.5. This
reflects the higher average B factor reported for cathepsin B
(47.5 A2) compared with the in cellulo polyhedrin reported
here (6.9 A2). Very many more crystals were used in the
XFEL serial crystallography experiment, with 178 875
contributing to the final structure and �108 expended
(Redecke et al., 2013), compared with the 20 crystals contri-
buting to the final structure of the polyhedrin, for which less
than 100 insect cells were required in total. We estimate that
�60 crystals would be needed to provide similar completeness
for the most common space group for proteins, P212121
(extrapolated from Fry et al., 1999). Furthermore, improve-
ments in the sample environment, reduction in air scatter and
improvements in beam collimation might provide an order of
magnitude improvement in signal to noise for such small
crystals at microfocus synchrotron sources, while continued
reductions in storage-ring electron-beam emittance and
improved beam-focusing capabilities, potentially coupled to
flux gains with the use of pink X-ray beams, will further
enhance the scope of this method at third-generation light
sources. Certainly, the workflow described here demonstrates
how the identification, collection and merging of data from
multiple micrometre-scale crystals is becoming a more routine
and rapid avenue for structure determination. Opportunities
remain to increase the throughput of samples. One aspect is
sample preparation; we expect that by working at a higher
concentration of cells the grid-scan hit rate could be increased
from�2% to perhaps 6%. With the current workflow it would
then be feasible to collect data from some 960 crystals in 20 h,
suggesting that a useful data set could be collected from more
weakly diffracting samples in less favourable space groups in a
typical allocation of user beam time. Furthermore, the work-
flow could be streamlined, for example, by automatic detec-
tion of grid scan hits to drive data collections at the
corresponding positions and by closer linking of the data
integration and merging. Ultimately, we anticipate that auto-
mated data acquisition and processing for structure determi-
nation from in vivo produced microcrystals will be achieved.
DIS and GS are supported by the MRC (grant No.
G1000099). This work is a contribution from the Instruct
Centre, Oxford. Administrative support was provided by the
Wellcome Trust (075491/Z/04). The authors would like to
thank Robin Owen and Gwyndaf Evans for the I24 beamline
experimental design and for helpful discussions.
References
Adams, P. D. et al. (2010). Acta Cryst. D66, 213–221.Aishima, J., Owen, R. L., Axford, D., Shepherd, E., Winter, G., Levik,
K., Gibbons, P., Ashton, A. & Evans, G. (2010). Acta Cryst. D66,1032–1035.
Anduleit, K., Sutton, G., Diprose, J. M., Mertens, P. P. C., Grimes, J. M.& Stuart, D. I. (2005). Protein Sci. 14, 2741–2743.
Chapman, H. N. et al. (2011). Nature (London), 470, 73–77.Colman, P. M., Suzuki, E. & Van Donkelaar, A. (1980). Eur. J.
Biochem. 103, 585–588.
research papers
1440 Axford et al. � Cypovirus polyhedrin Acta Cryst. (2014). D70, 1435–1441

Coulibaly, F., Chiu, E., Gutmann, S., Rajendran, C., Haebel, P. W.,Ikeda, K., Mori, H., Ward, V. K., Schulze-Briese, C. & Metcalf, P.(2009). Proc. Natl Acad. Sci. USA, 106, 22205–22210.
Coulibaly, F., Chiu, E., Ikeda, K., Gutmann, S., Haebel, P. W., Schulze-Briese, C., Mori, H. & Metcalf, P. (2007). Nature (London), 446,97–101.
Dodson, G. & Steiner, D. (1998). Curr. Opin. Struct. Biol. 8, 189–194.
Doye, J. P. K., Louis, A. A. & Vendruscolo, M. (2004). Phys. Biol. 1,P9–P13.
Emsley, P., Lohkamp, B., Scott, W. G. & Cowtan, K. (2010). ActaCryst. D66, 486–501.
Evans, P. R. (2011). Acta Cryst. D67, 282–292.Fan, G. Y., Maldonado, F., Zhang, Y., Kincaid, R., Ellisman, M. H. &
Gastinel, L. N. (1996). Microsc. Res. Tech. 34, 77–86.Foadi, J., Aller, P., Alguel, Y., Cameron, A., Axford, D., Owen, R. L.,
Armour, W., Waterman, D. G., Iwata, S. & Evans, G. (2013). ActaCryst. D69, 1617–1632.
Fry, E. E., Grimes, J. & Stuart, D. I. (1999). Mol. Biotechnol. 12, 13–23.Graham, R. I., Rao, S., Sait, S. M., Mertens, P. P. C., Hails, R. S. &
Possee, R. D. (2007). Virus Genes, 35, 463–471.Hasegawa, H., Wendling, J., He, F., Trilisky, E., Stevenson, R., Franey,
H., Kinderman, F., Li, G., Piedmonte, D. M., Osslund, T., Shen, M.& Ketchem, R. R. (2011). J. Biol. Chem. 286, 19917–19931.
Ijiri, H., Coulibaly, F., Nishimura, G., Nakai, D., Chiu, E., Takenaka,C., Ikeda, K., Nakazawa, H., Hamada, N., Kotani, E., Metcalf, P.,Kawamata, S. & Mori, H. (2009). Biomaterials, 30, 4297–4308.
Ji, X., Sutton, G., Evans, G., Axford, D., Owen, R. & Stuart, D. I.(2010). EMBO J. 29, 505–514.
Koopmann, R. et al. (2012). Nature Methods, 9, 259–262.McCoy, A. J., Grosse-Kunstleve, R. W., Adams, P. D., Winn, M. D.,
Storoni, L. C. & Read, R. J. (2007). J. Appl. Cryst. 40, 658–674.Murshudov, G. N., Skubak, P., Lebedev, A. A., Pannu, N. S., Steiner,
R. A., Nicholls, R. A., Winn, M. D., Long, F. & Vagin, A. A. (2011).Acta Cryst. D67, 355–367.
Redecke, L. et al. (2013). Science, 339, 227–230.Schnepf, E., Crickmore, N., Van Rie, J., Lereclus, D., Baum, J.,
Feitelson, J., Zeigler, D. R. & Dean, D. H. (1998). Microbiol. Mol.Biol. Rev. 62, 775–806.
Wang, Y., Lomakin, A., Hideshima, T., Laubach, J. P., Ogun, O.,Richardson, P. G., Munshi, N. C., Anderson, K. C. & Benedek, G. B.(2012). Proc. Natl Acad. Sci. USA, 109, 13359–13361.
Winter, G. & McAuley, K. E. (2011). Methods, 55, 81–93.Zhang, Z., Sauter, N. K., van den Bedem, H., Snell, G. & Deacon,
A. M. (2006). J. Appl. Cryst. 39, 112–119.Zhao, Y., Chapman, D. A. G. & Jones, I. M. (2003). Nucleic Acids Res.
31, e6.Zhou, C. E., Ko, R. & Maeda, S. (1998). Virology, 240, 282–294.
research papers
Acta Cryst. (2014). D70, 1435–1441 Axford et al. � Cypovirus polyhedrin 1441