improving underwriting expense measurement for a uk-based … · 2019-06-10 · specialty insurer...
TRANSCRIPT
CASE STUDY
IMPROVING UNDERWRITING EXPENSE MEASUREMENT FOR A UK-BASED INSURANCE COMPANY THROUGH AN ACTIVITY-BASED REPORTING SOLUTION
Abstract
The Infosys BPM analytics team developed a bespoke reporting solution for a UK based commercial insurer to measure underwriting service expenses for each line of business (LOB). This allowed the insurer to identify high expense contributors (for e.g., the expense contribution of broker A from region B which is higher compared to others, the cost incurred due to repeated transactions on the same proposal, etc.), which are important factors in measuring and improving profitability.

External Document © 2018 Infosys Limited External Document © 2018 Infosys Limited
Business challenge
Our client – a market-leading global
specialty insurer and reinsurer with a major
presence in Lloyd’s market and significant
US and international reach.
The insurer’s underwriting service cost
started to increase. This gave rise to a
significant challenge – they were unable
to identify the major drivers of expense at
different dimensions such as the region
(underwriter region, risk, etc.), placing
basis (declaration, binder, etc.), sections
(risk layer A, risk layer B etc.), underwriters
(underwriter A, underwriter B etc.), brokers
(broker A, broker B, etc.) and more.
Specifically, the insurer wanted to develop
an expense reporting solution for their
underwriting services that:
• Identified and mapped different
activities and sub-activities at the LOB
level
• Allocated and accounted the cost for
each sub-activity level under each LOB
• Provided multidimensional reporting to
view the breakup of cost
The Infosys BPM analytics solution
Infosys used an activity-based costing
approach to create the underwriting
expense reporting solution. This approach
recognizes the relationship between costs
and activities under each LOB. Through this
relationship, the costs of different activities
can be assigned in such a way that the
expense drivers at the activity and sub-
activity level can be identified.
The Infosys BPM Analytics team came up
with the following approach to create the
expense reporting solution:
• Data analysis at an activity and sub-
activity level: Our team gathered data
for different underwriting activities
(indexing, proposal processing, etc.) and
sub-activities (processing slips, pre-
renewals, etc.) that were being performed
by the Infosys BPM operations team. All
the available associated cost data was
assigned to each of these activities / sub-
activities for LOB’s and its corresponding
dimension (the placing basis, new
business, renewal business, underwriter,
region, etc.).
External Document © 2018 Infosys Limited External Document © 2018 Infosys LimitedExternal Document © 2018 Infosys Limited
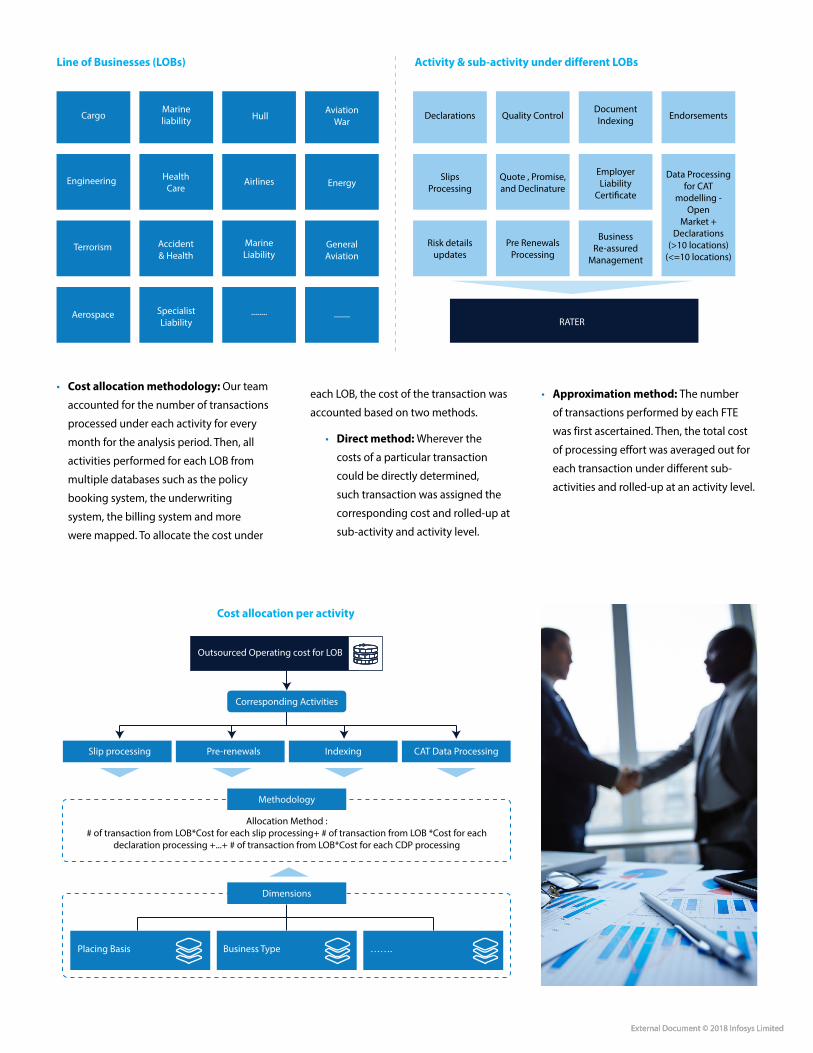
• Cost allocation methodology: Our team
accounted for the number of transactions
processed under each activity for every
month for the analysis period. Then, all
activities performed for each LOB from
multiple databases such as the policy
booking system, the underwriting
system, the billing system and more
were mapped. To allocate the cost under
Line of Businesses (LOBs) Activity & sub-activity under different LOBs
Cost allocation per activity
each LOB, the cost of the transaction was
accounted based on two methods.
• Direct method: Wherever the
costs of a particular transaction
could be directly determined,
such transaction was assigned the
corresponding cost and rolled-up at
sub-activity and activity level.
• Approximation method: The number
of transactions performed by each FTE
was first ascertained. Then, the total cost
of processing effort was averaged out for
each transaction under different sub-
activities and rolled-up at an activity level.
Aviation War
Accident & Health
Marine Liability
General Aviation
EnergyEngineering
Marine liability
Health Care
........ ........
HullCargo
Airlines
Specialist Liability
Aerospace
Terrorism
Declarations Quality ControlDocument Indexing Endorsements
Slips Processing
Quote , Promise, and Declinature
Employer Liability
Certificate
Data Processing for CAT
modelling - Open
Market + Declarations
(>10 locations)(<=10 locations)
RATER
Risk details updates
Business Re-assured
Management
Pre Renewals Processing
Outsourced Operating cost for LOB
Slip processing Pre-renewals Indexing CAT Data Processing
Methodology
Allocation Method : # of transaction from LOB*Cost for each slip processing+ # of transaction from LOB *Cost for each
declaration processing +...+ # of transaction from LOB*Cost for each CDP processing
Dimensions
Corresponding Activities
Placing Basis …….Business Type

© 2018 Infosys Limited, Bengaluru, India. All Rights Reserved. Infosys believes the information in this document is accurate as of its publication date; such information is subject to change without notice. Infosys acknowledges the proprietary rights of other companies to the trademarks, product names and such other intellectual property rights mentioned in this document. Except as expressly permitted, neither this documentation nor any part of it may be reproduced, stored in a retrieval system, or transmitted in any form or by any means, electronic, mechanical, printing, photocopying, recording or otherwise, without the prior permission of Infosys Limited and/ or any named intellectual property rights holders under this document.
For more information, contact [email protected]
Infosysbpm.com Stay Connected
• Self-serve reporting solution: Our team created an MS-SQL database consolidating diverse sets of information (policy number, major
/ minor class, business type, etc.) from multiple source systems (policy booking, underwriting and billing systems, etc.). The solution’s
output was provided in the form of a Power BI dashboard which included a comprehensive view of the underwriting services expenses at a
multidimensional level. This enabled our client to deep dive into the data to get different usable insights.
As an example, the average cost for slip processing across marine LoB, property LoB, etc. was reported across dimensions such as the broker,
placing basis, underwriter, risk class, etc.
Activities
Technical Processing Units(TPU)
CAT Data Processing (CDP)
Open Market + Declarations (>10 locations)
Open Market +Declarations (<=10 locations)
Document Scanning
Document Indexing
Indexing
Pre Renewals
Endorsement
Aerospace
Airlines
Terrorism Blood Stock
Specialist Liability
Cargo
Marine Liability
Engineering
........Energy
Placing Basis (P.B)
Reinsurance ..... Bulking line slip
Business Type
New Business Renewal Business
Underwriter (UW)
UW1 UW2 ..... UW n
.........
.........
Regions
Region 1 Region 2 ..... Region n
Dimensions
LOBs
EL CertsProcessing Slips and Declarations
QPD IGNIS BRM Rater
QC
The business impact
Our solution’s delivered multi-fold benefits:
• The Infosys BPM Analytics team provided
a detailed view of the cost break-up
through multiple dimensions which
could be drilled down further at an
activity and sub-activity level
• We enabled our client to compare
metrics (e.g. avg. cost per policy, avg.
transaction per policy, etc.) across
LOBs and multiple dimensions (e.g.
underwriters, placing basis etc.). and
provided insights on the existence of any
systematic pattern/trend around cost
concentration
• Our analysis revealed that all
underwriting activities and sub-activities
for similar types of policies do not result
in the same cost structure and that some
transactions were costing significantly
more than others (e.g. the average cost
of slip processing for the Asia region
was 20% lesser than Europe and North
America)
• Our client has started to use this
reporting solution to reduce the cost (up
to GBP 50k) incurred due to repeated
transactions on the same proposal (e.g.
organisation details, broker details, and
so on, being updated through multiple
requests rather than at one go)