improving school attendance in england -...
TRANSCRIPT

Improving school attendance in England
REPORT BY THE COMPTROLLER AND AUDITOR GENERAL | HC 212 Session 2004-2005 | 4 February 2005

The National Audit Office scrutinises public spending on behalf of Parliament. The Comptroller and Auditor General, Sir John Bourn, is an Officer of the House of Commons. He is the head of the National Audit Office, which employs some 800 staff. He, and the National Audit Office, are totally independent of Government. He certifies the accounts of all Government departments and a wide range of other public sector bodies; and he has statutory authority to report to Parliament on the economy, efficiency and effectiveness with which departments and other bodies have used their resources. Our work saves the taxpayer millions of pounds every year. At least £8 for every £1 spent running the Office.

Layout and production byNAO Information Centre
DG Ref: 5456VFPrinted on Consort Renew Satin containing recycled fibre
Published by TSO (The Stationery Office) and available from:
Onlinewww.tso.co.uk/bookshop
Mail, Telephone, Fax & E-mailTSOPO Box 29, Norwich NR3 1GNTelephone orders/General enquiries 0870 600 5522Fax orders 0870 600 5533Order through the Parliamentary HotlineLo-call 0845 7 023474E-mail [email protected] 0870 240 3701
TSO Shops123 Kingsway, London WC2B 6PQ020 7242 6393 Fax 020 7242 639468-69 Bull Street, Birmingham B4 6AD0121 236 9696 Fax 0121 236 96999-21 Princess Street, Manchester M60 8AS0161 834 7201 Fax 0161 833 063416 Arthur Street, Belfast BT1 4GD028 9023 8451 Fax 028 9023 540118-19 High Street, Cardiff CF10 1PT029 2039 5548 Fax 029 2038 434771 Lothian Road, Edinburgh EH3 9AZ0870 606 5566 Fax 0870 606 5588
The Parliamentary Bookshop12 Bridge Street, Parliament Square,London SW1A 2JXTelephone orders/General enquiries 020 7219 3890Fax orders 020 7219 3866
TSO Accredited Agents(see Yellow Pages)
and through good booksellers.
ISBN 0-10-293213-1
9 780102 932133
Imp
roving schoo
l attendance in England
A
report by the Com
ptroller and Auditor G
eneral The Stationery O
ffice
£11.25

LONDON: The Stationery Offi ce£11.25
Ordered by theHouse of Commons
to be printed on 31 January 2005
Improving school attendance in England
REPORT BY THE COMPTROLLER AND AUDITOR GENERAL | HC 212 Session 2004-2005 | 4 February 2005

This report has been prepared under Section 6 of the National Audit Act 1983 for presentation to the House of Commons in accordance with Section 9 of the Act.
John BournComptroller and Auditor GeneralNational Audit Offi ce
31 January 2005
The National Audit Offi ce study team consisted of:
Angela Hands, Paul Wright-Anderson, Paul Dimblebee, Lola Toppin and Jeremy Weingard with additional assistance from Kpakpo Brown, Andrew Griffi n, Darren Jones, Kate Pinder and Adam Smith
This report can be found on the National Audit Offi ce web site at www.nao.org.uk
For further information about the National Audit Offi ce please contact:
National Audit Offi cePress Offi ce157-197 Buckingham Palace RoadVictoriaLondonSW1W 9SP
Tel: 020 7798 7400
Email: [email protected]
© National Audit Offi ce 2005
CONTENTS
PREFACE 1
EXECUTIVE SUMMARY 2
Improving pupil attendance is a major challenge 3
Unauthorised absence is steady but overall 3attendance is improving
There is scope for further reductions in absence 5
Achieving reductions through national initiatives 6
Achieving reductions through more effective 7local practices
Recommendations 10
PART 1
School attendance and absence 12
Children must receive full-time education between 13the ages of fi ve and 16
Many children do not always attend school 13
There are serious consequences to not going 16to school
The Department, local authorities and schools 17share responsibility for pupil attendance
A lot of money is spent on managing attendance, 17and reducing pupil absence is a very high national priority
Study scope and methodology 18

PART 2
Our analysis of variations in 20pupil absence
The 2004 target to reduce unauthorised absence 21was not achieved
Total attendance is improving 21
There are diffi culties in assessing attendance data 21
There are wide ranges of absence rates 21between maintained schools
Some of the variations in absence can be 24explained by contextual factors and academic attainment
Some of the variations in absence refl ect the 27type of school
Good Ofsted assessments are broadly linked to 28lower absence
PART 3
How wider initiatives can improve 30attendance
There are early signs that the Behaviour 31Improvement Programme is contributing to lower absence rates
Advice from consultants is also supporting 32improvements but has met some resistance
Electronic registration systems are providing 34practical support to help improve attendance
Truancy sweeps have helped to tackle 35unauthorised absence but views on their long-term effectiveness are mixed
Sanctions against parents of pupils who truant 35can be useful as one element of a range of actions to improve attendance
Other wider initiatives can contribute to 38improving attendance
Evaluations of programmes need to be timely 39and based on relevant data
PART 4
What schools can do to make a 40difference
Schools can make a difference by managing 41attendance well
There is scope for developing the support 44available to help schools achieve improvements
Parents’ and carers’ support is essential to 46achieving sustained improvements
APPENDICES
1 Study methodology 47
2 Outline of the quantitative analysis and results 49
Photographs courtesy of Alamy.com and John Walmsley - www.educationphotos.co.uk

preface
PREFACE

preface
IMPROVING SCHOOL ATTENDANCE IN ENGLAND 1
Children who do not attend school regularly are much more likely to leave school with few or no qualifications, and they are more likely to be drawn into crime and anti-social behaviour. Parents are responsible, by law, for ensuring that their child receives full-time education that is suitable to their age, ability and aptitude. Nevertheless, each day around 450,000 of the 6.7 million pupils in state maintained schools in England miss school, equivalent to 13 days per year each. These pupils could fill 816 average-sized primary schools plus 252 average secondary schools.
The Department for Education and Skills (the Department) has overall responsibility for school attendance. It sets national policy and funds local authorities and schools. Reducing total absence and unauthorised absence from school are among the Department’s highest priorities.
This report examines attendance in state schools in England for children of compulsory school age. It examines the factors associated with absence from school, and considers whether initiatives taken by the Department, local authorities and schools to reduce absence have been successful. To do this, we carried out statistical analysis of school absence in 2002-03, visited 17 schools, and through surveys and discussions we obtained the views of head teachers, local authority staff, school inspectors and policymakers.
We found that:
� absence from school arises from a range of causes. Reducing absence is a major challenge, but there is scope for achieving further reductions in absence;
� the Department spent around £885 million between 1997-98 and 2003-04 on initiatives intended, at least in part, to reduce absence. These measures have contributed to a reduction in authorised absence, but unauthorised absence has not declined;
� the effectiveness of existing national initiatives could be improved by the Department working more closely with local authorities and schools;
� local authorities and schools do much good work in improving attendance, but best practice should be more widely adopted; and
� the national attendance strategy should be enhanced by increasing the focus on primary schools and parental attitudes, and by enabling the existing work of Ofsted to contribute more to improvements in attendance management.

executive summary
IMPROVING SCHOOL ATTENDANCE IN ENGLAND2
EXECUTIVE SUMMARY

executive summary
IMPROVING SCHOOL ATTENDANCE IN ENGLAND 3
1 Under the Education Act 1996, the parent is responsible for making sure that their child receives a full-time education.1 Regular school attendance is very important for all pupils because they face a number of risks if they fail to attend. In particular, pupils who do not attend regularly are much more likely to leave school with few or no qualifications, and more likely to be out of work after leaving school. They are also more easily drawn into crime and anti-social behaviour and some can be vulnerable to harm by adults.
Improving pupil attendance is a major challenge2 Absence from school can be caused by a wide range of factors, either on their own or in combination (Figure 1). Some causes lie in the quality and relevance of the curriculum and teaching and the school environment, and it is for schools to make the necessary improvements with support from local authorities and the Department. Other causes are associated with familial or wider problems in society such as drug addiction, and are usually much more difficult for schools alone to address.
3 Schools decide whether to authorise pupils’ absence on a case by case basis. Absences owing to illness and other leave such as study leave are usually authorised. Other absences, such as for term-time holidays, may or may not be authorised depending on the circumstances and a school’s policy on absence.
Unauthorised absence is steady but overall attendance is improving4 The Department has overall responsibility for improving attendance in schools, providing funding to local authorities and schools for attendance management and initiatives to reduce absence. Its initiatives have included grant funding to local authorities and schools, consultancy support, best practice advice and establishing sanctions for use against parents whose children persistently fail to attend school. Between 1997-98 and 2003-04, the Department spent around £885 million on these initiatives that were intended, at least in part, to reduce absence. It plans to spend another £560 million by 2005-06.
1 In nearly all cases, education takes place in school, but a parent can provide an education for their child at home so long as the education is suitable and efficient. “Parents” are: natural parents; persons with parental responsibility; and, carers living with and looking after a child. Compulsory school age is from the start of the school term commencing on or after the child’s fifth birthday and continues until the last Friday of June in the school year that they reach 16.
1 Factors influencing absence from school
School
Attractiveness and relevance of curriculum
Quality of teaching
Management of behaviour, including bullying
School-parent relationships
School policiesPupil
Genuine illness (and medical appointments)
Behavioural problems
Learning difficulties
Personal problems
Influence of friends and peers
Being bullied
Home
Parental attitudes to education
Holidays during term time
Other leave (e.g. for bereavement or religious observance)
Familial problems
Children with caring responsibilities
Difficulties in getting to and from school
Frequent movers
Source: National Audit Office
Absence from school

executive summary
IMPROVING SCHOOL ATTENDANCE IN ENGLAND4
5 Whilst over half a million pupils (7.5 per cent) a year do not miss a single school day, it is not possible to reduce absence to zero or near zero because there will always be times when some pupils cannot attend school because they are ill. Nearly 7 per cent (450,000 pupils) do not attend their state maintained school each day, including more than 0.7 per cent (50,000 pupils) whose absences are unauthorised. Between 1998 and 2004, the Department’s main focus has been to reduce the rate of unauthorised absence, but the causes have proved difficult to tackle and unauthorised absence has remained fairly steady.
6 From 2004 to 2008, the Department is targeting a reduction in total absence. Total absence is a more reliable measure than unauthorised absence, because it is not affected by schools’ decisions about whether or not to authorise absence. We focus on total absence in our report.
7 As one of six Public Service Agreement targets for schools2, the Department’s target requires the 2003 total absence rate to be reduced by 8 per cent (from 6.83 per cent to 6.28 per cent) by 2008. This reduction represents around 39,000 more pupils in school each day. (As well as state maintained schools, the target includes independent schools, which are attended by 387,000 day pupils and have lower absence rates, though the Department is not able to influence these schools directly.) With authorised absence declining, there has been some progress in reducing total absence over the last nine years (Figure 2). By the end of the 2003-04 school year, the total absence rate had moved almost halfway towards the target for 2008.
The rate of authorised absence has been falling, but unauthorised absence has remained fairly steady.
Absence rate (per cent)
Source: NAO analysis of the Department’s data
Absence rates in maintained schools, 1994-95 to 2003-042
Unauthorised absence
Authorised absence
Total absence
0
1
2
3
4
5
6
7
8
94-95 95-96 96-97 97-98 98-99 99-00 00-01 01-02 02-03 03-04
2 The five other Public Service Agreement targets relate to: 1 Narrowing the gap in educational achievement between looked after children and their peers 2 Raising standards of 11-year olds in English and maths 3 Raising standards of 14-year olds in English, maths, ICT and science 4 Enhancing the take-up of sporting opportunities by 5- to 16-year olds 5 Sixty per cent of 16-year olds to achieve 5 GCSEs at grades A* to C (by 2008), and all schools
to have at least 30 per cent of pupils achieving this standard (by 2008) Full details of the 2004 targets are at http://performance.treasury.gov.uk/recontopublishsr02to04.pdf.

executive summary
IMPROVING SCHOOL ATTENDANCE IN ENGLAND 5
There is scope for further reductions in absence8 Schools’ absence rates vary substantially. In 2002-03, total absence in primary schools ranged from less than one to nearly 30 per cent of days and in secondary schools from two to nearly 20 per cent of days.3 Some of the variation is associated with pupils’ socio-economic conditions. In particular, higher levels of pupils with free school meals are associated with higher rates of absence. Other contextual factors such as the number of exclusions of pupils from school and the number of pupils with special educational needs are also associated with relatively high rates of absence. Relatively low rates of absence are associated with factors such as high proportions of pupils from certain (most) minority ethnic groups.
9 Our analysis, set out in Part 2 and Appendix 2, confirms that total absence in secondary schools is strongly associated with contextual factors, such as levels of take up of free school meals, and attainment (for example, schools’ average GCSE point scores). Total absence in primary schools is also associated with these factors (see Figure 2 in the Appendix), but not as strongly as for secondary schools. Nevertheless, even after adjusting secondary schools’ total absence for their context, a large number of schools have absence rates that are clearly better or worse than would be expected given their context (Figure 3). Within secondary schools, we found that selective schools and voluntary-aided schools in particular were associated with lower rates of absence after adjusting for their context.
Most secondary schools’ absence rates are either clearly higher or lower than the rates that we expected given the schools’ context, such as the percentage of pupils with free school meals.
Source: NFER analysis for the National Audit Office
0 200 400 600 800 1,000 1,200
Worse than expected
About as expected
Better than expected
Absence rates after adjustment for schools’ context
Number of schools
Secondary schools’ performance on absence, after adjusting for their context
3
3 There are also wide variations in absence between local authorities, ranging from 5.48 per cent in Buckinghamshire to 8.54 per cent in Manchester in 2003-04.
executive summary
IMPROVING SCHOOL ATTENDANCE IN ENGLAND6
10 Some of the remaining difference from absence rates that would be expected may partly be accounted for by factors that we could not include in our analysis – such as parental education, employment and attitudes. We concluded, however, that at least part of the difference is likely to be accounted for by schools’ practice in dealing with absence. We drew this conclusion from our direct contacts with the schools we visited, views of our reference panel, and our surveys of head teachers and education welfare officers. Head teachers, local authority education welfare services, Ofsted and the Department all agree that it should be possible to bring up the weaker standards and performance of some schools and improve pupil attendance across the country.
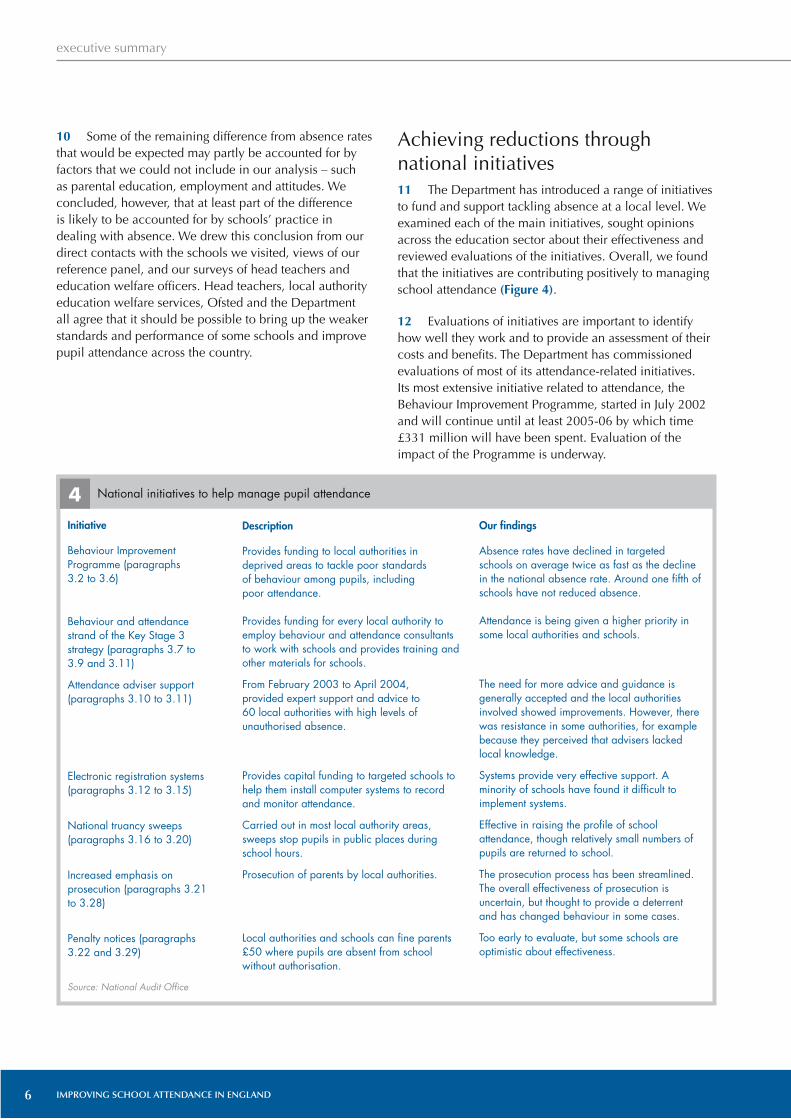
Achieving reductions through national initiatives11 The Department has introduced a range of initiatives to fund and support tackling absence at a local level. We examined each of the main initiatives, sought opinions across the education sector about their effectiveness and reviewed evaluations of the initiatives. Overall, we found that the initiatives are contributing positively to managing school attendance (Figure 4).
12 Evaluations of initiatives are important to identify how well they work and to provide an assessment of their costs and benefits. The Department has commissioned evaluations of most of its attendance-related initiatives. Its most extensive initiative related to attendance, the Behaviour Improvement Programme, started in July 2002 and will continue until at least 2005-06 by which time £331 million will have been spent. Evaluation of the impact of the Programme is underway.
4 National initiatives to help manage pupil attendance
Description
Provides funding to local authorities in deprived areas to tackle poor standards of behaviour among pupils, including poor attendance.
Provides funding for every local authority to employ behaviour and attendance consultants to work with schools and provides training and other materials for schools.
From February 2003 to April 2004, provided expert support and advice to 60 local authorities with high levels of unauthorised absence.
Provides capital funding to targeted schools to help them install computer systems to record and monitor attendance.
Carried out in most local authority areas, sweeps stop pupils in public places during school hours.
Prosecution of parents by local authorities.
Local authorities and schools can fine parents £50 where pupils are absent from school without authorisation.
Our findings
Absence rates have declined in targeted schools on average twice as fast as the decline in the national absence rate. Around one fifth of schools have not reduced absence.
Attendance is being given a higher priority in some local authorities and schools.
The need for more advice and guidance is generally accepted and the local authorities involved showed improvements. However, there was resistance in some authorities, for example because they perceived that advisers lacked local knowledge.
Systems provide very effective support. A minority of schools have found it difficult to implement systems.
Effective in raising the profile of school attendance, though relatively small numbers of pupils are returned to school.
The prosecution process has been streamlined. The overall effectiveness of prosecution is uncertain, but thought to provide a deterrent and has changed behaviour in some cases.
Too early to evaluate, but some schools are optimistic about effectiveness.
Initiative
Behaviour Improvement Programme (paragraphs 3.2 to 3.6)
Behaviour and attendance strand of the Key Stage 3 strategy (paragraphs 3.7 to 3.9 and 3.11)
Attendance adviser support (paragraphs 3.10 to 3.11)
Electronic registration systems (paragraphs 3.12 to 3.15)
National truancy sweeps (paragraphs 3.16 to 3.20)
Increased emphasis on prosecution (paragraphs 3.21 to 3.28)
Penalty notices (paragraphs 3.22 and 3.29)
Source: National Audit Office

executive summary
IMPROVING SCHOOL ATTENDANCE IN ENGLAND 7
13 The Department funds a wide range of other initiatives aimed at improving schools’ leadership, curricula and teaching, as well as the physical environment of the school. These wider initiatives are likely to have an impact on attendance. For example, our analysis indicated that Excellence in Cities4 schools, which receive additional funding, are associated with falls in total absence and unauthorised absence. It is important that the Department’s evaluations of wider initiatives include an assessment of the impact on pupil absence.
14 For some of its initiatives to work more effectively, the Department needs to improve communications with and between local authority education welfare services and schools. For example, we found that some local authorities did not see value in the advice given by the advisers whom the Department funds. They considered that the advisers did not provide expertise over and above that of their own staff, and that some did not tailor their advice to meet local circumstances. On the other hand, around half of the head teachers we surveyed would welcome more guidance on aspects such as term-time holidays, dealing with difficult parental attitudes, and use of sanctions. Guidance is already available in some of these areas, but schools need help in how best to apply it locally.
15 Pupils who struggle with academic subjects at secondary school are at particular risk of being absent and failing to attain basic skills. Alternative curricula and vocational education can motivate these pupils to attend school by matching courses more closely to their aspirations. Small numbers of schools and colleges provide vocational training to 14 to 16-year olds, generally as part of a locally developed and promoted initiative. The Tomlinson Report5 on education and training of 14 to 19-year olds concluded that schools need to strengthen their vocational programmes over the next ten years. In our recent report on improving adult literacy and numeracy6, we noted the progress being made in developing combined programmes of vocational learning and literacy, language and numeracy training for adults. These developments provide a source of good practice and experience in addition to the progress already being made in some schools.
Achieving reductions through more effective local practices16 We identified a number of practices that worked well in schools. Figure 5 overleaf outlines these practices and sets out our findings on how well the schools that we surveyed and visited have implemented them.
17 Most of the schools we visited had most of these practices in place. However, they represented a wide range of levels of attendance – both in absolute terms and adjusted for their context. The main common factor we identified in the schools with the highest attendance was that the schools had adopted all or virtually all the practices some time ago, and had followed them consistently over several years. Other schools that had more recently started to operate the practices in a consistent manner were beginning to see signs of improvement.
18 Local authorities’ education welfare services provide support to schools in handling difficult cases and many services also advise schools on attendance management. Head teachers acknowledge the importance of the services’ role, and most schools are satisfied with the service they receive, but a minority responding to our survey (14 per cent in secondary schools) suggested that the service provided by their local authority was ineffective. We observed that the most effective services were providing a comprehensive, consistent service that supported the range of expectations of schools outlined in Figure 5. In particular, effective services provided in-depth analyses of the causes of absence as well as comparative information between schools. They provided links between schools in similar circumstances to encourage them to share and spread effective practice.
19 Absence rates in primary schools are lower than those in secondary schools, at an average of around 5.5 per cent of days missed compared with 8 per cent respectively. This does not, however, mean that attendance among primary school pupils should receive low priority. Indeed the opposite is likely to be true, since pupils tend to fall into a pattern of absence that tends to increase over time if the causes are not resolved. How absence is handled in primary schools can therefore have a lasting impact – positive or negative – into secondary education. Some local authorities have therefore set up schemes to support pupils throughout their school careers, and especially during the transition from primary to secondary school.
4 Excellence in Cities is a targeted programme to bring additional resources to schools in deprived urban areas.5 14-19 Curriculum and Qualifications Reform: Final Report of the Working Group on 14-19 Reform, October 2004. (www.14-19reform.gov.uk/)6 Skills for Life: Improving Adult Literacy and Numeracy (HC20 2004-05), December 2004. (www.nao.org.uk/pn/04-05/040520.htm)

executive summary
IMPROVING SCHOOL ATTENDANCE IN ENGLAND8
5 Effective practices in attendance management in schools
Benefits
� Pupils and parents know what is expected and why
� Helps teachers to be consistent
� Staff more willing and able to give high priority to attendance
� Sufficient resources for initiatives to improve attendance
� Allows patterns to be identified, e.g. by year group, class, weekday or pupil
� Helps identify pupils with problems who need support
� If well communicated, helps reinforce the importance of good attendance
� Communicates to parents and pupils that absence is noted and needs explanation
� Identifies cases where support may be needed
� Used well, is efficient and provides reliable information, supporting monitoring and first-day calling
� Enables registration for each lesson, identification of lateness and post-registration truancy
� Encourage and recognise attendance
� Increase the profile of attendance
� Stimulate interest of those pupils who are less likely to achieve if focused solely on academic qualifications
� Where other methods fail to work, parents and pupils know that legal sanctions may be used
� Share best practice
� Strong schools can assist weaker schools
� Through expert advice and resources, helps schools to manage attendance effectively
� Provides specialist support for pupils with difficulties
Our findings
Most schools have a clear policy but there can be problems with communicating the policy to staff and parents, leading to inconsistent implementation.
Schools decide how to allocate their resources and the amount they allocate to attendance varies widely. Some schools give attendance a relatively low priority and they do not allocate sufficient resources to it.
The quality of information produced and its monitoring varies widely. Some schools use the information well in communicating with pupils and their families.
Most, but not all, schools operate first day calling, some using electronic systems linked to electronic registration.
Most secondary schools and some primary schools use some form of electronic registration, but more should do so – in particular the 1,100 or so secondary schools that use manual systems. A small minority of schools have had difficulties using it effectively.
Most secondary schools use reward schemes and consider them to be effective, and they are also often used in primary schools.
Relevant mainly to secondary schools, alternative curricula can be difficult to organise and are not widely used. The Tomlinson Report concluded that schools need to strengthen their vocational programmes.
Used mainly by local education authorities, but now more scope for schools to use them.
While some schools collaborate effectively, there is too little collaboration in some areas.
Some local authorities provide very effective services, but a small minority of head teachers consider that their authorities do not provide good support.
Effective practice
Clear policy on attendance, that is communicated to all parties (paragraph 4.5)
Head teacher supports and resources attendance management (paragraph 4.6)
Collection and regular analysis of reliable attendance data (paragraphs 4.7 to 4.9)
“First day calling” of parents of absent pupils (paragraph 4.10)
Electronic registration at each lesson (paragraph 4.11)
Reward schemes (paragraph 4.12)
Alternative curricula (in particular, more vocational education) (paragraph 4.13)
Threat of legal sanctions (paragraph 4.14)
Collaboration with other schools (paragraph 4.15)
Effective working with the local authority’s education welfare service (paragraphs 4.17 to 4.18)
Source: National Audit Office

executive summary
IMPROVING SCHOOL ATTENDANCE IN ENGLAND 9
20 Many head teachers and local authorities consider that negative parental attitudes to education are the external factor that is most closely associated with high rates of absence. Their views are supported by our analysis of the findings of Ofsted inspections, as well as by research that has shown a link between parental attitudes and truancy. Changing the views of parents and carers who do not see the value of their children attending school regularly takes time and is unlikely to be achieved quickly. We found that the most successful schools had focused on changing their own culture towards attendance first. Over time they had integrated their views on the importance of attendance into their wider communications with parents and carers, especially by setting high expectations in promoting their school to new parents and during the first year of school.
21 Through its inspections of schools and local authorities, Ofsted is in a good position to influence and support the strengthening of local practices. Its reports carry great weight and poor performers are obliged to respond to its findings. Ofsted inspection teams have a unique insight into how schools are run, yet attendance has a very small part in most inspections. There is a risk that the most is not being made of inspectors’ wide experience to help schools and authorities improve, particularly in the context of pupil attendance as one of just six national targets for schools.

IMPROVING SCHOOL ATTENDANCE IN ENGLAND10
22 Spending on schools occurs whether or not pupils are at school, and absent pupils are not receiving the benefit of funds spent on their education. The daily absence rate of 450,000 pupils represents around £1.6 billion of annual revenue spending on schools, and the real loss from this absence is to the pupils and to society. Absence cannot be reduced to zero, but a modest reduction would still result in many pupils receiving greater benefit from their education. For example, a reduction in the average annual absence of one day per pupil (8 per cent) would represent benefits to pupils of around £127 million of education revenue spending. It is clearly important that schools, local authorities and the Department continue to make further progress in improving school attendance, and we make the following recommendations to this end.
1 The Department, local authorities and schools must sustain the current momentum and emphasis on improving attendance. The substantial efforts we have observed reflect the Department’s high priority on pupil absence and are starting to have an impact – total absence is falling. A key lesson from our study is that these efforts must be sustained over a long period in order to achieve a substantial and lasting effect. The Department needs to maintain the high profile of attendance, for example through supporting schools in using the range of tools available to them and in developing fair and firm relationships with pupils and their parents.
2 The Department, local authorities and schools need to work together to develop strategies for changing negative parental attitudes to education. Where parents do not value education, pupils are much more likely to be absent from school without a good reason. Changing parental attitudes can be difficult and take a long time, but is essential to achieving sustainable reductions in pupil absence. Schools and local authorities need to persevere. To get the best results, schools need to integrate positive influences on parents into the whole school ethos, not just as a means of improving attendance. The Department should review all its relevant programmes, including wider programmes such as Sure Start, to ensure that the importance of pupils’ attendance at school is being sufficiently reinforced.
3 The Department and local authorities need to help schools to develop their curriculum in ways that match the aptitudes and aspirations of their pupils. In our society, most children increasingly question why they have to do things as they get older. Asked to spend a large part of their lives at school, they are more likely to comply if they can see the benefits for them. Matching the curriculum to their aptitudes and aspirations is also likely to make them more willing to learn while in school. The Department should help schools to draw on the experience of those schools that are already making a success of combining vocational and academic learning. It should also work with the Learning and Skills Council to develop ways of securing the involvement of further education providers and employers in the development and provision of the curriculum.
RECOMMENDATIONS

executive summary
IMPROVING SCHOOL ATTENDANCE IN ENGLAND 11
4 An improvement is needed in the collection and use of data on absence in which all concerned – including pupils – should be involved. The Department and local authorities should prompt schools to continue to improve the data that they collect on absence. Schools should focus on the causes of absence so that they can devise solutions that address specific problems as they emerge, such as a particular form group with increasing absence arising from peer pressure. They should use the data to raise the profile of attendance with pupils and parents, for example by asking older pupils to analyse the data themselves. The Department should make sure that it fulfils its intention to have pupil-level data for absence available for all schools from 2007, in order to support more effective analysis of which groups of pupils are absent and why, and more well informed evaluations of the impact of measures to improve attendance. Well managed schools and local authorities already collect pupil-level data and use it to target their interventions.
5 The Department should support or encourage more secondary schools to introduce electronic registration systems. Used well, these systems help schools to make registration more efficient, allow better monitoring of attendance and effective response to absence. The Department has granted financial support for electronic registration in 530 secondary schools, but we estimate that approximately 1,400 secondary schools still rely on manual systems.
6 The Department should look for ways to reinforce the focus of attention on unauthorised absence of primary schools pupils. If pupils start to truant in primary school and find they can get away with it, getting them to change their ways as they get older will be more difficult. Schools need to take a firm line on unauthorised absence as soon as it occurs, at whatever age it starts. Primary schools should work with their local secondary schools to ensure that, as far as possible, the pupils they transfer have well developed expectations that they will attend school regularly, and that the secondary schools are ready to reinforce that expectation from the day the new pupils enter their school.
7 The Department should evaluate the contribution of relevant initiatives to improving pupil attendance and disseminate the lessons. The Department has a range of initiatives in place to influence attendance and some of its wider initiatives, such as Excellence in Cities, are
also likely to have an impact on attendance. It has evaluations planned or in place for many initiatives, but there would be value in selectively commissioning some further evaluation, for example around local authorities’ and schools’ concerns about making more cost-effective use of sanctions against parents. The Department needs to disseminate the results of evaluations more widely to schools and local authorities so that they can use the lessons to help improve their practice.
8 Schools’ strategies for achieving and maintaining good levels of attendance should enable a range of actions to be developed and embedded in the day-to-day life of the school. Collectively schools and local authorities have built up an impressive range of good practices for dealing with absence, but not all schools have adopted and maintained all the relevant practices consistently over several years – as is generally required in order to achieve a sustained impact on absence. The Department and local authorities need to help schools to sustain their awareness of up-to-date good practice so that they can regularly review their approach, preferably in collaboration with other local schools.
9 The Department should encourage local authorities to review regularly the support that their education welfare services are providing to schools in managing attendance and the effectiveness of funding and support they receive from national initiatives. Education welfare services are generally schools’ main source of external support in managing attendance. Most schools are broadly satisfied with the services but there is room for improvement in many services to bring them into line with the best. Reviews of the services and initiatives should cover the analysis of absence data, help with difficult cases, and services’ overview of schools’ approaches to managing absence compared with up-to-date good practice. Reviews should consider, where relevant, the case for locating the service within schools.
10 Ofsted should consider whether inspections of schools and local authorities could usefully increase their emphasis on improving attendance. Ofsted could potentially add value to schools with relatively little additional effort by basing its extended review and advice around schools’ and authorities’ own assessments of their approach against good practice, which we suggest in recommendations 8 and 9.

IMPROVING SCHOOL ATTENDANCE IN ENGLAND
part one
12
PART ONESchool attendance and absence

IMPROVING SCHOOL ATTENDANCE IN ENGLAND
part one
13
Children must receive full-time education between the ages of five and 161.1 There are many reasons why it is important for children to attend school. A report by the Social Exclusion Unit7 highlighted that children who are regularly absent from school can be damaged as a result: they are more easily drawn into crime and anti-social behaviour; much more likely to leave school with few or no qualifications; more likely to be out of work after leaving school; and more likely to become homeless. High rates of absence from school can also disrupt the education of other children because teachers have to find time to help poor attenders catch up with missed work. In a small number of cases, absence from school can be a sign that a child needs to be protected from harm.
1.2 The law requires that children attend school regularly, making it one of a very small number of activities in life that are compulsory. Under the Education Act 1996, the parent is responsible for making sure that their child of compulsory school age8 receives an efficient full-time education that is suitable to the child’s age, ability and aptitude. Under the Act, the parent is allowed to make alternative arrangements for their child to be educated outside of school, which usually means education at home, provided that it is efficient and suitable.
Many children do not always attend school1.3 Absence from state maintained schools in England amounts to nearly seven per cent of school time. Figure 6 overleaf shows that the 1994-95 absence rate of 7.61% has since declined by 0.9 of a percentage point, the equivalent of around 60,000 more pupils back in school each day.
1.4 The absence rate of 6.72 per cent in maintained schools in England in 2003-04 is on average equivalent to:
� 13 days missed per pupil9;
� 450,000 of the 6.7 million pupils failing to attend school each day; and
� absent pupils sufficient to fill 816 average-sized primary schools plus 252 average secondary schools.
This absence rate excludes the 387,000 day pupils at independent schools, whose average absence rate is 3.97 per cent including 0.13 per cent unauthorised absence.
7 Truancy and School Exclusion, Social Exclusion Unit, 1998. (www.socialexclusion.gov.uk/page.asp?id=293)8 In nearly all cases, education takes place in school, but a parent can provide an education for their child at home so long as the education is suitable and
efficient. “Parents” are: natural parents; persons with parental responsibility; and, carers living with and looking after a child. Compulsory school age is from the start of the school term commencing on or after the child’s fifth birthday and continues until the last Friday of June in the school year that they reach 16.
9 The Department for Education and Skills requires schools to take a morning and an afternoon register, and each child’s absence counts as a half day missed. There are around 380 half day sessions, or 190 days in a year.

IMPROVING SCHOOL ATTENDANCE IN ENGLAND
part one
14
1.5 Taxpayers meet the cost of education in maintained schools, which averaged around £3,620 (excluding capital expenditure) per pupil in 2003-04. The daily absence figure of 450,000 pupils represents a real loss to the absent pupils of around £1.6 billion – that is, the cost of the teaching, facilities and other resources provided from which these pupils do not benefit. And a reduction in absence by, say, one day per pupil (8 per cent) would represent an educational loss reduction of around £127 million a year. This is without counting other costs to society such as the future costs of having a less educated population.
1.6 Absence rates vary between English regions from 6.35 per cent in the South East in 2003-04 to 7.02 per cent in the North East. There is a much wider range in absence between local authorities, ranging from 5.48 per cent in Buckinghamshire to 8.54 per cent in Manchester.10
1.7 Pupils in secondary schools in Scotland and Wales are more frequently absent, while pupils in secondary schools in Northern Ireland have better attendance records (Figure 7).
1.8 We compared pupil absence rates with the sickness absence rates of teachers. The Department’s statistics11 show that, on average, teachers were off sick for 5.4 days each in 2003, equivalent to an absence rate of 2.9 per cent of school days. The higher pupil absence includes absence for reasons other than sickness.
10 Excluding local authorities with fewer than 5,000 children of school age. 11 School Workforce in England: Provisional Teacher Sickness Absence in 2003 and Teacher Ethnicity 2004, Department for Education and Skills, 2004.
(www.dfes.gov.uk/rsgateway/DB/SFR/s000466/index.shtml)
There has been a reduction in authorised absence rates in schools between 1994-95 and 2003-04.
Total absence (percentage of half days missed)
Source: National Audit Office analysis of the Department for Education and Skills’ data
Absence rates in maintained schools, 1994-95 to 2003-046
9
8
7
6
5
4
3
2
1
094-95 95-96 96-97 97-98 00-01 01-02 02-03 03-0498-99 99-00
Authorised absence Unauthorised absence

IMPROVING SCHOOL ATTENDANCE IN ENGLAND
part one
15
There is a range of causes for pupils missing school
1.9 Each time a pupil does not attend school, their parent or carer is required to provide an explanation to the school, which then decides whether the reason for absence is acceptable (“authorised”) or not acceptable (“unauthorised”). Around 90 per cent of absence is authorised, for example where pupils are unwell or where the school agrees to an absence on a family holiday during term-time. Unauthorised absence is often known as “truancy”, and is the form of absence with which government, education workers and schools have been most concerned. Although it is only a small proportion of absence, it tends to become more common as children get older.
1.10 There are many causes of absence from school, with illness being the most common cause. Research in 1999 suggested a variety of causes for unauthorised absence including uninspiring curriculum, learning difficulties, apathy, bullying and school relationships.12 Other research has found that local authorities and schools identify parental attitudes and home environments as very influential.13
1.11 Our survey asked head teachers to rank the reasons given for absence in order of the most significant causes. They named sickness absence, holidays in term-time and medical appointments as the most common reasons for absence (Figure 8). These results are consistent with those of our survey of local authority education welfare services, who cited illness and term-time holidays respectively as the most significant reasons for absence.
Absence rates in secondary schools in England were lower than in Scotland and Wales but higher than in Northern Ireland.
Total absence(percentage of half days missed)
Source: Improving Pupil Attendance at School, Northern Ireland Audit Office, 2004
12
10
8
6
4
2
0
Comparison of home nations’ secondary school absence rates, 2002-03
7
Northern Ireland
England Wales Scotland
12 Truancy and Schools, Ken Reid, 1999.13 Absence from School: A study of its causes and effects in seven LEAs, Heather Malcolm, Valerie Wilson, Julia Davidson and Susan Kirk, Department for
Education and Skills, 2003. (www.dfes.gov.uk/research/data/uploadfiles/RR424.pdf)
8 Reasons for absence from school
Illness, family holidays and appointments were cited as the most significant reasons for absence in primary and secondary schools.
We asked head teachers: What do you consider to be the most significant causes of pupil absence from your school?
Primary schools Secondary schools
Illness Illness
Family holidays Family holidays
Medical appointments Medical appointments
Ethnicity1 Truancy with parent’s knowledge
Truancy with Excluded parent’s knowledge pupils
NOTE
1 For example, absence relating to observance of religious holy days and travel to countries of ethnic origin.
Source: National Audit Office survey of head teachers
5th
4th
3rd
2nd
1st
IMPROVING SCHOOL ATTENDANCE IN ENGLAND
part one
16
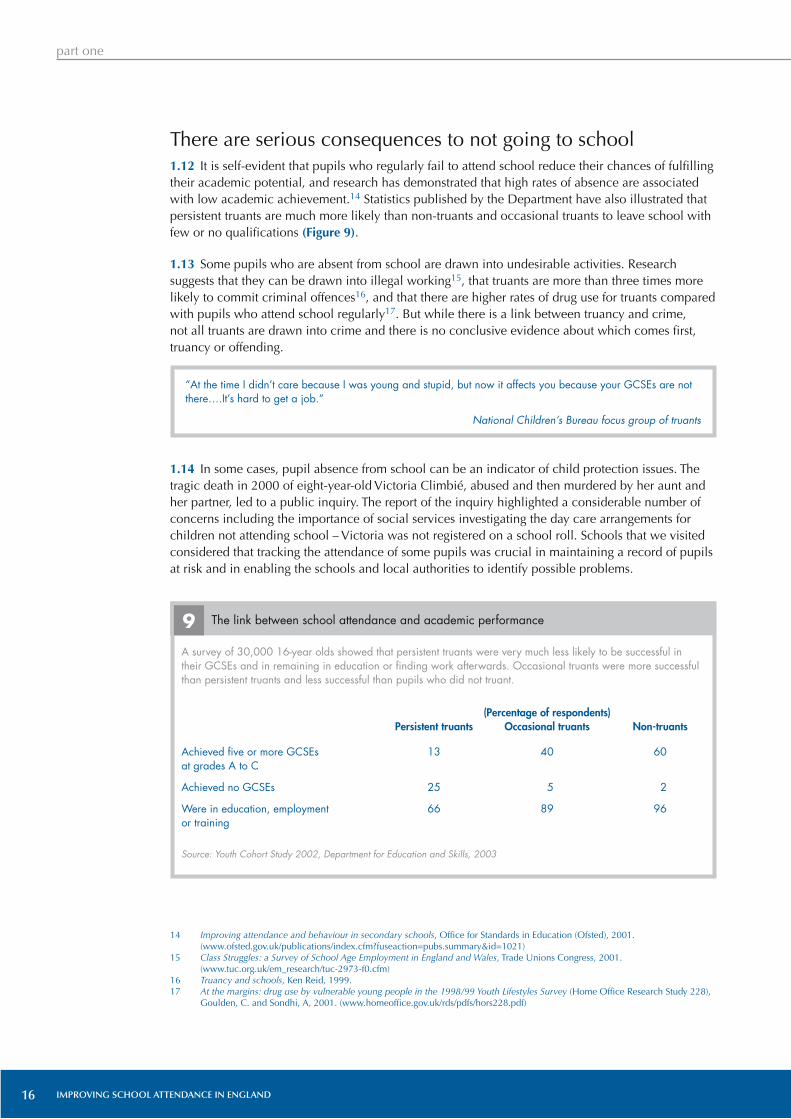
There are serious consequences to not going to school1.12 It is self-evident that pupils who regularly fail to attend school reduce their chances of fulfilling their academic potential, and research has demonstrated that high rates of absence are associated with low academic achievement.14 Statistics published by the Department have also illustrated that persistent truants are much more likely than non-truants and occasional truants to leave school with few or no qualifications (Figure 9).
1.13 Some pupils who are absent from school are drawn into undesirable activities. Research suggests that they can be drawn into illegal working15, that truants are more than three times more likely to commit criminal offences16, and that there are higher rates of drug use for truants compared with pupils who attend school regularly17. But while there is a link between truancy and crime, not all truants are drawn into crime and there is no conclusive evidence about which comes first, truancy or offending.
1.14 In some cases, pupil absence from school can be an indicator of child protection issues. The tragic death in 2000 of eight-year-old Victoria Climbié, abused and then murdered by her aunt and her partner, led to a public inquiry. The report of the inquiry highlighted a considerable number of concerns including the importance of social services investigating the day care arrangements for children not attending school – Victoria was not registered on a school roll. Schools that we visited considered that tracking the attendance of some pupils was crucial in maintaining a record of pupils at risk and in enabling the schools and local authorities to identify possible problems.
“At the time I didn’t care because I was young and stupid, but now it affects you because your GCSEs are not there….It’s hard to get a job.”
National Children’s Bureau focus group of truants
9 The link between school attendance and academic performance
A survey of 30,000 16-year olds showed that persistent truants were very much less likely to be successful in their GCSEs and in remaining in education or finding work afterwards. Occasional truants were more successful than persistent truants and less successful than pupils who did not truant.
(Percentage of respondents) Persistent truants Occasional truants Non-truants
Achieved five or more GCSEs 13 40 60at grades A to C
Achieved no GCSEs 25 5 2
Were in education, employment 66 89 96or training
Source: Youth Cohort Study 2002, Department for Education and Skills, 2003
14 Improving attendance and behaviour in secondary schools, Office for Standards in Education (Ofsted), 2001. (www.ofsted.gov.uk/publications/index.cfm?fuseaction=pubs.summary&id=1021)
15 Class Struggles: a Survey of School Age Employment in England and Wales, Trade Unions Congress, 2001. (www.tuc.org.uk/em_research/tuc-2973-f0.cfm)
16 Truancy and schools, Ken Reid, 1999.17 At the margins: drug use by vulnerable young people in the 1998/99 Youth Lifestyles Survey (Home Office Research Study 228),
Goulden, C. and Sondhi, A, 2001. (www.homeoffice.gov.uk/rds/pdfs/hors228.pdf)
IMPROVING SCHOOL ATTENDANCE IN ENGLAND
part one
17
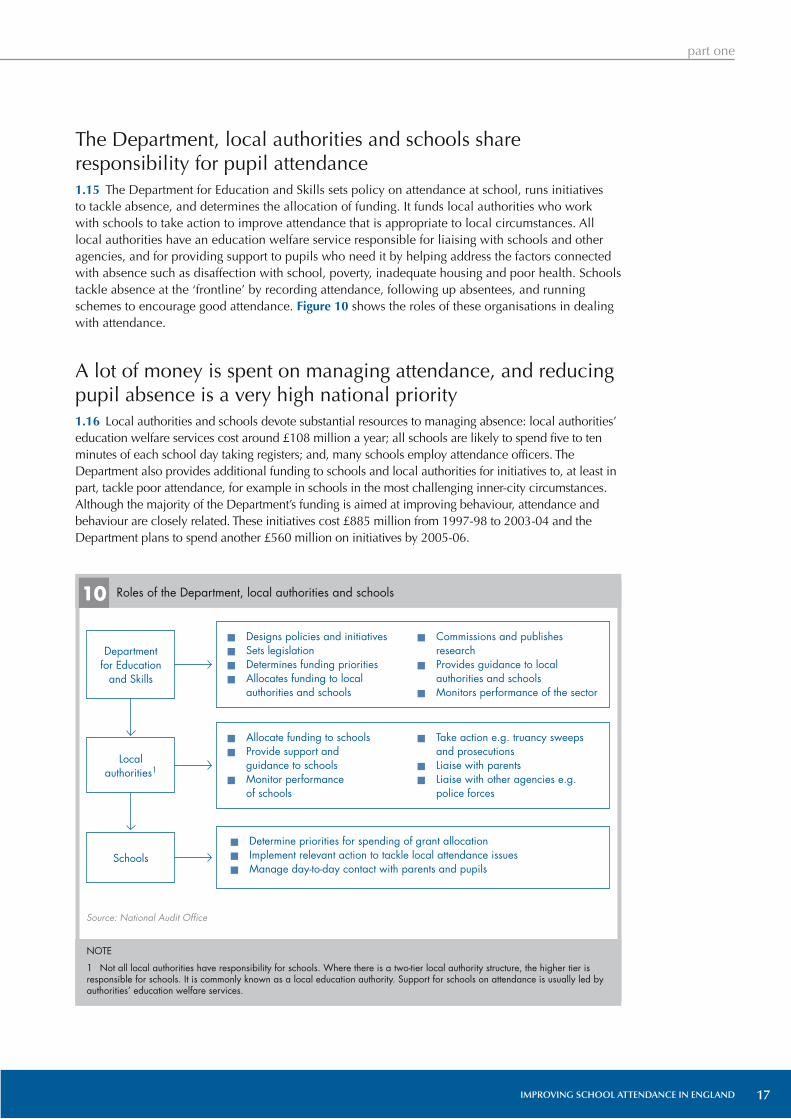
The Department, local authorities and schools share responsibility for pupil attendance1.15 The Department for Education and Skills sets policy on attendance at school, runs initiatives to tackle absence, and determines the allocation of funding. It funds local authorities who work with schools to take action to improve attendance that is appropriate to local circumstances. All local authorities have an education welfare service responsible for liaising with schools and other agencies, and for providing support to pupils who need it by helping address the factors connected with absence such as disaffection with school, poverty, inadequate housing and poor health. Schools tackle absence at the ‘frontline’ by recording attendance, following up absentees, and running schemes to encourage good attendance. Figure 10 shows the roles of these organisations in dealing with attendance.
A lot of money is spent on managing attendance, and reducing pupil absence is a very high national priority1.16 Local authorities and schools devote substantial resources to managing absence: local authorities’ education welfare services cost around £108 million a year; all schools are likely to spend five to ten minutes of each school day taking registers; and, many schools employ attendance officers. The Department also provides additional funding to schools and local authorities for initiatives to, at least in part, tackle poor attendance, for example in schools in the most challenging inner-city circumstances. Although the majority of the Department’s funding is aimed at improving behaviour, attendance and behaviour are closely related. These initiatives cost £885 million from 1997-98 to 2003-04 and the Department plans to spend another £560 million on initiatives by 2005-06.
10 Roles of the Department, local authorities and schools
Department for Education
and Skills
Source: National Audit Office
� Designs policies and initiatives� Sets legislation� Determines funding priorities� Allocates funding to local
authorities and schools
� Commissions and publishes research
� Provides guidance to local authorities and schools
� Monitors performance of the sector
Local authorities1
� Allocate funding to schools� Provide support and
guidance to schools� Monitor performance
of schools
� Take action e.g. truancy sweeps and prosecutions
� Liaise with parents� Liaise with other agencies e.g.
police forces
Schools� Determine priorities for spending of grant allocation� Implement relevant action to tackle local attendance issues� Manage day-to-day contact with parents and pupils
NOTE
1 Not all local authorities have responsibility for schools. Where there is a two-tier local authority structure, the higher tier is responsible for schools. It is commonly known as a local education authority. Support for schools on attendance is usually led by authorities’ education welfare services.
IMPROVING SCHOOL ATTENDANCE IN ENGLAND
part one
18
1.17 The Department previously had two targets on school attendance, both of which included absence in independent schools.
� A Public Service Agreement 1998 target to reduce unauthorised absence by a third between 1999 and 2002 (from 0.7 per cent to 0.5 per cent half days missed a year due to unauthorised absence) – no reduction was achieved by 2002 and the target was replaced.
� A Public Service Agreement 2000 and 2002 target to reduce school truancies by 10 per cent by 2004 compared to 2002 (from 0.72 per cent to 0.65 per cent). The target was not met – unauthorised absence for the 2003-04 school year remained at 0.72 per cent.
1.18 As one of six Public Service Agreement targets for schools set in July 2004 (the other five are set out in footnote 2 on page 4), the Department must reduce the 2003 total absence rate by 8 per cent (from 6.83 per cent to 6.28 per cent) by 2008. This reduction would represent around 39,000 more pupils in school each day. By the end of the 2003-04 school year, the Department was almost halfway to achieving the new target. Again, the target includes day pupils at independent schools.
Study scope and methodology1.19 In assessing whether efforts to tackle truancy and absence were likely to lead to a sustained increase in attendance, we examined:
� the external factors affecting and influencing absence, determined via quantitative analysis (Part 2);
� whether national initiatives are likely to lead to improved attendance (Part 3); and
� whether more could be done at local level to improve attendance (Part 4).
1.20 We covered both primary and secondary schools. Figure 11 summarises the elements of our methodology, and Appendix 1 provides a full description. Our analysis in Part 2 of the report draws upon work we commissioned from the National Foundation for Educational Research to conduct quantitative analysis into the factors that affect attendance, including an analysis to determine the extent to which low performing schools affect the national rates. We commissioned IFF Research to facilitate focus groups of local authority principal education welfare officers.

IMPROVING SCHOOL ATTENDANCE IN ENGLAND
part one
19
11 Study methodology
Discussions with the Department and others
Source: National Audit Office
Are current efforts to tackle abence likely to lead to a sustained increase in attendance?
NOTES
1 Analysis of existing research includes: a literature review and reviews of evaluations of initiatives.
Analysis of existing research1
Review of Ofsted inspection reports
Financial analysis
Quantitative analysis of absence data
Reference panel of experts
Focus groups of Principal Education Welfare Officers of local authorities
Case study of local authority
Survey of education welfare services
Survey of head teachers
Visits to 17 schools

IMPROVING SCHOOL ATTENDANCE IN ENGLAND
part two
PART TWOOur analysis of variations in pupil absence
20

IMPROVING SCHOOL ATTENDANCE IN ENGLAND
part two
21
2.1 Part 1 of this report showed that total attendance rates in England fluctuated between 1994-95 and 2000-01 and have improved slightly since then. This part of the report considers:
� the Department’s performance against its targets;
� variations in absence rates between schools;
� factors associated with variations in absence rates between schools;
� variations in the performance of different types of school, after adjusting for these factors; and
� the relationships between Ofsted assessments and absence rates.
The 2004 target to reduce unauthorised absence was not achieved2.2 Until recently, the Department has focused primarily on tackling unauthorised absence and its targets have been to reduce this type of absence. The 2002 Public Service Agreement target was to reduce unauthorised absence, then 0.72 per cent of school days, by 10 per cent by 2004. To meet the target, 5,000 fewer pupils each day needed be unauthorised absent. However, the recorded rate of unauthorised absence remained at 0.72 per cent in the 2003-04 school year.
Total attendance is improving 2.3 From 2004 to 2008, the Department is targeting a reduction in total absence.18 Total absence is a more reliable measure than unauthorised absence, because schools have adopted different policies on what absence is not authorised and some schools have changed their policies. With authorised absence on a downward trend, there has been some progress in improving attendance overall (Figure 2 on page 4).
There are difficulties in assessing attendance data2.4 The Department relies on schools to provide complete and accurate data. We identified some weaknesses with the data.
� Completeness – the Department prepares national attendance data from school returns and so it does not include young people who are not on a school roll. School data may not include all “post-registration truancy” that occurs when pupils register and then skip lessons, and 74 per cent of education welfare services in our survey considered that this type of absence was a problem.
� Accuracy – schools use various manual and electronic systems for recording absence and some devote little administrative resource to recording and monitoring absence, which increases the risk that data will be inaccurate. More recently, increased vigilance and investment in attendance initiatives may have resulted in better recording and so may have increased recorded levels of unauthorised absence without necessarily reflecting deterioration in performance.
� Consistency – the Department publishes guidance for schools on how to record and categorise absence, allowing schools some discretion in whether they authorise term-time holidays.
2.5 Better data would provide more reliable insights into the causes of absence and how best to tackle it, and more frequent data would allow for more timely interventions. From the 2004-05 school year, the Department is requiring that schools return attendance data every term and that 200 secondary schools with consistently high absence rates return data every half-term.
There are wide ranges of absence rates between maintained schools
2.6 Total absence in primary schools ranges widely from 0.3 to 29 per cent of days and in secondary schools from 2 to 20 per cent (Figure 12).
18 As with the Department’s previous attendance targets, performance includes maintained schools and independent schools.

IMPROVING SCHOOL ATTENDANCE IN ENGLAND
part two
22
2.7 We assessed the extent to which variations between schools’ unauthorised and total absence rates in 2002-03 can be explained by schools’ characteristics (contextual factors) and identified those contextual factors that most influence absence rates. The analysis involved sophisticated multi-level modelling techniques, and the results include estimates for uncertainty and are robust. Further details of the methodology and some of the results of the analysis are set out in Appendix 2. The principal elements covered:
� variations in absence rates between schools within the same local authorities;
� the extent to which contextual factors and academic attainment were associated with absence rates; and
� variations in absence rates between different types of school, after adjusting for contextual factors and attainment.
2.8 Our report focuses on total absence because it is a more reliable measurement than unauthorised absence (paragraph 2.4). Since July 2004, total absence has also been the focus of the Department’s target (paragraph 1.18).
A minority of schools have absence rates that are much higher than their local authority averages
2.9 While schools’ absence rates vary across the country, most schools have absence rates that are close to the average absence rate for their local authority. However, a minority of schools in some local authorities have absence rates much higher than the local authority average, and might be viewed as low-performing ‘outlier’ schools. Figure 13 and Figure 14 show the extent to which schools’ total absence varies from local authority averages.
2.10 Although absence is found in all schools, reducing absence in those with exceptionally high rates would have a substantial effect on the national absence rate. We examined the effect of the schools with the highest absence rates in each local authority improving their performance to average levels. For primary schools, improving the worst four schools in each local authority would change the national absence from 5.70 per cent to 5.53 per cent (equivalent to a 3 per cent reduction). For secondary schools, improving the worst four schools in each local authority would change the national absence rate from 8.40 per cent to 7.71 per cent (equivalent to a 8 per cent reduction).
There are wide ranges of absence rates between schools.
Source: National Foundation for Educational Research (NFER) analysis for the National Audit Office
NOTE
The range of secondary and primary total absence starts from a point higher than 0, giving the appearance of displacement of the bars in this figure.
Unauthorised absence (Secondary)
Unauthorised absence (Primary)
Total absence (Secondary)
Total absence (Primary)
Absence rate (percentage of days)
0 5 10 15 20 25 30
Variations in absence rates, 2002-0312

IMPROVING SCHOOL ATTENDANCE IN ENGLAND
part two
23
Source: NFER analysis for the National Audit Office
NOTE
Schools’ differences in absence rates from local authority averages have been rounded to the nearest percentage point.
Most primary schools’ absence rates in most local authorities are broadly in line with the average absence rate in their local authority.
Percentage of schools
35
30
25
20
15
10
5
0
Primary schools’ absence rates compared with their local authority average, 2002-0313
Difference in absence rate from local authority average (percentage points)
-5 -4 -3 -2 -1 0 1 2 3 4 5 6 7
Absence lower than average Absence higher than average
Source: NFER analysis for the National Audit Office
NOTE
Schools’ differences in absence rates from their local authority averages have been rounded to the nearest percentage point.
Most secondary schools’ absence rates in most local authorities are broadly in line with the average absence rate in their local authority.
Percentage of schools
25
20
15
10
5
0
Secondary schools’ absence rates compared with their local authority average, 2002-0314
Difference in absence rate from local authority average (percentage points)
-5 -4 -3 -2 -1 0 1 2 3 4 5 6 7 8 9 10 11-6
Absence lower than average Absence higher than average

IMPROVING SCHOOL ATTENDANCE IN ENGLAND
part two
24
Some of the variations in absence can be explained by contextual factors and academic attainment2.11 Our analysis of 22 contextual factors that are most strongly associated with absence rates was limited to those for which information is available on databases maintained by the Department. The factors included, for example, take up of free school meals, the ethnicity and gender mixes of schools, and school size and pupil-teacher ratios. Existing measures of context are imperfect and incomplete – for example, the Committee of Public Accounts previously concluded that the percentage of pupils eligible for free school meals is only a partial measure of deprivation.19 The Department accepted the Committee’s conclusion and noted that it had begun to explore the scope for using indicators of neighbourhood social circumstances. Some other important contextual factors, such as the numbers of pupils from traveller families20 and parental attitudes to education, were not available. Ofsted reported that the vast majority of traveller pupils were on the periphery of the education system, with many not registered on a school roll and an absence rate of around 25 per cent for those who are registered.
2.12 In addition, the Department’s absence data is not yet available at pupil-level21, and therefore analysis of schools’ performance relies on “whole school” data, which increases the uncertainty of the analysis. For example, it is possible to say that schools with high proportions of Asian pupils tend to have relatively low levels of absence. However, because there is no absence data at pupil-level, it is not possible to conclude with certainty that the pupils actually taking less time off school are the Asian pupils, or whether some other factor related to the presence of Asian pupils is causing relatively low absence across the school. Pupil-level data would also allow more detailed analysis, for example of the different levels and patterns of absence of different age groups, which could help show where resources should be targeted to achieve improvements.
The most important contextual factor is the level of pupils with free school meals
2.13 There were nevertheless statistically significant relationships between absence rates and 20 of the contextual factors. Figure 15 sets out the factors that are most strongly associated with high or low levels of total absence. The most important factor is the level of take up of free school meals. Schools with high levels of pupils with free school meals are likely to be located in more deprived areas in the country. Not only the free school meal level in a school matters but also the extent to which these levels exceed overall levels within a local authority – that is, the higher the levels of free school meals in a school compared to the rest of the local authority, the higher the rate of absence will generally be. However, the effect flattens off once a certain level of free school meals has been reached, and further increases in free school meal levels are not related to increases in absence.
2.14 Some ethnic groups are associated with higher or lower rates of absence. Schools with higher proportions of Asian, Black-African or Black-Caribbean pupils were associated with lower absence rates. This relationship is in spite of the increased likelihood that pupils of some minority ethnic origins will be absent from school on extended visits to relatives living abroad. Because the data is school-level rather than pupil-level, it is not clear whether it is these minority ethnic pupils who have lower absence rates, or whether there is something connected to these groups of pupils at their schools that is linked to the whole school absenteeing less than other schools. These results may indicate that absence is a particular problem with white pupils from more deprived backgrounds, as found by recent research conducted into pupil-level data by the NFER on behalf of the Department.22
19 Making a Difference: Performance of Maintained Secondary Schools in England, 19th Report of 2003-04 reported that eligibility for free school meals has limitations as a measure. This is because some pupils may be eligible but not take up free school meals and the measure does not assess pupils’ relative economic well-being. (www.nao.org.uk/publications/nao_reports/02-03/02031332es.pdf)
20 Provision and Support for Traveller Pupils, Ofsted, 2003. (www.ofsted.gov.uk/publications/index.cfm?fuseaction=pubs.displayfile&id=3440&type=pdf) 21 By contrast, pupil-level data is held by all schools and some local authorities and they should therefore be able to carry out their own analyses.22 Analysis of Pupil Attendance Data in Excellence in Cities (EIC) Areas: An Interim Report, NFER for the Department, September 2004.
(www.dfes.gov.uk/research/data/uploadfiles/RR571.pdf)

IMPROVING SCHOOL ATTENDANCE IN ENGLAND
part two
25
Academic attainment is strongly related to absence rates
2.15 We analysed 14 attainment variables (relating to Key Stage 2 performance) for primary schools and 23 attainment variables (relating to Key Stage 3 and GCSE performance) for secondary schools. At primary schools, we found that high Key Stage 2 scores were strongly associated with low absence rates. Other results indicate that schools where there is a wide range of attainment levels show higher rates of absence than might be expected. At secondary schools, we found that high GCSE point scores were strongly associated with low absence rates.
2.16 Interpretation of the relationship between attendance and academic attainment is problematic. We did not seek to determine the causal relationship between attainment and attendance, but simply to show the link between schools’ good academic results and lower absence rates. The relationship is likely to be circular – potentially high achieving pupils may be more likely to attend school, and their higher attendance may contribute to higher actual achievement.
15 Key contextual factors associated with total absence rates, 2002-03
Key contextual factors that are associated with absence rates relate mainly to pupils’ backgrounds.
Factor Commentary
Pupils’ take up of free school meals (school level)
Exclusion of pupils from school (2001-02)
Pupils with Special Educational Needs
Pupils whose first language is not English
This is a measure of deprivation and high take up rates are very strongly associated with high absence rates in primary and secondary schools. Our analysis also indicates that it is not only the take up level that matters, but the extent to which a school’s level exceeds the average of its local authority.
Schools with high rates of exclusions have higher rates of absence. Fixed period exclusions are counted as authorised absence, and a high level of exclusions may indicate that a school’s pupils are more likely to have behavioural problems.
Schools with high percentages of pupils with statements of Special Educational Needs tend to have higher rates of absence.
In primary schools, high percentages of pupils with a first language that is not English are associated with high absence.
Factors associated with higher absence rates:
Factors associated with lower absence rates:
Pupil stability
Ethnicity – Asian pupils
Ethnicity – Black-African pupils
In secondary schools, increased percentages of pupils remaining at the school between Key Stage 3 and GCSE are associated with lower levels of absence. (Pupil stability information was not available for primary schools).
Greater percentages of Asian pupils are strongly associated with reduced levels of absence in secondary schools.
Greater percentages of Black-African pupils are associated with reduced levels of absence.
Source: NFER analysis for the National Audit Office

IMPROVING SCHOOL ATTENDANCE IN ENGLAND
part two
26
Differences between schools’ absence rates are partly explained by contextual factors and academic attainment
2.17 Our analysis found that some of the variation between different schools’ total absence rates is explained when different schools’ context and attainment are taken into account:
� 43 per cent of variation between primary schools can be attributed to differences in schools’ contexts and attainment levels; and
� 70 per cent of variation between secondary schools can be attributed to differences in schools’ contexts and attainment levels.
The remaining unexplained variation implies that absence rates are also related to contextual factors that we were not able to measure, for example parental backgrounds and attitudes towards education, and to the ways schools are run.
2.18 We analysed whether individual schools’ performance on absence was clearly better or worse than expected once adjustments were made for their contextual factors. Figure 3 on page 5 shows that, given the schools’ contexts, over 900 (30 per cent) secondary schools have absence rates that are significantly higher than would be expected, while nearly 1,100 (35 per cent) secondary schools’ absence rates are significantly lower than would be expected.
2.19 We examined the extent to which the one fifth of primary and secondary schools with the worst absence rates ranked differently when their absence rates were adjusted for their context. Figure 16 shows that around 60 per cent remained in the worst group of schools after adjusting for their context, and around 10 per cent of schools moved up to the top two groups. Box 1 provides an example of a school whose ranking changed substantially when its result was adjusted to take account of contextual factors.
Just over 60 per cent of schools with the worst absence remained in the worst category after adjusting for their context.
Performance groups after adjusting for contextual factors
Source: NFER analysis for the National Audit Office
0 10 20 30 40 50 60 70
Best
2nd from best
Middle
Percentage of schools
2nd from worst
Worst
Secondary schools
Primary schools
Adjusted rankings of schools with the highest absence rates, 2002-03
16
BOX 1
Hereward Community College, Peterborough
Hereward Community College is a secondary school located in a relatively deprived part of town. In the 2002-03 school year, its total absence rate was 7 per cent (close to the national average) and its unauthorised absence rate was 1.9 per cent (much higher than the national average). The school has a relatively high number of pupils from traveller families and high rates of free school meals. After adjusting total absence rates for the school’s context, we found that it was performing far better than might be expected given its circumstances: the school was ranked the 7th best performing secondary school in England. When visiting the school, we found that the head teacher placed great emphasis on getting pupils to attend school. The school has a full-time attendance officer and runs an electronic registration system.

IMPROVING SCHOOL ATTENDANCE IN ENGLAND
part two
27
Some of the variations in absence reflect the type of school2.20 We examined whether the different school types are associated with variations in absence rates, taking account for contextual factors. Some schools fall into more than one of these categories (for example, a school may be a specialist school and have a sixth form). Figure 17 shows the difference in adjusted absence rates between the main types of secondary school – our analysis showed a stronger effect for secondary schools than primary schools.
2.21 At secondary level, selective, voluntary aided, specialist, foundation and boys’ schools are all associated with lower absence rates than is predicted by their context, while schools with sixth forms tended to have higher rates of absence (although sixth form pupils are not included in attendance statistics). In particular, absence rates are lower in selective schools than predicted based on their context. Although faith schools are associated with lower rates of unauthorised absence in primary schools, our model did not find that there was a significant relationship between faith schools and total absence rates. Faith schools mostly have either voluntary aided
or voluntary controlled status, and the former status is associated with lower absence while the latter status is not. Our analysis cannot explain why different types of school perform on average better or worse than other schools, and a range of pupil, school and context related factors are likely to be at play. For example, pupils of selective schools may come from relatively less deprived homes even if they do live in a deprived area.
2.22 We examined how schools’ performance, adjusted for their context, had changed in the three years from 2000-01 to 2002-03. Measures to tackle absence seem to be having an effect in reducing total absence, but unauthorised absence may be proving more difficult to reduce, particularly in some secondary schools. Excellence in Cities schools, which receive additional funding, and schools with high levels of pupils eligible for free school meals, which are likely to have access to many of the Department’s initiatives, are associated with faster reductions in absence compared to other schools. The relative success of these schools may reflect the benefits of the initiatives, an increased priority given to attendance or possibly a relative ease of achieving improvements in poorer performing schools.
Some school types have statistically significant relationships with attendance levels. For example, selective schools have relatively the lowest absence after adjusting for contextual factors.
Source: NFER analysis for the National Audit Office
NOTE
Some schools fall into more than one of these categories, and so are associated with more than one effect. For example, a specialist school with a sixth form would be predicted to have higher absence rates than one without a sixth form.
The associated effect on absence rates (days per year)
-2-2.5-3 -1.5 -1 -0.5 0 0.5 1
With sixth form
Boys’ school
Foundation
Specialist
Voluntary aided
Selective
Association between different types of secondary school and absence rates, 2002-0317

IMPROVING SCHOOL ATTENDANCE IN ENGLAND
part two
28
Good Ofsted assessments are broadly linked to lower absence2.23 Our analysis considered how closely Ofsted judgements of schools are related to absence rates, out of ten judgements relevant to attendance. We found that more positive assessments of primary and secondary schools are generally linked to lower absence rates. We found that the strongest link was between positive assessments of attendance and low absence rates - as expected because Ofsted inspectors examine absence rates to help them make this judgement. We also found that:
� pupils’ attitudes to the school are strongly linked with attendance, particularly for secondary schools;
� schools with positive assessments on parental relationships with the school are strongly associated with lower absence;
� positive assessments on effective systems for monitoring and improving attendance are associated with lower absence;
� other relevant judgements for which positive assessments are associated with lower absence are behaviour of pupils (including the incidence of exclusions), and pupils’ personal development and relationships; and
� surprisingly, positive assessments of leadership and management of the head teacher and key staff are associated with higher absence rates. This may be because strong leaders are sometimes brought in to improve poor-performing schools, and it takes time to turn around attendance.

IMPROVING SCHOOL ATTENDANCE IN ENGLAND
part two
29

IMPROVING SCHOOL ATTENDANCE IN ENGLAND
part three
PART THREEHow wider initiatives can improve attendance
30
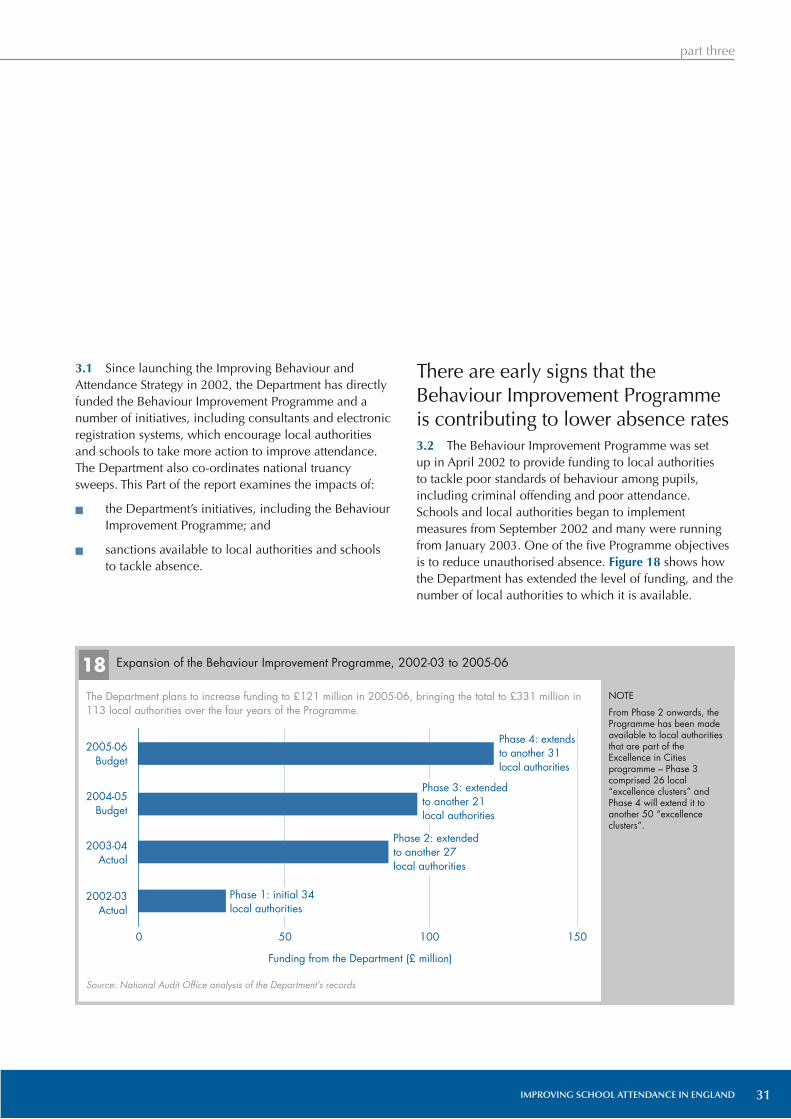
IMPROVING SCHOOL ATTENDANCE IN ENGLAND
part three
31
3.1 Since launching the Improving Behaviour and Attendance Strategy in 2002, the Department has directly funded the Behaviour Improvement Programme and a number of initiatives, including consultants and electronic registration systems, which encourage local authorities and schools to take more action to improve attendance. The Department also co-ordinates national truancy sweeps. This Part of the report examines the impacts of:
� the Department’s initiatives, including the Behaviour Improvement Programme; and
� sanctions available to local authorities and schools to tackle absence.
There are early signs that the Behaviour Improvement Programme is contributing to lower absence rates3.2 The Behaviour Improvement Programme was set up in April 2002 to provide funding to local authorities to tackle poor standards of behaviour among pupils, including criminal offending and poor attendance. Schools and local authorities began to implement measures from September 2002 and many were running from January 2003. One of the five Programme objectives is to reduce unauthorised absence. Figure 18 shows how the Department has extended the level of funding, and the number of local authorities to which it is available.
The Department plans to increase funding to £121 million in 2005-06, bringing the total to £331 million in 113 local authorities over the four years of the Programme.
Source: National Audit Office analysis of the Department’s records
NOTE
From Phase 2 onwards, the Programme has been made available to local authorities that are part of the Excellence in Cities programme – Phase 3 comprised 26 local “excellence clusters” and Phase 4 will extend it to another 50 “excellence clusters”.
Expansion of the Behaviour Improvement Programme, 2002-03 to 2005-0618
Funding from the Department (£ million)
Phase 4: extends to another 31 local authorities
2005-06Budget
2004-05Budget
2003-04Actual
2002-03Actual
0 50 100 150
Phase 3: extended to another 21 local authorities
Phase 1: initial 34local authorities
Phase 2: extendedto another 27 local authorities

IMPROVING SCHOOL ATTENDANCE IN ENGLAND
part three
32
3.3 Local authorities and schools use the funding in a range of ways, including piloting of innovative methods of supporting pupils most at risk of truancy. Box 2 shows two examples of how the funding has been used to tackle absence.
3.4 The Department is assisted in the management of the Behaviour Improvement Programme by PricewaterhouseCoopers, who monitor local authorities’ progress against quarterly targets, provide support and share good practice. The Department may decide to withdraw funding from an authority if it considers that it would not be spent effectively. By September 2004, the Department had not found cause to do so.
3.5 The Department appointed the Institute of Education, University of London to evaluate the effectiveness of the Programme and the performance of the programme managers. The first phase of the evaluation found that delays due to difficulties in recruiting new professional staff had contributed to a majority of local authorities missing the targets they set themselves for autumn 2002, the first school term of the Programme. The second phase of the evaluation, in August 2004, reported that although recruitment remained an issue, progress had been made across participating local authorities and schools involved in the Programme. Figure 19 shows that between school years 2001-02 and 2003-04, total absence in Phase 1 schools declined appreciably: absence in primary schools fell from 7.6 per cent to 6.7 per cent and absence in secondary schools fell from 12.0 per cent to 10.2 per cent. These overall reductions are around twice the rates of reduction in the national averages, although around one fifth of Phase 1 schools did not reduce absence in the period.
3.6 Our survey of head teachers showed that the majority of those involved in the Programme consider it effective (Figure 20). Education welfare services were also positive about its effectiveness, although some had experienced delays in getting it up and running. Some services have concerns about the Programme’s cost-effectiveness, an issue that we explored with our focus groups (paragraph 3.11).
Advice from consultants is also supporting improvements but has met some resistance3.7 As part of the Key Stage 3 Strategy (focused on 11 to 14-year olds but relevant to all pupils in a school), the Department has funded local authorities to recruit behaviour and attendance consultants – there were 236 in post by December 2004. The consultants are available to all secondary schools in all local authorities. The initiative, which also includes the provision of audit, guidance and staff training materials, will cost the Department £73 million between 2003-04 and 2005-06.
BOX 2
Examples of the use of Behaviour Improvement Programme funding and the impact on a child
Newcastle City Council
Newcastle City Council allocated £191,000 of its Programme funding to one secondary school and its four feeder primary schools. The schools decided together to spend some of their funding to supplement the local authority’s education welfare service. Part of the service is now dedicated to the five schools and physically located in each of the schools. The service remains managed by the local authority but the schools decide the priorities for the service. The service carries out a number of roles including telephoning parents on the first day that a pupil fails to attend school, visiting parents of persistently absent pupils, and developing the schools’ attendance strategies. We found that the service has developed innovative schemes for encouraging attendance such as home reading books that emphasise the importance of good attendance. While all local authorities run an education welfare service, it is unusual for the service to be located in and shared across a cluster of schools. Participants felt that the scheme allowed the service to provide better support for the schools and families. Recent attendance figures show reductions in absence across the five schools.
The success we found in Newcastle is consistent with the results of an independent evaluation of the devolution of education welfare services which found that the best results came where the service was school-based and local authority-managed.
“Claudia”, 14 years of age
Claudia did not regularly attend her school because she had no real friends and felt that other pupils picked on her. She was depressed and indicated that no-one listened to her, not even her parents. The local authority had applied Programme funding to set up a Behaviour and Education Support Team, including representatives from Connexions and the local Youth Offending Team - an approach adopted by almost all of the participating local authorities. The team provided Claudia with one-to-one counselling and persuaded her to participate in group discussions on self-awareness. She needs ongoing support, but her confidence has increased and she now attends school more regularly.
Source: National Audit Office visits to schools; Evaluation of the Devolution of the EWS to Schools (NFER); Behaviour and Improvement Programme – Interim Report (University of London)

IMPROVING SCHOOL ATTENDANCE IN ENGLAND
part three
33
3.8 The Department and the Prime Minister’s Delivery Unit undertook a joint initial evaluation of the impact of the Key Stage 3 consultants in two out of the 150 local authorities. They found that local authorities were giving a higher priority to attendance and that there was more widespread use of good practice in secondary schools. The evaluation found that the overall levels of attendance in schools in both local authorities had increased by at least one percentage point in a year.
3.9 Our surveys of education welfare services and head teachers found that more respondents feel that the behaviour and attendance element of the Key Stage 3 Strategy has been effective than considered that it has been ineffective (Figure 21).
3.10 The Department recruited eight senior officials from local authorities to act as attendance advisers from February 2003 to April 2004. Sixty local authorities, all with high unauthorised absence rates, received advice on attendance policies and the implementation of new systems. The Department invited participating local authorities to carry out a self-assessment of their own performance before receiving assistance. One year later, the advisers assessed the local authorities. In their opinion, more local authorities were performing well than one year earlier (40 per cent compared with 15 per cent) and fewer authorities were showing weak performance (11 per cent compared with 38 per cent). However, there has not been an independent evaluation of the impact of attendance advisers.
21 NAO surveys of education welfare services and head teachers
How effective has the Key Stage 3 behaviour and attendance strand been in tackling truancy and improving attendance at your local authority/school?
Effective Ineffective
Education welfare 16 7services (38 per cent) (17 per cent)
Head teachers of 50 12secondary schools (25 per cent) (6 per cent)
20 NAO surveys of education welfare services and head teachers
How effective has the Behaviour Improvement Programme been in tackling truancy and improving attendance at your local authority/school? (For those who had experience of the Programme).
Effective Ineffective
Education welfare 21 2services (55 per cent) (5 per cent)
Head teachers of 106 6primary schools (61 per cent) (3 per cent)
Head teachers of 120 12secondary schools (56 per cent) (6 per cent)
(As with other survey results) percentages do not sum to 100 because some respondents answered that the Programme was “neither effective nor ineffective”.
NOTE
We also asked education welfare services whether the Behaviour Improvement Programme was cost-effective. 41 per cent considered that it was cost-effective and 12 per cent considered it was not.
There were overall improvements in primary and secondary schools’ rates of absence after the first year of the Behaviour Improvement Programme.
Absence rates in schools involved in the first year of the Behaviour Improvement Programme
19
Unauthorised absence
Primary schools (Phase 1) Secondary schools (Phase 1)
Total absence rate (percentage of half days missed)
Authorised absence
At start(2001-02)
After two years(2003-04)
At start(2001-02)
After two years(2003-04)
Source: National Audit Office analysis of Department’s data
NOTE
Changes in performance cannot be attributed solely to the Programme because other factors may have had an impact on absence rates.
12
10
8
6
4
2
0

IMPROVING SCHOOL ATTENDANCE IN ENGLAND
part three
34
3.11 Most participants of our focus groups of principal education welfare officers were critical of either the consultants or the advisers. They considered that some consultants were inexperienced and advisers were often unaware of local circumstances, so their advice was not valued or needed. Some believed that these initiatives were insulting to them as professionals and a waste of money. The reasons for these strong views are uncertain. Some officers may be unhappy that consultants and advisers give direct advice to schools that might be inconsistent with their own policies and practices. The Department needs to persuade all parts of local authorities to “buy in” to this arrangement so that consultants and advisers can apply their skills to assist in ways that are helpful.
Electronic registration systems are providing practical support to help improve attendance3.12 Schools must take a register of pupils at least twice a day. Traditionally, schools recorded attendance on paper but an increasing number are using computerised systems.
3.13 Secondary schools with rates of unauthorised absence of more than one percentage point above the national average were entitled to bid for a share of £11.25 million available from 2002-03 to 2003-04. The Department has directly assisted 530 schools with high rates of unauthorised absence by providing funding to enable them to install electronic registration systems. Another 11 schools have received funding but not yet installed their systems – installation of systems will be checked during 2005. Effective implementation of electronic registration systems allows schools to collate absence information and to identify the appropriate action to take (Box 3). The cost averages £21,000 per school or around £21 per pupil on the school roll.
3.14 The Department has commissioned the University of Warwick to evaluate this modernisation project. In the first part of the evaluation, the researchers visited 20 schools in the early stages of implementation. They found that schools were generally optimistic about the likely benefits that the new systems would help them to achieve. In particular, they felt that the systems would be a good tool in data gathering and monitoring, locating pupils, helping reduce post-registration truancy and providing evidence for prosecutions. However, it was too early for most schools to comment on the effectiveness of the new systems.
3.15 According to our survey of head teachers, around 60 per cent of secondary schools and 40 per cent of primary schools use a type of electronic system, which leaves approximately 1,400 secondary schools and 10,700 primary schools using manual systems. Some schools have had difficulties with electronic systems, particularly with data input errors which were due to optical mark recognition equipment not working properly or staff being unfamiliar with the software and making mistakes. However, the great majority of head teachers responding to our survey considered that the systems were effective (Figure 22). Members of our focus groups of principal education welfare officers were also positive about electronic registration, finding it helpful to have access to up-to-date electronic records in local authorities. There is clearly scope for extending electronic registration more widely, particularly to secondary schools because they need to track the attendance of large numbers of pupils and tend to have higher rates of absence than primary schools.
BOX 3
Use of electronic registration – Abbey Wood School,London Borough of Greenwich
Electronic registration involves either teachers using IT in classrooms to record attendance or “optical mark reading” equipment converting paper registers into electronic data. The software produces reports and analysis of attendance records.
Abbey Wood School has a system that allows teachers to record the register each lesson using a personal digital assistant, which then transmits the results by radio waves to a central personal computer. The personal computer generates a daily contact list of parents of pupils absent that day. The school’s administrative staff telephone the parent and record the response on the computer system. Where telephone calls are not answered, the system generates letters to parents. The system is also useful for quickly identifying “post-registration truancy” that occurs when pupils register at the beginning of the session but then miss individual lessons. The school uses weekly and monthly reports to identify patterns of absence.
22 NAO surveys of head teachers
How effective have electronic registration systems been in tackling truancy and improving attendance at your school? (For those schools that had experience of the systems).
Effective Ineffective
Head teachers of 97 0 primary schools (64 per cent) (0 per cent)
Head teachers of 162 7secondary schools (80 per cent) (4 per cent)

IMPROVING SCHOOL ATTENDANCE IN ENGLAND
part three
35
Truancy sweeps have helped to tackle unauthorised absence but views on their long-term effectiveness are mixed3.16 Truancy sweeps are patrols of public areas, such as shopping centres, during school hours by small teams typically comprising education welfare officers and police officers and sometimes involving school staff, Connexions and youth offending teams. The Department supports truancy sweeps because they can:
� identify pupils who need support and get them back to school;
� discourage pupils from skipping school and parentally condoned truancy;
� raise the profile of school attendance in the community; and
� provide an opportunity to draw various agencies together to tackle absence.
3.17 The Department has co-ordinated five national truancy sweeps since 2002. The first four sweeps identified 28,200 children who had no valid reason for being out of school.24 Box 4 sets out some of the details of the fourth national truancy sweep.
3.18 The Department assists local authorities by publishing guidance on how to plan, operate and follow up sweeps. A 2003 evaluation of the national sweeps commissioned by the Department found that most interviewees25 felt the sweeps were successful because of the numbers of pupils picked up and the raised awareness generated. However, they were less certain of the long-term impact on individual pupil attendance.
3.19 Many principal education welfare officers who attended our focus groups had negative views on truancy sweeps, considering that they are done too often and are not cost-effective. The Department does not require local authorities to carry out sweeps, but some members of our focus groups considered that they were “instructed” to do so even though local authorities might not feel the timing was right. Nevertheless, our survey of education welfare services found that 29 (51 per cent) considered that sweeps are effective and only 9 (16 per cent) considered them ineffective, though 27 (48 per cent) considered they are not cost-effective. Primary and secondary school head teachers expressed similar views.
3.20 The statistics on national sweeps reflect the mixed views on their effectiveness, with local authority participation declining slightly since 2002, fewer pupils stopped, and fewer pupils found to have no valid reason for missing school. The Department acknowledges that many persistent truants are unlikely to be found in the sort of public areas covered by sweeps, and are more likely to be at home or at the home of a friend. However, sweeps do attract publicity and may deter pupils from truanting and parents from condoning absence without good reason.
Sanctions against parents of pupils who truant can be useful as one element of a range of actions to improve attendance3.21 Since the Education Act 1944, parents of children of compulsory school age (and school-registered) are responsible for ensuring that their children attend school regularly and local authorities have been able to prosecute parents who failed to do so. The offence was restated in the Education Act 1996. A more serious offence, introduced in 2001, is committed if the parent knows of their child’s non-attendance and fails to act.
BOX 4
National truancy sweep, March 2004
The Department co-ordinated the national exercise to take place throughout the month. Participation among local authorities was high with 128 (85 per cent) out of 150 authorities carrying out 1,030 sweeps. The teams stopped 11,365 children and found that 5,088 (45 per cent) had no valid reason for not being at school. Of the cases with no valid reason, 1,715 truanting pupils (34 per cent) were with adults.
“Truancy sweeps seem to be a PR exercise…and they are very expensive for such a small result.”
Principal education welfare officer
24 Data on the fifth sweep was not available in time for publication. 25 Interviewees were education welfare officers, school representatives, pupils, police and representatives from other agencies.

IMPROVING SCHOOL ATTENDANCE IN ENGLAND
part three
36
3.22 Local authorities have several compulsory measures they can use when parents do not co-operate in getting their children to attend school regularly.
� Education Supervision Order – under the Children Act 1989, a local authority can apply for an Education Supervision Order to make itself responsible for supervising the child and parents to ensure that the child is properly educated. Where a parent refuses to comply, the local authority can prosecute them for an offence under the Children Act; where a child refuses to comply, the authority can start proceedings to take the child into care.
� Penalty notice – under the Anti-social Behaviour Act 2003, local authorities, head teachers and the police can issue penalty notices of £50 (rising to £100 if unpaid within 28 days) to parents for their child’s unauthorised absence from school. The Department intends that the notices be used early as a deterrent to patterns of unauthorised absence developing.
� Prosecution – local authorities have discretion to prosecute parents, and normally only do so after extensive efforts to resolve the situation and if they consider that prosecution may bring about an improvement. Convicted parents may be fined (up to £1,000 or £2,500 depending on the type of
offence), given a community sentence (such as a parenting order that requires the parent to attend counselling sessions) or a custodial sentence of up to three months if convicted of the aggravated offence introduced in 2001 (paragraph 3.21).
3.23 Figure 23 summarises the paths that local authorities can take in dealing with parents of irregular attenders.
3.24 Most local authorities now use prosecution as a sanction against parents whose children’s absences from school are unauthorised. The Department estimates that local authorities prosecute around 7,500 parents each year, but does not have precise numbers. The NFER reported that 93 out of nearly 100 local authorities that it surveyed had prosecuted 5,381 parents between September 2001 and July 2002.26 The NFER reports showed that 80 per cent of prosecutions resulted in a conviction, and a fine (typically from £50 to £100) was the most common outcome. Seventy per cent of education welfare officers considered that prosecution could be effective, but over half of the prosecuted parents interviewed felt that prosecution did not work. The education welfare officers acknowledged that prosecution could damage their relations with parents and cause financial difficulties. Box 5 shows that parents and pupils had mixed views on prosecution.
26 School attendance and the prosecution of parents: effects and effectiveness (February 2004) and School attendance and the Prosecution of Parents: perspectives from education welfare service management (July 2003), NFER.
23 Sanctions available to local authorities
Parents whose children do not attend school may face sanctions culminating in prosecution if the child’s attendance does not improve.
Problem with unauthorised
absencearises
Problem tackled by school
Problem tackled by local authority1
Prosecution of parents
Education Supervision Order
applied for
Penalty notice issued
Source: National Audit Office
NOTE
1 Local authorities have a range of actions they can take to work with parents. One way is to use parenting contracts, which are formal agreements between the authority and parents, in which each sets out the steps they will take to secure an improvement in the pupil’s attendance. There are no direct sanctions for a parent’s failure to comply, but failure could be presented as evidence in a prosecution at a later time.
Continuing problem with unauthorised absence

IMPROVING SCHOOL ATTENDANCE IN ENGLAND
part three
37
3.25 Our survey of education welfare services showed that the majority consider that prosecution has been effective (Figure 24), but there is concern about the cost of the process. More head teachers responding to our survey consider that prosecution is effective than think it ineffective. Other statistical research covering 43 local authorities found no significant relationship between the numbers of prosecutions and changes in absence rates, so the impact of prosecution on absence is uncertain.27
3.26 The Department has tried to underpin the efficiency of the prosecution process with published guidance on effective prosecution processes and by facilitating seminars between the Magistracy and local authorities. The Department, in January 2003, also introduced a fast-track process for managing non-attendance cases to help promote early intervention by schools and local authorities. The process includes speedy access to the courts where the authorities deem prosecution appropriate. Parents of persistent truants are given around 12 weeks to ensure that their children attend school regularly, or else to face the risk of prosecution. Local authorities have generally adopted the process, making some changes to suit local circumstances (for example, extending the period allowed to parents).
3.27 On behalf of the Department, NFER evaluated the fast-track process.28 It concluded that the process had a positive impact in improving procedures, attitudes to attendance and attendance levels. For schools, the process provided a transparent and structured system. For pupils and parents, it heightened awareness of absence issues. For a sample of cases, the evaluation measured the absence rates of pupils subject to the fast-track process (Figure 25 overleaf). The evaluation found that pupils’ absence rates declined during the process, but rose again afterwards. In the period 19 to 24 weeks after the start of the process, authorised absence rates were the same as they had been before the process, but unauthorised absence was still 4.4 percentage points (14 per cent) lower than it had been prior to entry on to the fast-track. The evaluation measured absence rates only up until 24 weeks after entry on to the fast-track. It reported that the fast-track process was likely to be more effective for cases where non-attendance was not at crisis point, and that additional and alternative strategies may be needed to deal with the more entrenched cases of non-attendance.
BOX 5
Parents’ and pupils’ views on prosecution
Parents and pupils were asked whether they felt it was right that parents should be prosecuted for their children’s non-attendance at school.
Parents Pupils
Yes, parents should be prosecuted 3 2
Yes, but only in certain cases 12 -
No, they should not be prosecuted 8 4
No comment - 2
23 8
Persistently absent pupil
“I should be the one standing up in the courtroom, not my mum. I’m the one that’s doing it, it’s my choice, it’s my decision. I’m 15 years old, you can’t exactly drag me to school….The law is stupid in that department. I should get community service or something…just anything that’s not mum getting punished for it.”
Parent of a persistently absent pupil
“People who know their kids are nicking off school and don’t give a damn – they should be the ones that go [to court].”
Source: NFER, 2004
27 Time to Change the Truancy Laws? Compulsory Education: Its Origin and Modern Dilemma, Ming Zhang, 2004.28 Evaluation of Fast-track to Prosecution for School Non-Attendance, K. Halsey, N. Bedford, M. Atkinson, R. White, K. Kinder (NFER), 2004.
(www.dfes.gov.uk/research/data/uploadfiles/RR567.pdf)
24 NAO surveys of education welfare services and head teachers
How effective has prosecution been in tackling truancy and improving attendance at your local authority/school? (Percentages based on those respondents who expressed an opinion).
Effective Ineffective
Education welfare 43 4services (78 per cent) (7 per cent)
Head teachers of 49 25primary schools (39 per cent) (20 per cent)
Head teachers of 121 56secondary schools (52 per cent) (24 per cent)
NOTE
We also asked education welfare services whether prosecutions were cost-effective. 49 per cent considered that they were cost-effective and 34 per cent considered they were not.

IMPROVING SCHOOL ATTENDANCE IN ENGLAND
part three
38
3.28 In our school survey, 43 per cent of head teachers of primary schools and secondary schools responded that they consider the fast-track process has been effective.
3.29 Other sanctions such as parenting orders and penalty notices are relatively new and there has not been any formal evaluation of their effectiveness. However, where they were able to respond to our survey question, head teachers are generally positive about the effectiveness of penalty notices (Figure 26). Many schools we visited referred to the general deterrent effect of sanctions.
Other wider initiatives can contribute to improving attendance3.30 The Department runs initiatives that aim to improve school leadership, teaching standards, curricula, and accommodation, which can also influence attendance.
� Key Stage 3 Strategy – aims to improve teaching and learning for all 11 to 14-year old pupils. It supports the main curricula subjects as well as providing a more varied curriculum. As discussed in paragraph 3.7, the strategy includes the behaviour and attendance consultants.
� Excellence in Cities – provides additional resources to schools in deprived urban areas in 57 local authorities. Another 34 local authorities receive more limited funding. The programme focuses on improving teaching and learning, behaviour and leadership in schools. Some Excellence in Cities schools also receive funding from the Behaviour Improvement Programme. Our analysis of absence showed that Excellence in Cities schools were closely associated with reductions in absence between 2000-01 and 2002-03.
26 NAO survey of head teachers
By 7 to12 weeks after entry to fast-track, total absence rates were 10 percentage points lower than before entry to fast-track. By 19 to 24 weeks, absence rates had risen but were still 4 percentage points lower than before pupils’ entry to fast-track.
Source: National Audit Office analysis of data from the Department’s Evaluation of fast-track to prosecution for school non-attendance (by NFER)
0
5
10
15
20
25
30
35
40
45
50
Before entry tofast-track
Weeks 1-6 Weeks 7-12 Weeks 13-18 Weeks 19-24
Pre-fast-track During fast-track Post-fast-track
Unauthorised absence
Authorised absence
Absence rate (per cent)
Absence rates of pupils involved in the fast-track process25
How effective have penalty notices been in tackling truancy and improving attendance at your school? (Percentages based on those respondents who expressed an opinion).
Effective Ineffective
Head teachers of 37 18primary schools (34 per cent) (16 per cent)
Head teachers of 73 41secondary schools (42 per cent) (24 per cent)

IMPROVING SCHOOL ATTENDANCE IN ENGLAND
part three
39
� The Leadership Incentive Grant – aims to improve standards, promote collaborative working between schools and strengthen leadership in schools in Excellence in Cities areas and other schools facing challenging circumstances.
� School diversity – aims to enable schools to differentiate themselves according to their ethos, character or areas of special expertise. It includes academies, which are new or refurbished schools that receive financial and other support from private sponsors, and federations, in which schools formally group together to raise standards, leadership, teaching and learning. The programme also funds Beacon schools29 that have areas of recognised expertise, including nine schools that can be consulted on tackling absence.
� Primary pilots – in 2003-04, the Department selected 25 local authorities facing deprivation problems, but not eligible for its other funded programmes. The project provides additional support for primary school pupils, such as teaching of social skills, in order to help them to understand their emotions and improve their behaviour.
3.31 Some schools and local authorities in deprived areas have had access to regeneration funding from the Office of the Deputy Prime Minister’s Single Regeneration Budget. This regeneration programme’s objectives include improving employment prospects, education and skills of local people, and it has provided resources that tackle, directly or indirectly, poor attendance at school.
Evaluations of programmes need to be timely and based on relevant data3.32 The Department has carried out evaluations of most of its initiatives to tackle absence, the findings of which are useful to policy makers, local authorities and schools. For example, it has evaluated the impact of its biggest programme, the Behaviour Improvement Programme. It is too early to evaluate some other initiatives, such as parenting contracts and penalty notices, but the Department should do so as soon as practicable.
3.33 The Department has commissioned research into the attitudes of parents of pupils who are persistently absent from school, including their attitudes towards truancy and education, obstacles to meeting their responsibilities and whether they feel supported in getting their children to school. Where relevant, it could also include, in its evaluations of wider initiatives, assessments of levels of pupil absence and parental attitudes towards the value of education and their children’s attendance at school.
3.34 The evaluations would be more effective if there was better quality information on absence and the contextual factors. Although schools collate data at pupil-level, only school-level data is available nationally. This means, for example, that while we know that absence among secondary school pupils is higher than absence at primary level, we do not know to what extent the rising trend with age starts in or before year 6 (the final year of primary school). In order to permit this kind of analysis at national level, the Department intends to include pupil-level attendance data in the Pupil Level Annual School Census by January 2006 for secondary schools and by January 2007 for primary schools.
29 The Beacon schools programme will be phased out by August 2005. Collaboration will continue to be encouraged under the Leading Edge Partnership programme.

part four
PART FOURWhat schools can do to make a difference
40 IMPROVING SCHOOL ATTENDANCE IN ENGLAND

IMPROVING SCHOOL ATTENDANCE IN ENGLAND
part four
41
4.1 This Part of the report examines the scope for improving attendance by:
� increasing the effectiveness of schools’ management of attendance;
� improving the support given to schools; and
� gaining the support of parents and carers.
Schools can make a difference by managing attendance well4.2 In Part 2 we showed that while pupils’ absence rates are associated with factors external to the school, these factors do not fully explain variations in absence rates between schools. Schools can make a difference - many management and teaching practices potentially influence attendance. How schools tackle absence issues will, to some extent, depend upon local circumstances, including the nature of the absence, the social and ethnic make up of the school and other external factors such as socio-economic deprivation.
4.3 More than half of the head teachers of the schools we visited thought that they could reduce their schools’ absence rates (Figure 27). Even four out of the ten heads whose schools were doing better than average (after adjusting for their context) considered that they could do better still.
4.4 We identified a number of generic practices that worked well in schools (Figure 28), and that we explore in the following paragraphs.
Attendance policies
4.5 School attendance policies are important in prioritising, focusing attention and providing guidance on attendance matters within a school. The Department’s guidance to schools states that head teachers should ensure that a clear policy on attendance is in place. About 80 per cent of primary schools and 90 per cent of secondary schools have a documented attendance policy (Figure 29). Some schools without a documented policy believe that a policy is unnecessary given their good attendance record. However, without a clear policy there are risks that teachers and parents will not give attendance the priority that it requires. The school may find it more difficult to take a tough line on absence where necessary and teachers may be inconsistent in handling individual cases of absence.
27 Schools’ impressions of whether they can improve
More than half of the schools that we visited thought that they could make further reductions to their absence rates.
Do you consider that there is scope for your school to reduce absence further?
Number of schools Yes No/Not sure
Schools that are better than average 4 6(after adjusting for their context)
Schools that are worse than average 4 1(after adjusting for their context)
Source: National Audit Office visits to schools
NOTES
1 Head teachers were not aware of our analysis that adjusted performance for their context.
2 The under-performing school without scope for further improvement felt it had already implemented sufficient measures, but thought that these measures had not yet been in place long enough to have had an impact.
28 Effective practice in attendance management in schools
Effective practice
� Clear policy on attendance, communicated to all parties and implemented consistently
� Sufficiently high profile and resourcing for attendance
� Regular monitoring of reliable attendance information
� “First day calling” of parents of absent pupils
� Electronic register taken at each lesson
� Reward schemes for good or improved attendance
� Alternative curricula (in particular, more vocational education)
� Informal sanctions against pupils where appropriate
� Threat and use of legal sanctions against parents where appropriate
� Collaboration with other schools
� Effective working with the local authority’s education welfare service and other agencies
Source: National Audit Office

IMPROVING SCHOOL ATTENDANCE IN ENGLAND
part four
42
Profile and resourcing of attendance
4.6 Head teachers are free to decide what priority to give to tackling absence and what resources to apply. Head teachers of schools that performed well on attendance told us that it is most important to maintain a high profile for attendance and provide sufficient resources, for example to install an electronic registration system or to analyse and follow up the results. On the other hand, principal education welfare officers told us that some schools see attendance as an issue that they do not need to deal with, but as something that the local authority will sort out for them.
Monitoring attendance
4.7 Absence data allows schools and local authorities to monitor patterns and deal effectively with individual pupils (Box 6).
4.8 As we highlighted in Part 2 of our report, there are some problems with the quality and completeness of the data. The Department provides guidance to schools on how to categorise absence as authorised or unauthorised, but some schools are still uncertain how to categorise some absence and consider that their staff are not always consistent in recording data, particularly where teachers are new or temporary. We found from our focus groups that principal education welfare officers are particularly critical of the Department’s authorised-unauthorised split. Some think that it should use a different scheme of categorisation (for example, to distinguish parentally condoned absence from truancy), while others consider that there should be no split because all absence matters. The potential for prosecution of parents is undermined where absence is recorded as authorised when a school should not have authorised that absence.30
4.9 It is, however, important that schools do not allow uncertainties in the data to distract them from the task of monitoring attendance. As noted in paragraph 2.3, the Department’s focus is now on total absence, so the authorised-unauthorised split is less important than the underlying causes for the whole of the total absence figure. It is these causes that schools need, as far as possible, to identify accurately and analyse in order to assess whether and how attendance can be improved. We found that schools’ practices in using data varied widely – from schools that tended to focus mainly on school-level figures, to those that undertook more detailed analyses to try to identify the underlying reasons for absence and the groups and individual pupils who were most affected.
“First day calling” of parents of pupils absent from school
4.10 First day calling is the practice of telephoning parents on the first day that a pupil is absent from school without prior authorisation. Head teachers of secondary schools told us they find it the most effective measure for tackling absence from school, but a number of schools have not adopted it because of the resources required. One school that we visited has invested £6,000 in an automated telephone calling system, which reduces time spent calling parents of absent children (Box 7).
Source: National Audit Office survey of head teachers
Primary schools
Secondary schools
Percentage of schools0 10 20 30 40 50 60 70 80 90 100
A minority of schools do not have a clear, documented attendance policy
29
Documented policy
Undocumented policy
No attendance policy
The figures [authorised and unauthorised absence] are false, the figures are unreliable….They can be manipulated.
Principal education welfare officer
30 Local authorities can prosecute parents for unauthorised absence only.
BOX 6
Abbey Wood School, London Borough of Greenwich
In 2001-02, Abbey Wood was the secondary school with the highest rate of absence in its Borough. Since then it has used additional funding from the Behaviour Improvement Programme to tackle absence, becoming the school in the Borough with the most improved attendance in 2003-04. It places particular emphasis on home-school liaison, monitoring and following up attendance data. Registers are taken at each lesson, and weekly reports are sent to teachers and heads of year. There are monthly meetings to discuss performance on attendance, and an education welfare officer often attends. The school is, in particular, aiming to increase attendance by pupils who currently attend between 75 per cent and 89 per cent – these pupils have a disproportionate effect on the overall absence rate.

IMPROVING SCHOOL ATTENDANCE IN ENGLAND
part four
43
Electronic registration
4.11 Well-used and effective electronic registration systems help schools to record and monitor attendance and provide information to follow up individual cases. These systems can also make it easier for schools to take registers at each lesson, in order to deter or identify post-registration truancy. The systems are most useful in secondary schools or primary schools with relatively high rates of absence. From our survey of head teachers, around 60 per cent of secondary schools and 40 per cent of primary schools use an electronic system. Most head teachers consider that their electronic system is effective, but in a minority of cases the system has not been successful and has been removed – difficulties with these systems are explained in paragraph 3.15.
Reward schemes
4.12 Reward schemes aim to provide recognition and incentives for pupils to improve their attendance. The schemes take many forms, rewarding both high attending pupils and those whose attendance has improved. They are widely used in schools, particularly at secondary level where head teachers consider that they are one of the most effective measures to improve attendance (Box 8).
Alternative curricula
4.13 Some pupils, particularly at secondary schools, find academic subjects unattractive. Those who struggle at school may not expect even to be entered for any GCSE examinations, and can feel that there is no point going to school. Almost all education welfare services believe that there is a link between the curriculum and attendance. Principal education welfare officers consider that the academic focus of the National Curriculum discourages some pupils from attending school and some consider it to be the biggest barrier to raising attendance. A varied, alternative and relevant curriculum, in which pupils can learn skills that they will need at work, can raise pupils’ interest, making them more likely to want to attend school (Box 9). Some schools have access to additional funding from the Department that they can use to establish alternative curricula.31 Following the Tomlinson Report of October 2004, which found that schools and colleges need to improve the quality and status of vocational programmes and find a clear role for employers, we would expect more schools to offer alternative curricula.
BOX 7
Newquay Tretherras School, Cornwall
At this secondary school, electronic registers are linked to the school’s IT system. An attendance officer starts the automated parent call system, which identifies pupils absent and telephones, sends a text message or e-mails the parents according to their preference. The automated message asks the parent to contact the school by telephone, text message or e-mail to explain their child’s absence. The attendance officer checks messages received from parents and notes their explanations on the registers or follows up if there has been no response. As this is a large school, the system saves a great deal of time and makes it possible to check all cases of absence.
BOX 8
Acland Burghley School, London Borough of Camden
At this secondary school, there is a weekly lottery for a five pounds cash prize. At assembly, a tutor group is first drawn at random from a bag, and then a pupil number is drawn from another bag. If that pupil has a 100% attendance record for the fortnight, they win the prize, but if not then the prize rolls over to the next week. The Assistant Head Teacher told us that many pupils enjoy the event and that it helps to increase their motivation to come to school.
31 Including the Leadership Incentive Grant, Excellence in Cities, Behaviour Improvement Programme, The 14-19 Agenda, Enterprise Education Entitlement (from 2005-06).
BOX 9
Bedford College, Bedfordshire
Bedford College is a further education college that has introduced vocational programmes for 14 to 16-year old “non-academic” pupils of five local secondary schools. Training is available in a range of fields including catering, vehicle maintenance, hairdressing and construction. The schools retain the registration of the pupils and still receive local authority payments for them, but reimburse the College for the costs of the course. At the College, pupils are given a mixture of vocational training and unpaid work experience with local employers. Some still go to their school to study English and mathematics. Most pupils and their parents like these arrangements and head teachers report that attendancehas improved.
The biggest barrier to raising attendance within schools [is] the curriculum….For some of these kids there is nothing in that school that would invite them through the door, and we’re not talking one or two kids here, we’re talking huge numbers.
Principal education welfare officer

IMPROVING SCHOOL ATTENDANCE IN ENGLAND
part four
44
Threat and use of sanctions
4.14 Schools need to be flexible in how they tackle cases of persistent absence and, in many circumstances, the most effective approach will be to offer pupils and families support and to apply only informal sanctions against pupils, such as detention or restriction of privileges. However, there are times when legal sanctions, or threat of legal sanctions, are needed to secure the co-operation of persistently absent pupils or their parents. Schools need to strike a balance – a school that relies on legal sanctions sparingly and effectively is more likely to achieve relatively high levels of attendance, whereas a school that is too ready to enforce sanctions may damage its relations with parents, and one that resists using sanctions risks becoming thought of as a “soft touch”.
Collaboration with other schools
4.15 Some head teachers are keen to know how well their schools’ performance on attendance compares with similar schools, but they do not have the information they require. While some local authorities disseminate tables of schools’ performance, many do not do so and it is difficult for a local authority to make soundly based adjustments for schools’ contexts because it requires statistical expertise. The Department has the resources to carry out and disseminate analysis of absence rates, enabling schools to assess their performance and, where appropriate, identify other local schools that could provide advice. Some schools feel, however, that there is competition between schools within their local authority that can inhibit some successful schools collaborating with others.
There is scope for developing the support available to help schools achieve improvements4.16 The Department publishes guidance for schools, including on its behaviour and attendance website which holds material on legislation, sanctions, electronic registration and best practice.32 Local authorities also produce guidance. However, about 57 per cent of secondary school heads and 39 per cent of primary heads would welcome further guidance (Figure 30). Some are unaware of where existing material is available. The topics on which they feel they most need further guidance are:
� term-time holidays – some head teachers are uncertain about the circumstances in which to approve this type of absence;
� dealing with difficult parental attitudes – an issue that schools find particularly problematic;
� examples of good practice – many head teachers feel that they do not know enough about what practices work and which schools use them; and
� sanctions – primary school head teachers in particular are uncertain about how and when to refer parents to local authorities for sanctions.
30 NAO survey of head teachers
Would you welcome further guidance on how to tackle truancy and improve attendance? Yes No
Head teachers of 161 224 primary schools (39 per cent) (54 per cent)
Head teachers of 183 121 secondary schools (57 per cent) (38 per cent)
32 www.dfes.gov.uk/schoolattendance.
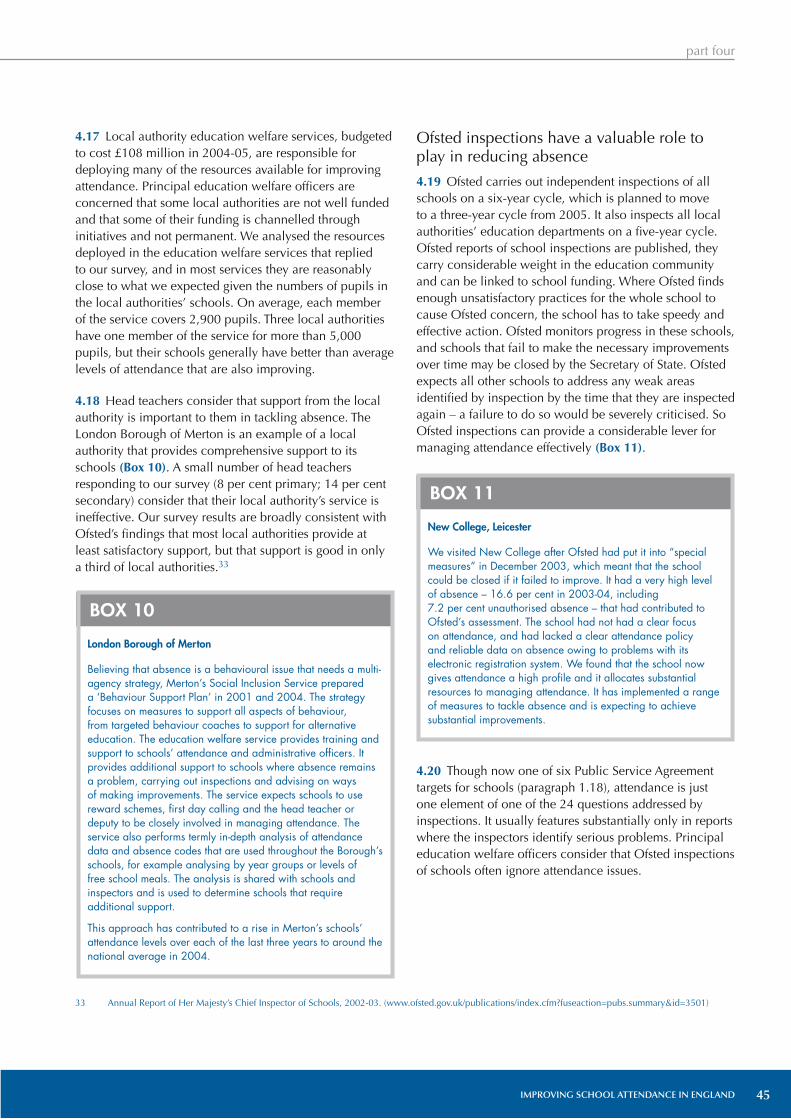
IMPROVING SCHOOL ATTENDANCE IN ENGLAND
part four
45
4.17 Local authority education welfare services, budgeted to cost £108 million in 2004-05, are responsible for deploying many of the resources available for improving attendance. Principal education welfare officers are concerned that some local authorities are not well funded and that some of their funding is channelled through initiatives and not permanent. We analysed the resources deployed in the education welfare services that replied to our survey, and in most services they are reasonably close to what we expected given the numbers of pupils in the local authorities’ schools. On average, each member of the service covers 2,900 pupils. Three local authorities have one member of the service for more than 5,000 pupils, but their schools generally have better than average levels of attendance that are also improving.
4.18 Head teachers consider that support from the local authority is important to them in tackling absence. The London Borough of Merton is an example of a local authority that provides comprehensive support to its schools (Box 10). A small number of head teachers responding to our survey (8 per cent primary; 14 per cent secondary) consider that their local authority’s service is ineffective. Our survey results are broadly consistent with Ofsted’s findings that most local authorities provide at least satisfactory support, but that support is good in only a third of local authorities.33
Ofsted inspections have a valuable role to play in reducing absence
4.19 Ofsted carries out independent inspections of all schools on a six-year cycle, which is planned to move to a three-year cycle from 2005. It also inspects all local authorities’ education departments on a five-year cycle. Ofsted reports of school inspections are published, they carry considerable weight in the education community and can be linked to school funding. Where Ofsted finds enough unsatisfactory practices for the whole school to cause Ofsted concern, the school has to take speedy and effective action. Ofsted monitors progress in these schools, and schools that fail to make the necessary improvements over time may be closed by the Secretary of State. Ofsted expects all other schools to address any weak areas identified by inspection by the time that they are inspected again – a failure to do so would be severely criticised. So Ofsted inspections can provide a considerable lever for managing attendance effectively (Box 11).
4.20 Though now one of six Public Service Agreement targets for schools (paragraph 1.18), attendance is just one element of one of the 24 questions addressed by inspections. It usually features substantially only in reports where the inspectors identify serious problems. Principal education welfare officers consider that Ofsted inspections of schools often ignore attendance issues.
33 Annual Report of Her Majesty’s Chief Inspector of Schools, 2002-03. (www.ofsted.gov.uk/publications/index.cfm?fuseaction=pubs.summary&id=3501)
BOX 10
London Borough of Merton
Believing that absence is a behavioural issue that needs a multi-agency strategy, Merton’s Social Inclusion Service prepared a ‘Behaviour Support Plan’ in 2001 and 2004. The strategy focuses on measures to support all aspects of behaviour, from targeted behaviour coaches to support for alternative education. The education welfare service provides training and support to schools’ attendance and administrative officers. It provides additional support to schools where absence remains a problem, carrying out inspections and advising on ways of making improvements. The service expects schools to use reward schemes, first day calling and the head teacher or deputy to be closely involved in managing attendance. The service also performs termly in-depth analysis of attendance data and absence codes that are used throughout the Borough’s schools, for example analysing by year groups or levels of free school meals. The analysis is shared with schools and inspectors and is used to determine schools that require additional support.
This approach has contributed to a rise in Merton’s schools’ attendance levels over each of the last three years to around the national average in 2004.
BOX 11
New College, Leicester
We visited New College after Ofsted had put it into “special measures” in December 2003, which meant that the school could be closed if it failed to improve. It had a very high level of absence – 16.6 per cent in 2003-04, including 7.2 per cent unauthorised absence – that had contributed to Ofsted’s assessment. The school had not had a clear focus on attendance, and had lacked a clear attendance policy and reliable data on absence owing to problems with its electronic registration system. We found that the school now gives attendance a high profile and it allocates substantial resources to managing attendance. It has implemented a range of measures to tackle absence and is expecting to achieve substantial improvements.
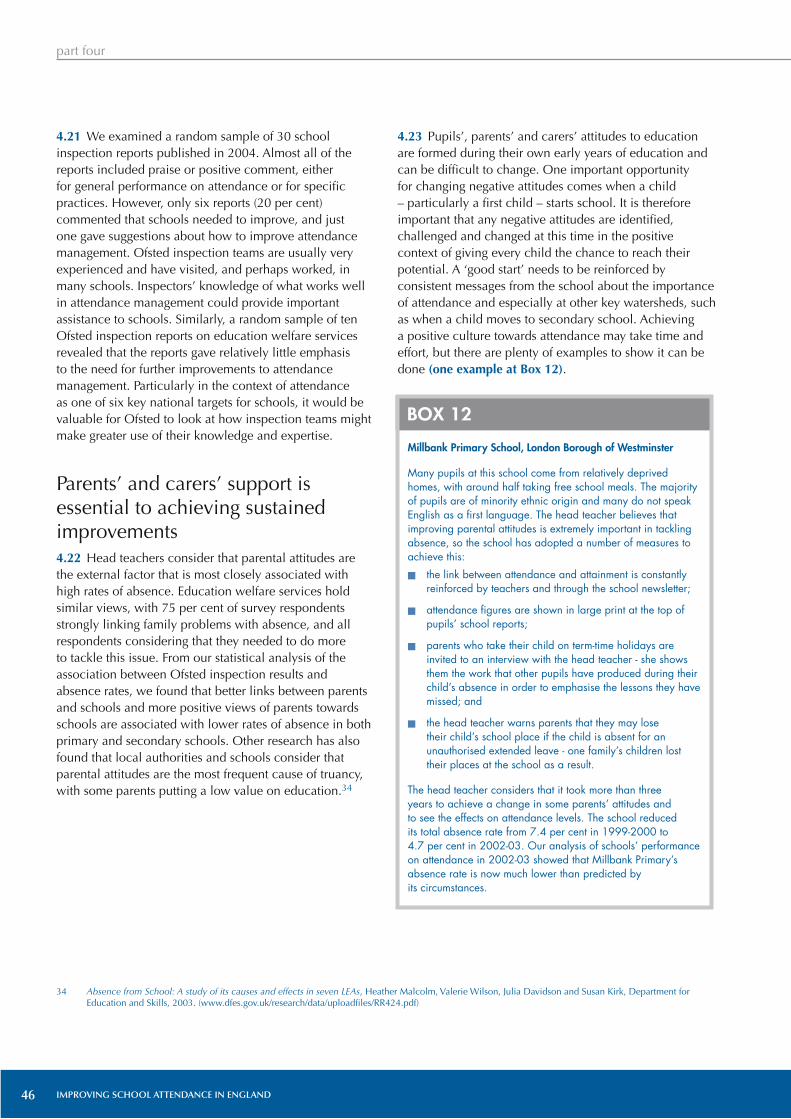
IMPROVING SCHOOL ATTENDANCE IN ENGLAND
part four
46
4.21 We examined a random sample of 30 school inspection reports published in 2004. Almost all of the reports included praise or positive comment, either for general performance on attendance or for specific practices. However, only six reports (20 per cent) commented that schools needed to improve, and just one gave suggestions about how to improve attendance management. Ofsted inspection teams are usually very experienced and have visited, and perhaps worked, in many schools. Inspectors’ knowledge of what works well in attendance management could provide important assistance to schools. Similarly, a random sample of ten Ofsted inspection reports on education welfare services revealed that the reports gave relatively little emphasis to the need for further improvements to attendance management. Particularly in the context of attendance as one of six key national targets for schools, it would be valuable for Ofsted to look at how inspection teams might make greater use of their knowledge and expertise.
Parents’ and carers’ support is essential to achieving sustained improvements4.22 Head teachers consider that parental attitudes are the external factor that is most closely associated with high rates of absence. Education welfare services hold similar views, with 75 per cent of survey respondents strongly linking family problems with absence, and all respondents considering that they needed to do more to tackle this issue. From our statistical analysis of the association between Ofsted inspection results and absence rates, we found that better links between parents and schools and more positive views of parents towards schools are associated with lower rates of absence in both primary and secondary schools. Other research has also found that local authorities and schools consider that parental attitudes are the most frequent cause of truancy, with some parents putting a low value on education.34
4.23 Pupils’, parents’ and carers’ attitudes to education are formed during their own early years of education and can be difficult to change. One important opportunity for changing negative attitudes comes when a child – particularly a first child – starts school. It is therefore important that any negative attitudes are identified, challenged and changed at this time in the positive context of giving every child the chance to reach their potential. A ‘good start’ needs to be reinforced by consistent messages from the school about the importance of attendance and especially at other key watersheds, such as when a child moves to secondary school. Achieving a positive culture towards attendance may take time and effort, but there are plenty of examples to show it can be done (one example at Box 12).
34 Absence from School: A study of its causes and effects in seven LEAs, Heather Malcolm, Valerie Wilson, Julia Davidson and Susan Kirk, Department for Education and Skills, 2003. (www.dfes.gov.uk/research/data/uploadfiles/RR424.pdf)
BOX 12
Millbank Primary School, London Borough of Westminster
Many pupils at this school come from relatively deprived homes, with around half taking free school meals. The majority of pupils are of minority ethnic origin and many do not speak English as a first language. The head teacher believes that improving parental attitudes is extremely important in tackling absence, so the school has adopted a number of measures to achieve this:
� the link between attendance and attainment is constantly reinforced by teachers and through the school newsletter;
� attendance figures are shown in large print at the top of pupils’ school reports;
� parents who take their child on term-time holidays are invited to an interview with the head teacher - she shows them the work that other pupils have produced during their child’s absence in order to emphasise the lessons they have missed; and
� the head teacher warns parents that they may lose their child’s school place if the child is absent for an unauthorised extended leave - one family’s children lost their places at the school as a result.
The head teacher considers that it took more than three years to achieve a change in some parents’ attitudes and to see the effects on attendance levels. The school reduced its total absence rate from 7.4 per cent in 1999-2000 to 4.7 per cent in 2002-03. Our analysis of schools’ performance on attendance in 2002-03 showed that Millbank Primary’s absence rate is now much lower than predicted by its circumstances.

47IMPROVING SCHOOL ATTENDANCE IN ENGLAND
APPENDIX 1Study methodology
Introduction1 This report is based on:
� quantitative analyses of the Department's data on absence and school background variables, and school inspection gradings given by Ofsted;
� focus groups of local authority principal education welfare officers;
� postal surveys of a sample of primary and secondary school head teachers and of a sample of local authority education welfare services;
� visits to seventeen schools, both primary and secondary;
� review of a sample of Ofsted inspection reports for local authorities, and primary and secondary schools;
� discussions with staff of the Department, Ofsted and other relevant organisations;
� analysis of academic and other research; and
� consultation with a reference panel of experts.
Quantitative analyses of absence data2 The main findings from the analyses, carried out on our behalf by the National Foundation for Educational Research (NFER), are set out in Part 2 of the report. Further details of the analyses and methodology used by NFER are set out in Appendix 2, and the NFER’s full report can be found at www.nfer.ac.uk.
Focus groups of local authority principal education welfare officers 3 Our consultants, IFF Research Ltd, ran three focus groups of principal education welfare officers in London, Bristol and Manchester. Principal education welfare officers manage local authority education welfare services, and one of their main responsibilities is managing pupil absence. The main purpose of the groups was to identify:
� the factors associated with truancy, and barriers to improving attendance;
� whether local authorities and schools have the capacity to improve attendance;
� the extent to which local authorities and schools are aware of, and able to apply, good practice; and
� local authority views on current government initiatives to improve attendance.
Surveys of head teachers and local authority principal education welfare officers4 We undertook a survey of a random sample of 500 primary school and 400 secondary school head teachers, including at least one school from every local authority. The aim of the survey was to establish: schools’ practices on managing attendance; which factors head teachers thought most influenced absence; and measures that schools had found effective in managing absence. The survey was conducted from May to November 2004 and we received responses from 414 primary head teachers (83 per cent) and 323 secondary head teachers (81 per cent).
appendix one
IMPROVING SCHOOL ATTENDANCE IN ENGLAND48
5 We undertook a survey of a random sample of 79 local authority education welfare services. The aim of the survey was to: identify education welfare services’ practices in recording absence; determine which factors they thought most influenced absence; and obtain their views on the effectiveness of government initiatives to tackle absence. The survey was conducted from June to November 2004 and we received responses from 57 education welfare services (72 per cent).
Visits to schools6 We visited five primary schools and 12 secondary schools of various types. We selected schools according to the results of our quantitative analysis (Appendix 2) and their geographic location, so as to gain a spread of schools across England. The schools visited were:
� Abbey Wood School, Greenwich
� Abraham Moss High School, Manchester
� Acland Burghley School, Camden
� Cheviot Primary School, Newcastle
� Etone Community School and Technology College, Nuneaton
� Haverstock School, Camden
� Hereward Community College, Peterborough
� Millbank Primary School, Westminster
� New College, Leicester
� Newquay Tretherras School, Cornwall
� North Blunts Primary School, Durham
� Notre Dame High School, Sheffield
� Padstow School, Cornwall
� Parkside Community College, Cambridge
� Selhurst High School for Boys, Croydon
� Sherborne Abbey Primary School, Dorset
� William Ellis School, Camden
7 During each visit, we held an extensive interview with a member of the school management and, in many cases, other members of the school’s attendance team.
Review of a sample of Ofsted inspection reports8 We reviewed a random sample of 40 Ofsted reports published in 2004, covering 10 local authorities, 15 secondary schools and 15 primary schools. We aimed to establish the extent of coverage on attendance in the reports and assess whether Ofsted inspections could do more to help improve attendance.
Reference Panel 9 We convened a panel to act as a sounding board for the development of the study methodology, and to comment on our emerging findings.
Reference Panel members Specialist area
Tim Andrew Vice-President, Secondary Heads Association Managing schools
Vic Chivers Ofsted Local authority inspections
Peter Gray National Audit Office Director, Home Affairs and Justice (Value For Money)
John King Headmaster, Gable Hall School Managing schools
Colin McShane Audit Commission Local authority inspections
David Moore Ofsted School inspections, former head teacher
Jan Myles National Association of Head Teachers Managing schools
Keith Shipman London Borough of Merton Managing education welfare services
John Smail Attendance adviser, Department for Education and Skills Managing education welfare services
IMPROVING SCHOOL ATTENDANCE IN ENGLAND
appendix one

49IMPROVING SCHOOL ATTENDANCE IN ENGLAND
appendix two
APPENDIX 2Outline of the quantitative analysis and results
Aim of the analysis
1 Our analysis aimed to investigate the statistical relationships between school absence rates and factors related to schools’ characteristics or context (contextual factors) such as the size of a school and its pupils’ ethnicity, gender and take up of free school meals. We conducted the analysis at both school and local authority level.
Outline of our method2 Our analysis:
a assessed the extent to which contextual factors are linked to the likelihood that pupils will be absent from school; and
b identified those contextual factors that are most associated with absence rates.
3 We derived a measure of effectiveness of schools and local authorities in addressing school absence in 2002-03 by:
a calculating the expected absence rates of pupils in different schools and local authorities given the contextual factors in the particular school or local authority area; and
b comparing this expected absence rate with the actual level of absence in the school or local authority area.
4 We examined what happened to overall absence rates in local authorities when schools with the highest absence rates were excluded.
5 Using the results of these analyses we derived measures of effectiveness in addressing school absence for:
a different types of schools – including selective, specialist, voluntary aided schools, and single sex schools;
b groups of schools that are participating in specific initiatives and strategies that include improving attendance, such as schools in Education Action Zones and Excellence in Cities initiatives; and
c different schools within the same local authority area.
6 We also assessed the link between the absence rates in schools and local authority areas and Ofsted’s judgements of how well schools and local authorities were managing absence.
7 Finally, we explored changes in absence rates from 2000-01 to 2002-03.
Source data8 The Department supplied our contractors, the National Foundation for Educational Research (NFER), with a data file containing details of 17,865 primary and 3,432 secondary schools. Of these, 14,340 primary and 3,078 secondary schools had complete data for authorised and unauthorised absence, and only complete data was included in our analysis. The data file contained:
� schools’ annual absence returns submitted to the Department, showing the average percentage of half days missed due to authorised and unauthorised absence;
� information on contextual factors such as the number of pupils in each school, and pupils’ take up of free school meals, ethnic make up and gender;
� a variety of school-level data on academic attainment; and
� type of school, for example specialist, selective etc.
9 Ofsted supplied the NFER with school inspection data from September 2001 to July 2003 on eight judgments related to attendance. These judgements included: leadership; behaviour (including the incidence of exclusions); pupil/parent attitudes and relationships with the school; and systems for monitoring and improving attendance.

50 IMPROVING SCHOOL ATTENDANCE IN ENGLAND
10 Schools are not consistent in whether or not they authorise absence, which has the effect of making the total absence measure (authorised plus unauthorised absence) a more reliable measure than unauthorised absence alone.
11 In contrast to the data used in our report on the performance of secondary schools35, pupil-level data is not available for absence. We used annual absence data at school level. Analysis of absence would have been more powerful if pupil-level data were available, for example in determining with much more certainty the relationships between types of pupil and absence rates.
Contextual factors used in our analysis12 Figure 1 explains the contextual factors used in our analysis. Factors on which data was not available, but which might have provided more comprehensive results include the condition of school buildings, and parental occupation and level of education.
Methodology13 Our main analysis technique was multilevel modelling, a development of the regression analysis technique, which is a method for predicting a result using factors known to be linked with the result. For example, regression analysis could be used to predict a school’s average attendance levels given factors such as numbers of pupils taking up free school meals and the size of the school. Multilevel modelling takes account of data which is grouped into similar clusters at different levels. For example, there may be more in common between schools within the same local authority than schools across different local authorities. Because it takes account of the hierarchical structure of data, multilevel modelling produces more accurate predictions than regression analysis.
1 Contextual factors
Location of school
Ethnicity
Headcount of pupils
Gender
Pupil:teacher ratio
Free school meals
Special Educational Needs
English as an additional language
Exclusions
Pupil stability(secondary schools only)
Whether the school was located in Neighbourhood Renewal Area, coalfield ward or rural ward
Percentage of pupils in each of the following ethnic groups: Indian, Pakistani, Bangladeshi, other Asian, Black Caribbean, Black African, other Black, and unclassified ethnicity
Number of pupils on the school roll
Percentage of pupils who are boys
Number of pupils per teacher
Percentage of pupils taking up free school meals
Percentage of pupils with a statement of Special Educational Needs
Percentage of pupils for whom English is not their first language
Percentage of pupils excluded in the school year 2001-02
Percentage of 15-year old pupils who were at the same school at the end of Key Stage 3
35 Making a difference: Performance of maintained secondary schools in England, HC 1332 / 2002-03. (www.nao.org.uk/publications/nao_reports/02-03/02031332es.pdf)
appendix two

51IMPROVING SCHOOL ATTENDANCE IN ENGLAND
Relationships of contextual factors with absence14 Our analysis measured the relationship between each contextual factor and absence. It also tested whether the relationship is statistically significant. We have expressed statistically significant relationships in terms of average days of absence per pupil each year (Figure 2). Positive values show an association with increased absence and negative values show an association with reduced absence.
15 For contextual factors that are categorical - that is, either one or the other, such as location in a Neighbourhood Renewal Area or not - the effect is shown in the days per year difference that the factor makes per pupil. For example, pupils in a primary school in a Neighbourhood Renewal Area will be absent on average 0.37 days per year more than pupils in primary schools not in a Neighbourhood Renewal Area (Figure 2).
16 We have used a different approach for factors that are continuous – that is, factors that increase in numbers, percentages or points. For each factor, the table shows the effect on pupil absence of a school being very close to one end of the range of values compared with a school with an average value for that factor.36 For example, pupils in a secondary school that has a relatively high level of Asian-Pakistani or Black-African pupils would tend to have 1.22 fewer days absence per year than pupils at a school with average levels of pupils of this ethnicity (Figure 2).
17 Some contextual factors have no significant relationship with some types of absence. For example, the location of primary schools in a Neighbourhood Renewal Area is associated with (higher) total absence, but location in these Areas is not associated with unauthorised absence in primary schools or with either total or unauthorised absence in secondary schools.
appendix two
36 This measure is based on the standard deviation, which is a statistical measure of the variation of a factor from the mean. Four standard deviations cover 95 per cent of the range of outcomes, and around two standard deviations cover the range from very close to one end of the range to the mean.

52 IMPROVING SCHOOL ATTENDANCE IN ENGLAND
2 Relationships of contextual factors with absence
Context
Categorical factors:
Coalfield ward
Neighbourhood Renewal Area
Rural ward
Continuous factors:
Boys (%)
Exclusions in school year 2001-02 (%)
Headcount of pupils
Pupil:teacher ratio
Pupils whose first language is not English (%)
Pupils with a statement of Special Educational Needs (%)
15-year old pupils in the same school for both KS3 and GCSE/GNVQs (stability indicator) (%)
Take up of free school meals in school (%)37
Take up of free school meals in local authority (%)
Asian-Pakistani pupils (%)
Asian-Bangladeshi pupils (%)
Asian-other pupils (%)
Black-Caribbean pupils (%)
Black-African pupils (%)
Black-other pupils (%)
Indian pupils (%)
Unclassified ethnicity pupils (%)
Total absence
0.61
0.37
-0.19
0.26
0.66
0.24
n/a
4.02
-0.96
-0.78
-0.14
Unauthorised absence
0.04
0.12
0.06
0.58
0.04
n/a
1.18
-0.12
-0.26
-0.20
-0.06
0.10
-0.16
-0.20
0.06
Total absence
-0.38
1.24
0.50
0.40
0.86
-0.84
6.84
-1.54
-1.22
-0.56
-0.42
-0.54
-1.22
0.30
-0.66
0.28
Unauthorised absence
-0.29
0.64
0.30
0.34
0.30
-0.42
2.40
-0.64
-0.34
0.18
-0.22
0.20
NOTE
No entry in the table means that the factor has no significant relationship.
Effect on absence (days per pupil per year)
Primary schools Secondary schools
37 We used a truncated measure of free school meals because the effect ‘flattened off’ at around 40 per cent in primary schools and 30 per cent in secondary schools. Further increases in free school meal levels are not related to increases in absence.
appendix two

53IMPROVING SCHOOL ATTENDANCE IN ENGLAND
appendix two
Relationships of academic attainment with absence18 Figure 3 shows the impact of attainment in primary and secondary schools on days absence per year for each pupil. All attainment measures are continuous factors, and so are treated in the same way as described in paragraph 16. The average GCSE/GNVQ point score has perhaps the most important relationship with absence: pupils at schools with very low point scores tend to be absent 3.48 days more than pupils at schools with average point scores.
Variations in school performance on absence19 There is a wide range of absence rates between schools. Figure 4 shows the variation in schools’ absence rates before making any adjustments for contextual factors.
4 Variations in schools’ absence rates (unadjusted for context)
Absence measure
Primary schools:
Total absence
Unauthorised absence
Secondary schools:
Total absence
Unauthorised absence
Minimum absence
%
0.3
0.0
1.9
0.0
Maximum absence
%
29.1
7.9
19.8
10.5
Average absence
%
5.7
0.4
8.4
1.1
3 Relationship of academic attainment with absence
Attainment measure
Primary attainment:
Pupils disapplied at Key Stage 2 (%)38
Average point score at Key Stage 2
School Value Added measure39
Secondary attainment:
Pupils disapplied at Key Stage 338 (%)
15-year old pupils achieving 5 or more grades A*-G at GCSE/GNVQ (%)
Average GCSE/GNVQ point score per 15-year old pupil
0.40
-2.08
0.28
1.62
-1.04
-3.48
0.20
-1.12
0.06
0.78
-1.30
-0.32
Effect on absence(days per pupil per year)
Total absence Unauthorised absence
38 Pupils are disapplied where the assessments are not suitable for them, for example because the pupils have certain special educational needs.
39 A statistical measure of attainment at Key Stages 2 and 3 compared with attainment at the preceding stages, measuring improvements in pupils’ attainment rather than absolute attainment.

54 IMPROVING SCHOOL ATTENDANCE IN ENGLAND
5 Secondary schools’ performance on absence, after adjusting for contextual factors
Schools with absence rates clearly worse than expected
928
Schools with absence rates about as expected
1,059
Schools with absence rates clearly better than expected
1,091
plus6 Variance in absence explained by our models
Model
Local authority level:
Contextual factors 55 57 46 25
Contextual factors 65 64 81 56plus attainment
School level:
Contextual factors 38 21 52 31
Contextual factors 43 26 70 45plus attainment
Total absence explained
%
Unauthorised absence
explained %
Total absence explained
%
Unauthorised absence
explained %
Primary schools Secondary schools
appendix two
Variations in school performance adjusted for contextual factors and attainment20 We adjusted secondary schools’ performance on total absence for their context, and placed schools into one of three categories - clearly better than expected, clearly worse than expected and about as expected (Figure 5). The analysis uses statistical estimation, allowing for imprecision by deriving for each school a range of possible values, rather than a single value. The “better than expected” category includes only those schools whose absence rate is below our estimated range of values, and the “worse than expected” category includes only those schools whose absence rate is above our estimated range of values. Other schools have absence rates within their expected range.
21 We sought to measure the extent to which contextual factors and academic attainment explain variance in absence. Variance was considered at two levels: variance in levels of absence between different local authorities and variance in absence between schools within the same local authority. Figure 6 shows how much of the variance can be attributed to context and attainment. At school level, more than half the variance in secondary schools’ total absence rates is explained by context and attainment. Absence in primary schools and unauthorised absence in secondary schools are not well explained by context and attainment. The implication of these results is that absence rates are also related to factors that we were not able to measure, such as pupils’ family environments or the way schools are run.

55IMPROVING SCHOOL ATTENDANCE IN ENGLAND
appendix two
Relationship between absence and Ofsted inspection judgements22 Our analysis also examined the relationship between school absence rates and relevant Ofsted judgements for schools inspected between September 2001 and July 2003. Figures 7 and 8 show the results for primary and secondary schools respectively. More positive assessments for most of the relevant judgements are associated with lower absence rates, in particular judgements on behaviour, links with parents, monitoring procedures, parental views, personal development and pupils’ attitudes to school.
23 The Figures show the relationship between a change of one grading (of seven) of the Ofsted scale40 and the number of days absence per year for each pupil. For example, the pupils of a primary school graded as “excellent” (grade 1) for managing behaviour would tend to have 0.96 fewer days absence (3 grades difference x 0.32 days) per year than pupils of a school graded as “satisfactory” (grade 4). Surprisingly, good assessments of leadership and management in secondary schools are associated with higher total absence rates. This may be because strong leaders are sometimes brought in to improve poor performing schools, and it takes time to turn around attendance. The relationship between Ofsted judgements and absence rates is stronger for secondary schools than primary schools.
40 There are seven gradings of the Ofsted scale in total, from 1 (excellent) to 7 (very poor). 41 A school is selected for a short inspection based on a combination of four factors that determine
good performance, including a favourable previous Ofsted inspection.
7 Relationships between Ofsted judgements and absence in primary schools
Ofsted inspection judgement
Total Unauthorised absence absence
Acquisition of skills, knowledge and understanding -0.06
Behaviour, including the incidence of exclusions -0.32
Effectiveness of the school’s links with parents -0.12 -0.08
Leadership and management of the head teacher 0.06and key staff
Parents’ views of the school -0.16 -0.12
Personal development and relationships -0.14 -0.09
Procedures for monitoring and improving attendance -0.25 -0.06
Pupils’ attitudes to school -0.06
Short inspection41 -0.45 -0.18
NOTE
No entry in the table means that the factor has no significant relationship.
Effect on absence per grade change (days per pupil per year)

56 IMPROVING SCHOOL ATTENDANCE IN ENGLAND
Low performing schools24 We investigated the proposition that there are small minorities of schools in each local authority that have absence rates much higher than their local authority average, and might be classified as low performing “outlier” schools.42 Figure 9 shows that fewer than 7 per cent of schools have absence rates much higher than their local authority average. Some local authorities have no low performing “outlier” schools.
9 Numbers of low performing “outlier” schools
Primary schools Secondary schools
Total Unauthorised Total Unauthorised absence absence absence absence
Number of outlier schools 540 902 108 184
Percentage of schools 3.8% 6.3% 3.5% 6.0%
appendix two
42 We defined outlier schools as those schools where the difference between the highest school absence rate and the average (mean) absence rate in their local authority divided by the local authority’s standard deviation is greater than or equal to 2.0.
8 Relationships between Ofsted judgements and absence in secondary schools
Ofsted inspection judgement
Total Unauthorised absence absence
Acquisition of skills, knowledge and understanding
Behaviour, including the incidence of exclusions -0.58
Effectiveness of the school’s links with parents -0.45 -0.27
Leadership and management of the head teacher 0.54and key staff
Parents’ views of the school -0.22
Personal development and relationships -0.22
Procedures for monitoring and improving attendance -0.39
Pupils’ attitudes to school -0.89 -0.33
Short inspection -1.14
NOTE
No entry in the table means that the factor has no significant relationship.
Effect on absence per grade change (days per pupil per year)
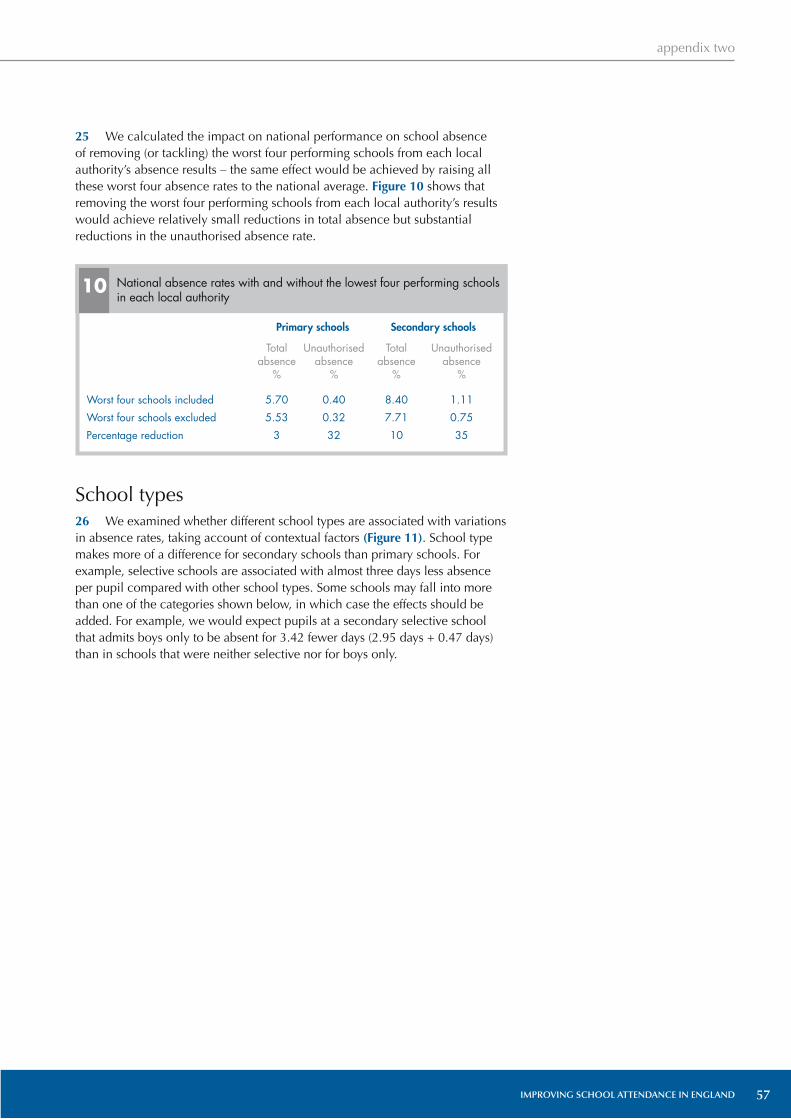
57IMPROVING SCHOOL ATTENDANCE IN ENGLAND
25 We calculated the impact on national performance on school absence of removing (or tackling) the worst four performing schools from each local authority’s absence results – the same effect would be achieved by raising all these worst four absence rates to the national average. Figure 10 shows that removing the worst four performing schools from each local authority’s results would achieve relatively small reductions in total absence but substantial reductions in the unauthorised absence rate.
School types26 We examined whether different school types are associated with variations in absence rates, taking account of contextual factors (Figure 11). School type makes more of a difference for secondary schools than primary schools. For example, selective schools are associated with almost three days less absence per pupil compared with other school types. Some schools may fall into more than one of the categories shown below, in which case the effects should be added. For example, we would expect pupils at a secondary selective school that admits boys only to be absent for 3.42 fewer days (2.95 days + 0.47 days) than in schools that were neither selective nor for boys only.
appendix two
10 National absence rates with and without the lowest four performing schools in each local authority
Primary schools Secondary schools
Total Unauthorised Total Unauthorised absence absence absence absence % % % %
Worst four schools included 5.70 0.40 8.40 1.11
Worst four schools excluded 5.53 0.32 7.71 0.75
Percentage reduction 3 32 10 35

58 IMPROVING SCHOOL ATTENDANCE IN ENGLAND
11 Effect of school types on absence for primary and secondary schools
School type Effect on absence (days per pupil per year)
Primary schools Secondary schools
Total Unauthorised Total Unauthorised absence absence absence absence
Education Action Zone 0.08 0.59 0.29
Excellence in Cities 0.14 0.86
Excellence in Cities - Action Zone 0.88
Excellence in Cities - Clusters 0.56 -0.64 -1.31
Excellence in Cities - n/a n/a City Learning Centre
Excellence in Cities - Phase 2 n/a n/a -0.62
Excellence in Cities - Phase 3 n/a n/a -0.53
Foundation school -0.30 -0.65 -0.40
Voluntary aided school -0.35 -1.41 -0.77
Voluntary controlled -0.15 0.10
Faith school - Christian -0.16
Boys' school n/a n/a -0.47 -0.29
Girls' school n/a n/a -0.41
Selective school n/a n/a -2.95
Has a sixth form n/a n/a 0.73 0.34
Specialist school n/a n/a -0.83 -0.27
Specialist Art College n/a n/a
Specialist Language College n/a n/a
Specialist Sports College n/a n/a 0.61
Specialist - other n/a n/a
appendix two
NOTES
1 No entry in the table means that the factor has no significant relationship.
2 Values for Excellence in Cities schools are mixed. This may be due to the different dates at which schools joined the schemes.

59IMPROVING SCHOOL ATTENDANCE IN ENGLAND
Change over time27 We examined attendance data from 2000-01 to 2002-03 to determine which factors were associated with the extent of improvements or reductions in absence rates over the three year period. Figures 12 and 13 show the “change over time” measures for primary and secondary schools respectively.
28 As with the earlier analysis, for contextual factors that are categorical, the impact of the factor on the rate of change of absence is shown in the days per year per pupil for each of the three years examined. For example, Figure 12 shows that on average, primary schools in Neighbourhood Renewal Areas are associated with faster reducing absence rates of 0.02 days absence per year for each pupil for each of the three years examined compared to schools not in a Neighbourhood Renewal Area. This may be because funding and initiatives directed at schools in Neighbourhood Renewal Areas are having an impact on reducing absence.
29 For factors that are continuous, the table shows the effect on pupil absence of a school being very close to one end of the range of values compared with a school with an average value for that factor. For example, Figure 12 shows that on average primary schools with some of the highest levels of pupils taking up free school meals are associated with faster reducing total absence (with attainment measure) of 0.04 days per year for each of the three years compared to primary schools with average levels of pupils taking up free school meals. This may reflect the impact of funding and initiatives that have been targeted at schools with high levels of pupils taking up free school meals.
appendix two
12 Relationships for primary school “change over time” measures, 2000-01 to 2002-03
Context Effect on absence (days per pupil per year)
With attainment measure Without attainment measure
Total Unauthorised Total Unauthorised absence absence absence absenceCategorical factors:
Rural ward -0.02 -0.02
Coalfield ward 0.05 0.05
Neighbourhood Renewal Area -0.02 -0.02
Voluntary aided 0.01 0.02
Excellence in Cities -0.04 -0.09 -0.04 -0.09
Excellence in Cities - clusters 0.07 0.06
Continuous factors:
Free school meals (%) -0.02 -0.04 -0.04 -0.04
Average point score KS2 0.02 0.02 n/a n/a
NOTE
No entry in the table means that the factor has no significant relationship.

60 IMPROVING SCHOOL ATTENDANCE IN ENGLAND
The full report30 The NFER’s full report, including details of the methodology and the results, are available at www.nfer.ac.uk.
13 Relationships for secondary school “change over time” measures, 2000-01 to 2002-03
Context Effect on absence (days per pupil per year)
With attainment measure Without attainment measure
Total Unauthorised Total Unauthorised absence absence absence absence
Categorical factors:
Boys’ school -0.07 -0.07
Education Action Zone -0.09 -0.07 -0.16 -0.06
Excellence in Cities2 -0.11
Excellence in Cities - Phase 2 0.11
Excellence in Cities - Phase 3 0.15
Excellence in Cities - Action Zone -0.07
Excellence in Cities - clusters -0.10
Faith school - Christian -0.06
Foundation school
Selective school 0.12
Specialist Language College 0.11
Continuous factors:
Free school meals (%) -0.24 -0.02
Average KS3 point score n/a n/a
Pupils achieving level 5+ in 0.06 n/a n/aKS3 English (%)
Pupils achieving level 5+ in 0.10 n/a n/aKS3 science (%)
Pupils disapplied at KS3 (%) 0.04 n/a n/a
School Value Added -0.12 -0.04 n/a n/ameasure (KS3-4)
Pupils achieving 5+ A* to C 0.10 n/a n/agrades at GCSE/GNVQ (%)
Pupils achieving 5+ A* to G 0.20 n/a n/agrades at GCSE/GNVQ (%)
NOTES
1 No entry in the table means that the factor has no significant relationship.
2 Values for Excellence in Cities schools are mixed. This may be due to the different dates at which schools joined the schemes.
appendix two
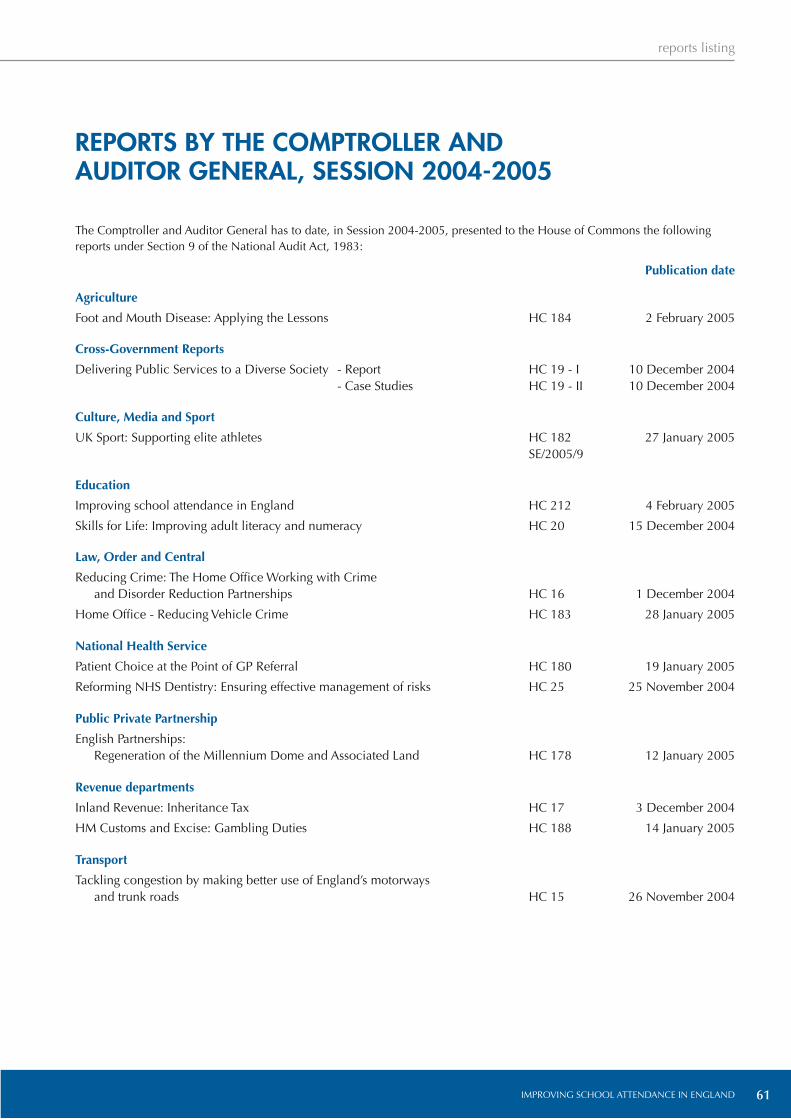
reports listing
IMPROVING SCHOOL ATTENDANCE IN ENGLAND 61
The Comptroller and Auditor General has to date, in Session 2004-2005, presented to the House of Commons the following reports under Section 9 of the National Audit Act, 1983:
Publication date
Agriculture
Foot and Mouth Disease: Applying the Lessons HC 184 2 February 2005
Cross-Government Reports
Delivering Public Services to a Diverse Society - Report HC 19 - I 10 December 2004 - Case Studies HC 19 - II 10 December 2004
Culture, Media and Sport
UK Sport: Supporting elite athletes HC 182 27 January 2005 SE/2005/9
Education
Improving school attendance in England HC 212 4 February 2005
Skills for Life: Improving adult literacy and numeracy HC 20 15 December 2004
Law, Order and Central
Reducing Crime: The Home Office Working with Crimeand Disorder Reduction Partnerships HC 16 1 December 2004
Home Office - Reducing Vehicle Crime HC 183 28 January 2005
National Health Service
Patient Choice at the Point of GP Referral HC 180 19 January 2005
Reforming NHS Dentistry: Ensuring effective management of risks HC 25 25 November 2004
Public Private Partnership
English Partnerships: Regeneration of the Millennium Dome and Associated Land HC 178 12 January 2005
Revenue departments
Inland Revenue: Inheritance Tax HC 17 3 December 2004
HM Customs and Excise: Gambling Duties HC 188 14 January 2005
Transport
Tackling congestion by making better use of England’s motorways and trunk roads HC 15 26 November 2004
REPORTS BY THE COMPTROLLER AND AUDITOR GENERAL, SESSION 2004-2005

reports listing
IMPROVING SCHOOL ATTENDANCE IN ENGLAND62
Printed in the UK for the Stationery Office Limited on behalf of the Controller of her Majesty's Stationery Office
176149 02/05 7333
Publication date
Work and Pensions
Managing Attendance in the Department for Work and Pensions HC 18 8 December 2004
Helping those in financial hardship: the running of the Social Fund HC 179 13 January 2005
Transfer of property to the private sector under the expansion of the HC 181 26 January 2005PRIME Contract