improving ferry service across long island...
TRANSCRIPT

Inc., Seattle, Phase 3 Rept., Jan. 1977. 5. Supplementary Report of the Highway Cost Alloca
tion Study. 89th Congress, 1st Session, House Document 124, March 1965.
6. Allocation of Highway Cost Responsibility and Tax
25
Payments, 1969. Federal Highway Administration, May 1970.
Publication of this paper sponsored by Committee on Application of Economic Analysis to Transportation Problems.
Improving Ferry Service Across Long Island Sound Michael R. Cohen, * Sikorsky Aircraft, Stratford, Connecticut
A study of vehicle-carrying ferry service across Long Island Sound is described. The purposes of the study were (a) to consider a wide range of possible services; (b) to explore and evaluate the economic performance. environmental impacts, and economic development impacts of these services; and (c) to combine the various measures of performance into an overall measure of feasibility that could be used as a basis for making recommendations. Five types of vessels were earmarked for study, from small, conventional-displacement vessels to high-speed hovercraft. A range of volumes and several possible crossing sites were chosen. A relatively simple economic model was constructed that used as input cost and performance data for ferry vessels, crossing distances and limitations on harbor speed, site-specific terminal cost estimates, and projections of fare versus the volume of vehicles carried at each site. A computer program written for this model was run for a wide range of vehicle volumes, crossings, and vessel types. Detailed studies were made of environmental impacts and the feasibility of terminal locations for services that performed well economically. The study concludes that high-technology vessels are not economically viable for vehicle-carrying service across the Sound and recommends near-term improvements to existing services that would lead to greatly expanded services over the long term.
Travel between Long Island and New England must currently take either a long, circular route passing over congested highways and bridges in New York City or one of two relatively high-cost ferry routes, one of which operates in the summer only. A bridge study conducted in 1971 (1) was part of an early attempt to improve travel between Long Island and the mainland. The study evaluated several potential bridges at various sites on the Sound. A bridge between Rye and Oyster Bay was proposed but met with strong public opposition and was subsequently abandoned, The proposed bridges east of the Rye-Oyster Bay Bridge were ruled out from the start because their tolls would not be able to cover their costs. The New York and Connecticut Departments of Transportation then decided to consider ways of improving ferry routes and services.
This paper describes the methodology and results of a study of ferry service across Long Island Sound performed by the Tri-State Regional Planning Commission for the New York and Connecticut Departments of Transportation (2). The purpose of the study was to examine a variety of potential ferry routes and determine the costs and benefits of each route. This involved a careful analysis of ferry vessels, terminals, sites, and a range of volumes of vehicles and passengers as well as an evaluation of the impact that such a ferry service would have on the environment and on local development. The results were then combined to formulate a set of recommendations.
SERVICE CHOICES AND IMPACTS
The basic choices that must be made in setting up a ferry service and the major impacts of these choices are summarized in the following table.
Choices
Vessels Speed Vehicle capacity Turnaround time Length Draft Operating cost
Terminal sites Crossing distance Harbor cruise Water depths Site location
Size of service Annual volume Peak-day volume Load factor Crossing time Vessels required Vessel hours Vessel berths Headway
Impacts
Economic Capital cost Operating cost Fare revenues Deficits
Developmental Employment Population
Environmental Ferry traffic on local roads Terminal construction and operation Vehicle emissions Energy use
Each of the basic choices (vessels, terminal sites, and size of service) is critical in determining the economic and environmental consequences of a ferry service.
Vessels
The types of vessels studied were
1. The conventional displacement vessel, which has low capital and operating costs as well as relatively low speeds and high capacities. Four vessel types were studied, including 200-vehicle, 100-vehicle, 100-vehicle used (converted from steam to diesel power), and 50-vehicle "T-boat" (designed to operate with a smaller crew).
2. The amphibious hovercraft, which floats on a cushion of air. This feature gives the vessel high speed and allows it to land directly on shore. Capital and operating costs (especially for fuel) are high as are noiseemission levels.
3. The rigid-sidewall surface effect ship, which floats on a bubble of air trapped between rigid sidewalls that pierce the water. Its costs and speed are less than those of hovercraft but more than those of a conventional-
26
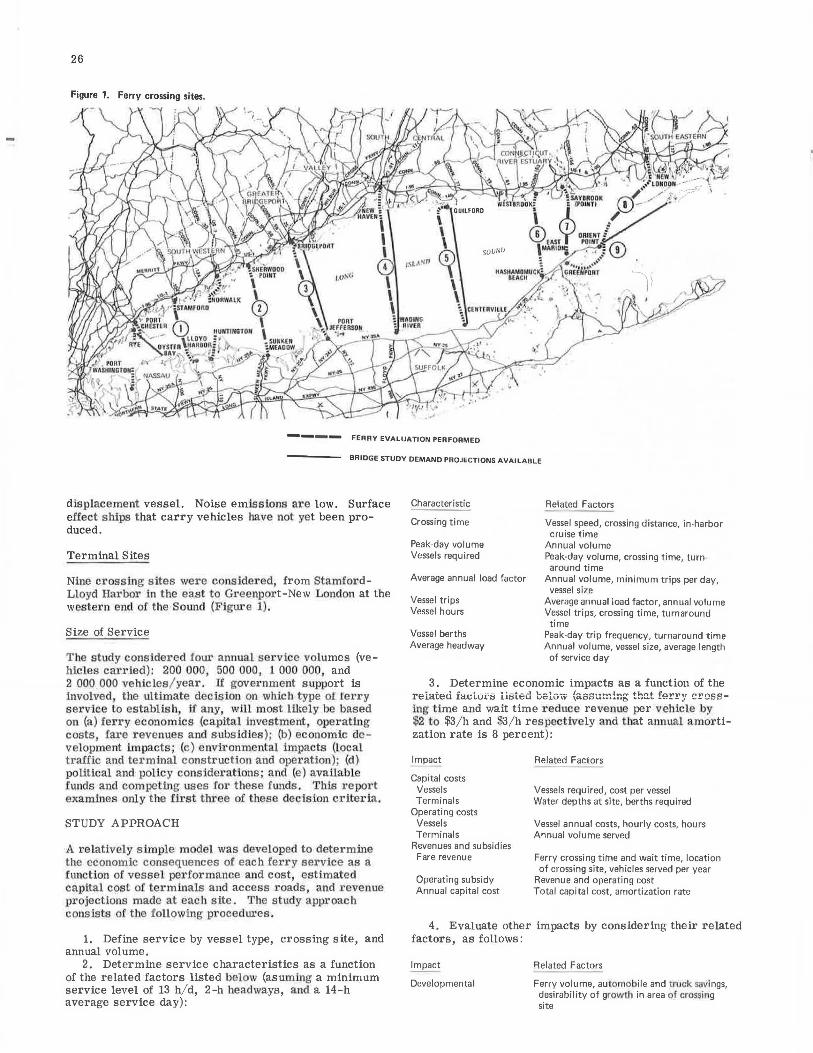
Figure 1. Ferry crossing sites.
._ __ _ FERRY EVALUATION PERFORMED
eRIDGE STUDY DEMAND PROJECTIONS AVAILABLE
displacement vessel. Noise emissions are low. Surface effect ships that carry vehicles have not yet been produced.
Terminal Sites
Nlne crossing sites were considered from StamfordLloyd Harbor in the east to Greenport-New London at the western end of the Sound (Figure 1).
Size of Service
The study considered four am1ual service volumes (vehicles carried): 200 000, 500 000, l 000 000, and 2 000 000 vehicles/ year. If government support is involved, the ultimate decision on which type of 1erry service to establish if any, will most likely be based on (a) ferry economics (capital investment operating costs, £are 1·evenues and subsidies)· (b) economic development impacts; (c) environmental impacts (local traffic and terminal construction and operation); (d) political and policy considerations; and (e) available funds and competing uses for these funds. This report examines only tbe first three of these decision criteria.
STUDY APPROACH
A relatively simple model was developed to determine the economic consequences of each ferry service as a function of vessel performance and cost, estimated capital cost of terminals and access roads, and revenue projections made at each site. The study approach consists of the following procedures .
1. Define service by vessel type, crossing site, and annual volume,
2. Determine service characteristics as a function of the related factors listed below (asuming a minimum service level of 13 h/ d, 2-h headways, and a 14-h average service day):
Characteristic
Crossing time
Peak-day volume Vessels required
Average annual load factor
Vessel trips Vessel hours
Vessel berths Average headway
Related Factors
Vessel speed, crossing distance, in-harbor cruise time
Annual volume Peak-day volume, crossing time, turnaround time
Annual volume, minimum trips per day, vessel size
Average annual load factor, annual volume Vessel trips, crossing time, turnaround time
Peak-day trip frequency, turnaround time Annual volume, vessel size, average length
of service day
3. Determine economic impacts as a function of the reiatec.i iactut~Si listed beluw {aaaurning that ferry crossIng time and wait time reduce revenue per vehicle by $2 to $3/h and $3/h respectively and t hat annual amortization rate is 8 percent):
lmpac_!
Capital costs Vessels Terminals
Operating costs Vessels Terminals
Revenues and subsidies Fare revenue
Operating subsidy Annual capital cost
Related Factors
Vessels required, cost per vessel Water depths at site, berths required
Vessel annual costs, hourly costs, hours Annual volume served
Ferry crossing titne and wait time, location of crossing site, vehicles served per year
Revenue and operating cost Total capital cost, amortization rate
4. Evaluate other impacts by considering their related factors, as follows:
Impact
Developmental
Related Factors
Ferry volume, automobile and truck savings, desirability of growth in area of crossing site

Impact
Environmental Ferry traffic Terminal construction
and operation Energy use and pollu
tion reduction
Aesthetic and other
Related Factors
Ferry volumes, current local conditions
Local site conditions, pleasure boat traffic Ferry fuel use and emissions, fuel savings and reduced emissions for automobiles and trucks
Local conditions, ferry facilities required
5. Summarize and compare the costs and impacts of alternate services and assess their feasibility.
6. Make recommendations.
A computer program was written for this model and run for many combinations of crossing site, vessel type, and service size. Detailed studies were then made for the most attractive services.
FINDINGS
Revenue Projections
The factors considered in predicting fares were current zone-to-zone travel (on existing bridges), time and distance saved on each ferry route, ferry fares, and existing ferry patronage. The volume of business at each ferry site is increased by reducing fares, increasing ferry speeds, or providing more frequent service. As might be expected, projected demand for ferry service at crossings farther east of the competing bridges was less elastic. The eastern crossings could charge the highest fares at low volumes, but to increase business they would have to make greater cuts in their fares than ferry services farther west.
Peaking of ferry demand also has far-reaching consequences on the economics of ferry service. The peak-day demand determines the size of the fleet required, and the greatly reduced demand at other times means that vessels lie idle or operate at far below their full capacity. It is expected that, as the size of a ferry service increases, demand will shift away from highly peaked summer vacation travel to more business and commercial travel and the peaking problem will become less severe.
Costs
The basic costs of providing ferry service are those for vessel operation-including crew, fuel, and maintenanceand terminal operation and maintenance. Vessel operating and capital costs were determined for each site and volume of service based on the cost and performance data given in Table 1. Terminal operating and maintenance costs were estimated based on recent experience on the Cape May-Lewes Ferry Service. A consultant was employed to determine the feasibility of terminals at certain locations, to develop a design concept, and to make preliminary estimates of terminal costs and environmental impacts.
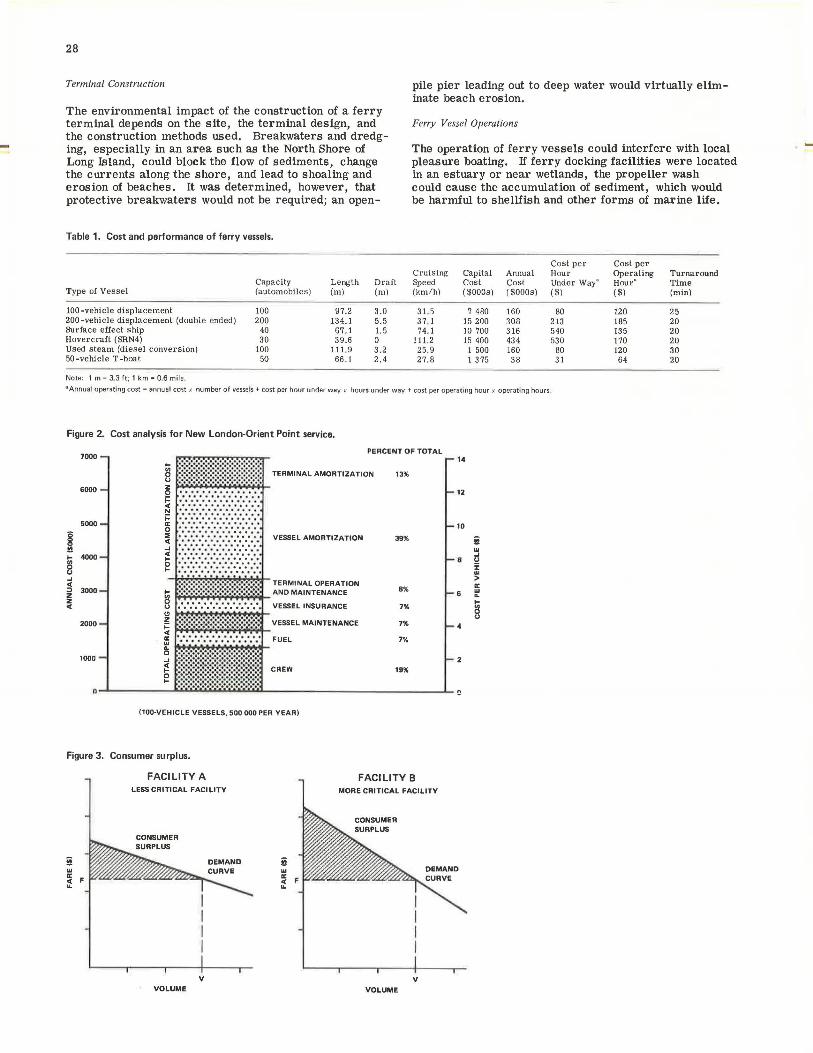
An analysis of the costs of a typical service (New London-Orient Point) is shown in Figure 2. Costs and benefits for this service are itemized in the following table (assuming service volume of 200 000 vehicles/ year, T-boat vessels of 50-vehicle capacity, and an annual amortization rate of 10 percent).
27
Item Amount
Vessels required 5
Capital costs ($000 OOOs) Vessels 6.9 Terminals 0
Total 6 .9
Annual costs ($000s) Amortization 688 Operating costs 1643
Total 2331
Annual benefits ($000s) Fare revenue 2706 Consumer surplus 474
Total 3180
Projected annual profit ($000s) 375
The benefit/ cost ratio for the New London-Orient Point service (total annual benefits divided by total annual costs) is 1.36. Funds for terminals for this service are already committed by the operator and New York State. Consumer surplus, which represents the value to ferry users of their time and travel savings in addition to the fares paid, is discussed in more detail later in this paper. The total cost is about half amortization and half operating. Crossing distance is critical in determining the cost of providing service because both vessel operating costs and the number of vessels required on a given service will vary directly with the time it takes to make a round trip.
Impacts
Development
Any new transportation facility will have an impact on the area it serves. The degree of the impact increases with the number of people served by the facility and the amount of time, kilometers, and money saved by using the new facility. Businesses may expand and hire new workers because of the reduced time and cost of shipping and receiving goods. Individuals may move in to fill new jobs or may relocate. because the area is now more accessible to jobs elsewhere. Development can also occur in the form of restaurants, shops, and hotels to serve travelers who use the facility.
Compared to a bridge, a ferry is a low-capital, high-operating-cost facility economically suited to carrying small volumes at relatively high tolls. Beyond a certain volume ferry fares must be lowered to a point where they do not cover the operating costs of additional service. Thus a ferry service will probably be a comparatively low-volume, high-fare facility, which will limit its impact on development.
One way to estimate the size of ferry-service impacts on development is to evaluate the consumer surplus. In economic terms, consumer surplus is the total amount of additional revenue that could be generated by charging the maximum fare that each patron would be willing to pay to use the service and is a measure of the benefits received by users of the service beyond what they pay in fares. Cons1.Uner surplus is shown in Figure 3 as the shaded area above the demand curves. Although both facilities can charge the same fare at volume V, facility B has a larger consumer surplus and its users would derive more benefits.
Environment
The aspects of ferry service that would affect the environment are terminal construction, vessel operation, and ferry traffic on local and regional roads.
28
Terminal Construction
The environmental impact of the construction of a ferry terminal depends on the site, the terminal design, and the construction methods used. Breakwaters and dredging, especially in an area such as the North Shore of Long Island, could block the flow of sediments, change the currents along the shore, and lead to shoaling and erosion of beaches. It was determined, however, that protective breakwaters would not be required; an open-
Table 1. Cost and performance of ferry vessels.
Capac ity Length Draft Type of Vess e l (au tomobiles ) (m) (ml
!OD-vehicle displacement JOO 97.2 3.0 200-vehicl e displacement (double ended) 200 134.1 5. 5 Su rface effect ship 40 67.1 I. 5 Hover cr aft (SRN4) 30 39.6 0 Used steam (diesel conversion) 100 111.9 3 .2 50-vehicle T-boat 50 66 .1 2 .4
Note: 1 m = 3,3 ft ; 1 km = 0 6 mile
pile pier leading out to deep water would virtually eliminate beach erosion.
Ferry Vessel Operations
The operation of ferry vessels could interfere with local pleasure boating. If ferry docking facilities were located in an estuary or near wetlands, the propeller wash could cause the accumulation of sediment, which would be harmful to shellfish and other forms of marine life.
Cost pe r Cost per Cruis ing Capital Annual Hou r Ope rating Turnaround Speed Cost Cos t Unde r Way Hour" Time (km/h) ( $000s) ( $000s) ($) ($) (min)
3 1.5 7 480 160 80 120 25 37. 1 15 200 308 2 13 185 20 74 . 1 10 700 316 540 135 20
111.2 15 400 434 530 170 20 25. 9 1 500 160 80 120 30 27.8 1 375 38 31 64 20
a A nnual operating cost= an nual cost x number o f vessels+ cost per hou r under way x hours under way+ cost pe r operating hour )( operating hours.
Figure 2. Cost analysis for New London-Orient Point service.
7000
6000
5000
§ !!! ... 4000 ~ ... ., C :, 3000 z z C
2000
1000
n
.............. . ... . .... .. .. . .. ... ........ . . .. .. .. ... ... .. .. ········ ... . . .. .. .. .. ... . . ·.·.·.·.·.·.·.·.·.·.·.·.·.·. ....... ...... . . .. . . ······· .. ... ........... ..... ......... ····· ········. -I .·:::.·::::.·::,,::
~ : ::::: :::: : :::: :::: ::: : : :::: : • • o O t I
~--------(J (!)---... ---~ z ~--------0: w .. 0 ., ~ I:!
PERCENT OF TOTAL
TERMINAL AMORTIZATION 13%
VESSEL AMORTIZATION 39%
TERMINAL OPERATION AND MAINTENANCE 8%
VESSEL INSURANCE 7%
VESSEL MAINTENANCE 7%
FUEL 7%
CREW 19%
(100-VEHICLE VESSELS, 500 000 PER YEAR)
Figure 3. Consumer surplus.
FACILITY A LESS CRITICAL FACILITY
CONSUMER
DEMANO CURVE r~==;a17:,.,..__
V VOLUME
i w
~ F II.
FACILITY B MORE CRITICAL FACILITY
CONSUMER
V
VOLUME
14
12
10
i w .,
8 (J
i w > 0:
6 w .. Iii 0 (J
4
2
~

This could be a factor at the Bridgeport-Fayerweather Island site and in East Marion. The other sites are not expected to be affected by propeller wash.
Ferry Traffic
The most noticeable and probably the most significant environmental impact of a ferry operation is the effect the ferry traffic has on the immediate terminal area. The traffic expected on a ferry facility is small compared to the capacity of a two-lane rural highway. Fig-
Figure 4. Impact of ferry traffic on a two-lane road.
1000
800
> i w 600 z Q w ::E ::l .J 0 > > 400 .J a: 5 :i:
200
TWO-LANE ROAD LEVEL OF
SERVICE
HEAVILY CONGESTED
CONGESTED
STABLE FLOW
29
ure 4, which uses as an example traffic on open areas of NY-25 for which 1973 one-way, peak-hour volume was 365 vehicles, shows that at an annual volume of 500 000 vehicles/ year the peak-day, peak-hour ferry traffic is less than half the capacity of a single lane of traffic under conditions of stable flow. The impact of the ferry traffic depends on the spare capacity available on existing roads. In this case the ferry would cause only a slight reduction in travel on the Throgs Neck and Whitestone Bridges. Even a ferry serving 2 000 000 vehicles/year would reduce the total traffic on these
AVERAGE-DAY, PEAK HR. FER RY VOLUME
oj_-----,!!!~~.....-r--r-r...-------.....-----.--r--r-,---.-m 100,000 2 3 4 5 6 7 8 9 10,000,000 2 4 5 G 7 8 9 1,000,000
ANNUAL FERRY VOLUME (VEHICLES)
Figure 5. Deficit by type of vessel for New Haven-Wading River service.
35
30
I I I 111 HOVERCRAFT '
"' SURFACE EFFECT SHIP
\ I'....
\ ~
25
w .J
' I'... ...... _ 1---" ~
u i w w > a: w .. ... 0 ii:
15 w a
10
5
200 VEHICLE DISPLACEMENT
I 11 1 111 \ 100 VEHICLE DISPLACEMENT I I I I II I
I I I I 111
~~ USED 100 VEHICLE DISPLACEMENT
~ \ \ ~ ,_ .-----..
50VEHICLE 'T-BOAT' ' ---v "'" -"' !"....... ~ ....
0 10,000 3 4 5 6 7 8 9 100,000 2 3 4 5 6 7 8 91,000,000 2 3 4 5 6 7 8 9 10,000,000
ANNUAL VEHICLES CARRIED

30
bridges by less than 2 percent.
Air Pollution and Fuel Use
By eliminating the land trip around the Sound, a ferry service would reduce fuel use and air-pollution emissions, but the effect would be relatively small and the bulk of the reductions would occur outside the areas of highest congestion and pollution concentrations.
The high-speed surface effect ship and the hovercraft would add to fuel use and emissions because they would burn considerably more fuel per vehicle than it takes to go around the Sound.
Summary of Costs and Benefits
The subsidies required for a typical crossing are shown in Figure 5 for each of the vessel types studied. The costs and deficits for high-technology vessels-the surface effect ship and hovercraft-are much greater at all volumes than those for the conventional-displacement vessels studied. The high speeds, high fares, and high load factors projected for these more sophisticated craft are not expected to outweigh their high capital and operating costs in vehicle-carrying ferry service,
Costs and benefits of ferry services at each site are summarized in Table 2 for services using vessels of 100-vehicle capacity. By using 100-vehicle vessels, all of the ferry services are expected to cover their operating costs through fare revenues. Only one site, WestbrookHashamomuck, is expected to cover the amortization cost of vessels and terminals. Because of the inclusion of consumer surplus in the calculation of benefits, ferry services at Westbrook-Hashamomuck and East Marion-
Table 2. Costs and benefits of ferry services.
Capital Costs ( $000s)
Ferry Vessel Terminal Total
Stamford-Lloyd Point 28 838 11 370 40 208 Sunken Meadow-Sherwood Point 25 457 16 276 41 733 Bridgeport-Port Jefferson (current) 32 353 9 199 41 552 Port Jefferson-Bridgeport (Fayerweather Island) 31 617 10 376 41 993 New Haven-Wading H1ver J~ g,;b 14 ~62 5J 8613 East Haven-Wading River 32 457 14 962 47 419 Guilford-Centerville 31 859 14 970 46 829 Westbrook Harbor-Hashamomuck 21 834 13 538 35 372 New London-Greenport 48 053 8 400 56 453 East Marion-Saybrook Point 24 626 14 943 39 569 New London-Orient Point 34 279 10 878 45 157
Note: Service volume of 500 000 vehicles/year; vessel of 100-vehicle displacement
Table 3. Evaluation of impact and feasibility of ferry services.
Economic
Saybrook Point show benefits that are greater than their total cost. Unfortunately, the most attractive sites from an economic point of view have severe problems with land access and environmental impact.
Evaluation of Findings
A decision on implementing ferry service must take into account
1. Costs versus revenues; 2, Impact of ferry traffic on local roads and fea
sibility of making needed improvements; 3. Access from local roads to shorelines; and 4. Impact and feasibility of terminal location and
construction.
High-speed ferry vessels were ruled out because of their poor economic performance. The conventional ferry services still being considered were compared by rating each on a scale ranging from very poor to very good. The ratings, which are based on other studies and are described briefly elsewhere (1), were then combined into an overall meas ure of feasibility (Table 3). This method proved to be the most practical way of combining and presenting various measures of ferryservice performance.
CONCLUSIONS AND RECOMMENDATIONS
The study reached the following major conclusions.
1. High-technology craft are extremely expensive to purchase and operate in vehicle-carrying service and
Cost per Benefits per Vehicle ( $) Annual Profits Vehicle($) ($000s)
Fare Con- Benefit/ Oper- Rev- sum.er Oper- Cost ating Total enue Surplus Total ating Total Ratio
5. 78 12.21 6.57 2.03 8.60 398 -2818 0.70 5.17 11.85 7.40 2.15 9.55 1116 -2223 0.81 6.40 13.05 7.03 2 .30 9.33 312 -3012 0.71 6.27 12.99 7.10 2.30 9.40 414 -2945 0. 72 '7 .57 16.19 i,,j8 2.5G iU.06 406 -3903 V.Oi 6.42 14.01 9.02 2 .50 11.52 1298 -2495 0.82 6.31 13.81 10.08 2.69 12. 77 1881 -1866 0.92 4.53 10.19 10.76 3.44 14.20 3117 287 1.39 9.20 18.24 9.44 3.44 12.88 116 -4400 0.71 5.02 11.36 10.49 3 .44 13.93 2731 -435 1.23 6.75 13.97 9.54 3.44 12.98 1396 -2217 0.93
Perfor- Highway Site Terminal Overall Ferry mance Access Access Location Feasibility
Stamford -Lloyd Point Poor Poor Fair Very poor Poor sunken Meadow-Sherwood Point Fair Good Very poor Very poor Very poor Bridgeport-Port Jeffers·on
(current) Poor Fair Good Good Fair Port Jefferson-Bridgeport
(Fayerweather Island) Poor Fair Fair Poor Poor New Haven-Wading River Poor Very good Fair Fair Poor East Haven-Wading River Fair Good Fair Fair Fair Guilford-Centerville Fair Poor Good Fair Fair Westbrook Harbor-Hashamomuck Good Fair Very poor Very poor Poor New London-Greenport Poor Poor Good Good Poor East Marion-Saybrook Point Good Good Very poor Very poor Poor New London-Orient Point Fair Good Good Good Good
Note: Service volume of 500 000 vehicles/year; vessel of 1 OD-vehicle displacement~
-

would require very high subsidies in spite of their high speed, higher load factors, and higher fares as compared to displacement vessels. A fleet of 200-vehicle vessels would be more expensive to operate than smaller 100-vehicle vessels for volumes upto 1 000 OOOvehicles/ year. Even at the highest volumes the savings are modest.
2. At some point fares will fall below the cost of providing service and the deficits per vehicle will increase. In economic theory, ferry volume should be set at a point where the fares plus the marginal dollar value of external benefits (such as pollution and road use saved by the ferry) are equal to the marginal cost of providing ferry service. Both the fares and the marginal cost of providing service, however, are best determined in practice.
3. The relative development impacts of a ferry are projected to be small. Passengers commuting to work are not likely to use ferry service in large numbers because of the costs and time involved.
4. At most ferry sites the most significant environmental impact results from the traffic that is generated on local access roads. Peak-day, peak-hour traffic is expected to make up as much as 40 percent of the capacity of a single lane of traffic on a rural highway under relatively uncongested conditions. In some areas, however, there is not enough spare capacity on existing roads and extensive improvements are necessary. Only slight savings in fuel and emissions result from ferry use.
This study was not able to find any clearly desirable sites for large-scale ferry service. Those sites that are most desirable economically have severe problems with land access and terminal construction. The current prospects for improvements to ferry service in the private sector are excellent. The current operator of the New London-Orient Point Ferry, Cross Sound Ferry Services, has received Coast Guard approval on the design for, and has begun construction of, a 50-vehicle vessel called a T-boat, which could significantly lower the costs of providing ferry service.
Near-Term Improvements
It is recommended that the states closely monitor and provide assistance to the development of ferry service in the private sector. A relatively modest investment by the states could serve the following short-range goals :
1. Ensure reliable service, 2. Reduce fares by introducing more efficient ves
sels, and 3, Maintain the incentive in the private sector to
hold down the cost of providing service.
New London-Orient Point
On the New London-Orient Point route, if the operating and capital costs of the T-boat vessel are as low as projected, substantial improvements in ferry service could be instituted without the need for continuing subsidies. The potential here is for a ferry service serving 200 000 vehicles/ year (at higher volumes substantial improvements to land access would have to be made). Such a service is projected to be self-supporting.
Bridgeport-Port Jefferson
The current Bridgeport-Port Jefferson service operates only 4 months out of the year. This service, which operates as ingle, side -loading, 3 5-vehic le vessel, provides a round trip every 4 h but carries no trucks. A through-
31
loading dis placement vessel and improved terminals could substantially reduce the operating costs of the service as well as reduce round-trip vessel time from 4 to 3 h.
The potential here is for a two-vessel operation carrying 50 000 vehicles/ year. Congestion on local streets in Port Jefferson may prevent the service from carrying trucks. Improvements would be needed to relieve this congestion if volumes greater than 50 000 vehicles/year were to be carried. The costs of such improvements are as follows:
Item
Vessels (2 at $1.375 million each) Terminal improvements
Total
Annual amortization (at 10 percent)
Cost ($000 000s)
2.8 0.5
3.3
0.33
A large portion of these costs could be financeu through reductions in the operating cost of the service and through increased revenues in response to improved service.
In addition to substantially improving current service, the following measures would also aid the states in establishing a much larger service at a later date.
1. Test the T-boat design in service to determine its near-term improvement costs and performance,
2. Test the market for improved ferry services to establish more points on the demand curve for ferry service.
3. Develop the market for improved ferry service.
Long-Term Improvements
Major services appear to be feasible at four sites: Bridgeport-Port Jefferson, East Haven-Wading River, Centerville-Guilford, and New London-Orient Point. Of the four, the Bridgeport-Port Jefferson and New London-Orient Point sites are the most attractive. The costs and benefits of services at the four sites are comparable. However, services at Bridgeport and New London could be developed in stages, whereas service at either of the other sites would require the commitment of $15 million in terminal facilities, including long piers out into the Sound, before the market for ferry service could be tested. If more than one major service were set up they would undoubtedly compete with each other. The actual volumes are best determined in practice. Based on our analysis the following combinations appear to be desirable and feasible.
Site
Bridgeport-Port Jefferson New London-Orient Point
New Haven-Wading River (or East Haven-Wading River
New London-Orient Point
Guilford-Centervi lie
New London-Orient Point
Annual Volume (000s)
500 200
500 200
;;,500
500
The decision on whether to invest in ferry service depends on the availability of funds and the competing uses for these funds. An investment in a viable, largescale ferry service is one whose value will grow through time, If the service covers its operating costs, the burden of fixed debt service payments should gradually diminish as revenues and other costs rise through inflation. In the meantime, the near-term recommendations made here can provide substantial improvements to current service at a relatively modest cost and also help to test and develop the market for a greatly expanded ferry service.

32
REFERENCES
1. A Comprehensive Transportation Study for Proposed Bridge Crossings. Creighton, Hamburg, Inc., and the New York State Department of Transportation, Dec. 1971.
2. Crossing the Sound: A Study of Improved Ferry Service on Long Island Sound. Tri-state Re-
gional Planning Commission, New York, Dec. 1974.
Publication of this paper sponsored by Committee on Application of Economic Analysis to Transportation Problems.
*Mr. Cohen was with the Tri-State Regional Planning Commission, New York, when this research was performed.
Significance of Benefit/Cost and Cost/Effectiveness Ratios 1n Analyses of Traffic Safety Programs and Projects G. A. Fleischer, Traffic Safety Center, University of Southern California, Los Angeles
This paper is a critique of NCH RP Report 162, Methods for Evaluating Highway Safety Improvements. Several important conceptual errors in that publication concerning the use of benefit/cost and cost/effectiveness ratios in evaluating traffic safety programs and projects are identified and discussed. Qualitative and quantitative arguments, as well as supporting numerical examples, are provided.
In the fall of 1971 the National Cooperative Highway Research Program (NCHRP) of the Transportation Research Board initiated a major research effort primarily funded by the American Association of State Highway Officials (AASHO). The principal objective of the study was to develop a set of guidelines detailing the methodology and techniques for evaluating the effectiveness of highway safety improvements in terms of reduced accidents. It was also expected that a methodology would be incorporated for evaluating these safety improvements by cost-benefit analysis.
The final report, NCHRP Report 162, is for the most part a well-written, useful document. But, in my view, its usefulness is markedly diminished by several serious conceptual errors concerning the proper application of benefit/ cost and cost/ effectiveness ratios.
FISCAL OBJECTIVES
The authors of NCHRP Report 162 point out that "the method of analysis chosen to select from among mutually exclusive improvements at a location depends upon the fiscal objective of the agency making the selection" (1, p. 8). They further assert that there are two fiscal objectives:
1. Optimum improvement, in which the goal is to obtain the most net benefit from each investment opportunity; and
2. Benefit maximization, in which the goal is to obtain the most net benefit from the funds budgeted.
After reference to an example listing of candidate projects (which will be discussed later in this paper),
the authors conclude: "The theoretically correct fiscal objective is the optimum improvement objective" (1, p. 9). This statement is not only puzzling; it is misleading. A false distinction is created that has no meaningful operational significance. For a given budget constraint, the agency's proper fiscal objective should be the maximization of net benefits from all investment opportunities. The optimum budget is that combination of investments-among sites, roadway designs, equipment, and so on-that maximizes net benefits. All subproblems at the design level can be accommodated under this rule.
BENEFIT/COST RATIOS
The NCHRP report discusses three methods for evaluating independent alternatives: (a) benefit/ cost (B/ C) ratio, (b) rate of return, and (c) payback period. Here, alternatives are independent if the selection of one alternative does not preclude the selection of any of the others.
The B/C ratio for a given project is defined in the usual way, as equal to either (a) the ratio of equivalent uniform annual benefits (EUAB) to equivalent uniform annual costs (EUAC), or (b) the ratio of the equivalent present worth of benefits (PWOB) to equivalent present worth of costs (PWOC). That is,
B/C = EUAB/EUAC = PWOB/PWOC (1)
The authors then assert that the B/C ratios should be used to rank independent alternatives: "Order the improvements by magnitude of the B/C Ratios, largest to smallest" (1, p. 42). An example of the basic data for this procedure, as well as calculations of the B/C ratios, is given in Table 1.
The authors conclude that "the order by magnitude for these independent alternatives is B, D, A, C" (1, p. 42). That conclusion is strictly correct, but the inference is unjustified. It is true that
B/C(B) > B/C(D) > B/C(A) > B/C(C) (2)
But it is not true that the economic preferences for these