improving equity in sweden
TRANSCRIPT

OECD EMPLOYER BRAND
Playbook
11
Improving equity
in Sweden
Andreas Schleicher
3 April 2017
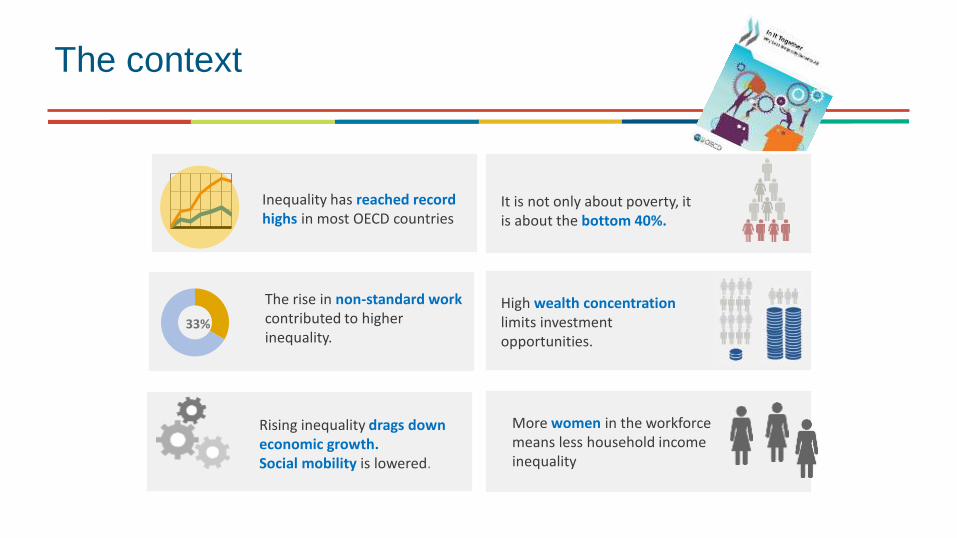
The context
The rise in non-standard workcontributed to higher inequality.
33%
It is not only about poverty, it is about the bottom 40%.
High wealth concentration limits investment opportunities.
Rising inequality drags down economic growth.Social mobility is lowered.
More women in the workforce means less household income inequality
Inequality has reached record highs in most OECD countries

Trends in science performance (PISA)
2006 2009 2012 2015
OECD
450
470
490
510
530
550
570
OECD average
Stu
de
nt
pe
rfo
rma
nc
e

Trends in science performance (PISA)
450
470
490
510
530
550
570
2006 2009 2012 2015
OECD average

SingaporeJapan
EstoniaChinese Tapei FinlandMacao (China)
CanadaViet Nam
Hong Kong (China)B-S-J-G (China) KoreaNew ZealandSlovenia
AustraliaUnited KingdomGermany
Netherlands
SwitzerlandIreland
Belgium DenmarkPolandPortugal NorwayUnited StatesAustriaFranceSweden
Czech Rep.Spain Latvia
RussiaLuxembourg Italy
Hungary LithuaniaCroatia IcelandIsraelMalta
Slovak Rep.
GreeceChile
Bulgaria
United Arab EmiratesUruguay
Romania
Moldova Turkey
Trinidad and Tobago ThailandCosta Rica QatarColombia MexicoMontenegroJordan
Indonesia BrazilPeru
Lebanon
Tunisia
FYROMKosovo
Algeria
Dominican Rep. (332)
350
400
450
500
550
Me
an
sc
ien
ce
pe
rfo
rma
nc
e
Hig
her
pe
rfo
man
ce
Science performance and equity in PISA (2015)
Some countries
combine excellence
with equity
High performance
High equity
Low performance
Low equity
Low performance
High equity
High performance
Low equity
More equity

Students expecting a career in scienceFigure I.3.2
0
5
10
15
20
25
30
35
40
45
50
Do
min
ican
Rep
. 1
2C
osta
Ric
a 1
1Jord
an
6
Un
ite
d A
rab E
m.
11
Me
xic
o
6C
olo
mbia
8Le
ban
on
15
Bra
zil
19
Peru
7Q
ata
r 19
Un
ite
d S
tate
s
13
Ch
ile 1
8T
un
isia
1
9C
anad
a 2
1S
loven
ia 1
6T
urk
ey 6
Austr
alia
1
5U
nite
d K
ing
dom
1
7M
ala
ysia
4
Kazakhsta
n
14
Spain
1
1N
orw
ay
21
Uru
guay 1
7S
ing
apo
re 1
4T
rin
ida
d a
nd T
. 13
Isra
el 2
5C
AB
A (
Arg
.)
19
Port
ug
al 18
Bulg
aria
2
5Ir
ela
nd
1
3K
osovo
7A
lge
ria
12
Ma
lta
1
1G
reece
12
Ne
w Z
eala
nd 2
4A
lba
nia
2
9E
sto
nia
1
5O
EC
D a
vera
ge 1
9B
elg
ium
1
6C
roa
tia
1
7F
YR
OM
2
0Lithu
ania
2
1Ic
ela
nd
2
2R
ussia
1
9H
KG
(C
hin
a)
2
0R
om
an
ia
20
Ita
ly 1
7A
ustr
ia
23
Mo
ldova
7La
tvia
1
9M
onte
neg
ro 1
8F
rance
21
Lu
xe
mbo
urg
1
8P
ola
nd
13
Ma
ca
o (
Ch
ina
) 10
Ch
ine
se
Taip
ei 2
1S
wede
n 2
1T
ha
iland
2
7V
iet
Nam
1
3S
witzerl
and
2
2K
ore
a
7
Hu
nga
ry 2
2S
lovak R
epub
lic
24
Japa
n 1
8F
inla
nd
24
Geo
rgia
2
7C
zech R
epu
blic
2
2B
-S-J
-G (
Chin
a)
31
Ne
therl
and
s
19
Germ
any 3
3In
don
esia
1
9D
enm
ark
4
8
%Percentage of students who expect to work in science-related professional and technical occupations when they are 30
Science-related technicians and associate professionals
Information and communication technology professionals
Health professionals
Science and engineering professionals
% o
f st
ud
ents
wit
hva
gu
e o
r m
issi
ng
exp
ecta
tio
ns

SingaporeCanadaSloveniaAustralia
United KingdomIreland
Portugal
Chinese TaipeiHong Kong (China)
New ZealandDenmark
JapanEstoniaFinland
Macao (China)Viet Nam
B-S-J-G (China)Korea
GermanyNetherlandsSwitzerland
BelgiumPoland
SwedenLithuaniaCroatiaIcelandGeorgiaMalta
United StatesSpainIsrael
United Arab Emirates
BrazilBulgaria
ChileColombiaCosta Rica
Dominican RepublicJordanKosovo
LebanonMexico
PeruQatar
Trinidad and TobagoTunisiaTurkey
Uruguay
Above-average science performance
Stronger than average beliefs in science
Above-average percentage of students expecting to work in a science-related occupation
Norway
Multip
le o
utc
om
es

0
10
20
30
40
50
300 400 500 600 700
Pe
rce
nta
ge
of
stu
de
nts
ex
pe
cti
ng
a
ca
ree
r in
sc
ien
ce
Score points in science
Low enjoyment of science
High enjoyment of science
Students expecting a career in scienceby performance and enjoyment of learning
Figure I.3.17

Inequity in opportunity
Outcomes
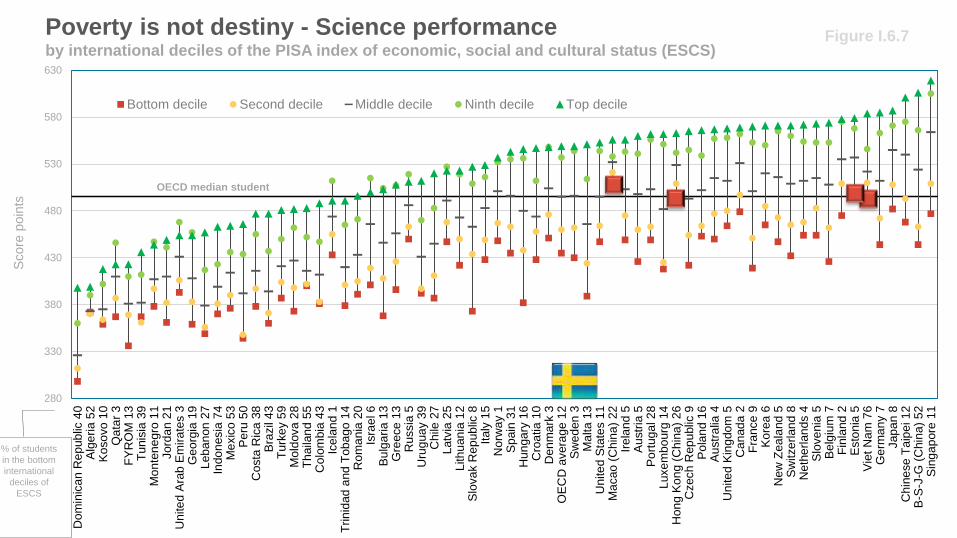
Poverty is not destiny - Science performanceby international deciles of the PISA index of economic, social and cultural status (ESCS)
280
330
380
430
480
530
580
630D
om
inic
an R
ep
ub
lic 4
0A
lge
ria 5
2K
oso
vo
10
Qa
tar
3F
YR
OM
13
Tu
nis
ia 3
9M
on
ten
eg
ro 1
1Jord
an 2
1U
nite
d A
rab
Em
ira
tes 3
Ge
org
ia 1
9L
eb
an
on
27
Indo
nesia
74
Me
xic
o 5
3P
eru
50
Co
sta
Ric
a 3
8B
razil
43
Tu
rke
y 5
9M
old
ova 2
8T
haila
nd
55
Co
lom
bia
43
Ice
lan
d 1
Trin
idad
and
Tob
ago
14
Ro
ma
nia
20
Isra
el 6
Bu
lga
ria
13
Gre
ece
13
Russia
5U
rug
ua
y 3
9C
hile
27
Latv
ia 2
5L
ith
uan
ia 1
2S
lova
k R
ep
ub
lic 8
Italy
15
Norw
ay 1
Sp
ain
31
Hun
ga
ry 1
6C
roa
tia
10
De
nm
ark
3O
EC
D a
vera
ge
12
Sw
ed
en
3M
alta 1
3U
nite
d S
tate
s 1
1M
acao
(C
hin
a)
22
Ire
lan
d 5
Au
str
ia 5
Po
rtug
al 2
8L
uxe
mb
ourg
14
Hon
g K
on
g (
Ch
ina
) 2
6C
zech
Rep
ublic
9P
ola
nd
16
Au
str
alia
4U
nite
d K
ing
do
m 5
Can
ad
a 2
Fra
nce 9
Ko
rea
6N
ew
Zea
land
5S
witze
rlan
d 8
Ne
the
rlan
ds 4
Slo
ve
nia
5B
elg
ium
7F
inla
nd
2E
sto
nia
5V
iet
Nam
76
Ge
rma
ny 7
Jap
an 8
Chin
ese
Ta
ipe
i 1
2B
-S-J
-G (
Chin
a)
52
Sin
ga
pore
11
Score
poin
ts
Bottom decile Second decile Middle decile Ninth decile Top decile
Figure I.6.7
% of students
in the bottom
international
deciles of
ESCS
OECD median student

300
350
400
450
500
550
600
650
700
-1 -0.5 0 0.5 1 1.5
PISA index of economic, social and cultural status
Public schools
Private schools
Relationship between school performance and schools’ socio-economic profile
Sco
re p
oin
ts

-100
-80
-60
-40
-20
0
20
40
60
Turk
ey
Sin
gapo
reV
iet
Nam
Japa
nT
un
isia
Ita
lyC
hin
ese
Taip
ei
Tha
iland
Gre
ece
Sw
itzerl
and
Czech R
epu
blic
Un
ite
d S
tate
sE
sto
nia
Uru
guay
Fra
nce
Austr
iaC
AB
A (
Arg
entina
)K
osovo
Me
xic
oH
ong K
on
g (
Chin
a)
Indon
esia
Lu
xe
mbo
urg
Sw
ede
nH
unga
ryM
alta
Do
min
ican
Rep
ublic
La
tvia
OE
CD
avera
ge
B-S
-J-G
(C
hin
a)
Port
ug
al
Slo
ven
iaS
pain
Un
ite
d K
ing
dom
Slo
vak R
epub
licN
orw
ay
Austr
alia
Cro
atia
De
nm
ark
Peru
Jord
an
Co
sta
Ric
aC
olo
mbia
Ch
ileN
eth
erl
and
sK
ore
aN
ew
Zeala
nd
Ca
nad
aLithu
ania
Irela
nd
Geo
rgia
Trin
ida
d a
nd T
obag
oF
YR
OM
Germ
any
Fin
land
Le
ban
on
Belg
ium
Pola
nd
Bra
zil
Un
ite
d A
rab E
mira
tes
Qata
r
Score
-poin
t diffe
rence
After accounting for socio-economic status Before accounting for socio-economic status
Public and private schools, and students’ science
performance
Figure II.4.14
Students in private schools perform better
Students in public schools perform better

Variation in science performance between and
within schools
Figure I.6.11
120
100
80
60
40
20
0
20
40
60
80
Ne
therl
and
s
114
B-S
-J-G
(C
hin
a)
119
Bulg
aria
1
15
Hu
nga
ry 1
04
Trin
ida
d a
nd T
obag
o 9
8B
elg
ium
1
12
Slo
ven
ia 1
01
Germ
any 1
10
Slo
vak R
epub
lic
10
9M
alta
1
54
Un
ite
d A
rab E
mira
tes 1
10
Austr
ia
10
6Is
rael 1
26
Le
ban
on
91
Czech R
epu
blic
1
01
Qata
r 10
9Japa
n 9
7S
witzerl
and
1
10
Sin
gapo
re 1
20
Ita
ly 9
3C
hin
ese
Taip
ei 1
11
Lu
xe
mbo
urg
1
12
Turk
ey 7
0B
razil
89
Cro
atia
8
9G
reece
94
Ch
ile 8
3Lithu
ania
9
2O
EC
D a
vera
ge 1
00
Uru
guay 8
4C
AB
A (
Arg
entina
)
82
Ro
man
ia
70
Vie
t N
am
6
5K
ore
a
10
1A
ustr
alia
1
17
Un
ite
d K
ing
dom
1
11
Peru
6
6C
olo
mbia
7
2T
ha
iland
6
9H
ong K
on
g (
Chin
a)
72
FY
RO
M 8
0P
ort
ug
al 94
Do
min
ican
Rep
ublic
5
9In
don
esia
5
2G
eo
rgia
9
2Jord
an
7
9N
ew
Zeala
nd 1
21
Un
ite
d S
tate
s
108
Mo
nte
neg
ro 8
1T
un
isia
4
7S
wede
n 1
17
Me
xic
o 5
7A
lba
nia
6
9K
osovo 5
7M
aca
o (
Ch
ina
) 74
Alg
eria
54
Esto
nia
8
8M
old
ova 8
3C
osta
Ric
a 5
5R
ussia
7
6C
anad
a 9
5P
ola
nd
92
De
nm
ark
9
1La
tvia
7
5Ir
ela
nd
8
8S
pain
8
6N
orw
ay
10
3F
inla
nd
103
Icela
nd
9
3
% Between-school variation Within-school variation
Total variation as a proportion
of the OECD average
OECD average 69%
OECD average 30%
6 percentage point rise since 2006
38% of between-school performance variation due to social
background (OECD 27%)

Declining overall performance between 2006 and 2012
Rising social inequality (biggest rise after Finland and Korea)
Growing share of low performers (+5.3%)
Rising between-school variation
Declining academic inclusion (-5.6) (biggest drop after Israel)
Some improvement in learning outcomes
since 2012

Inequity in opportunity
Resources

Spending per student from the age of 6 to 15 and
science performance
Figure II.6.2
Luxembourg
SwitzerlandNorwayAustria
Singapore
United States
United Kingdom
Malta
Sweden
Belgium
Iceland
Denmark
Finland
Netherlands
Canada
JapanSlovenia
Australia
Germany
IrelandFranceItaly
Portugal
New Zealand
Korea Spain
PolandIsrael
Estonia
Czech Rep.
LatviaSlovak Rep.
Russia
CroatiaLithuania
HungaryCosta Rica
Chinese Taipei
Chile
Brazil
Turkey
UruguayBulgaria
Mexico
Thailand MontenegroColombia
Dominican Republic
Peru
Georgia
11.7, 411
R² = 0.01
R² = 0.41
300
350
400
450
500
550
600
0 20 40 60 80 100 120 140 160 180 200
Scie
nce p
erf
orm
an
ce (
sco
re p
oin
ts)
Average spending per student from the age of 6 to 15 (in thousands USD, PPP)
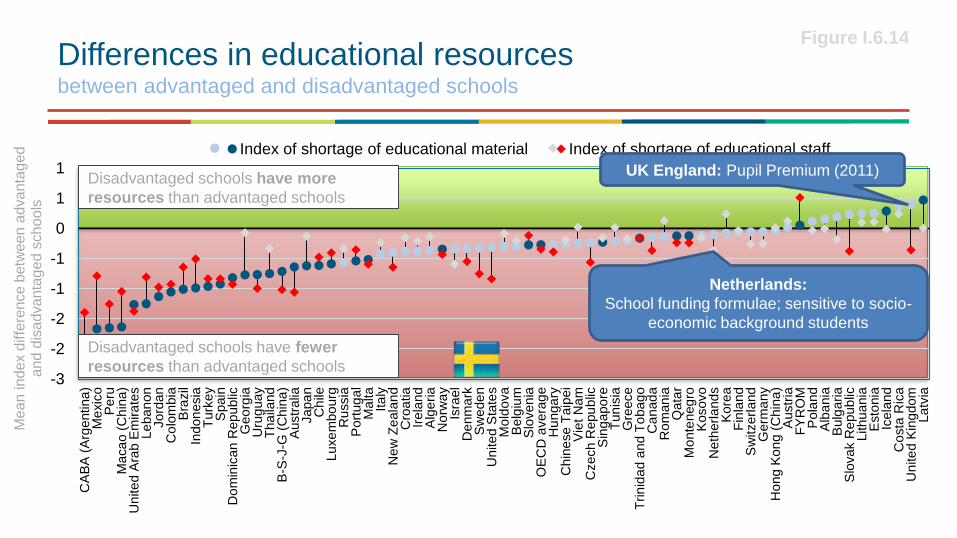
Differences in educational resourcesbetween advantaged and disadvantaged schools
Figure I.6.14
-3
-2
-2
-1
-1
0
1
1
CA
BA
(A
rgentina
)M
exic
oP
eru
Ma
ca
o (
Ch
ina
)U
nite
d A
rab E
mira
tes
Le
ban
on
Jord
an
Co
lom
bia
Bra
zil
Indon
esia
Turk
ey
Spain
Do
min
ican
Rep
ublic
Geo
rgia
Uru
guay
Tha
iland
B-S
-J-G
(C
hin
a)
Austr
alia
Japa
nC
hile
Lu
xe
mbo
urg
Ru
ssia
Port
ug
al
Ma
lta
Ita
lyN
ew
Zeala
nd
Cro
atia
Irela
nd
Alg
eria
No
rwa
yIs
rael
De
nm
ark
Sw
ede
nU
nite
d S
tate
sM
old
ova
Belg
ium
Slo
ven
iaO
EC
D a
vera
ge
Hu
nga
ryC
hin
ese
Taip
ei
Vie
t N
am
Czech R
epu
blic
Sin
gapo
reT
un
isia
Gre
ece
Trin
ida
d a
nd T
obag
oC
anad
aR
om
an
iaQ
ata
rM
onte
neg
roK
osovo
Ne
therl
and
sK
ore
aF
inla
nd
Sw
itzerl
and
Germ
any
Ho
ng K
on
g (
Chin
a)
Austr
iaF
YR
OM
Pola
nd
Alb
ania
Bulg
aria
Slo
vak R
epub
licLithu
ania
Esto
nia
Icela
nd
Co
sta
Ric
aU
nite
d K
ing
dom
La
tvia
Me
an
in
de
x d
iffe
ren
ce
betw
een
ad
va
nta
ge
d
and
dis
adva
nta
ge
d s
ch
oo
ls
Index of shortage of educational material Index of shortage of educational staff
Disadvantaged schools have more
resources than advantaged schools
Disadvantaged schools have fewer
resources than advantaged schools
UK England: Pupil Premium (2011)
Netherlands:
School funding formulae; sensitive to socio-
economic background students

-40
-30
-20
-10
0
10
Staff resistingchange
Teachersbeing toostrict withstudents
Teachers not meeting
individual students’
needs
Teacherabsenteeism
Teachers notbeing well
prepared forclasses
Student useof alcohol or illegal drugs
Studentsintimidatingor bullying
otherstudents
Studentsskippingclasses
Studenttruancy
Studentslacking
respect forteachers
Sco
re-p
oin
t d
iffe
ren
ce
After accounting for students' and schools' socio-economic profile
Before accounting for students' and schools' socio-economic profile
Student and teacher behaviour hindering learning
and science performance
Figure II.3.10

-20
0
20
40
60
80
100
-10
0
10
20
30
40
50
Un
ite
d A
rab E
mira
tes
CA
BA
(A
rgentina
)M
alta
Le
ban
on
Uru
guay
Do
min
ican
Rep
ublic
Jord
an
Me
xic
oQ
ata
rS
pain
Bra
zil
Peru
Co
lom
bia
Ch
ileS
ing
apo
reA
ustr
alia
B-S
-J-G
(C
hin
a)
Japa
nV
iet
Nam
Gre
ece
Isra
el
Geo
rgia
Trin
ida
d a
nd T
obag
oR
ussia
Ho
ng K
on
g (
Chin
a)
Irela
nd
Kosovo
De
nm
ark
FY
RO
MM
onte
neg
roF
rance
Port
ug
al
Austr
iaS
witzerl
and
Sw
ede
nO
EC
D a
vera
ge
Un
ite
d S
tate
sH
unga
ryB
elg
ium
Ne
therl
and
sM
aca
o (
Ch
ina
)K
ore
aF
inla
nd
Slo
ven
iaM
old
ova
La
tvia
Tha
iland
Slo
vak R
epub
licA
lge
ria
Ita
lyU
nite
d K
ing
dom
Germ
any
Tun
isia
Ca
nad
aLu
xe
mbo
urg
Turk
ey
Icela
nd
Indon
esia
Lithu
ania
Czech R
epu
blic
Esto
nia
Ne
w Z
eala
nd
Ro
man
iaB
ulg
aria
Cro
atia
Ch
ine
se
Taip
ei
Pola
nd
No
rwa
yC
osta
Ric
a
Perc
enta
ge-p
oin
t diffe
rence
%Percentage-point difference between advantaged and disadvantaged schools Index of school autonomy (%)
Index of school autonomy, by schools’ socio-economic status
Figure II.4.7
Advantaged schools have more school autonomy
Disadvantaged schools have more school autonomy

Challenges
15% migrant background > OECD 11.2%High concentration in disadvantaged schools (23%)
• Cannot explain decline in Sweden overall results. Policies in place: Swedish reception classes; additional $$; NAE programmes
Funding is unequal partly due to decentralisation.
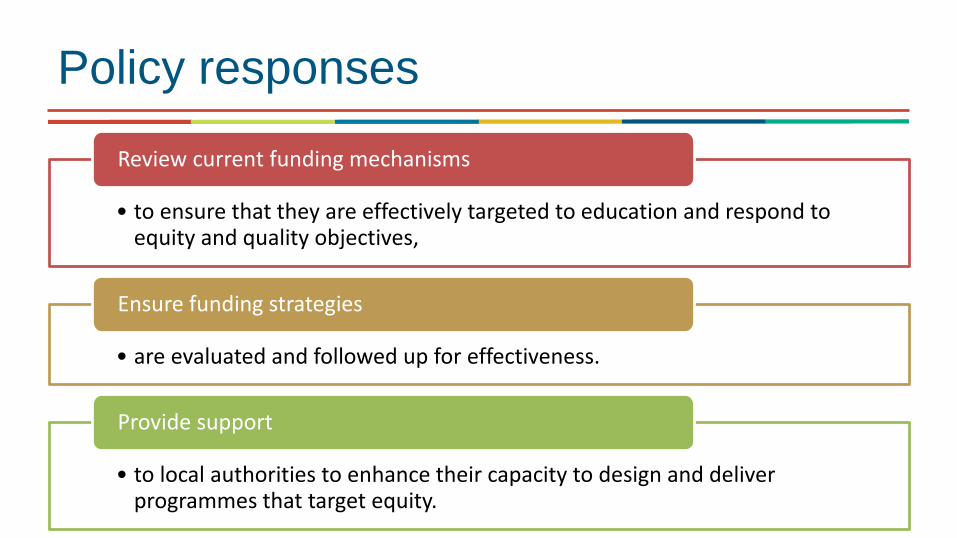
Policy responses
• to ensure that they are effectively targeted to education and respond to equity and quality objectives,
Review current funding mechanisms
• are evaluated and followed up for effectiveness.
Ensure funding strategies
• to local authorities to enhance their capacity to design and deliver programmes that target equity.
Provide support

• The type of mechanism used reflects the degree of budget autonomy given to the different administration levels and given policy priorities. Funding of school education can be :
– Specified for particular purposes [Earmarked grants] (e.g., teacher salaries, support for students with SEN, transportation to school)
– Weighted student funding schemes are based on two main elements: funding follows the student on a per-student basis and this amount depends on the social characteristics and educational needs of each student
– Discretion of lower levels of administration, as long as they are dedicated to specific cost types [Block grants and restricted block grants] (e.g., non-teacher staff salaries, operating costs)
– Discretion of lower levels of administration that decide how to allocate funds to other levels of administration/ schools [Lump sum transfer]
• Allocation mechanisms relying on transparent funding formulas can play a critical role in promoting greater efficiency and equity
Countries use a mix of various allocation mechanisms
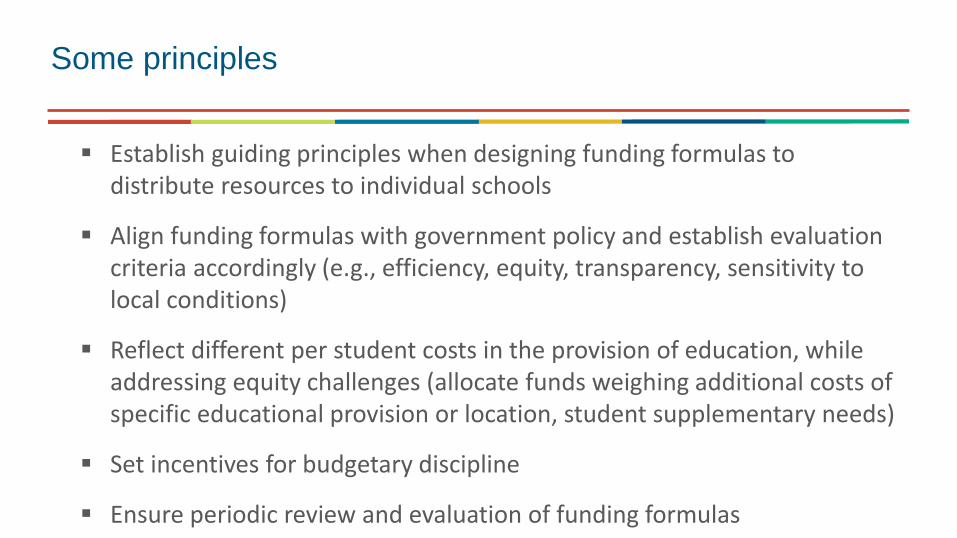
Establish guiding principles when designing funding formulas to distribute resources to individual schools
Align funding formulas with government policy and establish evaluation criteria accordingly (e.g., efficiency, equity, transparency, sensitivity to local conditions)
Reflect different per student costs in the provision of education, while addressing equity challenges (allocate funds weighing additional costs of specific educational provision or location, student supplementary needs)
Set incentives for budgetary discipline
Ensure periodic review and evaluation of funding formulas
Some principles
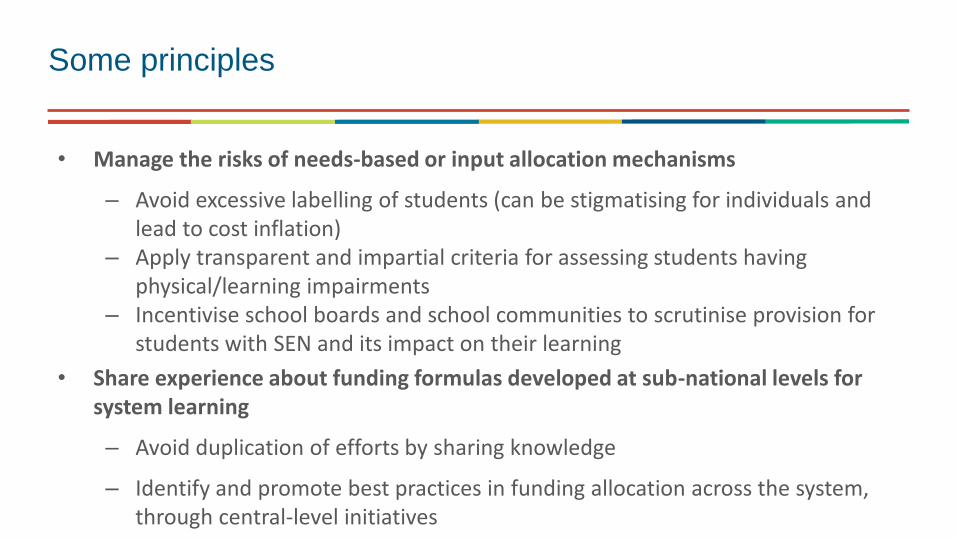
• Manage the risks of needs-based or input allocation mechanisms
– Avoid excessive labelling of students (can be stigmatising for individuals and lead to cost inflation)
– Apply transparent and impartial criteria for assessing students having physical/learning impairments
– Incentivise school boards and school communities to scrutinise provision for students with SEN and its impact on their learning
• Share experience about funding formulas developed at sub-national levels for system learning
– Avoid duplication of efforts by sharing knowledge
– Identify and promote best practices in funding allocation across the system, through central-level initiatives
Some principles

Inequity in opportunity
Policy and practice

Mean mathematics performance, by school location,
after accounting for socio-economic statusFig II.3.3
Australia
AustriaBelgium
Canada
Chile
Czech Rep.
DenmarkEstonia
Finland
GermanyGreece
Hungary
Iceland
Ireland
IsraelItaly
JapanKorea
Luxembourg
Mexico
Netherlands
New Zealand
Norway
Poland
Portugal
Slovak Rep.
Slovenia Spain
Sweden
Switzerland
Turkey
UK
USA
R² = 0.1735
30 40 50 60 70 80 90 100School competition
Mo
re
soci
al
incl
us
Less
so
cial
in
clu
sio
n
%
School competition and social inclusion, PISA 2012School choice and social inclusion

27
27 Square school choice with equity
Financial incentives
for schools
Assistance for disadvantaged
parents
Controlled choice
Financial incentives
Inform parents
Foster collaboration
among teachers and
schools
Use student and school
assessments

• Schools practicing selective admission tend to attract students with higher ability and socio-economic status, regardless of their educational quality
• Given that high-ability students are less costly to educate and can increase a school’s attractiveness to parents, controlling their intake can provide schools with a competitive advantage– Allowing private schools to select their students therefore provides
them with an incentive to compete on the basis of exclusiveness rather than their value added, which can undermine the dynamics of competition diminish the positive effects it may otherwise have on quality.
• Selective admission also a source of increased stratification.
Selective admission

• Student sorting occurs not only based on explicit admission criteria but also based on parental self-selection, selective expulsion and more subtle barriers to entry.
– Policies seeking to reduce segregation should therefore also identify and address overly complex application procedures, expulsion practices, information deficits and other factors that prevent some students from exercising school choice.
Selective admission

• Across 18 education systems where parents in PISA were asked why they choose a school parents were more likely to consider important or very important that:
– there is a safe school environment, that the school has a good reputation and that the school has an active and pleasant climate – even more so than the academic achievement of the students in the school.
Parental choice – outcomes often don’t come first

• Parents whose children attended disadvantaged schools considered distance more important– And children of parents who assigned more importance to
distance scored lower in PISA
• Students whose parents considered low expenses important scored worse – And in most countries the parents of children attending
disadvantaged and public schools were more likely to consider low expenses important
Parental choice – social background matters

Challenges for Sweden
Open school choice : first come first served. Growing segregation no better results.
Free schools not fully integrated in education planning.

37
Revise school-choice arrangements
• to ensure a more diverse distribution of students in schools.
Introduce controlled choice schemes
• To encourage a culture of collaboration and peer learning, consider defining national guidelines to ensure that municipalities integrate independent schools in their planning, improvement and support strategies.
National guidelilnes
• about schools and support them in making informed choices
Improve access to information

• As of 2009, 9 out of 22 OECD countries with available data facilitated the attendance of government-dependent private primary schools with vouchers.
– In five of these, the voucher programme was restricted to students with lower socio-economic background.
• At the lower secondary level, 11 out of 24 countries reported to operate voucher schemes,
– 7 of which targeted disadvantaged students.
Voucher policies

• Vouchers that are available for all students can help to expand the choice of schools available to parents and promote competition among schools.
• School vouchers that target only disadvantaged students can help improve equity in access to schools.
• PISA data show that, when comparing systems with similar levels of public funding for privately managed schools, the difference between the socio-economic profiles of publicly managed schools and privately managed schools is twice as large in education systems that use universal vouchers as in systems that use targeted vouchers
• Regulating private school pricing and admission criteria seem to have a positive impact on the ability of voucher schemes to go hand in hand with limited social inequity
Impact of voucher policies

Examples of systems with high levels of school choice
• Parents and students get to choose up to four schools from a list of schools in their geographical area.
• Inter-Network Enrolment Commission, steers the selection process, allocates students according to their priorities, and weighted geographical and educational criteria.
• Awards 80% of the places by the ranking, while ensuring that the remaining places are awarded to students from disadvantaged primary schools.
Flanders
•National Knowledge Centre for Mixed Schools produces knowledge & provides procedures for school choice and information to parents
•.In Nijmegen, central subscription system to assign students for primary schools, to reach 30% of disadvantaged students in each school. Primary schools have central subscription system, based on the distribution of students.
•In case of oversubscription, priority is given to siblings and proximity. To reach the required balance, subsequent priority is given to either advantaged or disadvantaged students by a lottery system.
Netherlands
•Government-dependent private schools cannot select students based on academic or socio-economic criteria until the end of primary education
•Complemented with a weighted voucher system, providing an extra per-student subsidy for disadvantaged students.
Chile

41
41 Thank you
Find out more about our work at www.oecd.org/edu– All publications
– The complete micro-level database
Discover PISA 2015 results by country www.compareyourcountry.org/pisa
Email: [email protected]
Twitter: SchleicherOECDand remember:

Student-teacher ratios and class sizeFigure II.6.14
CABA (Argentina)
Jordan
Viet Nam
Poland
United States
Chile
Denmark
Hungary
B-S-G-J(China)
Turkey
Georgia
ChineseTaipei
Mexico
Russia
Albania
Hong Kong(China)
Japan
Belgium
Algeria
Colombia
Peru
Macao(China)
Switzerland
Malta
Dominican Republic
Netherlands
Singapore
Brazil
Kosovo
Finland
Thailand
R² = 0.25
5
10
15
20
25
30
15 20 25 30 35 40 45 50
Stu
den
t-te
ach
er
rati
o
Class size in language of instruction
High student-teacher ratios
and small class sizes
Low student-teacher ratios
and large class sizes
OECD
average
OE
CD
ave
rage

Quality assurance and improvement actions at school:
evaluations
Figure II.4.27
20
30
40
50
60
70
80
90
100
Un
ite
d A
rab E
mira
tes
Tha
iland
Mo
nte
neg
roF
YR
OM
Ru
ssia
Sin
gapo
reR
om
an
iaP
ort
ug
al
Un
ite
d K
ing
dom
Qata
rN
ew
Zeala
nd
Alb
ania
Lu
xe
mbo
urg
La
tvia
Mo
ldova
Bulg
aria
Irela
nd
Ho
ng K
on
g (
Chin
a)
Icela
nd
Ch
ine
se
Taip
ei
Cro
atia
Pola
nd
Indon
esia
Esto
nia
Co
lom
bia
Ma
lta
Isra
el
Bra
zil
Kore
aB
elg
ium
Ne
therl
and
sU
nite
d S
tate
sK
osovo
Do
min
ican
Rep
ublic
Austr
alia
Lithu
ania
Jord
an
B-S
-J-G
(C
hin
a)
Turk
ey
Ma
ca
o (
Ch
ina
)C
hile
Japa
nH
unga
ryO
EC
D a
vera
ge
Trin
ida
d a
nd T
obag
oM
exic
oS
pain
Vie
t N
am
Germ
any
Geo
rgia
De
nm
ark
Peru
Tun
isia
Sw
itzerl
and
Sw
ede
nN
orw
ay
Ca
nad
aC
osta
Ric
aS
lovak R
epub
licC
zech R
epu
blic
CA
BA
(A
rgentina
)F
rance
Fin
land
Le
ban
on
Alg
eria
Slo
ven
iaU
rug
uay
Austr
iaIta
lyG
reece
% Internal evaluation/Self-evaluation External evaluation

Quality assurance and improvement actions
at school: Feedback from students and
teacher mentoring
Figure II.4.27
20
30
40
50
60
70
80
90
100
Sin
gapo
reR
ussia
Mo
nte
neg
roQ
ata
rIn
don
esia
Slo
vak R
epub
licT
ha
iland
Jord
an
Un
ite
d K
ing
dom
Peru
Esto
nia
Vie
t N
am
Austr
alia
Un
ite
d A
rab E
mira
tes
Ne
w Z
eala
nd
Alg
eria
Isra
el
Alb
ania
Un
ite
d S
tate
sM
old
ova
Czech R
epu
blic
B-S
-J-G
(C
hin
a)
Cro
atia
Kore
aF
YR
OM
Pola
nd
Kosovo
Ro
man
iaT
un
isia
Bra
zil
No
rwa
yM
aca
o (
Ch
ina
)M
alta
Ch
ine
se
Taip
ei
Ne
therl
and
sG
reece
Ca
nad
aC
AB
A (
Arg
entina
)P
ort
ug
al
Trin
ida
d a
nd T
obag
oIr
ela
nd
Ho
ng K
on
g (
Chin
a)
Japa
nLe
ban
on
Slo
ven
iaB
elg
ium
Hu
nga
ryLu
xe
mbo
urg
Do
min
ican
Rep
ublic
La
tvia
Sw
ede
nO
EC
D a
vera
ge
Co
lom
bia
Sw
itzerl
and
Austr
iaF
rance
Bulg
aria
Co
sta
Ric
aU
rug
uay
Fin
land
De
nm
ark
Turk
ey
Me
xic
oLithu
ania
Ch
ileG
eo
rgia
Spain
Germ
any
Ita
lyIc
ela
nd
%Teacher mentoring Seeking written feedback from students