improving clinical results via closed loop performance
TRANSCRIPT

Improving Clinical Results via Closed Loop Performance Management to Rise to Top 10% Percent Nationally
in Care Metrics
Joseph F. Scott, FACHE President and CEO of Jersey City Medical Center
RWJ Barnabas Health
April 29, 2016
Agenda
• Learning Objectives
• Introduction and Background on Jersey City
Medical Center/Barnabas Health• The Challenge• The Need for Automated Performance
Management• JCMC’s Closed-Loop Performance Management
Approach• Benefits Achieved
• Key Takeaways
Learning Objectives
• Identify opportunities for improvement that could
benefit from a standardized workflow approach across
the hospital
• Identify processes that define complex systematic
objectives and distill them down to concrete tactics and
accountability measures
• Describe the streamlined processes for collecting and
reporting real-time metrics and a closed loop process
for continuous improvement
About Jersey City Medical Center
• 330-bed acute-care hospital• Serves Hudson County, New Jersey• 15-acre campus• 16,000 admissions and 85,000 emergency room visits
annually
• Regional Trauma center
• Regional peri-natal intensive care
• Regional EMS communications and paramedic provider
• Comprehensive cardiac center
• Comprehensive behavioral health
• Orthopedic center of excellence
• Comprehensive ambulatory services
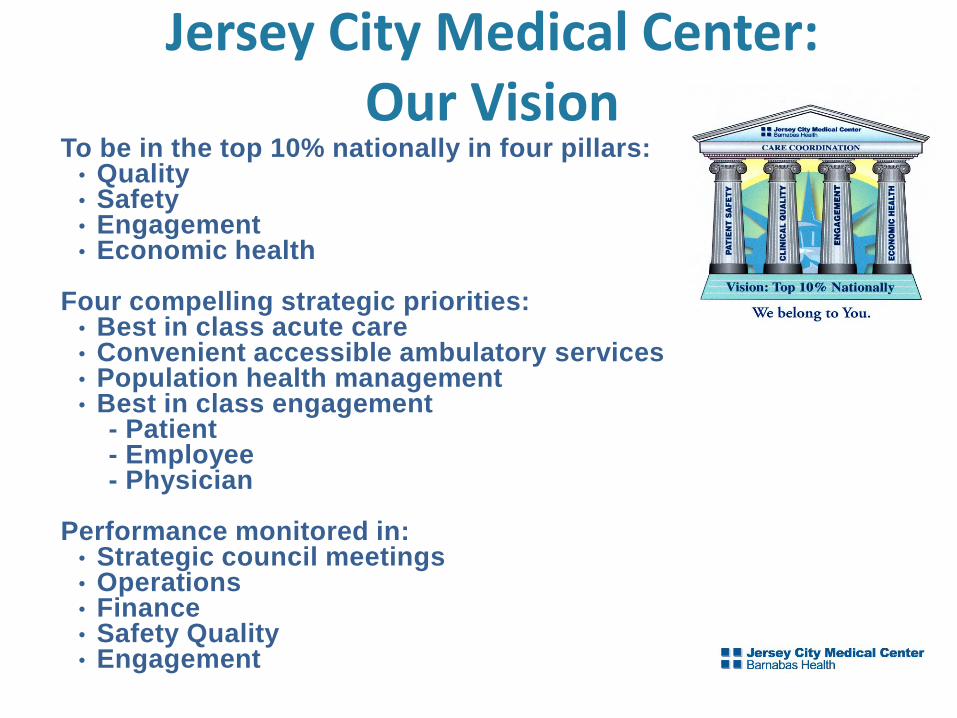
Jersey City Medical Center: Our Vision
To be in the top 10% nationally in four pillars:• Quality• Safety• Engagement• Economic health
Four compelling strategic priorities: • Best in class acute care• Convenient accessible ambulatory services• Population health management • Best in class engagement
- Patient- Employee- Physician
Performance monitored in:• Strategic council meetings• Operations• Finance• Safety Quality• Engagement
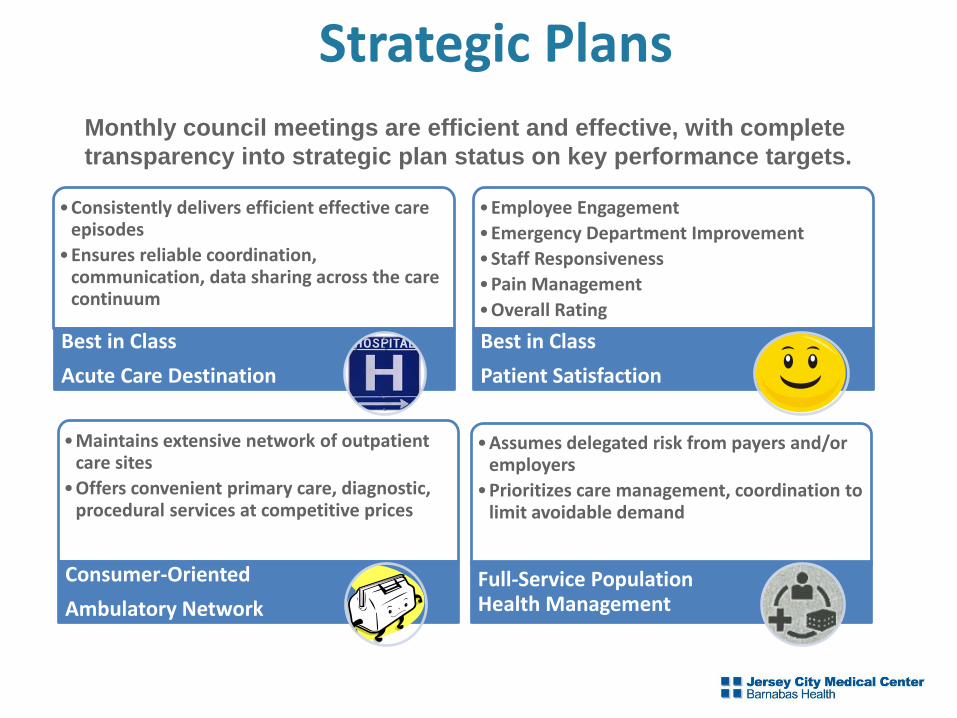
Strategic Plans
Monthly council meetings are efficient and effective, with complete
transparency into strategic plan status on key performance targets.
•Consistently delivers efficient effective care episodes
•Ensures reliable coordination, communication, data sharing across the care continuum
Best in Class
Acute Care Destination
•Employee Engagement
•Emergency Department Improvement
•Staff Responsiveness
•Pain Management
•Overall Rating
Best in Class
Patient Satisfaction
•Maintains extensive network of outpatient care sites
•Offers convenient primary care, diagnostic, procedural services at competitive prices
Consumer-Oriented
Ambulatory Network
•Assumes delegated risk from payers and/or employers
•Prioritizes care management, coordination to limit avoidable demand
Full-Service Population Health Management

The Challenge
Initially managed performance of strategic objectives on paper using manual reporting processes
Previous performance management software wasn’t as robust as needed
Challenges included:• Objectives difficult to define• Future achievement difficult to predict• Performance tracking nearly non-existent• Communication ineffective and inefficient• Difficult to determine tactics and assign
accountability
The Need for Automated Performance Management
“A recent survey of more than 400 global CEOs
found that ‘executional excellence’ was the
number ONE challenge facing corporate leaders
in Asia, Europe and the U.S., topping a list of
some 80 issues.”
- Harvard Business Review, March 2015
Source: “Why Strategy Execution Unravels – and What to do About It,” Harvard Business Review, March 2015
The New Healthcare Landscape Requires Increased Performance
Management Capabilities
Like no other industry, healthcare needs a systematic,
integrated approach to performance management.
Successful, high-performing healthcare organizations require:
• An enterprise-wide culture of agility, accountability, focus and
follow-through
• Automated and efficient planning, measurement and process
tracking at all levels, across all areas of the clinical and
business enterprise
• Alignment and management of all initiatives, resources and
key performance measurement indicators in one centralized
location
• Proactive tools like automated real-time notifications and
variance alerts

Choosing Performance Management: Jersey City
Medical Center’s NeedAn automated, efficient way to systematically define, track, manage and achieve strategic objectives.
Priorities included:• Communicate strategic objectives from the board to front-line staff• Define complex systematic objectives and distill them down to
concrete tactics and accountability measures• Enable managers to coach in the field rather than define tactics at
their desks• Focus on areas of opportunity and improvement

Implementing an Integrated Performance Management Solution

Reporting Capabilities
• Enterprise-Wide Goal Management and Execution Tracking
• Configurable, Three-Level “Drill Down” Execution Workflow
• Key Performance Indicators Linked to Objectives and Action Plans
• Integrated Action Planning & Leader Reported Progress Tracking
• Create Dynamic Scorecards for Each Facility & Department
• Action Plans Integrated into Scorecards to Address KPI Variances
• Filterable Dashboards with Multi-Level Performance Analysis
13
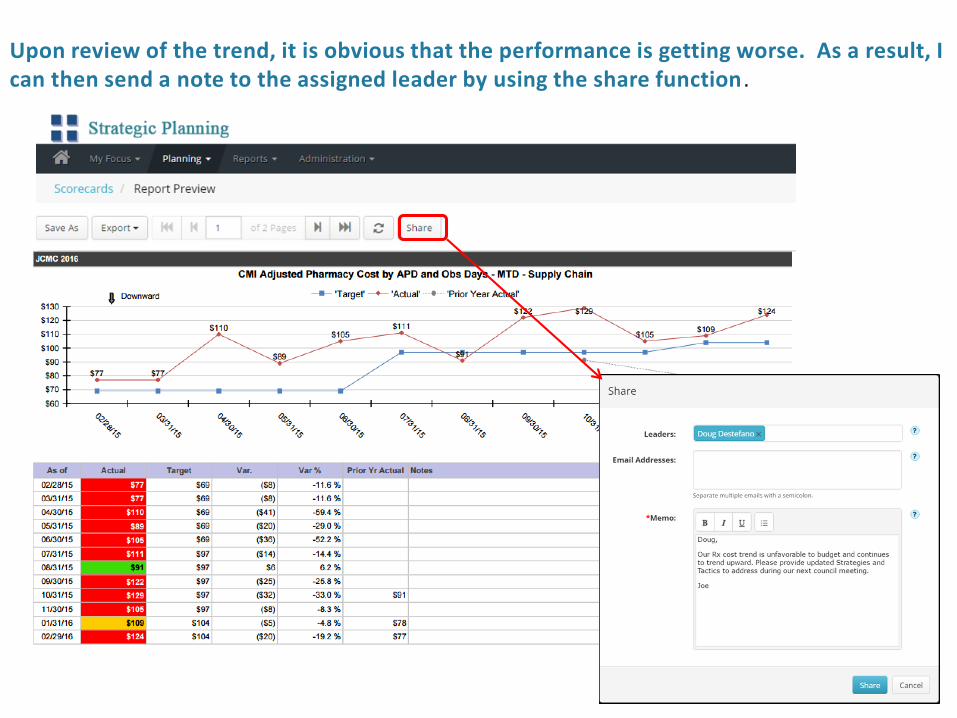
Upon review of the trend, it is obvious that the performance is getting worse. As a result, I can then send a note to the assigned leader by using the share function .
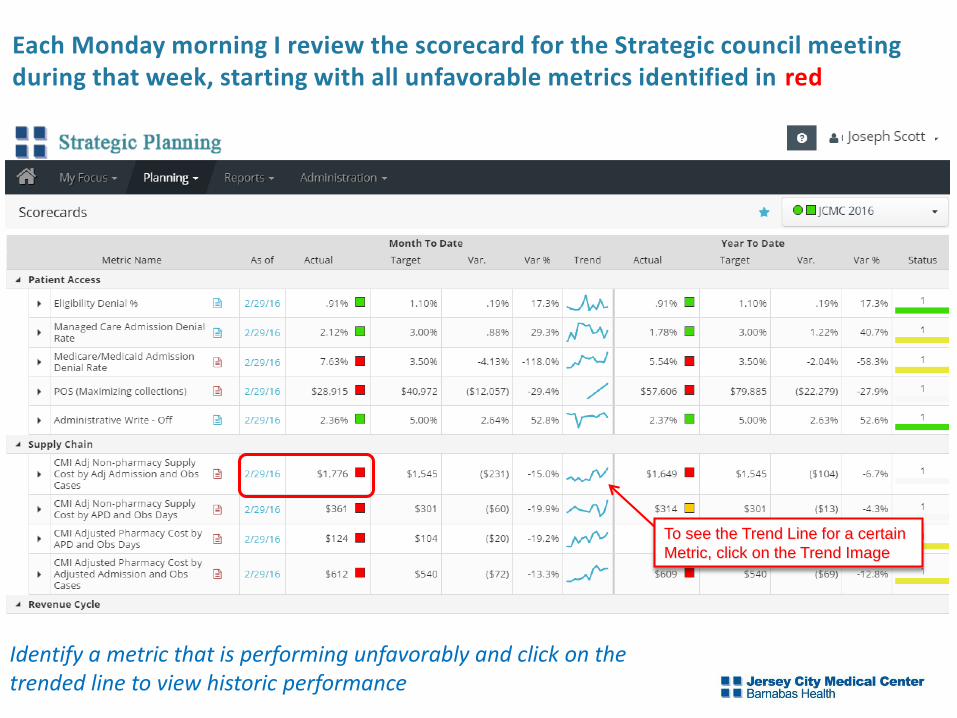
To see the Trend Line for a certain
Metric, click on the Trend Image
Identify a metric that is performing unfavorably and click on the trended line to view historic performance 14
Each Monday morning I review the scorecard for the Strategic council meeting during that week, starting with all unfavorable metrics identified in red
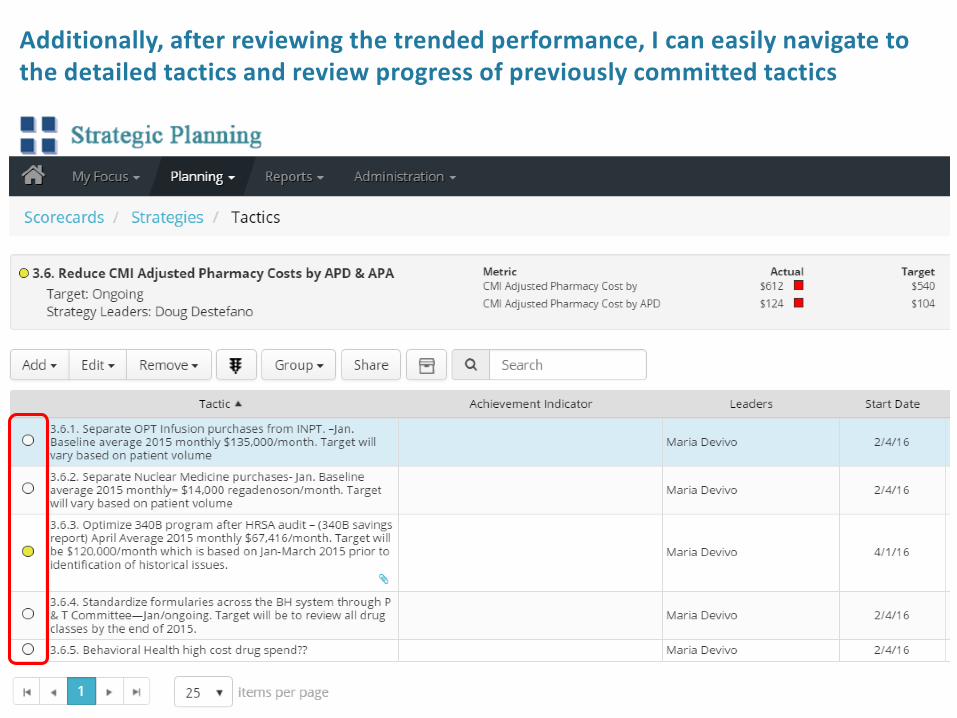
Additionally, after reviewing the trended performance, I can easily navigate to the detailed tactics and review progress of previously committed tactics
16
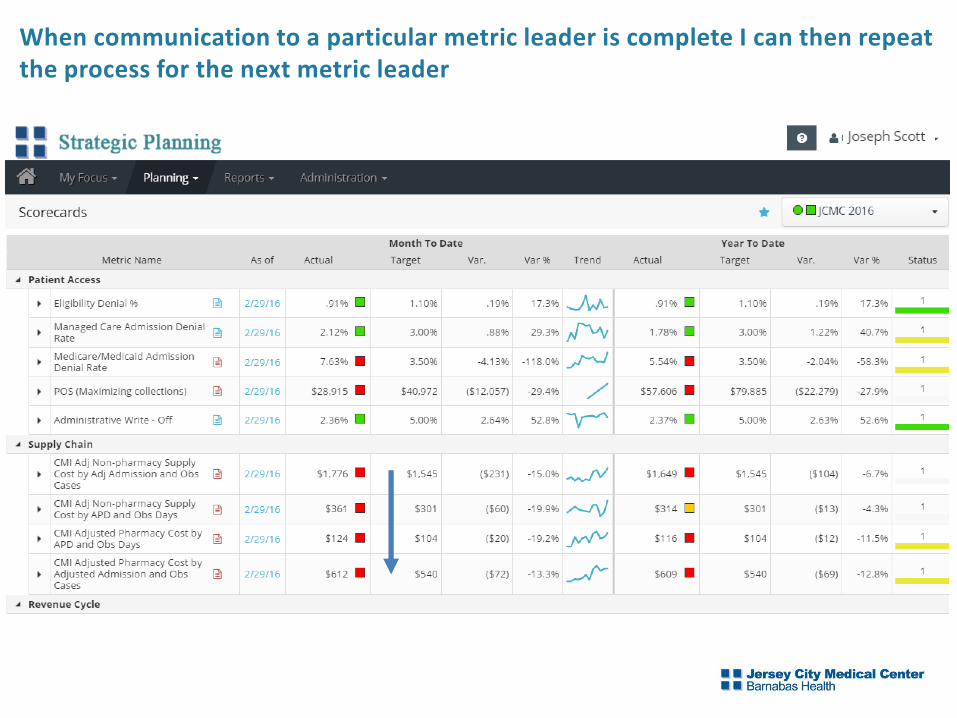
When communication to a particular metric leader is complete I can then repeat the process for the next metric leader
17
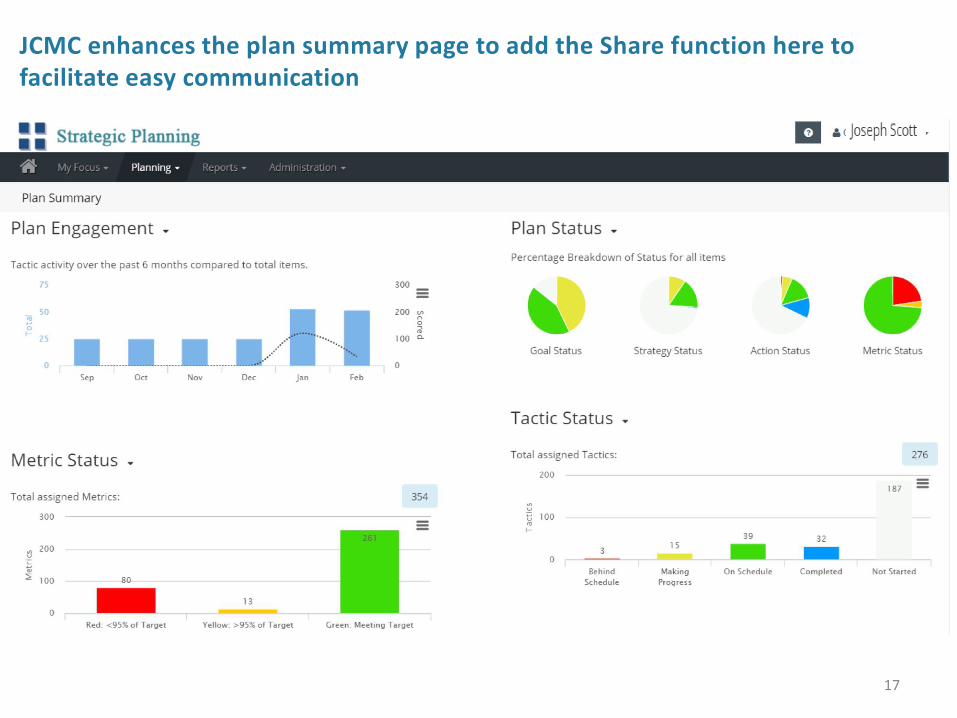
JCMC enhances the plan summary page to add the Share function here to facilitate easy communication
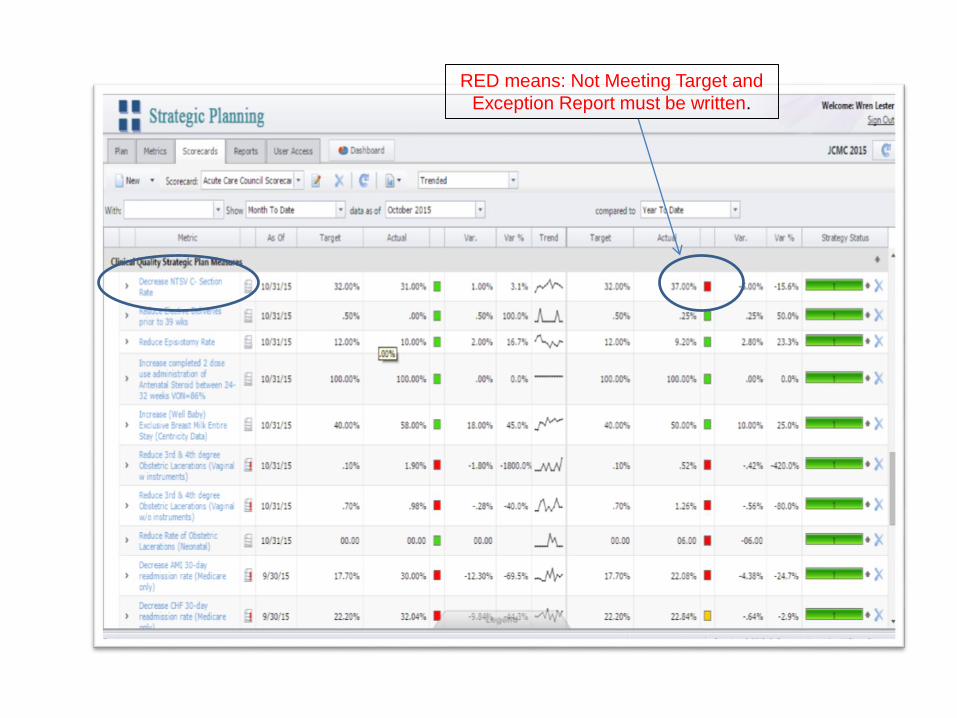
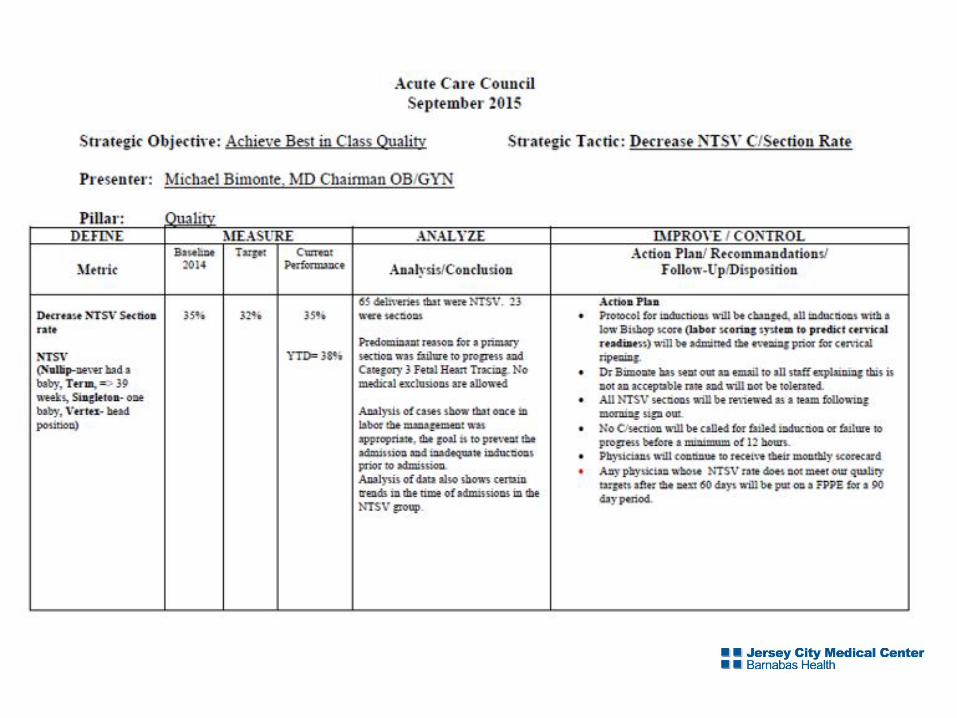
RED means: Not Meeting Target and
Exception Report must be written.

NTSV Trend Line

Clinical Quality: Trended Score Card 2015

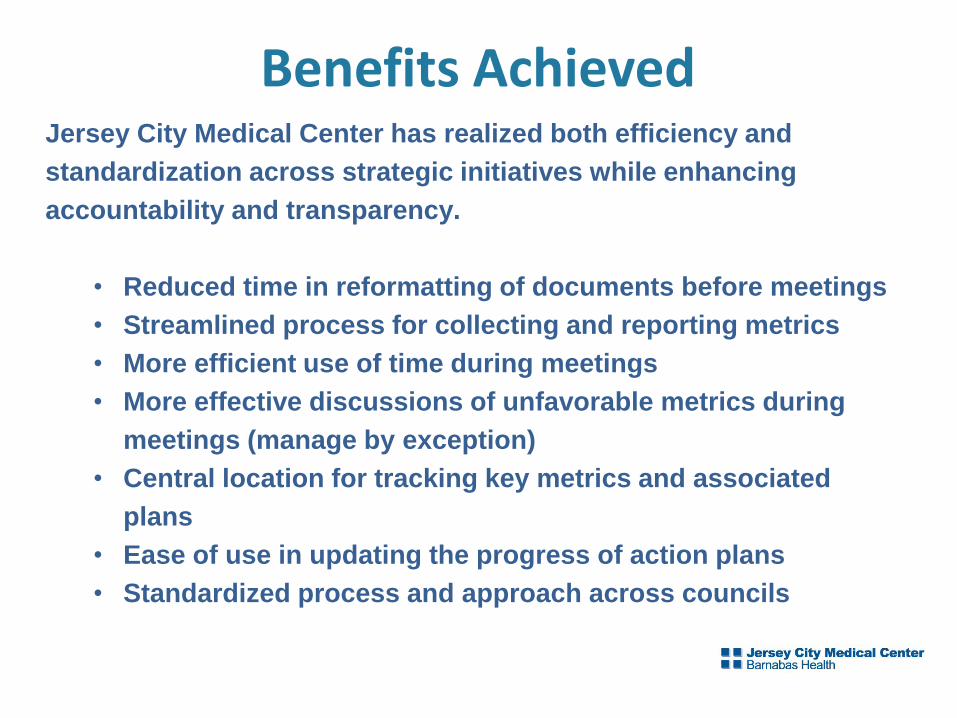
Benefits AchievedJersey City Medical Center has realized both efficiency and
standardization across strategic initiatives while enhancing
accountability and transparency.
• Reduced time in reformatting of documents before meetings
• Streamlined process for collecting and reporting metrics
• More efficient use of time during meetings
• More effective discussions of unfavorable metrics during
meetings (manage by exception)
• Central location for tracking key metrics and associated
plans
• Ease of use in updating the progress of action plans
• Standardized process and approach across councils
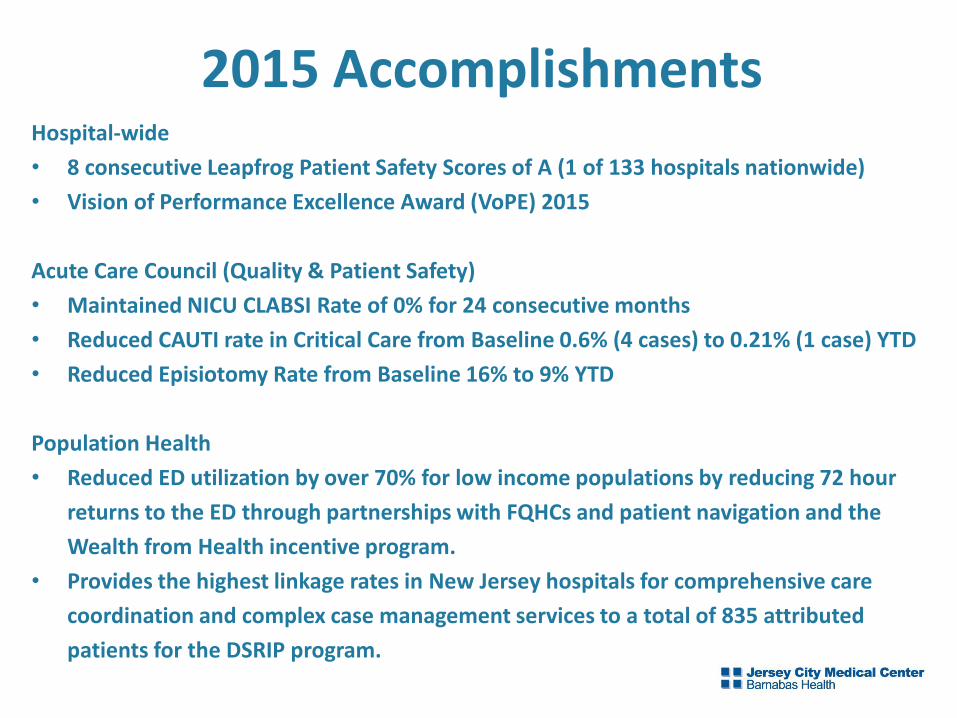
2015 AccomplishmentsHospital-wide
• 8 consecutive Leapfrog Patient Safety Scores of A (1 of 133 hospitals nationwide)
• Vision of Performance Excellence Award (VoPE) 2015
Acute Care Council (Quality & Patient Safety)
• Maintained NICU CLABSI Rate of 0% for 24 consecutive months
• Reduced CAUTI rate in Critical Care from Baseline 0.6% (4 cases) to 0.21% (1 case) YTD
• Reduced Episiotomy Rate from Baseline 16% to 9% YTD
Population Health
• Reduced ED utilization by over 70% for low income populations by reducing 72 hour
returns to the ED through partnerships with FQHCs and patient navigation and the
Wealth from Health incentive program.
• Provides the highest linkage rates in New Jersey hospitals for comprehensive care
coordination and complex case management services to a total of 835 attributed
patients for the DSRIP program.
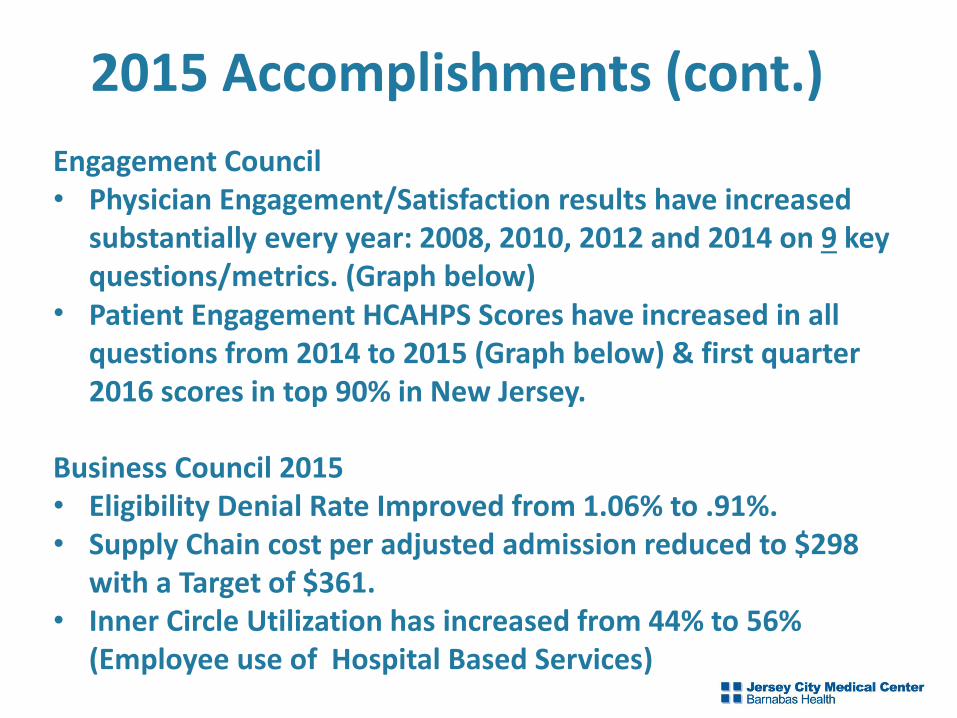
2015 Accomplishments (cont.)
Engagement Council• Physician Engagement/Satisfaction results have increased
substantially every year: 2008, 2010, 2012 and 2014 on 9 key questions/metrics. (Graph below)
• Patient Engagement HCAHPS Scores have increased in all questions from 2014 to 2015 (Graph below) & first quarter 2016 scores in top 90% in New Jersey.
Business Council 2015• Eligibility Denial Rate Improved from 1.06% to .91%.• Supply Chain cost per adjusted admission reduced to $298
with a Target of $361.• Inner Circle Utilization has increased from 44% to 56%
(Employee use of Hospital Based Services)
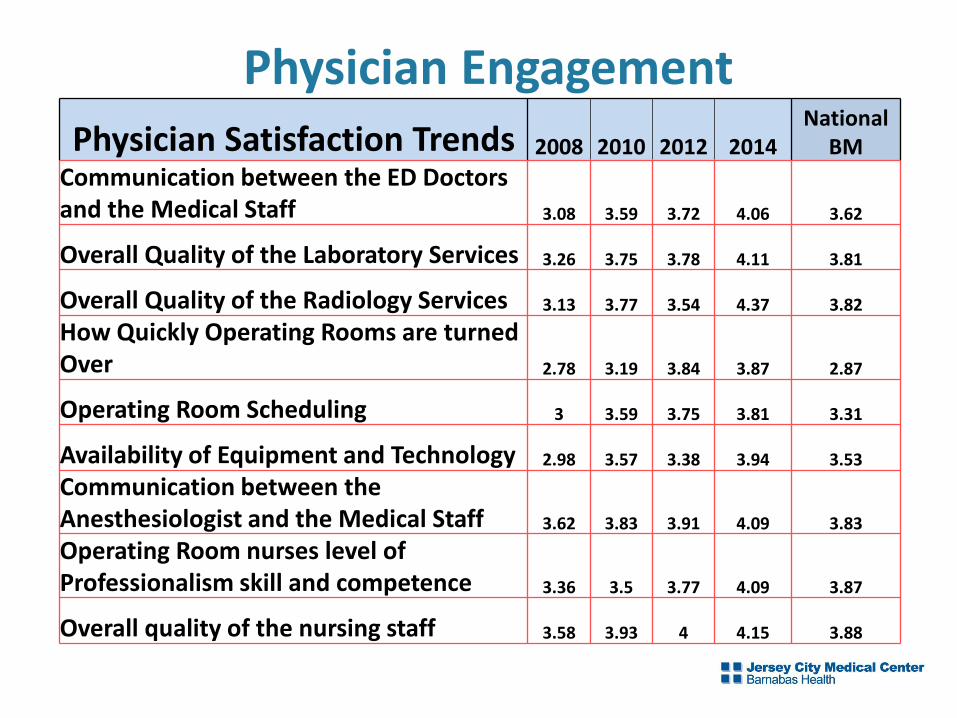
Physician Satisfaction Trends 2008 2010 2012 2014National
BM
Communication between the ED Doctors and the Medical Staff 3.08 3.59 3.72 4.06 3.62
Overall Quality of the Laboratory Services 3.26 3.75 3.78 4.11 3.81
Overall Quality of the Radiology Services 3.13 3.77 3.54 4.37 3.82
How Quickly Operating Rooms are turned Over 2.78 3.19 3.84 3.87 2.87
Operating Room Scheduling 3 3.59 3.75 3.81 3.31
Availability of Equipment and Technology 2.98 3.57 3.38 3.94 3.53
Communication between the Anesthesiologist and the Medical Staff 3.62 3.83 3.91 4.09 3.83
Operating Room nurses level of Professionalism skill and competence 3.36 3.5 3.77 4.09 3.87
Overall quality of the nursing staff 3.58 3.93 4 4.15 3.88
Physician Engagement

Key TakeawaysThe changing healthcare landscape requires automated and integrated operational tools to drive efficient and effective service delivery – better, faster, cheaper, smarter.
• Move beyond paper to real-time performance management• Automate planning, measurement and progress tracking• Define, plan and work toward achieving vision with greater
predictability, efficiency and effectiveness• Achieve lasting and meaningful results in key areas
Combining data, analytics and performance management creates a closed-loop solution that hard-wires focus, accountability, execution and improved performance on key objectives across the entire organization.
Questions
Joseph F. Scott, FACHEPresident and CEOJersey City Medical Center RWJBarnabas Health