improve the quality of healthcare in pennsylvania by...
TRANSCRIPT

Improve the quality of
healthcare in Pennsylvania
by collecting and analyzing
patient safety information,
developing solutions to
patient safety issues, and
sharing this information
through education and
collaboration.
Safe healthcare for all patients
Pennsylvania Patient Safety Authority Annual Report
2016 • April 28, 2017


i
Letter from the Board ChairDear Fellow Pennsylvanians:
The year 2016 proved to be a year of continuing improve-ment and transformation for the Pennsylvania Patient Safety Authority. Diligent efforts continued around data collec-tion and analysis, patient safety information dissemination, education and outreach, and collaborative partnerships. In addition, the agency embraced new leadership, employed innovative strategies, and developed its 2017–2020 strate-gic plan, which includes expanded outreach to patients and other sectors.
Pennsylvania healthcare facilities continued efforts to identify and report patient safety events. Acute healthcare facilities reported 255,714 events, a 7% increase over 2015. The Authority continues to observe an increase in the percentage of events reported as Incidents (events that do not harm the patient) rather than Serious Events (events that harm the patient). Further, the Authority received 218 reports of events that may have contributed to or resulted in a patient’s death, a 13.8% decrease from 2015. Notably in 2016, the Authority observed positive signs associated with efforts to standardize reporting implemented during 2015. With regard to nursing homes reporting healthcare-associated infections (HAIs), 2016 was the second calendar year for reporting using revised criteria. Nursing homes reported 27,544 HAI events, a 13% decrease from 2015.
In March 2016, the Authority bid farewell to Michael C. Doering, MBA, former executive director. We wish Mike well in his retirement, and appreciate his nine years of executive leadership that saw implementation of the patient safety liaison (PSL) program, HAI reporting, and other milestones in data analysis, publication, collaboration, and education and outreach initiatives.
Following Mike’s retirement, the Board of Directors welcomed Regina Hoffman, MBA, BSN, RN, CPPS, as executive director. Regina joined the Authority in 2012, most recently served as director of the PSL program, and possesses relevant and fresh perspective about the agency’s future. Under Regina’s leadership to date, the Authority has
invoked innovation strategies that foster ideas and concepts to address longstanding and emerging patient safety topics. In the Authority’s focus on innovation, it looks to strengthen existing services provided to healthcare facilities and culti-vate new viewpoints when facilities seek to address patient safety concerns.
In 2016, staff and directors developed the Authority’s third strategic plan. The 2017–2020 plan concentrates on four strategic pathways to focus on (1) improving diagnosis, (2) the patient, (3) long-term care, and (4) evaluating the reporting system. While foundational efforts have and will remain the priority, expanding outreach and education to patients and other sectors will prove beneficial for all patients.
In its past, present, and future, the Authority has been and projects to be effective and relevant in analyzing reports about patient safety events and disseminating, educat-ing, and collaborating about strategies to reduce patient harm. Through 2016, the Authority’s Pennsylvania Patient Safety Advisory has provided more than 540 patient-safety-focused articles, associated with nearly 50 educational toolkits, as well as credited with more than 4,650 process improvements by healthcare facilities. In 2016 alone, the Authority’s PSLs, infection prevention analysts, and patient safety analysts educated nearly 10,500 attendees of Authority patient safety programs and presentations. And success through 2016 in the Authority’s collaborative improvement projects on targeted interventions in health-care facilities has led to additional programs with Authority partners.
As chair of the Board of Directors, I look forward to our continuing work and new initiatives with Pennsylvania healthcare facilities and in the Authority’s vision of safe healthcare for all patients.
On behalf of the Board, I am pleased to submit this annual report for your review.
Rachel Levine, MD Physician General, Commonwealth of Pennsylvania Chair, Board of Directors Pennsylvania Patient Safety Authority

ii
Pennsylvania Patient Safety Authority
Board of DirectorsRachel Levine, MD, Chair Stanton N. Smullens, MD, Vice Chair Radheshyam Agrawal, MD Jan Boswinkel, MD John Bulger, DO, MBA Daniel Glunk, MD, MHCDS Arleen Kessler, PharmD, MBA, RPh Mary Ellen Mannix, MRPE Clifford Rieders, Esq. Linda Waddell, MSN, RN Eric Weitz, Esq.
StaffRegina Hoffman, MBA, BSN, RN, CPPS Executive Director
Michelle Bell, BSN, RN, FISMP, CPPS Director of Outreach and Education
Christina Hunt, MBA, MSN, RN, HCM, CPPS Director of Collaborative Programs
Howard Newstadt, JD, MBA, CGCIO Finance Director & CIO
Rebecca Jones, MBA, BSN, RN, CPHRM, CPPS Special Assistant to the Executive Director
JoAnn Adkins, BSN, RN, CIC Infection Prevention Analyst
Terri Roberts, BSN, RN, CIC Infection Prevention Analyst
Teresa Plesce Office Manager
Karen McKinnon-Lipsett Administrative Specialist
Shelly Mixell Executive Assistant
Megan Shetterly, MS, RN, CPPS Senior Patient Safety Liaison
Jeff Bomboy, BS, RN, CPPS Patient Safety Liaison
Kelly Gipson, BSN, RN, CPPS Patient Safety Liaison
Richard Kundravi, BS, CPPS Patient Safety Liaison
Christopher Mamrol, BSN, RN Patient Safety Liaison
Melanie Motts, M.Ed, BSN, RN, CPPS Patient Safety Liaison
Catherine Reynolds, DL, MJ, BSN, RN Patient Safety Liaison
Robert Yonash, RN, CPPS Patient Safety Liaison
Theresa V. Arnold, DPM Mgr., Clinical Analysis
Julia Barndt, MA Associate Editor (Advisory)
Sharon Bradley, RN, CIC Sr. Infect. Prev. Analyst
Phyllis Bray Database Administrator
John R. Clarke, MD Clinical Director Emeritus
James Davis, MSN, RN, CIC Sr. Infect. Prev. Analyst
Eloise DeHaan, ELS Copyeditor (Advisory)
Ellen Deutsch, MD, MS, CPPS Clinical Director, Editor (Advisory)
Michelle Feil, MSN, RN, CPPS Sr. Patient Safety Analyst
Edward Finley Data Analyst
Michael J. Gaunt, PharmD Sr. Medication Safety Analyst
Matthew Grissinger, RPh, FISMP, FASCP Mgr., Medication Safety Analysis
Shawn Kincaid System Developer
Ben Kramer System Administrator
Susan Lafferty Administrative Assistant
Donna Lockette Business Analyst
Mary C. Magee, MSN, RN, CPHQ, CPPS Sr. Patient Safety / Quality Analyst
William M. Marella, MBA, MMI Program Director
Christina Michalek, BSc Pharm, RPh, FASHP Sr. Medication Safety Analyst
Jesse Munn, MBA Operations Mgr., Managing Editor (Advisory)
Badal Sanghvi, MBA IT Manager
Carly Sterner System Developer
Dawn Thomas Communication Specialist
Susan C. Wallace, MPH, CPHRM Patient Safety Analyst

iii
Table of Contents
Executive Summary 1
Strategic Plan 5
Definitions 7
Overview of Data Reported through PA-PSRS 11
Reporting Standardization: Guidance for Acute Healthcare Reporting 39
Healthcare-Associated Infections 47
The Pennsylvania Patient Safety Advisory 69
Educational Programs 75
Collaborative Strategies to Improve Patient Safety 79
The Authority Celebrates Pennsylvania Healthcare Providers for Outstanding Patient Safety Efforts 88
Recommendations to the Department of Health 93
Anonymous Reports 94
Referrals to Licensure Boards 95
Fiscal Statements and Contracts 97
Board of Directors and Public Meetings 103


MISSION
Improve the quality of healthcare in Pennsylvania by collecting and analyzing patient safety information,
developing solutions to patient safety issues, and sharing this information through education and collaboration.
VISIONSafe healthcare for all patients.
Pennsylvania Patient Safety Authority 2016 Annual Report 1
Executive Summary
View Infographic online at www.patientsafetyauthority.org.
The Pennsylvania Patient Safety Authority recognizes the significant strides in patient safety improvement made by Pennsylvania healthcare facilities, as well as the important work that remains. In 2016, the Authority published a study of the effectiveness of data collection, data analysis, information dissemination, and statewide collaborative learning by the Authority and its partners to reduce health-care-associated patient harm in the Commonwealth. In the five measures selected for analysis, these core patient safety efforts led to an estimated 2,600 lives saved and $147 million saved since 2004.
The Authority, an independent state agency established under the Medical Care Availability and Reduction of Error (MCARE) Act1 of 2002, collects and analyzes data reported through its Pennsylvania Patient Safety Reporting System (PA-PSRS) and then provides strategies and lessons learned to healthcare facilities to improve safety and help prevent patient harm.
Under the MCARE Act, healthcare facilities must report Serious Events (events that harm the patient) and Incidents or “near misses” (events that do not harm the patient) to the Authority. Facilities must notify patients or their fami-lies when a Serious Event has occurred. The Pennsylvania Department of Health also receives Serious Event reports for its regulatory role.
The Authority initiated statewide mandatory reporting in June 2004. All reports are confidential and non-discover-able. In 2007, MCARE was amended (Act No. 2007-52: Reduction and Prevention of Health Care-Associated In-fection and Long-Term Care Nursing Facilities2) for nursing homes to report healthcare-associated infections (HAIs) as Serious Events to the Authority.
This executive summary highlights the Authority’s 2016 activities; specific details are included in the correspond-ing sections of the overall annual report.
A change in leadership occurred in 2016, as former ex-ecutive director Michael C. Doering retired. The Board of Directors named Regina M. Hoffman executive director in March 2016. The board and staff engaged in the Author-ity’s third strategic planning process, in which participants developed a mission statement, vision, and four strategic pathways of focus on (1) improving diagnosis, (2) the patient, (3) long-term care, and (4) evaluating the report-ing system. It is important to address these pathways while continuing the foundational efforts of data collection and analysis, information dissemination, education, and col-laborative learning.
The aforementioned analysis about the value of patient safety improvement efforts in Pennsylvania also discusses the decrease in high-harm events (i.e., Serious Events that result in permanent harm, near death, or death), a trend that continues in events reported during 2016. Acute

2016 Annual Report Pennsylvania Patient Safety Authority 2
healthcare facilities reported 255,714 events, with an increasing percentage of events reported as Incidents (n = 248,166), rather than Serious Events (n = 7,548). This brings the total number of events reported (2004 through 2016) to 2.76 million. The reporting category, Error relat-ed to Procedure/Treatment/Test, continues to be the most common category of Incident reports, and Complication of Procedure/Treatment/Test the most common category of Serious Events. Of Serious Events, facilities reported 218 events that may have contributed to or resulted in a patient’s death, a 13.8% decrease from 2015 as well as an overall decrease from 2005 through 2016.
Staff and board members, as well as participants from other agencies and organizations in the Commonwealth, engaged in efforts to improve consistency in acute health-care facility event reporting with standards effected in April 2015. In 2016, the Authority observed positive indicators associated with these standardization efforts, including improvement in Serious Event reporting, a near doubling of events reported under the new and revised event types and subtypes, and continued participation by reporting facilities in education about standardization principles.
Nursing homes reported 27,544 HAI events in 2016, a 13% decrease from the previous year. The year 2016 rep-resents the second full year of data since revised reporting criteria was implemented in 2014. Some highlights of 2016 event data include that catheter-associated urinary tract infections (CAUTIs) continue to be the predominant urinary tract infection by pooled infection rate, gastroin-testinal infection reports decreased (statistically significant) compared with such reports in 2015, and reports of influ-enza in Pennsylvania align with nationally reported data.
Events reported by Pennsylvania healthcare facilities, re-quests for information from Pennsylvania healthcare pro-viders, and review of the medical and patient safety litera-ture prompts analysis of the aggregate event reports. This leads to dissemination of analysis and guidance through the Authority’s journal, the Pennsylvania Patient Safety Advisory. From the first issue in March 2004 through December 2016, the Advisory has provided nearly 540 safety-focused articles and nearly 50 associated “toolkits” of assessment tools and education, available at www.patientsafetyauthority.org. To date, Pennsylvania health-care facilities credit the Advisory with contributing to more than 4,650 structure and process improvements. Top-ics addressed during 2016 include surgical procedures, medication-related events, infection prevention, maternity, leadership, patient/family involvement, and teamwork.
Of the Authority’s website traffic in 2016 (n = 1,563,044 hits) Advisory articles and toolkits comprised the majority, with 753,893 and 145,548 hits, respectively.
Staff—including patient safety liaisons (PSLs), patient safety analysts, infection prevention analysts, and phy-sicians—as well as patient safety and subject matter experts, use the Authority’s analysis, disseminated infor-mation, and additional research to educate healthcare providers about patient safety strategies. In 2016, educa-tional programs were associated with education of nearly 4,000 participants onsite at healthcare facilities, nearly 1,800 through regional/other presentations, nearly 4,000 through webinars, and nearly 800 through the Authority’s online education system. The Authority further enhanced its PSL outreach to reporting facilities with “Keystones” (i.e., targeted, topical outreach to facilities accompanied by consultative tools and resources).
In its work to reduce HAIs, the Authority’s infection prevention staff educated participants during activi-ties mentioned above. Staff researched and published educational and assessment tools (e.g., accompany-ing Advisory articles) to address reported HAI events; in feedback, hospital and nursing home representatives reported that these tools were highly useful in increasing staff knowledge and identifying specific areas of focus for prevention efforts. Furthermore, staff continued work with the Pennsylvania Department of Health, the Hospital and Healthsystem Association of Pennsylvania (HAP), and local health departments to help Pennsylvania acute healthcare facilities prepare for episodic biological threats by provid-ing consultation associated with site visits.
The Authority has long recognized the value of collabora-tive learning and continued its focus on such improve-ment efforts in 2016. Staff concluded work with HAP on Hospital Engagement Network (HEN) 2.0 immersion projects, addressing falls with harm and adverse drug events, as well as HAIs. Success in HEN 2.0 and during previous contracts led to the Authority again working with HAP, which was awarded a primary federal contract for the Hospital Improvement Innovation Network (HIIN) in September 2016. The Authority is leading HIIN projects addressing adverse drug events, falls, and culture of safety. The Authority is also co-leading a HIIN project with the Health Care Improvement Foundation to reduce emer-gency department radiologic diagnostic errors.
Finally, healthcare facilities again had the opportunity to showcase commitment to patient safety and reward the
Pennsylvania Patient Safety Authority 2016 Annual Report 3
people involved through the annual “I Am Patient Safety” contest. The Authority recognized 14 individuals or groups from nominations from Pennsylvania facilities, all of whom are featured in this annual report.
The Authority recognizes that Pennsylvania healthcare fa-cilities bear financial responsibility for costs associated with complying with mandatory reporting requirements. The Authority focuses on two fiscal goals: (1) to be prudent in the use of moneys contributed by the healthcare industry, and (2) to assure that healthcare facilities paying for PA-PSRS receive direct benefits from the system and Authority programs. The Authority’s FY 2016–2017 budget totals
$8.5 million, with approximately $7.2 million funding expenditures other than for HAI programs.
The Authority remains strongly committed to its founda-tional patient safety efforts, as evidenced by its continued attention to and enhancement of its data collection and analysis, information dissemination, education efforts, and collaborative learning outputs. Innovation is key to ongoing success, a critical concept for both the Author-ity’s foundational efforts and its forthcoming strategic pathways to enhance patient safety for all patients in the Commonwealth.
Notes
1. Medical Care Availability and Reduction of Error (MCARE) Act of March 20, 2002, P.L. 154, No. 13, Cl. 40. Avail-able: http://www.legis.state.pa.us/cfdocs/legis/li/ucons-Check.cfm?yr=2002&sessInd=0&act=13.
2. Medical Care Availability and Reduction of Error (MCARE) Act - Reduction and Prevention of Health Care-Asso-ciated Infection and Long-Term Care Nursing Facilities Act of July 20, 2007, P.L. 331, No. 52, Cl. 40. http://www.legis.state.pa.us/cfdocs/legis/li/uconsCheck.cfm?yr=2007&sessInd=0&act=52.


Pennsylvania Patient Safety Authority 2016 Annual Report 5
Strategic Plan
During 2016, the Pennsylvania Patient Safety Authority Board of Directors and staff engaged in a third strate-gic planning process. A contracted facilitator conducted research and stakeholder interviews. Research included summaries of current thinking in the field, the issue of patient safety in nonacute-care settings, and an overview of state adverse-event reporting systems.
Using a creative problem-solving process, the Authority conducted a daylong strategic planning meeting in Sep-tember 2016. The board and staff members participated in activities to develop a mission statement, vision, and strategic pathways. A strategic plan was drafted with the assistance of Authority board members and a representa-tive from the HAI Advisory Panel. The Authority developed key strategic pathways to enhance its foundational work
under the Medical Care Availability and Reduction of Error (MCARE) Act.1
The Authority continues to be committed to its key pro-grams. However, the Authority also believes that expand-ing its outreach to patients and other sectors will enhance patient safety for all patients in the Commonwealth. Providing education to patients will help them become informed and engaged participants in their healthcare. Expanding education and outreach to sectors that are part of the circle of care will help healthcare facilities achieve their patient safety goals for the populations they serve.
More information about the Authority’s 2017–2020 strategic plan is shown in the figure below.
Note
1. Medical Care Availability and Reduction of Error (MCARE) Act of March 20, 2002, P.L. 154, No 13 40. Available: http://www.legis.state.pa.us/cfdocs/legis/li/uconsCheck.cfm?yr=2002&sessInd=0&act=13

2016 Annual Report Pennsylvania Patient Safety Authority 6
Dataanalysis
Advisories/recommendations
Facility contact and consultation
Patient Safety Liaisons & Infection
Preventionists
Website Collaborative learning
Online and live education
Toolkits
FOCUS ONLONG-TERM CAREIdentify key topics
Expand educational offerings
Lead an infection preventioncollaborative
FOCUS ON EVALUATING THE REPORTING SYSTEMEvaluate scope of patient safety events captured via PA-PSRS
Identify opportunitiesto improve data capture
We will continue to provide these foundational services to
support our current and future work
FOCUS ONIMPROVINGDIAGNOSISAnalyze internal and external data to identify trends
Update PA-PSRS to improve data capture
Lead an ED radiology collaborative
Expand educational offerings
Include focus on ambulatory clinicsand practices
Strategic Plan 2017–2020VISION
Safe healthcare for all patients
MISSIONImprove the quality of healthcare in Pennsylvania by collecting and
analyzing patient safety information, developing solutions to patient safety
issues, and sharing this information through education and collaboration.
FOCUS ON THE PATIENTExpand inclusion of patient perspective
Identify key topics
Educate patients onsafe healthcare
Improve awarenessof and access to resources
Pennsylvania Patient Safety
Reporting System (PA-PSRS)

Pennsylvania Patient Safety Authority 2016 Annual Report 7
Definitions
Pennsylvania healthcare facilities are required to submit reports on the following four kinds of occurrences:
1. Serious Event. An adverse event resulting in patient harm. The legal definition from the Medical Care Availability and Reduction of Error (MCARE) Act:1 “An event, occurrence or situation involving the clini-cal care of a patient in a medical facility that results in death or compromises patient safety and results in an unanticipated injury requiring the delivery of additional health care services to the patient. The term does not include an incident.”
2. Incident. A “near miss,” in which the patient was not harmed. The legal definition from the MCARE Act:1 “An event, occurrence or situation involving the clinical care of a patient in a medical facility which could have injured the patient but did not either cause an unanticipated injury or require the delivery of additional health care services to the patient. The term does not include a serious event.”
3. Infrastructure Failure. A potential patient safety issue associated with the physical plant of a healthcare facility, the availability of clinical services, or criminal activity. The legal definition from the MCARE Act:1 “An undesirable or unintended event, occurrence or situation involving the infrastructure of a medical facility or the discontinuation or significant disrup-tion of a service which could seriously compromise patient safety.” Reports of Infrastructure Failures are submitted only to the state Department of Health and, therefore, are not addressed in this report.
4. Other. The U.S. Centers for Medicare and Medicaid Services (CMS) requires hospitals to report to the Department any death of patients in restraints or in seclusion or in which restraints or seclusion were used within 24 hours of death (other than soft wrist restraints). Deaths in which the restraints or seclu-sion are suspected of or confirmed as having played a role in the death should be reported as Serious Events. Other deaths in which the restraint or seclu-sion use was incidental or not suspected should be reported under this “Other” category.
Reports of Serious Events and Incidents are submitted to the Pennsylvania Patient Safety Authority for the purposes of learning how the healthcare system can be made safer in Pennsylvania. Reports of Serious Events and Infrastructure Failures are submitted to the Department so it can fulfill its role as a regulator of Pennsylvania healthcare facilities.
The MCARE Act requires the following types of facilities to submit reports of Serious Events, Incidents, and Infra-structure Failures to the Authority through the Pennsylvania Patient Safety Reporting System (PA-PSRS):
Hospitals. The Health Care Facilities Act2 defines a hos-pital as “an institution having an organized medical staff established for the purpose of providing to inpatients, by or under the supervision of physicians, diagnostic and therapeutic services for the care of persons who are in-jured, disabled, pregnant, diseased, sick or mentally ill or rehabilitation services for the rehabilitation of persons who are injured, disabled, pregnant, diseased, sick or men-tally ill. The term includes facilities for the diagnosis and treatment of disorders within the scope of specific medical specialties, but not facilities caring exclusively for the men-tally ill.” For this report, at the end of 2016, the Common-wealth of Pennsylvania had 238 qualifying hospitals.
Ambulatory surgical facilities. The Health Care Facilities Act2 defines an ambulatory surgical facility as “a facil-ity or portion thereof not located upon the premises of a hospital which provides specialty or multispecialty outpa-tient surgical treatment. Ambulatory surgical facility does not include individual or group practice offices of private physicians or dentists, unless such offices have a distinct part used solely for outpatient treatment on a regular and organized basis. …Outpatient surgical treatment means surgical treatment to patients who do not require hospital-ization but who require constant medical supervision fol-lowing the surgical procedure performed.” For this report, at the end of 2016, the Commonwealth of Pennsylvania had 309 qualifying ambulatory surgical facilities.
Birthing centers. The Health Care Facilities Act2 defines a birthing center as “a facility not part of a hospital which provides maternity care to childbearing families not requiring hospitalization. A birth[ing] center provides a home-like atmosphere for maternity care, including

2016 Annual Report Pennsylvania Patient Safety Authority 8
prenatal labor delivery and postpartum care related to medically uncomplicated pregnancies.” For this report, at the end of 2016, the Commonwealth of Pennsylvania had six qualifying birthing centers.
Abortion facilities. Act 30 of 20063 extended the report-ing requirements in the MCARE Act to abortion facilities that perform more than 100 procedures per year. For this report, at the end of 2016, the Commonwealth of Penn-sylvania had 19 qualifying abortion facilities.
Nursing homes. Act 52 of 20074 revised the MCARE Act to require nursing homes to report healthcare-associated infections (HAIs) to the Authority. Specifically, the act states that “the occurrence of a health care-associated infection in a health care facility shall be deemed a serious event as defined in section 302.”4 Reporting from these facilities be-gan in June 2009. For this report, at the end of 2016, the Commonwealth of Pennsylvania had 703 qualifying nursing homes. See the Healthcare-Associated Infections section of this report for data received from nursing homes.
Other pertinent definitions used in this report are as follows:
Medical error. This term is commonly used when discuss-ing patient safety, but it is not defined in the MCARE Act. The word “error” appears in PA-PSRS and in this report. For example, one category of reports discussed is “medi-cation errors.” The Institute of Medicine’s Committee on Data Standards for Patient Safety defines an error as the “failure of a planned action to be completed as intended (i.e., error of execution) or the use of a wrong plan to achieve an aim (i.e., error of planning)…. It also includes failure of an unplanned action that should have been completed (omission).”5
Within the MCARE Act, the term “medical error” is used in section 102: “Every effort must be made to reduce and eliminate medical errors by identifying problems and implementing solutions that promote patient safety.” It is also used in defining the scope of chapter 3, “Patient Safety”: “This chapter relates to the reduction of medical errors for the purpose of ensuring patient safety.”1
Adverse event. This term also appears in this report, al-though it is not defined in the MCARE Act. The Institute of Medicine Committee on Data Standards for Patient Safety defines an adverse event as follows: “An event that results in unintended harm to the patient by an act of commission or omission rather than by the underlying disease or con-dition of the patient.”5 The Authority considers this term to be broader than “medical error,” because some adverse
events may result from clinical care without necessarily involving an error.
Although PA-PSRS includes reports of events that result from errors, the Authority’s focus is on the broader scope of actual and potential adverse events—not only those that result from errors.
Patient safety officer. The MCARE Act requires each medical facility to designate a single individual to serve as that facility’s patient safety officer. Under the MCARE Act, the patient safety officer is responsible for submitting reports to the Authority. The MCARE Act also assigns other responsibilities to the patient safety officer.
Patient safety liaison. The patient safety liaison (PSL) is a unique resource to Pennsylvania MCARE facilities. Serv-ing as the face of the Authority, the PSL provides educa-tion and consultation to MCARE facilities and ensures that facilities are aware of the resources available to them through the Authority, such as educational toolkits, presentations, and webinars. The program has eight PSLs located regionally throughout Pennsylvania.
Analyst. The patient safety analyst (analyst) is a member of the Authority team of clinical professionals with degrees and experience in medicine, nursing, pharmacy, health administration, risk management, product engineering, and statistical analysis. The analyst reviews, aggregates, and investigates reports submitted through PA-PSRS. One example of an analyst is an infection prevention (IP) analyst, who tracks and trends reported HAIs. The IPs work closely with other agencies and groups (the Department, Association for Professionals in Infection Control and Epi-demiology [APIC]) to address HAI topics in Pennsylvania.
Reporting standardization. Twenty-eight guiding principles went into effect on April 1, 2015, to improve consistency in event reporting through PA-PSRS. The guidance was developed to help provide consistent standards to acute healthcare facilities in Pennsylvania in determining whether occurrences within facilities meet the statutory definitions of Serious Events, Incidents, and Infrastructure Failures as defined in section 302 of the MCARE Act.6 The Authority, the Department, and healthcare facility staff have worked together toward a shared understanding of the require-ments. The reporting guidelines were identified based on frequently asked questions (FAQs), controversies, and inconsistencies that were evident in the data collected by the Authority and the Department.

Pennsylvania Patient Safety Authority 2016 Annual Report 9
Notes
1. Medical Care Availability and Reduction of Error (MCARE) Act of March 20, 2002, P.L. 154, No 13 40. Available: http://www.legis.state.pa.us/cfdocs/legis/li/uconsCheck.cfm?yr=2002&sessInd=0&act=13.
2. Health Care Facilities Act of Jul. 19, 1979, P.L. 130, No. 48, Cl. 35 § 448.802a. Available: http://www.legis.state.pa.us/WU01/LI/LI/US/PDF/1979/0/0048..PDF.
3. Medical Care Availability And Reduction Of Error (MCARE) Act - Extending Patient Safety Standards To Certain Abor-tion Facilities Act of May 1, 2006, P.L. 103, No.30 Cl. 40. Available: http://www.legis.state.pa.us/cfdocs/legis/li/uconsCheck.cfm?yr=2006&sessInd=0&act=30.
4. Medical Care Availability and Reduction of Error (MCARE) Act - Reduction and Prevention of Health Care-Associated Infection and Long-Term Care Nursing Facilities Act of July 20, 2007, P.L. 331, No.52, Cl. 40. Available: http://www.legis.state.pa.us/cfdocs/legis/li/uconsCheck.cfm?yr=2007&sessInd=0&act=52.
5. Institute of Medicine Committee on Quality of Health Care in America. Kohn LT, Corrigan JM, Donaldson MS, editors. To err is human: building a safer health system. Wash-ington (DC): National Academy Press; 1999 Nov. 223 p. Also available: http://www.nationalacademies.org/hmd/Reports/1999/To-Err-is-Human-Building-A-Safer-Health-System.aspx.
6. Final guidance for acute healthcare facility determinations of reporting requirements under the Medical Care Avail-ability and Reduction of Error (MCARE) Act, 44 Pa. Bull. 6178 (2014 Sep 27). Also available: http://www.pabulle-tin.com/secure/data/vol44/44-39/2041.html.

Pennsylvania Patient Safety Authority 2016 Annual Report 11
Overview of Data Reported through PA-PSRS
IntroductionDuring 2016, more than a quarter million events were reported through the Pennsylvania Patient Safety Report-ing System (PA-PSRS), with an increasing percentage of reports submitted as Incidents, rather than Serious Events. The category Error related to Procedure/ Treatment/ Test continues to be the most common category of Incident reports, and Complication of Procedure/ Treatment/ Test the most common category of Serious Events.
In 2016, the Pennsylvania Patient Safety Authority published an analysis based on clinical outcomes and economic estimates for patient-safety measures in which concentrated improvement efforts have occurred.1 Mea-sures chosen for analysis included falls with harm, central line-associated bloodstream infection, catheter-associated urinary tract infection, wrong-site surgery, and high harm events. The intent was to estimate the value of data aggregation (e.g., through PA-PSRS), analysis, dissemi-nation, and statewide collaborative learning to reduce healthcare-associated patient harm in the Commonwealth during reporting periods of 11 to 12 years (e.g., inception of PA-PSRS reporting in 2004 through 2015). The Authority
estimated that more than 2,600 lives and more than $147 million were saved.
The analysis also discusses the decrease in high harm events numbers overall, including the following:
Given that the number of medical interactions is in-creasing, a plausible hypothesis for this decline in high harm events is that as improvements are realized in patient safety, the number and severity of harmful ad-verse events is decreasing. The Authority has seen an increase in the number of Incident (non-harm) events reported through PA-PSRS, and this is consistent with this hypothesis that there is a shift to earlier detection and reporting of events with fewer events reaching the patient and causing serious harm.1
As noted, this decline of high harm events continues to be evident through the 2016 reporting period, as well as the increasing percentage of reports describing Incidents. This annual report section explains the PA-PSRS reporting process and focuses on reported event data and evident reporting trends.
Pennsylvania Patient Safety Reporting System (PA-PSRS)PA-PSRS is a secure, web-based system that permits medical facilities to submit reports of “Serious Events” and “Incidents” involving patients, as defined by the Medical Care Availability and Reduction of Error (MCARE) Act.2 Statewide mandatory reporting through PA-PSRS went into effect June 28, 2004. All information submitted through PA-PSRS is confidential, and no information about individ-ual facilities is made public. The Department of Health can issue sanctions and penalties, including fines and forfeiture of license, to healthcare facilities that fail to comply.
As defined by the MCARE Act, PA-PSRS is a facility-based reporting system. Other complaint systems are available for individual citizens. Citizens can file complaints related
to hospitals and ambulatory surgical facilities by call-ing the Department of Health at 1-800-254-5164. The website to file complaints is http://www.health.pa.gov/facilities/Consumers/Complaints/Pages/default.aspx. Complaints against licensed medical professionals can be filed with the Department of State’s Bureau of Professional and Occupational Affairs at 1-800-822-2113.
Facilities submit event reports through a process identified in each facilities’ own patient safety plans, as required by the MCARE Act. However, the MCARE Act provides for one exception to this facility-based reporting requirement: a healthcare worker who feels that his or her facility has not complied with the MCARE Act reporting requirements

2016 Annual Report Pennsylvania Patient Safety Authority 12
may submit an Anonymous Report directly to the Authority (see Anonymous Reports).
Facility users can access PA-PSRS by means of a computer with Internet access and minimal, self-directed online training.* Patient safety liaisons assigned to each acute healthcare facility provide additional guidance, and an on-call Help Desk is available during business hours.
To report an event, facility users respond to 22 core ques-tions (e.g., check boxes, free-text narratives); the system directs to follow-up questions, based on the answers to previous questions. The process is similar for nursing homes, which began reporting healthcare-associated infections (HAIs) in June 2009, with the system posing 18 core and follow-up questions, depending on the type of infection reported.†
Facility users provide demographic information (such as a patient’s age and gender), the location within a facility
where the event took place, the type of event, and the lev-el of patient harm, if any. Patient and healthcare provider names are not solicited. Additionally, the report collects considerable detail about “contributing factors,” such as staffing, the workplace environment and management, the impact of health information technology (HIT), and clinical protocols. Users are also asked to identify the root causes of Serious Events and to suggest procedures that can be implemented to prevent a reoccurrence.
PA-PSRS was developed under contract with ECRI Institute, a Pennsylvania-based independent, nonprofit health ser-vices research agency, in partnership with Hewlett Packard Enterprise (HPE), a leading international, information tech-nology firm, and the Institute for Safe Medication Prac-tices (ISMP), also a Pennsylvania-based, nonprofit health research organization.
Analysis, Resources, and Feedback
The Authority team that analyzes reports includes profes-sionals with degrees and experience in medicine, nursing, pharmacy, health administration, risk and quality man-agement, product engineering, and statistical analysis. Additionally, through its contract staff, the Authority has access to a large pool of subject matter experts in virtually every medical specialty.
Based on this comprehensive analysis and augmented by review of healthcare literature and interviews with experts, the Authority develops and publishes articles and addi-tional resources through the Pennsylvania Patient Safety Advisory. The Advisory articles are directed primarily to healthcare professionals, for use by both clinical and ad-ministrative staff to improve processes and outcomes. The articles are often supplemented by toolkits, many of which are interactive, that may be used to clarify and standardize reporting practices as well as to assess and improve pa-tient care practices at the organizational, microsystem, or
individual patient-care level. More information about the Advisory and the data collected through PA-PSRS is cov-ered in The Pennsylvania Patient Safety Advisory section. Additionally, all issues of the Advisory are accessible on the Authority’s website at www.patientsafetyauthority.org.
The Authority has also developed analytical tools within PA-PSRS that are available to reporting facilities. These tools provide patient safety professionals, quality improve-ment specialists, and risk managers with detailed reports analyzing data related to their specific facilities in a timely manner. Many reports can be exported to other software programs for inclusion in facility publications or reports and presentations to trustees and senior management. Additionally, facility personnel have the ability to export all, or any portion, of their own facility’s data. Managers can use this information for their internal quality improve-ment and patient safety activities.
Interpreting PA-PSRS Data
Many factors influence the number of reports submitted by any particular facility, of which each facility’s safety and
quality are just two. Additional factors that affect reporting include facility size, case volume, services provided,
* Available to PA-PSRS users only; contact the Help Desk for more details. † HAIs from nursing homes are addressed under Healthcare-Associated Infections.

Pennsylvania Patient Safety Authority 2016 Annual Report 13
patient case mix, severity of illness, understanding of what occurrences are reportable, and success in detecting reportable occurrences.
The following factors should be considered when review-ing PA-PSRS data:
— Data presented in this report include only re-ports of Serious Events and Incidents. Although PA-PSRS also collects reports of Infrastructure Failures and reports that fall outside of these categorizations (Other), these reports are sub-mitted only to the Pennsylvania Department of Health. The Authority does not receive reports of Infrastructure Failures or Other (Figure 1).
— Unless specifically noted, data presented in this report are based on reports submitted through PA-PSRS between January 1, 2016, and Decem-ber 31, 2016. Data from acute-care facilities are presented in this section. HAI data from nursing homes are presented in Healthcare- Associated Infections.
— Unless specifically noted, numbers of reports in different categories are actual “raw numbers” and have not been adjusted for any facility- or patient-related factors that may influence differ-ences in report volume among different facilities.
— Unless specifically noted, historic data and trend span the years 2005 through 2016. These years are the twelve full calendar years of PA-PSRS data collection.
— The data are not adjusted to account for medical facility openings, closings, or changes of ownership.
Caution is advised when comparing data contained in this report with data published by other patient safety reporting systems. PA-PSRS was developed within the context of the MCARE Act, which has its own unique definitions for what is and what is not reportable through PA-PSRS.2 PA-PSRS also uses a specific taxonomy of event types that may be different from the lists used by other systems. PA-PSRS was the first mandatory state program collecting data on
“near misses”—unsafe conditions and events that did not harm patients.3 After more than a dozen years of data collection, it is widely considered the most comprehensive program of this type in the United States.
Many factors influence differences between data obtained from different facilities. The most valuable comparisons are those made by individual healthcare facilities, as they monitor their own performance over time and in relation to specific patient safety goals relevant to their healthcare setting.
Finally, overarching explanations of why certain event types predominate in aggregate data are complex, especially because each event type may relate to numer-ous and diverse clinical situations. The Authority identi-fies and approaches themes from the annual report and specific topics from the event reports (i.e., that have the potential for generalizable learning and improvement to patient safety) based on their frequency, severity, interest to clinicians, or other relevance. Subsequently, the Authority develops information and opportunities for improvement, and disseminates said information to healthcare facilities in Pennsylvania and other consumers through its Advisory, education and collaboration focuses, and other outreach activities (see the respective sections of this report for specific examples).
MS17
211
Healthcarefacilities
Other
Incidents
SeriousEvents
InfrastructureFailures
Figure 1. Submission of PA-PSRS Reports

2016 Annual Report Pennsylvania Patient Safety Authority 14
Report Volume
Reports by Month and Submission Type
Between January 1 and December 31, 2016, Pennsyl-vania acute care facilities submitted 255,714 reports through PA-PSRS, bringing the total number of reports submitted since the program’s inception to 2,765,059. Figure 2 shows the distribution of submitted reports by month for calendar year 2016. For the year, 7,548 Seri-ous Events and 248,166 Incidents were reported.
Of reports submitted in 2016, 3% were Serious Events, while 97% were Incidents. In 2016, the Authority received an average of 21,310 reports per month. This total breaks down to an average of 20,681 Incident reports and 629 Serious Event reports per month.
Reports by Facility Type
As shown in Table 1, the total number of reports submitted through PA-PSRS in 2016 surpassed a quarter million. The vast majority of all reports (87.5%) were submitted by hos-pitals. Among acute-level facilities (non-nursing homes),
the predominance of reports from hospitals is even more pronounced (96.9%). Nursing homes submitted 9.7% of the overall total number of reports in 2016.
NUMBER OF REPORTS
MS17
212
Aug
Sep
Oct
Jan
Feb
Mar Apr
May Jun
Jul
Nov
Dec
0
5,000
10,000
15,000
20,000
25,000
Serious events Incidents
578
18,825
661
19,166
680
22,830
644
20,405
649
20,290
645
21,804
582
19,286
670
21,411
599
19,918
637
20,767
584
20,989
619
22,375
MONTH
Figure 2. Number of Reports Submitted through PA-PSRS in 2016, Acute-Care Facilities
Table 1. Reports through PA-PSRS by Facility Type (2016)
FACILITY TYPE
HOSPITALS
AMBULATORY SURGICAL FACILITIES
BIRTHING CENTERS/ ABORTION FACILITIES
ALL ACUTE LEVEL FACILITIES
NURSING HOMES (HAI ONLY)
ALL FACILITIES REPORTING VIA PA-PSRS
Number of reports submitted 247,763 7,672 279 255,714 27,544 283,258
Number of facilities active as of December 31, 2016 238 308 25 571 703 1,274

Pennsylvania Patient Safety Authority 2016 Annual Report 15
Note: Control charts generated using QIMacros® 2016 (KnowWare International, Inc., Denver, CO), based on Six Sigma principles and Healthcare IHI rules (information available at https://www.qimacros.com/pdf/qiuser.pdf).
Figure 3. Number and Percentages of Reports by Acute Facility Types, 2005 through 2016
MS17
279
YEAR (BY QUARTER)
NUMBER OF SUBMITTED REPORTS
2006 2007 2008 2009 2010 2011 2012 2013 2014 2015 20162005
0
500
1,000
1,500
2,000
2,500
2006 2007 2008 2009 2010 2011 2012 2013 2014 2015 20162005
1,977.8
1,804.7
1,631.6
NUMBER OF SUBMITTED REPORTS BY AMBULATORY FACILITIES
Upper control limit
Lower control limit
Center line
YEAR
Common cause variation Special cause variation
562.3
389.1216
0
50,000
100,000
150,000
200,000
250,000
300,000
1.2%1.3%
1.4%1.3% 1.6% 2.1%1.7% 2.2% 2.5%2.1% 2.9% 3.1%
98.8%98.7%
98.6%98.7% 98.4% 97.9%98.3% 97.8% 97.5%97.9% 97.1% 96.9%
Ambulatory facilitiesHospitals
YEAR (BY QUARTER)
0
50
100
150
200
250
2006 2007 2008 2009 2010 2011 2012 2013 2014 2015 20162005
212.6
65.1
RANGE
Upper control limit
Lower control limit
Center line
YEAR (BY QUARTER)
010,00020,00030,00040,00050,00060,00070,00080,000
2006 2007 2008 2009 2010 2011 2012 2013 2014 2015 20162005
72,122.5
62,495.7Upper control limit
Lower control limit
Center line
YEAR (BY QUARTER)
0
2,000
4,000
6,000
8,000
10,000
12,000
2006 2007 2008 2009 2010 2011 2012 2013 2014 2015 20162005
11,823.6
3,619.1
RANGEUpper control limit
Lower control limit
Center line
52,289.0
NUMBER OF SUBMITTED REPORTS BY HOSPITALS
56,808.3
47,181.537,554.8

2016 Annual Report Pennsylvania Patient Safety Authority 16
The remainder of this data section will focus on acute-care facilities; data from nursing homes are presented in Health-care-Associated Infections.
Figure 3 shows the increasing percentage of report submis-sions from nonhospital acute-level facilities—ambulatory surgical facilities, birthing centers, and abortion facilities (ASFs/BCs/ABFs)—compared with hospital reports from 2005 to 2016. The figure contains trended control charts of quarterly report submissions from both ambulatory facilities and hospitals. Although both groups experienced increased reporting in general, the percentage from ambulatory facili-ties is increasing more quickly, by comparison. Notice that both reporting patterns appear to be stable, exhibiting com-mon cause variation from quarter to quarter.
Report Submission Trends
The trend line superimposed over the number of monthly reports in Figure 4 indicates that the volume of reports is growing at a modest rate and that reporting has had a stable increase in recent years.
Control Charts Evaluate Process Stability over TimeHow does one know whether variation in data from a process or system is expected or erratic? Control charts are used as a way to visually monitor a process for stability.1 When a process is stable, or in control, some variation is expected and is referred to as common cause variation. When the process is unstable, the chart will show out-of-range fluctuation, known as special cause or nonrandom variation.
Control charts contain these key elements:
• A line chart of data measuring the process over time.
• A center line (CL) calculated as the average or median of the data.
• An upper control limit (UCL) line cal-culated at 3 sigma above the center line.
• A lower control limit (LCL) line calcu-lated at 3 sigma below the center line.
Throughout this report, the individual moving range (IMR) control chart is used to evaluate stability of a single process using variable data (number of reports, rate per 1,000 patient days) . One should evaluate the range (bottom) chart first. If it is “out of control,” so is the process. If the range chart looks okay, then evaluate the X (top) chart.
Where appropriate, trend charts are used. The CL, UCL, and LCL are sloped at the same angle to portray the incline or decline of the respective data. This allows for evaluation of the trend against normal expectations of increase and decrease.
Note
1. KnowWare International, Inc. What is a
Control Chart? [online] [cited 2017 Mar 20]
https://www.qimacros.com/control-chart/
Figure 4. Number of Submitted Reports, Monthly, 2005 through 2016
0
5,000
10,000
15,000
20,000
25,000
31271S M
NUMBER OF REPORTS
2011
2012
2013
2005
2006
2007
2008
2009
2010
2014
Monthly reports Trend
YEAR
2015
2016
Figure 5 supports the proposition of improved reporting. Depicting the volume of Serious Events and Incidents on a relative scale (24:1) shows that the volume of Serious Events has increased somewhat over the long term, but not as sharply as the volume of Incidents. However, new published guidance* that clarified interpretations of the Serious Event definition and its component terms may have been temporally
* http://www.pabulletin.com/secure/data/vol44/44-39/2041.html

Pennsylvania Patient Safety Authority 2016 Annual Report 17
Figure 5. Number of Serious Event and Incident Reports and Trend of Serious Reports, Monthly, 2005 through 2016
INCIDENTREPORTS Incidents Serious Events
0
5,000
10,000
15,000
20,000
25,000 1,000
800
600
200
MS17
214
SERIOUS EVENTREPORTS
40140240340440540640740840940
Upper control limit
Lower control limit
Center line
769.9748.3
639.5
482.1 530.7
YEAR
NUMBER OF SERIOUS EVENT REPORTS
2012 2013 20142005 2006 2007 2008 2009 2010 2011 2015 2016
2012 2013 20142005 2006 2007 2008 2009 2010 2011 2015 2016
Final Guidance released
YEAR
400
0
0
50
100
150
200
250
2012 2013 20142005 2006 2007 2008 2009 2010 2011 2015 2016
133.6
40.9
YEAR
RANGE
Common cause variation Special cause variation
193.3
59.2
Upper control limit
Lower control limit
Center line
Note: Control charts generated using QIMacros® 2016 (KnowWare International, Inc., Denver, CO), based on Six Sigma principles and Healthcare IHI rules (information available at https://www.qimacros.com/pdf/qiuser.pdf).

2016 Annual Report Pennsylvania Patient Safety Authority 18
associated with reporting of these events. The two control charts in Figure 5 have an adjustment for when the final guidance was issued in April 2015—the process change point was noted and the variability recalculated. They sug-
gest that the timing of the guidance was associated with decreased variability (possibly greater standardization) in the number of Serious Events reported.
* Event types are coordinated by color between Incidents (97%) and Serious Events (3%). At left, values are a percentage of total Incidents submitted. At right, values are percentage of total Serious Events submitted. Due to rounding, percentages may appear greater or less than 100%.
† This is not a single category of completely unclassified reports but rather a category that includes specific subcategories that did not logically fit under other existing top-level headings. Examples of subcategories under Other/Miscellaneous include Inappropriate Discharge, Other Unexpected Death, and Electric Shock to the Patient.
‡ Serious Events represent 3% of overall 2016 PA-PSRS submissions. Transfusions, not pictured under Serious Events, represent less than 1% of the total Serious Events.
Errors related to procedure/treatment/test
Medication errors
Falls
Complications of procedure/treatment/test
Transfusions
Adverse drug reactions(not a medication error)
Self harm
All serious events‡
Skin integrity
Equipment/supplies/devices
Other/miscellaneous†
All Serious Events
MS17
215
30%
14%12% 11%
8%
3% 2% 2%
1%
7%
8%
3%
2% 2% 1%
18% 14%53%
10%
Figure 6. Comparison of Event Types by Percentage* of Total Reports Submitted, 2016
Reports by Event Type
When reporting an event through PA-PSRS, a facility uses a classification taxonomy to characterize the occurrence being reported. At the outset, a facility classifies a report by identifying what PA-PSRS defines as the “event type.” An event type dictionary is one way the Authority classi-fies and analysts look for patterns and trends in submitted reports. The top-level event type essentially answers the most basic question about an occurrence: “What type of event happened?” The complete event-type dictionary is a three-level, hierarchical taxonomy with 222 distinct event types.
These categories are further broken down into second- and third-level subcategories. For example, the category “Falls” includes a series of subcategories such as:
• Falls while Lying in Bed
• Falls while Ambulating
• Falls in the Hallways of the Facility
• Other Types of Falls

Pennsylvania Patient Safety Authority 2016 Annual Report 19
Figure 6 shows the percentage of reports submitted from acute-level facilities under each top-level event type in 2016. The most frequently reported occurrences were Errors Related to Procedure/ Treatment/ Test (29%) and Medication Errors (18%). These two event types account for about 47% of all reports submitted. Although Errors Related to Procedure/ Treatment/ Test was the event type most fre-quently reported through PA-PSRS, it was not the event type most frequently associated with patient harm.
Also shown in Figure 6 is a graphic comparison of the percentage of submissions as Serious Events and Incidents by event type. The event type Complications of Procedure/ Treatment/ Test accounted for more than half (53%) of the Serious Events submitted in 2016. This event type historically constitutes the largest percentage of Serious Events. For example, in calendar years 2014 and 2015, the percentage of Serious Events from this event type were 53% and 54%, respectively.
Analysis reveals that the number of the event type Errors Related to Procedure/ Treatment/ Test increased 21%, com-pared to 2015. This category’s increase equates to 76.2% of the total report submission increase in 2016. Table 2 shows several subtypes within that category accounting for the predominant increases by percentage. As noted previ-ously, the Authority identifies and approaches apparent themes from the annual report and other analysis sources for subsequent education and prevention strategies to health-care facilities. More in-depth analysis of these distributions may provide input in forthcoming education, if warranted.
This increase in Errors Related to Procedure/ Treatment/ Test was offset by decreases in overall Skin Integrity reports (-19.1%) and the Other/Other sub-event type reports (-14.5%). The standardization effort, which included the addition of several new reporting subtypes may have con-tributed to the decrease in the number reports submitted in the Other/Other subtype—for example, patients return-ing to the emergency department after discharge, surgical
procedure complications, and orthopedic-related events. A decrease in Pressure Injury reports may also reflect the effect of standardization and clarifications made in the Final Guid-ance document.* Further information about the Standardiza-tion effort can be found in Reporting Standardization.
Table 3 lists several event subtypes that realized decreases.
Table 2. Highest Percentage Increases among Report Submissions by Event Subtype, 2016
ERRORS RELATED TO PROCEDURE/ TREATMENT/TEST
CHANGE IN NUMBER OF REPORTS IN 2016 VS. 2015
CHANGE (%)
Laboratory test problem/ Specimen quality problem
6,160 83.9
Laboratory test problem/ Other
2,048 34.9
Referral/Consult problem/ Delay in service
939 46.2
Surgery or invasive procedure problem/Procedure cancelled or not performed
571 20.3
Table 3. Annual Decrease of Reports by Event Subtype, 2016
DECREASING EVENT TYPES
CHANGE IN NUMBER OF REPORTS IN 2016 VS. 2015
CHANGE (%)
Skin integrity/Pressure ulcers/ Admitted from other facility
-4,644 -51.6
Other/Other -2,518 -14.5
Skin integrity/ Pressure ulcers/ New ulcer <24 hours after admission
-850 -68.0
Skin integrity/Other -561 -14.8
Reports by Level of Patient Harm
For every report submitted through PA-PSRS, the associat-ed healthcare facility applies a 10-item scale to measure whether an event “reached” the patient and, if so, how
much harm it caused.† This scale4 ranges from “unsafe conditions” (e.g., look-alike medications stored next to one another) to the death of the patient.
* http://www.pabulletin.com/secure/data/vol44/44-39/2041.html† For example, an event in which a phlebotomist prepares to draw blood from the wrong patient but catches
the error by checking the patient’s wristband would be an event that did not reach the patient.

2016 Annual Report Pennsylvania Patient Safety Authority 20
Figure 7 shows the reports received during 2016 catego-rized by the level of harm (as described above). For the most part, the reports at each level of harm follow a similar distribution by event type as they do in the database as a whole (e.g., Harm score C is generally the most frequently submitted harm score for each event type). However, as seen in recent years, not all event types adhere to the distribution shown in Figure 7. For example, while the event type Complication of Procedure/ Treatment / Test comprise 14.8% of reports overall in 2016, as previously noted, it comprises 53.0% of the reports of events involving harm, including those resulting in or contributing to the patient’s death. Complication event examples include the following:
• Complication following surgery or invasive proce-dure/ Pneumothorax reports—57.1% involved harm
• Anesthesia Event/ Aspiration reports—54.2% involved harm
• Complication following surgery or invasive proce-dure/ Unplanned return to operating room—48.0% reports involved harm
These findings, similar to other data trends identified by Authority staff, will be queued and investigated further. If warranted, these data distributions may be addressed in forthcoming education.
At the other end of the spectrum, although the event type Medication Errors comprises 17.9% of reports in 2016, it comprises only 2.3% of reports involving harm and 0.9% of reports of events contributing to or resulting in death.
05
1015202530354045
PERCENTAGEOF REPORTS
HARM SCOREA B1 B2 C D E IF G H
MS17
216
8.02
1.19
12.91
42.79
32.14
1.96 0.83 0.03 0.05 0.09
HARM LEVEL HARM SCORE DEFINITION
Unsafe Condition
Event, No Harm
Event, Harm, excluding Death
Event, Death
A
B1, B2, C, D
E, F, G, H
I
Circumstance that could lead to an adverse event
Often called a “near miss,” an event that either did not reach the patient or did reach the patient but did not cause harm
An event that reached the patient and caused temporary or permanent harm
An event that resulted in or contributed to death
Figure 7. PA-PSRS Harm Scale for Acute-Level Facilities, 2016
Note: Percentage of Harm Scores given to second decimal to illustrate low percentages of higher harm.

Pennsylvania Patient Safety Authority 2016 Annual Report 21
Reports of the event type Error Related to Procedure/ Treat-ment/ Test were also associated with harm or death at a fre-quency lower than their representation in the database as a whole. Although 7.4% of events resulted in patient harm, no deaths were associated with reports related to Skin Integrity.
The designation “Harm Score A” is intended to identify “unsafe conditions,” meaning that there was an observed situation, or hazard, in which some harm was a possibility if corrective action was not taken. Unsafe conditions were cited in 8% of the reports submitted in 2016. As shown in Figure 8, and consistent with previous annual analysis, the event type in which unsafe conditions were most often reported was Error Related to Procedure/ Treatment/ Test (40%).
The event type in which unsafe conditions were least fre-quently reported by percentage was Adverse Drug Reac-tions. Of all reports of the Adverse Drug Reactions event type, 0.3% were reported as unsafe conditions.
Reports with harm scores of G, H, and I are deemed high harm events because they are associated with permanent harm or death. With the exception of high harm events in 2015, the number of high harm events has decreased annually since 2005, both in number and as a percent-age of Serious Events, as shown in Figure 9. Although the overall number of high harm events is trending downward, the rate of decrease slows in the last eight quarters.
MS17
217
EVENT TYPES
NUMBER OF REPORTS
Medication error
Adverse drug reaction
Equipment/supplies/devices
Fall
Error related toprocedure/treatment/test
Complication ofprocedure/treatment/test
Transfusion
Skin integrity
Self harm
Other/miscellaneous
0 10,000 20,000 30,000 40,000 50,000 60,000 70,000 80,000
Unsafe condition
Event, no harm
Harmful event
Death event
2,190
43,380
171
2
Medicationerror
53
5,398
221
0
Adversedrug
reaction
1,181
5,637
74
2
Equipment/supplies/devices
8,249
65,102
596
11
Error relatedto procedure/treatment/test
1,473
32,428
3,852
149
Complicationof procedure/treatment/test
859
3,457
27
1
Transfusion
2,808
21,296
544
0
Skinintegrity
191
33,363
937
3
Fall
19
1,478
145
7
Selfharm
3,481
16,113
763
43
Other/miscellaneous
Figure 8. Reports by Event Type and Level of Patient Harm, 2016

2016 Annual Report Pennsylvania Patient Safety Authority 22
Figure 9. Number, Percentage, and Trends of High Harm Events Reported by Acute-Level Facilities through PA-PSRS by Year, 2005-2016
* Percent of Serious Events
Note: Control charts generated using QIMacros® 2016 (KnowWare International, Inc., Denver, CO), based on Six Sigma principles and Healthcare IHI rules (information available at https://www.qimacros.com/pdf/qiuser.pdf).
MS17
278
90.3
NUMBER OF HIGH HARM REPORTS
0
50
100
150
200
250
300
350
400
450
500
2006 2007 2008 2009 2010 2011 2012 2013 2014 2015 20162005
YEAR (BY QUARTER)
2006 2007 2008 2009 2010 2011 2012 2013 2014 2015 2016
Upper control limit
Lower control limit137.9
Center line
2005
YEAR
Common cause variation Special cause variation
G
H
I
1.2%90
1.3%87 0.6%
470.8%73
1.2%95 0.7%
530.7%59
0.7%58
0.6%48
0.8%59
1.0%75
0.9%68
2.5%184
2.5%176
2.5%182 1.6%
135
2.1%173 2.1%
1552.1%171
1.3%106 1.2%
94
1.8%130
1.9%145 1.6%
124
6.0%*453
5.2%360
5.0%365
4.2%366
3.7%306
4.0%299 3.6%
287 3.2%254 2.9%
221 2.9%208
3.3%253 2.9%
218
42.6
NUMBER OF HIGH HARM REPORTS
RANGE
216.4
121.1
25
75
125
175
225
275
17.9
YEAR (BY QUARTER)
2006 2007 2008 2009 2010 2011 2012 2013 2014 2015 2016
Upper control limit
Lower control limit
58.5
Center line
20050
10203040506070

Pennsylvania Patient Safety Authority 2016 Annual Report 23
Reports Involving the Patient’s Death
Reports involving events that may have contributed to or resulted in the patient’s death (harm score I) account for fewer than 0.09% (i.e., about one tenth of one percent) of all submitted reports. In 2016, the Authority received 218 reports of events that had a harm score of I, a 13.8% decrease from 2015.
This decrease follows the general trend of the decreas-ing number of harm score I reports, as seen in Figure 10, over the twelve-year period starting in 2005. The total for 2016 is second fewest for a full year of reporting in PA-PSRS history. The majority of reports involving a patient’s death are associated with the event type Complications of Procedure/ Treatment/ Test.
Figure 10. Trend of Death Events Reported by Acute-Level Facilities through PA-PSRS by Quarter, 2005-2016
Note: Control charts generated using QIMacros® 2016 (KnowWare International, Inc., Denver, CO), based on Six Sigma principles and Healthcare IHI rules (information available at https://www.qimacros.com/pdf/qiuser.pdf).
MS17
280
13.8
NUMBER OF DEATH EVENT REPORTS
0
20
40
60
80
100
120
140
160
Upper control limit
Lower control limit
Center line
47.2
80.7
2006 2007 2008 2009 2010 2011 2012 2013 2014 2015 20162005
YEAR (BY QUARTER)
RANGE
2006 2007 2008 2009 2010 2011 2012 2013 2014 2015 2016
Upper control limit
Lower control limit
41.1
12.6Center line
0
5
10
15
20
25
30
35
40
45
2005
YEAR (BY QUARTER)
Common cause variation Special cause variation
136.9
103.4
70

2016 Annual Report Pennsylvania Patient Safety Authority 24
In terms of particular event types, although 14.8% of all reports in 2016 were attributed to Complication of Procedure/ Treatment/ Test, 68.3% of all reports involv-ing patient death were of that event type (Figure 11). Of the reports involving death associated with complications, the majority describe patients who died after surgery or
another invasive procedure (56.4%), with the next highest percentages reported as patients who suffered cardiopul-monary arrest outside the intensive care unit (ICU) setting (14.1%) and neonatal complications (7.4%).
Figure 11. Reports Involving the Patient’s Death, by Event Type, 2005 through 2016
NUMBER OF EVENTS ASSOCIATED WITH PATIENT DEATHS
MS17
218
0
100
200
300
400
500
2005 2006 2007 2008 2009 2010 2011 2012 2013 2014 2015 2016
Complication of procedure/treatment/test
Fall
Adverse drug reaction
Transfusion
Other/miscellaneous
YEAR
Error related toprocedure/treatment/test
Medication error
277
17
16
11
8
2
0
3
1
117
200
20
24
7
8
2
0
0
0
99
214
20
14
7
5
3
0
0
0
103
215
19
11
2
12
2
0
1
0
103
181
18
9
2
3
3
0
1
1
86
180
22
17
6
3
3
0
0
0
68
169
14
17
4
2
2
0
0
0
81
144
21
11
5
4
3
0
0
0
65
128
14
8
3
2
3
0
0
0
64
111
18
14
4
3
0
0
1
0
56
144
14
10
3
4
5
2
1
0
70
149
11
3
2
0
2
7
1
0
43
Skin integrity
Self harm
Equipment/supplies/devices
Notes: Event types listed in ascending order by total. Self-harm added as event type in 2015.

Pennsylvania Patient Safety Authority 2016 Annual Report 25
Patient DemographicsPA-PSRS collects few demographic details about patients because the Authority is not authorized to collect individu-ally identifying information. As a result, patient disparity
data are limited to gender and age. Figure 12 shows report submissions by age and gender.
NUMBER OF REPORTS
AGE COHORTS IN YEARS
MS17
219
0
5,000
10,000
15,000
20,000
25,000
Unknown85+75 to 8465 to 7455 to 6445 to 5435 to 4425 to 3415 to 245 to 140 to 4
Female Male
Figure 12. Number and Percentage of Reports Submitted by Age Cohort and Gender, 2016
Patient Gender
Of the 255,714 reports submitted in 2016, 132,144 (51.7%) involved female patients, and 123,570 (48.3%) involved male patients. This proportion by gender is in line with the Authority’s reported trends since 2004 and with evidence in the medical literature. According to Nowatzki and Grant, during childbearing years, women are more likely than men to have encounters with the healthcare system, and because women have a longer life expectancy than men, there are more women in the general popula-tion in the older age cohorts.5
The proportion of reports classified as Serious Events dif-fered slightly according to the patient’s gender, with 3.1%
of reports involving female patients classified as Serious Events, compared to 2.8% for reports involving males.
Figure 13 shows the distribution of reports by patient gender and event type. Many of the patterns observed in 20156 are evident this year as well. Among these ob-served patterns, the proportion of reports involving female patients was greater than 60% among reports of Adverse Drug Reactions and Self Harm. The three event types involving a greater proportion of male patients in 2016 included equipment issues, falls, and skin integrity reports.

2016 Annual Report Pennsylvania Patient Safety Authority 26
* Based upon publicly available data from the website of the Pennsylvania Health Care Containment Council (www.PHC4.org). Estimates based on statewide inpatient data from 2015.
Patient Age
Figure 14 shows the proportion of events reported through PA-PSRS, from hospitals only, by gender and by patient age cohort. As discussed above, this figure reflects that women are more likely as are men to have encounters with the healthcare system during childbearing years. Patients age 65 or older account for 41.0% of all reports from hospitals through PA-PSRS in 2016.
Also shown on this figure is the proportion of hospital in-patient admissions as reported by the Pennsylvania Health Care Cost Containment Council (PHC4).* Reports through PA-PSRS roughly track admissions by age cohort. Older patients’ representation among PA-PSRS reports (41.0%
of reports) merely reflects greater representation in the healthcare system in terms of number of admissions and patient days. The PHC4 data show that patients age 65 and older make up 39.8% of the admissions to hospitals in 2015.
The fact that patient age and gender in reports submitted through PA-PSRS track so closely to distribution of age and gender in the hospitalized population speaks to the overall generalizability of the data healthcare facilities submitted to the Authority.
NUMBER OF REPORTS
MS17
220
Female
Male
0
10,000
20,000
30,000
40,000
50,000
60,000
70,000
80,000
Other/miscellaneous
Self harmSkinintegrity
TransfusionsEquipment/supplies/devices
Adversedrug
reactions
Medicationerrors
Falls Complicationsof procedure/
treatment/test
Errorsrelated to
procedure/treatment/
test
48.8%
37.7%
52.2%
51.6%
47.7%
44.2%
47.7%
52.9%
67.1%32.9%
48.9%51.2%
62.3% 47.8%
48.4%
52.3%
55.8%
52.3%47.1% 51.1%
3,536
2,136
23,406
22,337
3,293
3,601
16,690
17,804
38,653
35,305
21,152
16,750
2,278
2,076
11,613
13,035
1,107
542
10,416
9,984
EVENT TYPES
Figure 13. Number and Percentage of Reports Submitted by Gender and Event Type, 2016

Pennsylvania Patient Safety Authority 2016 Annual Report 27
PERCENTAGE BY AGE COHORT
MS17
221
Female (PA-PSRS data)Male (PA-PSRS data)
Admissions (PHC4 data)
0
5
10
15
20
AGE COHORTS IN YEARS
85+75to 84
65to 74
55to 64
45to 54
35to 44
25to 34
15to 24
5to 14
0to 4
Figure 14. Proportion of Hospital Reports Submitted by Gender and Age Cohort, 2016*
* Based upon publicly available data from the website of the Pennsylvania Health Care Cost Containment Council (www.PHC4.org). Estimates based on statewide inpatient data from 2015.PA-PSRS, Pennsylvania Patient Safety Reporting System; PHC4, Pennsylvania Health Care Cost Containment Council.
0
10
20
30
40
50
60
70
80
90
100
201620152014201320122011201020092008200720062005
PERCENTAGE
MS17
222
Skin integrity Falls TotalYEAR
53.0 53.2 52.8 51.9 50.0 48.3 46.9 46.0 43.2 42.9 43.4 41.0
64.0 62.4 61.2 60.1 57.4 56.2 54.2 52.0 51.1 49.6 49.9 49.1
73.2 73.2 73.6 73.2 70.7 70.6 69.5 68.1 68.0 66.7 66.0 64.6
Patients in High and Low Age Cohorts
Elderly PatientsIn the Authority’s previous annual reports, several patterns of interest were identified with respect to reports involving elderly hospital patients (age 65 or older). For example, fewer than 50% of reported Falls have involved elderly patients since 2014 (Figure 15).
In another area of interest, elderly hospital patients ac-counted for 73.2% of Skin Integrity reports, including
pressure injuries, in 2005. This figure declined steadily to 64.6% in 2016. The decline in the submission of reports of pressure injuries may reflect the effect of standardization and exclusions in reporting as outlined in the Final Guid-ance document.* See the Reporting Standardization section for more details about previous and ongoing efforts.
Figure 15. Percentage of Reports of Specific Event Types Involving Elderly Hospital Patients (age 65 or older)
* Final Guidance for Acute Healthcare Facility Determinations of Reporting Requirements under the Medical Care Availability and Reduction of Error (MCARE) Act. 44 Pa.B. 6178, September 27, 2014. Available online: http://www.pabulletin.com/secure/data/vol44/44-39/2041.html

2016 Annual Report Pennsylvania Patient Safety Authority 28
Figure 16. Percentage of Medication Errors among All Event Types Involving Perinatal Hospital Patients (20 days or younger), 2005 through 2016
Note: Control charts generated using QIMacros® 2016 (KnowWare International, Inc., Denver, CO), based on Six Sigma principles and Healthcare IHI rules (information available at https://www.qimacros.com/pdf/qiuser.pdf).
MS17
281
11.6
PERCENTAGE
5
10
15
20
25
30
Upper control limit
Lower control limit
Center line
17.9
24.2
2006 2007 2008 2009 2010 2011 2012 2013 2014 2015 20162005
YEAR (BY QUARTER)
RANGE
2006 2007 2008 2009 2010 2011 2012 2013 2014 2015 2016
Upper control limit
Lower control limit
7.7
2.4Center line
0
1
2
3
4
5
6
7
8
9
2005
YEAR (BY QUARTER)
Common cause variation Special cause variation
26.8
14.2

Pennsylvania Patient Safety Authority 2016 Annual Report 29
Perinatal Patients
In all, 8,551 reports involved perinatal hospital patients (those aged 20 days or younger), an increase of 879 re-ports (10.3%) from 2015. Less than 2% (1.36%) of perinatal reports were classified as Serious Events, noticeably lower than the overall Serious Event percentage of 3.0% for 2016.
About two thirds (66.4%) of reports for perinatal patients were related to events of Error or Complication of Proce-dure/ Treatment/ Test. Because of specialized needs based on age and size, these patients are proportionally more likely to experience errors or complications compared with other event types associated with older patient age groups.
About one fifth (19.9%) of reports involving perinatal patients were related to Medication Errors. There is a slight but consistent decline in the percentage of reports involving Medication Errors since 2005 for this age cohort (Figure 16). Complication of Procedure, Treatment and Test ac-counted for 73.3% of the Serious Events in this age group, which is somewhat higher than for this event type in 2015 (61.2%). Four out of five of these complications are neona-tal complications, such as birth injury or trauma (n = 35), other (n = 15), unplanned transfer to the neonatal inten-sive care unit (NICU; n = 7) and neonatal death (n = 6).
Children and Adolescents
A total of 46,656 reports submitted through PA-PSRS in 2016 involved children and adolescents (i.e., patients younger than 21 years). This number is higher this year because of normal variation in reporting. The top two report types were Error Related to Procedure/ Treatment/
Test, accounting for 35% of the reports of this population, and Medication Errors, at 28.8%. However, the event type Complication of Procedure/ Treatment/ Test made up 55.4% of the 540 Serious Events for this age group. Table 4 lists the three largest event subtypes by percentage in this age group.
Table 4. Top Three Complication of Procedure/ Test/ Treatment Subtypes, by Percentage of Serious Events among Children and Adolescents, 2016
COMPLICATIONS OF PROCEDURES/TREATMENTS/TESTS (ALL SERIOUS EVENTS FOR CHILDREN AND ADOLESCENTS)
SERIOUS EVENTS (NO.)
SERIOUS EVENTS (%)
Complications of Procedures/Treatments/Tests 299 55.4
Complication following surgery or invasive procedure/Unplanned return to operating room
74 13.7
Complication following surgery or invasive procedure/Other 59 10.9
Neonatal complication/Birth injury or trauma 35 6.5
Reports by Location/Department (Hospitals Only)
PA-PSRS has 155 designated care areas for hospitals. These are the locations or departments of the hospital in which a patient receives care or is exposed to in the process of receiving care. As illustrated in Figure 17, the care areas designated as Critical Care Areas and General Medical/ Surgical Units were cited as the locations for the greatest number of overall reports submitted in 2016, each generat-ing nearly one fifth of the total. Other hospital departments with high report rates were Pediatric Care, Surgical Services, and Intermediate Unit.
Although most hospital reports were submitted from the Critical Care and General Medical/ Surgical areas, the greatest number of Serious Events came from Surgical Ser-vices, accounting for nearly one third of Serious Events from hospitals. However, the care areas with highest proportion of Serious Events per submitted report were the Diagnostic/ Labs Care Group and Surgical Services (Table 5).

2016 Annual Report Pennsylvania Patient Safety Authority 30
MS17
223
PERCENTAGE
0 5 10 15 20
CARE AREA GROUP
18.2
17.3
11.0
9.5
7.4
6.2
5.6
4.7
4.5
4.5
3.2
2.8
2.3
1.5
0.9
0.3
0.2
0.1
0.0Other
Chemical dependency
Administration
Extended care
Rehabilitation services
Diagnostics/Labs
Physical plant
Obstetrical care
Outpatient clinics
Inpatient rehabilitation
Inpatient psychiatry
Radiology services
Specialty units
Ancillary departments
Intermediate unit
Surgical services
Pediatric care
General medical/Surgical units
Critical care
Figure 17. Percentage of Submitted Reports by Location/Department (Hospitals Only), 2016
Table 5. Number and Percentage of Serious Events among all Serious Events and of Submitted Reports, by Care Area Location (Hospitals Only), 2016
LOCATION
SERIOUS EVENTS
TOTAL
SERIOUS EVENTS BY GROUP (%)
SERIOUS EVENTS (% OF TOTAL)
Diagnostic/Labs 299 3,686 8.1 5.1
Surgical services 1,873 23,506 8.0 32.0
Inpatient psychiatric 380 11,066 3.4 6.5
Obstetrical care 228 6,959 3.3 3.9
Physical plant 147 5,577 2.6 2.5
14 other care groups 2,922 196,969 1.5 50.0

Pennsylvania Patient Safety Authority 2016 Annual Report 31
Reports by Region and Submission Type
For this report, the Pennsylvania Patient Safety Authority Board of Directors has adopted a geographic break-down of the Commonwealth into six regions, as shown in Figure 18. This breakdown is based on the Department of Health’s Public Health Districts.
The variation in the number of reports submitted through PA-PSRS by geographic region (Figure 19) may be explained by noting proportion of reporting patterns; for example, more reports may be submitted in regions with larger populations and greater numbers of healthcare facilities. Consistent with this statement, the regions with the greatest number of reports (Southeast and Southwest) were those with the Commonwealth’s two largest popula-tion centers: Philadelphia and Pittsburgh, respectively. The Authority will continue to look for trends and closely moni-tor the data within these regions.
Adjusting the report volume for a measure of healthcare utilization paints a different picture. Figure 20 shows, by
region, the number of reports from hospitals per 1,000 patient days.* This figure shows that, after accounting for the differences in the volume of healthcare provided by hospitals in each region, those in the Northwest and Southcentral regions reported the highest number of Inci-dents per 1,000 patient days.
Figure 21 shows that the Northcentral and Northeast regions submitted the greatest proportion of Serious Events, comprising 4.9% and 3.4% of their event reports, respectively, as compared to the statewide pooled mean of 2.6%. Conversely, the Southeast and Southwest regions submitted the highest proportion of Incidents comprising 98.2% and 98.0% of their event reports, respectively.
Many factors contribute to reporting variation. The Au-thority continues to provide education about reporting, to refine the reporting criteria when appropriate, and to examine variance. It would be speculative to consider facilities in any of the regions as less or more safe than
Erie
Crawford
Adams
Allegheny
ArmstrongBeaver
Bedford
BerksBlair
Bradford
Bucks
Butler
Cambria
Cameron
CarbonCentre
Chester
Clarion
Clearfield
Clinton
Columbia
Cumberland
Dauphin
Delaware
Elk
Fayette
Forest
FranklinFulton
Greene
Huntingdon
Indiana
Jefferson
Juniata
Lackawanna
Lancaster
Lawrence
Lebanon
Lehigh
Luzerne
Lycoming
McKean
Mifflin
MonroeMontour
NorthamptonNorthumberland
Montgomery
Perry
Philadelphia
Pike
Potter
SchuylkillSnyder
Somerset
Sullivan
SusquehannaTioga
Union
Venango
Warren
Washington
Wayne
Westmoreland
Wyoming
York
Mercer
Northwest Northcentral Northeast
Southwest Southcentral Southeast
MS15
180
Figure 18. Regions of the Commonwealth
* Based upon publicly available data from the website of the Pennsylvania Health Care Containment Council (www.PHC4.org). Estimates based on statewide inpatient data from 2015.

2016 Annual Report Pennsylvania Patient Safety Authority 32
* Based upon publicly available data from the website of the Pennsylvania Health Care Containment Council (www.PHC4.org). Estimates based on statewide inpatient data from 2015.
those in other regions based solely on this data. It may mean that the healthcare providers in certain facilities or regions were better at identifying and reporting potential patient safety issues. The Authority does not risk adjust for factors (e.g., severity of illness). The Authority will further review this variation in the coming year.
Figure 22 shows that the Southwest region has the largest number of reports submitted per hospital.
Further analysis reveals that regional reporting by hospi-tals varies by event type. For instance, the hospitals in the
Southeast region submitted 46.9% of all Medication Errors submitted in 2016. Meanwhile, the region accounted for 19.9% of all Other/Miscellaneous reports, as compared to the region’s 34.3% overall share of the Common-wealth’s reports.
Another example of variability in reporting is found in the Northwest region; hospitals of that region submitted 14.8% of all its reports as Other/Miscellaneous reports, the highest percentage of the state.
Northwest Northcentral Northeast
Southwest Southcentral Southeast
MS17
224
90526,062
1,53983,399
82137,156
1,25862,041
54418,094 773
14,976
Serious Events Incidents!
! ! !
!!!
Figure 19. Number of Serious Event and Incident Reports from Hospitals by Region, 2016
Figure 20. Reports from Hospitals* per 1,000 Estimated Patient Days by Region, 2016
Figure 21. Percentage of Incident and Serious Event Reports from Hospitals by Region, 2016
Northwest Northcentral Northeast
Southwest Southcentral Southeast
MS17
225
3.4%96.6%
1.8%98.2%
2.2%97.8%
2.0%98.0%
2.9%97.1% 4.9%
95.1%
Serious Events Incidents!
! ! !
!!!
Northwest Northcentral Northeast
Southwest Southcentral Southeast
MS17
226
1,103
750
1,1871,241
746
Statewide pooled mean = 1,058
963
Figure 22. Pooled Mean of Reports Submitted Per Hospital by Region, 2016
Northwest Northcentral Northeast
Southwest Southcentral Southeast
MS17
282
0.823.6
0.422.3
0.834.1
0.629.2
1.135.6 1.6
31.8
Serious Events Incidents!
! ! !
!!!

Pennsylvania Patient Safety Authority 2016 Annual Report 33
Figure 23 shows the percentage of each event type submitted by regional hospitals. Figures 24 through 29 isolate each region, comparing the overall submission
percentage against the percentage of submissions by event type.
Figure 23. Percentage of Reports Submitted by Hospitals per Event Type by Region, 2016
PERCENTAGE
REGION
MS17
227
0 10 20 30 40 50 60 70 80 90 100
Southwest
Northwest
Southcentral
Northcentral
Southeast
Northeast
14%
16%
17%
17%
25%
13%
2%
4%
2%
2%
2%
3%
2%
2%
3%
4%
3%
3%
15%
14%
12%
12%
14%
15%
30%
25%
34%
25%
30%
23%
17%
16%
13%
20%
10%
18%
2%
1%
4%
1%
1%
1%
11%
7%
6%
7%
10%
16%
0%
0%
2%
1%
1%
0%
8%
15%
8%
10%
4%
7%
Medication error
Adverse drug reaction (not a medication error)
Equipment/Supplies/Devices
Fall
Error related to procedure/Treatment/Test
Complication of procedure/Treatment/Test
Transfusion
Skin Integrity
Patient self-harm
Other/Miscellaneous
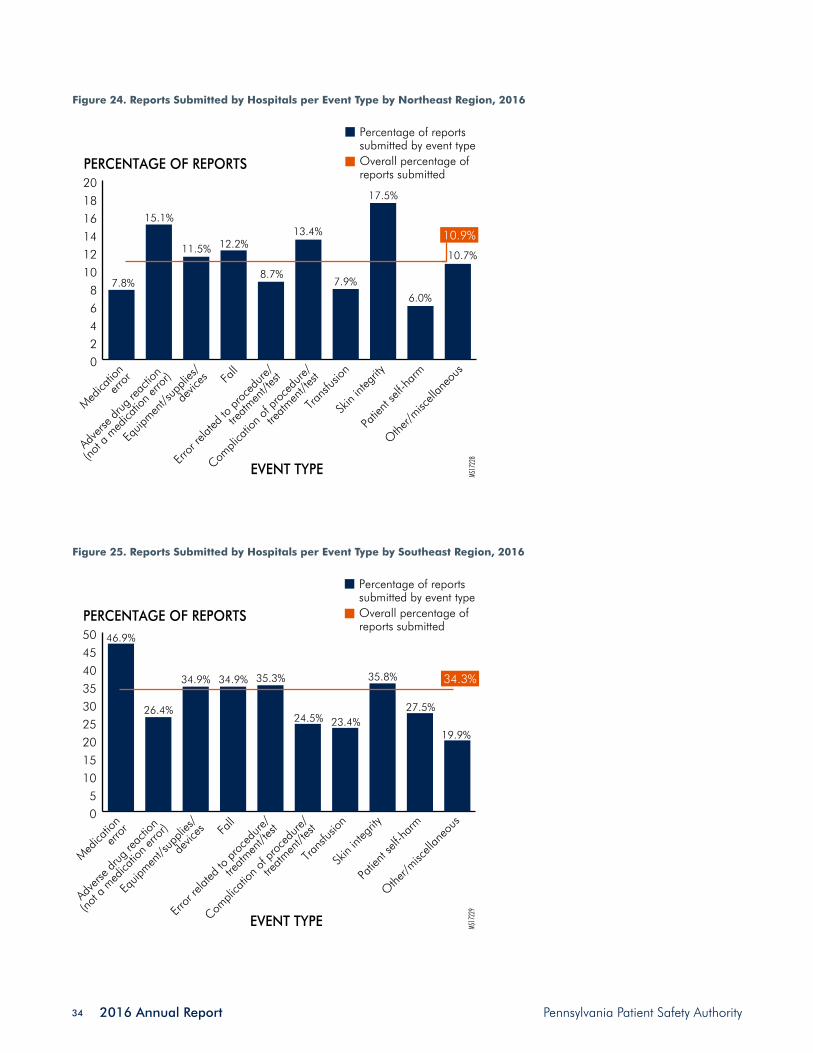
2016 Annual Report Pennsylvania Patient Safety Authority 34
Figure 24. Reports Submitted by Hospitals per Event Type by Northeast Region, 2016
Medica
tion
error
Adve
rse dr
ug re
actio
n
(not a
med
icatio
n erro
r)
Equip
ment/s
uppli
es/
devic
es Fall
Error
relat
ed to
proc
edure
/
treatm
ent/t
est
Compli
catio
n of p
roce
dure/
treatm
ent/t
est
Trans
fusion
Skin
integ
rity
Patie
nt se
lf-har
m
Othe
r/misc
ellan
eous
EVENT TYPE
02468
101214161820
PERCENTAGE OF REPORTS
MS17
228
Percentage of reports submitted by event typeOverall percentage of reports submitted
10.9%
7.8%
15.1%
11.5% 12.2%
8.7%
13.4%
7.9%
17.5%
6.0%
10.7%
Figure 25. Reports Submitted by Hospitals per Event Type by Southeast Region, 2016
EVENT TYPE
05
101520253035404550
PERCENTAGE OF REPORTS
MS17
229
Percentage of reports submitted by event typeOverall percentage of reports submitted
34.3%
46.9%
26.4%
34.9% 34.9% 35.3%
24.5% 23.4%
35.8%
19.9%
27.5%
Medica
tion
error
Adve
rse dr
ug re
actio
n
(not a
med
icatio
n erro
r)
Equip
ment/s
uppli
es/
devic
es Fall
Error
relat
ed to
proc
edure
/
treatm
ent/t
est
Compli
catio
n of p
roce
dure/
treatm
ent/t
est
Trans
fusion
Skin
integ
rity
Patie
nt se
lf-har
m
Othe
r/misc
ellan
eous

Pennsylvania Patient Safety Authority 2016 Annual Report 35
Figure 27. Reports Submitted by Hospitals per Event Type by Southcentral Region, 2016
Figure 26. Reports Submitted by Hospitals per Event Type by Northcentral Region, 2016
EVENT TYPE
0
2
4
6
8
10
12
14
PERCENTAGE OF REPORTS
MS17
230
Percentage of reports submitted by event typeOverall percentage of reports submitted
6.4%
5.9%6.8%
9.5%
5.5% 5.4%
8.9%
4.8% 4.6%
8.8%
12.7%
Medica
tion
error
Adve
rse dr
ug re
actio
n
(not a
med
icatio
n erro
r)
Equip
ment/s
uppli
es/
devic
es Fall
Error
relat
ed to
proc
edure
/
treatm
ent/t
est
Compli
catio
n of p
roce
dure/
treatm
ent/t
est
Trans
fusion
Skin
integ
rity
Patie
nt se
lf-har
m
Othe
r/misc
ellan
eous
EVENT TYPE
0
5
10
15
20
25
30
35
40
45
PERCENTAGE OF REPORTS
MS17
231
Percentage of reports submitted by event typeOverall percentage of reports submitted
15.3%
14.0% 13.6%18.4%
12.9%17.9%
14.0%
31.4%
9.6%
16.8%
39.2%
Medica
tion
error
Adve
rse dr
ug re
actio
n
(not a
med
icatio
n erro
r)
Equip
ment/s
uppli
es/
devic
es Fall
Error
relat
ed to
proc
edure
/
treatm
ent/t
est
Compli
catio
n of p
roce
dure/
treatm
ent/t
est
Trans
fusion
Skin
integ
rity
Patie
nt se
lf-har
m
Othe
r/misc
ellan
eous

2016 Annual Report Pennsylvania Patient Safety Authority 36
Figure 28. Reports Submitted by Hospitals per Event Type by Northwest Region, 2016
Figure 29. Reports Submitted by Hospitals per Event Type by Southwest Region, 2016
EVENT TYPE
0
2
4
6
8
10
12
14
16
18
PERCENTAGE OF REPORTS
MS17
232
Percentage of reports submitted by event typeOverall percentage of reports submitted
7.5%6.5%
12.9%
4.8%
7.6% 6.5%8.4%
5.7% 5.2%
15.7%
4.4%
Medica
tion
error
Adve
rse dr
ug re
actio
n
(not a
med
icatio
n erro
r)
Equip
ment/s
uppli
es/
devic
es Fall
Error
relat
ed to
proc
edure
/
treatm
ent/t
est
Compli
catio
n of p
roce
dure/
treatm
ent/t
est
Trans
fusion
Skin
integ
rity
Patie
nt se
lf-har
m
Othe
r/misc
ellan
eous
EVENT TYPE
0
5
10
15
20
25
30
35
PERCENTAGE OF REPORTS
MS17
233
Percentage of reports submitted by event typeOverall percentage of reports submitted
25.6%18.8%
25.2%
20.9%
26.9% 26.2%
30.7%
26.8% 27.3% 28.0%
10.1%
Medica
tion
error
Adve
rse dr
ug re
actio
n
(not a
med
icatio
n erro
r)
Equip
ment/s
uppli
es/
devic
es Fall
Error
relat
ed to
proc
edure
/
treatm
ent/t
est
Compli
catio
n of p
roce
dure/
treatm
ent/t
est
Trans
fusion
Skin
integ
rity
Patie
nt se
lf-har
m
Othe
r/misc
ellan
eous

Pennsylvania Patient Safety Authority 2016 Annual Report 37
ConclusionThe data presented in this section suggest that healthcare facilities in the Commonwealth continue to make prog-ress in their efforts to identify and report patient safety events. The average monthly number of events submitted through PA-PSRS by Pennsylvania acute-level healthcare facilities increased 7% in 2016 over 2015. The increased reporting of Incidents may suggest earlier recognition and proactive mitigation of hazards with fewer events reach-ing the patient and causing serious harm.1 The number of Serious Events related to death continues to be a low and decreasing proportion of submitted reports. As the
Authority completes its twelfth calendar year of collecting, analyzing, and providing information about medical errors and patient harm, the data trends noted reflect positively on the efforts made by healthcare institutions in the Com-monwealth. As noted previously, the Authority estimated that more than 2,600 lives and more than $147 million were saved since 2005.1 The encouraging trends noted above are starting points. The Authority looks forward to learning whether these observations and trends are repeatable.
Notes
1. Magee MC, Marella WM, Newstadt HM, Clarke JR, Doer-ing MC. The value of improving patient safety in Pennsyl-vania. Pa Patient Saf Advis. 2016 Dec;13(4):125-36. Also available: http://patientsafetyauthority.org/ADVISORIES/AdvisoryLibrary/2016/Dec;13(4)/Pages/125.aspx.
2. Medical Care Availability and Reduction of Error (MCARE) Act of March 20, 2002, P.L. 154, No. 13, Cl. 40. Avail-able: http://www.legis.state.pa.us/cfdocs/legis/li/ucons-Check.cfm?yr=2002&sessInd=0&act=13.
3. Levinson DR. Adverse events in hospitals: state reporting systems. Washington (DC): Office of Inspector General (OIG), Department of Health and Human Services; 2008 Dec. 37 p. Also available: http://oig.hhs.gov/oei/reports/oei-06-07-00471.pdf.
4. NCC MERP index for categorizing medication errors. Na-tional Coordinating Council for Medication Error Reporting and Prevention; 2001 Feb. 1 p. Also available: http://www.nccmerp.org/types-medication-errors.
5. Nowatzki N, Grant KR. Sex is not enough: the need for gender-based analysis in health research. Health Care Women Int. 2011 Apr;32(4):263-77. Also available: http://dx.doi.org/10.1080/07399332.2010.519838. PMID: 21409661


Pennsylvania Patient Safety Authority 2016 Annual Report 39
Reporting Standardization: Guidance for Acute Healthcare Reporting
IntroductionTwenty-eight guiding principles went into effect on April 1, 2015, to improve consistency in event reporting through the Pennsylvania Patient Safety Reporting System (PA-PSRS). The Pennsylvania Patient Safety Authority (Authority) and the Pennsylvania Department of Health (Department) jointly developed the “Final Guidance for Acute Healthcare Facil-ity Determinations of Reporting Requirements under the Medical Care Availability and Reduction of Error (MCARE) Act.”1 This guidance document provides consistent standards to acute healthcare facilities in Pennsylvania in
determining whether occurrences within facilities meet the statutory definitions of Serious Events, Incidents, or Infra-structure Failures as defined in section 302 of the MCARE Act.2 The Authority, the Department, and healthcare facility staff have worked together toward a shared understanding of these requirements. The reporting guidelines were identi-fied based on frequently asked questions (FAQs), contro-versies, and inconsistencies that were evident in the data collected by the Authority and the Department.
EducationAn online education program was developed and made available concurrent with the April 1, 2015, release of the Final Guidance to ensure that all Authority, Department, and healthcare-facility staff had a common understanding of the principles.
The Authority’s outreach to disseminate and educate peo-ple about the new reporting standards continued in 2016 with more than 6,600 education modules completed by 809 (i.e., 80%) of registered online learners.
Assessing the Impact of Reporting StandardizationA set of performance measures was identified to assess the impact standardization had on reporting practices. In 2016, the Authority was encouraged to see that the indicators it felt were important continued to move in the desired direction. For example:
— An improvement in Serious Event reporting has been noted since the new standards went into effect in April 2015.
— The number of reports submitted under the new and revised event types and subtypes that promote more consistent reporting have nearly doubled over the total submitted in 2015 (see Table).
— Healthcare facilities continued to participate in education for the standardization principles. By
the end of December 2016, 80% of registered online learners completed all required modules.
— Analysis of events reported as related to health information technology revealed that more than half involve medication errors.
The principles continue to have good acceptance among healthcare providers, as evidenced by the improvement in the volume and quality of the reports submitted.
Table. Number of Events Submitted under the New Event Type and Subtypes
REPORTS Q1 Q2 Q3 Q4 TOTAL
2015 N/A 683 1,323 1,443 3,469
2016 1,629 1,495 1,704 1,948 6,776
Note: As reported to the Pennsylvania Patient Safety Authority, April 2015 through December 2016.N/A: Not applicable.

2016 Annual Report Pennsylvania Patient Safety Authority 40
Serious EventsThe guidance clarified interpretations of the Serious Event definition and its component terms. The number of Seri-ous Event reports from acute healthcare facilities in Penn-sylvania in 2016 increased by 6.7% over 2014. The Au-thority believes standardization contributed to this increase
(see Overview of Data Reported through PA-PSRS, Figure 5). Standardizing Serious Event reporting was intended to improve the accuracy of event reporting; the number of Serious Event reports increased in 2015 after standardiza-tion, and 2016 numbers appear to remain consistent with
YEAR (BY QUARTER)
MS17
234
NUMBER OF SERIOUS EVENTS
1,473
1,573
1,673
1,773
1,873
1,973
2,073
2,173
2,273
2,373
Upper control limit
Lower control limit
Common cause variation Special cause variation
2,184
2,043
1,919Center line
1,794
1,653
Final Guidance released
2006 2007 2008 2009 2010 2011 2012 2013 2014 2015 20162005
YEAR (BY QUARTER)
RANGE
2006 2007 2008 2009 2010 2011 2012 2013 2014 2015 2016
Upper control limit
Lower control limit
153.1
46.9
Center line
0
50
100
150
200
250
300
350
2005
325.7
99.7
Figure 1. Serious Event Reporting Pattern (January 2005 through December 2016)
Note: As reported to the Pennsylvania Patient Safety Authority; control charts generated using QIMacros® 2016 (KnowWare International, Inc., Denver, CO), based on Six Sigma principles and Healthcare IHI rules (information available at https://www.qimacros.com/pdf/qiuser.pdf).
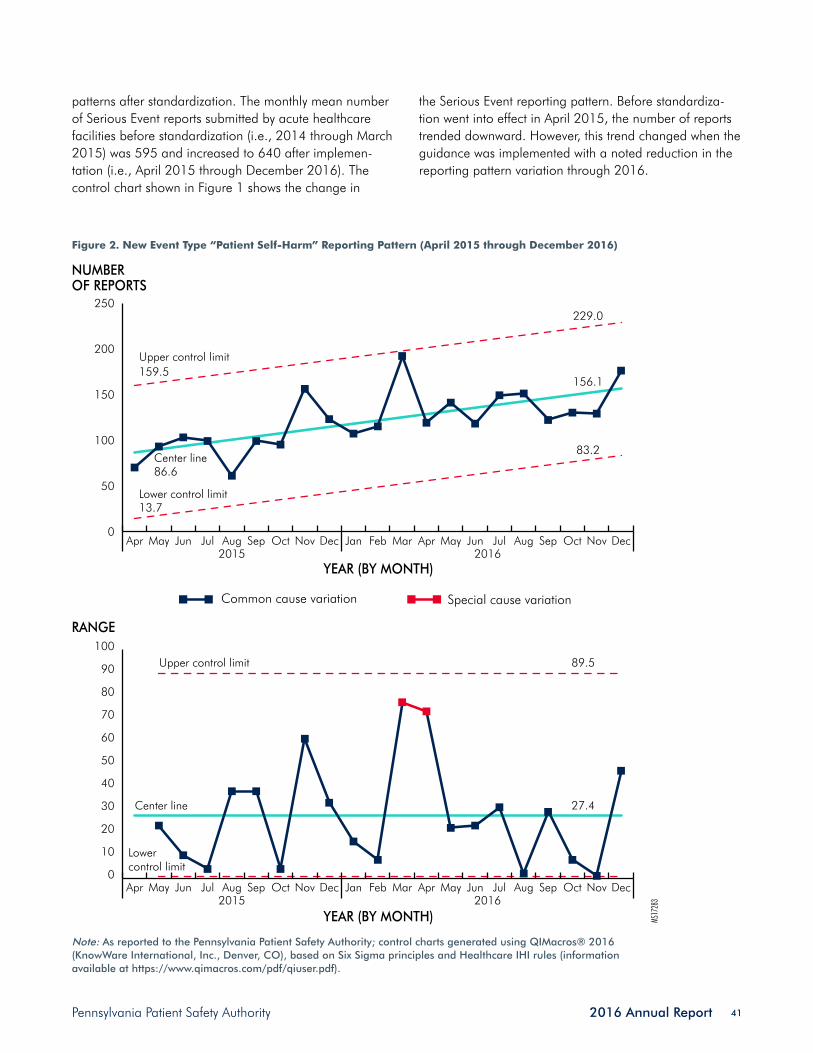
Pennsylvania Patient Safety Authority 2016 Annual Report 41
patterns after standardization. The monthly mean number of Serious Event reports submitted by acute healthcare facilities before standardization (i.e., 2014 through March 2015) was 595 and increased to 640 after implemen-tation (i.e., April 2015 through December 2016). The control chart shown in Figure 1 shows the change in
the Serious Event reporting pattern. Before standardiza-tion went into effect in April 2015, the number of reports trended downward. However, this trend changed when the guidance was implemented with a noted reduction in the reporting pattern variation through 2016.
MS17
283
NUMBEROF REPORTS
RANGE
Lowercontrol limit
Lower control limit
Upper control limit
Center line 27.4
89.5
0
50
100
150
200
250
0
10
20
30
40
50
60
70
80
90
100
DecNovOctSepAugJulJunMayAprMarFebJanDecNovOctSepAugJulJunMayApr
Center line
Upper control limit
13.7
86.6
159.5
229.0
156.1
83.2
YEAR (BY MONTH)
YEAR (BY MONTH)20162015
DecNovOctSepAugJulJunMayAprMarFebJanDecNovOctSepAugJulJunMayApr20162015
Common cause variation Special cause variation
Figure 2. New Event Type “Patient Self-Harm” Reporting Pattern (April 2015 through December 2016)
Note: As reported to the Pennsylvania Patient Safety Authority; control charts generated using QIMacros® 2016 (KnowWare International, Inc., Denver, CO), based on Six Sigma principles and Healthcare IHI rules (information available at https://www.qimacros.com/pdf/qiuser.pdf).
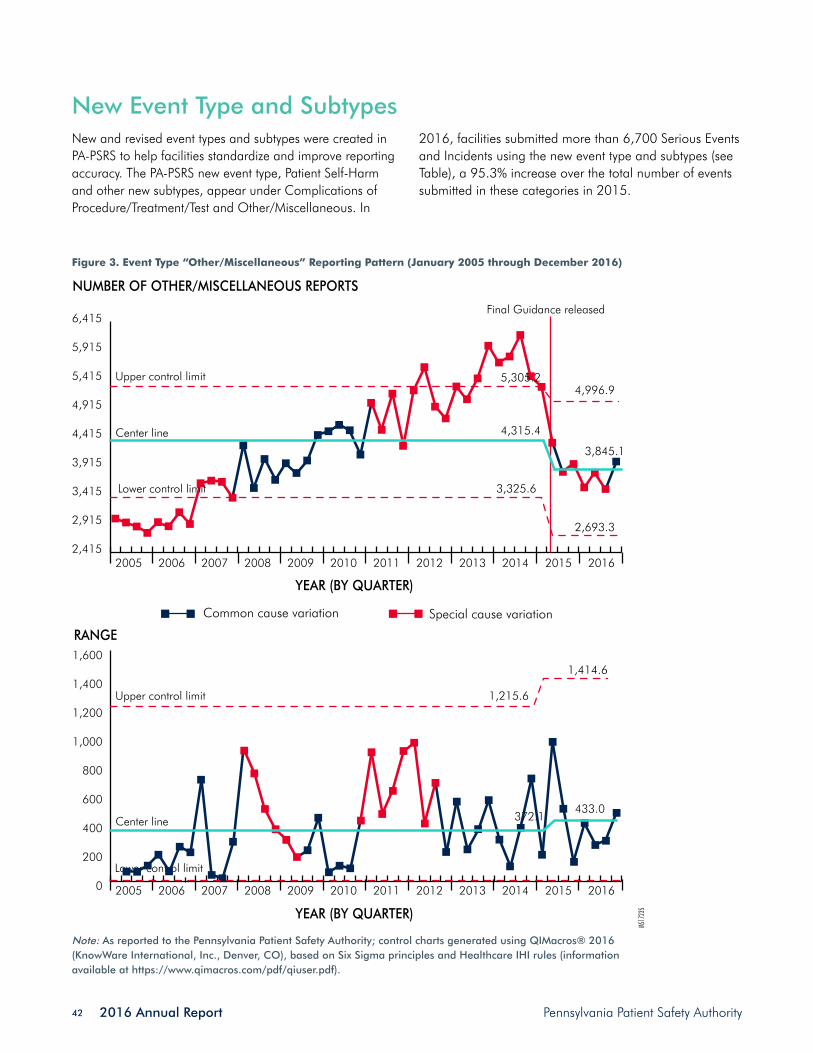
2016 Annual Report Pennsylvania Patient Safety Authority 42
New Event Type and SubtypesNew and revised event types and subtypes were created in PA-PSRS to help facilities standardize and improve reporting accuracy. The PA-PSRS new event type, Patient Self-Harm and other new subtypes, appear under Complications of Procedure/Treatment/Test and Other/Miscellaneous. In
2016, facilities submitted more than 6,700 Serious Events and Incidents using the new event type and subtypes (see Table), a 95.3% increase over the total number of events submitted in these categories in 2015.
Figure 3. Event Type “Other/Miscellaneous” Reporting Pattern (January 2005 through December 2016)
Note: As reported to the Pennsylvania Patient Safety Authority; control charts generated using QIMacros® 2016 (KnowWare International, Inc., Denver, CO), based on Six Sigma principles and Healthcare IHI rules (information available at https://www.qimacros.com/pdf/qiuser.pdf).
YEAR (BY QUARTER)
MS17
235
NUMBER OF OTHER/MISCELLANEOUS REPORTS
2,415
2,915
3,415
3,915
4,415
4,915
5,415
5,915
6,415
Upper control limit
Lower control limit
Common cause variation Special cause variation
Center line
2006 2007 2008 2009 2010 2011 2012 2013 2014 2015 20162005
YEAR (BY QUARTER)
RANGE
2006 2007 2008 2009 2010 2011 2012 2013 2014 2015 2016
Upper control limit
Lower control limit
1,414.6
433.0Center line
0
200
400
600
800
1,000
1,200
1,400
1,600
2005
1,215.6
372.1
Final Guidance released
3,325.6
2,693.3
4,315.4
3,845.1
4,996.95,305.2

Pennsylvania Patient Safety Authority 2016 Annual Report 43
Complications of Procedure/Treatment/Test
As a part of the standardization effort, new and revised event subtypes were created in the Complication of Procedure, Treatment, or Test event type. “Patient in 302 process eloped – with injury” was a new addition un-der Emergency Department (302 process is involuntary commitment into a mental health institute for emergency
psychiatric evaluation). “Use of reversal agents (Not neu-romuscular blockers)” in the subtype Anesthesia Event was revised. With the addition of these new event subtypes, the total number of Serious Events reported increased 7.2% as compared with Serious Events reporting in 2014. See Overview of Data Reported through PA-PSRS.
Patient Self-Harm
Pennsylvania healthcare facilities continued to submit event reports using the patient self-harm event type and subtypes. Figure 2 illustrates a steady increase in the number of reports submitted through this event type since it was introduced in April 2015. The implementation of this category allowed for specific reporting of these events,
and the rise in the number of reports may be attributable to improved awareness (e.g., online education) of the event type by PA-PSRS users. The Authority will continue to evaluate events reported and offer solutions to mitigate harmful patient outcomes. See Overview of Data Reported through PA-PSRS.
Other/Miscellaneous
The number of new reports submitted by facilities using the event type “Other/Miscellaneous” continued to de-cline, as expected with the development of new subtypes. The control chart shown in Figure 3 shows the change in the “Other/Miscellaneous” reporting pattern over time. With the development of the new subtypes, the num-ber of events reported using this event type has trended downward since April 2015, with a noted reduction in the reporting pattern variation through 2016.
In 2016, the number of events reported as subtype “Other” in this category fell by 36% and 14.5% as compared with reporting in 2014 and 2015, respectively, suggesting that reporters used more specific categories to report events and resulting in an overall improvement in the specificity of the reports submitted. The greatest increase in the number of events reported using new event types and subtypes was submitted through the new event subtype, Unanticipated Transfer to Higher Level of Care. More than 5,000 events were submitted using this subtype with Intrafacility Transfer comprising nearly 70% of the reported events.
Health Information Technology
Healthcare organizations have rapidly adopted electronic health records (EHRs) over the past few years as informa-tion systems increasingly become interoperable, and the Authority has seen an increase in events that are related to health information technology (HIT) as a causative or contributing factor. However, HIT may also help prevent other types of safety problems that are not necessarily HIT-related. To identify events in which HIT may have played a role, several questions were added through PA-PSRS to help identify such events and the systems involved.
The HIT measure represents the aggregate number of events submitted with “yes” responses to the question,
“Did HIT cause or contribute to this event?” Figure 4 shows the progression in the number of affirmative re-sponses to this question from April 2015 through Decem-ber 2016. The majority of these HIT-related events involve Medication Errors (54.6%) and Errors in Procedures/Treat-ments/Tests (32.3%).
After collecting and analyzing events associated with medication errors in which HIT caused or contributed to reportable events, the Authority will publish a Pennsylvania Patient Safety Advisory analysis about this topic in 2017.

2016 Annual Report Pennsylvania Patient Safety Authority 44
Infrastructure Failures and OtherInfrastructure Failures and specific “Other” events related to restraints and seclusion are reportable to the Depart-ment and are beyond the scope of this report.
Facilities with Low Report VolumeThe events reported through PA-PSRS inform the analyses published in the Pennsylvania Patient Safety Advisory, and they are the basis for the educational programs and collaborative forums that allow healthcare organiza-tions throughout the state to learn from one another. The Authority consistently monitors and notifies those facilities that: (1) submit a low volume of reports as compared with the volume of reports from like facility types or (2) do not submit any reports through PA-PSRS. A goal of standard-ization is to increase the number and precision of reports received through PA-PSRS from all facility types.
Figure 5 shows the annual number of hospital and ambu-latory surgical facilities with low report volumes.
Hospitals identified with low report volumes meet any of the following criteria:
• No Serious Events submitted through PA-PSRS for one year
• No Incidents submitted through PA-PSRS for one year
• Reporting of Serious Events, Incidents, or total re-ports per 1,000 patient days is less than 10% of the mean of their hospital type (e.g., acute, behavioral, children’s facilities)
Ambulatory surgical facilities identified with low report volumes meet any of the following criteria:
• No reports submitted through PA-PSRS for one year (4+ rooms) or two years (<4 rooms), AND
• There are no extenuating circumstances identified by the facility’s patient safety liaison
• Facilities of unknown room size will be treated as having fewer than 4 rooms
Note: As reported to the Pennsylvania Patient Safety Authority.
NUMBEROF EVENTS
YEAR (BY MONTH)
MS17
236
0
50
100
150
200
250
300
350
183196 205 194
209225
269 275
231246
309 301 291
239 243 243
280297
239 240
294
DecNovOctSepAugJulJunMayAprMarFebJanDecNovOctSepAugJulJunMayApr
20162015
Figure 4. Events Related to Health Information Technology (April 2015 through December 2016)

Pennsylvania Patient Safety Authority 2016 Annual Report 45
Failure to report as required by the MCARE Act is a violation of the Health Care Facilities Act.2 In addition to any penalty that may be imposed under the Health Care Facilities Act, a medical facility that fails to report a Seri-ous Event or an Infrastructure Failure may be subject to an administrative penalty of $1,000 per day imposed by the Department. The Authority actively monitors facilities with low report volumes and notifies senior leaders in writing.
Evidenced by the number of facilities identified as reporting low event volumes, the Authority established the first pa-tient safety liaison Keystone project, The Keys to Reporting, in 2016 to help facilities identify opportunities to improve and evaluate common barriers to reporting. The patient safety liaisons also offer education to facilities and health-care providers at their request. See Educational Programs for more information.
Pressure Injury Reporting Standardization To help acute healthcare facilities determine whether oc-currences of pressure injuries meet the statutory definitions of Incidents or Serious Events as defined in the MCARE Act, the Authority staff and its Board of Directors identified pressure injury reporting as the next priority for standard-ization. A multi-disciplinary work group with backgrounds in medicine (including wound care), nursing (including Wound, Ostomy, and Continence nurses), administra-tion and facility operations, regulation, patient safety and healthcare quality, and a patient representative developed recommendations for pressure injury reporting.
These guidance recommendations were intended to pro-vide consistent and clear standards for the MCARE Act’s reporting requirements for pressure injuries so that the
Authority, the Department, and healthcare facility staff have a shared understanding of the requirements. The subjects of these requirements were identified based on inconsisten-cies that were evident in the data collected by the Authority and the Department.
The drafted guidance document was published in the Penn-sylvania Bulletin 46 Pa.B. 6198 on October 1, 2016, for public comment through October 31, 2016. The Authority, the Department, and the other members of the work group reviewed 15 public comments and will make selected changes to the document in response to those comments. A final guidance document will be issued to guide interpre-tations about whether occurrences of pressure injuries meet the statutory definitions of Incidents or Serious Events as
Note: As reported to the Pennsylvania Patient Safety Authority.
5
10
15
20
25
30
35
40
NUMBER OF FACILITIES
MS17
237
Hospitals
YEARS2010 2011 2012 2013 2014 2015
36
2630
26
29 27
1411
9
13
17
21
Linear trend (hospitals)Ambulatory surgical facilitiesLinear trend (ambulatory surgical facilities)
Figure 5. Number of Facilities with Low Report Volumes
2016 Annual Report Pennsylvania Patient Safety Authority 46
defined under the MCARE Act and will include the agen-cies’ response to the correspondence received. Assuming the Authority’s Board of Directors and the Secretary of the Department approve the final guidance document in
2017, the agencies will need to modify PA-PSRS to support implementation of these standards and develop an educa-tion program for staff of both agencies as well as affected healthcare facilities.
Notes
1. Final guidance for acute healthcare facility determinations of reporting requirements under the Medical Care Avail-ability and Reduction of Error (MCARE) Act, 44 Pa. Bull. 6178 (2014 Sep 27). Also available: http://www.pabulle-tin.com/secure/data/vol44/44-39/2041.html.
2. Medical Care Availability and Reduction of Error (MCARE) Act of March 20, 2002, P.L. 154, No 13 40. Available: http://www.legis.state.pa.us/cfdocs/legis/li/uconsCheck.cfm?yr=2002&sessInd=0&act=13.

Pennsylvania Patient Safety Authority 2016 Annual Report 47
Healthcare-Associated Infections
IntroductionHealthcare-associated infections (HAIs) continue to be an important public health challenge. HAIs are infections patients develop while receiving treatment for other condi-tions and can occur in any healthcare setting. The Centers for Disease Control and Prevention (CDC) estimates 1 in 25 hospitalized patients will develop an HAI during their care.1 Research by Columbia University estimates 1.6 million to 3.8 million HAIs occur among nursing home residents in the United States annually.2 These infections are associated with significant morbidity and mortality and increased healthcare costs. According to CDC, pneumo-nia, gastrointestinal illness such as Clostridium difficile or norovirus infections, urinary tract infections, primary bloodstream infections, and surgical site infections are the most common HAIs.3
Working toward the elimination of HAI is a priority for the Authority because many of these infections are prevent-able. The Medical Care Availability and Reduction of Error (MCARE) Act was amended (Act 52)4 in 2007 to encompass HAI prevention, and it mandates HAI reporting for hospitals and nursing homes. Pennsylvania hospitals report infections through CDC’s National Healthcare Surveillance Network (NHSN) and Pennsylvania nursing homes report infections through the Pennsylvania Patient Safety Reporting System (PA-PSRS).
The Authority uses knowledge gained through analysis of HAI reports to detect infection trends and develop new strategies to prevent HAIs. HAI data from CDC’s NHSN are also analyzed by the Department of Health for hospi-tal trends. The HAI Advisory Panel provides advice and guid-
ance to both the Authority and Department on activities to prevent HAIs. The Authority’s infection prevention analysts use data from HAI reports to prioritize prevention activities. The Authority also partners with local, state, and national organizations to reduce HAIs.
The Authority sponsors in-depth educational offerings tailored to meet the needs of the audience, covering topics including sepsis, scabies, pneumonia, and environment of care issues. Multiple modalities are used to present the education, including webinars, Pennsylvania Patient Safety Advisory articles, toolkits, presentations at conferences and symposiums, and on-site facility consultations and presentations.
The Centers for Medicare and Medicaid Services (CMS) released new regulations for long-term care in Octo-ber 2016. Key elements of these regulations include the establishment of a formal infection prevention and control program with a comprehensive facility assessment and a designated infection prevention and control officer to over-see the program; development of an antibiotic stewardship program with involvement of a pharmacist to oversee antibiotic use; standardization of information provided during care transitions; and food and nutrition services to comply with applicable federal, state, and local laws, reg-ulations, and codes. The Authority’s infection prevention analysts are an available resource, providing guidance to help facilities meet the requirements of these regulations.
This section summarizes the Authority’s HAI activities in 2016.
Education and Outreach ProgramsIn 2016, the Authority’s infection prevention analysts provided education to about 5,600 healthcare workers. The infection prevention analysts presented information at healthcare facilities, on statewide webinars, for our
national and state partners, in a grade school district annual event, and for each of the Authority’s ambulatory surgical facilities’ symposia. An overview of this education is shown in the following graphic.

2016 Annual Report Pennsylvania Patient Safety Authority 48
Antibiotic Stewardship Central Line-Associated Bloodstream Infections
Improving Isolation AwarenessPA-PSRS Analytics
Urinary Tract Infections
Webinars*:981 attendees
Topic:“Environmental Hygiene in Ambulatory Surgery Facilities”
Hempfield Area School District’s “3rd Annual STEAM Academy” — Science, Technology, Engineering, Arts, and Math skills
Infection Prevention Education and Outreach Programs
Facility Education: 386 attendees
ASF Symposia: 155 attendees
Schools:150 students and teachers “Tips from the Toolbox”
– Early Detection of Sepsis in Long-Term Care
– Preventing Non-Ventilator Healthcare Acquired Pneumonia
– Scabies
Professional Organizations:
Association for Professionals in Infection Control and
Epidemiology
State and National Presentations:3,200 attendees through
national partners813 attendees through
state partners
Central Pennsylvania Association for Healthcare Quality
Pennsylvania Association of Directors of Nursing Administration
Pennsylvania Coalition of Affiliated Healthcare & Living Communities
Pennsylvania Health Care Association
Clostridium difficileInfluenza
Pneumonias and Antimicrobial Therapy
Safe Injection PracticesZika
MS1709
2
*Attendees located in PA, DE, NJ, WV, and LA.

Pennsylvania Patient Safety Authority 2016 Annual Report 49
InnovationThe Authority’s infection prevention analysts attended innovation training provided by the Authority in 2016. This training provided knowledge of the creative problem-solving framework for the analysts to use in their work with education, the Advisory, PA-PSRS nursing home data, resources, and the Authority’s HAI Advisory Panel (see lightbulb).
Innovation
MS17
094
Ideas
Webinars
Brainstorming
Education
Resources
Creative
Inspiring
Tools
EfficientPlanGoals
SharingStrategy
Teamwork
ResearchLeading
Statewide
Analysis
Facility consultsSupport
preventionHAI Advisory Panel
Infection
Think BigSuccess
“ I learned we have a good system; just need to keep peopleinformed, educated, and accountable.”“ Thank you for all you do to help;
I feel more connected to the infection control community.”
“ You just helped me put a new spin on an old issue.”
“ I will use the Patient Safety Authority resources more frequently.”“ Most of the program was new information
that I can put into practice.”
MS17
093
Infection Prevention and Control Annual Survey In the fall, the Authority distributed an infection prevention and control–specific survey to hospital and nursing home infection prevention analysts, as a subset of an annual sur-vey. It was intended to elicit information about the effective-ness of the Authority’s guidance and educational programs and to capture critical information about facilities’ infection prevention and control practices. The responses inform and help the Authority prioritize future research, education, and collaboration programs.
The top five infection prevention and control areas of inter-est for hospitals are (in order of importance): hand hygiene, C. difficile infection, surveillance for HAI, antibiotic steward-ship, and environmental infection control. Nursing homes listed the top five infection prevention and control topics of interest as urinary tract infection (UTI), antibiotic steward-ship, pneumonia, surveillance for HAI, and influenza.

2016 Annual Report Pennsylvania Patient Safety Authority 50
As a result of reading one or more of the 2016 infection prevention and control Advisory articles, hospitals and nursing homes made 117 changes to policies, systems, education, collaboration, and communication. The
following graphic shows samples of changes initiated by Pennsylvania healthcare facilities as a result of reading a specific infection control Advisory article.
Advisory: Strategies to Turn the Tide against Inappriopriate Antibiotic Utilization— Developed formulas for appropriate
antibiotic choices
— Instituted a recheck of antibiotics and culture results
— Antibiotic use tracked and evaluated at QAPI meetings
Advisory: A Conceptual Framework for Improving Isolation Awareness in Pennsylvania AcuteCare Hospitals— Standardized network
isolation practices across multiple hospitals
— Increased observations (use)of PPE, and made isolation compliance a PI measure
— Reevaluated signage system and patient/visitor education
Advisory: Data Snapshot: Clostridium Difficile Infections in Long-Term Care Facilities— Reinforced C. diff contact precaution practices— Implemented new environmental cleaning products
and schedules
— Improved QA and ongoing review and early identification process
Advisory: Scabies - Strategies for Management and Control— Changed environmental
cleaning process
— New tracking forms provide better (case) information
— Revamped policy on scabies infestation management
Produced by ECRI Institute
and ISMP under contract
to the Pennsylvania
Patient Safety Authority
An Independent Agency of the Commonwealth of Pennsylvania
PENNSYLVANIAPATIENT SAFET Y ADVISORY
HEALTHCARE FACILITY CHANGES AS A
RESULT OF READING PENNSYLVANIA PATIENT
SAFETY ADVISORY ARTICLES
Advisory: Early Detection of Sepsis in Pennsylvania’s Long-Term Care Residents— Added to QAPI initiative
— Staff educated on early warning signs
— Sepsis protocol pilot to MEC for input
MS17
095
C. diff, Clostridium difficile infection; MEC, medical executive committee; PI, performance improvement; PPE, personal protective equipment; QA, quality assurance; QAPI, Quality assurance and performance improvement.
Survey respondents who indicated that they used one or more of the Authority tools gave the majority of the tools high scores for their usefulness in increasing staff knowl-edge about infection prevention and control, identifying specific areas in which to direct infection control resources and helping infection prevention analysts perform their
job. Most impressive was the response from multiple respondents that a decrease in HAIs in their respective facilities was attributed to use of one or more of the Au-thority tools. Figure 1 shows how the facilities scored the usefulness of 11 tools in decreasing HAIs. All of the tools are accompanied by an Advisory article.

Pennsylvania Patient Safety Authority 2016 Annual Report 51
Healthcare-Associated Infection Advisory PanelIn response to the requirements of Act 52 of 2007,4 the Authority’s board of directors approved a panel of infec-tion control experts to help implement the Act. The role of the HAI Advisory panel is to provide advice and guidance to the Authority and other state agencies, such as Penn-sylvania Department of Health, in implementing the HAI legislation.
The Advisory panel met in June 2016 to review CDC changes to UTI criteria and to discuss potential changes to PA-PSRS and overall guidance from the panel. The panel suggested aligning UTI reporting in PA-PSRS with national
criteria, adding notes to the PA-PSRS user manual with the UTI criteria changes, and providing facilities with the updated information through a program memorandum.
The panel met in December 2016 to discuss an increase in central line–associated bloodstream infections and bloodstream infections (CLABSIs/BSIs), a decrease in catheter-associated urinary tract infections (CAUTI), new baseline HAI rates from CDC, CDC‘s standardized infec-tion ratio (SIR) method versus Pennsylvania’s SIR method, and the new CMS long-term care guidelines. The Depart-ment, which currently calculates Pennsylvania’s baseline
MS17
096
0 10 20 30 40 50 60 70 80 90 100
0%
50%
25%
0%
50%
67%
100%
60%
16%
57%
63%
85%
51%
69%
58%
63%
67%
58%
69%
76%
83%
75%
Long Term Care Best Practice Assessment
INTERACT Stop and Watch Early Warning Tool
Scabies Transmission, Symptoms,Diagnosis and Control Poster
Scabies Case/Contact Investigation Line List
Scabies Outbreak Control Checklist
Antibiotic Use Best Practices/Suboptimal Practices Decision Tree
Acute Gastroenteritis Outbreak Case Log
Norovirus Outcome andProcess Measure Worksheet
Norovirus Preparedness Checklist
Decision-Making Map to ImproveHand Hygiene Behavior
Patient Safety Impact Assessment Tool
Nursing home Hospital
TOOLKIT
PERCENTAGE*
Figure 1. The Usefulness of Authority Toolkits in Decreasing HAI Rates
* Among survey respondents who used one or more Authority tools, percentage who found tool useful.

2016 Annual Report Pennsylvania Patient Safety Authority 52
HAI rates, provided an overview of CDC’s revised hospital baseline calculations. Feedback from the panel of experts provided guidance to the Department to facilitate align-ment with CDC criteria for hospital data.
The HAI Advisory panel continues to meet to discuss HAI-related topics. A new HAI Advisory panel member was added and was to begin participating in activities in 2017. See Figure 2.
Aligned PA-PSRS LTC UTI reporting with national
criteria
New CMS LTC guidelines
Updated PA-PSRS LTC
user’s manual with UTI criteria
changes
Acute care CLABSI & BSI increase and
CAUTI decrease
Disseminated LTC program memo aboutUTI criteria changes
Acutecare CDC
re-baselining discussion
Acute care CDC vs. PA SIR
discussion
MS17
097
Figure 2. HAI Advisory Panel Activities
Emergency PreparednessThe Authority, the Department, the Hospital and Health-system Association of Pennsylvania (HAP), and local health departments have worked together over the past two years to help Pennsylvania acute-care facilities prepare for epi-sodic biological threats by providing consultation before and during site visits. The Authority provides infection prevention and control expertise for the following:
• Employee health
• Patient safety and holistic care
• System design
• Workflow management
• Equipment evaluation
• Personal protective equipment use
• Suggestions for simulation and practice drills
Although these activities fall under the auspices of Ebola disease preparedness and build on CDC’s Rapid Ebola Preparedness team visits, the Authority has supported and worked with Pennsylvania facilities on emergency preparedness since 2014. The Authority looks forward to continuing the partnerships with the Department, HAP, local health departments, and the acute-care facilities that have been designated as biologic hazard preparedness treatment centers or that continue to strive for that status.
BSI, Bloodstream infection; CAUTI, catheter-associated urinary tract infection; CDC, Centers for Disease Control and Prevention; CLABSI, central line–associated bloodstream infection; CMS, Centers for Medicare and Medicaid Services; LTC, long-term care; LTCF, long-term care facility; PA-PSRS, Pennsylvania Patient Safety Reporting System; PA, Pennsylvania; SIR, standardized infection ratio; UTI, urinary tract infection.

Pennsylvania Patient Safety Authority 2016 Annual Report 53
Nursing Home Data AnalysisThe year 2016 was the second full calendar year of data from nursing homes reported through PA-PSRS using the revised McGeer criteria.5 Authority analysts grouped several infection classifications into specific care areas because this practice helps nursing homes concentrate their surveillance, resources, and prevalence investigations. Individual facili-ties can access reports about their own HAI occurrences in specific patient care areas in the PA-PSRS nursing home HAI analytics tab. In 2016, Pennsylvania nursing homes reported 27,544 HAI events through PA-PSRS, a 13% de-crease from the 31,672 submitted in 2015.
In previous reports, analysts have provided figures and tables depicting trends of nursing home HAI in Pennsylva-nia. Because 2016 represents the second calendar year
of data based on the McGeer criteria, comparison in this report of two data points would have no statistical signifi-cance in terms of realizing or predicting trends.6 The 2017 annual report will make possible testing of these data for trends, because three calendar years will be avaliable for statistical analysis.
However, comparison of lower respiratory tract infection (LRTI) events is provided (in subsequent sections) by month and year because they are affected by seasonal variabil-ity and the influence of community disease pressure on the nursing home. A year-to-year comparison of device-related bloodstream infections is also provided to draw attention to the observation by Authority analysts that the number of reports increased in most months.
Analysis Method
Of the 703 facilities active as of December 31, 2016, basic validation criteria were met by 678 (96.4%) facili-ties, spanning five care areas.*
The Authority excluded 25 facilities for analysis based on the following (where relevant, comparisons to exclusions in 2015 are provided):
• Resident days were not entered for every month of 2016; 8 nursing homes were excluded, compared with 17 in 2015.
• Nursing homes had a month during which occu-pancy was above 100% or below 50%. Occupancy is calculated by dividing the number of resident days by the number of beds listed for each facility. The
quotient is then divided by the number of days in each month. In the 2016 data, 16 nursing homes were excluded, compared to 21 in 2015.
• No nursing homes were excluded at the unit level for reporting infections without accompanying resi-dent days in 2016 data.
• One nursing home was excluded from analysis for CAUTIs in 2016 data because CAUTIs were reported without accompanying catheter days.
• No nursing homes were excluded from analysis for CLABSIs in 2016 data for reporting CLABSIs without accompanying central-line days.
Urinary Tract Infection
Table 1 shows 2016 UTIs by care area and in aggregate total. CAUTI overall has the greatest rates of the UTI category, followed by symptomatic urinary tract infection (SUTI), then both of the asymptomatic bacteremic urinary tract infection (ABUTI) types.
* The following sections and associated tables and graphs include breakdowns by care area where applicable. Care areas are defined in the PA-PSRS Training Manual and Users’ Guide. Nursing Home Event Reporting.7

2016 Annual Report Pennsylvania Patient Safety Authority 54
CAUTI
Ventilator-dependent units seem to have significantly lower CAUTI rates as compared with other units. Demen-tia and mixed units appear to have the highest rates of CAUTI (Figure 3). The dementia units have a very low rate of device use, signaling that it may be difficult to lower their CAUTI rate further unless novel care practices are developed to address prevention. The skilled nursing/short-term rehabilitation (SN/STR) units have the highest
device use rate. Compared with 2015 data, SN/STR units experienced a decrease in CAUTI, albeit not statistically significant:
• 2015: rate 0.85 (95% confidence interval [CI], 0.77 to 0.93)
• 2016: rate 0.82 (95% CI, 0.74 to 0.91)
SUTI
SUTI (Figure 4) remains low overall; however, it is most prevalent in mixed and SN/STR units.
ABUTI
Both C types are depicted as having pooled rates of zero. ABUTI signals the transformation of an asymptomatic UTI into a bloodstream infection, essentially sepsis or at least bacteriemia. ABUTI should remain a focus from a
prevention standpoint in all environments regardless of rate interpretation because of its potential for life- theatening consequences.
Respiratory Tract Infection
Pneumonia continues to be the predominant infection type in all care areas (Table 2). The rates of other lower respi-
ratory tract infection (LRTI) types remain fairly consistent throughout the months, with the exception of influenza.
Influenza
The incidence of influenza in January 2016 as compared to January 2015 was lower in terms of LRTI rates (Fig-ure 5), probably because of the influence of annual and seasonal variability. The rate of influenza has a temporal association with the rate of pneumonia within this popula-tion of patients. CDC FluView data (Figures 6 and 7) show the national impact of influenza by week. When data in these figures is combined to equate to calendar year 2016, in terms of trends, the resulting national laboratory data is similar epidemiologically with Pennsylvania event reports through PA-PSRS in 2016 (Figure 8).
This similarity in statewide and national influenza trends reinforces the need for continued preventative measures that protect residents in a nursing home facility from
influenza when the incidence in the community is unusu-ally large. For example, nursing homes may consider screening visitors for respiratory illness before or during a visit, then provide just-in-time education about respiratory etiquette, mask use, and hand hygiene.
Other interventions nursing homes may wish to consider include placing signage and providing materials such as masks, hand sanitizer, and tissues at entrances, which could help protect residents from illness and heighten awareness of visitors about their impact on the health of residents. Resident education and their use of respiratory etiquette, as well as appropriate use of isolation, could be areas of focus.
Gastrointestinal Infection
Gastrointestinal infections in 2016 were primarily C. dif-ficile and norovirus (Table 3). There were few reports of bacterial gastrointestinal infections.

Pennsylvania Patient Safety Authority 2016 Annual Report 55
C. difficile
The rate of C. difficile infection was highest in the ventila-tor dependent units, which may be related to the fact that the ventilator dependent units also experienced a higher rate of pneumonia as compared with other unit types (Table 2). According to Chmielewska and co-authors, “One of the most common gastrointestinal infections after the antibiotic treatment of community or nosocomial pneumonia is caused by the anaerobic spore Clostridium difficile.”8 Given the higher acuity and nature of the constellation of patients on ventilator dependent units and their susceptibility to respiratory infection, these units may be prime areas of focus for antibiotic stewardship pro-grams for the prevention of C. difficile infection.
A statistically significant decrease in the confidence inter-val in gastrointestinal total infections occurred between 2015 and 2016:
• 2015 rate per 1,000 resident days: 0.15 (95% CI, 0.15 to 0.16)
• 2016 rate per 1,000 resident days: 0.12 (95% CI, 0.12 to 0.13)
• This reduction is likely atributed to a reduction in the rate of norovirus with a positive laboratory result as well as norovirus by Kaplan criteria. Analysis of this difference is impossible without national trend data in order to identify external pressure and seasonality.9
Norovirus
CDC’s “U.S. Trends of Norovirus-associated Outcomes Figures” webpage was last reviewed on June 24, 2016, and last updated on October 30, 2013.9 To aid Pennsyl-vania nursing homes, Figure 9 provides seasonal trends to help nursing homes prepare for norovirus in the coming year associated with timing and expected duration of
external pressure. A norovirus outbreak is defined as three or more cases of norovirus defined within a three-day period.10 Further, Figure 9 shows the number of reports from nursing homes that did or did not meet the norovi-rus outbreak definition.
Skin and Soft Tissue Infection
Cellulitis, soft tissue, or wound infection remain constant throughout the defined care areas, which is consistent with the 2015 annual report. The incidence of both scabies and conjunctivitis is present in all care areas. Units for ventilator-dependent patients seem to experience more conjunctivitis in general. The Authority encourages staff
in ventilator dependent units, as well as others, to assess infection-control practices, such as hand hygiene and iso-lation practices, and to conduct root-cause analysis when scabies or conjunctivitis cases occur, to build knowledge and prevention strategies. See Table 4 for 2016 events.
Central Line–Associated Blood Stream Infection
CLABSI is split into three separate categories: dialysis lines, temporary lines, and permanent lines. The definition for each line type is available in Figure 11.
A rate table is not included in this analysis because the pooled rates by care area for 2016 remain at 0.0. CLABSI is measured as a rate per 1,000 central line days.11 In circumstances in which CLABSI rates are very low, even zero, there may still be infections happening. For example, Pronovost and co-authors noted that, after their interven-tion aimed at CLABSI reduction, “within 3 months after implementation the median infection rate was 0.”12 That is
to say, the median rate per 1,000 central line days was 0, not that there were no infections occurring.
Pennsylvania nursing homes reported more CLABSI events in 2016 than in 2015 (Figures 10 and 11). Because only two years of data are available for analysis, there are too few data points to predict whether this will become an ongoing trend. According to the literature, mortality rates because of CLABSI are between 12% and 25% and costs are between $3,700 and $36,000 per occurrence.13,14 CLABSI should remain a focus for all care areas that house residents with central lines regardless of zero or

2016 Annual Report Pennsylvania Patient Safety Authority 56
very low-pooled rates of infection. The Authority encour-ages facilities to assess practices related to the care and maintenance of central lines and adhere to accepted clini-
cal standards. Facilities could also engage dialysis centers in conversations about care and maintenance of dialysis lines, to coordinate care and maintenance.
Conclusion
The analytics presented herein related to HAI are no lon-ger static yearly reports. Upon login to PA-PSRS, nursing homes can access facility-specific data as well as state-wide and peer group data through the “Analytical Data Tools Menu”; the data are updated daily. The Authority
encourages individual facilities to use the analytics within PA-PSRS to lead continuous performance improvement interventions at the facility level.
See following pages for data tables and figures. Note: Table rows indicating totals show the number of nursing homes reporting for the given type of infection with each unit name. This is not to be confused with the sum of the unit types for that infection. There may be overlap of unit types reporting at any given facility.

Pennsylvania Patient Safety Authority 2016 Annual Report 57
Table 1. Urinary Tract Infections, Pooled Mean Rates, by Subcategory and Care Unit, 2016
UNIT NAME (N)
NUMBER OF INFECTIONS
RESIDENT DAYS
CATHETER DAYS
DEVICE UTILIZATION RATE*
POOLED INFECTION RATE (95% CI)†,‡
CAUTI—Catheter in place with localizing urinary signs or symptoms or catheter removed within the past 2 calendar days at the facility
Dementia unit (25) 33 2,293,538 37,318 0.016 0.88 (0.58 - 1.19)
Mixed unit (118) 335 7,739,418 372,521 0.048 0.9 (0.8 - 1)
Nursing unit (107) 281 8,426,415 355,114 0.042 0.79 (0.70 - 0.88)
SN/STR unit (157) 392 9,109,775 475,261 0.052 0.82 (0.74 - 0.91)
Vent unit (7) 30 173,405 43,885 0.253 0.68 (0.44 - 0.93)
Total (356) 1,071 27,742,551 1,284,099 0.046 0.83 (0.78 - 0.88)
Device-Related ABUTI—Catheter in place without localizing urinary signs or symptoms
Dementia unit (1) 1 2,293,538 37,318 0.016 0.03 (0 - 0.08)
Mixed unit (10) 10 7,739,418 372,521 0.048 0.03 (0.01 - 0.04)
Nursing unit (7) 10 8,426,415 355,114 0.042 0.03 (0.01 - 0.05)
SN/STR unit (18) 23 9,109,775 475,261 0.052 0.05 (0.03 - 0.07)
Vent unit (2) 3 173,405 43,885 0.253 0.07 (0 - 0.15)
Total (37) 47 27,742,551 1,284,099 0.046 0.04 (0.03 - 0.05)
SUTI—Catheter not present or catheter removed for more than 2 calendar days within the facility with localizing urinary signs or symptoms
Dementia unit (84) 230 2,293,538 NA NA 0.1 (0.09 - 0.11)
Mixed unit (160) 1,328 7,739,418 NA NA 0.17 (0.16 - 0.18)
Nursing unit (181) 1,215 8,426,415 NA NA 0.14 (0.14 - 0.15)
SN/STR unit (252) 1,649 9,109,775 NA NA 0.18 (0.17 - 0.19)
Vent unit (7) 12 173,405 NA NA 0.07 (0.03 - 0.11)
Total (491) 4,434 27,742,551 NA NA 0.16 (0.16 - 0.16)
ABUTI—Catheter not present or catheter removed for more than 2 calendar days within the facility without localizing urinary signs or symptoms (may have fever)
Dementia unit (5) 9 2,293,538 NA NA 0 (0 - 0.01)
Mixed unit (31) 41 7,739,418 NA NA 0.01 (0 - 0.01)
Nursing unit (26) 39 8,426,415 NA NA 0 (0 - 0.01)
SN/STR unit (39) 70 9,109,775 NA NA 0.01 (0.01 - 0.01)
Vent unit (2) 2 173,405 NA NA 0.01 (0 - 0.03)
Total (93) 161 27,742,551 NA NA 0.01 (0 - 0.01)
Note: As reported through the Pennsylvania Patient Safety Reporting System (PA-PSRS) in 2016
ABUTI, Asymptomatic bacteremic urinary tract infection; CI, confidence interval; CAUTI, catheter-associated urinary tract infection; NA, not applicable; SN/STR, skilled nursing/short-term rehabilitation; SUTI, symptomatic urinary tract infection; vent, ventilator-dependent.* Device utilization rate (DUR): number of urinary catheter days ÷ number of resident days† Basic urinary tract infection (UTI) rate calculation: number of UTI ÷ number of resident days × 1,000 ‡ CAUTI rate calculation: number of CAUTI ÷ number of catheter days × 1,000

2016 Annual Report Pennsylvania Patient Safety Authority 58
0
1
2
3
4
5
6
MS17
284
Ventilator dependent unit
Nursing unit
Skilled nursing/short-term rehabilitation unit
Dementia unit
Mixed unit
DecNovOctSepAugJulJunMayAprMarFebJan
CAUTI RATES(PER 1,000 CATHETER DAYS)
MONTH
0.89 1.54 0.57 0.55 1.55 0.26 0.24 0.25 0.58 0.27 0.83 0.84
0.65 0.91 1.04 0.70 0.75 0.73 0.90 0.93 0.95 0.70 0.77 0.84
0.73 0.81 0.86 1.06 0.66 0.65 0.53 1.05 0.66 0.78 0.85 0.85
0.84 1.39 0.67 1.01 0.63 0.97 0.93 0.85 0.72 0.75 0.96 1.11
1.09 0.39 0.91 0.31 0.94 0.31 0.61 0.64 0.64 0.91 1.62 2.24
Figure 3. CAUTI Rates, by Care Unit and Month, 2016
0.0
0.1
0.2
0.3
0.4
0.5
0.6
0.7
0.8
MS17
285
Ventilator dependent unit
Nursing unit
Skilled nursing/short-term rehabilitation unit
Dementia unit
Mixed unit
DecNovOctSepAugJulJunMayAprMarFebJanMONTH
0.070.00 0.07 0.13 0.13 0.140.00 0.00 0.07 0.07 0.07 0.07
0.18 0.15 0.16 0.18 0.17 0.16 0.23 0.18 0.22 0.18 0.18 0.18
0.14 0.11 0.15 0.17 0.16 0.12 0.12 0.17 0.15 0.15 0.17 0.11
0.170.13 0.16 0.19 0.18 0.15 0.18 0.19 0.19 0.18 0.20 0.14
0.08 0.10 0.16 0.10 0.14 0.12 0.08 0.09 0.10 0.10 0.070.07
SUTI RATES(PER 1,000 RESIDENT DAYS)
Figure 4. SUTI Rates, by Care Unit and Month, 2016

Pennsylvania Patient Safety Authority 2016 Annual Report 59
Table 2. Respiratory Tract Infections, Pooled Mean Rates, by Subcategory and Care Unit, 2016
UNIT NAME (N)
NUMBER OF INFECTIONS
RESIDENT DAYS
POOLED INFECTION RATE (95% CI)*
Influenza—The resident has tested positive for influenza
Dementia unit (18) 55 2,293,538 0.02 (0.02 - 0.03)
Mixed unit (40) 131 7,739,418 0.02 (0.01 - 0.02)
Nursing unit (45) 135 8,426,415 0.02 (0.01 - 0.02)
SN/STR unit (62) 168 9,109,775 0.02 (0.02 - 0.02)
Vent unit (1) 4 173,405 0.02 (0 - 0.05)
Total (81) 493 27,742,551 0.02 (0.02 - 0.02)
Influenza-like illness—The resident has fever, influenza is suspected. Testing for influenza is negative or not performed, there may be a dry cough, but no other overt signs
Dementia unit (9) 10 2,293,538 0 (0 - 0.01)
Mixed unit (13) 32 7,739,418 0 (0 - 0.01)
Nursing unit (17) 34 8,426,415 0 (0 - 0.01)
SN/STR unit (29) 37 9,109,775 0 (0 - 0.01)
Vent unit (0) 0 173,405 0 (0 - 0)
Total (137) 113 27,742,551 0 (0 - 0)
Lower respiratory tract infection—Chest radiograph is negative for pneumonia or a new infiltrate and the resident is without fever; or no chest radiograph performed
Dementia unit (81) 233 2,293,538 0.1 (0.09 - 0.11)
Mixed unit (137) 823 7,739,418 0.11 (0.1 - 0.11)
Nursing unit (152) 718 8,426,415 0.09 (0.08 - 0.09)
SN/STR unit (198) 1,132 9,109,775 0.12 (0.12 - 0.13)
Vent unit (9) 28 173,405 0.16 (0.1 - 0.22)
Total (426) 2,934 27,742,551 0.11 (0.1 - 0.11)
Pneumonia—Resident’s chest radiograph is positive for pneumonia or a new infiltrate
Dementia unit (120) 377 2,293,538 0.16 (0.15 - 0.18)
Mixed unit (186) 1,548 7,739,418 0.2 (0.19 - 0.21)
Nursing unit (206) 1,451 8,426,415 0.17 (0.16 - 0.18)
SN/STR unit (283) 1,958 9,109,775 0.21 (0.21 - 0.22)
Vent unit (9) 99 173,405 0.57 (0.46 - 0.68)
Total (198) 5,433 27,742,551 0.2 (0.19 - 0.2)
Total Respiratory Tract Infections
Dementia unit (136) 675 2,293,538 0.29 (0.27 - 0.32)
Mixed unit (194) 2,534 7,739,418 0.33 (0.31 - 0.34)
Nursing unit (217) 2,338 8,426,415 0.28 (0.27 - 0.29)
SN/STR unit (303) 3,295 9,109,775 0.36 (0.35 - 0.37)
Vent unit (11) 131 173,405 0.76 (0.63 - 0.88)
Total (577) 8,973 27,742,551 0.32 (0.32 - 0.33)
Note: As reported through the Pennsylvania Patient Safety Reporting System (PA-PSRS) in 2016 CI, Confidence interval; SN/STR, skilled nursing/short-term rehabilitation; vent, ventilator dependent. * Rate calculation: number of infections ÷ number of resident days × 1,000

2016 Annual Report Pennsylvania Patient Safety Authority 60
0.0
0.2
0.4
0.6
0.8
1.0
1.2
1.4
MS17
286
MONTH (BY YEAR)
201620152016201520162015201620152016201520162015201620152016201520162015201620152016201520162015
Influenza — The resident has tested positive for influenza
Chest radiograph is negative for pneumonia or a new infiltrate and the resident is without fever
Resident's chest radiograph is positive for pneumonia or new infiltrate
DecNovOctSepAugJulJunMayAprMarFebJan
No chest radiograph performed or radiograph is negative for pneumonia or new infiltrate
0.06
0.01
0.01
0.09
0.20
0.00
0.00
0.01
0.08
0.17
0.00
0.00
0.02
0.08
0.19
0.00
0.00
0.01
0.07
0.18
0.00
0.00
0.02
0.08
0.17
0.00
0.00
0.01
0.09
0.18
0.00
0.01
0.01
0.08
0.18
0.00
0.00
0.01
0.08
0.19
0.00
0.00
0.02
0.06
0.16
0.00
0.00
0.01
0.08
0.18
0.00
0.00
0.02
0.06
0.17
0.00
0.00
0.02
0.11
0.22
0.00
0.00
0.01
0.07
0.17
0.00
0.00
0.02
0.11
0.22
0.01
0.00
0.01
0.08
0.16
0.01
0.00
0.01
0.09
0.18
0.06
0.01
0.02
0.10
0.22
0.04
0.01
0.02
0.16
0.24
0.05
0.01
0.02
0.12
0.22
0.07
0.02
0.02
0.13
0.24
0.01
0.00
0.02
0.13
0.27
0.19
0.02
0.02
0.15
0.23
0.01
0.00
0.02
0.11
0.22
0.60
0.12
0.04
0.20
0.29
The resident has fever, influenza is suspected. Testing for influenza is negative or not performed;there may be a dry cough, but no other overt signs
LRTI RATES(PER 1,000 RESIDENT DAYS)
Figure 5. Lower Respiratory Tract Infection (LRTI) Rates, by Criteria Definition and Month, 2015 versus 2016

Pennsylvania Patient Safety Authority 2016 Annual Report 61
Figure 6. CDC FluView by Week, 2015–2016
Source: From Centers for Disease Control and Prevention. Influenza positive tests reported to CDC by US public health laboratories, national summary, 2015–2016, week ending Oct 01, 2016 [online]. [cited 2017 Mar 26]. https://gis.cdc.gov/grasp/fluview/fluportaldashboard.html
Figure 7. CDC FluView by week, 2016-2017
Source: From Centers for Disease Control and Prevention. Influenza positive tests reported to CDC by US public health laboratories, national summary, 2016–2017, week ending Mar 18, 2017 [online]. [cited 2017 Mar 26]. https://gis.cdc.gov/grasp/fluview/fluportaldashboard.html

2016 Annual Report Pennsylvania Patient Safety Authority 62
0
30
60
90
120
150
MS17
287
Ventilator dependent unit
Nursing unit
Skilled nursing/short-term rehabilitation unit
Dementia unit
Mixed unit
DecNovOctSepAugJulJunMayAprMarFebJan
NUMBER OF REPORTS
MONTH
0
47
28
42
30
0
3
2
1
1
0
0
0
0
0
0
0
1
2
0
0
0
0
0
0
0
0
2
1
0
0
1
1
0
0
0
3
5
6
7
0
54
52
28
3
0
25
41
45
14
4
22
2
5
0
0
13
1
1
0
Figure 8. Influenza Reports, by Care Unit and Month, 2016

Pennsylvania Patient Safety Authority 2016 Annual Report 63
Table 3. Gastrointestinal Infections, Pooled Mean Rates, by Subcategory and Care Unit, 2016
UNIT NAME (N)
NUMBER OF INFECTIONS
RESIDENT DAYS
POOLED INFECTION RATE (95% CI)*
Clostridium difficile—The resident has diarrhea and a stool sample is positive for C. difficile toxin A or B, or a toxin-producing C. difficile organism is identified from stool culture or by molecular testing, or Pseudomembranous colitis identified through endoscopic examination, surgery, or biopsy
Dementia unit (32) 53 2,293,538 0.02 (0.02 - 0.03)
Mixed unit (160) 548 7,739,418 0.07 (0.06 - 0.08)
Nursing unit (150) 447 8,426,415 0.05 (0.05 - 0.06)
SN/STR unit (250) 1,074 9,109,775 0.12 (0.11 - 0.12)
Vent unit (11) 43 173,405 0.25 (0.17 - 0.32)
Total (480) 2,165 27,742,551 0.08 (0.07 - 0.08)
Norovirus—The resident has diarrhea and/or vomiting and laboratory results are positive for Norovirus
Dementia unit (1) 1 2,293,538 0 (0 - 0)
Mixed unit (7) 15 7,739,418 0 (0 - 0)
Nursing unit (4) 4 8,426,415 0 (0 - 0)
SN/STR unit (13) 21 9,109,775 0 (0 - 0)
Vent unit (0) 0 173,405 0 (0 - 0)
Total (22) 41 27,742,551 0 (0 - 0)
Bacterial gastroenteritis—The resident has diarrhea and/or vomiting and laboratory results are positive for a bacteriologic pathogen
Dementia unit (1) 1 2,293,538 0 (0 - 0)
Mixed unit (6) 7 7,739,418 0 (0 - 0)
Nursing unit (5) 5 8,426,415 0 (0 - 0)
SN/STR unit (7) 8 9,109,775 0 (0 - 0)
Vent unit (0) 0 173,405 0 (0 - 0)
Total (19) 21 27,742,551 0 (0 - 0)
Kaplan—Norovirus is suspected based on Kaplan criteria; the resident has diarrhea and/or vomiting and C. difficile results are negative
Dementia unit (17) 137 2,293,538 0.06 (0.05 - 0.07)
Mixed unit (20) 294 7,739,418 0.04 (0.03 - 0.04)
Nursing unit (25) 325 8,426,415 0.04 (0.03 - 0.04)
SN/STR unit (30) 417 9,109,775 0.05 (0.04 - 0.05)
Vent unit (0) 0 173,405 0 (0 - 0)
Total (67) 1,173 27,742,551 0.04 (0.04 - 0.04)
Total Gastrointestinal Infections Reported
Dementia unit (32) 192 2,293,538 0.08 (0.07 - 0.1)
Mixed unit (160) 864 7,739,418 0.11 (0.1 - 0.12)
Nursing unit (150) 781 8,426,415 0.09 (0.09 - 0.1)
SN/STR unit (250) 1,520 9,109,775 0.17 (0.16 - 0.18)
Vent unit (11) 43 173,405 0.25 (0.17 - 0.32)
Total (504) 3,400 27,742,551 0.12 (0.12 - 0.13)
Note: As reported through the Pennsylvania Patient Safety Reporting System (PA-PSRS) in 2016 CI, Confidence interval; SN/STR, skilled nursing/short-term rehabilitation; vent, ventilator dependent.* Rate calculation: number of infections ÷ number of resident days × 1,000

2016 Annual Report Pennsylvania Patient Safety Authority 64
0
5
10
15
20
25
MS17
288
DecNovOctSepAugJulJunMayAprMarFebJan
NUMBER OF NURSINGHOME REPORTS
MONTH
Without an outbreak
With an outbreak 10 13 14 11 4 0 0 1 1 1 2 12
2 3 7 4 1 4 3 1 0 1 2 6
Figure 9. Norovirus Outbreaks by Month, 2016

Pennsylvania Patient Safety Authority 2016 Annual Report 65
Table 4. Skin and Soft Tissue Infections, Pooled Mean Rates, by Subcategory and Care Unit, 2016
UNIT NAME (N) NUMBER OF INFECTIONS RESIDENT DAYSPOOLED INFECTION RATE (95% CI)*
Cellulitis, soft tissue, or wound infection
Dementia unit (103) 317 2,293,538 0.14 (0.12 - 0.15)
Mixed unit (183) 1,597 7,739,418 0.21 (0.2 - 0.22)
Nursing unit (206) 1,609 8,426,415 0.19 (0.18 - 0.2)
SN/STR unit (277) 1,769 9,109,775 0.19 (0.19 - 0.2)
Vent unit (11) 56 173,405 0.32 (0.24 - 0.41)
Total (546) 5,348 27,742,551 0.19 (0.19 - 0.2)
Conjunctivitis
Dementia unit (101) 365 2,293,538 0.16 (0.14 - 0.18)
Mixed unit (150) 1,004 7,739,418 0.13 (0.12 - 0.14)
Nursing unit (177) 1,099 8,426,415 0.13 (0.12 - 0.14)
SN/STR unit (200) 975 9,109,775 0.11 (0.1 - 0.11)
Vent unit (9) 28 173,405 0.16 (0.1 - 0.22)
Total (455) 3,471 27,742,551 0.13 (0.12 - 0.13)
Scabies
Dementia unit (14) 36 2,293,538 0.02 (0.01 - 0.02)
Mixed unit (27) 42 7,739,418 0.01 (0 - 0.01)
Nursing unit (19) 44 8,426,415 0.01 (0 - 0.01)
SN/STR unit (41) 98 9,109,775 0.01 (0.01 - 0.01)
Vent unit (0) 0 173,405 0 (0 - 0)
Total (91) 220 27,742,551 0.01 (0.01 - 0.01)
Total Skin and Soft Tissue Infections
Dementia unit (140) 718 2,293,538 0.31 (0.29 - 0.34)
Mixed unit (205) 2,643 7,739,418 0.34 (0.33 - 0.35)
Nursing unit (221) 2,752 8,426,415 0.33 (0.31 - 0.34)
SN/STR unit (309) 2,842 9,109,775 0.31 (0.3 - 0.32)
Vent unit (12) 84 173,405 0.48 (0.38 - 0.59)
Total (589) 9,039 27,742,551 0.33 (0.32 - 0.33)
Note: As reported through the Pennsylvania Patient Safety Reporting System (PA-PSRS) in 2016 CI, Confidence interval; SN/STR, skilled nursing/short-term rehabilitation; vent, ventilator dependent.* Rate calculation: number of infections ÷ number of resident days × 1,000
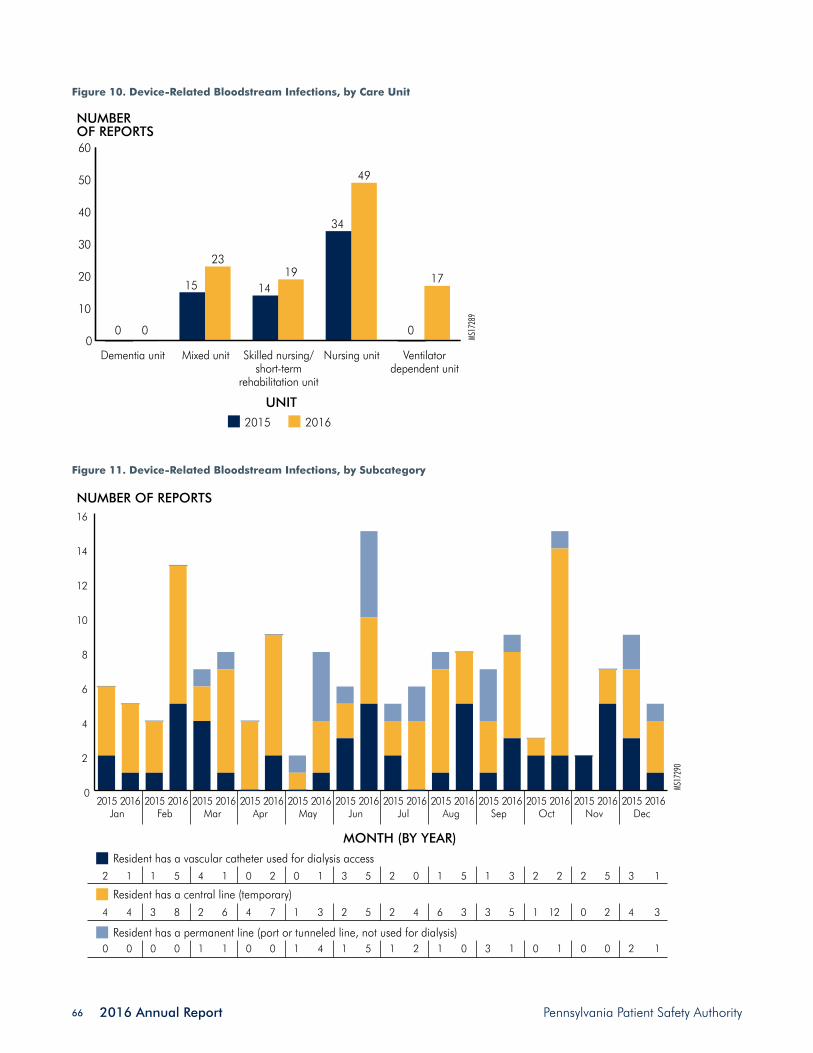
2016 Annual Report Pennsylvania Patient Safety Authority 66
Figure 10. Device-Related Bloodstream Infections, by Care Unit
Figure 11. Device-Related Bloodstream Infections, by Subcategory
0
10
20
30
40
50
60
MS17
289
Ventilatordependent unit
Nursing unitSkilled nursing/short-term
rehabilitation unit
Dementia unit
0
15 14
34
0
Mixed unit
NUMBEROF REPORTS
UNIT2015 2016
0
2319
49
17
0
2
4
6
8
10
12
14
16
MS17
290
NUMBER OF REPORTS
MONTH (BY YEAR)
201620152016201520162015201620152016201520162015201620152016201520162015201620152016201520162015
Resident has a vascular catheter used for dialysis access
Resident has a central line (temporary)
Resident has a permanent line (port or tunneled line, not used for dialysis)
DecNovOctSepAugJulJunMayAprMarFebJan
4 4 3 8 2 6 4 7 1 3 2 5 2 4 6 3 3 5 1 12 0 2 4 3
2 1 1 5 4 1 0 2 0 1 3 5 2 0 1 5 1 3 2 2 2 5 3 1
0 0 0 0 1 1 0 0 1 4 1 5 1 2 1 0 3 1 0 1 0 0 2 1

Pennsylvania Patient Safety Authority 2016 Annual Report 67
Notes
1. HAI data and statistics. [internet]. Atlanta (GA): Centers for Disease Control and Prevention (CDC); 2016 Oct 5 [accessed 2017 Apr 07]. [4 p]. Available: https://www.cdc.gov/hai/surveillance/index.html.
2. Herzig C, DIck AW, Sorbero M, Pogrozelska-Maziarz M, Crawford Cohen C, Stone P. [896] Longitudinal trends in infection rates in US nursing homes, 2006 - 2011. IDWeek 2014. October 8-12, 2014; Philadelphia (PA). 2014 Oct 10. Also available: https://idsa.confex.com/idsa/2014/webprogram/Paper46630.html.
3. National and state healthcare associated infections prog-ress report. Atlanta (GA): Centers for Disease Control and Prevention (CDC); 2016. 140 p. Also available: https://www.cdc.gov/hai/surveillance/progress-report/index.html.
4. Medical Care Availability and Reduction of Error (MCARE) Act - Reduction and Prevention of Health Care-Asso-ciated Infection and Long-Term Care Nursing Facilities Act of July 20, 2007, P.L. 331, No.52, Cl. 40. http://www.legis.state.pa.us/cfdocs/legis/li/uconsCheck.cfm?yr=2007&sessInd=0&act=52.
5. Stone ND, Ashraf MS, Calder J, Crnich CJ, Crossley K, Drinka PJ, Gould CV, Juthani-Mehta M, Lautenbach E, Loeb M, Maccannell T, Malani PN, Mody L, Mylotte JM, Nicolle LE, Roghmann MC, Schweon SJ, Simor AE, Smith PW, Stevenson KB, Bradley SF, Society for Healthcare Epidemiology Long-Term Care Special Interest Group. Surveillance definitions of infections in long-term care facilities: revisiting the McGeer criteria. Infect Control Hosp Epidemiol. 2012 Oct;33(10):965-77. Also available: http://www.ncbi.nlm.nih.gov/pmc/articles/PMC3538836/. PMID: 22961014
6. Edwards RD, Magee J, Bassetti WH. Technical analysis of stock trends. 10th ed. Boca Raton (FL): CRC Press; 2012. 624 p.
7. Pennsylvania Patient Safety Authority. Training manual and users’ guide. Nursing home event reporting. Version 4.0. Harrisburg (PA): Pennsylvania Patient Safety Authority; 2016 Oct 13.
8. Chmielewska M, Zycinska K, Lenartowicz B, Hadzik-Blaszcyzk M, Cieplak M, Kur Z, Wardyn KA. Clostridium difficile infection due to pneumonia treatment: mortality risk models. In: Pokorski M, editor(s). Pathobiology of Pul-monary Disorders. 2016. p. 59-63. Also available: DOI: 10.1007/5584_2016_160.
9. U.S. trends of norovirus-associated outcomes figures. [internet]. Atlanta (GA): Centers for Disease Control and Prevention (CDC); [accessed 2017 Mar 19]. Available: https://www.cdc.gov/norovirus/trends-outbreaks-figure-1.html#fig1a.
10. Kaplan JE, Feldman R, Campbell DS, Lookabaugh C, Gary GW. The frequency of a Norwalk-like pattern of illness in outbreaks of acute gastroenteritis. Am J Public Health. 1982 Dec;72(12):1329-32. PMID: 6291414
11. Centers for Disease Control and Prevention (CDC). Bloodstream Infection Event (Central Line-Associated Bloodstream Infection and non-central line-associated Bloodstream Infection). Atlanta (GA): Centers for Disease Control and Prevention (CDC); 2017 Jan. 38 p. Also avail-able: https://www.cdc.gov/nhsn/pdfs/pscmanual/4psc_clabscurrent.pdf.
12. Pronovost P, Needham D, Berenholtz S, Sinopoli D, Chu H, Cosgrove S, Sexton B, Hyzy R, Welsh R, Roth G, Bander J, Kepros J, Goeschel C. An intervention to decrease cath-eter-related bloodstream infections in the ICU. N Engl J Med. 2006 Dec 28;355(26):2725-32. PMID: 17192537
13. Centers for Disease Control and Prevention (CDC). Vital signs: central line-associated blood stream infections--Unit-ed States, 2001, 2008, and 2009. MMWR Morb. Mortal. Wkly. Rep.. 2011 Mar 4;60(8):243-8. PMID: 21368740
14. Scott II RD. The direct medical costs of healthcare-associated infections in U.S. hospitals and the benefits of prevention. Atlanta (GA): Centers for Disease Control and Prevention (CDC); 2009 Mar. 13 p. Also available: http://www.cdc.gov/HAI/pdfs/hai/Scott_CostPaper.pdf.


Pennsylvania Patient Safety Authority 2016 Annual Report 69
The Pennsylvania Patient Safety Advisory
Through its Pennsylvania Patient Safety Advisory, the Pennsylvania Patient Safety Authority continues to help improve patient safety in Pennsylvania. From the first issue in March 2004 through December 2016, the Advisory has provided nearly 540 safety-focused articles. Patient safety events—including “good catches” and unsafe conditions—reported by Pennsylvania healthcare facili-ties, requests for information from Pennsylvania healthcare providers, and review of the medical and patient safety literature prompts analysis of the aggregate event data; specific examples from 2016 include the following:
• A select set of patient safety measures—falls with harm, central line–associated bloodstream infec-tions, catheter-associated urinary tract infections, wrong-site surgeries, and high harm events—was analyzed to demonstrate patient safety improve-ments associated with the combined efforts of Pennsylvania healthcare facilities, statewide qual-ity improvement entities, and the Authority. The Authority estimates that through 2015, for these five measures alone, more than 2,600 lives and more than $147 million were saved.1
• Although rarely reported to the Authority in Penn-sylvania, incorrect-end colostomy formation using the distal bowl limb can potentially result in serious harm to patients or even death.2
• In a Pennsylvania event associated with a “good catch,” a healthcare worker noted that pads for an automated external defibrillator (AED) were incom-patible with the accompanying AED. Beyond just en-suring that all of the parts fit together correctly on this particular AED, this person went further, and checked on the other similar devices throughout the facility.3
• Analysts estimate that an average of 1.7 newborn misidentification events occur daily in Pennsylvania, affecting 4.6 newborns per 1,000 births.4
• Through November 2015, Pennsylvania nurs-ing homes reported 484 cases of scabies and
37 outbreaks; hospital inpatient, emergency, and outpatient settings reported 110 events associated with scabies.5
• In an analysis of the most recent 10 years of events reported in Pennsylvania, analysts identified a 66.4% reduction in the number of opioid wrong-drug events reported, and a 79.4% reduction in the number of wrong-drug events involving mix-ups between morphine and HYDROmorphone.6
• Healthcare personnel are responsible for removing the tourniquet after intravenous insertion, phleboto-my, and anesthesia blocks are complete. An online video provides suggestions to help healthcare pro-viders overcome persistent challenges in ensuring tourniquet removal (https://youtu.be/fsc6chuPBkc).7
Overall, in responses collected through annual surveys conducted since 2005, Commonwealth facilities credit the Advisory with contributing to more than 4,650 structure and process improvements; the Authority assumes these numbers represent just the tip of the iceberg. Support-ing education and improvement endeavors constitute the primary objective of the Advisory, as follows:
“The Pennsylvania Patient Safety Advisory provides timely original scientific evidence and reviews of scientific evidence that can be used by healthcare systems and providers to improve healthcare-delivery systems and educate providers about safe healthcare practices. The emphasis is on problems reported to the Pennsylvania Patient Safety Authority, especially those associated with a high combination of frequen-cy, severity, and possibility of solution; novel problems and solutions; and problems in which urgent com-munication of information could have a significant impact on patient outcomes.”8
By introducing video presentations and heat map graph-ics, staff continued to enhance the readability and presentation of information during 2016. A graphic display of scabies transmission, symptoms, diagnosis,

2016 Annual Report Pennsylvania Patient Safety Authority 70
and control was a highlight. Articles consistently identi-fied and analyzed problems and challenges, presented narrative stories, and offered strategies and solutions. The Advisory also featured several articles addressing modern concepts and processes in patient safety and care delivery, such as using simulation to improve care, appreciating the essential human element in technology-driven care processes, and promoting the value of lessons learned through “good catches,” which stimulated system-wide
improvements. Finally, as noted in Educational Programs, Advisory-based, concise webinars allowed participants to interact with analysts and explore the principles of patient safety and methods to implement improvements.
The following pages illustrate the depth and breadth of the Authority’s Advisory in 2016, as well as during its 13-volume history, and its demonstrated value in the healthcare community.
Notes
1. Magee MC, Marella WM, Newstadt HM, Clarke JR, Doer-ing MC. The value of improving patient safety in Pennsyl-vania. Pa Patient Saf Advis. 2016 Dec;13(4):125-36. Also available: http://patientsafetyauthority.org/ADVISORIES/AdvisoryLibrary/2016/Dec;13(4)/Pages/125.aspx.
2. Feil M. Incorrect end colostomy formation using the distal bowel limb. Pa Patient Saf Advis. 2016 Sep;13(3):118-21. Also available: http://patientsafetyauthority.org/ADVISO-RIES/AdvisoryLibrary/2016/sep;13(3)/Pages/118.aspx.
3. Saves, system improvements, and safety-II. Pa Patient Saf Advis. 2016 Dec;13(4):171. Also available: http://patient-safetyauthority.org/ADVISORIES/AdvisoryLibrary/2016/dec;13(4)/Pages/171.aspx.
4. Wallace S. Newborns pose unique identification chal-lenges. Pa Patient Saf Advis. 2016 Jun;13(2):42-9. Also available: http://patientsafetyauthority.org/ADVISORIES/AdvisoryLibrary/2016/jun;13(2)/Pages/42.aspx.
5. Bradley S. Scabies: strategies for management and control. Pa Patient Saf Advis. 2016 Jun;13(2):66-73. Also available: http://patientsafetyauthority.org/ADVISORIES/ AdvisoryLibrary/2016/jun;13(2)/Pages/66.aspx.
6. Grissinger M. Decline in serious events and wrong-drug reports involving opioids in Pennsylvania facilities. Pa Patient Saf Advis. 2016 Mar;13(1):29-31. Also available: http://patientsafetyauthority.org/ADVISORIES/Advisory Library/2016/Mar;13(1)/Pages/29.aspx.
7. Magee M. The forgotten tourniquet - an update. Pa Patient Saf Advis. 2016 Mar;13(1):32-5. Also available: http://patientsafetyauthority.org/ADVISORIES/Advisory Library/2016/Mar;13(1)/Pages/32.aspx.
8. About the Pennsylvania Patient Safety Advisory. [internet]. Harrisburg (PA): Pennsylvania Patient Safety Authority; 2016 [accessed 2016 Jan 28]. [2 p]. Available: http://patientsafetyauthority.org/ADVISORIES/AdvisoryLibrary/Documents/editorial_info.pdf.

Pennsylvania Patient Safety Authority 2016 Annual Report 71
Incorrect-End Colostomies Preoperative Screening:
CollaborationOphthalmology Process
AssessmentWrong-Site Surgery: Updates
Surgery
Checklists Healthcare: Complex,
Adaptive, EvolvingI Am Patient
Safety Awards
Drug InteractionsIncorrect Patient Weights
Medication Errors involving StudentsPrescribing Errors
Opioids
Health Literacy Identifying Patients with Dementia Wrong-Site Surgery: Patient Engagement
2016 Articles
Patient and Family Involvement
Leadership
Medication
MS17
104
Content is grouped according to predominant patient safety foci. For more information by areas of focus, see “Patient Safety Focus” at http://patientsafetyauthority.org.
Blood TransfusionsForgotten Tourniquets Intraosseous LinesIsolation AwarenessMissed Respiratory TherapyThat Pesky Human Factor
Newborn IdentificationMaternal Serious Events
Postpartum Hemorrhage
MaternityTeamwork
Clostridium difficile InfectionsEarly Detection of SepsisInfection Control and CAUTIs Nursing Homes Reduce CAUTIsScabies
Infection Prevention
Innovation is Key Saves, System Improvements, and Safety IIValue of Improving Patient Safety
Computerized
Prescriber Order
Entry (CPOE) System
Evaluation
Scabies Transmission,
Symptoms,
Diagnosis, and
Control
Tourniquet Removal
and Discard Process
Simulation and Patient Safety Events
Can Simulation in situ Improve Patient Safety?
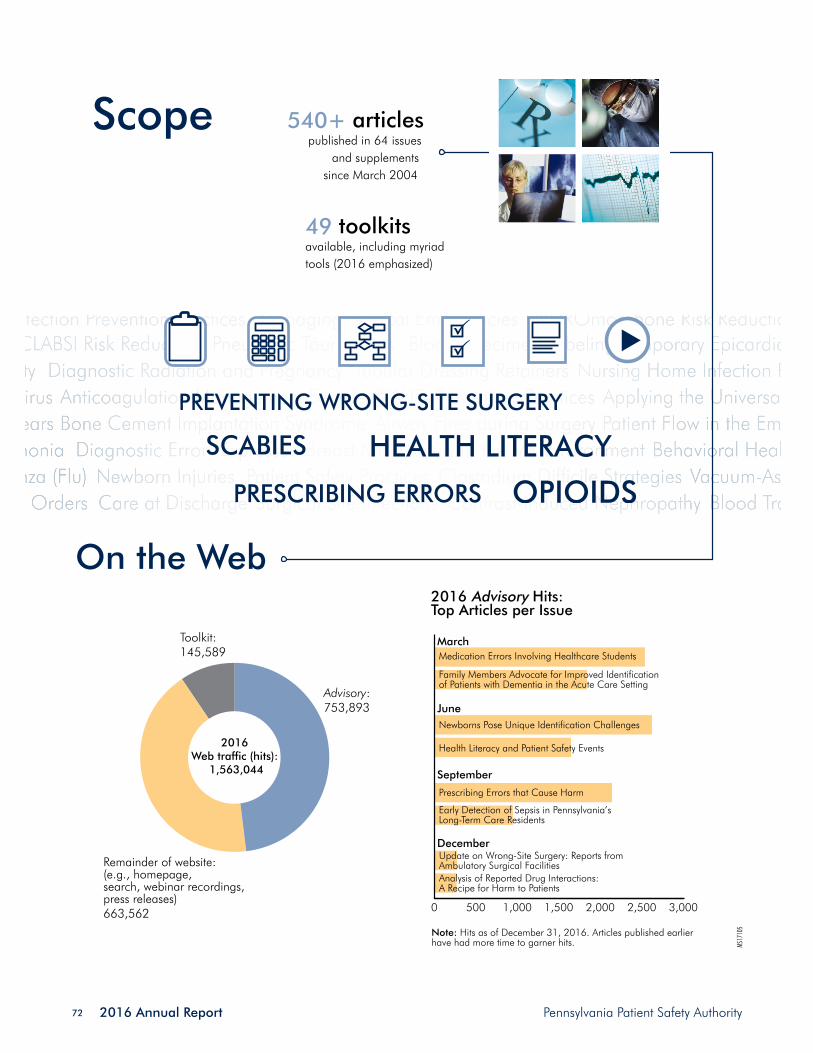
2016 Annual Report Pennsylvania Patient Safety Authority 72
Scope 540+ articles published in 64 issues
and supplements since March 2004
49 toolkits available, including myriad tools (2016 emphasized)
MS17
105
On the Web2016 Advisory Hits: Top Articles per Issue
0 500 1,000 1,500 2,000 2,500 3,000
Analysis of Reported Drug Interactions: A Recipe for Harm to Patients
Update on Wrong-Site Surgery: Reports from Ambulatory Surgical Facilities
Early Detection of Sepsis in Pennsylvania’s Long-Term Care Residents
Prescribing Errors that Cause Harm
Health Literacy and Patient Safety Events
Newborns Pose Unique Identification Challenges
Family Members Advocate for Improved Identification of Patients with Dementia in the Acute Care Setting
Medication Errors Involving Healthcare Students
December
September
June
March
Note: Hits as of December 31, 2016. Articles published earlier have had more time to garner hits.
2016 Web traffic (hits):
1,563,044
Remainder of website: (e.g., homepage, search, webinar recordings, press releases)663,562
Advisory:753,893
Toolkit:145,589

Pennsylvania Patient Safety Authority 2016 Annual Report 73
1,837Pennsylvania subscribers†
5,497Authority program recipients*
3,107 subscribers in the United States
Subscribers in 49 states, as well as Washington, DC, and Puerto Rico
MS17
106
Readership
Subscribers in 45 countries
3,276 subscribers worldwide
(top five, other than U.S. emphasized)
332 new subscribers in 2016
* Recipients include reporting system users from acute healthcare facilities and nursing homes, as well as board and panel members in Pennsylvania. These recipients are not included in the total numbers of PA/U.S./worldwide subscribers indicated above.
† Subscriber numbers reported through 2016 exclude any subscribers with email addresses that indicated lack of receipt (i.e., “bounced”) during 2016.

2016 Annual Report Pennsylvania Patient Safety Authority 74
Usefulness Relevance Readability
Acute-care Facilities
Nursing Homes
Weighted Average
Scientific Quality Educational Value
0 1 2 3 4 5
0 1 2 3 4 5
0 1 2 3 4 5
0 1 2 3 4 5
0 1 2 3 4 5
0 1 2 3 4 5
0 1 2 3 4 5 0 1 2 3 4 5
0 1 2 3 4 5
0 1 2 3 4 5
0 1 2 3 4 5
0 1 2 3 4 5
0 1 2 3 4 5
0 1 2 3 4 5
0 1 2 3 4 5
2016 Ratings of the Advisory
4,650+ documented* changes in Pennsylvania acute- care facilities and nursing homes directly attributed to Advisory articles since 2005
* According to Authority user surveys (internal reports): acute-care facilities (2005-2016) and nursing homes (2009-2016). † The Authority applies select articles for CME credit through the Pennsylvania Medical Society (http://www.pamedsoc.org). MS
1710
7
Value
“ We now ensure that someone, patient or significant other, has a complete understanding of post-op discharge instructions.”
“ The tracking forms are more helpful than what we were using. I was able to provide better and more useful information to staff.” “ We have patients’ height and weight taken
in preoperative area so it is accurate on H&P for procedure date.”
“ We have developed an antibiotic stewardship program—to be rolled out next week.”
Annual Survey Respondents
“ We are in the process of changing our electronic medical record and will incorporate your points”
12,320+ Advisory-based CME credits,
2006 through 2016†
Through 2016, the media or medical
literature attributed or mentioned
Authority-associated content in more than
850 instances, including nearly
450 references to Advisory articles.
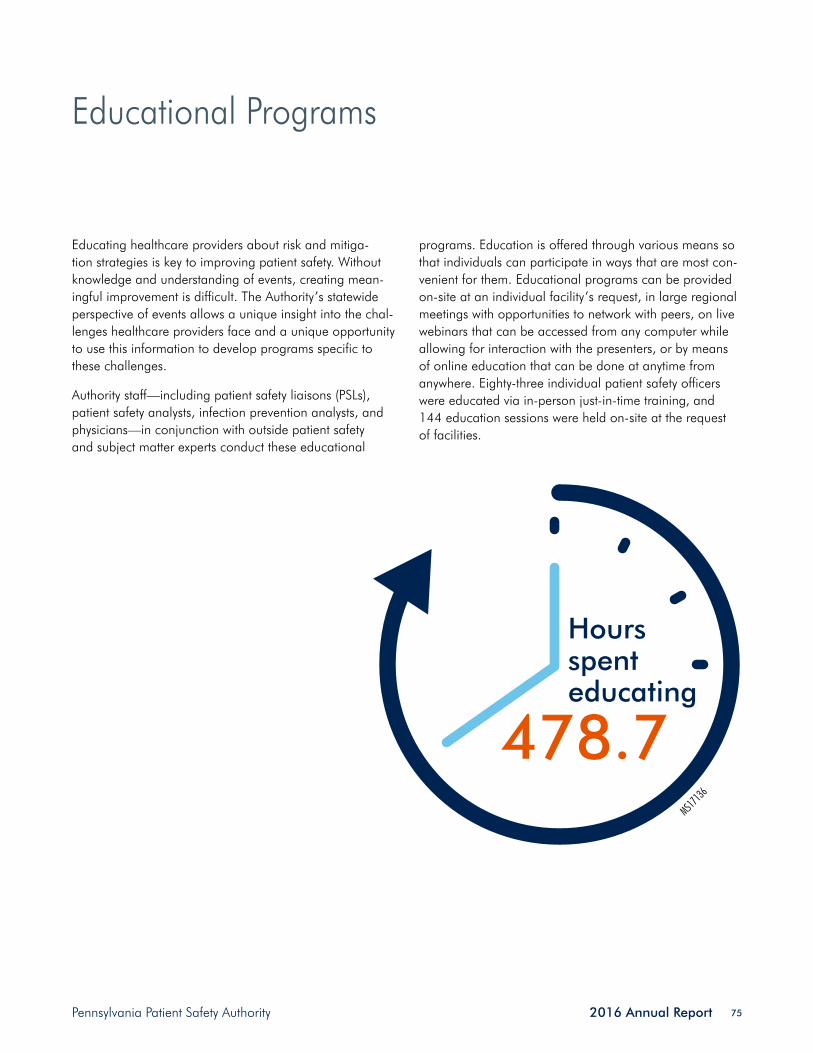
Pennsylvania Patient Safety Authority 2016 Annual Report 75
Educational Programs
Educating healthcare providers about risk and mitiga-tion strategies is key to improving patient safety. Without knowledge and understanding of events, creating mean-ingful improvement is difficult. The Authority’s statewide perspective of events allows a unique insight into the chal-lenges healthcare providers face and a unique opportunity to use this information to develop programs specific to these challenges.
Authority staff—including patient safety liaisons (PSLs), patient safety analysts, infection prevention analysts, and physicians—in conjunction with outside patient safety and subject matter experts conduct these educational
programs. Education is offered through various means so that individuals can participate in ways that are most con-venient for them. Educational programs can be provided on-site at an individual facility’s request, in large regional meetings with opportunities to network with peers, on live webinars that can be accessed from any computer while allowing for interaction with the presenters, or by means of online education that can be done at anytime from anywhere. Eighty-three individual patient safety officers were educated via in-person just-in-time training, and 144 education sessions were held on-site at the request of facilities.
MS1713
6
Hoursspenteducating 478.7

2016 Annual Report Pennsylvania Patient Safety Authority 76
Newborn SafetyErrors involving
Healthcare StudentsImproving Isolation Awareness
Behavioral Patients in the Acute Care Setting
Safety-I and Safety-IIScabies
That Pesky Human Factor
Webinars: 3,964 attendees
Board’s RoleDon’t Gamble on Patient SafetyFrom Reporting to PreventionNurse Leaders DementiaHuman FactorsMoving Patient Safety Forward
2016 Education Programs
In-Person: 3,957 attendees
Online learning management system (LMS) and continuing medical eduction (CME):
783 attendees
Other (professional organizations and schools):
1,164 attendees
MS17
130
Ambulatory SurgeryJust Culture
Health Literacy10 Things Every
Patient Safety Officer Should Know
Regional: 612 attendees
Health LiteracyClostridium difficile
FallsDistractions in the Operating Room
Failure Modes and Effects Analysis
From Reporting to Prevention
Root Cause AnalysisJust Culture
Medication Safety Culture of Safety
TeamworkWrong-Site Surgery
Safe Injection Practices
Final Guidance for ReportingAlarm ManagementHealth Information TechnologyPressure UlcersHand Hygiene

Pennsylvania Patient Safety Authority 2016 Annual Report 77
On Becoming a QAPI Cat: Improving Quality
Active Shooter Workplace Violence
Wrong-Site Surgery
Environmental Hygiene
TOPICS
Annual symposia held to meet the specific requests and educational needs of Ambulatory Surgical Facilities
Warrendale
Scranton
Lebanon
PlymouthMeeting
strongly agree that they would recommend this program to a friend
MS17
133
ASF SYMPOSIA 2016
88%MS
1713
1
CONTINUED
GROWTH!
327 hours of CME were awarded for Authority programs through our partnership with UPMC.
MS17
132
10,480
6,946 in 2015
in 2016
Number of Pennsylvania individuals educated

2016 Annual Report Pennsylvania Patient Safety Authority 78
Patient Safety Liaison (PSL) ProgramThe PSL program continues to be a unique program available to Pennsylvania hospitals, ambulatory surgical facilities, birthing centers, and abortion facilities. The PSLs serve as a resource to these facilities for reporting under the Medical Care Availability and Reduction of Error Act, patient safety education, patient safety consultative ser-vices, and for ensuring facilities are knowledgeable about Authority resources. The PSL team consists of eight profes-sionals who bring a wide range of skills and experience in patient safety to these facilities.
In 2016, the PSL program underwent some redesign, with a focus on creating a more cohesive team with shared vision and goals and additional resources for facilities. Periodically, the PSLs will roll out a new “Keystone.” Each keystone will have a specific topic focus with consultative tools and resources to support facilities in those areas.
730In-person
visits
317 Educationalprograms
815 Mobileconsultations
MS17
134
26 On-site consultations
PROGRAM USEFULNESS*
0 1 2 3 4 5
MS17
135
4.24*2016 acute care user survey
The first Keystone, “Keys to Reporting,” started September 1
MS17
137

Pennsylvania Patient Safety Authority 2016 Annual Report 79
Collaborative Strategies to Improve Patient Safety
The Pennsylvania Patient Safety Authority has formed stra-tegic partnerships with organizations and facilities in the Commonwealth, collaborating to improve patient safety. All collaborations use evidence-based best practices and provide education, tools, resources, and opportunities for facility networking and sharing. The Authority evaluates grant and other funding and partnership opportunities to support collaborative efforts.
The Authority partnered with the Hospital and Healthsys-tem Association of Pennsylvania (HAP) at the end of 2015 and 2016 to work on the second Hospital Engagement Network (HEN) contract* and begin work on the Hospital Improvement Innovation Network (HIIN) contract.† The Authority will continue the success of previous HEN con-tracts with the HIIN contract, which began on September 28, 2016. Following is a summary of the collaborative and partnership activities.
Hospital and Healthsystem Association of Pennsylvania Hospital Engagement Network*
On September 24, 2015, HAP was awarded the primary federal contract for Pennsylvania’s Hospital Engagement Network 2.0 (HAP PA-HEN 2.0). The Authority partnered with HAP and other Pennsylvania healthcare organizations to work with Pennsylvania hospitals to reduce healthcare-acquired conditions. The contract ended on September 23, 2016.
The goals of the national Partnership for Patients (PfP) Hospital Engagement Network (HEN) 2.0 were as follows:
• Reduce all-cause preventable inpatient harm by 40%.
• Reduce 30-day all-cause readmissions by 20%.
The Authority continued to build on the success of first HAP PA-HEN by continuing to manage the HEN 2.0 im-mersion projects, comprising Falls with Harm Reduction project (Falls) and the Preventing Harmful Adverse Drug Events Related to Anticoagulants, Insulin, and Opioids project (ADE). The Authority also co-led a culture of safety program in partnership with HAP and supported HAP with the PA-HEN 2.0 Healthcare Associated Infections (HAI) projects. The Authority provided support by providing ac-cess to PassKey, a secure, collaborative site that allowed each project to communicate and share information with participants.
The main HAP PA-HEN 2.0 project activities for 2016 are shown on “Building on Success: HEN 2.0 Collaboration.”
Unity is strength…when there is teamwork and collaboration, wonderful things can be achieved. —Mattie Stepanek
* The analyses upon which this publication is based were performed under Contract Number HHSM- 500-2015-00300C, entitled, “Partnership for Patients Hospital Engagement 2.0 Contract.”
† The analyses upon which this publication is based were performed under Contract Number HHSM-500-2016-00066C, entitled, “Partnership for Patients Hospital Improvement Innovation Network Contract, sponsored by the Centers for Medicare & Medicaid Services, Department of Health and Human Services.”

2016 Annual Report Pennsylvania Patient Safety Authority 80
MS17
086
Building on Success:HEN 2.0* Collaboration
3 Culture with HAP
7FALLS
11ADE
Falls Self-Assessment Tool
Falls Self-Assessment Action Plan
Postfall Investigation Tool
Falls Prevention Process Measures Audit Tool
HAP HEN 2.0 Webinar Education
Programs
Anticoagulants tools: http://patientsafetyauthority.org/Educational-Tools/PatientSafetyTools/ams/Pages/Home.aspxInsulin tools: http://patientsafetyauthority.org/EducationalTools/PatientSafetyTools/insulin/Pages/home.aspxOpioids tools: http://patientsafetyauthority.org/EducationalTools/PatientSafetyTools/opioids/Pages/home.aspx
Falls tools: http://patientsafetyauthority.org/EducationalTools/Pa-tientSafetyTools/falls/Pages/home.aspx
FALLSTOOLS
Org. Assessment of Safe Anticoagulant Practices
Org. Assessment of Safe Insulin Practices
Opioid Knowledge Self-Assessment
Org. Assessment of Safe Opioid Practices
ADE TOOLS
ADE, Preventing Harmful Adverse Drug Events Related to Anticoagulants, Insulin, and Opioids project; Falls, Falls with Harm Reduction project; COS, culture of safety; HAP, Hospital and Healthsystem Association of Pennsylvania; HEN 2.0, Partnership for Patients Hospital Engagement 2.0 Contract. * The analyses upon which this publication is based were performed under Contract Number HHSM- 500-2015-00300C, entitled, “Partnership for Patients Hospital Engagement 2.0 Contract.”

Pennsylvania Patient Safety Authority 2016 Annual Report 81
Preventing Harmful Adverse Drug Events Related to Anticoagulants, Insulin, and Opioids
The Authority partnered with HAP PA-HEN 2.0* to reduce adverse drug events related to anticoagulants, insulin, and opioids. The Authority’s analysis of adverse drug events found the following:
• Over an 18-month period ending in 2009, Pennsyl-vania healthcare facilities submitted 2,685 medica-tion error reports to the Authority involving the use of insulin. More than 52% of the reported events led to situations in which a patient may have or ac-tually received the wrong dose of insulin (e.g., dose omissions, wrong dose/overdosage, wrong dose/underdosage, extra dose, wrong rate errors), which could lead to difficulties in glycemic control.1
• Analysts reviewed medication error reports submit-ted from July 2013 through June 2014 involving oral anticoagulants. Of the 831 errors related to oral anticoagulants analyzed, the most common event types were drug omissions (32.5%, n = 270), other (18.5%, n = 154), and extra doses (11.7%, n = 97).2
• As a part of the first HAP adverse drug event col-laboration, a 45-item organization assessment tool was developed to assess the safety of opioid practices in hospitals. Findings from the assessment revealed many opportunities to improve medica-tion safety and established a baseline of current practices regarding opioid use that can be used to evaluate ongoing improvement.3
• In the same project, an 11-question opioid knowl-edge assessment tool was developed to assess
practitioners’ current knowledge about the use of opioids. More than 1,700 individual practitioners completed the assessment. It has identified numer-ous, basic knowledge gaps by practitioners, which will hopefully spur organizations to address these gaps and assess staff knowledge about other high-alert medications.4
The goals of HAP PA-HEN 2.0 were to reduce adverse drug events related to anticoagulants, insulin, and opioids by 40%, help hospitals assess their practices, provide education on these adverse drug event topics, and help hospitals improve their discharge education process for anticoagulants and insulin. The outcome measures for the immersion project are shown in the Table.
Fourteen hospitals focused on the immersion project. The Collaborative for Effective Prescription Opioid Policies (CEPOP) recognized the work being done by the ADE team through its CEPOP Salutes award (http://cepoponline.org/resource/cepop-salutes-webinar-august-2016/). This award recognizes HENs for their efforts to combat pre-scription opioid misuse, abuse, and diversion, beginning with pain management in the inpatient setting.
The ADE project provided hospitals educational webinars, the use of PassKey, one-on-one coaching calls, and mul-tiple hospital coaching calls. The ADE project offered 11 educational webinars that were made available to all HAP PA-HEN 2.0 hospitals. Although this contract has ended, the work to preventing adverse drug events related to anti-coagulants, insulin, and opioids will continue with HIIN.
Prevention of Falls with Harm
The Authority partnered with HAP to reduce falls with harm, which was the second most reported Serious Event in Pennsylvania in 2015.5 Falls can have a serious impact on a person’s ability to function, as well as their life ex-pectancy. In 2015, Pennsylvania facilities reported 34,004 falls events through the Pennsylvania Patient Safety Report-ing System (PA-PSRS). Of these falls events, 947 had harm sufficient to be classified as a Serious Event. The category Falls with Harm continues to represent a significant patient safety challenge for hospitals. The goal of the HAP PA-
HEN 2.0 Falls project was to reduce the number of falls with harm by 40% from the 2010 baseline.
Thirty-four hospitals participated in the falls project: 28 acute-care hospitals, 2 behavioral health hospitals, 3 rehabilitation hospitals, and 1 skilled nursing and rehabili-tation unit. Of these, 23 hospitals had participated in the first HEN falls project, and 11 were new enrollees for HEN 2.0.
* The analyses upon which this publication is based were performed under Contract Number HHSM- 500-2015-00300C, entitled, “Partnership for Patients Hospital Engagement 2.0 Contract.”

2016 Annual Report Pennsylvania Patient Safety Authority 82
Table. HEN 2.0* Outcome and Process Measures for Anticoagulants, Insulin, Opioids, and Falls Projects
IMMERSION PROJECT
HEN-WIDE
PROJECT TYPE OUTCOME MEASURES PROCESS MEASURES OUTCOME MEASURE
AnticoagulantINRs >5 per the number of inpatients prescribed warfarin therapy
Patients discharged on an anticoagulant receiving drug-specific information education per patients discharged on these medications
Aggregate anticoagulant serious events
InsulinBlood sugars <50 mg/dL per total number of patients receiving insulin
Patients discharged on an insulin receiving drug-specific information education per patients discharged on these medications
Aggregate insulin serious events
Opioid
Naloxone use to reverse adverse effects from opioids per total number of patients receiv-ing opioidsThe number of rapid response team calls related to opioids per the total number of rapid response calls
Patients discharged on an opioid receiving drug-specific information education per patients discharged on these medications
Aggregate opioid serious events
Falls with harmFalls with harm per 1,000 patient days (using PA definitions)
The percentage of patients identified at risk who had a prevention protocol in place before the fall with harmThe percentage of pa-tients who were assessed for risk prior to experiencing a fall with harm
Falls with harm per 1,000 patient days (using PA definitions)
Hospitals used the Pennsylvania standardized definition of falls and falls with harm to ensure consistency in reporting. The Falls project offered educational webinars, coaching calls, hospital visits, in-person regional meetings, a col-laborative website, and falls preventions tools (see Build-ing on Success: HEN 2.0 Collaboration for links to tools) as resources for the participants.
The Falls project offered immersion hospitals a model to follow using the acronym FALLS.
This helped to guide the hospital project teams in de-veloping and improving their falls-prevention programs. Hospitals that participated in this project were required to
complete the self-assessment survey and action plan. The evidence-based self-assessment tool was developed in the first HEN contract and revised for HEN 2.0. The other tools were optional and provided additional resources to the hospitals for monitoring their falls programs. The Authority also offered hospital visits to provide feedback to the falls team, assist with data analysis and assessment, help with action plan development and monitoring, and identify opportunities to collaborate with other hospitals. During the HAP PA-HEN 2.0 falls project, 26 hospitals participated in hospital visits.
HEN, Hospital Engagement Network; INR, international normalized ratio; PA, Pennsylvania Safety Authority’s standardization project.
* The analyses upon which this publication is based were performed under Contract Number HHSM-500-2015-00300C, entitled, “Partnership for Patients Hospital Engagement 2.0 Contract.”

Pennsylvania Patient Safety Authority 2016 Annual Report 83
The falls project provided hospitals seven educational webinars and coaching calls that were made available to all the HAP PA-HEN 2.0* hospitals. Although this contract has ended, the work to prevent falls with harm will continue with the HIIN subcontract (see Table).
* The analyses upon which this publication is based were performed under Contract Number HHSM- 500-2015-00300C, entitled, “Partnership for Patients Hospital Engagement 2.0 Contract.”
† The analyses upon which this publication is based were performed under Contract Number HHSM-500-2016-00066C, entitled, “Partnership for Patients Hospital Improvement Innovation Network Contract, sponsored by the Centers for Medicare & Medicaid Services, Department of Health and Human Services.”
MS17
159
Assess your falls program
Look at your gaps
Learn why falls are happening
Study your data
Form a team
Hospital and Healthsystem Association of Pennsylvania Hospital Improvement Innovation Network†
On September 28, 2016, HAP was awarded one of the 16 primary federal contracts for HIIN. The Authority has formed partnerships with HAP and other Pennsylvania healthcare organizations to work with Pennsylvania hospi-tals to reduce healthcare-acquired conditions.
The goals of the HIIN are to achieve the following:
• A 20% decrease in overall patient harm.
• A 12% reduction in 30-day readmissions as a population-based measure from 2014 baseline.
The Authority’s success in previous partnerships with HAP has led to the leadership of the Authority on the adverse drug events, prevention of falls with harm, and culture of safety projects. The Authority is also leading a project with the Health Care Improvement Foundation to reduce emergency department radiologic diagnostic errors. The Authority issued a press release in November 2016 that can be found on the Authority’s website: http://patient-safetyauthority.org/NewsAndInformation/PressReleases/Pages/pr_November_10_2016_Final.aspx.
Experts Work to Prevent Wrong-Site Anesthesia Nerve Blocks in PennsylvaniaWrong-site local and regional anesthesia nerve blocks represent a significant portion of wrong-site operating room procedures. Between July 1, 2004, and December 31, 2016, wrong-site nerve blocks performed by anesthe-siologists and surgeons comprised 25.9% of all wrong-site procedures reported through PA-PSRS. Given that only a fraction of patients who are vulnerable to wrong-site sur-gery receive anesthesia in the form of blocks, the propor-tion of wrong-site anesthesia blocks is notable.
The Authority has partnered with the Pennsylvania Society of Anesthesiologists for the following:
• To evaluate current practices for preventing wrong-site/side blocks, through interviews with expert panel members and stakeholders including anesthesiolo-gists, surgeons, nurses, and patient representatives.
• To conduct a systematic literature review that will be used as a knowledge base for developing a guid-ance document.
• To draft and disseminate guidance and resource document(s) to address wrong-site/side regional anesthesia block prevention for physicians, nurses, and healthcare facilities.

2016 Annual Report Pennsylvania Patient Safety Authority 84
Collaborative Feedback
Annual Survey Collaborative Results
The Authority seeks feedback from facilities each year through an annual survey. Some of the questions in the survey help the Authority learn about topics that facilities are interested in for collaboration. A summary of the results is shown in the following infographic:
And the results are...
Percentage of facilities that responded by facility type 35.1% 24.4%
ACUTE CA
RELONG-TERM
CARE
Is your facility currently participating in any collaborative projects?
0 20 40 60 80 100100 80 60 40 20 0
Yes
No
Unsure
19.070.9
10.1
11.657.4
31.0
ACUTE CARE LONG-TERM CARE
MS17
087
Percentage Percentage
Acute Care Topic Interests:
Infection prevention (overall)
Simulation to improve patient safety
Standardizing emergency codes
Long-Term Care Topic Interests:
Preventing urinary tract infections
Antibiotic stewardship
Modifying risk factors for respiratory tract
infections
MS17
087

Pennsylvania Patient Safety Authority 2016 Annual Report 85
PartnershipsThe Authority’s partnerships help provide important relationships that complement, enhance, and expand the knowledge of the Authority. The graphic below provides information on our partnerships in 2016 (an interactive version is available online with this annual report at www.patientsafetyauthority.org).
Association for Professionals in Infection Control and Epidemiology (APIC)
– Active involvement in state and national chapters
– Presented at APIC annual conference
– On APIC research committee
One and Only Campaign
– Provide education on safe injection practices
Health Research and Education Trust (HRET)
– Member of the national project team for CAUTI measurement and definitions
– Partnered to write a research article on evidence base for urinary leg bags
National Patient Safety Foundation (NPSF)
– On the research oversight committee
– On the executive oversight committee
– Assist in the development and education of the Certified Professional in Patient Safety credential
Quality Insights Renal Network 4
– Authority supports Renal Network 4 for itsdialysis center project
The Health Care Improvement Foundation (HCIF)
– Health Literacy partner to provide education
– Member of the Pennsylvania Health Literacy Coalition
Pennsylvania Association of Directors of Nursing Administration (PADONA)
– Authority provides infection control resources
– PADONA highlights the Authority’s Advisory articles and tools in its communications
– PADONA sponsored a statewide webinar in 2016
Kendal Outreach, LLC
– Partnered to offer the second annual infection prevention webinar series
Pennsylvania
Patient Safety
Authority
MS17
088
Pennsylvania Department of Health
– Reduce HAIs
– Support facility reporting and education

2016 Annual Report Pennsylvania Patient Safety Authority 86
Notes
1. Medication errors with the dosing of insulin: prob-lems across the continuum. Pa Patient Saf Advis. 2010 Mar;7(1):9-17. Also available: http://www.patientsafety-authority.org/ADVISORIES/AdvisoryLibrary/2010/Mar7(1)/Pages/09.aspx.
2. Andreica I, Grissinger M. Oral anticoagulants: a review of common errors and risk reduction strategies. Pa Patient Saf Advis. 2015 Jun;12(2):54-61. Also available: http://patientsafetyauthority.org/ADVISORIES/Advisory Library/2015/Jun;12(2)/Pages/54.aspx.
3. Grissinger M, Lamis RL. Results of the PA-HEN organization assessment of safe practices for a class of high-alert medi-cation. Pa Patient Saf Advis. 2013 Jun;10(2):59-66. Also available: http://patientsafetyauthority.org/ADVISORIES/AdvisoryLibrary/2013/Jun;10(2)/Pages/59.aspx.
4. Grissinger M. Results of the opioid knowledge assess-ment from the PA hospital engagement network adverse drug event collaboration. Pa Patient Saf Advis. 2013 Mar;10(1):27-33. Also available: http://patientsafety authority.org/ADVISORIES/AdvisoryLibrary/2013/Mar;10(1)/Pages/19.aspx.
5. Pennsylvania Patient Safety Authority 2015 annual report. Harrisburg (PA): Pennsylvania Patient Safety Authority; 2016 Apr 29. 98 p. Also available: http://patientsafety authority.org/PatientSafetyAuthority/Documents/annual_ report_2015.pdf.

Pennsylvania Patient Safety Authority 2016 Annual Report 87

2016 Annual Report Pennsylvania Patient Safety Authority 88
The Authority Celebrates Pennsylvania Healthcare Providers for Outstanding Patient Safety Efforts
IntroductionThe Pennsylvania Patient Safety Authority held its annual I Am Patient Safety contest to recognize individuals and groups taking action to positively impact patient safety. The contest provides an opportunity to showcase the great work being done in Pennsylvania healthcare facilities and reward the people involved. We received more nominations this year than ever before. As one of the judges, I personally read all 184 submissions and was impressed by the evident level of dedication and resulting impact on patient safety.
The judging panel, composed of an Authority board member, executive and management staff, and a patient community member, evaluated submissions using the following criteria: the person or group demonstrated (1) a discernible impact on patient safety for one or many patients, (2) a commitment to patient safety, (3) a strong patient safety culture present in the facility, and (4) initia-tive. Winners were awarded with a plaque, certificate, and recognition pin from the Authority. Their photos and patient safety efforts were highlighted on posters that could be displayed within their facilities. Winners and healthcare
facility representatives were also invited to attend the March 2017 Authority Board of Directors meeting and a luncheon to meet Authority board members and staff. I want to thank everyone who participated in the contest. It is always a challenge to narrow such an impressive group of nomina-tions down to just a handful of winners.
The next round of nominations begins May 1, 2017. Please take the time to acknowledge the patient safety stars in your facilities by nominating them for this contest. The Author-ity board members and staff appreciate the time you have taken to tell us about your colleagues’ efforts to improve patient safety in Pennsylvania.
Thank you, again, to all who participated in the I Am Patient Safety contest. Please join me in congratulating the winners for their commitment to patient safety.
The individuals and groups recognized for the I Am Patient Safety contest and their achievements are grouped by name of facility.¹
Regina Hoffman, MBA, BSN, RN, CPPS Executive Director Pennsylvania Patient Safety Authority
1 Any included numbers and/or results were provided for publication by the recognized healthcare facilities. The Pennsylvania Patient Safety Authority has not independently verified, and bears no responsibility or liability for, these numbers and/or results.
Scan this code with your mobile device’s QR reader to view videos about winners on the Authority's Facebook page.

Pennsylvania Patient Safety Authority 2016 Annual Report 89
Trisha Patel, PharmD, BCPS, BCCCP Critical Care and Infectious Disease Pharmacist
Cancer Treatment Centers of America® at Eastern Regional Medical Center
A patient with cancer was ill with signs and symptoms that sug-gested a urinary tract infection. Trisha Patel, a critical care and infectious disease pharmacist, went beyond her standard inpa-tient duties to review the outpatient’s urine test results. Trisha, who works to ensure that patients are on the right antibiotics for their particular disease, noticed the patient was infected with a harmful, multidrug-resistant bacterium. She called the infectious disease consultant and the patient was admitted to the hospital to receive necessary intravenous (IV) antibiotics.
Trisha’s attention to detail and quick identification of the bacteria prevented the patient from developing a worsening infection.
Melissa Hewitt, Clinical Nurse Manager, Registered Nurse, Certified Neonatal Intensive Care Nursing, MSN
Arlene Stonelake, Registered Nurse, Certified
Meghan Mahoney, Registered Nurse, Certified
Labor & Delivery Department Einstein Medical Center Montgomery
A manufacturer changed the packaging of a medication for IV treatment, and the new bag looked very much like another medication. As nurses in the Labor & Delivery department, Melissa Hewitt, clinical nurse manager; Ar-lene Stonelake, registered nurse; and Meghan Mahoney, registered nurse worried that the wrong medication could be given to patients. After trying numerous solutions, the group and hospital pharmacy changed procedures so that instead of using two sizes of IV bags, the medication with the new packaging is prepared only in a 500 mL bag, the department’s only bag of that size.
The team’s persistence led to a safer process for distin-guishing IV medications.
Rose Hall, RT (R) (CT), and her team in the CT Scan Department
Einstein Medical Center Philadelphia
Although important in evaluating patients, computed tomography (CT) scans increase patient exposure to
dangerous radiation. Rose Hall, supervisor of the CT Scan Department, and her team made it their priority to reduce the amount of radiation used in scans. They worked with radiologists to implement new protocols, and new scanning technology was introduced.
Because of these changes, the image quality of CT scans improved and average radiation exposure was cut in half. Einstein ranked in the top 17th percentile of participating providers in the American College of Radiology Dose Index Registry.
Andrew Klee, Infection Control Practitioner The Healthcare Acquired Infections TeamGuthrie Robert Packer Hospital
Good hand hygiene is important in protecting patients from healthcare-acquired infections (HAIs) that healthcare workers can unintentionally spread. The HAI Team, under infection preventionist Andrew Klee, convinced the hospital to install an electronic hand-hygiene monitoring system. Any employee who routinely enters patient rooms wears a monitoring badge, and handwashing compliance is posted for all to see. The team also collaborated with the Envi-ronmental Services Department to use an ultraviolet-light robot to disinfect operating and intensive care unit rooms.
The results were favorable—the oncology unit saw a threefold decrease in patients infected in the hospital with the harmful bacterium Clostridium difficile.
Paul Karlin, DO, Medical Director of Critical Care Unit (CCU) and Division Chief for Pulmonary Medicine
Jeanes Hospital
Jeanes Hospital performs case reviews for each patient death, to improve patient safety and quality of care. Dr. Karlin performs the lion’s share of these case reviews. He looks to improve clinical care, foster respect and com-munication among providers, provide patient dignity, and enhance family-member relations. He is frank about op-portunities for improvement but does not place blame.
His efforts, as architect of a new departmental structure and captain of the ship, have prompted physician and staff education, policy and process revisions, and practice changes that support better patient outcomes.

2016 Annual Report Pennsylvania Patient Safety Authority 90
The Pain Center of OSS HealthOSS Health
A large team of nurses in a pain-management procedure center needed to consult about cases while still maintain-ing patients’ privacy. To achieve this, the center imple-mented among the staff use of two-way wireless com-munications, with devices that have a microphone and a single earpiece.
Recently, a patient in the procedure room fainted while being helped from the procedure table to a wheelchair. The procedure room nurse used her wireless device to call for assistance. Multiple staff members responded. Thanks to the wireless system, the post-op nurses were also aware of the situation and notified the family and gathered the supplies needed to properly care for the patient.
Wannetta Love, Registered Nurse, CCRN
Intensive Care Unit
Phoenixville Hospital
As a registered nurse in the intensive care unit (ICU), Wannetta (Neadie) Love observed two patients who each had an endotracheal tube. One patient had a facial pres-sure injury associated with the endotracheal tube, while the other patient did not. She investigated and found that the unaffected patient had been transferred from another facility that used a special holder to reduce pressure-injury development. Love championed the use of these holders.
Because of her efforts, the hospital decided to purchase the pressure-reduction devices, which are now used in the ICU. No facial pressure injuries have occurred since.
Erin Madden, Patient Care Assistant - Nursing 4S PCT
Phoenixville Hospital
As a patient care assistant, Erin Madden was helping a patient into bed. She had made sure the bed’s wheels were locked, but during the patient’s transfer, the bed shifted away. Fortunately, the patient did not fall. The bed was repaired. But Erin remained concerned and raised the issue during one of the unit’s daily safety huddles. The concern was relayed to hospital leadership. It was discov-ered that even with wheels locked, nearly 60% of the beds on the unit were unstable.
This finding led to a hospital-wide assessment and repair of the wheel locks on all beds in the facility, lessening patients’ risk of falling.
Ashley Hartzell, Registered Nurse
Babette Rudick, Registered Nurse
Lisa Swenson, BSN, RN, ONC
Jacqueline Brown, Medical Assistant
Tina Frank, MHS, BSN, RN
Teresa Diez, Certified Registered Nurse Practitioner
Surgery Optimization Clinic PinnacleHealth System
A surgery optimization clinic was established by Tina Frank, MHS, BSN, RN, with the help of her team Teresa Diez, CRNP; Lisa Swenson, BSN, RN, ONC; Ashley Hartzell, RN; Babette Rudick, RN; and Jacqueline Brown, MA. They collaborate with healthcare providers inside and outside the hospital to coordinate care, looking at “the whole person” through one-on-one education and sup-port before surgery. These programs include screenings related to pain, smoking, sleep apnea and alcohol use, weight management and dietary practices, and “prehabili-tation” to improve mobility.
Endoscopy Department and Infection Prevention and Control Staff
PinnacleHealth System
Recently, gastrointestinal professionals were shocked to learn that nationally, an antibiotic-resistant organism was being spread to patients through endoscopes that were contaminated, even after proper cleaning (the scopes have crevices that shelter bacteria). The PinnacleHealth endoscopy leadership, the endoscopy team, and the in-fection control department devised a plan to mitigate the risk to patients. The endoscopy team embraced the new disinfecting process, even though it takes more time.
After reorientation and education, the Endoscopy De-partment staff process endoscopes beyond professional standards.

Pennsylvania Patient Safety Authority 2016 Annual Report 91
Renu Joshi, MD, Medical Director, Endocrinology
Endocrinology Team NP Inpatient Endocrinology Service PinnacleHealth System
When patients with diabetes are hospitalized, controlling their blood glucose levels is difficult. Hospital workers may not have expertise in managing glucose levels. Addition-ally, the patient is seen by multiple practitioners—each treatment can affect a patient’s blood glucose levels. As medical director for endocrinology, Dr. Joshi heads a Diabetes Clinical Initiative and championed the creation of a Nurse Practitioner Inpatient Endocrinology Service. This multidisciplinary service improves knowledge among nonspecialist staff and provides education, advice, and support to clinical staff, patients, and families.
Because of this program, diabetic patients’ hospital stays are shorter and they have fewer surgical-site infections than before.
Donna Miller, Nurse Manager
Jessica Radicke, Administrative Charge Registered Nurse
Marissa McMeen, Infection Control Practitioner
Bone Marrow Transplant Unit Thomas Jefferson University Hospital
Concerned about the number of central line–associated bloodstream infections (CLABSIs) in the Bone Marrow Transplant Unit, Donna Miller, nurse manager; Jessica Radicke, administrative charge registered nurse; and Ma-rissa McMeen, infection control practitioner made positive changes. Protocols were altered to limit who could change central-line dressings, and staffing was adjusted to cover this task. They introduced a medical manikin so nurses could practice and demonstrate accessing the central line. Senior leadership recognized and celebrated the team’s success.
Since the action plan was implemented, the unit experi-enced just one CLABSI in 15 months.
Quality Based Improvement Resident Teams
Department of Surgery Thomas Jefferson University Hospital
Recognizing the importance of quality and safety educa-tion, surgical residents at Thomas Jefferson University Hospital established the Quality Based Improvement Resident Teams (QBIRT) initiative. Under QBIRT, residents have researched, developed, and launched programs to reduce harm and improve the quality of care for surgi-cal patients. They have led projects that have resulted in reducing surgical site infections and catheter-associated urinary tract infections and safer insertion of feeding tubes. With one hospital-wide QBIRT initiative, residents analyzed data and created a “risk score” to help predict postoperative respiratory failure in an effort to intervene earlier and prevent these complications.
Through advanced analytics, best practice implementa-tion, team integration, and innovation, the residents of QBIRT have made a significant difference in patient care and surgical outcomes.
ICU Service PartnersInfectious Disease Practitioners
UPMC Susquehanna’s Williamsport Regional Medical Center
A team of intensive care service partners, infectious disease practitioners, and a professional development specialist analyzed every CLABSI in the ICU. They aimed to reduce CLABSIs. The expectation was set that staff would wear a mask and use a sterile drape whenever ac-cessing a central line (to give medications or draw blood). The professional development specialist conducts compe-tency checks and infectious disease practitioners monitor compliance with infection-control practices.
After achieving 572 days without a CLABSI, these partners continue with the goal of zero CLABSI for patients in the ICU.

Pennsylvania Patient Safety Authority 2016 Annual Report 93
Recommendations to the Department of Health
The Medical Care Availability and Reduction of Error (MCARE) Act calls upon the Authority to suggest recom-mendations for statutory or regulatory changes that may help improve patient safety in the Commonwealth. In 2016, the Board had no formal recommendations for
statutory or regulatory changes. However, the Authority continues to work in partnership with the Department of Health to standardize reporting requirements. Please see Reporting Standardization: Guidance for Acute Healthcare Reporting.
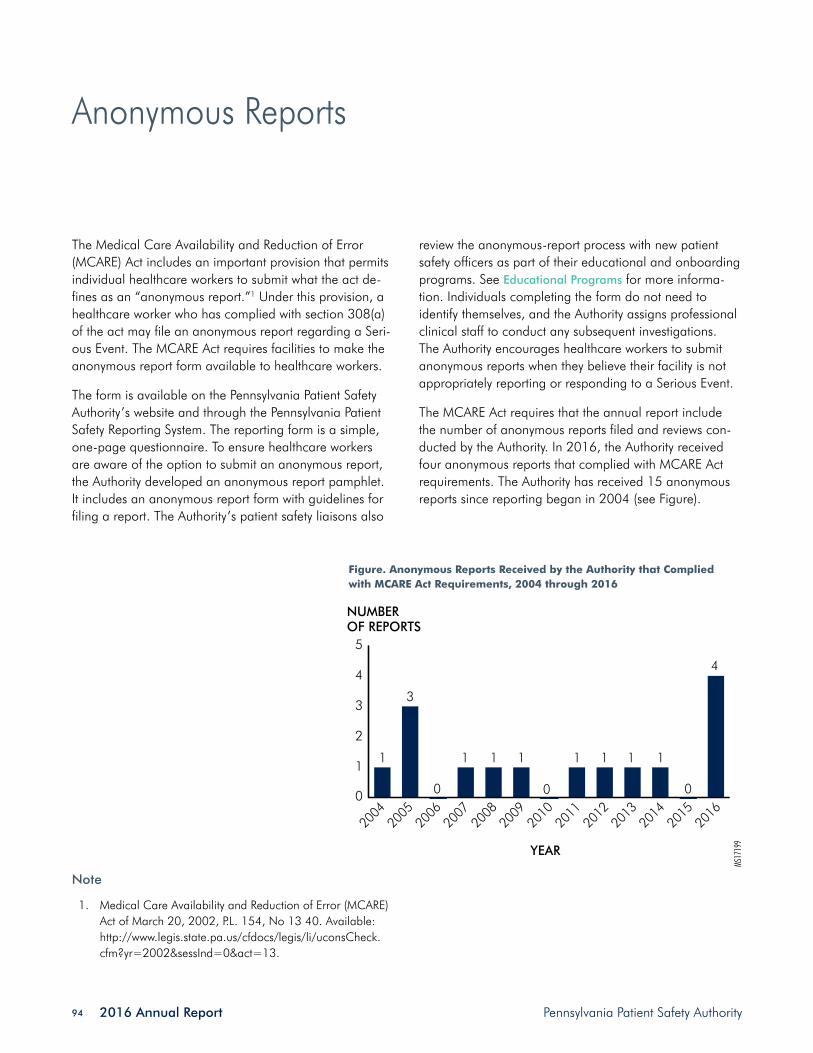
2016 Annual Report Pennsylvania Patient Safety Authority 94
Anonymous Reports
The Medical Care Availability and Reduction of Error (MCARE) Act includes an important provision that permits individual healthcare workers to submit what the act de-fines as an “anonymous report.”1 Under this provision, a healthcare worker who has complied with section 308(a) of the act may file an anonymous report regarding a Seri-ous Event. The MCARE Act requires facilities to make the anonymous report form available to healthcare workers.
The form is available on the Pennsylvania Patient Safety Authority’s website and through the Pennsylvania Patient Safety Reporting System. The reporting form is a simple, one-page questionnaire. To ensure healthcare workers are aware of the option to submit an anonymous report, the Authority developed an anonymous report pamphlet. It includes an anonymous report form with guidelines for filing a report. The Authority’s patient safety liaisons also
review the anonymous-report process with new patient safety officers as part of their educational and onboarding programs. See Educational Programs for more informa-tion. Individuals completing the form do not need to identify themselves, and the Authority assigns professional clinical staff to conduct any subsequent investigations. The Authority encourages healthcare workers to submit anonymous reports when they believe their facility is not appropriately reporting or responding to a Serious Event.
The MCARE Act requires that the annual report include the number of anonymous reports filed and reviews con-ducted by the Authority. In 2016, the Authority received four anonymous reports that complied with MCARE Act requirements. The Authority has received 15 anonymous reports since reporting began in 2004 (see Figure).
Figure. Anonymous Reports Received by the Authority that Complied with MCARE Act Requirements, 2004 through 2016
Note
1. Medical Care Availability and Reduction of Error (MCARE) Act of March 20, 2002, P.L. 154, No 13 40. Available: http://www.legis.state.pa.us/cfdocs/legis/li/uconsCheck.cfm?yr=2002&sessInd=0&act=13.
0
1
2
3
4
5
MS17
199
NUMBEROF REPORTS
YEAR
2004
3
0
4
0
2005
2006
2007
2008
2009
2010
2011
2012
2013
2014
2015
2016
1 1 1 1 1 1 1 1
0
Pennsylvania Patient Safety Authority 2016 Annual Report 95
Referrals to Licensure Boards
The Medical Care Availability and Reduction of Error (MCARE) Act requires the Pennsylvania Patient Safety Authority to identify the number of referrals to licen-sure boards for failure to submit reports under the Act’s reporting requirements.1 MCARE specifies that it is the medical facility’s responsibility to notify the licensee’s
licensing board of failure to report. No such situations were reported to the Authority during 2016. However, the Authority is unlikely to receive information related to a referral to a licensure board because Pennsylvania Patient Safety Reporting System (PA-PSRS) reports do not include the names of individual licensed practitioners.
Note
1. Medical Care Availability and Reduction of Error (MCARE) Act of March 20, 2002, P.L. 154, No 13 40. Available: http://www.legis.state.pa.us/cfdocs/legis/li/uconsCheck.cfm?yr=2002&sessInd=0&act=13.


Pennsylvania Patient Safety Authority 2016 Annual Report 97
Fiscal Statements and Contracts
The Medical Care Availability and Reduction of Error (MCARE) Act1 establishes the Patient Safety Trust Fund as a separate account in the Pennsylvania Treasury. Under the MCARE Act, the Pennsylvania Patient Safety Author-ity determines how those funds are used to effectuate the patient safety provisions of the Act and administers funds in the Patient Safety Trust Fund. Funds come primarily from assessment surcharges made by the Department of Health on certain medical facilities.
The Authority recognizes that Pennsylvania hospitals, birth-ing centers, ambulatory surgical facilities, abortion facili-ties, and nursing homes bear financial responsibility for costs associated with complying with mandatory reporting requirements. Accordingly, the Authority has focused on two fiscal goals: (1) to be prudent in the use of moneys contributed by the healthcare industry, and (2) to as-sure that healthcare facilities paying for the Pennsylvania Patient Safety Reporting System (PA-PSRS) receive direct benefits from the system and from Authority programs in return. Pursuant to Section 304(A)(4) of the MCARE Act, as a general rule, the Authority is authorized to receive funds from any source consistent with the Authority’s purposes under the Act. Consistent with this mandate, the Authority at times contracts with and receives funding from other healthcare-related entities to reduce medical errors and promote patient safety in the Commonwealth. These contracts in 2016 are described in the section, “Contracts under which the Authority Received Revenue in 2016 as a Contractor,” which lists contracts with the Hospital and Healthsystem Association of Pennsylvania (HAP) and the Health Care Improvement Foundation (HCIF).
In this regard, within the design of PA-PSRS, the Author-ity included a variety of integral and analytical tools that provide immediate, real-time feedback to facilities
on their own adverse event and near-miss reports and activities. The Authority recently provided nursing homes with an infection analytic system within PA-PSRS. Facilities can use these tools for their internal patient safety and quality improvement programs. In 2016, the Authority began working on the PA-PSRS Application Modernization (AMOD). The AMOD project entails a complete redesign of the PA-PSRS application with a planned release to the facilities in 2018. Also in 2016, the Authority’s SAS Visual Analytics Reporting System was named a national finalist in the Emerging & Innovative Technologies category of the National Association of State Chief Information Officers (NASCIO) 2016 State IT Recognition Awards.
The Authority provides numerous training and educa-tion programs, including programs related to reporting, investigating, and analyzing events, risk assessment, and patient safety topic-specific education. The Authority also publishes the Pennsylvania Patient Safety Advisory, a scholarly journal issued quarterly that includes detailed analysis and identification of trends of reports submitted through PA-PSRS. All these programs are offered at no additional cost to the facilities. As identified elsewhere in this annual report, the Authority expanded its services by organizing and supporting research collaborations with reporting facilities and other patient-safety-centric orga-nizations. The Authority also provides continuing medical education and patient safety curriculum development. By directly offering clinical guidance, feedback, and edu-cational programs to providers about actual events that occur in Pennsylvania, the Authority provides measurable value back to the healthcare industry that contributes to funding this program.

2016 Annual Report Pennsylvania Patient Safety Authority 98
Funding Received from Hospitals, Ambulatory Surgical Facilities, Birthing Centers, and Abortion FacilitiesThe MCARE Act1 set an initial limit of $5 million on the total aggregate assessment on acute-care facilities for any one year beginning in 2002, plus an annual increase based on the consumer price index (CPI) for each sub-sequent year. For fiscal year 2016–2017, the maximum allowable acute-care assessment is $7,097,85, against the Authority Board’s approved aggregate acute-care as-sessment of $6,675,000.
On December 13, 2016, the Authority Board authorized a recommendation to the Department of Health that the FY 2016–2017 acute-care assessment surcharges should total $6.675 million. This amount is a $175,000, or 2.7%, increase over the FY 2015–2016 acute-care assessment and is 6.0% less than the maximum annual
amount that could have been assessed for the year pursuant to Section 305(d) of the MCARE Act. Beginning in 2015, the Authority Board authorized the use of the Northeast Medical Professional Services CPI to calculate annual adjustments to maximum assessments.
At the time of this acute-care assessment recommenda-tion, the Patient Safety Authority Board considered several points, including the following:
• The Patient Safety Authority’s FY 2016–2017 bud-get totals about $8.5 million, with approximately $7.2 million funding expenditures other than for healthcare-associated infection (HAI).
Table 1. Acute Care Facility Assessments A
FISCAL YEAR
NUMBER OF FACILITIES ASSESSED BY DEPARTMENT OF HEALTH
APPROVED ASSESSMENTS
TOTAL ASSESSMENTS RECEIVED BY DEPARTMENT OF HEALTH B
2002-03 356 $5,000,000 $4,663,000
2003-04 377 $2,500,000 $2,542,316
2004-05 414 $2,500,000 $2,508,787 C
2005-06 450 $2,500,000 $2,500,149
2006-07 453 $2,500,000 $2,500,034
2007-08 526 $5,400,000 $5,391,583
2008-09 524 $4,000,000 $3,972,677
2009-10 519 $5,000,000 $4,989,781
2010-11 542 $5,000,000 $4,981,443
2011-12 550 $5,100,000 $5,063,723
2012-13 545 $5,500,000 $5,504,549
2013-14 556 $5,500,000 $5,492,002
2014-15 564 $6,200,000 $6,209,459
2015-16 569 $6,500,000 $6,494,845
2016-17 D $6,675,000
$68,814,348
A The number of facilities assessed by the Department of Health differs from the number of the Medical Care Availability and Reduction of Error (MCARE) Act’s facilities cited elsewhere in this report because of differences in the dates chosen to calculate the number of facilities for these two different purposes.
B Amounts assessed and amounts received differ because a few facilities may have closed in the interim or are in bankruptcy. In a few cases, the Department of Health has pursued action to enforce facility compliance with the MCARE Act’s assessment requirement
C Total assessments received are greater than assessments made because some funds received were late payments for the previous year’s assessment.
D 2016-17 missing figures were unavailable at the time of publication and will appear in next year’s annual report.

Pennsylvania Patient Safety Authority 2016 Annual Report 99
• The Patient Safety Authority’s FY 2016–2017 budget increased by $249,000, or 3.0%, from the previous fiscal year budget.
• The FY 2016–2017 acute-care assessment of $6.675 million has increased by $1.675 million from the Authority’s initial acute-care assessment in FY 2002–2003 of $5.0 million, a 2.39% per year average increase.
• Since the Authority’s FY 2007–2008 acute-care assessment of $5.4 million, the acute-care assess-
ment has increased by an average of 2.62% per year.
Also considered in authorizing this increase were staff and program growth, significant increases in Commonwealth of Pennsylvania mandated burdened benefit rates, and projected contract revenue in FY 2016–2017.
Table 1 shows the number of acute-care facilities as-sessed, approved assessments, and assessments received for each fiscal year.
Funding Received from Nursing HomesAct 522 of the MCARE Act allows the Department of Health to assess Pennsylvania nursing homes up to an aggregate amount of $1 million per year for any one year beginning in 2008, plus an annual increase based on the CPI for each subsequent year. In 2008, following the Authority’s suggestion, the Department assessed 725 nursing home facilities a total of $1,000,000 and trans-ferred $1,000,782 to the Patient Safety Trust Fund for FY 2008–2009. This money could be spent only on activities related to HAI and implementation and maintenance of Chapter 4 of the MCARE Act. For FY 2016–2017, the Act 52 maximum allowable assessment is $1,145,915, against the Authority Board’s approved aggregate assessment of $1,110,000.
On December 13, 2016, the Authority Board autho-rized a recommendation to the Department that the FY 2016–2017 nursing home assessment surcharges should total $1.11 million. This amount is $20,000 more than the previous year’s assessment and is approximately 3.1% below the maximum assessment permitted under Act 52, based on annual CPI adjustments. Beginning in 2015, the Authority Board authorized the use of the Northeast Medi-cal Professional Services CPI to calculate annual adjust-ments to maximum assessments.
Table 2 shows the number nursing homes assessed, ap-proved assessments, and assessments received for each fiscal year.
Table 2. Nursing Home Assessments
FISCAL YEAR
NUMBER OF FACILITIES ASSESSED BY DEPARTMENT OF HEALTH
APPROVED ASSESSMENTS
TOTAL ASSESSMENTS RECEIVED BY DEPARTMENT OF HEALTH
2008-09 725 $1,000,000 $1,000,782
2009-10 711 $800,000 $799,382
2010-11 707 $800,000 $799,829
2011-12 707 $800,000 $804,473 A
2012-13 711 $900,000 $913,315 A
2013-14 698 $1,000,000 $998,751
2014-15 703 $1,050,000 $1,049,842
2015-16 702 $1,080,000 $1,079,505
2016-17 B $1,080,000
$7,445,879
A Total assessments received are greater than assessments made because some funds received were late payments for the previous year’s assessment.
B FY 2016-2017 missing figures were unavailable at the time of publication and will appear in the next year’s annual report.

2016 Annual Report Pennsylvania Patient Safety Authority 100
Annual ExpendituresDuring calendar year 2016, the Authority spent about $7.833 million and received contract and service related receipts of $546,000, resulting in net expenditures of $7.286 million (Table 3).
Table 3. Expenditures for Calendar Year 2016
CONTROL LEVEL AMOUNT
61: Personnel $2,494,304
63: Operating $5,338,706
Contract Revenue Receipts -$546,399
Net expenditures $7,286,611
Patient Safety Authority ContractsThe MCARE Act requires the Authority to identify a list of contracts entered into pursuant to the Act, including the amounts awarded to each contractor.
During calendar year 2016, the Authority received services under the following contracts (FC, funds commit-ment; PO, purchase order).
ECRI Institute, FC # 4000018888
Four-year, nine-month contract for program administra-tion, clinical analysis, training and data collection, and reporting infrastructure services.
October 1, 2014, through June 30, 2019
Total contract amount: $24,227,233 over 4 years and 9 months
Amount invoiced for 2014 (October through December): $1,135,983.79
Amount invoiced for 2015 (January through December): $4,824,833.20
Amount invoiced for 2016 (January through November): $4,946,827.23
(December 2016 invoice estimated and unaudited)
IKON Office Solutions, PO # 4500712922
Ricoh B&W copier lease
August 1, 2013, to June 30, 2017 @ $202.62/month
12-month lease expense (Jan-Dec) paid in 2016: $2,431.44
XEROX Corp., PO # 4500734462
Xerox color copier lease
October 1, 2013, to August 31, 2017 @ $398.39/month with no overage charge
12-month lease expense (Jan-Dec) paid in 2016: $4,780.68
DELL Marketing LP, PO # 4300446203
SAS Visual Analytics software maintenance
Valid from March 31, 2016 – March 31, 2017
Amount expended in 2016: $11,909.78
Happy Cog, Philadelphia, PA (Purchasing Card)
Logo design contract (completed)
Amount expended in 2016: $10,000.00
Contract Value: $10,000.00

Pennsylvania Patient Safety Authority 2016 Annual Report 101
Contracts under which the Authority Received Revenue in 2016 as a Contractor:
HCIF (Health Care Improvement Foundation) Agreements 1 (Completed) & 2 (Ongoing) – Health Literacy Projects
HCIF 1 Total Receipts in 2016: $27,198.02
HCIF 2 Total Receipts in 2016: $1,198.99
HAP/CMS subcontract agreement – HAP–PA Hospital Engagement Network (HEN 2.0), Completed in 2016
Total Receipts in 2016: $518,002.00
Table 4. Patient Safety Trust Fund Balance Sheet (Unaudited), as of December 31, 2016
ASSETS
Cash in transit $1,199
Temporary investments $5,632,604
Total Assets $5,633,803
LIABILITIES AND FUND BALANCE
Liabilities
Accounts payable and accrued liabilities $6,975
Invoices payable $420,070
Total Liabilities $427,045
Fund Balance
Restricted $5,206,758
Total Fund Balance $5,206,758
Total Liabilities and Fund Balance $5,633,803
Source: Comptroller Operations, Commonwealth Bureau of Accounting and Financial Management
Patient Safety Authority Balance Sheet
Table 4, Balance Sheet, reflects the status of the Patient Safety Trust Fund as of December 31, 2016.
Notes
1. Medical Care Availability and Reduction of Error (MCARE) Act of March 20, 2002, P.L. 154, No 13 40. Available: http://www.legis.state.pa.us/cfdocs/legis/li/uconsCheck.cfm?yr=2002&sessInd=0&act=13.
2. Medical Care Availability and Reduction of Error (MCARE) Act - Reduction and Prevention of Health Care-Asso-ciated Infection and Long-Term Care Nursing Facilities Act of July 20, 2007, P.L. 331, No. 52, Cl.40. http://www.legis.state.pa.us/cfdocs/legis/li/uconsCheck.cfm?yr=2007&sessInd=0&act=52.


Pennsylvania Patient Safety Authority 2016 Annual Report 103
Board of Directors and Public Meetings
Members of the board of directors are appointed by the governor and the general assembly according to certain occupational or residence requirements. As of December 31, 2016, members included:
Physician appointed by the Governor who serves as Chair: Rachel Levine, MD, Physician GeneralResidence: Middletown (Dauphin County)
Appointee of the President pro tempore of the Senate:Daniel Glunk, MD, MHCDSResidence: Williamsport (Lycoming County)
Appointee of the Minority Leader of the Senate:Cliff Rieders, Esq.Residence: Williamsport (Lycoming County)
Appointee of the Speaker of the House:Stanton N. Smullens, MD, Vice ChairResidence: Philadelphia (Philadelphia County)
Appointee of the Minority Leader of the House:Eric Weitz, Esq.Residence: Philadelphia (Philadelphia County)
Pharmacist appointed by the Governor:Arleen G. Kessler, PharmD, MBA, RPhResidence: Williamsport (Lycoming County)
Hospital employee appointed by the Governor:Radheshyam Agrawal, MDResidence: Pittsburgh (Allegheny County)
Healthcare worker appointed by the Governor:Jan Boswinkel, MDResidence: Havertown (Delaware County)
Non-healthcare worker appointed by the Governor:Mary Ellen Mannix, MRPEResidence: Wayne (Delaware County)
Physician appointed by the Governor:John Bulger, DO, MBAResidence: Danville (Montour County)
The Medical Care Availability and Reduction of Error (MCARE) Act requires the board of directors to meet at least quarterly.1 During 2016, the board met frequently to assess and develop future patient safety educational and advocacy activities, including developing standards for more consistent reporting. Representatives of healthcare, consumer, and other stakeholder groups, including the general assembly, have attended and spoken at public meetings. Following are the dates of all public board meetings held by the Authority during 2016:
• January 26, 2016
• March 8, 2016
• April 26, 2016
• June 7, 2016 (cancelled)
• July 26, 2016
• September 13, 2016
• October 25, 2016
• December 13, 2016
Summary minutes of the public meetings are available on the Authority’s website at http://www.patientsafetyauthority.org.
Address:
Pennsylvania Patient Safety Authority 333 Market Street, Lobby Level Harrisburg, PA 17120 Phone: (717) 346-0469
Fax: (717) 346-1090
E-mail: [email protected]
Note
1. Medical Care Availability and Reduction of Error (MCARE) Act of March 20, 2002, P.L. 154, No. 13, Cl. 40. Avail-able: http://www.legis.state.pa.us/cfdocs/legis/li/ucons-Check.cfm?yr=2002&sessInd=0&act=13.

Phone | (717) 346-0469Fax | (717) 346-1090
E-mail | [email protected] Website | www.patientsafetyauthority.org
Address 333 Market Street
Lobby LevelHarrisburg, PA 17120