implementing energy savings with automation - aia … kulkarni_acc_6thnov09_ai… · implementing...
TRANSCRIPT

6th November 2009, Mumbai
1
Implementing Energy Savings with Automation
Gururaj KulkarniHead, Electrical Engineering
ACC Limited
6th November 2009, Mumbai
2
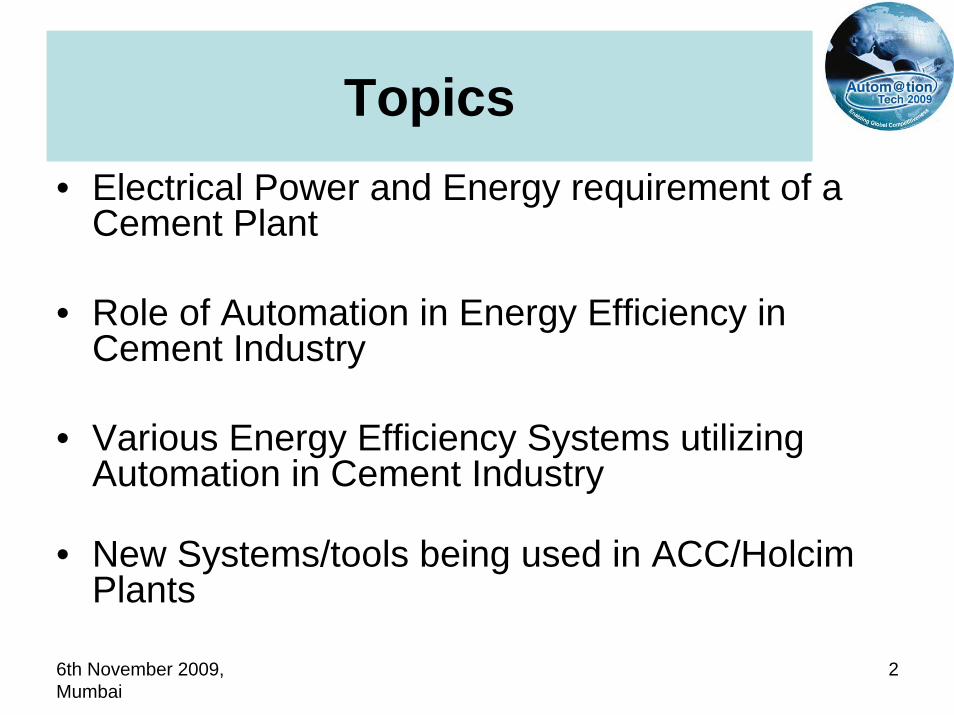
Topics• Electrical Power and Energy requirement of a
Cement Plant
• Role of Automation in Energy Efficiency in Cement Industry
• Various Energy Efficiency Systems utilizing Automation in Cement Industry
• New Systems/tools being used in ACC/Holcim Plants

6th November 2009, Mumbai
3
Energy Consumption and Energy cost in Cement Industry
• Thermal Energy :• Best in India –around 680 kCal/Kg of Clinker• Best in World –around 650 kCal/Kg of Clinker
• Electrical Energy :• Best in India –around 63 kwh/t of Cement• Best in World –around 65 kwh/t of Cement
• Energy cost :• *Electrical energy cost (Grid power) around Rs. 300 / t • *Thermal energy cost around Rs. 500-700 / t• *Note :- These are approx costs and also depends on Energy
sourcing, Plant location, Sale Agreement, transportation cost etc.,

6th November 2009, Mumbai
4
Energy Consumption pattern in Cement Industry
• The Electrical energy consumption in Cement Industry is reduced by around 27% in last decade
• and • Thermal energy consumption by 11% during last one
decade.
• The Energy cost has reduced from 60% of the total cost in 2005 to 50% in 2009.
• CMA & NCB have proposed Energy consumption Norms to BEE for adherence by Cement Industry.

6th November 2009, Mumbai
5
Electrical Power and Energy requirement of a Cement Plant

6th November 2009, Mumbai
6
Electrical Power and Energy requirement of a Cement Plant
• Cement Industry is a Energy Intensive industry (both Electrical & Thermal).
• Therefore Energy Efficiency is very vital in Cement Industry.
• The Medium Voltage (6.6 KV/11 KV) form around 65 % of total loads.

6th November 2009, Mumbai
7
Quantity Powerover 250kW50-250kW10-50kW
3-10kW
up to 3kw
High voltage
Low voltage
1%6%
14%
17%
62%
65%
19%
9%3%4%
Distribution
Power range and distribution profile of drive applications in a cement plant

6th November 2009, Mumbai
8
Motors in a Cement Plant
Motor Type
Slipring Squirrel Cage Direct current
Fixed Speed
Mills, Crushers
Pumps, Belt Conveyor, Fans, Blowers, Compressors etc.,
Variable Speed
Fans with GRR or SPRS
Fans, Separators, Kilns, Belt Conveyors with VFD’s
Kiln, Separator (not recommended now)

6th November 2009, Mumbai
9
Motors in a Cement Plant
Constant Torque Loads KilnMillsSeparatorsConveyorsElevatorsCompressorsCrushers
Variable Torque Loads FansBlowersPumps

6th November 2009, Mumbai
10
Conveyor Belt
Fan or pump
Torque
Ball Mill
Kiln
Winder
Speed
Md
n
n
Md
Md
n
Md
n
Torque/speed profile of process equipment

6th November 2009, Mumbai
11
Typical power distribution structureUtility Power Supply
High VoltageSwitchgear
TransformersHigh / Medium Voltage
Medium Voltage Switchgear
Transformers Medium / Low Voltage
Motor Control Centers
Medium / Low Voltage MotorsPLANT
AUTOMATION
PROCESS
EmergengyPower

6th November 2009, Mumbai
12
kW = Electrical Power
kWh = Electrical Energy
For Plant of 3000 t you need ~ 30’000 kW = 30 MW
of Installed power to be able to run the plant electrical equipment
Rule of Thumb:P = t × (7…10) kW/t
Power and EnergyPower = Energy /
Time

6th November 2009, Mumbai
13
• Specific Electrical Energy Consumption ~ 100 kWh/t
• Electrical Energy Consumed during 24 Hours:Econs = 3’000 t × 100 kWh/t = 300’000 kWh
Average Daily Power Demand:Paver = 300’000 kWh / 24 h = 12’500 kW
• Peak Power Demand: ~ 1.2 - 2 × Average Daily Power Demand~ 25’000 kW (to size electrical equipment)
Power Demand:
6th November 2009, Mumbai
14
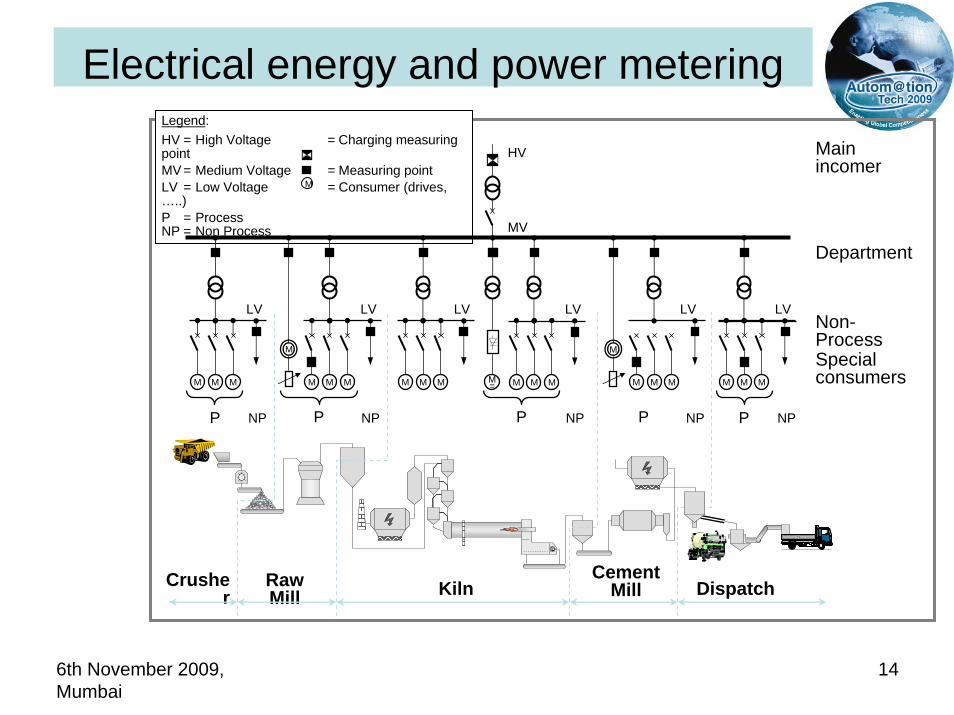
Special consumers
Legend:HV = High Voltage = Charging measuring pointMV = Medium Voltage = Measuring pointLV = Low Voltage = Consumer (drives, …..)P = ProcessNP = Non Process
M
Main incomer
M=
Department
Non-Process
MV
HV
DispatchCement
MillKilnRawMill
Crusher
P NP
LV
P NP P NP
LV
M M M
P NP P NP
LV
M M M
M
M M M
LV
M M M
M
M M M
LV LV
M M M
Electrical energy and power metering

6th November 2009, Mumbai
15
Packing & Shipping
Cement GrindingClinker ProductionRaw Meal Preparation
Raw Material Preparation
Raw Material Extraction
Electrical Energy Consumption per Cost Center 2003
0.8 2.5
25.5
32.9
47.4
2.9
05
101520253035404550
10 Raw Material Extraction 20 Raw Material Preparation 30 Raw Meal Preparation 40 Clinker Production 50 Cement Grinding 60 Packing and Shipping
Plant Cost Center
kWh/
t cem
1%
2%
22%
3%
30%
42%
Plant Cost Center kWh/t cem %
10 Raw Material Extraction 0.8 120 Raw Material Preparation 2.5 230 Raw Meal Preparation 25.5 2240 Clinker Production 32.9 3050 Cement Grinding 47.4 4260 Packing and Shipping 2.9 3
Total 112 100

6th November 2009, Mumbai
16
Total Production costs
63%
19%
18%
Energy Cost
Total production costs:Electrical Energy = 18%-20%Thermal Energy = 18%-30%

6th November 2009, Mumbai
17
Role of Automation in Energy Efficiency
6th November 2009, Mumbai
18
Role of Automation in Energy Efficiency
• Automation plays major role in :
• Collation of Information/data on Energy consumption.
• Provides real-time information about Energy usage
• Analysis of Energy consumption pattern / trends
• Optimization of the operating parameters / philosophy or the equipment/system based on the above analysis.

6th November 2009, Mumbai
19
Role of Automation in Energy Efficiency
• Automation has boosted performance of Drives and therefore now widely accepted system for Energy efficiency in Cement Industry
• Seamless flow of information across units
• Load Shedding Scheme
• Islanding operation of CPP

6th November 2009, Mumbai
20
Role of Automation in Energy Efficiency
• Increase in productivity
• Decrease in Breakdown
• Reduction in per tonne of Energy cost
• The Electrical energy consumption in Cement Industry is reduced by around 27% and Thermal energy by 11% during last one decade

6th November 2009, Mumbai
21
• Protection of environment
Costsavings
Benefits of Automation
• Uniform and automated operation
• Energy saving
• Increasing manpower efficiency
• More efficient maintenance
Best Cement
in the World
• Stable quality of products
• Fast, reliable information
• More reliable operation
• Personnel safety and equipment protection
6th November 2009, Mumbai
22
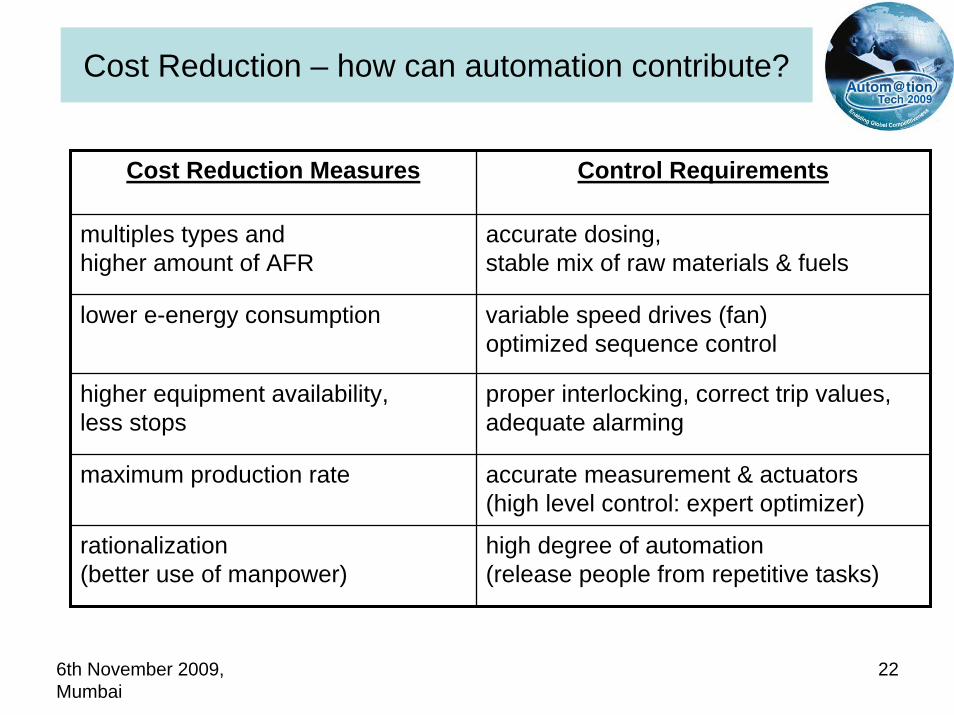
Cost Reduction – how can automation contribute?
Cost Reduction Measures Control Requirements
multiples types and higher amount of AFR
accurate dosing, stable mix of raw materials & fuels
lower e-energy consumption variable speed drives (fan)optimized sequence control
higher equipment availability,less stops
proper interlocking, correct trip values, adequate alarming
maximum production rate accurate measurement & actuators(high level control: expert optimizer)
rationalization (better use of manpower)
high degree of automation (release people from repetitive tasks)

6th November 2009, Mumbai
23
Areas of Automation: From Quarry to Shipping
Quarry
Raw Material
PreparationCement
Mill
Shipping
Quarry: quarry management
Raw Material Preparation: pre-blending control, stock pile management
Raw Mill: process control, material feed and homogenisation
Fuel Preparation: process control, fuel preparation (coal, oil, AFR) & feed
Kiln & Cooler: process control, quality control
Cement Mill: process control, mix and quality control
Shipping: dispatch/ logistic management
Fuel / AFR
Raw Milling Kiln & Cooler

6th November 2009, Mumbai
24
Automation: One Integrated System which Covers all Tasks in the Whole Plant (Quarry to Shipping)
Raw Material
Preparation
Quarry
Raw Milling Kiln & Cooler Cement
Mill
Shipping
Finance, Administration, Maintenance, Logistic, …

6th November 2009, Mumbai
25
Automation Trends in a Cement PlantYear Complexity of control. Plant size Signals
1940 local control of individual machine, local pneumatic/mechanical indication.
50 motors,20 instruments
65
1960 central control rooms (CCR), relay control of motors, some remote indication of instruments.
200 motors,70 instruments
600
1975 first use of programmable controllers,monitoring- or process computers.
400 motors,150 instruments
1'900
1985 first use of PC's in CCR, full graphic displays, communication links. decentralized inputs & outputs
800 motors,300 instruments
3'000
1990distributed control systems, optical cables,automated documentation tools, integration ofmanagement information. full use of PC's….
1000 drives500 sensors
5'500
1995 optimized human machine interface,fuzzy logics, high level control.
1050 drives600 sensors
7'000
2000 field bus, soft PLC based on PC's 1100 drives1000 sensors
9'000
2006 WLAN throughout the plant, increased complexity, new projects 12'000
FutureWAN controlled factory/wireless maintenance, fully integrated information flow, increased complexity More instruments More
signals

6th November 2009, Mumbai
26
TIS (PIMS/LIMS): 350’000 USD
mechanical equipment:68 mio. USD = 100 %for 1 mio t/d plant
EO: 1ki ln & cooler : 250’000 USD1kiln & cooler , 3 mills: 310’000 USD
auto lab & sampler:2 – 3 mio USD
instr. & sensors: 1.5%advanced instr. : 1.5%
of mech. equip.
PCS: 2.8 mio USD per plant or 3 - 5 % of mech. equip.
Specific / typical Cost (system, engineering, installation)
TIS (PIMS/LIMS): 350’000 USD
mechanical equipment:68 mio. USD = 100 %for 1 mio. t/d plant
auto lab & sampler:2 – 3 mio USD
instr. & sensors: 1.5%advanced instr. : 1.5% of mech. equip.
PCS: 2.8 mio. USD per plant or 3 - 5 % of mech. equip.
EO: 1kiln & cooler : 250’000 USD1kiln & cooler , 3 mills: 310’000 USD

6th November 2009, Mumbai
27
Investment & Lifetime Comparison
• Lifetime of an equipment and system (years)
• Investment cost– 1 mio. t/a plant =170 mio. USD– mechanical equipment = 68 mio. USD (40 % of plant)
– electrical equipment = 21 mio. USD (30 % of mech., 12% of plant)
– PCS = 2.8 mio. USD (4 % of mech., 1.6 % of plant)
40 + : mechanical equipment20-35 : electrical equipment8 - 16 : automation
3 - 5 : office automation

6th November 2009, Mumbai
28
Level of Automation in Cement Plants
Very High
+ high level control on all mills+ full-size auto lab+ auto raw/cement-mix control+ automatic shipping station (link to SAP)
High+ high level control on kiln+ TIS for process and lab
Adequate+ master group control+ recipe, silo selection, auto feed
Very Lowstart/stop of individual motors (relay logic)alarm announcer panelsindividual indicators for analog values/loop
MinimumPCS for sequence control, analog indication, loop control and alarming system
Lowmotor sequence on PLCseparate (computer) system of analog/loop
equalcosts
risingcosts

6th November 2009, Mumbai
29
Various Energy Efficiency Systems utilizing Automation in Cement Industry

6th November 2009, Mumbai
30
Various Energy Efficiency Systems utilizing Automation in Cement Industry• 1. Variable Frequency Drives :• Electrical rotating m/cs (Motors) form 90% of Electrical Loads
which is highest of all industries.
• Variable Speed Drives with Frequency converters reduce energy consumption of Pumps & Fans by up to 70%.
• LV drives are common now and MV drives are becoming acceptable now in India. We should promote these in Cement Industry as 65% of the energy consumption is from MV motors.Other industries may also take clue from this.
• Kiln main drive which was predominantly a DC drive, is replaced by VFD now.

6th November 2009, Mumbai
31
Drive train efficiency consideration

6th November 2009, Mumbai
32
Variable Speed Drives

6th November 2009, Mumbai
33
Variable Speed Drives

6th November 2009, Mumbai
34
Compressors

6th November 2009, Mumbai
35
Fan Drive

6th November 2009, Mumbai
36
Fan Drive

6th November 2009, Mumbai
37
Pump

6th November 2009, Mumbai
38
Various Energy Efficiency Systems utilizing Automation in Cement Industry• Medium Voltage Variable Frequency Drives :
• Common in Europe & North America
• It was not very popular in India due to very high capital cost.
• Now due to high energy cost & power shortage, MV drives are being considered for variable speed applications.
• Large Process Fans in Cement Plant consume major part of Electrical energy and MV drives contribute in energy savings for this applications.
• Water cooled MV drives have higher energy saving potential than the Air cooled.
6th November 2009, Mumbai
39
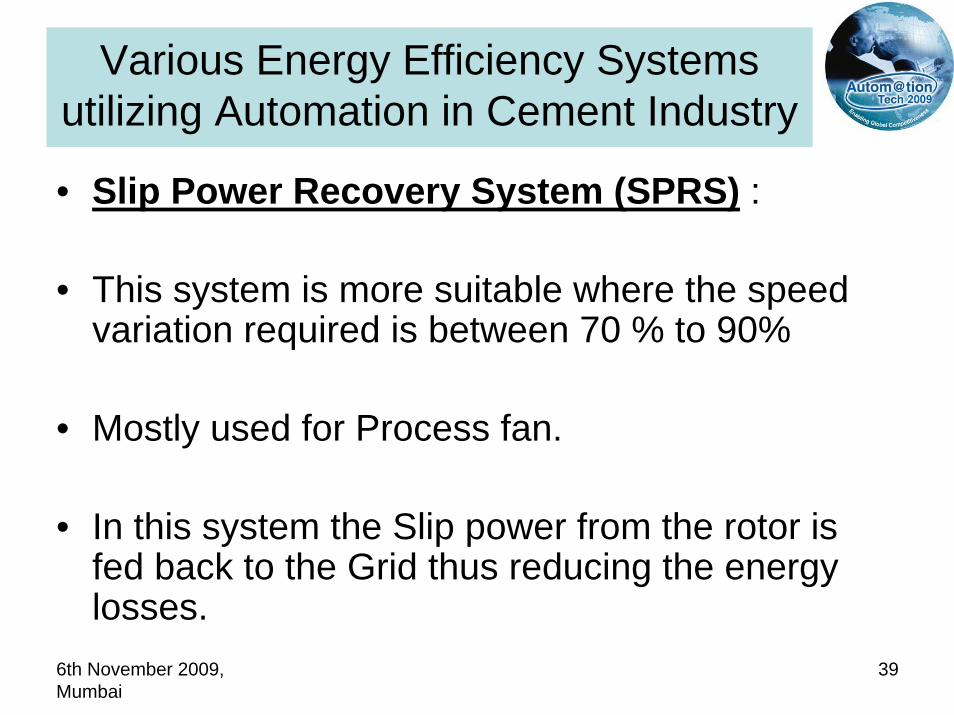
Various Energy Efficiency Systems utilizing Automation in Cement Industry
• Slip Power Recovery System (SPRS) :
• This system is more suitable where the speed variation required is between 70 % to 90%
• Mostly used for Process fan.
• In this system the Slip power from the rotor is fed back to the Grid thus reducing the energy losses.
6th November 2009, Mumbai
40
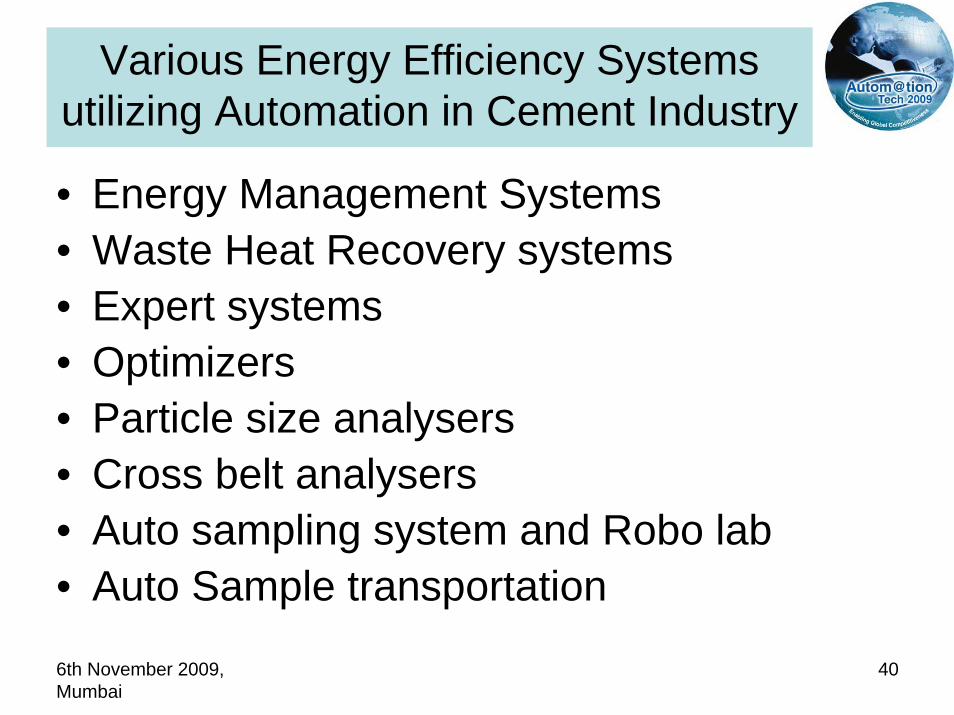
Various Energy Efficiency Systems utilizing Automation in Cement Industry
• Energy Management Systems • Waste Heat Recovery systems• Expert systems• Optimizers• Particle size analysers• Cross belt analysers• Auto sampling system and Robo lab• Auto Sample transportation

6th November 2009, Mumbai
41
New Systems/tools being used in ACC/Holcim Plants

6th November 2009, Mumbai
42
New Systems/tools being used in ACC/Holcim Plants
• Technical Information System (TIS)
• Energy Management Systems
• MV VFD’s
• Waste Heat Recovery systems
• Green building concept for Offices, CCR & Residential Colony

6th November 2009, Mumbai
43
Technical Information System (TIS)
• Storage, analysis and reporting of technical data for Holcim cement plants
6th November 2009, Mumbai
44
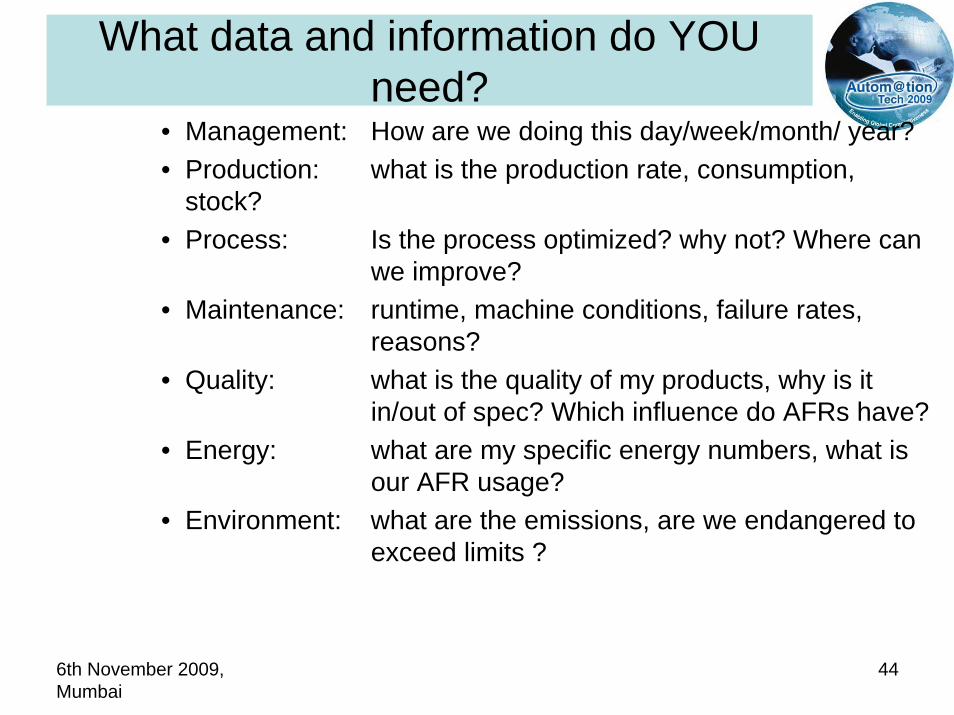
What data and information do YOU need?
• Management: How are we doing this day/week/month/ year?• Production: what is the production rate, consumption,
stock?• Process: Is the process optimized? why not? Where can
we improve?• Maintenance: runtime, machine conditions, failure rates,
reasons?• Quality: what is the quality of my products, why is it
in/out of spec? Which influence do AFRs have?• Energy: what are my specific energy numbers, what is
our AFR usage? • Environment: what are the emissions, are we endangered to
exceed limits ?

6th November 2009, Mumbai
45
Data flow in a cement plant
PMPP
MM / SDLIMS
BW
SAP R/3
HIP
TIS
I/O
HMI
measuring
logic
storage
confirmcompilation
display &
control
transmission
The physical signal e.g. Temperature is converted to an electrical Signal e.g mA
Short tern data storage threshold values for alarm and/or interlocking
Automation networktransmission
Data collection forhigher level data storage(OPC-Server)
Reporting and storage
HMI:1 value display value and trend2. Warning and Alarm3. Control (interlock or PID
Signal transmission4-20 mA or BCD-Signal (Profibus)
Business administration
[ ms ]
[ s ]
[ min,Hr,d,
weeks,y ]
consolidate Management information

6th November 2009, Mumbai
46
Specific indicators(x/t) online
Spanningdata analysis
Information availablefor everybody
OnlineCorrelations
Many sources - one hub - several
destinations
LIMS
PCSProcess Control System
CrossBeltAnalyser
EnergyMonitoringSystem
OnlineParticleSizeAnalyser
ContinuesEmissionMonitoring
XRFXRDLaboratory
I/O
Process Measurements

6th November 2009, Mumbai
47
Specification for an plant information system
• One source for all technical data (process, quality, production, environment,…)
• Easy, reliable and fast access to data• Interfaces to source system: control systems, laboratory
systems• Interface to SAP system• Calculation of indicators• Correction of data (incl. automatic recalculations)• Possibility for ad-hoc reporting

6th November 2009, Mumbai
48
Integration of TIS into Plant Networks
LAB PCS HLC EMS DISP
Link to Corporate HQSAP
TISServer
Plant Admin.
Plant Operation
LINKman
Automation Network
Office Network
Firewall

6th November 2009, Mumbai
49
Data consolidation and storage
Minute dataStorage period 1.5 years
Hour dataStorage period 1.5 years
Shift dataStorage period 1.5 years
Day dataStorage period 5 years
Week dataStorage period 5 years
Month dataStorage period 10 years
Year dataStorage period 10 years
Laboratory dataStorage period 10 years

6th November 2009, Mumbai
50
Electrical Energy Report• Energy reports according HARP and plant requirements
supports a close monitoring and analysis of energy consumption.

6th November 2009, Mumbai
51
TIS Mission Statement
• Provide a proven solution to Holcim cement plants for – online process data acquisition – long-time data storage– comprehensive process data management– analysis of process performance– support of sustainable process optimization
• With the definitions of the TIS Global Concept a standard scope and functionality as well as a systematic implementation will be achieved for every TIS implementation in Holcim.

6th November 2009, Mumbai
52
Energy Management System
• The Main functions of the proposed EMS are :
Load Monitoring
Load Shedding Assistance
Analysis & Reporting
Remote access to the Energy Management Systems information
Load Optimization

6th November 2009, Mumbai
53
Overview of proposed overall metering system configuration

6th November 2009, Mumbai
54

6th November 2009, Mumbai
55

6th November 2009, Mumbai
56

6th November 2009, Mumbai
57

6th November 2009, Mumbai
58
*****Thank You*****