implementation of energy detection · pdf fileimplementation of energy detection spectrum...
TRANSCRIPT
International Journal Of Electrical, Electronics And Data Communication, ISSN: 2320-2084 Volume-4, Issue-5, May.-2016
Implementation of Energy Detection Spectrum Sensing Using USRP N210 and GNU Radio
47
IMPLEMENTATION OF ENERGY DETECTION SPECTRUM SENSING USING USRP N210 AND GNU RADIO
1P. BISWAS, 2K. DAS, 3D. SHARMA, 4P. BORO, 5R. NATH, 6A. J. SARMAH
1,2,3,4,5B.E. (8th Semester), Electronics and Telecommunication Engineering, Assam Engineering College
6Lecturer, Electronics and Telecommunication Engineering, Assam Engineering College E-mail: [email protected], [email protected], [email protected]
Abstract— In this era of wireless technology, scarcity of wireless channels pose a severe dilemma for service providers and telecom operators. Cognitive radio technology provides a novel solution for significantly improving spectrum utilization. A cognitive radio consists of 4 cyclic steps- spectrum sensing, spectrum management, spectrum mobility and spectrum sharing out of which spectrum sensing is the most important and complex step. In this paper, the energy detection spectrum sensing mechanism has been investigated using GNU Radio and USRP N210 operating at a centre frequency of 825 MHz and within a bandwidth of 20MHz. An important point to note is that the bandwidth under consideration is kept fixed and thus, the delay associated with tuning of centre frequency is absent. The sensing mechanism employed is the Energy Detection spectrum sensing technique with 1024 point FFT. The entire experimental setup was initially made in the GNU Radio Companion (GRC) and later the corresponding python program generated was modified externally. Data for 30 different time frames each comprising of 1024 samples was recorded for analysis. Finally, in order to determine the optimum threshold value, the probability of false alarm (Pfa) was calculated and plotted from the data recorded earlier for 5 different threshold values of -98 dB, -99 dB, -100 dB, -101 dB and -102 dB. The final target is to choose a threshold such that Pfa lies just below 5%. Index Terms— GNU Radio, USRP N210, GRC, spectrum sensing, spectrum management, spectrum mobility, spectrum sharing, energy detection. I. INTRODUCTION Wireless communication has become an indispensable part of our daily lives with demands growing more diverse every day. According to the USA Federal Communications Commission (FCC), the conventional fixed channel allocation technique has resulted in sporadic and inefficient spectrum usage [1]. The same can be said for other countries as well [2]. But, the available spectrum that can be utilized remains fixed and limited thus giving rise to the need for newer and better communication paradigms to better analyze the spectrum to thereby increase spectrum utilization efficiency. One such solution to the problem of spectrum utilization inefficiency is provided by the Cognitive Radio (CR) technology which is expected to be the next big thing in the
Fig 1: Classification of spectrum sensing techniques
field of wireless communication. The concept of CR technology was first introduced by Joseph Mitola in
his doctoral dissertation [3]. Basically, this technology allows secondary or unlicensed users (SU) to temporarily utilize the unused sections of spectrum (also called spectrum holes or white spaces) and releases them when requested by the licensed or primary user (PU). Thus, the first step in designing a cognitive radio is to identify the location of the white spaces in the spectrum. This is termed as spectrum sensing. Apart from being the most essential step, spectrum sensing is also the most practically challenging step. There are a number of factors that make spectrum sensing challenging. Firstly, the sensing problem can be severely complicated by multipath fading and time dispersion of wireless channels. Secondly, the required SNR for detection
Fig 2: Sensing accuracy and complexity of various sensing
methods may be very low. In such a case, the SU will not be able to detect the PU even though it is very near to it giving rise to signal interference. Thirdly, noise power
Matched Filter Detection
Covariance based Detection
Cyclostationary based Detection
Energy based Detection
ACCURACY
COM
PLEX
ITY
International Journal Of Electrical, Electronics And Data Communication, ISSN: 2320-2084 Volume-4, Issue-5, May.-2016
Implementation of Energy Detection Spectrum Sensing Using USRP N210 and GNU Radio
48
uncertainty may arise due to changing levels of noise or interference with time and location. These challenges gave birth to a wide scope of research area for spectrum sensing alone and a number of spectrum sensing methods like energy based detection, cyclostationary based detection, matched filter detection, wavelet detection, and filter bank based detection. As can be seen from Fig 2, the most accurate and complex spectrum sensing technique is the matched filter detection technique while energy detection based spectrum sensing is the least accurate and complex. Matched filter detection is an optimal method for spectrum sensing when the transmitted signal is known and maximizes the signal to noise ratio (SNR) when additive white stochastic noise is present. It is basically a linear filter obtained by correlation of a known signal and an unknown signal to detect the presence of the known signal in the unknown signal. Covariance detection on the other hand is used when no prior knowledge of signal or power is present. This technique is based on covariance which is a measure of the strength of the link between two random variables such that when the value of one random variable is known then the other can be determined without any uncertainty. Similar to covariance detection, Energy Detection technique does not require prior knowledge of the PU signal. It is a non coherent detection technique where the presence of PU is estimated by comparing the received signal energy with a known threshold derived from noise statistics. Cyclostationary Feature Detection detects the PU by exploiting the cyclostationary features of a signal. A signal is said to be cyclostationary if its autocorrelation is a periodic in nature. The signal is absent if at a given cyclic frequency, the cyclic autocorrelation function is below the threshold level. Wavelet detection is relatively recent and uses the fully scalable modulated window to overcome the drawbacks of the Fourier Transform. The spectrum is calculated at every position by shifting the window along the signal. This process is repeated with a slightly shorter or longer window for every new cycle to finally get a collection of time-frequency representations of the signal with different resolutions. Another point to be noted is that spectrum sensing can be done either by direct or indirect methods. The direct method or the frequency domain approach is where sensing is done directly from the signal whereas autocorrelation is required in the indirect or time domain approach [4]. This research was done with the objective of designing a cognitive radio that would work with as less delay as possible. Spectrum sensing is just the first step in designing the entire radio. Energy detection spectrum sensing was chosen primarily for two reasons: (1) it was assumed that very limited prior information is present on the PU signal and (2) low complexity of execution which would ultimately make the final design of the cognitive radio simple. This paper is organized as follows: Section II presents
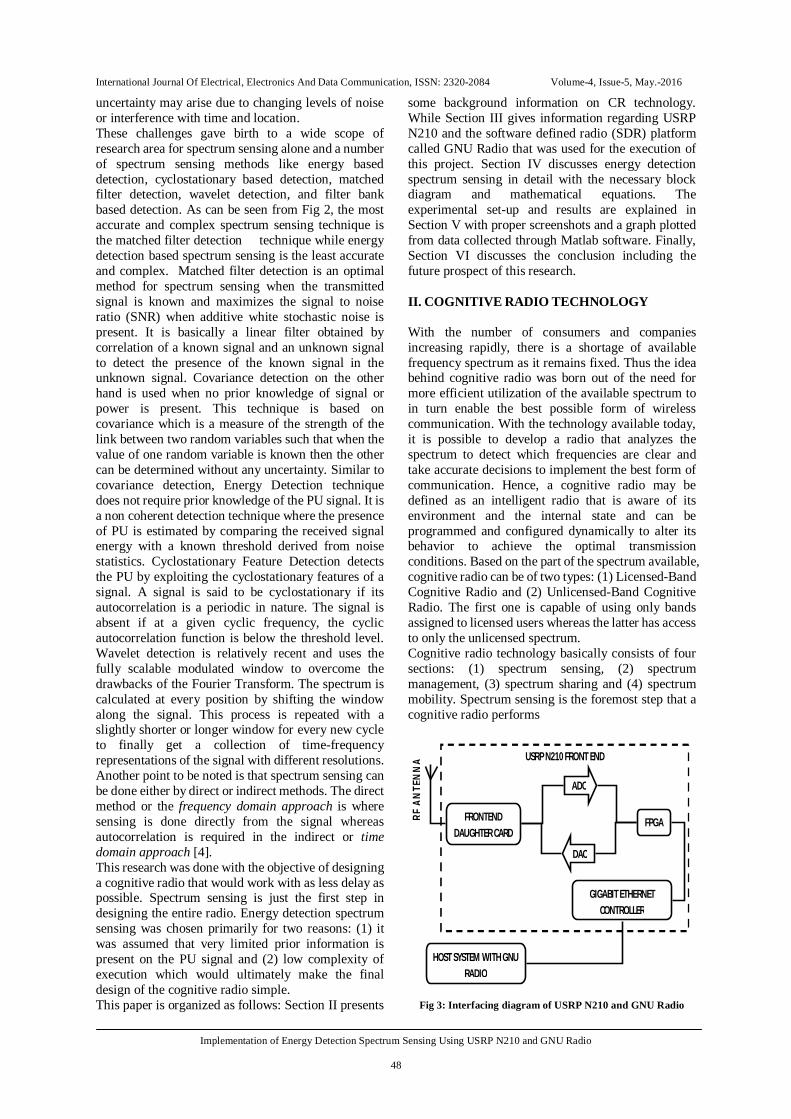
some background information on CR technology. While Section III gives information regarding USRP N210 and the software defined radio (SDR) platform called GNU Radio that was used for the execution of this project. Section IV discusses energy detection spectrum sensing in detail with the necessary block diagram and mathematical equations. The experimental set-up and results are explained in Section V with proper screenshots and a graph plotted from data collected through Matlab software. Finally, Section VI discusses the conclusion including the future prospect of this research. II. COGNITIVE RADIO TECHNOLOGY With the number of consumers and companies increasing rapidly, there is a shortage of available frequency spectrum as it remains fixed. Thus the idea behind cognitive radio was born out of the need for more efficient utilization of the available spectrum to in turn enable the best possible form of wireless communication. With the technology available today, it is possible to develop a radio that analyzes the spectrum to detect which frequencies are clear and take accurate decisions to implement the best form of communication. Hence, a cognitive radio may be defined as an intelligent radio that is aware of its environment and the internal state and can be programmed and configured dynamically to alter its behavior to achieve the optimal transmission conditions. Based on the part of the spectrum available, cognitive radio can be of two types: (1) Licensed-Band Cognitive Radio and (2) Unlicensed-Band Cognitive Radio. The first one is capable of using only bands assigned to licensed users whereas the latter has access to only the unlicensed spectrum. Cognitive radio technology basically consists of four sections: (1) spectrum sensing, (2) spectrum management, (3) spectrum sharing and (4) spectrum mobility. Spectrum sensing is the foremost step that a cognitive radio performs
Fig 3: Interfacing diagram of USRP N210 and GNU Radio
FRONTEND DAUGHTER CARD
ADC
DAC
FPGA
HOST SYSTEM WITH GNU RADIO
RF A
NTE
NN
A USRP N210 FRONT END
GIGABIT ETHERNET CONTROLLER
International Journal Of Electrical, Electronics And Data Communication, ISSN: 2320-2084 Volume-4, Issue-5, May.-2016
Implementation of Energy Detection Spectrum Sensing Using USRP N210 and GNU Radio
49
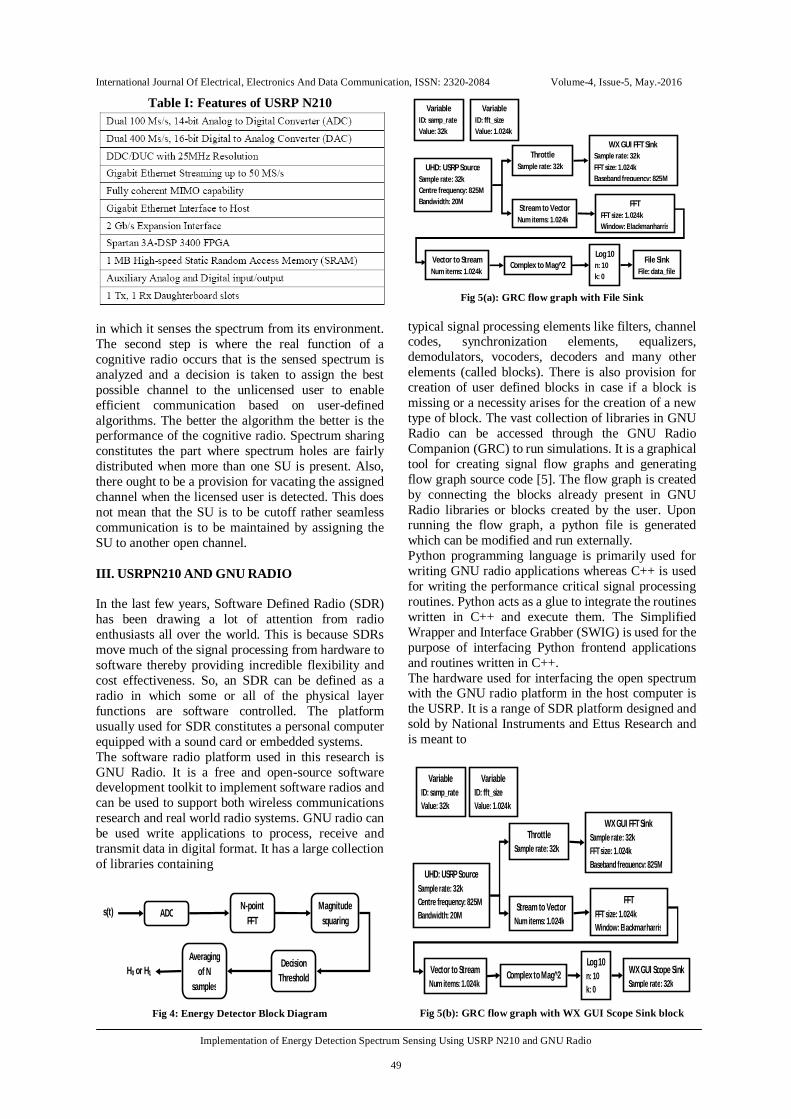
Table I: Features of USRP N210
in which it senses the spectrum from its environment. The second step is where the real function of a cognitive radio occurs that is the sensed spectrum is analyzed and a decision is taken to assign the best possible channel to the unlicensed user to enable efficient communication based on user-defined algorithms. The better the algorithm the better is the performance of the cognitive radio. Spectrum sharing constitutes the part where spectrum holes are fairly distributed when more than one SU is present. Also, there ought to be a provision for vacating the assigned channel when the licensed user is detected. This does not mean that the SU is to be cutoff rather seamless communication is to be maintained by assigning the SU to another open channel. III. USRPN210 AND GNU RADIO In the last few years, Software Defined Radio (SDR) has been drawing a lot of attention from radio enthusiasts all over the world. This is because SDRs move much of the signal processing from hardware to software thereby providing incredible flexibility and cost effectiveness. So, an SDR can be defined as a radio in which some or all of the physical layer functions are software controlled. The platform usually used for SDR constitutes a personal computer equipped with a sound card or embedded systems. The software radio platform used in this research is GNU Radio. It is a free and open-source software development toolkit to implement software radios and can be used to support both wireless communications research and real world radio systems. GNU radio can be used write applications to process, receive and transmit data in digital format. It has a large collection of libraries containing
Fig 4: Energy Detector Block Diagram
Fig 5(a): GRC flow graph with File Sink
typical signal processing elements like filters, channel codes, synchronization elements, equalizers, demodulators, vocoders, decoders and many other elements (called blocks). There is also provision for creation of user defined blocks in case if a block is missing or a necessity arises for the creation of a new type of block. The vast collection of libraries in GNU Radio can be accessed through the GNU Radio Companion (GRC) to run simulations. It is a graphical tool for creating signal flow graphs and generating flow graph source code [5]. The flow graph is created by connecting the blocks already present in GNU Radio libraries or blocks created by the user. Upon running the flow graph, a python file is generated which can be modified and run externally. Python programming language is primarily used for writing GNU radio applications whereas C++ is used for writing the performance critical signal processing routines. Python acts as a glue to integrate the routines written in C++ and execute them. The Simplified Wrapper and Interface Grabber (SWIG) is used for the purpose of interfacing Python frontend applications and routines written in C++. The hardware used for interfacing the open spectrum with the GNU radio platform in the host computer is the USRP. It is a range of SDR platform designed and sold by National Instruments and Ettus Research and is meant to
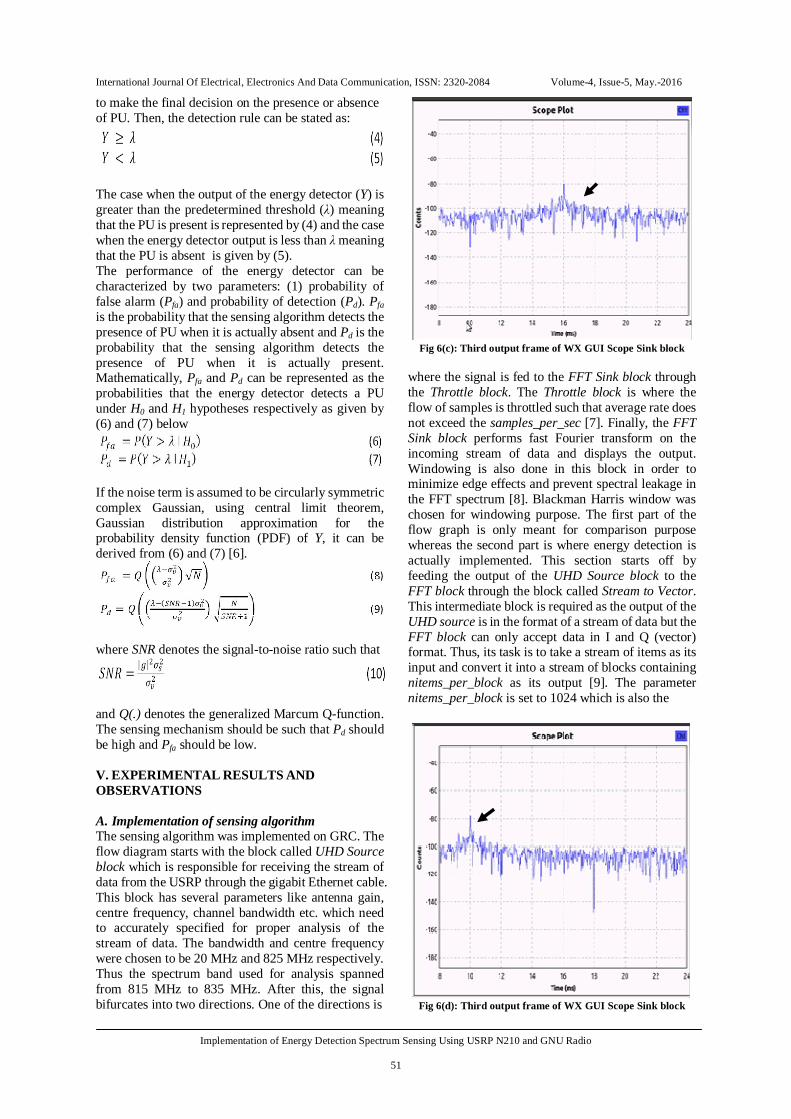
Fig 5(b): GRC flow graph with WX GUI Scope Sink block
Decision Threshold
N-point FFT
Averaging of N
samples
ADC Magnitude
squaring s(t)
H0 or H1
Vector to Stream Num items: 1.024k
UHD: USRP Source Sample rate: 32k Centre frequency: 825M Bandwidth: 20M
Throttle Sample rate: 32k
WX GUI FFT Sink Sample rate: 32k FFT size: 1.024k Baseband frequency: 825M
Stream to Vector Num items: 1.024k
FFT FFT size: 1.024k Window: Blackmanharris
Complex to Mag^2 Log 10 n: 10 k: 0
File Sink File: data_file
Variable ID: fft_size Value: 1.024k
Variable ID: samp_rate Value: 32k
Vector to Stream Num items: 1.024k
UHD: USRP Source Sample rate: 32k Centre frequency: 825M Bandwidth: 20M
Throttle Sample rate: 32k
WX GUI FFT Sink Sample rate: 32k FFT size: 1.024k Baseband frequency: 825M
Stream to Vector Num items: 1.024k
FFT FFT size: 1.024k Window: Blackmanharris
Complex to Mag^2 Log 10 n: 10 k: 0
Variable ID: fft_size Value: 1.024k
Variable ID: samp_rate Value: 32k
WX GUI Scope Sink Sample rate: 32k

International Journal Of Electrical, Electronics And Data Communication, ISSN: 2320-2084 Volume-4, Issue-5, May.-2016
Implementation of Energy Detection Spectrum Sensing Using USRP N210 and GNU Radio
50
Fig 5(c): GRC flow graph with Threshold block
serve as relatively inexpensive hardware platform for software radio. The model of USRP used in this research was the USRP N210 which is the highest performing class of hardware of the USRP family of products whose features are shown in Table I. The Multiple Input Multiple Output (MIMO) capability allows two similar units of USRP to be connected together using the MIMO cable to realize a complete and synchronized 2x2 MIMO configuration. The general purpose tasks of digital down conversion (DDC), digital up conversion (DUC), decimation, interpolation are performed in the Field Programmable Array (FPGA) of the USRP. DDC and analog to digital conversion is done during transmission of signal when the RF signal is fetched from the real time environment and converted to Intermediate Frequency (IF) and Direct Current (DC). Conversely, DUC and digital to analog conversion is required during
Fig 6(a): Output of FFT Sink block
Fig 6(b): First output frame of WX GUI Scope Sink block
reception. The transmission or reception of signals between USRP and host computer equipped with GNU Radio takes place through the Gigabit Ethernet controller as shown in Fig. 3. IV. ENERGY DETECTION SPECTRUM SENSING In energy detection spectrum sensing mechanism, to determine whether the channel is active or not the energy of the received signal is compared to a predetermined threshold. Unlike matched filter detector, prior knowledge on the transmitted PU signal is not required in case of energy detector. As shown in the block diagram in Fig. 4, the processing starts by converting the received signal to the digital domain by the ADC. After that, FFT is done and the square of the magnitude of each FFT sample is calculated. Finally, to make the measurement more accurate, average of N number of samples is used to make the decision on the presence or absence of the signal. In time domain, the sensing mechanism is based on the following hypotheses:
where n=1,2,…,N; N and g denote the total number of samples and the channel gain respectively. Hypothesis H0 is when the PU is present and hypothesis H1 is when the PU is absent. Value of g is 0 for (1) and 1 for (2). Y[n] and S[n] denote the received signal and transmitted signal respectively. The noise V[n] is assumed to be Additive White Gaussian noise (AWGN) with zero mean and variance σv
2. Similarly, S[n] is assumed to be a random process with zero mean and variance σs
2. Using Neyman-Pearson criterion the test statistics of the energy detector can be given as
where Y is the output of the energy detector. Let λ be the predetermined threshold with which Y is compared
Vector to Stream Num items: 1.024k
UHD: USRP Source Sample rate: 32k Centre frequency: 825M Bandwidth: 20M
Throttle Sample rate: 32k
WX GUI FFT Sink Sample rate: 32k FFT size: 1.024k Baseband frequency: 825M
Stream to Vector Num items: 1.024k
FFT FFT size: 1.024k Window: Blackmanharris
Complex to Mag^2 Log 10 n: 10 k: 0
File Sink File: data_file
Variable ID: fft_size Value: 1.024k
Variable ID: samp_rate Value: 32k
WX GUI Slider ID: high Default value: -100 Minimum: -120 Maximum: -80
WX GUI Slider ID: low Default value: -100 Minimum: -120 Maximum: -80
Threshold Low: -100 High: -100
International Journal Of Electrical, Electronics And Data Communication, ISSN: 2320-2084 Volume-4, Issue-5, May.-2016
Implementation of Energy Detection Spectrum Sensing Using USRP N210 and GNU Radio
51
to make the final decision on the presence or absence of PU. Then, the detection rule can be stated as:
The case when the output of the energy detector (Y) is greater than the predetermined threshold (λ) meaning that the PU is present is represented by (4) and the case when the energy detector output is less than λ meaning that the PU is absent is given by (5). The performance of the energy detector can be characterized by two parameters: (1) probability of false alarm (Pfa) and probability of detection (Pd). Pfa is the probability that the sensing algorithm detects the presence of PU when it is actually absent and Pd is the probability that the sensing algorithm detects the presence of PU when it is actually present. Mathematically, Pfa and Pd can be represented as the probabilities that the energy detector detects a PU under H0 and H1 hypotheses respectively as given by (6) and (7) below
If the noise term is assumed to be circularly symmetric complex Gaussian, using central limit theorem, Gaussian distribution approximation for the probability density function (PDF) of Y, it can be derived from (6) and (7) [6].
where SNR denotes the signal-to-noise ratio such that
and Q(.) denotes the generalized Marcum Q-function. The sensing mechanism should be such that Pd should be high and Pfa should be low. V. EXPERIMENTAL RESULTS AND OBSERVATIONS A. Implementation of sensing algorithm The sensing algorithm was implemented on GRC. The flow diagram starts with the block called UHD Source block which is responsible for receiving the stream of data from the USRP through the gigabit Ethernet cable. This block has several parameters like antenna gain, centre frequency, channel bandwidth etc. which need to accurately specified for proper analysis of the stream of data. The bandwidth and centre frequency were chosen to be 20 MHz and 825 MHz respectively. Thus the spectrum band used for analysis spanned from 815 MHz to 835 MHz. After this, the signal bifurcates into two directions. One of the directions is
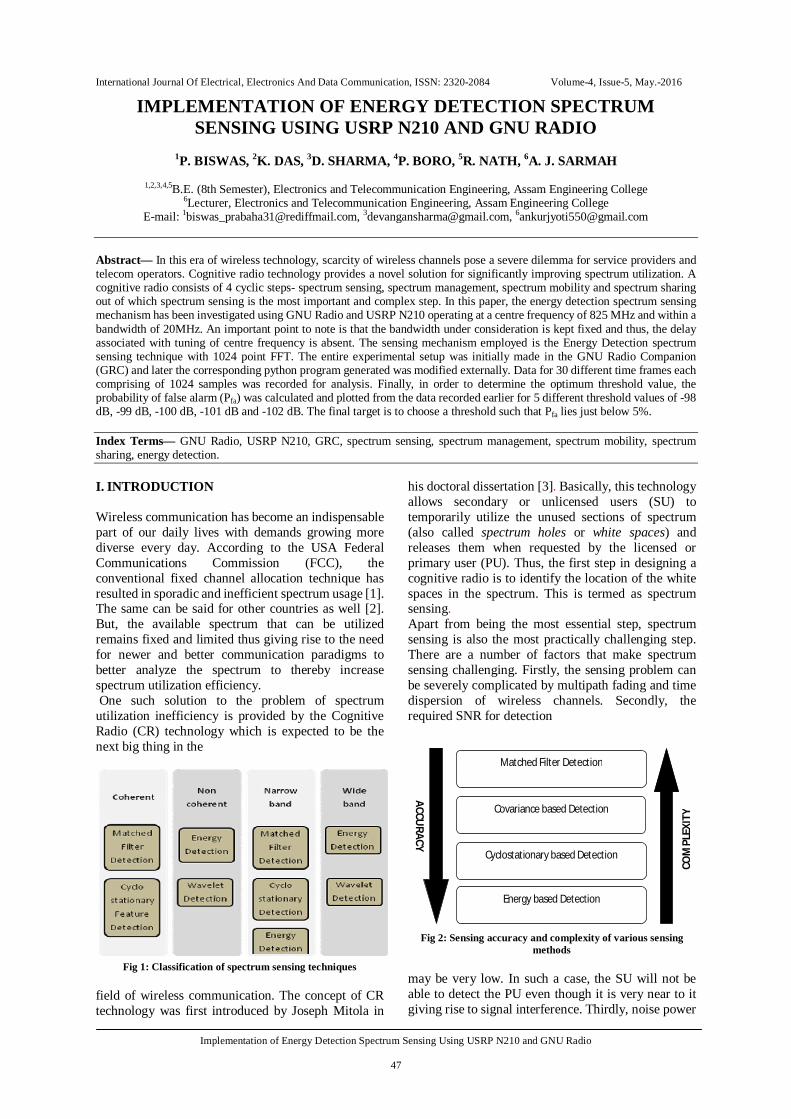
Fig 6(c): Third output frame of WX GUI Scope Sink block
where the signal is fed to the FFT Sink block through the Throttle block. The Throttle block is where the flow of samples is throttled such that average rate does not exceed the samples_per_sec [7]. Finally, the FFT Sink block performs fast Fourier transform on the incoming stream of data and displays the output. Windowing is also done in this block in order to minimize edge effects and prevent spectral leakage in the FFT spectrum [8]. Blackman Harris window was chosen for windowing purpose. The first part of the flow graph is only meant for comparison purpose whereas the second part is where energy detection is actually implemented. This section starts off by feeding the output of the UHD Source block to the FFT block through the block called Stream to Vector. This intermediate block is required as the output of the UHD source is in the format of a stream of data but the FFT block can only accept data in I and Q (vector) format. Thus, its task is to take a stream of items as its input and convert it into a stream of blocks containing nitems_per_block as its output [9]. The parameter nitems_per_block is set to 1024 which is also the
Fig 6(d): Third output frame of WX GUI Scope Sink block

International Journal Of Electrical, Electronics And Data Communication, ISSN: 2320-2084 Volume-4, Issue-5, May.-2016
Implementation of Energy Detection Spectrum Sensing Using USRP N210 and GNU Radio
52
size of FFT used in this research. After this, the FFT block similar to the FFT sink block performs 1024 point FFT on the incoming data except that in this case the output instead of being displayed like the FFT sink block is sent to the Vector to Stream block for further processing. The Vector to Stream block performs the exact opposite of the function done by the Stream to Vector block and converts the output of FFT block back to stream format and sends it to the Complex to Mag^2 block. Up until this point both the input and output of all the blocks were in complex vector form. But, the Complex to Mag2 block gives its output in float format. It takes a complex number as its input and gives the square of its magnitude in float format as its output. Then, this result is passed to the Log 10 block which converts the ADC value which represents the voltage value to the dB value. Finally, to make sure that the data generated was accurate in real time two types of blocks were used as sinks one at a time: (1) the File Sink and (2) the WX GUI Scope Sink. The File Sink was used for writing the data into an empty file for a certain period of time such that a total of approximately 30,720 samples were written. The 30,720 samples written consisted of 30 time frames each again comprising of 1024 samples. The WX GUI Scope Sink block was used to compare the output of the second part of the flow graph with that of the first part. The output of the FFT Sink should match with that of the WX GUI Scope Sink. Here, the File Sink and WX GUI Scope Sink were used only for analysis of the performance characteristics and in turn determine the optimum threshold level. Once the correct threshold level is chosen, the output of the Log 10 block is to be fed to the Threshold block. The Threshold block was used for comparing the output of the sensing diagram with a predetermined threshold. It has two parameters called high and low. If the signal level becomes higher than the value set for the high parameter or if the signal value goes below the value set for low parameter of the threshold then the block outputs a value of 1 otherwise the output is 0. In this research however, the values assigned to both the parameters is same such that when the signal level goes above or below this assigned value the output of the threshold block is 1 and 0 respectively. Fig 5 (a), (b) and (c) represent the flow graphs with the File Sink, the WX GUI Scope Sink and the Threshold block respectively. The blocks seen on the top left corner of the flow graphs represent the variables used and the threshold values. The samp_rate variable block sets the sampling rate at 32k MS/s and the fft_size variable block sets the FFT size at 1.024k. The other two blocks used are called WX GUI Slider blocks and are used to set the values for the high and low parameters of the Threshold block. These values are not fixed and can be changed at run time with the help of a slider. B. Experimental Data A randomly generated DQPSK signal was transmitted at the centre frequency of 825 MHz using another
USRP N210 acting as cognitive transmitter as shown in Fig.6. To determine Pfa, the measurement needs to be carried out Table II: Maximum, Minimum and Average values of Pfa
when there is no signal transmission that is only noise is present. As mentioned in the last section, a total of 30,720 samples were collected in the File Sink which were later analyzed through Matlab software. These 30,720 samples constituted of 30 time frames with each time frame having 1024 samples. For each of these time frames probability of false alarm was calculated at varying threshold levels to check whether the energy detection flow graph produced approximately correct and constant values of Pfa as time progressed and also to determine the value of threshold to be finally used such that the Pfa is just below 5%. The values of threshold chosen for comparison are -98 dB, -99 dB, -100 dB, -101 dB and -102 dB. These 5 values of threshold together with the 30 time frames will generate a total of 150 values of Pfa. The corresponding graphical plot is shown in Fig 7 and also the maximum, minimum and average values of Pfa for each of the 5 thresholds is tabulated in Table II above. It can be seen from both Fig.7 and Table II that the threshold value of -101 dB is appropriate in order to keep Pfa just below 5%. The output of the FFT Sink block is given in Fig. 6(a) and the output of WX GUI Scope Sink
Fig 7: Probability of false alarm versus time frames at various
threshold values

International Journal Of Electrical, Electronics And Data Communication, ISSN: 2320-2084 Volume-4, Issue-5, May.-2016
Implementation of Energy Detection Spectrum Sensing Using USRP N210 and GNU Radio
53
block at various instances of time is given in Fig. 6(b), (c) and (d) . The presence of the PU signal is pointed by the black arrow. By comparing Fig. 6(a) and (c), it can be said that the output of the FFT Sink and WX GUI Scope Sink approximately match each other. CONCLUSION An Energy Detector was designed at a centre frequency of 825 MHz within a bandwidth of 20 MHz using USRP N210 and GNU Radio. The design was implemented on the GNU Radio Companion and the output was stored in a file for analysis. The performance metric Probability of False Alarm was estimated for various instances of time for different values of threshold. Finally, the optimum threshold value of -101dB was selected to match a target Pfa value of less than 5%. Future works will include attempts to increase the bandwidth coverage by synchronizing two USRPs with a MIMO cable and also design the entire cognitive radio by implementing the other three steps: spectrum management, sharing and mobility.
REFERENCES
[1] FCC, “Spectrum policy task force report,” in Proceedings of the Federal Communications Commission (FCC ’02), Washington, DC, USA, November 2002.
[2] M. H. Islam, C. L. Koh, S. W. Oh, X. Qing, Y. Y. Lai, C. Wang et al., “Spectrum survey in Singapore: occupancy measurements and analysis,” in Proceedings of the 3rd International Conference on Cognitive Radio Oriented Wireless Networks and Communications (CROWNCOM ’08), Singapore, May 2008.
[3] J. Mitola and G. Q. Maguire, “Cognitive Radio: making software radios more personal,” IEEE Personal Communications, vol.6, no. 4, pp. 13-18, 1999.
[4] S. Kalia, “Spectrum sensing Techniques and Challenging Issues in Cognitive Radio,” SSRG International Journal of Electronics and Communication Engineering (SSRG-IJECE), vol.2, issue 5, pp. 44-49, May 2015.
[5] GNU Radio Companion, https://gnuradio.org/redmine/projects/gnuradio/wiki/GNURadioCompanion.
[6] H. V. Poor, An Introduction to signal detection and estimation, 2nd ed. Springer-Verlag, New York, 1994.
[7] GNU Radio Manual and C++ API Reference, https://gnuradio.org/doc/doxygen/classgr_1_1blocks_1_1throttle.html#details.
[8] P. Courtois. “Windowing: Optimizing FFTs Using Window Functions”. National Instruments Tutorial, 3 September 2008.
[9] GNU Radio Manual and C++ API Reference, https://gnuradio.org/doc/doxygen/classgr_1_1blocks_1_1stream__to__vector.html#details.