implan based impact modeling for … · fisheries on florida’s east coast: alternative approaches...
TRANSCRIPT
IMPLAN BASED IMPACT MODELING FOR COMMERICALFISHERIES ON FLORIDA’S EAST COAST: ALTERNATIVE
APPROACHES AND RECOMMENDATIONS
by
David Mulkey, Tom Stevens, Alan W. Hodges, and Charles Adams
Food and Resource Economics DepartmentInstitute of Food and Agricultural Sciences
University of Florida
Project report to National Marine Fisheries Service,University of Florida Project No. 03060952
March, 2005
i
TABLE OF CONTENTS
INTRODUCTION...........................................................................................................1
THE FLORIDA EAST COAST FISHERY: AN OVERVIEW ........................................1
STATE AND FEDERAL FISHERIES DATA PROGRAMS ..........................................9
Cost and Effort Data Requirements............................................................................10
THE IMPLAN REGIONAL MODELING SYSTEM ....................................................18
Overview and Theory ................................................................................................18
Industry Sectors and Regional Trade Flows ............................................................... 19
Defining Study Regions.............................................................................................21
Adjustments to IMPLAN...........................................................................................22
IMPLAN Fishery Sectors ..........................................................................................23
REVIEW OF MODELING APPROACHES .................................................................23
Modeling Fishery Industries: A Conceptual Framework ............................................24
Input-Output Logic and Product Flows ..................................................................24
Application to Regulatory Changes in Fisheries.....................................................26
Approaches to IMPLAN Applications .......................................................................26
Estimating Direct Impacts...................................................................................... 27
Kirkley Mid-Atlantic Approach .............................................................................27
Steinback-Thunberg New England Approach ........................................................29
Sectors, Regions and Applications.............................................................................30
Defining Fishing Related Sectors and Sub-regions.....................................................32
CONCLUSIONS AND RECOMMENDATIONS .........................................................34
ii
LIST OF TABLES
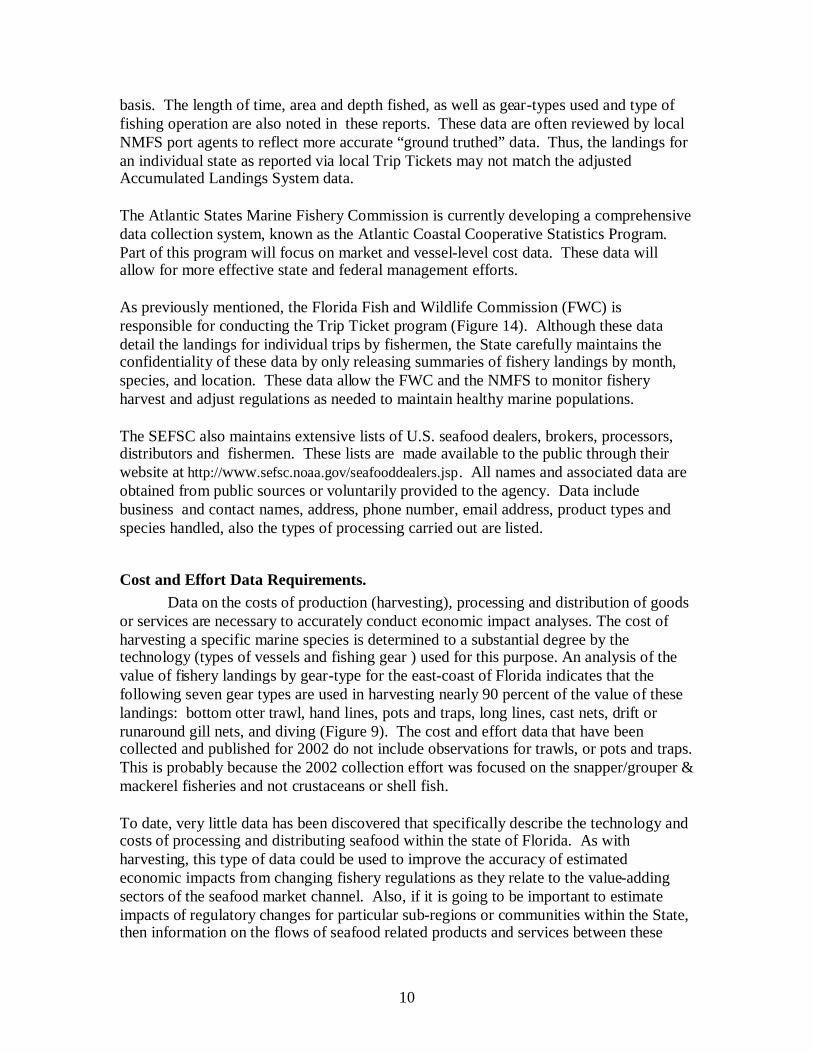
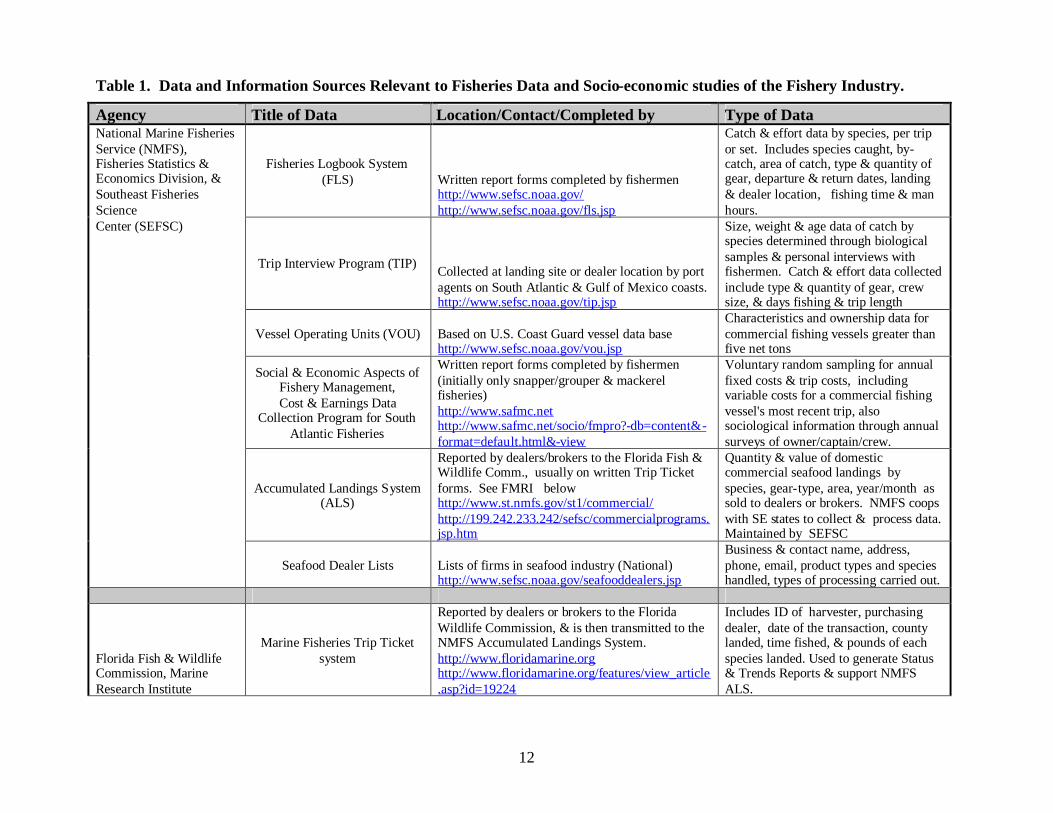
Table 1. Data and Information Sources Relevant to Fisheries Data andSocio-economic Studies of the Fishery Industry .............................................. 12
Table 2. Typical Fishing Expenditures and IMPLAN Sectors ..................................... 28
Table 3. Fishing Related Sectors: Mid-Atlantic and New England Models .................. 32

iii
LIST OF FIGURES
Figure 1. Florida East Coast Fishery: Landings, Value and Implied Price,1998 – 2002 ................................................................................................. 4
Figure 2. Florida East Coast Fishery: Sum of Landings and Value by Countyfor 5 Years between 1998 – 2002 ................................................................. 4
Figure 3. Bureau of Economic Analysis Economic Areas for East Coast of Florida .... 5
Figure 4. Florida East Coast Fishery: Sum of Value of Landings by County andSpecies Group for 5 Years between 1998 – 2002 .......................................... 5
Figure 5. Florida East Coast Fishery: Fin Fish Species with Total Landings ValuesExceeding $1 Million for 1998 – 2002 ......................................................... 6
Figure 6. Florida East Coast Fishery: Top 10 Invertebrate Species for Sum ofLandings Values, 1998 – 2002 ..................................................................... 6
Figure 7. Florida East Coast Fishery: Landing Values of Shrimp, 1998 – 2002 ........... 7
Figure 8. Florida East Coast Fishery: Sum of Landings and Values by Gear Class,for 5 Years between 1998 – 2002 ................................................................. 7
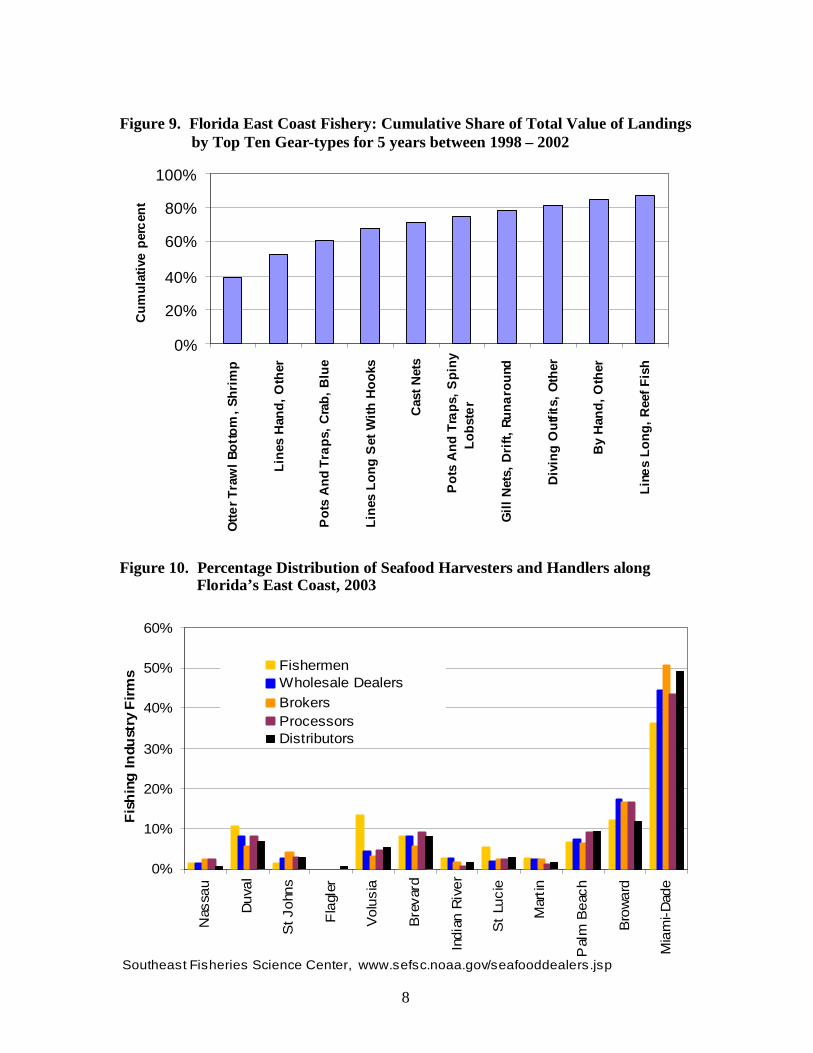
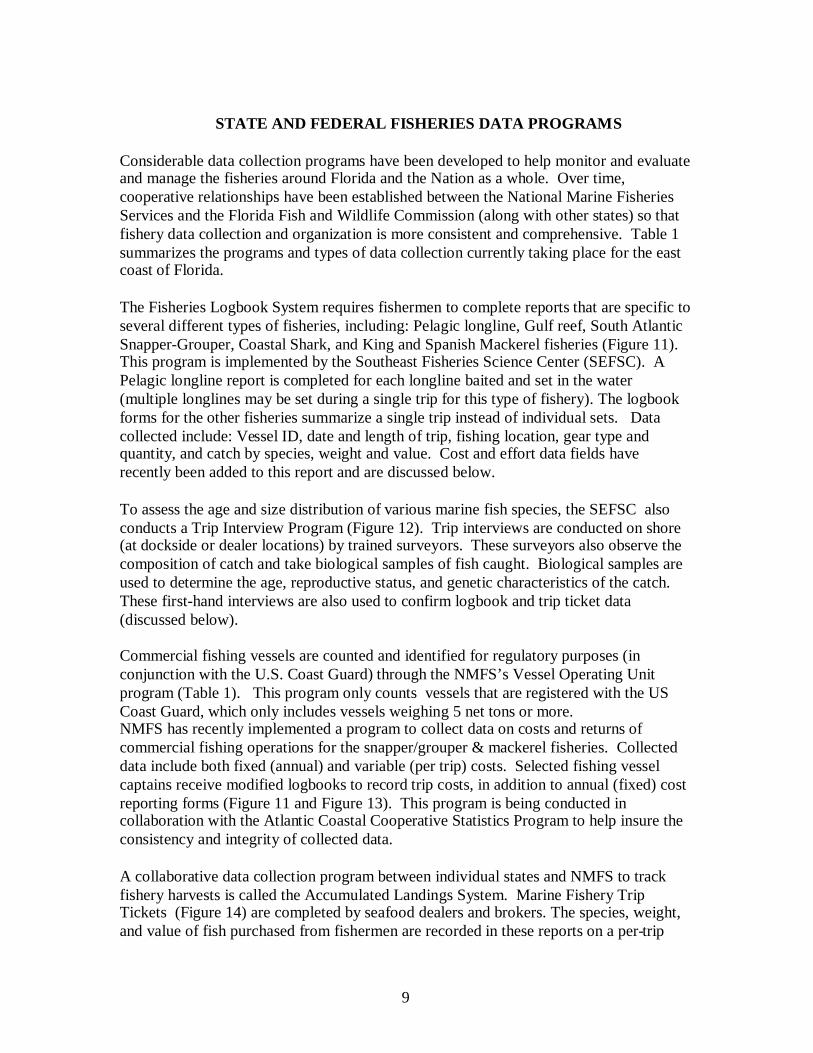
Figure 9. Florida East Coast Fishery: Cumulative Share of Total Value of Top 10Landings by Gear-type for 5 Years between 1998 – 2002 ............................. 8
Figure 10. Percentage Distribution of Seafood Harvesters and Handlers alongFlorida’s East Coast, 2003 ......................................................................... 8
Figure 11. Logbook Trip Report Form ........................................................................ 13
Figure 12. Trip Interview Program Form, Sections 1 and 2 ......................................... 14
Figure 12 (continued). Trip Interview Program Form, Section 3 ................................. 15
Figure 13. South Atlantic Fisheries Management Council Annual ExpendituresSurvey Form ............................................................................................. 16
Figure 14. Florida Fish and Wildlife Commission Marine Fisheries Trip Ticket Form 17
Figure 15. Input-Output Logic and Fishery Product Flows .......................................... 25
Figure 16. Schematic of Mid-Atlantic (Kirkley) Impact Model ................................... 31
Figure 17. Schematic of New England Fisheries (Steinback-Thunberg) Impact Model 31
1
IMPLAN BASED IMPACT MODELINGFOR COMMERCIAL FISHERIES ON FLORIDA’S EAST COAST:
ALTERNATIVE APPROACHES AND RECOMMENDATIONS
INTRODUCTION
This paper reports the results of a study to evaluate alternative approaches to developingan input-output modeling capability that will allow the National Marine Fisheries Serviceto complete economic impact studies associated with specific fishery regulatorychanges.1 The study is based on the potential use of the IMPLAN (IMpact Analysis forPLANing) Professional ® software modeling package and associated databases.2 Specificobjectives include:
a.describing IMPLAN Professional (IMPLAN) software and databases with regardto existing fishery related sectors,
b. evaluating existing IMPLAN sectors in the context of commercial fishing onFlorida’s east coast (primarily value of landings by species and county, types offishing gear employed, and the nature of production expenditures, relationshipsbetween commercial fishing and the retail, wholesale, and processing sectors,and the size and type of fishing by sub-region of the state),
c.recommending adjustments to standard IMPLAN models with respect to thenumber and nature of fishing sectors and the need for state and/or sub-statemodels, data requirements to support adjustments, and an evaluation of existingdata, and providing recommendations with regard to accomplishing therecommended approach.
Following sections provide a descriptive overview of the fishery along Florida’s eastcoast followed by an overview of the IMPLAN regional modeling system and specificapplications to estimating fishery impacts. A final section presents conclusions andrecommendations.
THE FLORIDA EAST COAST FISHERY: AN OVERVIEW
To develop guidelines for modifying standard IMPLAN models to more accuratelyestimate economic impacts of changes in Florida’s east-coast commercial fishingindustry, it is important to review the industry, how fishing technology varies amongdifferent segments, and how the industry is geographically distributed within the State.Industry sectors may be defined based on species harvested and/or type of fishing gearused. Further, any analysis and definition of sectors may treat the entire east coast as one
1 Work on the project was funded by a grant from the National Marine Fisheries Services, University ofFlorida Project 03060952.2 MIG, Inc., IMPLAN Professional 2.0: User’s Guide, Version 2.0. (http://www.implan.com).

2
economic area or focus on sub-regions along the coast. In either case the specification ofsectors and/or regions should reflect the nature of the fishing industry and the realities ofdefining those sectors within the context of functional economic regions.
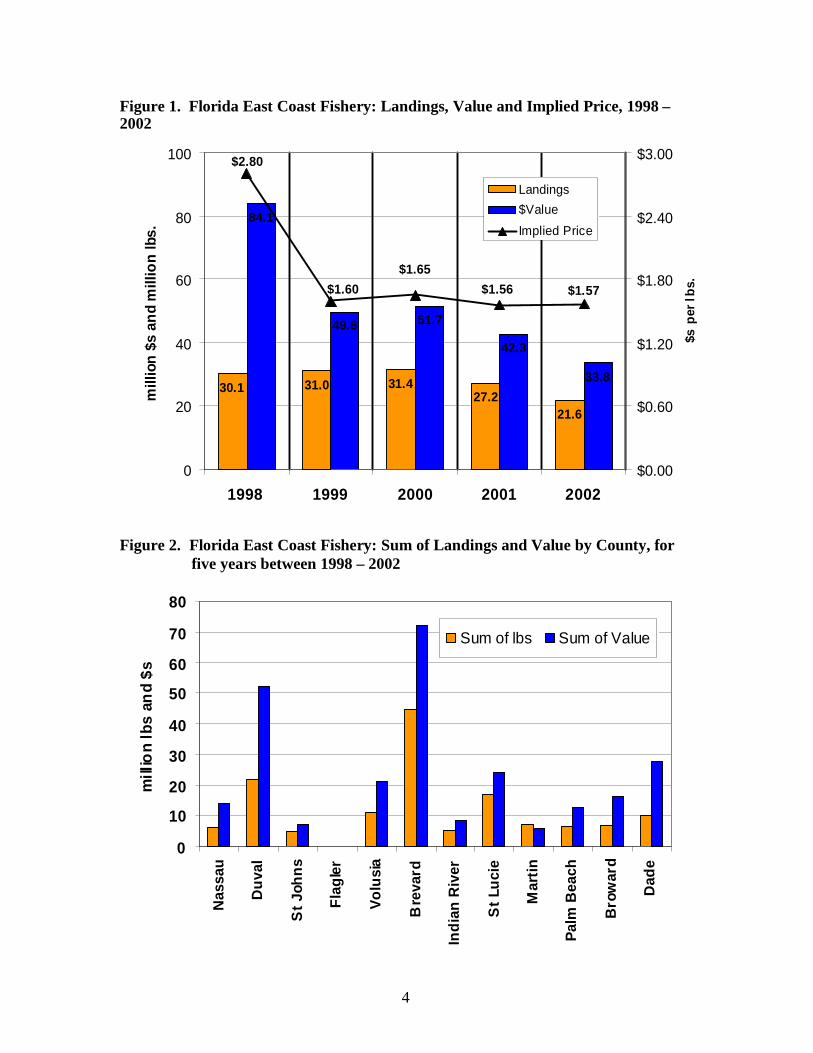
Saltwater commercial landings along Florida’s east coast have declined since 1984, whenthey peaked at 89.2 million pounds. Landings for 2002 came in at a historical low of21.6 million pounds (Figure 1). The value of these 2002 landings in nominal terms wasalso the lowest since 1979. The average ex-vessel price for east-coast landings has beenrelatively stable since 1999, fluctuating by only 3 to 5 cents above or below $1.60 perpound on an annual average basis.3
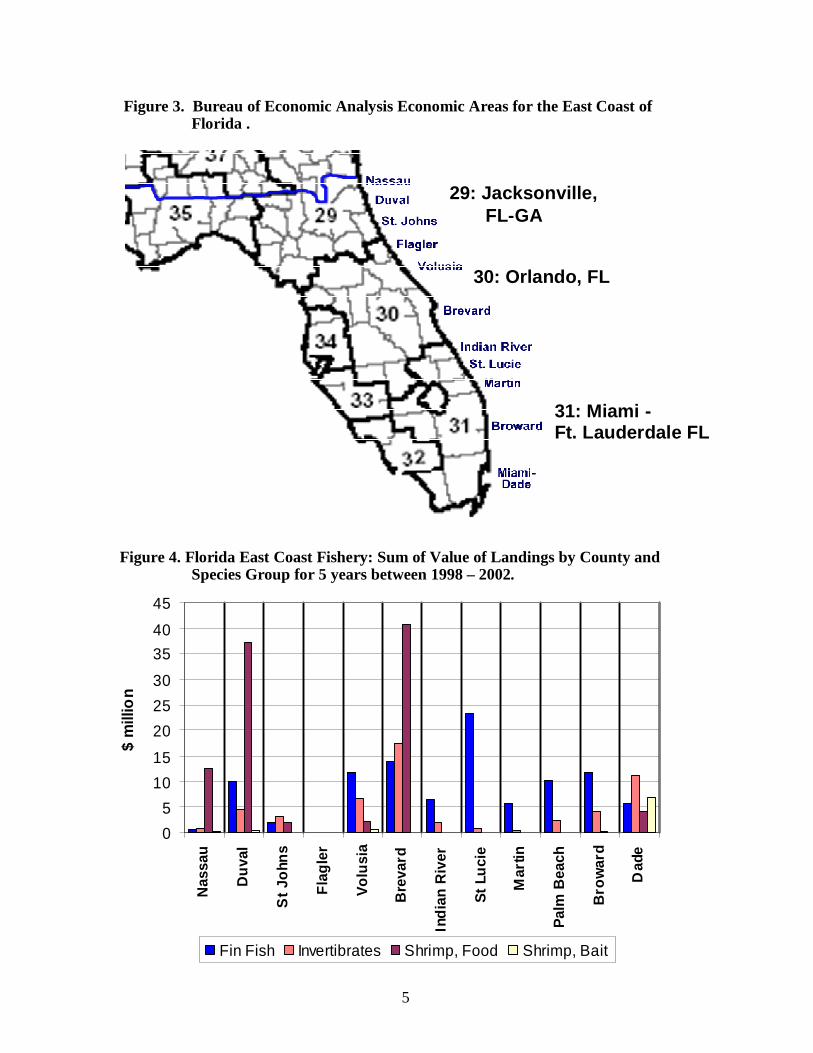
Geographically, there is considerable variation in the volume and value of landings alongFlorida’s east coast (Figure 2). For the five years from 1998 to 2002, the total value oflandings ranged from a high of $71.2 million for Brevard County, to a low of $93.1thousand for Flagler County. The order of Counties along the horizontal axis in Figure 2is from north to south along Florida’s east coast, with Nassau County being the northern-most and Miami-Dade being southern-most. Three sub-regions of fishing activity aresuggested by this graphic, with Flagler county being a dividing point between northernand central sub-regions, and central and southern sub-regions being divided at the borderbetween St. Lucie and Martin counties. These three regions would then consist of North:Nassau, Duval and St. Johns; Central: Flagler, Volusia, Brevard, Indian River, St. Lucie;and South: Martin, Palm Beach, Broward and Miami-Dade. For later reference, thesethree regions correspond to Department of Commerce, Bureau of Economic Analysis(BEA) “Economic Areas”. A map showing these areas is provided in Figure 3.
There is also geographic variation of targeted species groups up and down the coast.Revenues from shrimp landings dominate the northern and central sub-regions of the eastcoast (Figure 4). Landings of invertebrate and fin-fish are greater in the central divisionof the coast between Volusia and Indian River Counties. Miami-Dade County and thesouthern end of the study area has the highest diversity of catch among the four groups ofspecies.
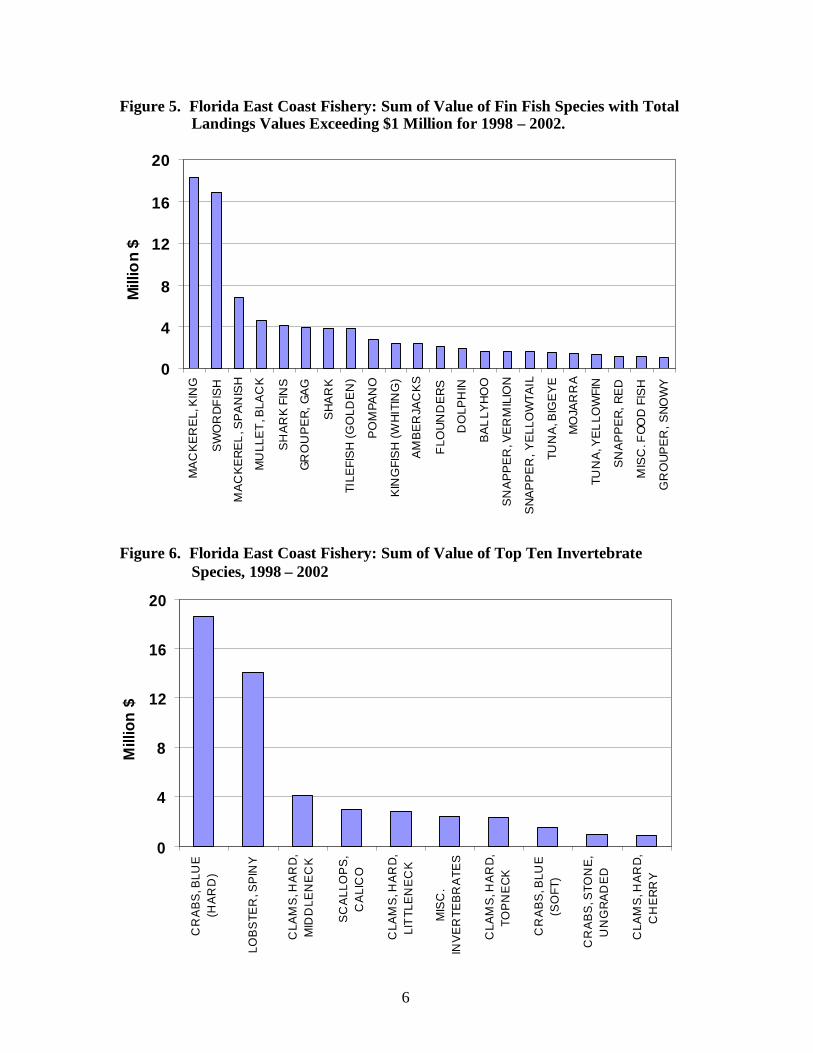
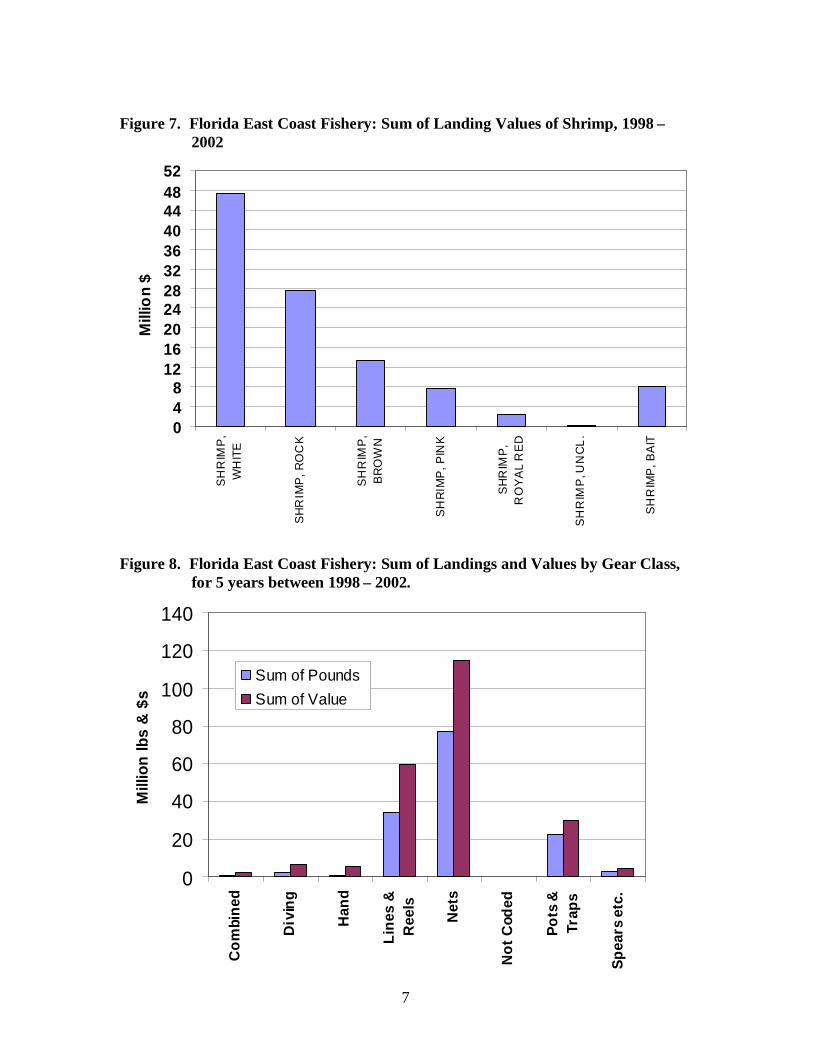
In Figure 5, the 5-year total value of different fin-fish species landings on the east coast isshown in decreasing order of magnitude. King Mackerel is the most economicallyimportant individual species for this coast, followed by Swordfish, both with landingsvalued at more than $16 million. Within the invertebrate class of marine species, the 5-year value of Blue Crab landings exceeded $18 million between 1998 and 2002, followedby Spiny Lobster and Hard Middleneck Clams (Figure 6). The 5-year value of differenttypes of shrimp are shown in Figure 7. White Shrimp is the most valuable speciesharvested on the east coast, with the value of landings between 1998 and 2002 exceeding$47 million.
3 Data on volume and ex-vessel value of commercial fish landings by species, gear type and county wereobtained from Steve Brown with the Florida Marine Research Institute, of the Florida Fish and WildlifeConservation Commission, 100 8th Avenue SE, St. Petersburg, Florida 33701 (727) 896-8626,[email protected]. Comparable data are also available on the Internet from the National MarineFisheries Service at: http://www.st.nmfs.gov/st1/commercial/index.html

3
While fishery regulation is often designed for particular species, modeling the economicimpacts of regulating the harvesting of individual species will be highly dependent on theparticular technology involved. For example, with King Mackerel, the mosteconomically important fin-fish harvested on Florida’s east coast, hand lines and trolllines are the predominate gear types used. For the next most important fin-fish species,Swordfish, long-lines with hooks are used to catch the majority of value, and shrimp arecaught primarily with bottom trawls. This is confirmed in Figures 8 and 9, wherecomparative landing values are shown for different gear classes and types for the five-year period between 1998 and 2002.
The percentage distribution of seafood harvesters and handlers across east-coast countiesis reflected in Figure 10. The regional pattern is similar to that for the value of landingsnoted earlier, but with a larger concentration of dealers, brokers, processors anddistributors in the southern most counties. The latter is likely explained by higher levelsof import-export activities due to the location of port facilities in the area and thefrequency of use by Latin American shippers.
4
Figure 1. Florida East Coast Fishery: Landings, Value and Implied Price, 1998 –2002
Figure 2. Florida East Coast Fishery: Sum of Landings and Value by County, forfive years between 1998 – 2002
30.1 31.0 31.427.2
21.6
84.1
49.6 51.7
42.3
33.8
$1.60 $1.57$1.56
$1.65
$2.80
0
20
40
60
80
100
1998 1999 2000 2001 2002
mill
ion
$san
dm
illio
nlb
s.
$0.00
$0.60
$1.20
$1.80
$2.40
$3.00
$sp
erlb
s.
Landings
$Value
Implied Price
0
10
20
30
40
50
60
70
80
Nas
sau
Du
val
St
Joh
ns
Fla
gle
r
Vo
lusi
a
Bre
vard
Ind
ian
Riv
er
St
Luci
e
Mar
tin
Pal
mB
each
Bro
war
d
Dad
e
mill
ion
lbs
and
$s
Sum of lbs Sum of Value
5
Figure 3. Bureau of Economic Analysis Economic Areas for the East Coast ofFlorida .
Figure 4. Florida East Coast Fishery: Sum of Value of Landings by County andSpecies Group for 5 years between 1998 – 2002.
0
5
10
15
20
25
30
3540
45
Nas
sau
Du
val
St
John
s
Fla
gle
r
Vo
lusi
a
Bre
vard
Ind
ian
Riv
er
St
Luci
e
Mar
tin
Pal
mB
each
Bro
war
d
Dad
e
$m
illio
n
Fin Fish Invertibrates Shrimp, Food Shrimp, Bait
29: Jacksonville,FL-GA
30: Orlando, FL
31: Miami -Ft. Lauderdale FL
6
Figure 5. Florida East Coast Fishery: Sum of Value of Fin Fish Species with TotalLandings Values Exceeding $1 Million for 1998 – 2002.
Figure 6. Florida East Coast Fishery: Sum of Value of Top Ten InvertebrateSpecies, 1998 – 2002
0
4
8
12
16
20
CR
AB
S,B
LUE
(HA
RD
)
LOB
STE
R,S
PIN
Y
CLA
MS
,HA
RD
,M
IDD
LEN
EC
K
SC
ALL
OP
S,
CA
LIC
O
CLA
MS
,HA
RD
,LI
TTL
EN
EC
K
MIS
C.
INV
ER
TEB
RA
TES
CLA
MS
,HA
RD
,TO
PN
EC
K
CR
AB
S,B
LUE
(SO
FT)
CR
AB
S,S
TON
E,
UN
GR
AD
ED
CLA
MS
,HA
RD
,C
HE
RR
Y
Mill
ion
$
0
4
8
12
16
20
MA
CK
ER
EL,
KIN
G
SW
OR
DF
ISH
MA
CK
ER
EL
,SP
AN
ISH
MU
LLE
T,B
LAC
K
SH
AR
KFI
NS
GR
OU
PE
R,G
AG
SH
AR
K
TILE
FIS
H(G
OLD
EN
)
PO
MPA
NO
KIN
GFI
SH
(WH
ITIN
G)
AM
BE
RJA
CK
S
FLO
UN
DE
RS
DO
LPH
IN
BA
LLY
HO
O
SN
AP
PE
R,V
ER
MIL
ION
SN
AP
PE
R,Y
ELL
OW
TAIL
TUN
A,B
IGE
YE
MO
JAR
RA
TUN
A,Y
EL
LOW
FIN
SN
AP
PE
R,R
ED
MIS
C.F
OO
DFI
SH
GR
OU
PE
R,S
NO
WY
Mill
ion
$
7
Figure 7. Florida East Coast Fishery: Sum of Landing Values of Shrimp, 1998 –2002
Figure 8. Florida East Coast Fishery: Sum of Landings and Values by Gear Class,for 5 years between 1998 – 2002.
0
20
40
60
80
100
120
140
Co
mbi
ned
Div
ing
Han
d
Lin
es&
Ree
ls
Net
s
No
tC
oded
Po
ts&
Trap
s
Sp
ears
etc.
Mill
ion
lbs
&$s
Sum of PoundsSum of Value
048
1216202428323640444852
SH
RIM
P,
WH
ITE
SH
RIM
P,R
OC
K
SH
RIM
P,
BR
OW
N
SH
RIM
P,P
INK
SH
RIM
P,
RO
YA
LR
ED
SH
RIM
P,U
NC
L.
SH
RIM
P,B
AIT
Mill
ion
$
8
Figure 9. Florida East Coast Fishery: Cumulative Share of Total Value of Landingsby Top Ten Gear-types for 5 years between 1998 – 2002
Figure 10. Percentage Distribution of Seafood Harvesters and Handlers alongFlorida’s East Coast, 2003
0%
20%
40%
60%
80%
100%
Ott
er
Tra
wl
Bo
tto
m,
Sh
rim
p
Lin
esH
and
,O
ther
Po
tsA
nd
Tra
ps,
Cra
b,
Blu
e
Lin
esL
on
gS
etW
ith
Ho
oks
Cas
tN
ets
Po
tsA
nd
Tra
ps,
Sp
iny
Lo
bst
er
Gil
lN
ets,
Dri
ft,
Ru
na
rou
nd
Div
ing
Ou
tfit
s,O
ther
By
Han
d,
Oth
er
Lin
es
Lo
ng
,R
eef
Fis
h
Cu
mu
lati
vep
erc
ent
0%
10%
20%
30%
40%
50%
60%
Nas
sau
Duv
al
StJ
ohns
Fla
gler
Vol
usia
Bre
vard
Indi
anR
iver
St
Luci
e
Mar
tin
Pal
mB
each
Bro
war
d
Mia
mi-D
ade
Fis
hin
gIn
dust
ryF
irm
s FishermenWholesale DealersBrokersProcessorsDistributors
Southeast Fisheries Science Center, www.sefsc.noaa.gov/seafooddealers.jsp
9
STATE AND FEDERAL FISHERIES DATA PROGRAMS
Considerable data collection programs have been developed to help monitor and evaluateand manage the fisheries around Florida and the Nation as a whole. Over time,cooperative relationships have been established between the National Marine FisheriesServices and the Florida Fish and Wildlife Commission (along with other states) so thatfishery data collection and organization is more consistent and comprehensive. Table 1summarizes the programs and types of data collection currently taking place for the eastcoast of Florida.
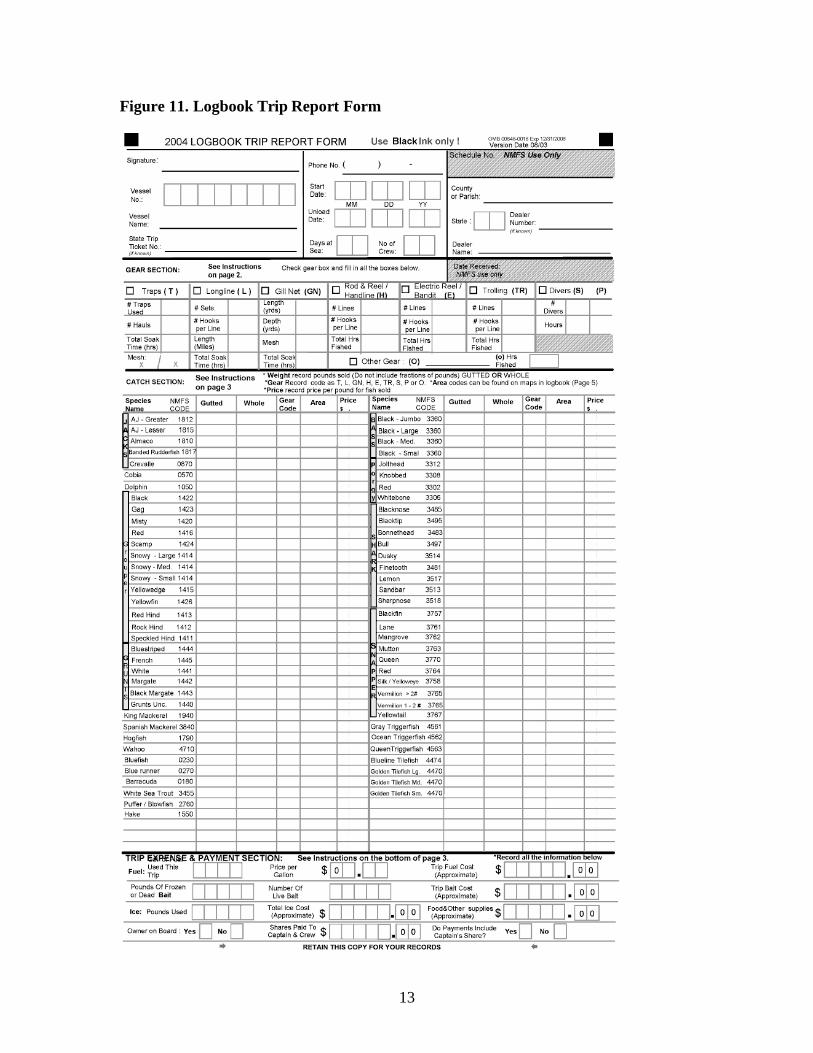
The Fisheries Logbook System requires fishermen to complete reports that are specific toseveral different types of fisheries, including: Pelagic longline, Gulf reef, South AtlanticSnapper-Grouper, Coastal Shark, and King and Spanish Mackerel fisheries (Figure 11).This program is implemented by the Southeast Fisheries Science Center (SEFSC). APelagic longline report is completed for each longline baited and set in the water(multiple longlines may be set during a single trip for this type of fishery). The logbookforms for the other fisheries summarize a single trip instead of individual sets. Datacollected include: Vessel ID, date and length of trip, fishing location, gear type andquantity, and catch by species, weight and value. Cost and effort data fields haverecently been added to this report and are discussed below.
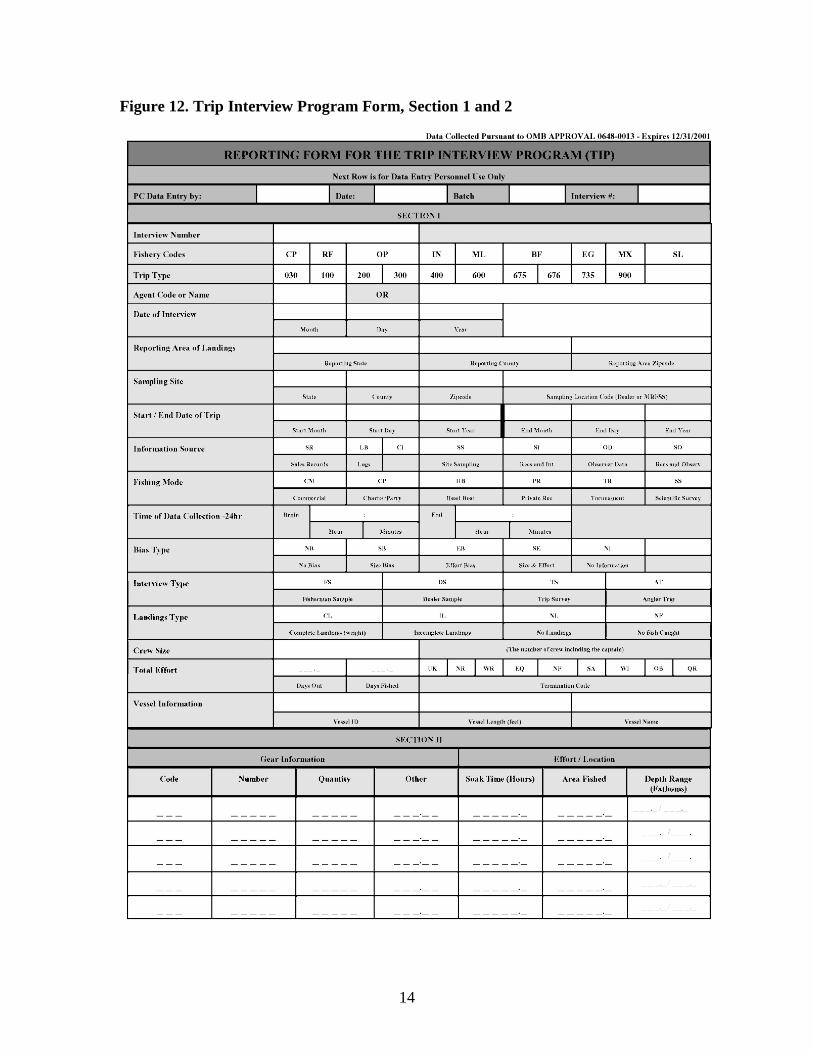
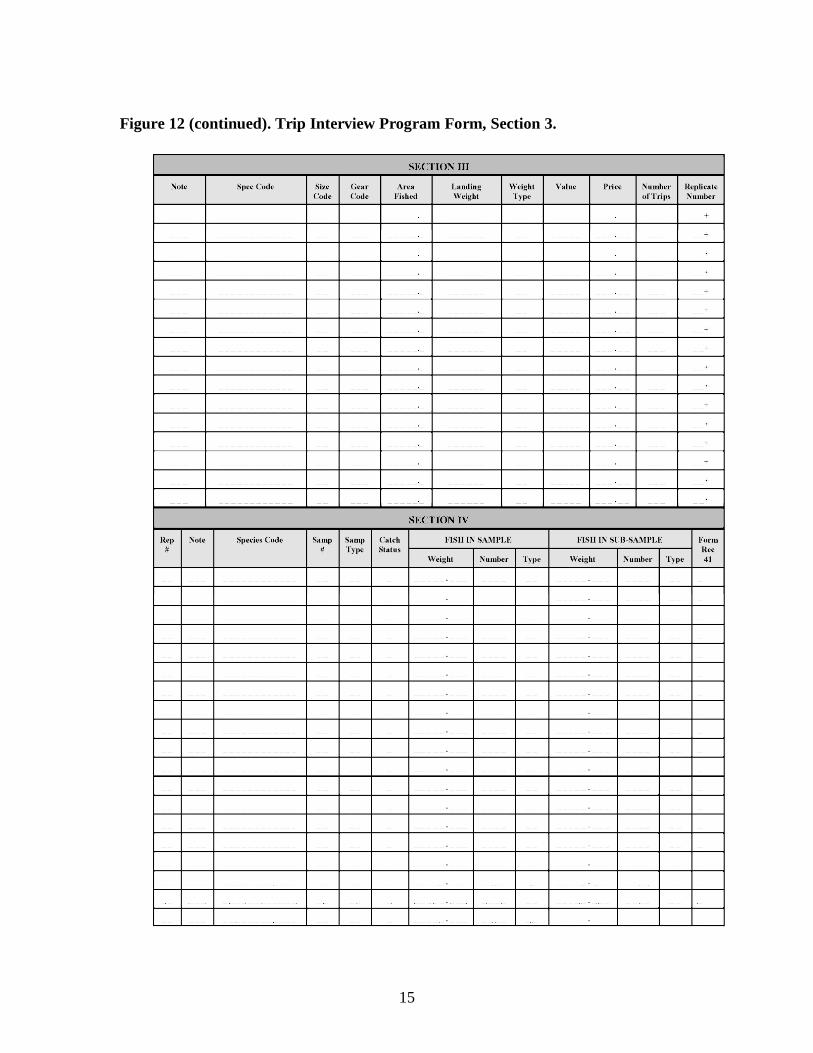
To assess the age and size distribution of various marine fish species, the SEFSC alsoconducts a Trip Interview Program (Figure 12). Trip interviews are conducted on shore(at dockside or dealer locations) by trained surveyors. These surveyors also observe thecomposition of catch and take biological samples of fish caught. Biological samples areused to determine the age, reproductive status, and genetic characteristics of the catch.These first-hand interviews are also used to confirm logbook and trip ticket data(discussed below).
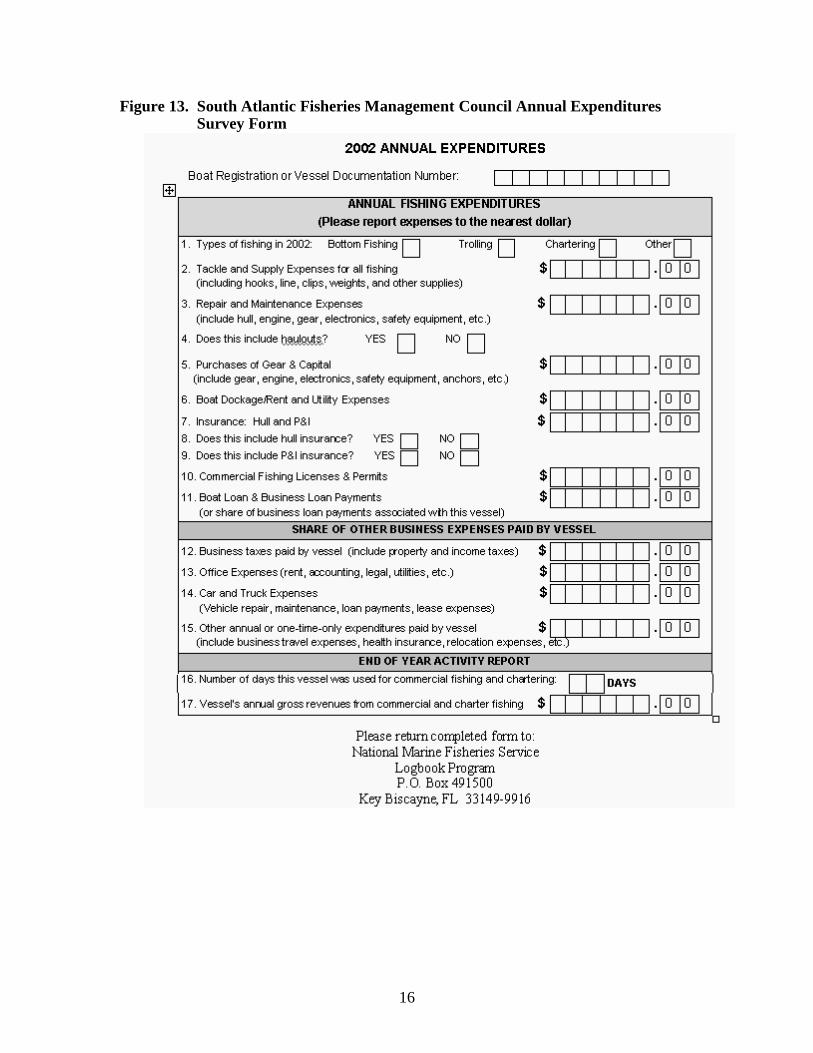
Commercial fishing vessels are counted and identified for regulatory purposes (inconjunction with the U.S. Coast Guard) through the NMFS’s Vessel Operating Unitprogram (Table 1). This program only counts vessels that are registered with the USCoast Guard, which only includes vessels weighing 5 net tons or more.NMFS has recently implemented a program to collect data on costs and returns ofcommercial fishing operations for the snapper/grouper & mackerel fisheries. Collecteddata include both fixed (annual) and variable (per trip) costs. Selected fishing vesselcaptains receive modified logbooks to record trip costs, in addition to annual (fixed) costreporting forms (Figure 11 and Figure 13). This program is being conducted incollaboration with the Atlantic Coastal Cooperative Statistics Program to help insure theconsistency and integrity of collected data.
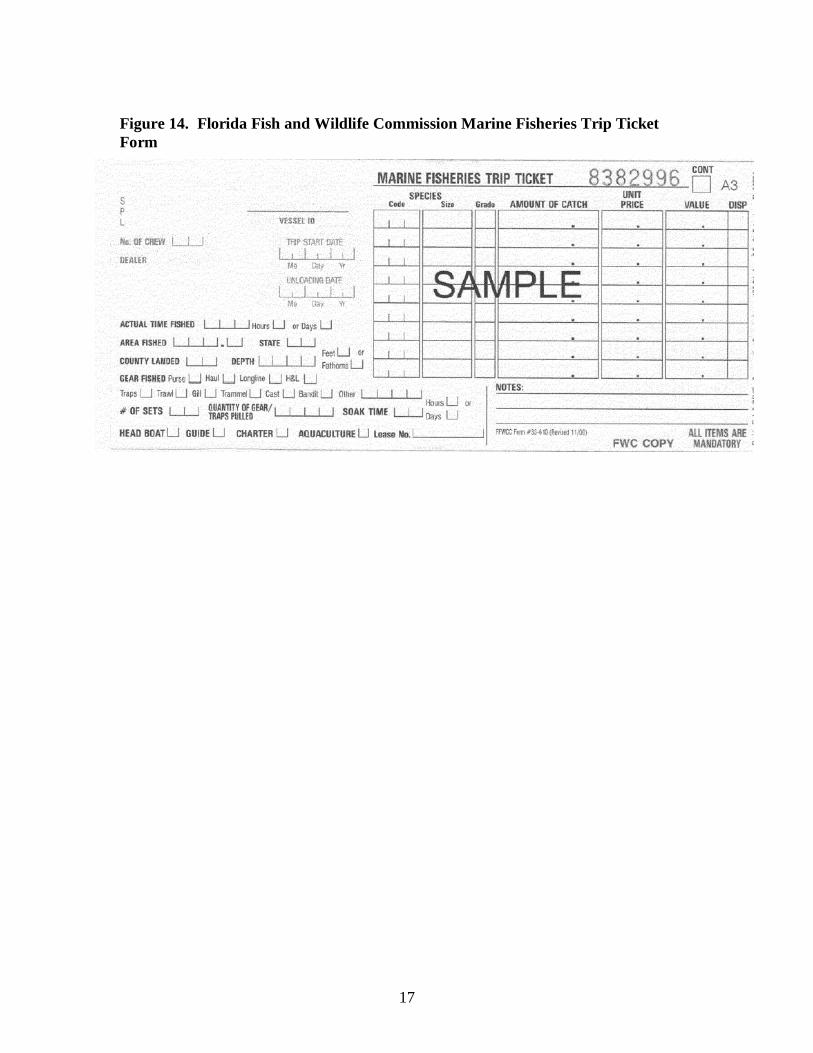
A collaborative data collection program between individual states and NMFS to trackfishery harvests is called the Accumulated Landings System. Marine Fishery TripTickets (Figure 14) are completed by seafood dealers and brokers. The species, weight,and value of fish purchased from fishermen are recorded in these reports on a per-trip
10
basis. The length of time, area and depth fished, as well as gear-types used and type offishing operation are also noted in these reports. These data are often reviewed by localNMFS port agents to reflect more accurate “ground truthed” data. Thus, the landings foran individual state as reported via local Trip Tickets may not match the adjustedAccumulated Landings System data.
The Atlantic States Marine Fishery Commission is currently developing a comprehensivedata collection system, known as the Atlantic Coastal Cooperative Statistics Program.Part of this program will focus on market and vessel-level cost data. These data willallow for more effective state and federal management efforts.
As previously mentioned, the Florida Fish and Wildlife Commission (FWC) isresponsible for conducting the Trip Ticket program (Figure 14). Although these datadetail the landings for individual trips by fishermen, the State carefully maintains theconfidentiality of these data by only releasing summaries of fishery landings by month,species, and location. These data allow the FWC and the NMFS to monitor fisheryharvest and adjust regulations as needed to maintain healthy marine populations.
The SEFSC also maintains extensive lists of U.S. seafood dealers, brokers, processors,distributors and fishermen. These lists are made available to the public through theirwebsite at http://www.sefsc.noaa.gov/seafooddealers.jsp. All names and associated data areobtained from public sources or voluntarily provided to the agency. Data includebusiness and contact names, address, phone number, email address, product types andspecies handled, also the types of processing carried out are listed.
Cost and Effort Data Requirements.Data on the costs of production (harvesting), processing and distribution of goods
or services are necessary to accurately conduct economic impact analyses. The cost ofharvesting a specific marine species is determined to a substantial degree by thetechnology (types of vessels and fishing gear ) used for this purpose. An analysis of thevalue of fishery landings by gear-type for the east-coast of Florida indicates that thefollowing seven gear types are used in harvesting nearly 90 percent of the value of theselandings: bottom otter trawl, hand lines, pots and traps, long lines, cast nets, drift orrunaround gill nets, and diving (Figure 9). The cost and effort data that have beencollected and published for 2002 do not include observations for trawls, or pots and traps.This is probably because the 2002 collection effort was focused on the snapper/grouper &mackerel fisheries and not crustaceans or shell fish.
To date, very little data has been discovered that specifically describe the technology andcosts of processing and distributing seafood within the state of Florida. As withharvesting, this type of data could be used to improve the accuracy of estimatedeconomic impacts from changing fishery regulations as they relate to the value-addingsectors of the seafood market channel. Also, if it is going to be important to estimateimpacts of regulatory changes for particular sub-regions or communities within the State,then information on the flows of seafood related products and services between these

11
areas within the State will be needed. As is the case for harvesting, the standardIMPLAN model has only one sector for seafood processing. There is no specificallydesignated IMPLAN sector to represent seafood dealing, importing, exporting, ordistribution.
12
Table 1. Data and Information Sources Relevant to Fisheries Data and Socio-economic studies of the Fishery Industry.
Agency Title of Data Location/Contact/Completed by Type of DataNational Marine FisheriesService (NMFS),Fisheries Statistics &Economics Division, &Southeast FisheriesScience
Fisheries Logbook System(FLS) Written report forms completed by fishermen
http://www.sefsc.noaa.gov/http://www.sefsc.noaa.gov/fls.jsp
Catch & effort data by species, per tripor set. Includes species caught, by-catch, area of catch, type & quantity ofgear, departure & return dates, landing& dealer location, fishing time & manhours.
Center (SEFSC)
Trip Interview Program (TIP) Collected at landing site or dealer location by portagents on South Atlantic & Gulf of Mexico coasts.http://www.sefsc.noaa.gov/tip.jsp
Size, weight & age data of catch byspecies determined through biologicalsamples & personal interviews withfishermen. Catch & effort data collectedinclude type & quantity of gear, crewsize, & days fishing & trip length
Vessel Operating Units (VOU) Based on U.S. Coast Guard vessel data basehttp://www.sefsc.noaa.gov/vou.jsp
Characteristics and ownership data forcommercial fishing vessels greater thanfive net tons
Social & Economic Aspects ofFishery Management,Cost & Earnings Data
Collection Program for SouthAtlantic Fisheries
Written report forms completed by fishermen(initially only snapper/grouper & mackerelfisheries)http://www.safmc.nethttp://www.safmc.net/socio/fmpro?-db=content&-format=default.html&-view
Voluntary random sampling for annualfixed costs & trip costs, includingvariable costs for a commercial fishingvessel's most recent trip, alsosociological information through annualsurveys of owner/captain/crew.
Accumulated Landings System(ALS)
Reported by dealers/brokers to the Florida Fish &Wildlife Comm., usually on written Trip Ticketforms. See FMRI belowhttp://www.st.nmfs.gov/st1/commercial/http://199.242.233.242/sefsc/commercialprograms.jsp.htm
Quantity & value of domesticcommercial seafood landings byspecies, gear-type, area, year/month assold to dealers or brokers. NMFS coopswith SE states to collect & process data.Maintained by SEFSC
Seafood Dealer Lists Lists of firms in seafood industry (National)http://www.sefsc.noaa.gov/seafooddealers.jsp
Business & contact name, address,phone, email, product types and specieshandled, types of processing carried out.
Florida Fish & WildlifeCommission, MarineResearch Institute
Marine Fisheries Trip Ticketsystem
Reported by dealers or brokers to the FloridaWildlife Commission, & is then transmitted to theNMFS Accumulated Landings System.http://www.floridamarine.orghttp://www.floridamarine.org/features/view_article.asp?id=19224
Includes ID of harvester, purchasingdealer, date of the transaction, countylanded, time fished, & pounds of eachspecies landed. Used to generate Status& Trends Reports & support NMFSALS.
13
Figure 11. Logbook Trip Report Form
14
Figure 12. Trip Interview Program Form, Section 1 and 2
15
Figure 12 (continued). Trip Interview Program Form, Section 3.
16
Figure 13. South Atlantic Fisheries Management Council Annual ExpendituresSurvey Form
17
Figure 14. Florida Fish and Wildlife Commission Marine Fisheries Trip TicketForm
18
THE IMPLAN REGIONAL MODELING SYSTEM
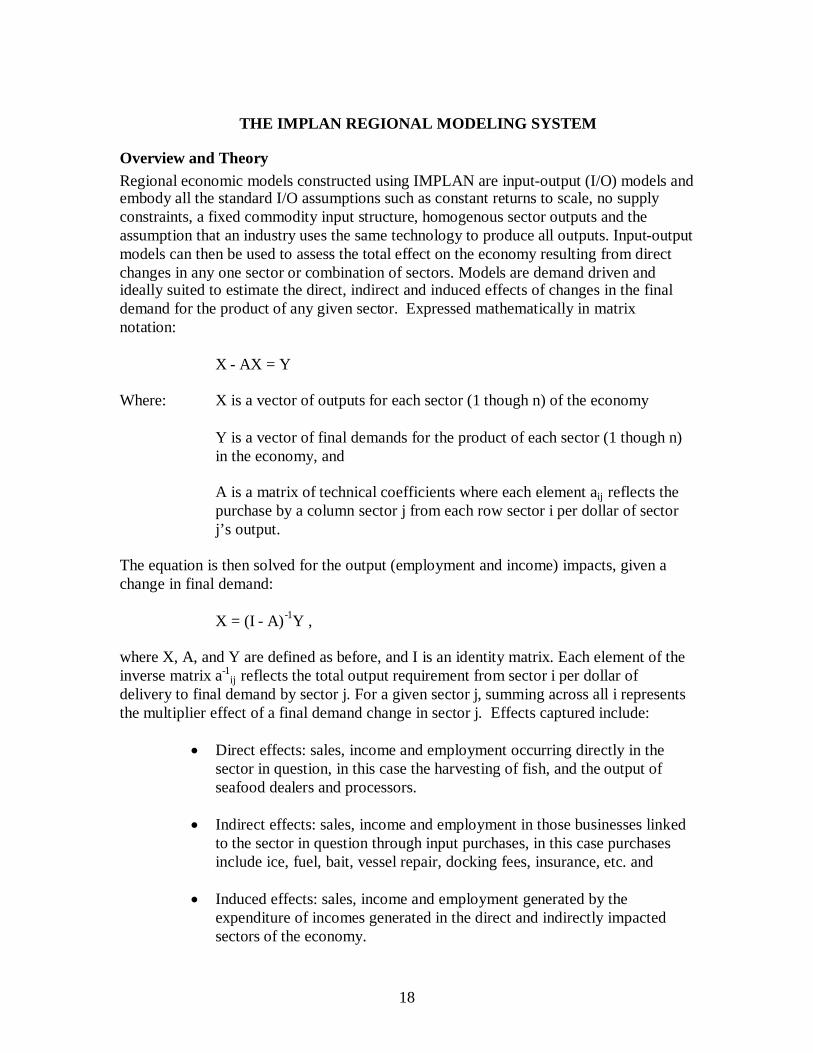
Overview and TheoryRegional economic models constructed using IMPLAN are input-output (I/O) models andembody all the standard I/O assumptions such as constant returns to scale, no supplyconstraints, a fixed commodity input structure, homogenous sector outputs and theassumption that an industry uses the same technology to produce all outputs. Input-outputmodels can then be used to assess the total effect on the economy resulting from directchanges in any one sector or combination of sectors. Models are demand driven andideally suited to estimate the direct, indirect and induced effects of changes in the finaldemand for the product of any given sector. Expressed mathematically in matrixnotation:
X - AX = Y
Where: X is a vector of outputs for each sector (1 though n) of the economy
Y is a vector of final demands for the product of each sector (1 though n)in the economy, and
A is a matrix of technical coefficients where each element aij reflects thepurchase by a column sector j from each row sector i per dollar of sectorj’s output.
The equation is then solved for the output (employment and income) impacts, given achange in final demand:
X = (I - A)-1Y ,
where X, A, and Y are defined as before, and I is an identity matrix. Each element of theinverse matrix a-1
ij reflects the total output requirement from sector i per dollar ofdelivery to final demand by sector j. For a given sector j, summing across all i representsthe multiplier effect of a final demand change in sector j. Effects captured include:
Direct effects: sales, income and employment occurring directly in thesector in question, in this case the harvesting of fish, and the output ofseafood dealers and processors.
Indirect effects: sales, income and employment in those businesses linkedto the sector in question through input purchases, in this case purchasesinclude ice, fuel, bait, vessel repair, docking fees, insurance, etc. and
Induced effects: sales, income and employment generated by theexpenditure of incomes generated in the direct and indirectly impactedsectors of the economy.
19
Input-output models provide an estimate of impacts within one production period, usuallyone year, based on the effects of expenditure changes. They are not benefit-costevaluations of particular activities nor do they provide a discounted sum of impacts overfuture production periods.4 Impact estimates are based on the expenditures associatedwith a production activity within a single time period, usually one year.
IMPLAN Professional® (IMPLAN) is a commercially available software package andrelated databases available through MIG, Inc. (see earlier citation) that allows users toquickly develop regional input-output models for any county or group of contiguouscounties or states within the United States. The software runs on IBM-compatiblepersonal computers within Windows® 95, 98, NT, 2000 or XP operating systems. Modeldevelopment using IMPLAN requires the purchase of the IMPLAN software ($450) andthe regional data set ($1450 for all counties in Florida). MIG, Inc. also provides trainingat an additional cost. Updated data sets are available for purchase each year. There is anadditional cost for a license to use the data set on more than one computer (the IMPLANwebsite has information on prices).
Industry Sectors and Regional Trade FlowsIMPLAN begins with national I/O matrices based on benchmark studies of the nationaleconomy conducted by the Bureau of Economic Analysis of the U. S. Department ofCommerce. National I/O tables reflect the use of commodities to produce each industry’soutput (the use table), the production of commodities by industry sector (the make table),and details on value added and final demands by industry. A coefficient version of theuse table (the absorption table) is a set of linear production functions for each industrysector of the national economy. Data are also available on output, employment and valueadded for each industry sector at the national level. For IMPLAN purposes, economicactivities are grouped into 509 different industry sectors following the North AmericanIndustry Classification System (NAICS). The IMPLAN data set includes “bridge” tablesto allow users to determine which activities are included in a given sector.
To allow the construction of regional models, the IMPLAN database contains statisticson output, employment, and value-added for each of 509 industry sectors in each countyof the United States. Regional models may then be estimated for any region consisting ofa county or group of contiguous counties within the nation. Although regional IMPLANmodels are tailored to the particular distribution of industrial capacities of a given region,the production technology (the proportional use of commodity inputs to produce one unitof output) and the proportional distribution of industry outputs between intermediateindustry sales and final demands embodied in these models are the same as thosereflected in the national I/O tables. The assumption in the construction of regionalmodels is that a given regional industry uses the same production technology to produce aunit of output as that industry does (on average) for the whole nation. Mathematically,this means that the production coefficients for the regional industry are the same as thenational average for that industry. Regional coefficients may be smaller, however,depending on the mix of industries present in the region in comparison to the nation as a
4 Information provided in the overview section is taken from the earlier cited IMPLAN User’s Guide.
20
whole. Regional production coefficients reflect both the prevailing technology (from thenational data) and whether or not industry inputs are purchased from within the region.
If a particular supplying industry does not exist within the region (employment is zero),then all coefficients reflecting input requirements supplied by that (missing) industry areset to zero, and regional models show those purchases as required imports. For othersupplying industries within the region, some downward adjustment may be requiredbased on available supplies relative to total intermediate and final demands for thatoutput. IMPLAN procedures then estimate regional trade flows (imports and exports toand from the region) for each industry sector as part of the process of estimating regionalproduction coefficients. This step is crucial since the size of resulting regional multipliersdepends on the proportion of input requirements purchased within the region.
IMPLAN offers the regional analyst three options for estimating trade flows (regionalpurchase coefficients in IMPLAN terminology) within regional models. The “supply-demand pooling” approach maximizes local purchases and the magnitude of the resultingmultiplier by requiring that, to the extent possible, local needs be satisfied by localproduction. All local demands for the output of a particular industry (either asintermediate products or final demands) must be satisfied before any of that industry’soutput is exported from the region. Where an industry’s output is insufficient to satisfylocal needs, all regional purchases from that industry are scaled downward proportionallyand the balance is reflected as imports. This approach eliminates cross-hauling (regionalimports and exports of the same good). In IMPLAN terminology, the regional purchasecoefficient for a particular sector is set to 1.0 when regional production meets or exceedsregional requirements, and any excess production is shown as regional exports. Whenregional production is less than regional requirements, the regional purchase coefficient isless than 1.0 and represents the percentage of requirements supplied locally withremaining requirements supplied by regional imports.
A second option within IMPLAN for estimating trade flows is a “location-quotient”based approach. Here the extent to which a region specializes in a particular industryrelative to the nation is assessed by calculating industry location quotients, the ratio of thepercentage of regional employment in a given industry to the same percentage for thenational economy. If the location quotient is greater than 1.0, the region is morespecialized in production of that industry than is the nation as a whole, and the regionalpurchase coefficient is set equal to 1.0 (all needs are met with local production). Forlocation quotients less than 1.0, regional purchase coefficients are set equal to thelocation quotient (less than 100 percent of local needs is supplied locally). In either caselocal purchases from a particular industry cannot exceed the output of that industry.Compared to the supply-demand pooling approach, the use of location quotients allowsfor some cross-hauling to occur and multipliers are generally lower.
The third option, and the one set as the default in IMPLAN when no choice is made,would use regional purchase coefficients estimated by a set of econometric equationswithin IMPLAN, with arguments in the estimating equations being some set of regionalcharacteristics. As with the previous case, regional purchases from any given industry are
21
constrained to equal regional output of that industry. That is, the regional purchasecoefficient can never be larger than the one resulting from the supply-demand poolingoption.
The final result of the estimating process contained within IMPLAN is a regional input-output model constructed by adjusting national production coefficients to reflect regionaldifferences in production capacity (industry mix). While the underlying productiontechnology remains the same as the national model, the adjustments in the coefficientsreflect the degree to which inter-industry product flows are satisfied from within theregion, or through imports or exports. These adjusted coefficients determine themagnitude of the estimated regional I/O multipliers. IMPLAN regional models calculatestandard I/O Type I multipliers (direct and indirect effects), Type II multipliers (direct,indirect and induced effects), or Type SAM (social accounts matrix) multipliers thatcapture the effects of institutional transfers within the regional economy. Again, it isimportant to stress that regional models are based on all the standard I/O assumptionsnoted earlier, as well as the additional assumptions regarding the uniformity oftechnology between the region and the nation, and those assumptions associated with thechoice of procedures for estimating regional trade flows.
Defining Study RegionsPrevious sections provided a general discussion of estimating regional input-outputmodels using IMPLAN without explicitly noting the critical step of defining the regionfor which impacts are to be estimated. As noted, IMPLAN allows regions to consist ofgeographic areas as small as counties and as large as multi-county or multi-state regions.
To some extent the definition of a region for a particular study depends on the nature ofthe impact question and the specific need for information. Such needs, however, mustrecognize that multipliers and resulting impact estimates are dependent on the size(economic and geographic) of the region. Ideally, the region suggested by the IMPLANUser’s Guide and by regional theory should be one where most of the impacts associatedwith the purchasing activity of firms takes place within the region (a “functional”economic region) of interest. For example, in its treatment of the household sector(employment), IMPLAN assumes that employment is local. If in fact the region definedis too small and a large number of workers commute from outside the area, models willover estimate employment impacts. At the other extreme, if the region defined is toolarge, resulting estimates may not be meaningful for a particular location or politicaljurisdiction.
With respect to the particular application addressed in this report, the question of regionaldefinition is equally important. A state model (Florida) would provide impacts specificonly to the state of Florida with little meaning for any particular county (or community)in the state. On the other hand, individual models for each of the twelve counties alongFlorida’s east coast would likely be unrealistic from the standpoint of the fishing industryand from the standpoint of providing models for functional regions. As noted in theearlier discussion of fishing activity along Florida’s east coast, activity seems to fallwithin three regions (Figures 2), which corresponds to functional economic regions
22
defined by the Bureau of Economic Analysis, U. S. Department of Commerce (Figure 3).It may also be possible to accomplish an acceptable level of sub-regional specificity inimpact estimates by working with a state level model and then assigning a proportionalallocation of indirect and induced impacts to the functional regions noted here.
Adjustments to IMPLANOnce regional models are constructed, the IMPLAN software allows users considerablelatitude in making adjustments where additional or more accurate data is available forparticular regional industries. Users are able to view and edit the regional data set onwhich IMPLAN bases its calculations (industry output, employment and value added)and incorporate new data into the final model.
Likewise, IMPLAN users can view and edit regional household and institutional demandsfor commodities. There are nine household sectors within IMPLAN (based on incomelevels), federal defense and non-defense sectors, state/local government education andnon-education sector, and an investment sector. Users may also adjust the amount ofsales by a sector going to foreign exports, adjust the margins used for the wholesale andretail trade sectors, and margins for the transportation sectors as well, where those areappropriate to the sector of interest.
Finally, and perhaps most importantly for modeling impacts in the fisheries sector,IMPLAN allows users to edit regional production functions for particular industrieswhere sufficient data is available to estimate new coefficients. Similarly, users have theflexibility of adding new sectors, or more precisely, disaggregating existing sectors toprovide more precise specifications of regional industries. More detail on the reasoningwill be offered later, but for the fisheries sector adjustments to the regional productionfunction will likely be necessary due to wide variations in the nature of the industry byregion. Due to these variations, regional production coefficients based on adjustednational averages will not closely reflect those of the fishing industry within any region.
With reference to adjusting IMPLAN, however, it is important to note that IMPLAN datasets contain much of the data that is readily available from secondary sources. IMPLANallows the incorporation of additional data for specific sectors, but in many cases, thecollection of primary data will be necessary to support major adjustments to standardIMPLAN models. For example, from the earlier discussion of fisheries along Florida’seast coast, an adjusted IMPLAN model would require data on cost of production to allowthe specification of the production function for each defined harvesting sector andinformation detailing the product flow between those sectors and defined dealer and/orprocessing sectors. Expanding the study to include sub-regions would require a similardata collection effort for each sub-region as well as information on the interaction amongsectors across regions. All such efforts would likely require primary data collectionefforts.
23
IMPLAN Fishery SectorsThe current version of IMPLAN captures fishing related activity in two economicsectors, one for fishing and an additional sector for processing activities. The two sectorsare defined as follows:5
IMPLAN Sector 16 Fishing (NAICS 1141): This industry comprisesestablishments primarily engaged in the commercial catching or taking of finfish,shellfish, or miscellaneous marine products from a natural habitat, such as thecatching of bluefish, eels, salmon, tuna, clams, lobsters, mussels, oysters, shrimp,frogs, sea urchins, and turtles.6
IMPLAN Sector 71 Seafood Product Preparation and Packaging (NAICS3117): This industry comprises establishments primarily engaged in one or moreof the following: (1) canning seafood (including soup); (2) smoking, salting, anddrying seafood; (3) eviscerating fresh fish by removing heads, fins, scales, bones,and entrails; (4) shucking and packing fresh shellfish; (5) processing marine fatsand oils; and (6) freezing seafood. Establishments known as “floating factoryships” that are engaged in the gathering and processing of seafood into cannedseafood products are included in this industry.
There may however, be some seafood related activities that would not be captured in thetwo IMPLAN sectors described above. Note that industry classification is based on theprimary activity of a given establishment. To the extent that businesses exist thatprimarily provide a purchase and resale function for raw seafood products in a givenregion, those activities could be classified as a part of the Wholesale Trade sector withinIMPLAN. Again, this implies that adjusting IMPLAN models for a particular region willrequire information on the nature of the regional industry and the movement of productsbetween harvesters, dealers, processors and final consumers.
REVIEW OF MODELING APPROACHES
IMPLAN has been widely used for impact analysis around the county with issuesinvolving commercial fisheries. The section provides a brief review of those efforts as abasis for establishing alternative approaches to the question as it relates to Florida’s eastcoast and commercial fisheries. Particular attention will be devoted to work by Steinbackand Thunberg7 in developing a multi-regional impact model for commercial fishing in
5 Executive Office of the President, Office of Management and Budget, North American IndustryClassification System, United States, 1997.6 Farm raising of finfish, shellfish, or other marine animals is classified separately by NAICS and is
included in an animal production sector by IMPLAN.7 Steinback, Scott and Eric Thunberg, “An Approach for Using IMPLAN and its Associated Data Package
to Estimate the Economic Activity (“impact”) Resulting From Fishery Management Actions. NortheastFisheries Science Center. NMFS National Social Scientists Workshop, La Jolla, California, February 22-25, 2000.
24
New England and supporting work completed at Woods Hole Oceanographic Institution,8
work by James Kirkley9 in developing spreadsheet models using basic IMPLANmultipliers to capture indirect and induced impacts, and a U.S. west coast modelingapplication (F.E.A.M.)10.
This literature review is not intended to be exhaustive of fishery impact studies usingIMPLAN. Rather, the intent is to establish the nature of the modeling problem (aconceptual approach) and identify the major approaches to addressing impact estimationwithin that conceptual framework. The actual modeling applications mentioned forreview in the previous paragraph are examples of different approaches. The FEAMmodel is not treated in detail since its basic logic is similar to that of the Mid-Atlanticmodel developed by Kirkley.
Modeling Fishery Industries: A Conceptual FrameworkThe process or challenge of adapting IMPLAN type input-output models to fisheriesapplications can best be understood within a conceptual framework that outlines themodeling issues in a manner consistent with input-output logic. The framework can thenbe used to assess different approaches to modeling impacts for commercial fisheries.
Input-Output Logic and Product Flows
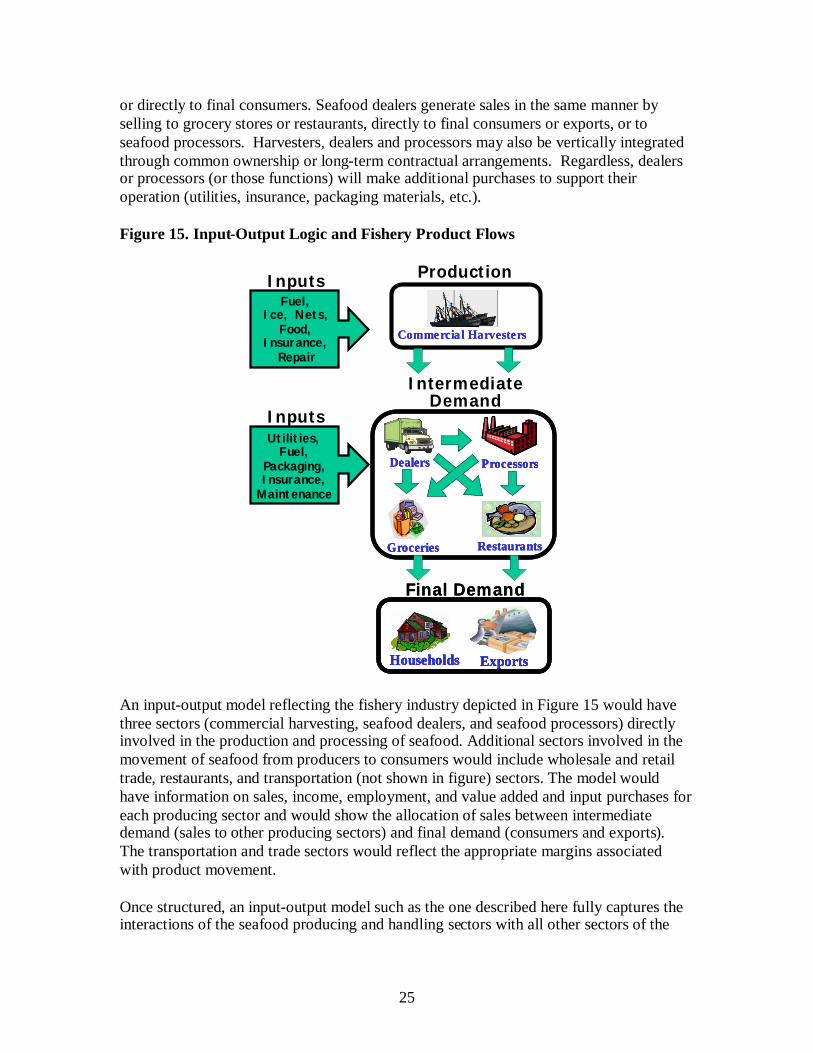
Input-output models divide the economy into economic sectors (groupings of likebusinesses) and track the movement of goods and services (linkages) between businessesand between businesses and final consumers. Thus, the first step in applying input-outputmodels to fisheries is to delineate the product flows of interest in a manner consistentwith the standard input-output framework. Figure 15 provides an overview of productflows in the context of input-output logic adapted from the earlier cited work bySteinback and Thunberg.
In Figure 15 commercial harvesters of fish and marine products generate sales,employment and income through the harvesting and marketing of fish. Harvesters, inturn, make purchases of the inputs required to conduct harvesting operations (fuel, boatrepair, nets, ice, insurance, food, etc.). Commercial harvesters sell seafood products toseafood dealers or to seafood processors (direct sales to consumers are not shown here tosimplify the diagram), and seafood dealers may resell products to processors. Seafoodprocessors generate sales, income and employment by selling processed products toconsumers through other intermediate sectors (grocery stores and restaurants) to exports
8 Woods Hole Oceanographic Institute, Marine Policy Center, “Development of an Input-Output Model forSocial Economic Impact Assessment of Fisheries Regulation in New England.” MARFIN Project FinalReport to National Marine Fisheries Service Grant Number NA87FF0548, March 2000.
9 Kirkley, James E., “Assessing the Economic Importance of Commercial Fisheries in the Mid-AtlanticRegion: A User’s Guide to the Mid-Atlantic Input/Output Model.” School of Marine Science, College ofWilliam and Mary. Report prepared for the Northeast Science Center, NOAA Fisheries, National MarineFisheries Service, Woods Hole, Ma.
10 Jensen, William S., “Notes on Using the FEAM Economic Impact Model: A Practitioner’s Approach,”Prepared for Steve Frese, Economist, National Marine Fisheries Service, May 1998.
25
or directly to final consumers. Seafood dealers generate sales in the same manner byselling to grocery stores or restaurants, directly to final consumers or exports, or toseafood processors. Harvesters, dealers and processors may also be vertically integratedthrough common ownership or long-term contractual arrangements. Regardless, dealersor processors (or those functions) will make additional purchases to support theiroperation (utilities, insurance, packaging materials, etc.).
Figure 15. Input-Output Logic and Fishery Product Flows
An input-output model reflecting the fishery industry depicted in Figure 15 would havethree sectors (commercial harvesting, seafood dealers, and seafood processors) directlyinvolved in the production and processing of seafood. Additional sectors involved in themovement of seafood from producers to consumers would include wholesale and retailtrade, restaurants, and transportation (not shown in figure) sectors. The model wouldhave information on sales, income, employment, and value added and input purchases foreach producing sector and would show the allocation of sales between intermediatedemand (sales to other producing sectors) and final demand (consumers and exports).The transportation and trade sectors would reflect the appropriate margins associatedwith product movement.
Once structured, an input-output model such as the one described here fully captures theinteractions of the seafood producing and handling sectors with all other sectors of the
ExportsHouseholds
Final Demand
ExportsHouseholds ExportsExportsHouseholdsHouseholds
Final Demand
Production
Commercial HarvestersCommercial Harvesters
IntermediateDemand
Groceries Restaurants
Dealers Processors
GroceriesGroceries RestaurantsRestaurants
DealersDealers ProcessorsProcessors
Utilities,Fuel,
Packaging,Insurance,
Maintenance
Inputs
Fuel,Ice, Nets,
Food,Insurance,
Repair
Inputs
26
economy. Model information would reflect purchases by the seafood industry from allother sectors of the economy and sales to all other sectors and to final demand.
Application to Regulatory Changes in FisheriesAs noted above, the input-output model described in the previous section in terms ofproduct flows depicted in Figure 15 is a demand driven model ideally suited to assessingthe economic impacts of changes final demand (changes in consumers sales or exports).Resulting multipliers would trace the effects of such a change backward through thevarious industry linkages from grocery stores or restaurants to processors, seafooddealers, commercial harvesters and all other sectors directly or indirectly related throughinput purchases. The model would also capture the induced (spending) effects of changesin income in the various sectors.
The scenario of a final demand change is not, however, the most likely when consideringimpacts resulting from changes in fishery regulations. Such changes are more likely toimpact the output of the commercial fishing sector, and the analyst must decide how sucha change will affect the output of seafood dealers and processors, and final consumption.Outputs of the forward-linked sectors may be reduced in proportion to the decline in theavailability of fish products from the commercial harvesting sector, or, dealers andprocessors may continue to operate at the same level by substituting other species orother products, or they may increase the use of imported products. Consumers will notlikely reduce total consumption, but are more likely to make product substitutes either byconsuming other types of seafood or substituting non-seafood products.
The analyst must decide, in dealing with this issue, on the extent to which impactsreflected in the forward linkages are to be captured by any impact analysis. To the extentthat such impacts are to be considered, analysts must have information on how theforward-linked sectors respond to changes in product availability. The simplestassumption is that the output of each forward-linked sector will decline in a mannerproportional to the change in the output of the commercial fishing sector withadjustments for the yield of processed product from a given volume of raw seafood.Obviously, product substitution becomes more likely as one moves further up theproduction chain away from the harvesting sector. Within the input-output framework,however, which captures the relationships between all sectors, care must be taken toavoid double-counting when considering both harvesting sectors (commercial fishing)and forward-linked sectors (seafood processing).
Approaches to IMPLAN ApplicationsIn general, there are two ways in which an analyst might approach the use of IMPLAN toestimate economic impacts of changes in the output of the commercial fishing sectors (orrelated dealer and processing sectors). In one approach, IMPLAN multipliers aregenerated for all sectors of a regional economy using standard IMPLAN procedures forcompiling regional models. Resulting multipliers for non-fishing sectors are then used incalculations external to IMPLAN to estimate impacts associated with independentestimates of expenditures by fishing related sectors (similar to the effort by Kirkley). Asecond approach focuses on using the “Impact Module” provided within the IMPLAN
27
software to calculate impacts of potential changes in fishery output. This approachrequires the creation of new fishery and fishery-related sectors within IMPLAN oradjustment of existing fishery sectors. The latter approach is embodied in the work ofSteinback and Thunberg.
With either of the general approaches an analyst may proceed in a systematic or an adhoc fashion. The latter is intended to describe attempts to estimate the impacts of specificchanges in specific locations without regard to the impact of the overall fishery on theregional economy. The systematic approach is descriptive of attempts to build morecomprehensive models at the regional level that capture the impacts (interactions) of theentire fishery related industry. Both the effort by Kirkley and that by Steinback andThunberg as well as the FEAM model represent systematic efforts to capture the totaleconomic impact of the entire fishing industry within the region(s) of interest. Eachgeneral approach is described below after comments related to the estimation of directimpacts.
Estimating Direct ImpactsA key point before addressing IMPLAN applications is to reinforce the point madeearlier regarding the direct impacts of changes in the fishery sector. IMPLANapplications in either of the cases mentioned above will require estimates of direct outputchanges in fishery related sectors. Such changes are made independently of informationcontained within IMPLAN.
The extent of the direct impact estimates required will depend on the level of analysisselected for the total impact estimates. If the focus is only on the commercial harvestingsector and potential changes generated indirectly with the production of seafood productsat that level, then only estimates of direct changes in the value of landings will berequired. If the analysis is to focus on the forward-linked sectors, then direct outputchanges must also be provided for those sectors prior to developing any IMPLANapplications. Further, the fishery model outlined in terms of Figure 15 contains only threefishery related sectors (harvesting, seafood dealers, and processors) and is described interms of one region. To the extent that additional harvesting, dealer, or processing sectorsare specified, or if the analysis is extended to include more than one region, the task ofestimating direct changes in outputs, and the data required to do so, expands accordingly.
Kirkley Mid-Atlantic ApproachThis approach implicitly begins with the assumption that the fishery sectors (harvestingand processing) within a standard IMPLAN model are not adequate for completingfishery impact estimates for any specific component of the fishery industry in anyspecific region. As noted earlier, such an assumption is likely valid in that any particularcomponent of the fishery industry will depart rather substantially from standard input-output assumptions of homogenous sector outputs and similar production technologies.This approach allows the analysis to proceed without requiring adjustments toinformation contained within IMPLAN, and impact calculations can be performed usingspreadsheets.
28
The procedure begins by using a regional IMPLAN model to calculate multipliers forthose sectors of the regional economy impacted by expenditures of the fisheries sector.The IMPLAN multipliers are then applied to the estimated fishery sector expenditures toderive the impacts. The basic idea is that an expenditure by a fishery related sectorrepresents a direct impact on some other sector of the regional economy and that sector’sactivity then has an indirect and induced impact captured by its multiplier. A simpleexample can be illustrated with some examples of typical expenditures and sectorallocations taken from Kirkley.
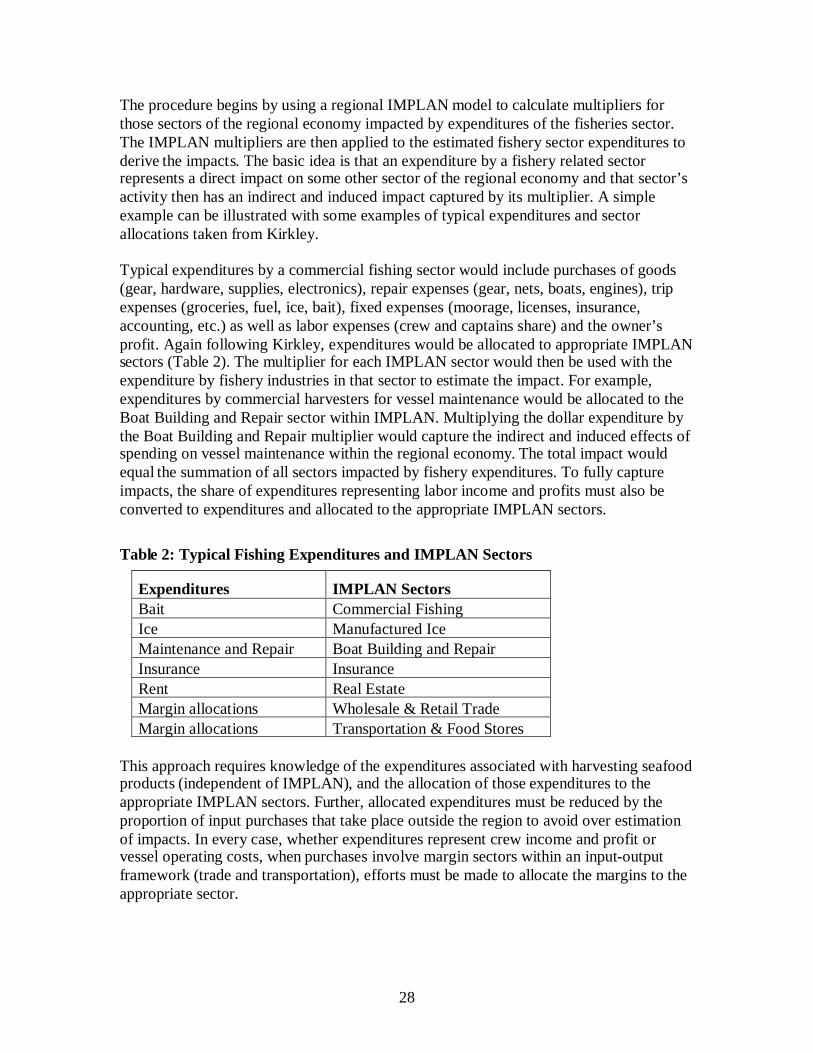
Typical expenditures by a commercial fishing sector would include purchases of goods(gear, hardware, supplies, electronics), repair expenses (gear, nets, boats, engines), tripexpenses (groceries, fuel, ice, bait), fixed expenses (moorage, licenses, insurance,accounting, etc.) as well as labor expenses (crew and captains share) and the owner’sprofit. Again following Kirkley, expenditures would be allocated to appropriate IMPLANsectors (Table 2). The multiplier for each IMPLAN sector would then be used with theexpenditure by fishery industries in that sector to estimate the impact. For example,expenditures by commercial harvesters for vessel maintenance would be allocated to theBoat Building and Repair sector within IMPLAN. Multiplying the dollar expenditure bythe Boat Building and Repair multiplier would capture the indirect and induced effects ofspending on vessel maintenance within the regional economy. The total impact wouldequal the summation of all sectors impacted by fishery expenditures. To fully captureimpacts, the share of expenditures representing labor income and profits must also beconverted to expenditures and allocated to the appropriate IMPLAN sectors.
Table 2: Typical Fishing Expenditures and IMPLAN Sectors
Expenditures IMPLAN SectorsBait Commercial FishingIce Manufactured IceMaintenance and Repair Boat Building and RepairInsurance InsuranceRent Real EstateMargin allocations Wholesale & Retail TradeMargin allocations Transportation & Food Stores
This approach requires knowledge of the expenditures associated with harvesting seafoodproducts (independent of IMPLAN), and the allocation of those expenditures to theappropriate IMPLAN sectors. Further, allocated expenditures must be reduced by theproportion of input purchases that take place outside the region to avoid over estimationof impacts. In every case, whether expenditures represent crew income and profit orvessel operating costs, when purchases involve margin sectors within an input-outputframework (trade and transportation), efforts must be made to allocate the margins to theappropriate sector.
29
While the discussion above is in terms of a commercial harvesting sector, attempts toinclude estimates associated with seafood dealers or processors would require similarinformation and actions for those sectors. The projected change in output of thecommercial production sector would first have to be translated to an output change at thedealer level based on the yield of wholesale or processed product from a given volume ofraw seafood product. Information on expenditures for other production inputs by dealersor processors would also be needed. Again, care must be taken at this step to avoiddouble counting impacts. Double counting can be avoided by estimating dealer orprocessor impacts net of the value of the seafood product at the harvester level.
Steinback-Thunberg New England ApproachThe Kirkley Mid-Atlantic approach discussed in the previous paragraphs generallyrequires little expertise at using or adjusting IMPLAN models. Multipliers are extractedfrom a standard regional input-output model generated in IMPLAN and then exported tospreadsheet software to complete the impact analysis. The Steinback-Thunberg approachdirectly modifies the number of sectors, production functions, trade flows, anddistribution of outputs within IMPLAN to estimate a regional model that reflects thecharacteristics of those sectors in the regions that harvest, process and distribute seafoodproducts.
This approach requires much more familiarity with the modification and use of theIMPLAN software during model development. Data similar to that on expenditures usedin the Kirkley approach will be necessary to estimate new production functions forfishery related sectors in a Steinback-Thunberg type IMPLAN model. By the same token,in the process of specifying the new IMPLAN production function, expenditure data mustbe allocated to the appropriate IMPLAN sectors, and adjustments will be necessary whendirect expenditures by the fishing related sectors take place outside the region of interest.Information will also be required on the movement of product between fishery relatedsectors (i.e.; harvesters, seafood dealers, and processors), between each of these sectorsand the various components of final demand (consumers and domestic and foreignexports), and on the handling of final products by various margin sectors (trade andtransportation) between producers and consumers.
Once the regional models are constructed, this approach will have the same problem asnoted before; the model is demand driven while the problem is more one of assessing theimpact of changes in supply at the harvester level. The same decisions must be madeabout whether or how many of the forward-linked sectors to include in the impacts, andthe same level of care is required to avoid double counting impacts. Impacts can,however, be calculated using the standard impact module within the IMPLAN softwarewhich takes full advantage of the complete interaction between sectors within the modeland allows a more detailed assessment of impacts across sectors. Income, for example,would accrue to the household sector and be expended in accordance with modelcoefficients without requiring the separate step of calculating household expenditures.Other fishing expenditures by seafood sectors will be distributed by IMPLAN based onthe estimated production functions for each sector. The percentage of those productssupplied locally, however, will be determined by the IMPLAN regional purchase

30
coefficient for the supplying sectors and will require verification to make sure that theadjusted model allocates the correct proportion of expenditures to regional sectors asopposed to regional imports.
Sectors, Regions and ApplicationsThe issue of the number of sectors and specific regions is best addressed with referenceto and further explanation of the two specific models referenced earlier, the works byKirkley and that by Steinback and Thunberg. Both represent systematic attempts tocapture the impacts of the entire fishery at the regional level, both disaggregatecommercial fishing into a number of harvesting sectors, and both consider sub-regionalimpacts within the broader Mid-Atlantic and New England regions. The general logic ofeach model will be presented first. This will be followed by a more detailed discussion ofthe delineation of sub-regions and sectors.
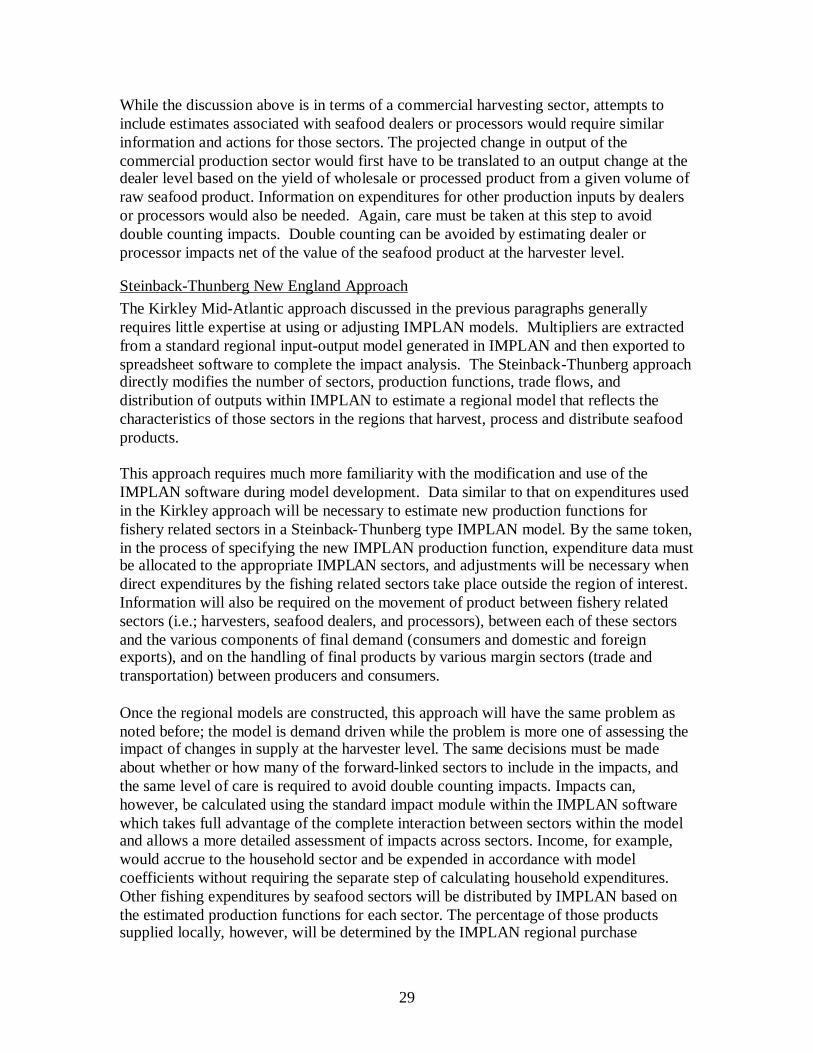
Figure 16 depicts a general outline of the approach employed by Kirkley. The model ismulti-sector and multi-region, and the user is required to specify the value of landings foreach sector in each region. Spreadsheets then calculate the total impacts using multipliersfor regional sectors estimated using standard IMPLAN input-output models. In terms offorward linkages, the model also calculates within the spreadsheets the impactsassociated with activities for seafood dealers, processors and wholesalers with accountingfor product flow among harvesters, processors, and dealers across sub-regions. The finalstep in the model is to allocate total impacts to sub-regions of interest. Total impacts offishing related activity are first calculated for the multi-state, Mid-Atlantic region andthen allocated to sub-regions based on the existing income, employment or output foreach sector relative to that of the larger region. The Kirkley model does not include theimpacts associated with the final distribution of seafood products. The model does takethe steps necessary to avoid double counting when dealer and processor sectors areincluded.
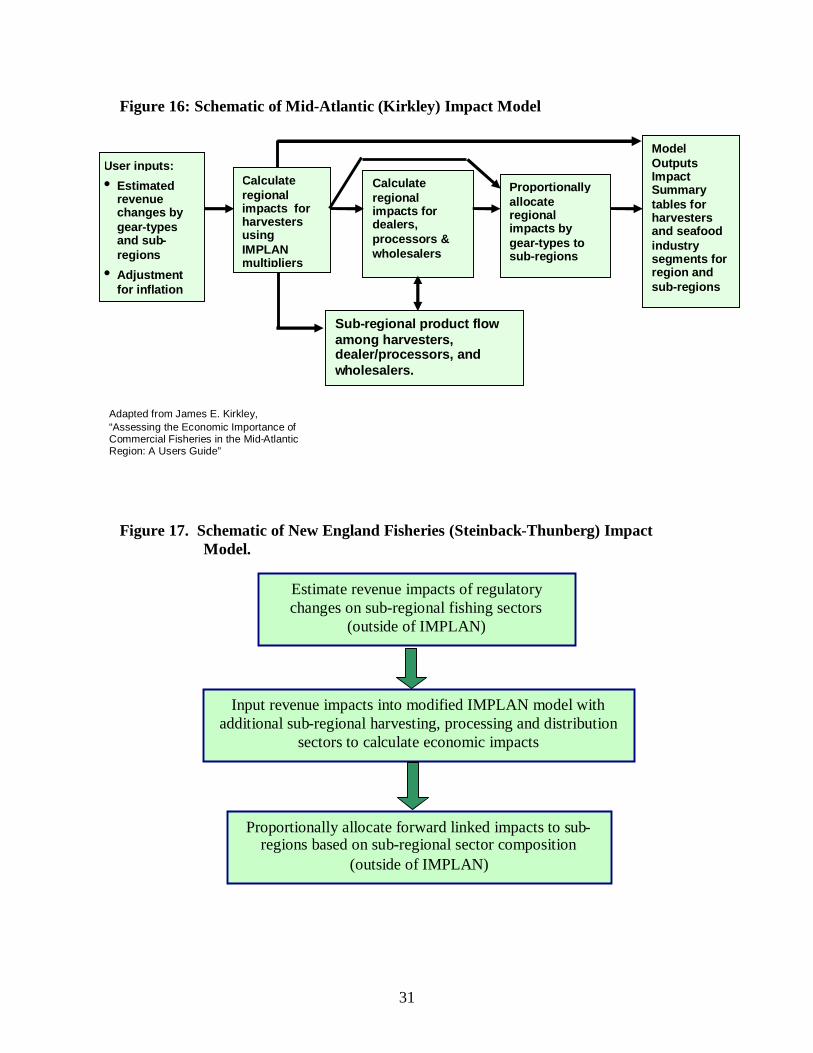
The New England model developed by Steinback and Thunberg is in many ways similarto the effort by Kirkley for the Mid-Atlantic region. For fishing related industries themodel is multi-sector and considers several sub-regions within a five-state New Englandregion, and like the Kirkley model it captures the impacts of harvesting , seafood dealersand processing. Impacts are calculated for the entire New England region and thenallocated to sub-regions using either employment, income or output in the sub-regionrelative to the larger region (Figure 17).
The key difference is that the Steinback-Thunberg model adjusts all fishing relatedsectors within the New England input-output model estimated using IMPLAN. In thismanner all impact calculations take place using the standard IMPLAN impact modulerather than separate from IMPLAN as in the Kirkley approach. Sub-regional impacts arethen allocated proportionally as in the Kirkley approach.
31
Figure 16: Schematic of Mid-Atlantic (Kirkley) Impact Model
Figure 17. Schematic of New England Fisheries (Steinback-Thunberg) ImpactModel.
User inputs:
• Estimatedrevenuechanges bygear-typesand sub-regions
• Adjustmentfor inflation
Calculateregionalimpacts forharvestersusingIMPLANmultipliers
Calculateregionalimpacts fordealers,processors &wholesalers
ModelOutputsImpactSummarytables forharvestersand seafoodindustrysegments forregion andsub-regions
Proportionallyallocateregionalimpacts bygear-types tosub-regions
Adapted from James E. Kirkley,“Assessing the Economic Importance ofCommercial Fisheries in the Mid-AtlanticRegion: A Users Guide”
Sub-regional product flowamong harvesters,dealer/processors, andwholesalers.
Estimate revenue impacts of regulatorychanges on sub-regional fishing sectors
(outside of IMPLAN)
Input revenue impacts into modified IMPLAN model withadditional sub-regional harvesting, processing and distribution
sectors to calculate economic impacts
Proportionally allocate forward linked impacts to sub-regions based on sub-regional sector composition
(outside of IMPLAN)
32
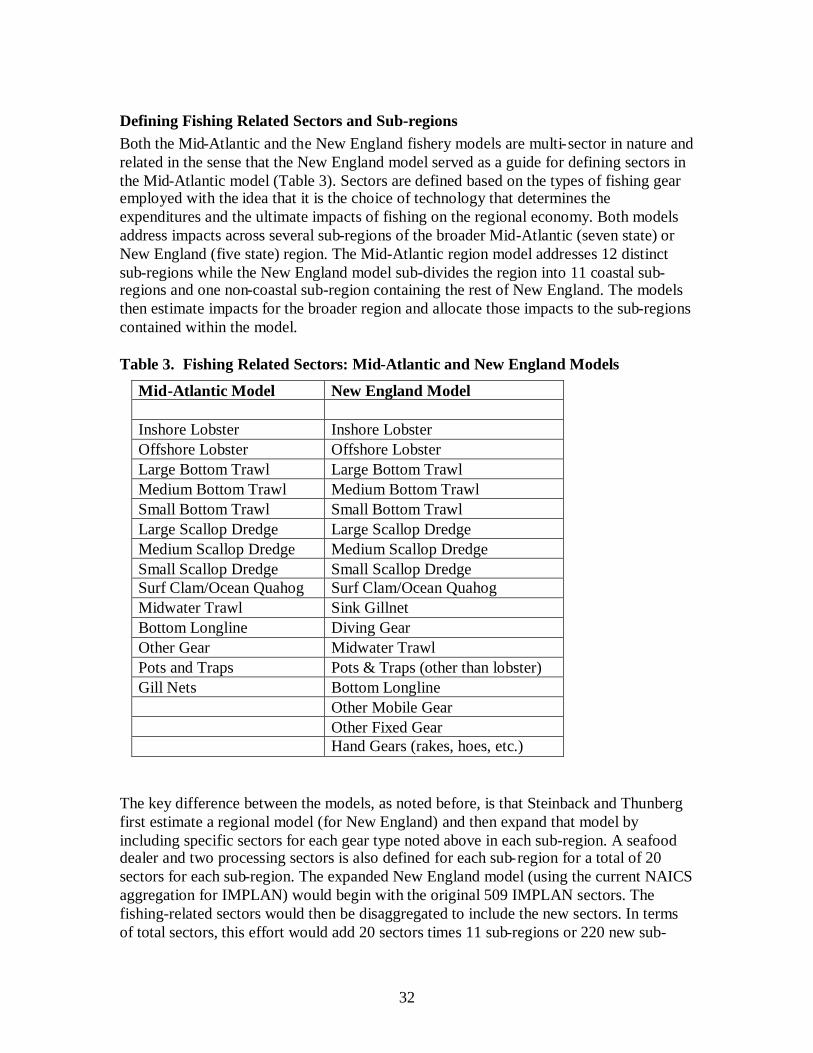
Defining Fishing Related Sectors and Sub-regionsBoth the Mid-Atlantic and the New England fishery models are multi-sector in nature andrelated in the sense that the New England model served as a guide for defining sectors inthe Mid-Atlantic model (Table 3). Sectors are defined based on the types of fishing gearemployed with the idea that it is the choice of technology that determines theexpenditures and the ultimate impacts of fishing on the regional economy. Both modelsaddress impacts across several sub-regions of the broader Mid-Atlantic (seven state) orNew England (five state) region. The Mid-Atlantic region model addresses 12 distinctsub-regions while the New England model sub-divides the region into 11 coastal sub-regions and one non-coastal sub-region containing the rest of New England. The modelsthen estimate impacts for the broader region and allocate those impacts to the sub-regionscontained within the model.
Table 3. Fishing Related Sectors: Mid-Atlantic and New England Models
Mid-Atlantic Model New England Model
Inshore Lobster Inshore LobsterOffshore Lobster Offshore LobsterLarge Bottom Trawl Large Bottom TrawlMedium Bottom Trawl Medium Bottom TrawlSmall Bottom Trawl Small Bottom TrawlLarge Scallop Dredge Large Scallop DredgeMedium Scallop Dredge Medium Scallop DredgeSmall Scallop Dredge Small Scallop DredgeSurf Clam/Ocean Quahog Surf Clam/Ocean QuahogMidwater Trawl Sink GillnetBottom Longline Diving GearOther Gear Midwater TrawlPots and Traps Pots & Traps (other than lobster)Gill Nets Bottom Longline
Other Mobile GearOther Fixed GearHand Gears (rakes, hoes, etc.)
The key difference between the models, as noted before, is that Steinback and Thunbergfirst estimate a regional model (for New England) and then expand that model byincluding specific sectors for each gear type noted above in each sub-region. A seafooddealer and two processing sectors is also defined for each sub-region for a total of 20sectors for each sub-region. The expanded New England model (using the current NAICSaggregation for IMPLAN) would begin with the original 509 IMPLAN sectors. Thefishing-related sectors would then be disaggregated to include the new sectors. In termsof total sectors, this effort would add 20 sectors times 11 sub-regions or 220 new sub-
33
regional sectors. Other sectors determined to be fishery related were also disaggregated.The final version of the New England model resulted in an IMPLAN model with morethan 900 producing sectors. These additions require not only disaggregation of the sectorsat the sub-regional level, but they also require adjustments to the national data tableswithin IMPLAN (in Microsoft access) to allow the IMPLAN software to recognize theexpanded number of sectors and reformulate the regional models with the adjustments.
The Kirkley approach is similar in terms of data requirements. Fourteen gear type sectorsare defined for 12 coastal sub-regions within the Mid-Atlantic region. To use the model,as with the New England model, information is necessary on the value of landings(fishery output) for each sector in each sub-region. Similar to the New England model,the Kirkley approach does not include impacts in restaurants and grocery stores but doesaccount for seafood dealers and processors, so output data for those sectors, by region, isnecessary as well. Once the Kirkley model is constructed in spreadsheets, it can be usedwithout knowledge of IMPLAN, and the initial construction of the model requires littleknowledge or expertise with IMPLAN. This is in contrast to the approach with the NewEngland model where construction requires a user with a high level of sophistication inusing IMPLAN, Microsoft Access, and spreadsheets.
Both the Mid-Atlantic and New England model are similar in that impacts for fisheryrelated sectors are calculated at the multi-state, regional level. Both then allocate theindirect and induced portion of total impacts to sub-regions in proportion to income,employment or output in each sector within the sub-region relative to the larger region. Ineffect, both consider sub-regions in the analysis, but neither approach represents a trulymulti-regional model.
A potential shortcoming of both the New England model and the Mid-Atlantic modelrelates to the available data to support the modeling application. While no attempt ismade here to evaluate the data contained within each model, it appears likely that thelevel of detail in terms of the number of sectors and regions is greater than can besupported by the available data. For example, for each particular harvesting technology orgear type defined as a sector within the New England model, one sees 11 IMPLANsectors, one sector for each gear type within each sub-region. For example, the LargeBottom Trawl sector would be defined for Region 1, Region 2, Region 3, etc. until the 11sectors were completed. Each sub-regional bottom trawl sector could, in theory, have aunique production function and production distribution pattern compared to the bottomtrawl sector in other sub-regions.
The estimation of unique sub-regional sectors would suggest that either productionexpenditures within a particular gear type sector differ across sub-regions or that thedistribution of output from the harvesting sector differs across sub-regions. The firstappears less likely since harvesting expenditures are determined, for the most part, by thetechnology employed and seems less likely to vary across sub-regions. Productdistribution patterns could vary across sub-regions for a number of reasons: differentspecies taken with the same technology, variations in the location of processing facilitiesacross sub-regions, or variations in the value of sales by sub-regional harvesters to
34
dealers located outside the sub-region. There are likely other possibilities for explainingsub-regional variations, but in any case, the definition of different sectors by sub-regionwould require both detailed knowledge of the sub-regional industry and sufficient data tospecify differences in either harvesting expenditures or product distribution. For aparticular gear type sector, to the extent that the production functions and proportionalproduct distributions are the same across sub-regions, the impacts per unit of output valuewill be the same since the impacts for each sector are assessed within the larger regionalmodel.
One additional difference should be noted between the New England model and the Mid-Atlantic model. The latter is constructed using spreadsheets designed to be used byindividuals with little or no knowledge of underlying IMPLAN models. Thespreadsheets contain the necessary proportional expenditure and product distributioncoefficients, and users are required only to enter the value of landings by gear type sectorto calculate impacts. The New England model, on the other hand, is more complex in itsapplication of IMPLAN. There is some possibility of making such a model available toIMPLAN users, but such an effort would require either previous knowledge of IMPLANor training to develop analysts comfortable with its use. More likely, the New Englandtype model would be developed within a regional center and remain in that center for useby experienced analysts. If widely used, however, the approach of the Mid-Atlanticmodel would involve some attention to logistics regarding model updates. The IMPLANdata set is updated annually to reflect the latest national and regional data on output,value added, income and employment by sector. If the spreadsheet models were toremain current, then all versions of the models in use would require new multiplier datato be incorporated each year.
CONCLUSIONS AND RECOMMENDATIONS
Conclusions and recommendations will be discussed at this point with regard toestimating impacts associated with commercial fishing along Florida’s east coast. Pointsoffered are based on the assumption that any modeling effort will be comprehensive andongoing. In other words, the developed model will be applied across all species andharvesting activities in the fisheries for the indefinite future, as opposed to short-term adhoc efforts to estimate the economic impacts of a specific regulatory change, or a specificcomponent of the fisheries industry. Although this study was focused on Florida’s eastcoast, there are no issues that preclude the application of these conclusions andrecommendation to the development of a State-wide fisheries model, given that thenecessary data is available and that the modeling approach will be comprehensive.
Adjustments to standard IMPLAN models will be necessary to adequately capturethe impact of fishery related industries on Florida’s East Coast. Given the largenumber of species harvested and the variety of technologies (gear types) employed, thefishery sector within the standard IMPLAN regional model will violate the assumptionsthat a sector produces a homogenous product with a homogenous production technology.Further, due to the same type of variation across regions or sub-regions, the distribution(or allocation) of products from the harvesting sector to other intermediate sectors,
35
domestic and foreign exports, and final consumers is likely to vary widely from that in aregional model based on national averages. The industry is diverse, and that diversitylikely rules out the use of generic models that can be used without significant refinementsor accommodations to capture its variety.
Given the complexity and time horizon of fisheries regulation programs, the strategychosen in modeling the economic impacts of regulatory changes must also consider theskill and time required to maintain and update the model, apply the model to differentimpact questions, and to interpret the results. These modeling capabilities could beimplemented using National Marine Fisheries staff or they could be contracted to outsidepublic or private entities. In either case, the key to success is building or acquiring thehuman capital to carry out development, applications and modification of the I/O modelsover time. It will also be critical that the analysts working on impact issues be familiarwith Florida fisheries, related industries and their regulations, or, have close workingrelationships with individuals that do.
The final form of the adjusted IMPLAN model will depend on the number ofcommercial fishery harvest sectors, the number of regions or sub-regions definedwithin the State, and the number of forward linked industries to be included. Thesechoices will depend on the degree of geographic and sectorial detail desired, and thedegree of detail desired in tracing the linkages between fishing related sectors and othersectors of the regional economy. Data requirements for model estimation will increaseproportionally as the number of sectors, regions and forward-linkages are added to themodel. Specific recommendations on these different aspects of model design arediscussed below.
Based on NMFS’s Annual Commercial Landings data for Florida’s east coast, sevento ten sectors determined by fishing gear-type or technology would encompassapproximately ninety percent of fishery output based on the value of landings. Thisnumber, however, must be viewed as a preliminary conclusion. Given the diversityof species landed and the variety of gear types and methods employed, thedelineation of additional harvesting sectors will be one of the more challengingaspects of modifying an IMPLAN model to Florida’s fishery industry. Certainly,defining sectors is dependent on having (or collecting) the data necessary to specifyproduction functions. The NMFS and the South Atlantic Fisheries Council (SAFC)began collecting cost and effort data on finfish such as snapper, grouper and king orSpanish mackerel in the South Atlantic in 2002. Data collection on shrimpharvesting began in 2004. Cost and effort data for harvesting other economicallyimportant species in the South Atlantic, Gulf and Caribbean will presumably follow.These data will be necessary to specify the production functions required to capturethe diversity of Florida’s fishing industry. The final choice of sectors should comeafter a thorough review of the data by modeling analysts in consultation withindividuals from the pubic and private sectors with detailed knowledge of the fishingindustry.
36
It is feasible to model the regional variation in fish harvesting and post-harvestactivity along Florida’s east coast using one or more regions. Fishing activity alongFlorida’s east coast tends to be concentrated around three locations. These includethe Jacksonville area towards the northern part of the state, the Volusia-Brevardcounty area near the center of the state, and the Miami-West Palm Beach area to thesouth. Using geographic sub-regions smaller than the BEA regions would likelyresult in models that would be less realistic from the standpoint of the fisheriesindustry and from their inherent economic functionality. The decision will depend onthe degree of geographic detail desired, the extent to which forward-linked sectorsare to be included, and the degree of detail desired in the ability to trace linkagesbetween fishing related sectors and other sectors of the regional economy. From ageographic perspective, IMPLAN will allow models for areas as small as counties oras large as the entire state or any combination between the two that considers groupsof contiguous counties.
A practical alternative to developing a model based on BEA Economic Areas mightbe to use a state-level model for Florida with seven to ten fishery harvesting sectorsbased on gear type, in addition to a seafood dealer sector and a seafood processingsector. As noted earlier, expenditures by harvesting sectors are likely to be highlycorrelated to the technology and may not vary substantially across sub-regions of thestate. Thus, production functions estimated at the state level may adequately reflectexpenditures at the regional level given a sufficient number of harvesting (gear-type)sectors. This approach could provide a comparable level of sub-regional detail as amodel with sub-regions explicitly incorporated into the sectoring scheme. Directimpacts could easily be identified with sub-regions based on estimates of the valueof landings for different parts of the state. Indirect and induced components of totalimpacts could then be proportionally allocated to sub-regions following theprocedures used in the Mid-Atlantic and New England models. This alternativeregional-sectoring approach would greatly reduce the complexity and datarequirements of the modeling effort and therefore the development cost of themodel.
Additional and/or adjusted IMPLAN sectors may be required to adequately modelthe post-harvest seafood industry. Additional information will be required to makereliable decisions on the adjustments and/or extensions needed to model the dealer,broker, processor and/or distributor stages of Florida’s seafood industry. A reviewof existing secondary data can provide an overview of the numbers of firms,approximate sales values, employment and other descriptive information on thesesectors. Consultations with industry trade associations and the Florida Division ofSeafood Marketing can also provide additional information and contacts that will beuseful in initially describing the industry. This information could then be used todevelop a series of “focus group” meetings and/or informal interviews with industrymembers to develop a better understanding of the post-harvest seafood industry.Information derived from these meetings could be used to verify the appropriatenessof specifying distinct dealer and processor sectors, and in developing a market-channel survey instrument(s). Multiple survey instruments may needed and may be
37
administered via mail, telephone or personal visits, depending on the nature of themarketing channel, for different forms of seafood products. The survey findingscould then be used to specify product movements in more detail with respect tovalues and to estimate expenditures (production coefficients) for each post-harvest,forward-linked sector specified.
Since input-output models of the type produced by IMPLAN are demand driven,care must be taken to avoid double-counting impacts when forward-linked industriesare included in the model. I/O models are ideally suited to the estimation of impactsassociated with changes in final demand, where impacts are then traced backwardsthrough the production change to calculate indirect and induced impacts. Regulatoryimposed changes in fishing industries, however, usually result in changes in theoutput of the harvesting sector, the producer of raw product. Such reductions clearlyimpact the output of forward-linked sectors such as dealers and processors ofseafood. Analysts must determine what forward-linked sectors to include, how theycan best be incorporated into a model, and how to avoid double counting harvestingoutput.
Double-counting can avoided by estimating the output changes for the dealer andprocessor sectors net of the output changes estimated for the harvesting sectors. Inother words, the input-output models for the dealer/processor sectors would have tobe structured so that the value of the untransformed/unprocessed seafood inputs,(from the fishery harvesting sectors) is excluded from the impact calculations.Within the IMPLAN software, this can effectively be accomplished by setting theregional purchase coefficients for fishery harvesting sector inputs equal to zero.This prevents the model of the post-harvest sectors from purchasing seafood inputsfrom within the study area and thus subtracts those purchases from the estimatedregional impacts.
Data requirements and costs for model development and application will increasewith the number of harvesting sectors, sub-regions, and forward-linked sectors addedto the model. Increasing the number of harvesting sectors increases the datarequirements by the number of sectors included. The analyst will be required tospecify production functions or expenditures for each new sector, delineate productflows to forward-linked sectors, and specify interactions between sectors wherenecessary. The inclusion of additional sub-regions multiplies the data requirementsof the model. Data to specify production coefficients and product distributionpatterns would be necessary for each sector included in each sub-region. Data willalso be needed to represent the interactions between sectors across sub-regions. Foreach forward-linked sector added to the model, data will be required to specify itsproduction function (just like harvesting sectors). Additional forward-linked sectorswill also require information on product flows to other sectors in the marketingchannel and to final consumers.
The recommended approach follows that of Steinback and Thunberg in the NewEngland model, but reduces its complexity by focusing on fewer sectors and sub-

38
regions. This simplified approach will help avoid much of the complex and tediousprocess of adjusting the national data tables within IMPLAN. This approach is also morefeasible in terms of data requirements. If it is decided to model the State as a singleregion, some degree of geographic specificity could still be achieved though a sub-regional allocation procedure.