impacts of extreme precipitation on tree plantation carbon cycle
TRANSCRIPT
ORIGINAL PAPER
Impacts of extreme precipitation on tree plantation carbon cycle
Mei Huang & Jinjun Ji & Feng Deng & Fengting Yang
Received: 17 September 2012 /Accepted: 9 May 2013# Springer-Verlag Wien 2013
Abstract Extreme precipitation events are expected to in-crease in frequency and magnitude in future due to globalwarming, but relevant impacts on tree plantation ecosystemcarbon cycle are unknown. In this study, we use an atmo-sphere–vegetation interaction model (AVIM2) to estimatethe likely impacts of extreme precipitation events on carbonfluxes and carbon stocks of a tree plantation in south China.Our results indicate that shifting from moderate precipita-tion events to extreme precipitation events whilst keepingmonthly precipitation unchanged could decrease the treeplantation carbon accumulation. Tree plantation net primaryproductivity, net ecosystem productivity, soil carbon stockand vegetation carbon stock could decrease by 4.2, 28, 4.3and 1.4 % during the studying period of 1962–2004, respec-tively. Though reductions in net primary productivity andnet ecosystem productivity are relatively smaller than theirannual variations, our sensitivity test shows that the treeplantation carbon stock could decrease by 3.3 % if theassumed extreme precipitation regime lasts for 500 years.Observed and simulated gross primary productivity, ecosys-tem respiration and net ecosystem productivity have signif-icant positive correlation with soil water content (SWC),especially the deep SWC. The mechanism for the extremeprecipitation effect is that the increase in extreme precipita-tion events will cause SWC to decrease, consequently, re-ducing carbon fluxes and stocks.
1 Introduction
Extreme weather events are expected to increase in frequen-cy and magnitude due to global warming (Easterling et al.2000; Allan and Soden 2008). Studies have shown manycountries have experienced a significant increase or de-crease of total seasonal precipitation and a disproportionateincreasing trend in frequency of 1-day heavy precipitationevents (Easterling et al. 2000; Goswami et al. 2006). Thefrequency and intensity of extreme weather events, such asdroughts and heavy precipitation, are important componentsof climate change and their effects on vegetation are ofincreasing concerns (Granier et al. 1999; Reichstein et al.2003; Ciais et al. 2005).
Recently, several experimental researches wereconducted to study the ecological effects of extreme weatherevents. A 4-year experiment conducted in native grasslanddemonstrated that key carbon cycling processes and grass-land community composition can be altered rapidly byreducing storm frequency and increasing rainfall quantityper storm, independent of changes in total precipitation(Knapp et al. 2002). Other manipulated experiments showedthe interval between rainfall events, which led to lower andmore variable soil water content, may be a primary driver ingrassland ecosystem responses to altered rainfall patterns(Fay et al. 2000; Fay et al. 2003). The grassland ecosystemresponses to extreme rainfall would likely result in changesin ecosystem carbon cycling (Fay et al. 2008).
Although the concern about the potential effects of cli-mate change on forests has grown in recent years (Bonan etal. 1990; Botkin and Nisbet 1992; Solomon and Bartlein1992; McGuire et al. 1993; Coops and Waring 2001; Davi etal. 2006), few studies, based on model simulation or phys-ical experiment, considered the effects of extreme weatherevents on forest. A major challenge for the experimentalstudy comes from the operability of experiments.
In this study, we use a process-based model to study theeffects of extreme precipitation on carbon fluxes and stocksof tree plantations. The simulations were conducted on a
M. Huang (*) : J. Ji : F. YangKey Laboratory of Ecosystem Network Observationand Modeling, Institute of Geographical Sciences and NaturalResources Research, Chinese Academy of Sciences,Beijing 100101, Chinae-mail: [email protected]
J. JiInstitute of Atmospheric Physics, Chinese Academy of Sciences,Beijing 100029, China
F. DengDepartment of Physics, University of Toronto, Toronto, OntarioM5S 3G3, Canada
Theor Appl ClimatolDOI 10.1007/s00704-013-0927-8

“ChinaFLUX” network site in subtropical monsoon climaticzone of south China. Sensitivity analysis was carried out toassess the impacts of extreme precipitation on net primaryproductivity (NPP), net ecosystem productivity (NEP), veg-etation carbon (VC) stock and soil carbon (SC) stock of thetree plantation. The possible mechanism is also discussed.
The objectives of this study are to answer the followingquestions: (1) whether the rising trend in extreme precipita-tion events could influence the tree plantation carbon cycleand (2) if yes, what's the possible magnitude of thesechanges and what cause the changes?
2 Material and methods
2.1 Site characteristics and data source
The experimental site, Qian Yanzhou, is located in the southsubtropical monsoon area of China (26°44′48″N, 115°04′13″E). The altitude of this site is 100 m above sea level.Annual rainfall in this area is 1,485 mm and the annualmean temperature is 17.9 °C. The unique southeast mon-soon gives the site a warm and humid environment. Theoriginal vegetation in Qian Yanzhou area was most probablythe evergreen broadleaf forest, but it has been changed muchby human activities. The plantation (mainly consisting ofPinus massoniana and Pinus elliottii) was planted in 1983,and before that time, the area was mainly covered by wildgrasslands, shrub lands and some sparse P. massoniana. Theeddy flux observation tower was installed in the plantationsin 2001. Around the tower, the forest cover reaches 90 % in1 km2 area and 70 % in 100 km2. The soil is red soil, whichweathered from red sand rock. The plantations have notbeen disturbed by human activities since planted in 1983(Li and Wang 2000).
The long-term meteorological data used in this study arefrom a nearby meteorological station, which is located at26°45′N, 114°55′E, less than 10 km away from QianYanzhou. The six hourly meteorological data was interpo-lated into half-hourly data for model simulation.
2.2 Model description
The atmosphere–vegetation interaction model (AVIM) wasfirst developed by Ji (1995) and modified in a secondversion (AVIM2, Huang et al. 2007; Ji et al. 2008). Themodel consists of three modules: physical process module,physiological plant growth module, and soil carbon andnitrogen dynamics module.
The main process simulated by the physical processmodule is the transfer of energy and water amongst soil,vegetation and atmosphere. This includes solar and infraredwave radiation transfers; sensible and latent heat fluxes
between air, canopy and soil; interception of rainfall anddrainage; surface runoff and infiltration; evapotranspirationfrom the canopy and evaporation from the surface; andsnow accumulation and snowmelt processes.
The plant growth module simulates the carbon exchangebetween the vegetation and the atmosphere as well as thevariation of vegetation parameters, such as leaf area index(LAI). Gross primary productivity (GPP) is calculated withthe well-known Farquhar model, which is based on plantphysiological processes and biochemistry of photosynthesis(Farquhar et al. 1980; Collatz et al. 1992). Net primaryproduction (NPP) is the residue of GPP minus maintenanceand growth respiration. The change in biomass for the plantis determined by the budget of carbon. The allocation ofassimilated carbon amongst different parts in plant is basedon the following presumption: at the initial stage of growingseason, more carbon is allocated to foliage part, and there-after, carbon allocated to root and shoot during the growingseason. The allocation coefficients are adjusted by the sea-sonal LAI variation. The phenological feature is assumed tobe controlled by the air degree days (above 5 °C). The offsetof leaves depends on the lifetime of the leaf.
The soil carbon and nitrogen dynamics module used inthis study is an approach similar to that of Parton et al.(1987) and Cao and Woodward (1998). The soil organicmatter was divided into eight pools: surface structural andmetabolic litter; structural and metabolic root litter; surfacemicrobe and soil microbe; and slow and passive carbon.
The detailed descriptions of the physical processmodule and the plant growth module can be found inJi (1995), Dan and Ji (2007), and Lu and Ji (2006). Thesoil carbon and nitrogen dynamics module was fullydescribed by Huang et al. (2007).
The performance of the AVIM2 in this site has beenvalidated with the field and eddy covariance measurementsindicating that the model could simulate the seasonal andinter-annual variations of carbon fluxes and stocks well here(Huang, et al. 2007).
2.3 Experimental design
This study aims to assess the effect of extreme precipitationon the ecosystem carbon fluxes and stocks. The simulationcontains the following steps:
1. Simulating the ecosystem carbon flux over the period1962–2004 using the observed meteorological data andcalculating the annual NPP and NEP anomaly percent-age. We first run the model to the state of equilibriumand then simulate the carbon fluxes and stocks with themeteorological data of 1962–2004. In this study, equi-librium state means that the changes of all state vari-ables of the model from 1 year to the next must be less
M. Huang et al.
than a few percent, and a quasi-balance between theheterotrophic respiration and NPP is obtained. The me-teorological data of 1962 was used for loop running toapproach the equilibrium state. The reason for using thedata of 1962 is that the annual mean temperature andprecipitation of this year are close to the mean values of1962–2004. The carbon fluxes anomaly (CFA) percent-age was calculated according to:
CFA ¼CF−CF
� �
CF� 100% ð1Þ
where CF represents NPP or NEP; CF is the mean ofCF values over 1962–2004.
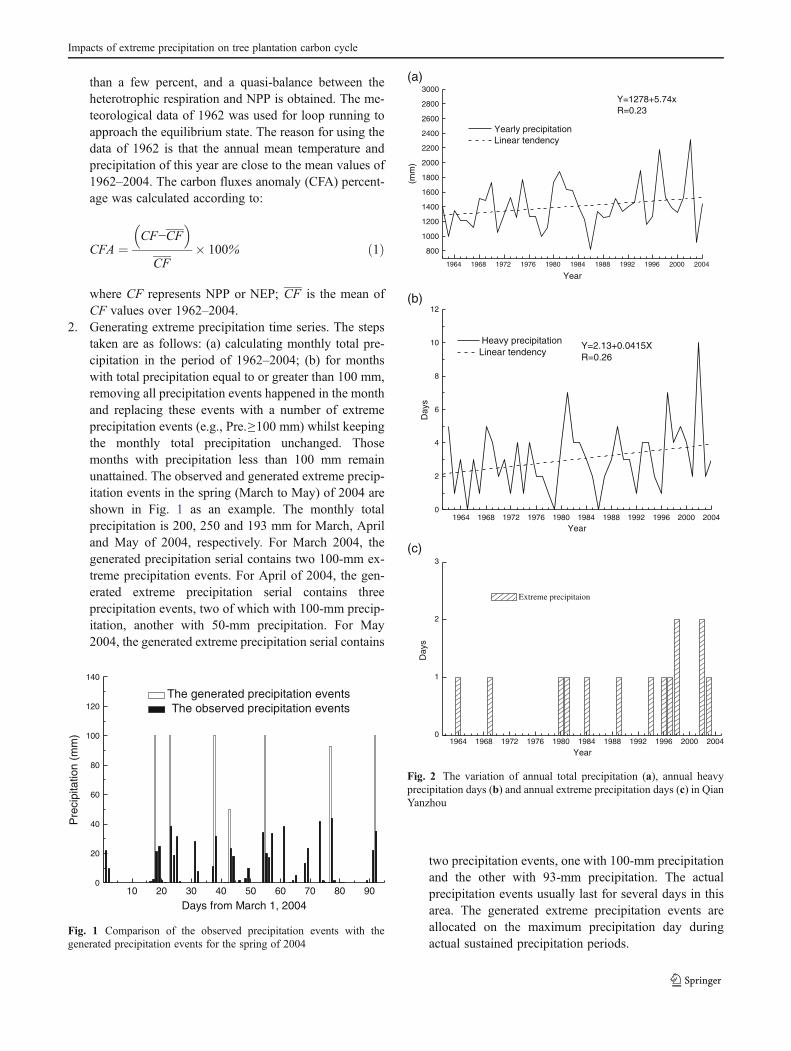
2. Generating extreme precipitation time series. The stepstaken are as follows: (a) calculating monthly total pre-cipitation in the period of 1962–2004; (b) for monthswith total precipitation equal to or greater than 100 mm,removing all precipitation events happened in the monthand replacing these events with a number of extremeprecipitation events (e.g., Pre.≥100 mm) whilst keepingthe monthly total precipitation unchanged. Thosemonths with precipitation less than 100 mm remainunattained. The observed and generated extreme precip-itation events in the spring (March to May) of 2004 areshown in Fig. 1 as an example. The monthly totalprecipitation is 200, 250 and 193 mm for March, Apriland May of 2004, respectively. For March 2004, thegenerated precipitation serial contains two 100-mm ex-treme precipitation events. For April of 2004, the gen-erated extreme precipitation serial contains threeprecipitation events, two of which with 100-mm precip-itation, another with 50-mm precipitation. For May2004, the generated extreme precipitation serial contains
two precipitation events, one with 100-mm precipitationand the other with 93-mm precipitation. The actualprecipitation events usually last for several days in thisarea. The generated extreme precipitation events areallocated on the maximum precipitation day duringactual sustained precipitation periods.
10 20 30 40 50 60 70 80 900
20
40
60
80
100
120
140
Pre
cipi
tatio
n (m
m)
Days from March 1, 2004
The generated precipitation events The observed precipitation events
Fig. 1 Comparison of the observed precipitation events with thegenerated precipitation events for the spring of 2004
1964 1968 1972 1976 1980 1984 1988 1992 1996 2000 2004
800
1000
1200
1400
1600
1800
2000
2200
2400
2600
2800
3000
(mm
)
Year
Yearly precipitation Linear tendency
Y=1278+5.74xR=0.23
(a)
1964 1968 1972 1976 1980 1984 1988 1992 1996 2000 20040
2
4
6
8
10
12
Day
s
Year
Heavy precipitationLinear tendency
Y=2.13+0.0415XR=0.26
(b)
1964 1968 1972 1976 1980 1984 1988 1992 1996 2000 20040
1
2
3
Extreme precipitaion
Day
s
Year
(c)
Fig. 2 The variation of annual total precipitation (a), annual heavyprecipitation days (b) and annual extreme precipitation days (c) in QianYanzhou
Impacts of extreme precipitation on tree plantation carbon cycle
3. Estimating the impacts of extreme precipitation on eco-system. The generated precipitation data together with
other observed meteorological data are inputted to themodel to simulate the ecosystem carbon fluxes and
0 1 2 3 4 5 6 7 8 9 10 110
1
2
3
4
5
6
7
8
9
10
11
Sim
ulat
ed G
PP
(g C
m-2 d
ay-1)
Observed GPP(g C m-2 day-1)
Y=0.200+XR2=0.81 P<0.0001
(a)
0 1 2 3 4 5 6 7 8 90
1
2
3
4
5
6
7
8
9
Sim
ulat
ed R
E
(g C
m-2 d
ay-1)
Observed RE(g C m-2 day-1)
Y=0.0518+0.986XR2=0.852 P<0.0001
(b)
-1 0 1 2 3 4 5-1
0
1
2
3
4
5
Sim
ulat
ed N
EE
(g C
m-2 d
ay-1)
Observed NEE(g C m-2 day-1)
Y=0.669+0.52XR2=0.175 P<0.0001
(c)
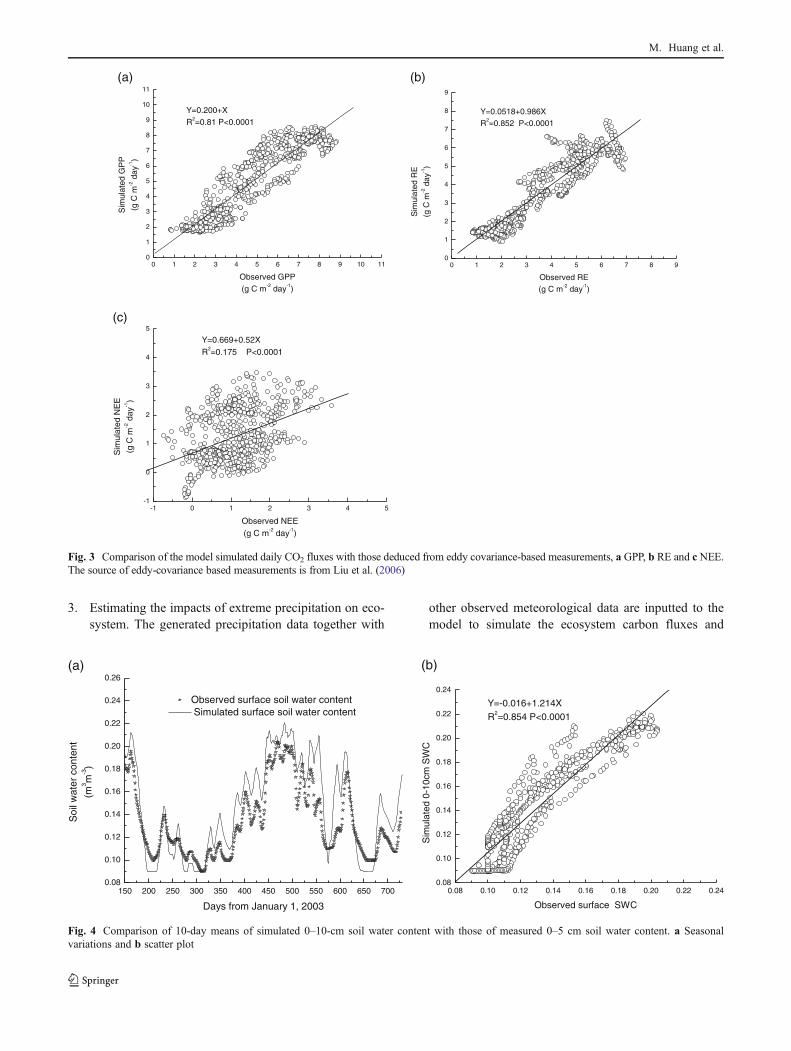
Fig. 3 Comparison of the model simulated daily CO2 fluxes with those deduced from eddy covariance-based measurements, a GPP, b RE and c NEE.The source of eddy-covariance based measurements is from Liu et al. (2006)
150 200 250 300 350 400 450 500 550 600 650 7000.08
0.10
0.12
0.14
0.16
0.18
0.20
0.22
0.24
0.26
Soi
l wat
er c
onte
nt
(m3 m
-3)
Days from January 1, 2003
Observed surface soil water content Simulated surface soil water content
(a)
0.08 0.10 0.12 0.14 0.16 0.18 0.20 0.22 0.240.08
0.10
0.12
0.14
0.16
0.18
0.20
0.22
0.24
Sim
ulat
ed 0
-10c
m S
WC
Observed surface SWC
Y=-0.016+1.214XR2=0.854 P<0.0001
(b)
Fig. 4 Comparison of 10-day means of simulated 0–10-cm soil water content with those of measured 0–5 cm soil water content. a Seasonalvariations and b scatter plot
M. Huang et al.

stocks over 1962–2004, and a similar method asFormula (1) is designed to calculate the changes ofNPP, NEP, SC and VC in percentage (CP):
CP ¼ V−CC
� 100% ð2Þ
where C represents simulated NPP, NEP, SC, or VCusing the actual precipitation events and V representssimulated NPP, NEP, SC, or VC using the generatedprecipitation events.
4. Estimating the longtime impacts of extreme precipita-tion on ecosystem. The model runs for 500 years withobserved and generated precipitation data of 1962
together with other meteorological data, respectively.The differences between carbon fluxes and stocks basedon the observed precipitation and those based on gen-erated precipitation are calculated.
3 Results
3.1 The precipitation trends in Qian Yanzhou
Yearly precipitation in Qian Yanzhou over 1962–2004 andits linear trend are shown in Fig. 2a. The annual totalprecipitation shows an increasing tendency in the study
150 200 250 300 350 400 450 500 550 600 650 7000.24
0.26
0.28
0.30
0.32
0.34
0.36
0.38
0.40
0.42
Soi
l wat
er c
onte
nt
(m3 m
-3)
Days from January 1, 2003
Observed deep soil water contentSimulated deep soil water content
(a)
0.24 0.26 0.28 0.30 0.32 0.34 0.36 0.38 0.400.24
0.26
0.28
0.30
0.32
0.34
0.36
0.38
0.40
Sim
ulat
ed d
eep
soil
SW
C
Observed deep soil SWC
Y=0.087+0.71xR2=0.76 P<0.0001
(b)
Fig. 5 Comparison of the model-simulated deep soil water contents withthe field measurements in 10-day mean. a Seasonal variation; b scatterchart. The field observations are the mean values of measurements at
20 cm and 40 cm soil depth. The model simulations are the averaged soilwater contents of 10–60 cm soil depth
1964 1968 1972 1976 1980 1984 1988 1992 1996 2000 2004
0.4
0.5
0.6
0.7
0.8
0.9
1.0
1.1 NPP based on generated precipitation NPP based on actual precipitation
NP
P(k
g C
m-2 a
-1)
Year
Fig. 6 Comparison of themodel-simulated NPP based onactual precipitation with thatbased on the generatedprecipitation
Impacts of extreme precipitation on tree plantation carbon cycle

period with a changing rate of 5.74 mm/year, an equivalentof 0.4 % of annual mean precipitation.
The accumulated days with heavy precipitation (e.g.,daily Pre.≥50 mm) in a year (ADHP) and its tendency over1962–2004 in Qian Yanzhou are shown in Fig. 2b. TheADHP also shows an increasing trend in the study periodand its changing rate is 0.0415 day/year, which is 0.95 % ofthe mean ADHP during 1962–2004. The change percentageis much greater than that of the total precipitation amount(0.4 %), and this is consistent with the research of Easterlinget al. (2000). The correlation coefficient (0.26) for the heavyprecipitation linear regression equation is also greater thanthat for the total precipitation (0.23).
The frequency of extreme precipitation, e.g., 1-dayprecipitation excess 100-mm event, also shows an increas-ing tendency in this area (Fig. 2c). During the 20 years of1960s and 1970s, the number of total extreme precipita-tion days is two, but this number increased to nine duringthe 1980s and 1990s. There are unprecedentedly two ex-treme precipitation events that occurred in each year of1998 and 2002.
3.2 Model validation
The model simulated daily GPP, net ecosystem exchange(NEE) and ecosystem respiration (RE) were compared withthose from eddy covariance-based measurements (Fig. 3).The simulated daily GPP are close to the measurements(Fig. 3a, r2=0.81). We also found a close correlation be-tween simulated and measured daily RE (Fig. 3b, r2=0.85).The correlation between the simulated and measured dailyNEE is relatively weak (Fig. 3c, r2=0.175), but the P valueis still less than 0.0001.
We further compared the model-simulated surfaceSWCs with the field measurements at the eddy covarianceflux tower site. The surface soil in the model simulation isdefined as the soil in the depth between 0 and 10 cm. TheSWC measurements are obtained at 5-cm depth by timedomain reflectometry probes (CS616, Campbell ScientificInc., Logan, UT, USA). Figure 4a shows that the model isable to capture the seasonal variations of the measuredsurface SWC well, with the determination coefficient ofsimulated SWC against observations equal to 0.85(Fig. 4b).
Figure 5 shows the comparison of simulated 10–60-cmSWC with the means of SWC measured depths of 20 and40 cm. Simulated 10–60-cm SWC closely matched theobservations (r2=0.76, p<0.0001).
3.3 The effects of extreme precipitation on NPP
The comparisons of the simulated NPP based on actual pre-cipitation and that based on the generated precipitation areshown in Fig. 6. For the actual precipitation, the simulatedNPP averaged over 1962–2004 is 0.707 kg C m−2 a−1,ranging from 0.54 to 0.923 kg C m−2 a−1. For the gener-ated precipitation, the mean of simulated NPP is0.677 kg C m−2 a−1, which is 4.2 % less than the “actual”mean value of NPP. The difference between “actual” and“generated” NPPs ranges from 77.9 g C m−2 a−1 (11 %)to almost naught.
3.4 The effects of extreme precipitation on NEP
NEP is the net carbon exchanges between the ecosystemand the atmosphere. It is the residue of NPP minus
1964 1968 1972 1976 1980 1984 1988 1992 1996 2000 2004-0.2
-0.1
0.0
0.1
0.2
0.3
NE
P(k
g C
m-2
a-1
)
Year
NEP based on generated precipitation NEP based on actual precipitation
Fig. 7 Comparison of themodel-simulated NEP based onactual precipitation with thatbased on generatedprecipitation
M. Huang et al.

heterotrophic respiration. When the NEP value is posi-tive, the ecosystem is a carbon sink, and when it isnegative, the ecosystem is a carbon source. Figure 7shows the model-simulated NEP curves based on actualprecipitation and generated precipitation over 1962–2004. The latter is less than the former in almost allthe years. The simulated mean NEP value for actualprecipitation is 0.025 kg C m−2 a−1 and ranges from−0.153 to +0.239 kg C m−2 a−1. The simulated averagedNEP using generated precipitation is 0.007 g C m−2 a−1,which is 28 % less than that “actual” one.
3.5 The effect of extreme precipitation on vegetation carbon
Simulated vegetation carbon stocks based on actual pre-cipitation and generated precipitation during the period of1962–2004 are shown in Fig. 8a. The simulated mean
vegetation carbon stock for actual and generated precipi-tation are 9.68 and 9.26 kg C m−2, respectively. The latteris 4.3 % less than the former. The vegetation carbondifference increases sharply for the first 29 years (from1962 to 1991) and then decreases slowly (Fig. 8b).
3.6 The effect of extreme precipitation on soil carbon
Figure 9a shows the simulated soil carbon stocks based onactual precipitation and generated precipitation during1962–2004. The simulated mean soil carbon stock is 8.88and 8.75 kg C m−2 for actual and generated precipitation,respectively. The latter is 1.4 % less than the former. Thevariation of soil carbon stock difference is similar to that ofthe vegetation carbon stock; the soil carbon stock differenceincreases sharply for the first 30 years (from 1962 to 1992)and then decreases slowly (Fig. 9b).
1964 1968 1972 1976 1980 1984 1988 1992 1996 2000 20048.0
8.2
8.4
8.6
8.8
9.0
9.2
9.4 Soil Carbon based on generated precipitation Soil Carbon based on actual precipitation
Soi
l Car
bon
stoc
k (k
g C
m-2)
Year
(a)
1964 1968 1972 1976 1980 1984 1988 1992 1996 2000 20040.00
0.05
0.10
0.15
0.20
Soi
l car
bon
diffe
renc
e (k
g C
m-2)
Year
Soil carbon stock difference
(b)
Fig. 9 The soil carbon stock differences in the period of 1962–2004. aThe simulated soil carbon stock based on actual precipitation and thatbased on generated precipitation. b The residues of actual soil carbonstocks minus generated soil carbon stocks
1965 1970 1975 1980 1985 1990 1995 2000 20058.6
8.8
9.0
9.2
9.4
9.6
9.8
10.0
10.2
10.4
10.6
10.8
Veg
etat
ion
carb
on s
tock
(K
g C
m-2)
Year
Vegetation carbon based on actual precipitaiton Vegetaitn carbon based on generated precipitation
(a)
1964 1968 1972 1976 1980 1984 1988 1992 1996 2000 20040.0
0.1
0.2
0.3
0.4
0.5
0.6
0.7
Veg
etat
ion
Car
bon
stoc
k (k
g C
m-2)
Year
Vegetation carbon stock difference
(b)
Fig. 8 The vegetation carbon stock differences in the period of 1962–2004. a The simulated vegetation carbon stock based on actual precipi-tation and that based on generated precipitation. b The residues of actualvegetation carbon stock minus generated vegetation carbon stock
Impacts of extreme precipitation on tree plantation carbon cycle
4 Discussions
4.1 The relationships between SWC and CO2 fluxes
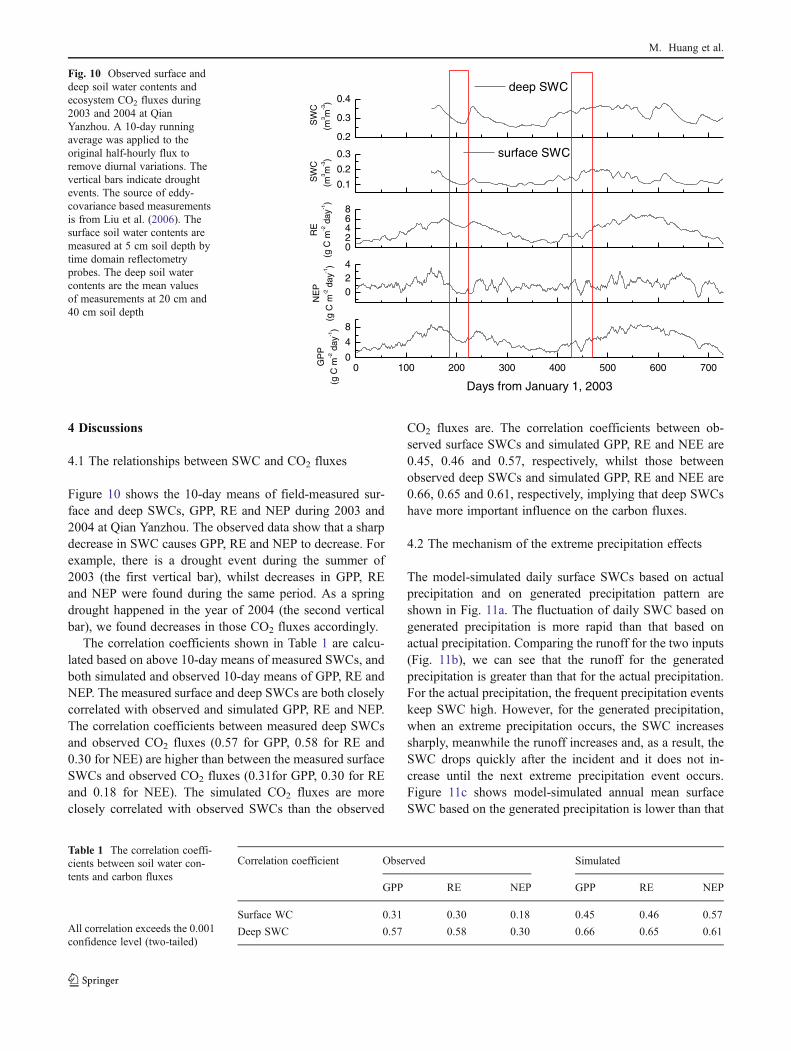
Figure 10 shows the 10-day means of field-measured sur-face and deep SWCs, GPP, RE and NEP during 2003 and2004 at Qian Yanzhou. The observed data show that a sharpdecrease in SWC causes GPP, RE and NEP to decrease. Forexample, there is a drought event during the summer of2003 (the first vertical bar), whilst decreases in GPP, REand NEP were found during the same period. As a springdrought happened in the year of 2004 (the second verticalbar), we found decreases in those CO2 fluxes accordingly.
The correlation coefficients shown in Table 1 are calcu-lated based on above 10-day means of measured SWCs, andboth simulated and observed 10-day means of GPP, RE andNEP. The measured surface and deep SWCs are both closelycorrelated with observed and simulated GPP, RE and NEP.The correlation coefficients between measured deep SWCsand observed CO2 fluxes (0.57 for GPP, 0.58 for RE and0.30 for NEE) are higher than between the measured surfaceSWCs and observed CO2 fluxes (0.31for GPP, 0.30 for REand 0.18 for NEE). The simulated CO2 fluxes are moreclosely correlated with observed SWCs than the observed
CO2 fluxes are. The correlation coefficients between ob-served surface SWCs and simulated GPP, RE and NEE are0.45, 0.46 and 0.57, respectively, whilst those betweenobserved deep SWCs and simulated GPP, RE and NEE are0.66, 0.65 and 0.61, respectively, implying that deep SWCshave more important influence on the carbon fluxes.
4.2 The mechanism of the extreme precipitation effects
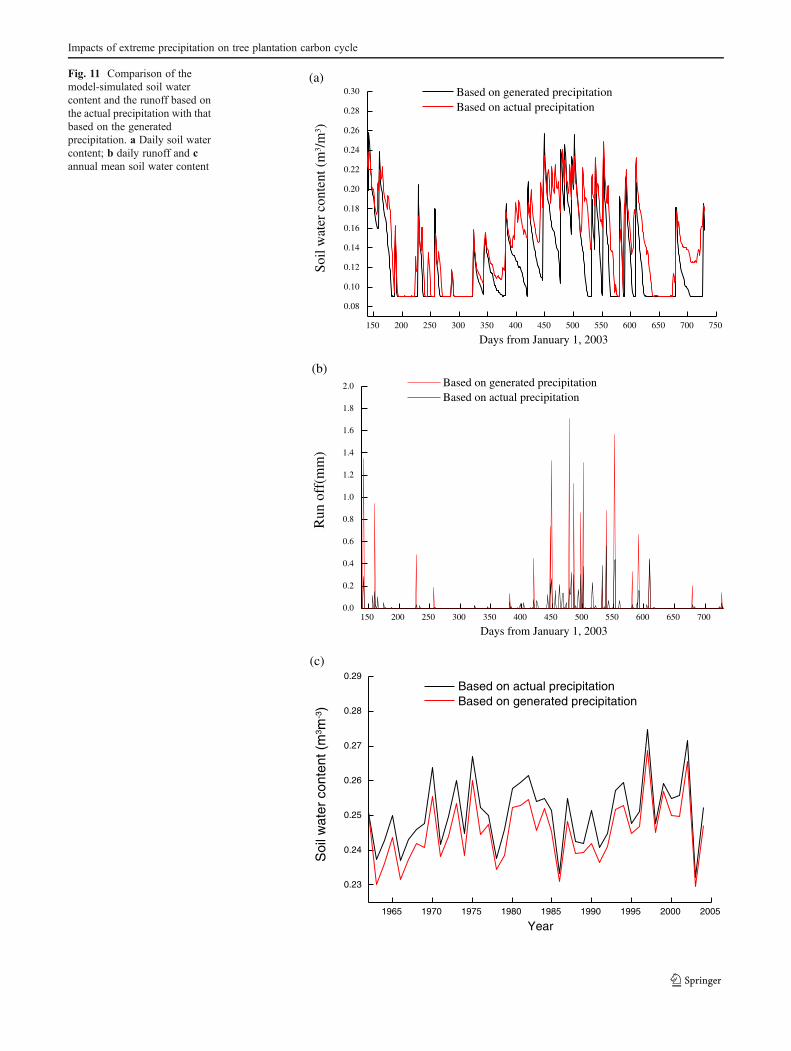
The model-simulated daily surface SWCs based on actualprecipitation and on generated precipitation pattern areshown in Fig. 11a. The fluctuation of daily SWC based ongenerated precipitation is more rapid than that based onactual precipitation. Comparing the runoff for the two inputs(Fig. 11b), we can see that the runoff for the generatedprecipitation is greater than that for the actual precipitation.For the actual precipitation, the frequent precipitation eventskeep SWC high. However, for the generated precipitation,when an extreme precipitation occurs, the SWC increasessharply, meanwhile the runoff increases and, as a result, theSWC drops quickly after the incident and it does not in-crease until the next extreme precipitation event occurs.Figure 11c shows model-simulated annual mean surfaceSWC based on the generated precipitation is lower than that
0 100 200 300 400 500 600 7000
4
8
024
02468
0.1
0.2
0.3
0.2
0.3
0.4
GP
P
(g C
m-2 d
ay-1)
Days from January 1, 2003
N
EP
(g C
m-2 d
ay-1)
RE
(g C
m-2 d
ay-1)
surface SWC
SW
C
(m3 m
-3)
deep SWC
SW
C
(m3 m
-3)
Fig. 10 Observed surface anddeep soil water contents andecosystem CO2 fluxes during2003 and 2004 at QianYanzhou. A 10-day runningaverage was applied to theoriginal half-hourly flux toremove diurnal variations. Thevertical bars indicate droughtevents. The source of eddy-covariance based measurementsis from Liu et al. (2006). Thesurface soil water contents aremeasured at 5 cm soil depth bytime domain reflectometryprobes. The deep soil watercontents are the mean valuesof measurements at 20 cm and40 cm soil depth
Table 1 The correlation coeffi-cients between soil water con-tents and carbon fluxes
All correlation exceeds the 0.001confidence level (two-tailed)
Correlation coefficient Observed Simulated
GPP RE NEP GPP RE NEP
Surface WC 0.31 0.30 0.18 0.45 0.46 0.57
Deep SWC 0.57 0.58 0.30 0.66 0.65 0.61
M. Huang et al.
150 200 250 300 350 400 450 500 550 600 650 700 750
0.08
0.10
0.12
0.14
0.16
0.18
0.20
0.22
0.24
0.26
0.28
0.30
Soil
wat
er c
onte
nt (
m3 /
m3 )
Days from January 1, 2003
Based on generated precipitation Based on actual precipitation
(a)
150 200 250 300 350 400 450 500 550 600 650 7000.0
0.2
0.4
0.6
0.8
1.0
1.2
1.4
1.6
1.8
2.0
Run
off
(mm
)
Days from January 1, 2003
Based on generated precipitation Based on actual precipitation
(b)
1965 1970 1975 1980 1985 1990 1995 2000 2005
0.23
0.24
0.25
0.26
0.27
0.28
0.29 Based on actual precipitation Based on generated precipitation
Soi
l wat
er c
onte
nt (
m3 m
-3)
Year
(c)
Fig. 11 Comparison of themodel-simulated soil watercontent and the runoff based onthe actual precipitation with thatbased on the generatedprecipitation. a Daily soil watercontent; b daily runoff and cannual mean soil water content
Impacts of extreme precipitation on tree plantation carbon cycle

based on actual precipitation during 1962–2004. The SWCwas reduced by 2.1 % under the condition of generatedprecipitation. This result is lower than the experimentalstudy in grassland (Knapp et al. 2002). In the grasslandresearch, the SWC in the upper 30 cm was reduced by11.6 % in altered rainfall plots (six to eight events, meanper events=42 mm) versus actual rainfall plots (30 rainfallevents, mean per events=14 mm).
We calculated the correlation coefficients between theyearly mean surface SWC, and the NPP and NEP over1962–2004. The correlation coefficients between the yearlymean SWC, and the NPP and NEP are 0.917 and 0.904,respectively. They are significant at the 0.01 level (two-tailed). The strong positive correlations suggest that theincrease/decrease of the annual mean SWC would lead verylikely to the increase/decrease of the NPP and NEP. Thelower SWC for the generated extreme precipitation case
could cause decreases of vegetation NPP and NEP, andhence, reductions in the vegetation and soil carbon stock.
4.3 The effects of extreme precipitation on ecosystemcarbon cycle
Our simulation results show that the ecosystem NPP, NEP,vegetation and soil carbon under the generated extremeprecipitation are lower than those under the actual precipi-tation in the studying period. On average, the NPP, NEP,vegetation and soil carbon stock for the generated extremeprecipitation are 4.2, 28, 4.3 and 1.4 % less than the corre-sponding ones for the actual precipitation, respectively.Though the decreases in NPP (4.2 %) and NEP (28 %) arefar less than the annual NPP (−23.6 to +30.6 %) and NEP(−712 to +856 %) variation, we see a systematical changeduring our studying period.
4.4 Longtime effects of extreme precipitation on treeplantation carbon cycle
Our model was spin-up to 500 years using the actual andgenerated precipitation data for 1962 to explore the longtimeextreme precipitation effects. After 500 years, the tree plan-tation almost reaches to its own equilibrium state for eachcase. At the equilibrium state, the plantation NEP is zero foreach case, so the NEP difference is zero. The variation ofsoil carbon stock difference during the 500-year period isshown in Fig. 12a. The soil carbon difference increasessharply during the first 100 years and then rises smoothly.If the generated extreme precipitation lasts for 500 years,then the soil carbon stock will decrease by 0.18 kg C in theend. The variation of vegetation carbon stock differenceover the 500-year period is shown in Fig. 12b. The vegeta-tion carbon stock difference expands in the first 70 years andthen maintains at high value and ends with 0.43 kg C.Considering changes in both the soil and the vegetationcarbon stocks, the ecosystem carbon stock will decreaseby 0.61 kg C for the extreme precipitation case, which is3.3 % of the ecosystem carbon stock.
5 Conclusions
China is facing more and more extreme precipitation events,and in most areas, the increasing rate of heavy precipitationevents is greater than that of the precipitation. We conducteda series of modelling experiments to simulate the likelyeffects of extreme precipitation on the carbon fluxes andstocks of a tree plantation in southern China through shiftingthe moderate precipitation events to extreme precipitationevents. Our results show that the extreme precipitation hasnegative effects on the tree plantation carbon accumulation.
0 50 100 150 200 250 300 350 400 450 5000.0
0.1
0.2
0.3
0.4
Soi
l car
bon(
kg C
m-2)
Year
Soil carbon difference
(a)
0 50 100 150 200 250 300 350 400 450 5000.0
0.1
0.2
0.3
0.4
0.5
0.6
Veg
etai
on c
arbo
n(kg
C m
-2)
Year
Vegetation carbon difference
(b)
Fig. 12 The residues of simulated soil (a) and vegetation (b) carbonstocks based on the actual precipitation minus that based on generatedprecipitation
M. Huang et al.
If the monthly precipitation does not change, shifting mod-erate precipitation events to extreme precipitation eventswill cause the NPP, NEP, vegetation and soil carbon of thetree plantation to decrease by 4.2, 28, 4.3 and 1.4 %, re-spectively, during the period of 1962–2004. If the extremeprecipitation pattern lasts a long time (500 years), the totaltree plantation carbon stock will decrease by 3.3 %.
The observed and simulated CO2 fluxes are positivelycorrelated with soil water content in this plantation. Themechanism analysis shows that the extreme precipitationeffects are caused by the reduction of the plantation soilwater content.
In this study, we assumed that the extreme precipitationevents do not physically destroy the tree plantation, and theresulted changes in tree plantation carbon fluxes and stocksare relatively small. The fact that extreme rainfall alwayscauses landslides, flash floods and crop damage could leadto severer impact on carbon cycle as well as on the society,the economy and the environment.
Acknowledgments This research was supported by the State KeyBasic Research Development and Planning Project (2010CB833503and 2010CB950603) and the National Nature Science Fund (41271118and 40975045).
References
Allan RP, Soden BJ (2008) Atmospheric warming and the amplifica-tion of precipitation extremes. Science 321:1481
Bonan GB, Shugart HH, Urban DL (1990) The sensitivity of some high-latitude boreal forests to climatic parameters. Clim Chang 16:9–29
Botkin DB, Nisbet RA (1992) Forest response to climatic change:effects of parameter estimation and choice of weather patternson the reliability of projections. Clim Chang 20:87–111
Cao M, Woodward FI (1998) Net primary and ecosystem productionand carbon stocks of terrestrial ecosystems and their responses toclimate change. Global Change Biol 4:185–198
Ciais P, Viovy N, Reichstein, Granier A et al (2005) Europe-widereduction in primary productivity caused by the heat and droughtin 2003. Nature 437(22):529–533
Collatz GJ, Ribas-Carbo M, Berry JA (1992) Coupled photosynthesis–stomatal conductance model for leaves of C4 plants. Aust J PlantPhysiol 19:519–538
Coops NC,Waring RH (2001) Assessing forest growth across southwest-ern Oregon under a range of current and future global changescenarios using a process model, 3-PG.Global ChangeBiol 7:15–29
Dan L, Ji J (2007) The surface energy, water, carbon flux and theirintercorrelated seasonality in a global climate–vegetation coupledmodel. Tellus B 59:425–438
Davi H, Dufrêne E, Francois C et al (2006) Sensitivity of water andcarbon fluxes to climate changes from 1960 to 2100 in Europeanforest ecosystems. Agric For Meteorol 141:35–56
Easterling DR, Meehl GA, Parmesan C, Changnon SA, Karl TR,Mearns LO (2000) Climate extremes: observations, modeling,and impacts. Science 289(22):2068–2074
Farquhar GD, Caemmerer S, Berry JA (1980) A biochemical model ofphotosynthetic CO2 assimilation in leaves of C3 plants. Planta149:78–90
Fay AP, Carlisle DJ, Knapp KA, Blair MJ, Collins LS (2000) Alteringrainfall timing and quantity in a mesic grassland ecosystem:design and performance of rainfall manipulation shelters.Ecosystems 3:308–319
Fay AP, Carlisle DJ, Knapp KA, Blair MJ, Collins LS (2003)Productivity responses to altered rainfall patterns in a C4-dominated grassland. Oecologia 137:245–251
Fay AP, Kaufman Md, Nippert BJ, Carlisle DJ, Harper WC (2008)Changes in grassland ecosystem function due to extreme rainfallevents: implications for responses to climate change. Glob ChangBiol 14:1600–1608
Goswami BN, Venugopal V, Sengupta D, Madhusoodanan MS, XavierPK (2006) Increasing trend of extreme rain events over India in awarming environment. Science 314:1442
Granier A, Bréda N, Biron P, Villette S (1999) A lumped water balancemodel to evaluate duration and intensity of drought constraints inforest stands. Ecol Model 116:269–283
Huang M, Ji J, Li K, Liu Y, Yang F, Tao B (2007) The ecosystemcarbon accumulation after conversion of grasslands to pineplantations in subtropical red soil of South China. Tellus59B:439–448
Ji JJ (1995) A climate–vegetation interaction model: simulating phys-ical and biological processes at the surface. J Biogeogr 22:2063–2069
Ji JJ, Huang M, Li KR (2008) Prediction of carbon exchanges betweenChina terrestrial ecosystem and atmosphere in 21st century. SciChina Ser D: Earth Sci 51:885–898
Knapp KA, Fay AP, Blair MJ, Collins LS et al (2002) Rainfall vari-ability, carbon cycling, and plant species diversity in a mesicgrassland. Science 298:2202–2205
Li ZP, Wang XJ (2000) Analysis and devaluation of soil organic matterdynamics at a little region scale (In Chinese). Sci Geograph Sin20(2):45–50
Liu YF, Yu GR, Wen XF, co-authors (2006) Seasonal dynamics of CO2
fluxes from sub-tropical plantation coniferous ecosystem. SciChina Ser D 49(II):99–109
Lu J, Ji J (2006) A simulation and mechanism analysis of long-termvariations at land surface over arid/semi-arid area in north China.J Geophys Res 111(D09306):1–19
McGuire AD, Joyce LA, Kicklighter DW, Melillo JM et al (1993)Productivity response of climax temperate forests to elevatedtemperature and carbon dioxide: a north American comparisonbetween two global models. Clim Chang 24:287–310
Parton WJ, Schimel DS, Cole CV, Ojima DS (1987) Division S-3-soilmicrobiology and biochemistry. Analysis of factors controllingsoil organic matter levels in great plains grasslands. Soil Sci SocAm J 51:1173–1179
Reichstein M, Tenhunen J, Roupsard O et al (2003) Inversemodeling of seasonal drought effects on canopy CO2/H2Oexchange in three Mediterranean ecosystems. J Geophys Res108(D23):4726
Solomon AM, Bartlein PJ (1992) Past and future climate change:response by mixed deciduous–coniferous forest ecosystems innorthern Michigan. Can J For Res 22:1727–1738
Impacts of extreme precipitation on tree plantation carbon cycle