impacts of covid-19 and desert locusts on smallholder
TRANSCRIPT

Impacts of COVID-19 and Desert Locusts on Smallholder Farmers Food Systems and Value Chains in Kenya
Reporting period: March - August 2020
Odhiambo, K., Lewis, J., Tefera, N., Thomas, A., Meroni, M., Dimou, M., Rembold, F.
EUR 30628 EN
2021

This publication is a Science for Policy report by the Joint Research Centre (JRC), the European Commission’s science and knowledge service. It aims to provide evidence-based scientific support to the European policymaking process. The scientific output expressed does not imply a policy position of the European Commission. Neither the European Commission nor any person acting on behalf of the Commission is responsible for the use that might be made of this publication. For information on the methodology and quality underlying the data used in this publication for which the source is neither Eurostat nor other Commission services, users should contact the referenced source. The designations employed and the presentation of material on the maps do not imply the expression of any opinion whatsoever on the part of the European Union concerning the legal status of any country, territory, city or area or of its authorities, or concerning the delimitation of its frontiers or boundaries. Contact information Name: Felix Rembold Email: [email protected] EU Science Hub https://ec.europa.eu/jrc JRC123842 EUR 30628 EN
PDF ISBN 978-92-76-32073-9 ISSN 1831-9424 doi:10.2760/66626
Luxembourg: Publications Office of the European Union, 2021 © European Union, 2021 The reuse policy of the European Commission is implemented by the Commission Decision 2011/833/EU of 12 December 2011 on the reuse of Commission documents (OJ L 330, 14.12.2011, p. 39). Except otherwise noted, the reuse of this document is authorised under the Creative Commons Attribution 4.0 International (CC BY 4.0) licence (https://creativecommons.org/licenses/by/4.0/). This means that reuse is allowed provided appropriate credit is given and any changes are indicated. For any use or reproduction of photos or other material that is not owned by the EU, permission must be sought directly from the copyright holders. All content © European Union, 2021 How to cite this report: Odhiambo, K., Lewis, J., Tefera, N., Thomas, A., Meroni, M., Dimou, M., Rembold, F., Impacts of COVID-19 and Desert Locusts on Smallholder Farmers Food Systems and Value Chains in Kenya , EUR 30628 EN, Publications Office of the European Union, Luxembourg, 2021, ISBN ISBN 978-92-76-32073-9, doi:10.2760/66626, JRC123842.

1
Contents
Abstract ...................................................................................................................................................................2
Acknowledgements .................................................................................................................................................3
Executive summary .................................................................................................................................................4
1 Introduction .......................................................................................................................................................8
1.1 Survey Background ...................................................................................................................................8
1.2 Purpose of the study .................................................................................................................................9
1.3 Kenyan Context .......................................................................................................................................10
2 Data Design and Methodology ........................................................................................................................11
2.1 Consultation with key Informants ...........................................................................................................11
2.2 Smallholder Farmers telephone Survey ..................................................................................................12
3 Empirical Results .............................................................................................................................................15
3.1 Main livelihoods characteristics and crops grown ..................................................................................15
3.2 Impact of COVID-19 on Input and Output Markets ................................................................................19
3.3 Impact of Floods and Desert Locusts ......................................................................................................25
3.4 Impacts of COVID-19 on Food Security and Diversity of the Respondents. ............................................29
3.5 Satellite Imagery Analysis .......................................................................................................................30
4 Conclusions ......................................................................................................................................................37
5 Policy Recommendations ................................................................................................................................39
References ............................................................................................................................................................41
Glossary .................................................................................................................................................................42
List of figures .........................................................................................................................................................43
List of tables ..........................................................................................................................................................44
Annex A .................................................................................................................................................................45
Annex B – Survey methods ...................................................................................................................................48
Annex C .................................................................................................................................................................49

2
Abstract
The study analyses impacts of multiple stressors including floods, COVID-19 and desert locusts on agri-food value-chains in Kenya’s main agricultural areas during the 2020 long rains season. While 76% of farmers reported negative impacts of COVID-19 on their primary income source, only 16% reported losses due to desert locusts.

3
Acknowledgements
The authors would like to acknowledge the numerous farmers and interviewers who have made the survey possible in Kenya. We would also like to thank the colleagues who helped reviewing or provided comments to the concept and to the draft report and in particular: Tharcisse Nkunzimana, Darrell Sexstone, Myra Bernardi and Stephen Wathome.
The survey was funded under the Administrative Arrangement between DG DEVCO and the JRC: “Technical and scientific support to sustainable agriculture, food & nutrition security and food systems (TS4FNS)”.
Authors
Odhiambo, K. and Lewis, J, agriBORA, Robert-Bosch Straße 7, Darmstadt Germany
Tefera, N., Thomas, A., Meroni, M., Dimou, M., Rembold, F., Joint Research Centre of the European Commission

4
Executive summary
Kenya has been hit by multiple shocks throughout 2020: the economy has been significantly affected by the
COVID-19 pandemic and the containment measures introduced by the government, such as the restrictions on free movement of people, goods and services that have had a great impact on agricultural and food supply chains. Moreover, desert locust invasions have occurred since December 2019, followed by major floods between May and June 2020. Understanding the impacts of these multiple stressors on agriculture, food systems and rural livelihoods is key to define adequate instruments to mitigate the effects on the economy and on food security.
The study examines the impact of COVID-19 and its containment measures, as well as of floods and desert locusts, on the smallholders food system using a telephone survey conducted in August 2020 with 1,026 smallholder farmers in 19 counties of the main crop producing regions in Southwestern and Central Kenya, complemented with about 40 follow-up field visits where locust damage was reported, as well as with consultations from 20 agro-dealers and 15 aggregators or agro-processors. The survey will be repeated during three consecutive cropping seasons: July-August 2020, November -December 2020 and July-August 2021. This report is based on the first of this series of three surveys being conducted thanks to a research collaboration between the Kenyan-German digital service start-up agriBORA and the European Commission Joint Research Centre (JRC).
The study benefits from direct contact with individual farmers and other value chain actors to obtain quantitative and qualitative insights. Each interview lasts for around 30 minutes to provide insights about farm activities and multiple challenges farmers faced during the pandemic period. The study focuses on the impact across the entire value chain for the inputs providers to the smallholders farmers and their (economic) welfare. The impact of the stressors on the food security of the smallholders farmers is part of the study. However, to keep the overall length of the questionnaire limited, the standard food security and nutritional indicators, such as the SDG2 indicators or the standard acute food security indicator used by the IPC or the UN agencies (FAO, WFP) could not be fully included in the phone survey. The priority was put on collecting indicators on the agricultural activity of households and impact of COVID-19 and desert locusts. In addition, the survey did not include potential differential effects by gender. Furthermore, the respondents are representative only for farmers in the agriBORA database representing selected value chains. However, the farmers network was spread across the main cropping regions of the country and the value chains captured during the survey are varied enough to give a good picture of the situation in the main food production areas. Key informant interviews (i.e., with agro-dealers, aggregators and agro-processors) were purely qualitative based on the selected interview partners and their experience and led to some valuable insights that helps to better understand challenges impacting farmers’ access to inputs.
Policy context
Food and nutrition security in the East African region continue to be challenged by multiple stressors including conflicts, economic downturn and climate extremes. As shown by the 2020 Global Report on Food Crises, 3 out of 10 countries with the largest food crises are in this region (Ethiopia, South Sudan and Sudan). Since late 2019 the pressure on these highly vulnerable food security and nutrition situations further increased due to the extraordinary invasion and breeding of desert locusts. The COVID-19 health and economic crisis and the related containment measures are a further stressor.
With small scale farmers being an important target of the EU’s development and food security policies, understanding the impact of the exceptional combination of stressors on their livelihoods and the implications on agri-food value chains becomes more important than ever. The Green deal’s Farm to Fork strategy and the Comprehensive strategy for Africa aim at strengthening and making food systems in the continent more efficient and sustainable and increasing their resilience to multiple shocks is central.
The EC also supports the role of STI (Science Technology and Innovation) in international cooperation and the important role of new technologies (i.a. Information and Communications Technology) in relation to achieving the Sustainable Development Goals is increasingly recognized. This survey provides an opportunity to use such innovative technologies in collaboration with an African-European start-up and to test how quickly and efficiently information about the impact of multiple stressors on rural food systems can be retrieved and made available. A similar study has been launched in West Africa (Ivory Coast and Senegal) by JRC D4 and it will be interesting to have comparable results for an East African country.

5
Key conclusions
The survey has shown impacts of COVID-19 on smallholder farmers in major crop growing regions in Kenya spanning the entire agricultural sector. The associated public health mitigation measures introduced by the government in mid-March 2020 to prevent further spread of the virus — particularly lockdowns, stay-at-home orders and the closing of borders and public spaces such as markets and schools —have negatively impacted livelihoods of many smallholder farmers, and activities of agro-dealers, aggregators and agro-processors.
The containment measures affected farmers due to lack of timely access to farm inputs, in particular to seeds and fertilizer, increased input costs and difficulties in accessing output markets for their harvest. While these challenges were most prominent during the March-June 2020 period, when the government measures had the maximum effect, they also persisted between July and August 2020, when farmers were harvesting and seeking markets for their crops. Decreasing household income due to job losses, reduced revenues from farming or other income generating activities as well as increase in price of food and low yields and/or grain quality experienced by farmers, contributed to reduced food access and reductions in both quantity and quality of food consumed by the smallholders farmers during the pandemic period. The situation improved during the harvesting period as from July 2020. However, the food reserves of most households in August 2020 covered less than three months of consumption.
The above average rainfall during the long rains season in most areas of the country led to good growing conditions but also resulted in major floods on lake shores and riverine areas. The floods have affected crop fields of many farmers resulting in yield loss or low quality of produced commodities. Minimal flood impact on livestock was reported.
While the Horn of Africa has suffered the worst desert locust invasion in decades, the survey has shown that the impact of the desert locusts on the investigated five crops in the sampled counties, which include Kenya’s most important production regions, was quite low. The findings confirm that the forecasted worst case scenario of desert locusts causing major crop losses during the long rain season, which had been of concern to the country in early 2020, has not materialized because the desert locust invasions did not reach the most productive areas. Also, in areas that have been affected by desert locusts it is assumed that the positive effect of the exceptional rainfall on both crop and rangelands in March-May 2020 has to a large extent prevailed on the negative impact of desert locusts. The hypothesis is corroborated by the results of the remote sensing analysis which has not found clear signals of biomass decrease that can be attributed to desert locusts. The survey managed to collect GPS points and photographs of affected fields including maize, sorghum, pigeon peas, okra, green grams and Napier grass fields. However, no clear traces of locust damages were found at the time of survey, as most fields were at maturity stage or had already been harvested. In addition, we were not able to confirm the severity of the infestation reported by a number of farmers with the remote sensing analysis. The survey also revealed that apart from desert locusts, the fall armyworm pest was affecting many maize farmers in the country.
This farmers survey working with agricultural digitalization pioneers like agriBORA could be organized quickly and was flexible in terms of adapting questionnaires specific to survey needs. Such surveys are a valid tool for COVID-19 impact assessment on food value chains and can be repeated easily in time (eg. for different waves). The survey has been successful in reaching and engaging farmers quickly and in representative numbers.
Main findings
The findings confirm significant drops in income for smallholder farmers as well as disruptions in access to agricultural inputs such as seeds, fertilisers and chemicals (herbicides, pesticides, fungicides) and output markets for many farmers, as also revealed by recent studies in Kenya and neighbouring East African countries1. About 76% of farmers reported impacts of COVID-19 pandemic containment measures with direct consequences on their primary income source (crop farming). Lack of access to farm inputs, drastic reduction in sales, low market prices for harvested crops, high cost of transport and difficulty in accessing markets are among the major constraints linked to the COVID-19 containment measures and their consequences. Loss of secondary income
1 FAO, July 2020. Impact of COVID-19 on agriculture, food systems and rural livelihoods in Eastern Africa: Policy and
programmatic options. https://reliefweb.int/sites/reliefweb.int/files/resources/CB0552EN.pdf

6
due to movement restrictions and business closure, as well as low yields resulting from lack of adequate inputs, floods and desert locusts have also jeopardized both quantity and quality of households’ food consumption during the pandemic period. Those impacts are observed across all crops/values chains even if some of them could be more impacted. For example, the fertiliser shortage was especially deep for the tea value chain at the agro-dealer level. Smallholder farmers operating under contract were also affected by the drop in demand and prices changes. About ⅓ of them had to close their contracts or renegotiate the terms of the contracts because of the pandemic.
The early onset of rains and above-average rainfall since February 2020 helped land preparation and planting activities for the long rain season across the country and were generally beneficial to agricultural production. On the other side, the abundant rains also caused localized flooding and river overflows, mainly during the months of March - May 2020, causing casualties, infrastructure damage, and crop damage in parts of the country. The above average rainfall also created favourable conditions for further spread of desert locusts, providing suitable breeding conditions and abundance of vegetation growth for feeding across the country. Contrarily however to major fears about major crop losses due to Desert Locusts, that had dominated early warning information in early 2020, the survey results show that the impact of the desert locusts on crop production during the 2020 long rains was low, as the main cropping regions of the country were eventually not infestation hot spots. 43% of the farmers concerned used some form of treatment of their fields against locusts and control measures by the Kenyan government and international organisations were generally perceived as adequate by the interviewed agro-dealers and agro-processors.
More than 90% of the farmers surveyed have planted maize during the long rains season 2020. We also noticed a shift in the type of crop planted with a significant increase of maize planting. While growing maize is a typical activity for most smallholder farmers in Kenya, the surge in maize planting seems to be a coping strategy in response to the difficulty to access inputs and markets, as maize is less demanding for inputs and other essential resources as compared with other crops. Availability of more labour force due to those who lost jobs in urban areas and return to rural areas also lead to increase maize farming.
During the survey, smallholder farmers as well as agro dealers and agro processors reported shortage of cash/credit and requested for cash support in the form of loans or subsidies to afford buying essential inputs for the next agricultural season (October to December 2020). At the time of the survey in August 2020, only 11% of the farmers could access farm loans and/or subsidy incentives.
While we have limited information on the actual food security and diet quality of the smallholder farmers, food security is the main concern for most of the respondents. About 38% of the respondents perceived their status as food insecure households (do not have food stock for consumption). Furthermore, although about 62% of the respondents have food stock for consumption, only 28% of them have stock that can last for more than three months per a year. About a quarter of them have limited stock that can last within less than a month and about half of them within 2 or 3 months in a year. Majority of them were forced to reduce either quantity or quality of their food consumption during March to June 2020 to retain some of their stock for future consumption. During the June to August 2020 period, with the harvest, the food consumption resumed to its usual pattern for a bit less than 60% of the farmers while 40% of them still have a reduced quantity and quality of their diet compared to usual. The reduction of food consumption disproportionally affects the population with low incomes.
Related and future JRC work
The 2020 crop production was not as severely affected as expected by multiple stressors including COVID-19 pandemic, floods and desert locusts and the abundant rainfall led to a close to average production in the main agricultural areas. However, in the case of low or irregular rainfall, the impact of COVID-19 on food production could be much more severe than during the 2020 long rains. Moreover, the continuation of the COVID-19 pandemic with its detrimental effects on the economy is expected to have negative impacts on food production which go beyond the 2020 long rains season. The next two phases of the study will be key in understanding the impacts of the prolonged pandemic effects on small scale farmers. These studies will add information to the JRC’s continuous agricultural hotspots monitoring which is carried out as part of the Anomaly hotSpots of Agricultural Production system (https://mars.jrc.ec.europa.eu/asap/) and will support food security assessments in the East Africa Region in general.
The increased shift towards maize cultivation should be further investigated. The 2020 above average maize production to some extent might have been obtained at the expense of crop diversity and shifts from cash crops

7
to staple crops. With the constantly worrying nutrition situation in Kenya, the quantity versus quality aspect could be an important factor to look at. Planting of vegetables and diversified food crops should be further supported.
It was difficult to trace desert locusts during the field surveys as most fields were at maturity stage or had just been harvested and the pest traces obtained could not be fully attributed to desert locusts. Better timing of field visits will be necessary during the next two phases of the survey to collect improved information about Desert Locusts impacts on green crops. We also recommend more efficient ground data collection from the early stages of the invasion and renewed strengthening of the DL early warning systems, which in the East African region have partially become obsolete and understaffed over time during the years with little invasions. Satellite data derived information has not yet proven to make the difference in locusts swarms monitoring nor in impact assessment, but this is to some extent due to lack of high-quality ground information. The JRC will continue to assess the potential of different Earth Observation data and methods for improved desert locusts impact monitoring.
Since the economic effects of COVID-19 are not limited in time to a single crop season, the negative impacts for example on access to farming inputs are expected to extend to the next seasons, leading to a progressive erosion of crop diversity and product quality. With the repetition of the survey during the next two crop seasons the study will focus on those protracted effects of the pandemic as well as looking more in detail at some specific aspects. The questionnaires will be further improved in order to include some more food security information and in order to improve the quality and timing of the desert locust information. The latter will of course also depend on the dynamics of further desert locusts breeding in the region.
The results integrate the earlier JRC macro-economic modelling analysis by Nechifor et al., 2020 and the questionnaire development has been aligned with a similar study carried out simultaneously by JRC D4 in Ivory coast (Tillie et al., 2020).

8
1 Introduction
1.1 Survey Background
Agricultural communities in East Africa have suffered from a series of stressors since early 2020, including the outbreak of the COVID-19 pandemic, floods, plagues of desert locusts, and fears about increasing food insecurity. Monitoring the impacts of these stressors on the smallholder farmers food system is challenging due to several constraints in accessing information, both from farmers and from all other actors engaging in the food system value chains.
The outbreaks of COVID-19 pandemic and desert locust invasion are a very recent phenomenon. The pandemic first appeared in China, in December 2019, and rapidly spread to Asia, Europa, America, and the rest of the world. More than 61 million people were tested positive in more than 185 countries, including more than 1.4 million deaths, when this report is organized. The outbreak of the virus attests to global health, supply, demand, and financial shocks at a time, and containing the transmission of the virus becomes a global challenge, requiring coordinated efforts among governments, nations, and businesses, as well as various stakeholders.
The world had also experienced a limited number (8 events) of desert locust infestations in the last 50 years although there were exceptional events in 2018 and 2019 in the Arabic Peninsula and then in remote areas of the Africa Red Sea coast (Meynard et al., 2020). However, early in December 2019, FAO (2020) reported locust upsurges in East Africa that have been the worst in the last 70 years in Kenya, as well as in the last 25 years in Ethiopia and Somalia. During the early stages of the infestation, major cropping areas in the region had not been severely affected, as most of the crops had either already been harvested or were in the last stage of maturity (FSNWG, 2020). However, unexpected heavy rains, in Eastern Ethiopia and Somalia in early December 2019, allowed swarms breeding conditions to remain favorable through June 2020. The swarms in Ethiopia, Kenya and Somalia bred, gave rise to substantial hopper bands in March and a new generation of swarms in April and then another new generation of immature swarms in about mid-June to July (near the end of cropping seasons in most areas in the region). In early 2020 there were widespread fears about a possible worst scenario desert locust invasion of the region’s main agricultural areas, including Kenya’s cereal baskets in Western and Central Kenya. In order to better understand the impact of desert locust on agricultural activities (cropping and livestock rearing), the Food Security and Nutrition Working Group (FSNWG, 2020) conducted a telephone survey in June/July 2020, using a randomly selected 10,831 agricultural respondents across desert locust affected areas of Ethiopia, Kenya, Somalia, and Uganda. The results show roughly about a third of them experienced desert-locust related pasture or crop losses. Furthermore, about half of those who experienced desert locust perceived losses to their crops and rangeland as high or very high. Desert locusts were also causing emotional stress, environmental impacts, increased food insecurity or malnutrition, and animal health issues.
The COVID-19 and desert locust crises are simultaneously complemented with floods, insecurity and economic related issues in most developing countries including Kenya. Moreover, the economy of the country has been adversely affected following the COVID-19 containment measures the government had implemented since mid-March 2020. In the effort to have a better understanding of the combined impact of COVID-19 and desert locusts, agriBORA, used its farmers database built in the past three years, and carried out a limited scope of smallholder farmers survey in May 2020. A team of 16 enumerators were deployed on 12th-13th May 2020, and a digital survey was completed for 194 respondents across 10 counties in Kenya. The findings provide some insightful outcomes on loss of farmers crop production and income generating activities, adopted coping strategies and impacts on the staple foods system. Desert locusts affected maize, sorghum, vegetables and cowpeas at either germinating, late stage of maturity or harvesting of the 2019/2020 short rains crop. While the majority of respondents experienced the invasion of desert locusts at a late stage of maturity or harvesting (of the 2019 short rains), thereby limiting losses, about 20% reported locust invasion at stages of germination (of
the 2020 long rains) that led to almost a total production loss2. The COVID-19 containment measures adversely affected farming activities too. Besides lack of access to seed and fertilizer, land preparation was also delayed due to the self-distancing protocol imposed by the government.
2 agriBORA (2020). Report on Impact of Desert Locust (and COVID-19) on Livelihoods in Selected Kenyan Counties. Initial
draft B.

9
The European Commission Joint Research Centre (EC-JRC) supported the extension of the study in three consecutive crop growing seasons, (July-August 2020, November-December 2020 and July-August 2021) in the effort to better understand the impacts of COVID-19 and desert locust invasion through interviewing the same households over three crop growing seasons. This report is based on the first phone survey (July-August 2020). In addition to extending the survey to a larger number of farmers and to other value chain actors, the EC-JRC included desert locusts impact field data collection among the objectives of the survey. This was driven by the experience that until mid-2020 there was only limited evidence of deserts locust impacts on vegetation based on Earth Observation analysis and one of the main reasons for that gap was the lack of ground observations to validate satellite observations. The satellite imagery, commonly used for monitoring biomass, could not be extensively used for desert locust emergency in 2020 due to biomass anomaly attribution problems, as detecting a decrease of biomass during an exceptionally green season and wet rainy season are difficult. In discussions with remote sensing experts of UN agencies and development partners throughout summer 2020, it was confirmed that more and better field data on direct impacts on vegetation is crucial in order to quantify the impact on crops and rangeland with the use of remote sensing.
1.2 Purpose of the study
The study is designed to assess impacts of COVID-19 containment measures and biophysical factors limiting agricultural production such as desert locusts and floods on food system value chains of smallholder farmers in Kenya. The analysis is based on quantitative information collected via phone interview from a randomly selected
1,026 smallholder farmers in 19 counties supplemented with qualitative consultation of key informants from 20 agro-dealers and 15 aggregators/agro-processors obtained from agriBORA’s networks and database (Table 1). While agro-dealers supply farmers with seeds, fertilisers and chemicals such as herbicides, pesticides, and fungicides; aggregators and agro-processors engage in buying and processing harvested crops. The study focuses on five main crops and six value chains: maize (contracted and non-contracted), sorghum, Irish potatoes, tea and sunflower. These crops are the main sources of income and food security of smallholder farmers in Kenya. In the case of maize, there is a distinction between “contracted” (the farmers that have a contract to deliver harvested output) and “non-contracted” (where the farmers have no such contract). The telephone interviews were supplemented with about 39 field visits planned as follow-up in areas where locust damages are reported.
This study extends the scope of similar studies on the impact of COVID-19, such as the “60_Decibels”3 and the
“Precision Agriculture for Development4 (PAD)”, from agro-dealers and farmers perspective in Kenya with
inclusion of relevant consumer markets, as well as capturing information on impact of floods and desert locusts on smallholder farmers’ crop production. It was also launched simultaneously with a similar study organized by the JRC in collaboration with partners in Ivory Coast and there has been close coordination for to the
development of the questionnaire.
Table 1. Summary of Key Points of the Survey
Descriptions N
Consecutive growing seasons to be covered in the survey. 3
Main crop types surveyed. 5 Value chains (or strata) addressed. 6 Number of counties surveyed. 19 Agro-dealers, aggregators and agro-processors interviewed prior to the farmer survey. 35 Number of field visits following telephone interviews. 39 Sample smallholder farmers interviewed via telephone. 1026
Source: Authors’ computation from August phone survey
The survey also involved field visits to collect GPS positions of affected fields and photographs showing traces of the desert locust invasion. About 4% of farmers were revisited during the exercise. The study also aims to provide
3 Source: https://app.60decibels.com/COVID-19/agriculture#explore
4 Source: https://precisionag.org/COVID-19-dashboard-2-0/#more-1181

10
information supporting use of satellite data analysis in assessing damage caused by desert locusts. The collected information will be made available to the WFP-FAO’s Desert Locust Damage Assessment Working Group.
1.3 Kenyan Context
Agriculture contributes for 30% of Kenya’s GDP5 and is the main source of income for more than 75% of the
rural population; over 18 million6 Kenyans earn income from agriculture. The importance of the sector in the country’s economy has been emphasized through Kenya Vision 2030, the Medium-Term Plan III, and most recently through the President’s Big Four priority agenda for 2017-2022, which emphasizes its dominance in food and nutrition security for all Kenyans.
The outbreaks of the COVID-19 pandemic happened during a critical period in the agricultural cycle, the planting season, which coincides with the on-set of the March-April-May (MAM) 2020 long rains. The associated public health mitigation measures introduced by the Kenyan government in mid-March 2020 — particularly lockdowns, stay-at-home orders and closing of public spaces such as markets, schools, religious institutions, and borders — to prevent further spread of the virus, had a great impact on livelihoods and businesses in both government and private sectors. The nationwide overnight curfew between 7pm – 5am introduced on 27th of March and the directive to public transport vehicles to operate at 60% capacity are among the measures taken by the government that have had substantial impact on movement of people and goods within the country between April and June. Apart from the national government’s containment efforts of the COVID-19 pandemic, worldwide travel bans, and restrictions have adversely affected supplying inputs and exporting crop outputs and led to
workforce reduction7;8. As of June 2020, some of the restrictions put in place were eased as the country’s infections appeared to reach a manageable level and containment measures focused on hotspots such as counties of Nairobi, Mombasa, Kilifi and Kwale. Curfew hours were adjusted to run between 9pm and 4am to enable businesses thrive for more hours. The restrictions on free movement of people, goods and services – a key enabler in any market – have had a great impact on businesses and huge ramifications on producers, buyers, sellers, consumers and consequently vulnerable households that depend on markets for their livelihoods. According to Nechifor et al., 2020, the April-June lockdowns in Kenya and abroad would lead to the country’s economic slowdown by 5.6% and employment by 11.8%, as compared to the projected pre COVID-19.
Households welfare could also be expected to decrease by 7.9% and 6.8% in rural and urban areas, respectively.
Furthermore, farmers have also faced locust invasion and extreme flooding in some regions. Abundant rains have promoted the breeding and development of desert locusts and protracted the locust outbreak across the
region9, which continues to pose a significant threat to food security. The floods have impeded farm inputs provision, delayed land preparation and swamped cropland, and then expected to worsen food insecurity. Efforts to tackle one crisis have sometimes been hampered by measures to curtail another. The business of growing food and moving them to markets has become increasingly difficult and this has in turn posed a twin threat of exacerbating poverty and hunger in vulnerable populations.
5 Kenya Economic Survey 2017, KNBS , July 2017; Quarterly Gross Domestic Product Report 2017 Q1 Statistical Release,
KNBS, July 2017.
6 Modelled ILO estimate. Employment is defined as persons of working age, who are engaged in any activity to produce
goods or provide services for pay or profit, ~28 million Kenyans are employed by this definition.
7 Roussi, A. 2020. Kenya farmers face uncertain future as COVID-19 cuts exports to EU. Financial Times, June 4, 2020. (also
available at https://www.ft.com/content/05284de8-c19f-46de-9fe7- 482689be364b).
8 FAO, July 2020. Impact of COVID-19 on agriculture, food systems and rural livelihoods in Eastern Africa: Policy and
programmatic options. https://reliefweb.int/sites/reliefweb.int/files/resources/CB0552EN.pdf
9 “Eastern Africa Region (2020). Floods and Locust Outbreak Snapshot (May 2020).” Reliefweb, May 11, 2020.
https://reliefweb.int/report/ethiopia/eastern-africa-region-floods-and-locust-outbreak-snapshot-may-2020

11
2 Data Design and Methodology
2.1 Consultation with key Informants
Agro-dealers, aggregators and agro-processors are the “key informants” consulted to better understand the distributional impacts of stressors along identified value chains with possible market disruptions. The informants were selected from the agriBORA database and represent input dealers (fertilizers, seeds and chemicals such as herbicide, pesticides, fungicide etc.,) and output aggregators (collecting products and delivering to the markets) of agricultural products. The selections were based on their knowledge of the Kenyan agri-value chain, existing engagements and relationships with smallholder farmers and their distribution across the country. Figure 1 and Table 2 present geographic locations and number of selected key informants consulted respectively. These include 20 agro-dealers and 15 aggregators or agro-processors.
Table 2. Numbers of aggregators and agri- processors Consulted
Crop # of Agro-dealers # of Aggregators/Agro-processors
Maize (contracted and non-contracted)
7 4
Sunflower 3 3 Sorghum 5 3 Irish Potatoes 3 3 Tea 1 2
Total 20 15
The interview guidance for key informants of agro-dealers and aggregators/agro-processors were independently designed in the form of questionnaires and the responses were recorded and the follow up questions were documented during the consultation period. Since the purpose of consultation was to explore issues for better understanding on the impact of multiple stressors, the responses were used as basis for additional unstructured questions aiming at obtaining general descriptive information about issues such as combined impact of COVID-19 and desert locusts, most affected crops, and qualitative comparison with previous seasons/years and the effects of confinement measures, on import or trade slowdowns, changes in input prices and demand for farmers inputs. For the selection, the target was to reach at least one agro-dealer and agro-processor per county, so for examples for the agro-dealers we called around 230 in total, to achieve the 20 complete interviews.

12
Figure 1. Counties of Agro-processors Interviewed (agro-dealers work also in: Kiambu, Kajado, Murang’a and Narok)
2.2 Smallholder Farmers telephone Survey
The smallholder farmers survey was designed to undertake quantitative assessment on the impact of the COVID-19 pandemic and associated restriction measures, floods and desert locust invasion on their agricultural activities such as production and income sources, food value chains including input and output marketing, as well as on household food consumption and food availability. The survey also collected basic information on general characterstics of respondents such as age and gender of respondents, their livelihoods, and food security status and livestock ownership, as well as main sources of drinking water. agriBORA designed survey questionnaires in collaboration with experts from JRC with an effort to make the questionnaires complementary to and comparable with other surveys implemented in other African countries, for example the WFP’s mVAM surveys, or the JRC survey about COVID-19 impact on rural households in Côte d'Ivoire. The farmers database used, has been setup over the last three years by agriBORA. Farmers subscribe (via SMS) to services offered by agriBORA including access information to markets (inputs and outputs) and agro weather advisories. Most entries in the database have been a result of radio/SMS advertisements promoting the agroweather advisory of both agriBORA and KALRO’s Kenya Agricultural Observatory Platform (KAOP). In addition, agriBORA works with local producer organisations who represent large numbers of farmers and use the digital platform to manage the communication process with individual farmers. The database can be expected to represent typical smallscale farmer households in Kenya’s main crop growing areas, who have access to radio and own a mobile phone capable of basic SMS functionality.
The survey uses a two-pronged approach. Firstly, sample farmers were randomly selected from the agriBORA farmers database, built in the past three years, and interviewed via phone. The phone survey was targeted to run for a maximum of 30 minutes to ensure higher completion rates within a short time. Secondly, those farmers who experienced desert locust infestation on their fields and traced locust infestation, were requested to have appointment for field visits with enumerators to collect photographs and GPS data of affected fields, landscape photographs of the area, as well as close-up photos of the crops showing traces of desert locusts. Estimates of the extent of the field with the same crop type or grassland were made in the four cardinal directions (north, south, east and west) including recording of information on percentage damage (where crop was still present)

13
up to 50 meters from the recorded point in the four cardinal directions. A control farm within a 5 km radius with similar crop type or grassland but not affected by desert locusts was visited and data was collected, as much as possible. The farmers affected by desert locusts according to phone surveys also helped to identify other affected farmers through suggestions made by interviewed farmers. This had a “snowball effect” for the data collected through 39 field visits.
It is a rapid appraisal survey targeting a sample of 1,000 randomly selected farmers participating in 6 value
chains10 (maize (contracted and non-contracted), sorghum, sunflower, tea and Irish potatoes) from a total of about 43,000 farmers registered in agriBORA platform, with additional 29 farmers drawn through the “snowball
effect” method, from 19 counties in Kenya11. The sample farmers are drawn in a two-stage sampling technique.
In the first stage, spatially distributed total number of farmers participating in each value chain are identified from the list of agriBORA platform. The targeted sample size from each county for identified value chains are then computed using a proportion of farmers in each county for identified value chain to total number of farmers participating in the value chains. In the second stage, sample farmers for identified value chain are randomly
drawn from wards (level 3 administrative units) of each county. Finally, a total of 1,026 sample farmers12 were
interviewed via phone survey.
Figure 2 presents selected crops in each county.
The study plan is to set a panel data analysis through repeatedly surveying sample famers. Thus, a list of potentially up to three farmers were identified for replacement in the case of failure to reach the previous farmers due to no longer register lines, unreachable farmers, or unwillingness to participate in the survey. If selected farmers could not be reached, the enumerators could then contact one of the two remaining farmers in the same “ward” (possibly with identical crops). The smallholder farmers can be attributed to level 3 administrative units, also known as “wards”
10 The crops value chains are yet to clearly identified in the survey and this reports, as some of the essential inputs and constraints are reported for all crops together.
11 The survey was carried out using Computer Assisted Telephone Interviewing (CATI) as described briefly in Annex B.
12 Although a survey was planned to interview 1,000 smallholder farmers via telephone, and additional 29 farmers through “snowball” methods, interviews with 3 farmers were not completed due to bad network connection for 1 farmer or unknown reasons for another two farmers.

14
Figure 2. Counties where selected crops are growing

15
3 Empirical Results
3.1 Main livelihoods characteristics and crops grown
The phone survey was completed for 1,026 smallholder farmers from 19 counties in Kenya. The survey was largely drawn from male respondents, 83.0% (852), as compared with 17% (174) female respondents (Table 3). The phone survey may have systematically excluded female farmers with no access to phones and hence not yet registered on the digital platform of the agriBORA database. The majority of the respondents are household heads (80%) with male heads accounting for 81.8% of surveyed household heads. About three-fourths of the respondents are economically active (aged between 18 and 65) and have attended at least primary school. On average, the respondents are from big families comprising of six members albeit the average number of children (4 persons) in a family are slightly greater than the average number of adult family members (3 persons) (Table 4). Own production of farms is the main source of food for the majority of them (72%) while about 28% rely on purchase. About 62% (635 farmers) reported having food in stock for consumption. While only 28% have stock that can serve for more than three months per year, about a quarter have stock that can serve for less than a month, about half of them have stock that can serve only for 2 to 3 months per year (Table 3). About 80% of respondents own livestock, as part of their livelihoods, with animal’s body conditions mostly ranked as hovering around average, and about 40% own pastureland to feed their cattle. Borehole and surface water are the major sources of drinking water for more than half (56%) of respondents. While less than 10% of the respondents use either protected wells or springs, public tap/standpipes, or pipe into dwellings as main sources of drinking water, about 12% use unprotected wells or springs. About 5% of respondents also consider rainwater as the main source of drinking (Table 3). Table 3. Smallholder farmers basic characteristics (N=1026)
Characteristic Categories N %
Sex of respondents Female 174 17.0 Male 852 83.0
Are you head of households (HH)? Yes 823 80.0 No 203 19.7
Sex of household head (HH) Female 150 18.2 Male 673 81.8
Age of respondents NA (not available) 197 19.2 18-35 238 23.2 36-50 312 30.4 51-65 194 18.9 66 + 45 4.4
Highest level of respondent’s education No School (illiterate) 21 2.0 Primary 431 41.9 Secondary 415 40.3 College/University 159 15.5
Main sources of food Donors 2 0.2 Farm (own production) 738 71.9 Purchase 286 27.9
Do you have food stock for consumption? No 391 38.1 Yes 635 61.9
# of months food stock can serve per year Less than a month 153 24.1 2 months 198 31.2 3 months 105 16.5 More than 3 months 179 28.2
Do you have livestock? No 204 19.9 Yes 822 80.1
If yes, body conditions of livestock Don't Know 3 0.4 Exceptionally poor 15 1.8 Less than average 118 14.4 On average 427 52.0 More than average 189 23.0

16
Exceptionally good 70 8.6
Do you have pastureland No 614 59.84 Yes 412 40.16
Main sources of drinking water Bore hole 361 35.1 Bottled water 1 0.1 Piped into dwelling 81 7.9 Protected well or spring 91 8.8 Public tap/Standpipes 100 9.7 Rainwater 49 4.8 Surface water 219 21.3 Tanker, truck or cart with small tank 1 0.1 Unprotected well or spring 123 12.0
Source: Authors computation from July-August telephone survey
Table 4. Respondents family size.
Mean Median Min Max
Total number of people in household 6.5 6 1 25 Number of adult persons 3.1 2 0 15 Number of children 3.5 3 0 22
While crop farming is the main sources of income for almost all smallholder farmers, about 38% (387 farmers) are also involved in own business (36%), informal but casual employment (25%), petty trade such as selling of cattle and animals (14%), and formal employment (12%), as secondary sources of income (Table 5). Most of the respondents (about 38%) earn less than KES 25,000 per annum from either primary or secondary sources. While barely less than a quarter of them earns between KES 25,000 and KES 50,000 and about 10% -12% earn between KES 50,000 and KES 100,000, a very limited number (less than 10%) of them earn more than KES 100,000 (Table 6).
Table 5. Primary and secondary Sources of income
N %
Main sources of income Crop farming 1,023 99.42 Formal-Employment 1 0.1 Informal-casual-Employment 1 0.1 Pastoralism-Livestock-Sales-of-cattle. 1 0.1
Total sample farmers 1,026 100
Secondary Sources of income Own business 141 36.43 Informal casual Employment 95 24.55 Pastoralism Sales of cattle and animals 55 14.21 Formal Employment 50 12.92 Crop farming 23 5.94 Employed Business 9 2.33 Donation 1 0.26 Honey production 1 0.26 Other: specify 12 3.1
Total farmers reporting secondary sources of income 387 37.7*
Source: Authors computation from July-August telephone survey; * represents the percentage of respondents reporting secondary sources of income in the total sample of 1,026 farmers.
Table 6. Level of income generating from either primary or secondary sources per annum
Primary Secondary
N % N %
Don’t know 181 17.6 118 30.5 Less than KES 25,000 392 38.2 149 38.5

17
KES 25,000- KES 50,000 237 23.1 81 20.9 KES 50,000 - KES 100,000 131 12.8 39 10.1 KES 100,000 + 85 8.3 36 9.3
Total respondents 1026 100.0 387 37.7*
Source: Authors computation from July-August telephone survey; * represents the percentage of respondents reporting secondary sources of income in the total sample of 1,026 farmers.
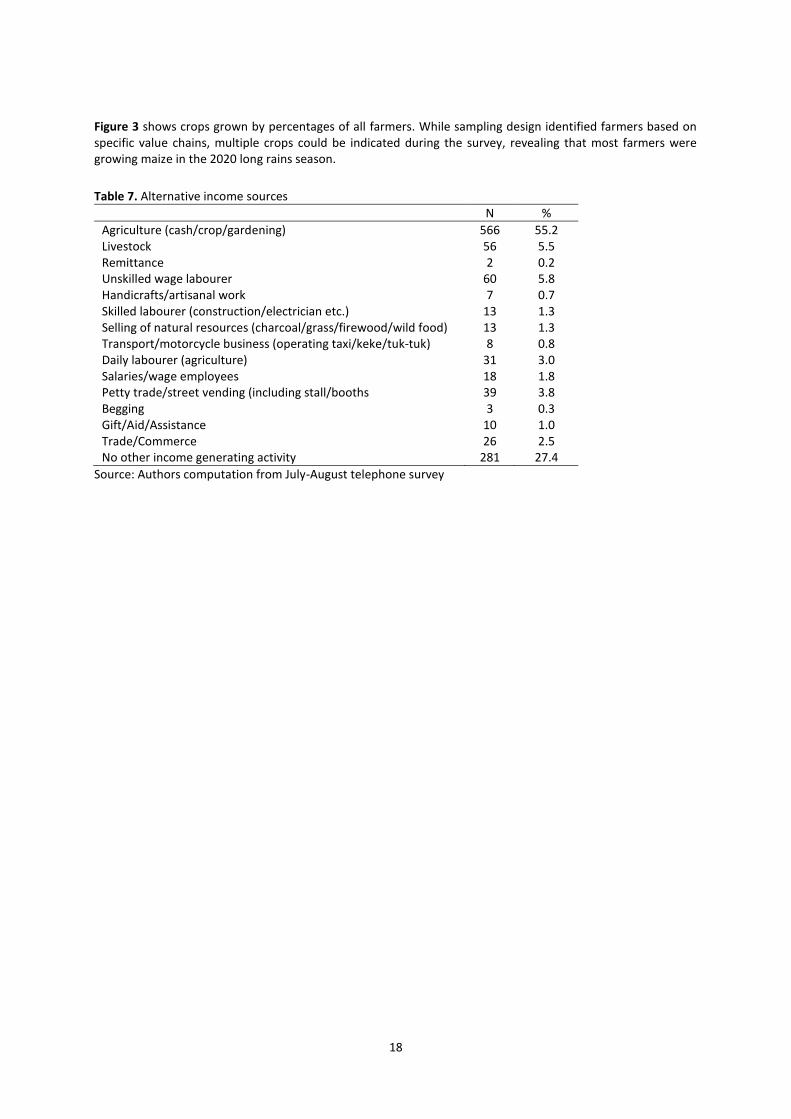
During the Long Rain (LR) season, majority of farmers are growing maize (91%) and beans (60%)13along with other crops (Figure 3). While growing maize is a typical activity for most smallholder farmers who are growing both food and cash crops in Kenya, the high maize planted areas in 2020 could also be partially attributed to a surge in farming activities across the country. It was in fact reported that the pandemic restrictions lasted for a longer period than initially expected and many citizens who lost their jobs returned to run crop farming in rural areas of their county. Furthermore, as input availability was challenging, reducing crop diversity by moving from cash crops to maize is a coping strategy for most of them as it would not only be used to fetch income but also to sustain the needs for household consumption. Most students could also be potentially participating in crop farming, as schools were closed due to lockdown restrictions. More importantly, about 35% of them reported participating in these activities for the first time, in 2020, due to the COVID-19 pandemic and containment measures imposed by the government (Figure 4). The findings support the hypothesis of increasing in the number of agricultural workforces from March to June 2020 although it needs to be augmented with further research findings. Furthermore, about 55% of smallholder farmers engage in either cash and food crops or gardening, as an alternative source of income (Table 7). About 8% of them also consider daily laborers as alternative income sources. However, more than a quarter of respondents do not have alternative income sources.
Figure 3. Crops grown during (LR) season.
13 a total of 341 (33% of panel) farmers participating in both contracted and non-contracted maize value chains were randomly selected from the agriBORA database. During the survey, farmers selected multiple main crops grown on their fields which increased the number of farmers participating in the maize value chain drastically to almost the entire panel.
Figure 4. Nature of main crops grown.
90.760.2
3.63.8
1.117.1
10.80.5
21.928.2
2.822.2
19.88.1
3.91.8
34.1
0.0 20.0 40.0 60.0 80.0 100.0
Maize
Beans
Green grams
Soy beans
Cow peas
Sunflowers
Cassava
Wheat
Tea
Vegetables
Rice
Irish potatoes
Sorghum
Sweet Potatoes
Millets
Fruits
Napier grass (Pasture)
16%7%
20%57%
Off season crop not typical for LR Se..
Perennial crop
Seasonal crop not typical for LR season
Seasonal crop typical for LR season
18
Figure 3 shows crops grown by percentages of all farmers. While sampling design identified farmers based on specific value chains, multiple crops could be indicated during the survey, revealing that most farmers were growing maize in the 2020 long rains season.
Table 7. Alternative income sources
N %
Agriculture (cash/crop/gardening) 566 55.2 Livestock 56 5.5 Remittance 2 0.2 Unskilled wage labourer 60 5.8 Handicrafts/artisanal work 7 0.7 Skilled labourer (construction/electrician etc.) 13 1.3 Selling of natural resources (charcoal/grass/firewood/wild food) 13 1.3 Transport/motorcycle business (operating taxi/keke/tuk-tuk) 8 0.8 Daily labourer (agriculture) 31 3.0 Salaries/wage employees 18 1.8 Petty trade/street vending (including stall/booths 39 3.8 Begging 3 0.3 Gift/Aid/Assistance 10 1.0 Trade/Commerce 26 2.5 No other income generating activity 281 27.4
Source: Authors computation from July-August telephone survey

19
3.2 Impact of COVID-19 on Input and Output Markets
The COVID-19 pandemic and its containment measures imposed by the government have affected both the demand and supply side of the food system value chains. On the supply side, key agro-dealer informants underlined that containment measures disrupted the supply of critical farming inputs such as seeds, fertilisers and chemicals (herbicides, pesticides, fungicides, etc...), due to the restrictions imposed on the international and domestic trades. According to the Kenya Tea Development Agency (KTDA) – a local agro-dealer and a leading management agency for small scale tea farmers in Kenya – the company was forced to suspend distributing fertilizer to smallholder tea farmers (for 2020 cropping seasons) following disruptions in the import chain because of the pandemic and its containment measures. Another fertilizer provider also emphasized there were logistics related issues at the beginning of the pandemic (around March 2020), although the government streamlined agriculture as essential services that helped them to provide enough fertilizers to be distributed across the country as of early April 2020. However, many transporters, as well as aggregators, reported their preference to stay at home fearing for their security, as well as to avoid any fine or arrest by overzealous police. The dealers also underlined difficulties of supplying agricultural inputs due to ‘stay at home measures’ and ‘night curfews’ that disrupted business working hours, besides logistic related issues such as lack of transport services.
On the demand side, the outbreak of the pandemic adversely affects farmers' demand for farm inputs as well as their main and secondary sources of income. About 76.8% (788 out of 1026 farmers) surveyed via phone reported an impact of COVID-19 on their main sources of income (crop farming) and about 81.1% (314 out of 387 farmers) on their secondary sources of income (Table 8). Absence of economic activities due to lockdowns, unable to sale crop outputs due to movement restrictions or drastic reduction in sales due to sharp drop in demand for products, are frequently mentioned as the major channels through which COVID-19 and its containments measures had affected their primary and secondary sources of income (Table 8). Lack of access to farm inputs due to movement restrictions is the second most frequently cited way through which the pandemic has affected the primary income generating activities (crop farming).

20
Table 8. Main channels of COVID-19 pandemic and containment measures have affected primary and secondary sources of income (Multiple responses).
Primary income Secondary income
N % N %
No sales due to movement restrictions 221 28.0 66 21.0 No access to farm inputs due to movement restrictions 210 26.6 11 3.5 Drastic reduction in sales due to lack of demand 200 25.4 79 25.2 Activity stopped or Business closed due to COVID-19 199 25.3 101 32.2 Daily wage is much lower 127 16.1 38 12.1 Increase in prices of inputs 94 11.9 13 4.1 Impossible to find work force 79 10.0 11 3.5 Reduced working hours due to curfew restrictions 24 3.0 29 9.2 No worth to cultivate due to no hope to sale 5 0.6 1 0.3 Reallocation due to COVID-19 8 1.0 7 2.2 Other: specify 51 6.5 23 7.3
Total sample farmers reporting the impacts 788 76.8¥ 314 81.1*
Source: Authors computation from July-August telephone survey; ¥ and * represent the percentage of respondents reporting impact of COVID-19 on their primary and secondary sources of income in the total sample of 1,026 and 387 farmers, respectively.
The COVID-19 pandemic containment measures have also negatively affected contract farming (maize or tea), a potential better income source. While about 17.5% (180 farmers) had contract farming before COVID-19, about one third of them retained their contract, which might be attributed to the fact that certain contracts had long standing enforcement such as contracts for perennial crops or were already signed before the outbreak of the pandemic. By contrast, about 15% were forced to stop the contract, more than a quarter to decrease buying prices, about 9.4% to decrease quantity of supply under contract, and about 10% forced to cancel their contract and sign a new one (Table 9). Key informant aggregators highlighted the decrease in buying prices led them to terminate a few contracts, as it could have an adverse impact or be uneconomical for some farmers. During July-August, they also noticed farmers operating in parallel markets or ‘side selling’ but had been challenging to react, as it led to a substantial increase in the cost of managing the contracts (field extension activities) following travel restrictions and increased transportation costs.
Table 9. Comparison of contract farming before and after COVID-19 (Multiple responses)
N %
Contract stopped 27 15.0 Decrease quantity under contract 17 9.4 Decrease buying prices 50 27.8 Increase buying price 12 6.7 Increase quantity under contract 5 2.8 Remain the same both quantity and prices 58 32.2 Signed a new contract 18 10.0
Total farmers reporting having contract farming before COVID-19 180 17.5*
Source: Authors computation from July-August telephone survey; * represent the percentage of respondents reported that had contract farming before the outbreak of COVID-19 in a total sample of 1,026 farmers. Furthermore, about 87% (891 farmers) interviewed via phone reported several constraints during planting and growing stages of the season (March-June 2020), that were directly or indirectly linked to supply disruptions or income losses due to government restrictions to combat spread of the virus, such as ‘night curfews between 7pm and 5am’ and ‘limiting number of passengers in public transport to a maximum of 60% of vehicles capacities’ that limit a number of economic activities. Farmers are constrained from lack of agricultural inputs and tools (seeds, fertiliser, pesticides, herbicides, fungicides, etc…) (29.4%), lack of capital and finance (23%) and high cost of agricultural inputs (15%) (Table 10). They also reported pests (fall armyworm) and diseases (32.2%) affecting maize production due to lack of chemicals. During the period, less than 2.5% of them reported the impact of desert locust and lack of workforce in the field, and only about 0.6% (5 farmers) expected lack of market for their products. Notwithstanding, during July-August 2020 (harvesting period), about 20% (198 farmers) reported difficulties of selling their products that directly linked to COVID-19 containment measures such as lack of

21
demand in the markets (no buyers) (47%), absence of transport services or poor yield quality (11% each) and lack of brokers/middleman or closed markets (9% each) (Table 12). Furthermore, during this period about 72% of
sample farmers are yet to harvest their crops and will expect to harvest soon14(Table 11), but about 13.5% (101 farmers) will expect challenges of selling outputs (harvested crops) due to poor quality of the products (41%), resulting from insufficient treatment during growing seasons; and lack of demand in the markets (21%) as a result of movement restrictions, as well as low quantity of the products (18%) (Table 12). Furthermore, about 60% reported constraints of harvesting at least some of their crops (Table 11).
Table 10. Main constraints during March-June (Planting period) (Multiple responses)
N %
Lack of capital and finance 236 23.0 Lack of Agricultural inputs and tools (seeds/seedlings, fertilizer, pesticide etc.) 302 29.4 High cost of agricultural inputs 153 14.9 Lack of workforce at field preparation, planting or weeding stage 90 8.8 Expected lack of market for produce sales 10 1.0 No contract anymore (contract farming) 3 0.3 Desert Locust 30 2.9 Other Pest and Diseases 330 32.2 Movement/Travel restrictions (COVID-19 related) 6 0.6 Could not lease land because of travel restriction 2 0.2 No rains 82 8.0 Harvested enough last month 1 0.1 Others 183 17.8
Total farmers reporting mains constraints 891 86.8*
Source: Authors computation from July-August telephone survey; * represent the percentage of respondents reporting main constraints during July-August survey in a total sample of 1,026 farmers.
Table 11. Respondents reporting crops yet to be harvested and will expect to be harvested
Do you have crops still to harvest?
If Yes, do you plant to harvest soon?
If, yes, do you have any constraints to harvest?
N % N % N %
No 283 27.58 67 9.02 298 40.11 Yes 743 72.42 676 90.98 445 59.89
Total 1026 100 743 100 743 100
Source: Authors computation from July-August telephone survey
Table 12. Farmers experiencing challenges for selling harvested crops (July-August 2020) and will expect challenges
Constrained for selling crop harvested (July-August 2020)
Expecting challenges of selling harvested crops (yet harvested)
N % N %
No buyers 93 47 21 20.8 Closed shops 19 9.6 3 3.0 Lack of brokers 18 9.1 9 8.9 Lack of transport 23 11.6 6 5.9 Poor yield quality 23 11.6 41 40.6 Low quantity produced - - 19 18.8 Lack of aggregators 3 1.5 1 1.0 Other specify 19 9.6 1 1.0
Total 198 19.3¥ 101 13.6*
14 About 70% rated the current conditions of their crops yet to be harvested as either “less than average” (40%) and “on average” (32%) largely due to either above average rainfall conditions (25%) or flooding (22%). The
impact of desert locust, pest, inability to access due to COVID-19, lack of work forces at field operations are reported by less than 5% of farmers yet to harvest their crops (Annex A2; Annex A3)

22
Source: Authors computation from July-August telephone survey; ¥ and * represent the percentage of respondents experienced challenges of selling harvested crops and will expect challenges of selling their harvested crops in a total sample of 1,026 and 743 farmers, respectively.
Farmers were also requested to compare the constraints they experienced during Mach-June 2020 and July-August 2020. Most of farmers (748 farmers or 73%) had experienced difficulties in accessing inputs such fertilizer (31%), fertilizer and seeds (27%) and fertilizer and pesticides (19.3%) during March-June 2020, at the early stage
of restrictions to contains the spread of the virus (Table 13). During July-August 2020, only about half of sample
farmers (533 farmers) had planted short rain crops due to lack of fertilizer (30%), fertilizer and seeds (28.3%) and seeds (20%). However, about 20% of them did not need such inputs during the short rain season, as compared with only 5% reporting the same reason during the long rain season (Annex A1). Table 13. Inputs with constrained access to farmers, March-June 2020 and July-August 2020
March-June 2020 July-August 2020
N % N %
Fertiliser 232 31.0 155 30.3 Chemicals such as insecticide, herbicide, fungicide etc. 47 6.3 24 4.7 fertilizer and chemicals 144 19.3 72 14.1 Fertilizers and seeds 200 26.7 145 28.3 Seeds for planting 106 14.2 104 20.3 Land preparation or farming machine 10 1.3 8 1.6 Others 9 1.2 4 0.8
Total famers reporting input constraints 748 72.9* 512 49.9*
Source: Authors computation from July-August telephone survey; * represent the percentage of respondents reporting main constraints during March-June 2020 and July-August in a total sample of 1,026 farmers.
Furthermore, Agro-dealers underlined, farmers spending on agricultural inputs, between March and August 2020, was on average about 50% higher than their spending in the same period in 2019, resulting from supply disruption caused by outbreaks of the pandemics and its containment measures imposed by the government. More than half of sample farmers (about 58%) also perceived farm input prices had increased after the outbreak of COVID-19 pandemic and its containment measures (Table 14). However, about 42% of perceived farm input prices remain the same as before or even decreased by less than 20%. Agro-dealers had also confirmed an overall decrease in footfall (visits), resulting from lower sales of farm inputs to farmers, as compared with the same period in 2019. Moreover, they also stated the challenges to condense their regular operations into fewer hours following the government 7pm-5am nationwide curfew in place since early August 2020.
Table 14. Changes in inputs prices level after evolution of COVID-19
N %
Increase (indication: increase 5 to 20) 510 49.71 Largely increase (indication: increase > 20%) 78 7.6 Lower (indication: decrease 5 to 20) 48 4.68 Much lower (indication: decrease >20%) 4 0.39 Remain similar 386 37.62
Total 1026 100.0
Most farmers (about 79%) usually plant during the short-rain (SR) season, between October and December. While about 61% of them had already planted at the time of interviews, about 78% had claimed lack of access to inputs such as seeds (39%) and fertilizers (40%), as inputs providers and distributors had challenges of restocking shops and the transport costs remained high following government restrictions. The fact that the rainfall in the months of August and September 2020 was also above average in many parts of the country could have been assumed to be an early onset of the SR season and led to many farmers choosing to plant earlier than usual. Others planted earlier to capitalize on the earlier rainfall availability as they expect less rainfall in the next season. According to the Kenya Meteorological Department (KMD), the short rain season between October and December 2020 is expected to experience lower rains than usual and this is likely to affect yields and overall food security plans of smallholder farmers.

23
Although the outbreaks of the pandemic and its containment measures affect major income sources of most smallholder farmers, appropriate measures to mitigate the shocks are not yet in place. For instance, farmers' access to farm loans and/or subsidy incentives are limited (less than 11% of them could access these services) (Table 15). During field visits, enumerators recognized a substantial number of farmers requested for cash support in the form of loans or subsidies to afford buying essential inputs for August- September 2020 short rain (SR) planting season. During this period, about 19% (198 farmers) reported absence of essential farm inputs such as fertilizer (67%) and pesticides (14%) in their stocks (Figure 5). Most agro-dealers emphasized farmers must be supported to regain their financial standing (ability to invest in their farms) prior to even their own access to credit for stocking inputs in shops. Moreover, they want to assure demand for inputs will be in place before considering fresh stocking in shops. Table 15. Farmers access to farm loans and subsidy incentives (July-August 2020)
Subsidy incentives Farm loans
N % N %
No 910 88.69 914 89.08 Yes 116 11.31 112 10.92
Total 1026 100 1026 100
Source: Authors computation from July-August telephone survey
Figure 5. Farmer’s input stocks in July-August 2020
Furthermore, although the LR season is the normal time for input companies and agro-dealers to undertake promotion and extension services to farmers through programs such as seed fairs, weekly village markets, and field days, the ban on congregation of people has hindered farmers to access farming information and thereby limited the pathways through which some inputs companies and agro-dealers advertising their products available in stocks. While some agro-dealers doubled up provision of the services through field inspection, extension services on pest and diseases and post-harvest handling have been challenging to offer farmers training and advice on their farms.
The impact of the pandemic and its containment measures on the demand side were also felt by Agro-processors. According to key informants of agro-processor, lack of sufficient raw materials to meet that current demand led them to proactively manage their inventory and stocking up only whenever they could. A few large agro-processors reported importing sufficient raw materials before the outbreak of the pandemic that allowed them to overcome major supply chain disruptions at least until March 2020. However, the COVID-19 regulations and cross border movement restriction results in delaying access to import raw materials and also increasing the cost of transport services, which in turn results in rapidly increasing, as well as fluctuating, prices of raw materials and commodities between March and August 2020.
Aggregators and agro-processors were constrained not only to access importing raw materials but also from most farmers’ decision to withhold their production for their own consumption (Figure 6). During March-August 2020, while 56% (576 farmers) were reporting usually selling their products, only about 40% of them were selling out more than 75% of the total products in the markets, either to aggregators agro-processors, retailers or

24
directly to consumers. Most farmers' decision to withhold production is partly linked to the low margins for sales as confirmed by key informants, because of low market prices and high cost of transport services. Moreover, fears of food insecurity due to poor yields and giving a maximum care for own consumption needs are the main drivers for holding their product for those who yet to sell their crops output but still to harvest (72%) at the time of telephone interviews, during July-August 2020. This partly implies the impacts of multiple stress imposed on food supply and security across the country. While the ministry of agriculture has assured the counties that the government has put in place all the necessary mechanisms to avert potential food shortages, farmers could be more concerned on the widespread availability of products in the market cannot be taken for granted as it remains unclear when the country would return to normal activities. Figure 6. Proportion of Harvest Usually Sold

25
3.3 Impact of Floods and Desert Locusts
According to the Kenya Meteorological Department (KMD), March to May (MAM) rainfall period was one of the wettest the region has experienced since 1981, following an already record wet 2019 October to December (OND) rainfall period. The early onset of rains and above-average rainfall since February 2020 promoted land preparation and planting activities for the MAM period across the country. However, the abundant rains have also caused localized flooding, mudslides, flash floods, and river overflows over the past months causing casualties, displacement, infrastructure damage, and crop damage in parts of Kenya15. The geographic distribution of floods was reported mainly in Western Kenya and the Lake Victoria basin region in the counties of Homa Bay, Busia, Siaya and Kericho (Figure 7). Desert locusts were reported mainly in Eastern Kenya in the Arid and Semi-Arid Land (ASAL) counties of Meru, Embu and Nyeri. Figure 7. Counties Affected by Floods and Desert Locusts
About half of farmers were drawn from wards experiencing flooding during LR season and about 44% of them experienced floods on their field (Table 16). Moreover, among farmers who experienced floods, about 78% own livestock, as part of their livelihoods. The farmers were requested to rank their perceptions of floods effects on their farmland, crops or yields and livestock as very little or none (< 10%), small percentage (10% - 25%), moderately affected (25% - 50%), majority affected (50%-75%) and mostly affected (75% -100%). While the impact of floods on their livestock are perceived as very limited or almost none for more than 64% of respondents, its impacts on farmland and yields were ranked as moderately affected and/or majority affected, as reported by about 60% of the respondents. More importantly, about 20% and 25% of the respondents perceived as mostly affected damage on their fields and yields, respectively (Table 17).
Although heavy rainfall could create favorable conditions for further spread of desert locusts as it could provide suitable breeding conditions and promoted vegetation growth for feeding, only about 16% of the respondents experienced desert locusts (defined as “mostly flying” to distinguish them from hoppers) once or twice in their fields, during LR season (Table 16; Annex A4; Annex A5). Notwithstanding, between February and March 2020, agro-processors were worried about desert locust invasion as menace was spreading through the Horn of Africa. The peak infestation occurred in March (Figure 8) at a time when most farmers had already harvested for short rain season and yet to plant for the long rain season. The greatest fear was passed in December 2019, when fresh vegetation suitable for the spawn would help them to generate and wipe out the next harvest as of early in July
15 “Eastern Africa Region: Floods and Locust Outbreak Snapshot (May 2020).” Reliefweb, May 11, 2020. https://reliefweb.int/report/ethiopia/eastern-africa-region-floods-and-locust-outbreak-snapshot-may-2020.

26
2020. However, there was a sigh of relief as the destruction to crops did not happen as it had been expected in worst case scenarios and the Kenyan government long rains assessment also confirmed that desert locusts have finally not had a significant negative impact on the long rains crop production16. FAO’s Desert Locusts warning team however warned that there will be a threat of possible re-infestation towards the end of the year.
Table 16. Flooding and desert locust experienced during July-August 2020.
Do you live in a ward experiencing flooding?
Do you experience flooding?
If experienced flooding, do you have Livestock?
Do you experience desert locust
N % N % N % N %
No 515 50.19 576 56.14 100 22.22 863 84.11 Yes 511 49.81 450 43.86 350 77.78 163 15.89
Total 1026 100 1026 100 450 100 1026 100
Source: Authors computation from July-August telephone survey. Table 17. If experienced flooding, extent of its impacts on:
Farms land Crops/yields Livestock
N % N % N %
Very little to none <10% 25 5.56 28 6.22 224 64.00 A small percentage (10-25%) 57 12.67 41 9.11 44 12.57 A moderately affected (25-50%) 138 30.67 117 26.00 41 11.71 Majority affected (50-75%) 144 32.00 153 34.00 31 8.86 Mostly affected (75-100%) 86 19.11 111 24.67 10 2.86
Total farmers experiencing flooding 450 43.86* 450 43.86* 350 77.78¥
Source: Authors computation from July-August telephone survey; * and ¥ represent the percentage of farmers experiencing flooding in a total sample of 1,026 and 450 who experienced flooding, respectively. Figure 8. Locust Presence peak months
16 THE 2020 LONG RAINS SEASON ASSESSMENT REPORT, Collaborative report of the Kenya Food Security Steering Group (KFSSG): Ministries of Devolution and ASALs; Agriculture, Livestock and Fisheries; Water and Irrigation; Health; and Education, Science and Technology; Regional Pastoral Livelihoods Resilience Project (RPLRP), National Drought Management Authority (NDMA), WFP, FEWS NET, UNICEF, FAO, World Vision, ACF, and Arid and Semi-Arid Lands (ASAL) County Steering Groups (CSGs): with financial support from the Government of Kenya (NDMA), WFP, UNICEF and partners. August 2020

27
Among farmers who faced desert locusts, about 43% (70 out of 163 farmers) applied farm treatments such as making noise (44%) and bio pesticides (34%) (Table 19) before or during locust infestations (Annex A6). Most of them (92%) underlined the treatments were either fully effective (43%) or effective to some extent (46%) (Annex A7). Table 18. Stages at which the desert locust had affected crops
N %
Flowering (the plant is fully grown) 38 26.76 Maturity (flowers dried and developing) 21 14.79 Vegetative (the plant is growing stalling) 45 31.69 small plant growing its first pairs 30 21.13 Harvest 3 2.11
Total 134 82.2*
Source: Authors computation from July-August telephone survey; * represents the percentage of farmers reporting the stage at which their crops experienced desert locust in a total of 163 farmers who reported desert locust infestation. Table 19. Type of treatment applied to control desert locust
N %
Bio-pesticides 24 34.29 Noise 31 44.29 Smoke 9 12.86 Traditional pesticides 6 8.57
Total 70 42.94*
Source: Authors computation from July-August telephone survey; * represents the percentage of farmers who applied treatment to control the locust in a total of 163 farmers who reported desert locust infestation.
Most farmers (about 60%) with desert locust damage perceived the impact on their farmland, crops or yields in the range between a moderate percentage (25%-50%) to large (75%-100%) (Table 20) and about 46% of them reported crop losses between KES 10,000 - KES 30,000 (Table 21). About 34% (55 out of 163 farmers) were forced to replant, on average around 25%-50% of their affected fields in a bid to save their crop (Table 22).
Furthermore, about 40% of the respondents had pastureland17 and less than 10% (33 out of 412 farmers)
reported the effects of desert locust on their pastureland (Table 23) but 21 farmers were forced to increase expenditure on animal feed (Annex A10). Another unexpected feedback received by many maize farmers is that the perceived impact of fall armyworm was greater than the impact of the desert locusts’ invasion. It was observed that some farmers were referring to desert locusts during phone surveys while a more in-depth unstructured discussion with the enumerators in the field revealed that in various cases the actual pest was fall armyworm. The fact that fall armyworm is better known in Western Kenya than desert locusts confirms once again that desert locusts are not perceived as a major problem in the most productive agricultural areas.
Table 20. Extent of farmland, crops and yields affected by desert locust
Farmland Crops Yields
N % N % N %
Do not know 13 7.98 - - - - very little to none <10% 17 10.43 30 18.4 28 17.18 A small percentage (10-25%) 20 12.27 18 11.04 18 11.04 A moderate percentage (25-50%) 35 21.47 38 23.31 44 26.99 Majority of them (50-75%) 37 22.70 42 25.77 35 21.47 Most to all them (75-100%) 41 25.15 35 21.47 38 23.31
17 Most households perceived their pastureland as on average or less than average (Annex A8) due to above average and average rainfall (Annex A9).

28
Total 163 100 163 100 163 100
Source: Authors computation from July-August telephone survey. Table 21. Estimated crop loss due to desert locust
N %
Can't /Don't want to say 33 20.25 KES 10,000 - KES 30,000 75 46.01 KES 30,000 - KES 70,000 32 19.63 >KES 70,000 23 14.11
Total 140 100
Source: Authors computation from July-August telephone survey. Table 22. Size of farm replanted due to desert locust infestation
N %
<25% of farm 8 14.55 between 25% - 50% of farm 22 40.00 between 50% - 75% of farm 9 16.36 100% of farm 16 29.09
Total 55 33.74*
Source: Authors computation from July-August telephone survey; * represents the percentage of farmers replanted crops due to desert locust in a total of 163 farmers who reported desert locust infestations.
Table 23. Extent of desert locust impacts on pastureland
N %
NA 379 91.99 Very little to none <10% 1 0.24 A small percentage (10-25%) 5 1.21 A moderate percentage (25-50%) 10 2.43 Majority of land (50-75%) 10 2.43 Most to all pastureland (75-100%) 7 1.70
Total farmers owned farmland 412 40.15*
Source: Authors computation from July-August telephone survey; * represents the percentage of farmers owned pastureland in a total sample of 1,026 farmers.

29
3.4 Impacts of COVID-19 on Food Security and Diversity of the Respondents.
Food security is the main concern for most respondents. About 38% of the respondents perceived their status as food insecure households and do not have food in stock for consumption. The remaining 62% (635 farmers) have reported food remains in stock for family's consumption. Only about 28% of them have stocks that can last for more than three months, half of them have stock for two to three months and the remaining a quarter of them have stock for less than a month (Table 3). Most sample households including those with an existing food stock
(58%) earn less than KES 50,000 per annum (Annex A12).
Households report reducing both the quantity and diversity of their food consumption to retain their stock for future consumption, as they: don’t have enough money to restock their food demand or they lost their jobs (52%), their production are destroyed because of locust or pest (18%), food prices are too high (15%) and food is not available in the market (7.4%) and they could not able to access the markets (5.5%) (Table 24). During the June to August 2020 period, with the harvest, the food consumption resumed to its usual pattern for a bit less than 60% of the farmers while 40% of them still have a reduced quantity and quality of their diet compared to usual. About 62% of these households consume grains, white roots, and tubers, about 36% of them consume meat, poultry, and fish and about 25% pulses (beans, peas and lentils) (Table 25). About a third of them were also forced to sell their property to purchase food for consumption and the number of households able to get assistance are limited to 15% of these households (Annex A11).
Furthermore, food insecurity is the major future concern for about a quarter of respondents in August 2020 complemented with inability to get inputs for the next season. The same holds as concern over the next three months (September to December 2020) with disruption of livelihoods being another major concern highlighted by respondents. The low level of confidence amongst farmers may be one of the reasons, as they entered to a new planting season and lack of access to affordable inputs may be one of the top challenges anticipated by these farmers. The challenges associated with low revenue from the sale of their produce as well as the difficulty in accessing output markets during the Long rains (LR) season 2020, as compared to the previous LR season in 2019, indicate wavering confidence in farmers’ future earning potential.
Table 24. Reasons for reducing food quantity and diversity (N=635)
N %
NA 9 1.42 Unable to access the market (no access, markets) 35 5.51 No food available at the markets 47 7.40 No money to buy food/ lost job or sources 333 52.44 Own production destroyed (locust and pest) 116 18.27 Too expensive/ price too high 95 14.96
Total farmers reducing food quantity and diversity 635 100
Source: Authors computation from July-August telephone survey

30
Table 25. If reduced quantity and diversity, changes in consumption July-August 2020 (Multiple responses)
N %
Grains, white roots and tubers, and plantains 414 61.5 Pulses (beans, peas and lentils) 170 25.3 Nuts and seeds 14 2.1 Dairy 73 10.8 Meat, poultry and fish 241 35.8 Eggs 69 10.3 Dark Green leafy vegetables 30 4.5 Other vitamin-A reach fruits and vegetables 19 2.8 Other vegetables 21 3.1 Fruits 39 5.8 Others 28 4.2
Source: Authors computation from July-August telephone survey
3.5 Satellite Imagery Analysis
Remote sensing analysis has been used in the effort to map desert locust impacts on crops and rangelands in
East Africa in 2020, including, for example, the Kenya Red Cross18 and the Chinese Academy of Science19.
According to these reports about 350,000 ha of land have been lost due to desert locust in Meru country alone
and more than 1 Mio. ha of cropland in the Central Kenya province. The reports, however, acknowledged
limitations in ground data retrieval due to COVID-19 driven movement restrictions. Moreover, based on JRC
internal analysis, using mainly Sentinel 2 NDVI and Sentinel 1 data in 2020, we have not been able to associate
any anomalies of the satellite indicators uniquely with desert locust damages. This survey is therefore perceived
as an opportunity for additional field evidence for collection of desert locust damage at least for the counties
with reported observed large swarms such as Meru, Embu and Nyeri.
The remote sensing (RS) analysis carried out for this study specifically aimed at exploring the possibility of
disentangling desert locust damages to crops from natural crop senescence and harvesting using Sentinel-2
imagery. Field visits were conducted to gather objective evidences about desert locust damage to support the
analysis. The field visits were organised for those farmers that acknowledged the presence of visible signs of
locust damage during the phone interview. The visits allow us to get a precise geolocation of the affected fields
(n=39), when possible together with the geolocation of a control farm (i.e. a nearby farm that was not affected
by locusts; n=9); information about the damage severity and replanting activities; information about the extent
of the crop damage in four cardinal directions from the GPS measurement; landscape, transect and close-up
photographs of the damaged area.
The first wave of the survey was deployed in August 2020, when crops had either already been harvested or were
in senescence and thus did not meet optimal conditions for collecting damage evidence. The inspection of
photographs collected in August revealed the difficulties of identifying damage on plants that were reported to
have been affected by locusts mostly from March to May. Nevertheless, it is useful to describe here the results
of the RS analysis for a few selected farms to exemplify the challenges related to this analysis.
18 Impact of Desert Locust Invasion in Kenya, Kenya Red Cross, June 2020.
19 Report of Monitoring and Assessment of Desert Locust in Africa and Asia 2020 (No. 1-12). Aerospace Information Research Institute, Chinese Academy of Sciences

31
Sentinel-2 multispectral data at 10 m spatial resolution is used to provide first mapping insights through
comparative analysis of before- vs. after-infestation. As dense infestations of locusts are expected to reduce
standing green biomass, the analysis focuses on Normalised Difference Vegetation Index (NDVI), a spectral
vegetation index exploiting the differential absorption of green vegetation in the spectral band of the red (light
strongly absorbed by the chlorophyll present in the green leaves) and near-infrared (light reflected by healthy
green leaf). NDVI ranges roughly from 0 (bare soil) to 1 (dense healthy vegetation fully covering the ground).
NDVI is commonly employed as a proxy of green standing biomass in RS analysis. Nevertheless, a decrease in
NDVI (and hence in green biomass) can be due to different causes, including natural or drought-induced
senescence of vegetation (i.e. dry-up and yellowing of leaf tissues), complete or partial harvest of the plants, and
biomass reduction due to locusts and other pests. Therefore, it is obvious that a decrease in NDVI at a time when
natural senescence or harvesting operations are taking place should not be regarded as a univocal sign of locust
infestation.
Disentangling the latter (locust damage) from the former causes (senescence and harvest) thus requires a full
understanding of the conditions in which the reduction of NDVI occurs. In order to gain some further in insights
and develop a possible operational protocol to detect locust damages with RS, the NDVI variation before and
after the reported infestation were considered under two types of controls: a temporal and a spatial one. The
temporal control refers to the same location (i.e. the farm reported to be affected) observed in the same period
of the previous year. The temporal control is useful to understand the seasonal dynamics of vegetation when not
affected by locusts. The spatial control refers to the control farm, a farm located nearby (maximum 5 km away)
that was not affected by locusts. The control farm is identified by the affected farmer and then visited by our
surveyor that registered precise geolocation and collected photographs. Similarly, to the temporal control, the
NDVI temporal trajectory of the control farm in the current and previous year were analysed and qualitatively
compared with the affected farm. The processing is made on-the-fly using Google Earth Engine and level 2
Sentinel-2 data.
We analysed all 39 visited farms to conclude that we are not able attribute NDVI reductions to DL damage
unambiguously. We reported here the detailed results for four farms as an example. Such four farms were
selected among those having an available control farm (n = 9) and with farmers reporting damage during the
phone interview.
Here, we present examples from four western counties —Vihiga, Uasin Gishu, West Pokot and Trans Nzoia—
among the visited farmlands affected by desert locusts and visited during the field survey (Figure 9). Table 26
presents peak of DL infestation dates, dates of the selected Sentinel-2 imagery, estimation of DL damages and
extent of crop damage (damaged area radius). The damaged area radius was derived from information about the
extent of the crop damage in four cardinal directions from the GPS measurement. The selection of a specific date
is driven by the availability of cloud-free imagery. Data about infestation severity were also reported (from
surveyors during field visits and from farmers during phone interviews). Approximate damage to crops refers to
the % of plants showing some visible sign of damage.

32
Figure 9. Location of selected affected farmlands: Vihiga, Uasin Gishu, West Pokot and Trans Nzoia
Table 26. Peak interstation dates and images dates, ’before- and after-infestation’’ comparative analysis for the four farms.
Data and imagery for Vihiga farm (farm 1) are presented here while the same information for the remaining
farms (farms 2 to 4) are reported in Annex C. Figure 10 and Annex (C1, C4, C7) shows the Sentinel-2 images for
each farm before (left column) and after (centre column) the reported peak infestation time in 2020 (bottom
row) and before and after the same time of the previous year (i.e. 2019, top row). The NDVI difference (i.e., NDVI
after - NDVI before) is shown for 2020 (right column, bottom) and for 2019 (right column, top). The InfraRed
False Colors RGB composites (R: Near Infrared, G: Red, B: Green) are shown for before and after images. This
band combination is useful to detect healthy vegetation, shown in red color. The NDVI difference is expressed
using a blue-yellow-red legend from 0.25 to -0.25. The affected farm is depicted as a green circle in all imagery
while the control farm as a blue circle only in the before-after imagery of the current year.
North East South West
1 Vihiga 03/05/20 01/04/20 21/05/20 12/04/19 17/05/19 21-30% 21-30% 61-70% 11-20%
2
Uasin
Gishu 28/03/20 12/03/20 06/04/20 13/03/19 02/04/19 11-20% 11-20% 11-20% 11-20%
3
West
Pokot 18/02/20 17/01/20 21/02/20 22/01/19 26/02/19 11-20% 41-50% 11-20% 11-20%
4
Trans
Nzoia 29/02/20 11/02/20 22/03/20 22/01/19 13/03/19 11-20% 11-20% 11-20% 11-20%
Phone
survey
40
>50
30
>50
Proportion
of land
affected
25-50%
75-100%
50-75%
50-75%
Peak
infestati
on dateCounty
Farm
ID
Before,
previous
year
After,
previous
year
Field visit observations
Approximate damage to crops
Date of S2 imagery
Before After
Damaged
area radius
(meters)

33
Figure 10. Satellite images of Vihiga farm (farm 1)
Note: Satellite images of Farm 1 for the previous year (2019, top row) and the current year (2020, bottom row) before (left column) and after infestation (middle column). In the third column we show the NDVI difference for the previous (top) and the current year (below). The green circle is the farm affected and the blue circle is the control farm.
Vegetation conditions for the first three farms are not compromised after the peak infestation date for 2020 as it can be observed in the satellite imagery of Figure 10, C1, and C4 (Farms 1, 2 and 3), where bright red color points to healthy vegetation. This can be also observed in the NDVI difference images for 2020, where the blue color indicates a higher NDVI value in the “after’’ image for the affected farms.
Comparing the NDVI difference images for 2020 and 2019 in all farms, the evolution of vegetation condition has seen from before to after the infestation peak is similar between the two years for Farm 1 (Figure 10) and Farm 2 (Figure C1). For Farm 3 (Figure C4), conditions seem slightly better in 2020, whereas for Farm 4 (Figure C7), conditions seem to have worsened significantly in 2020, as compared to 2019. For farm 4, however, a reduction of NDVI over the period was experienced in both years were observed, possibly due to senescence or harvesting operations. The stronger reduction observed for the whole area in 2020 can be due to the fact that the overall season of 2020 was more productive and ended later than the previous one, resulting in the larger decrease in the investigated period observed for 2020.
Figure 11, C2, C5 and C8 show the temporal NDVI profiles from March 2020 to August 2020 for the affected- and control-farms before and after the peak infestation period. DL damage can be very scattered in space, thus an area of the field may be affected while another one may be left untouched. To focus on damaged areas, we extracted profiles for a circular area centred on the collected GPS coordinates of the field centre. To determine the radius of such circular, we used information about the extent of the crop damage in four cardinal directions from the GPS measurement. In particular, the radius was set to the minimum of such reported lengths to ensure the coverage of the damaged area.
It is noted that NDVI temporal trajectories are not continuous lines because several observations are missing due to severe cloud cover. In addition, NDVI drops in one or two consecutive observations are likely due to undetected partial cloud cover as only a simplified cloud masking algorithm and no temporal smoothing are used for analysis. The actual trajectory of NDVI typically follows the upper envelope (i.e. the local maxima) of the observed data points. Additionally, in Figure 11, C3, C6 and C9 the affected-farm 2020 profile are compared with that of the previous year. All temporal NDVI profiles represent the average NDVI value over a circular area of x meters radius; x being the damaged area radius observed in the field (Table 26).

34
Figure 11. Temporal NDVI profile of Vihiga (Farm 1)
Note. Temporal NDVI profile for Farm 1 (above) and for the corresponding control farm (below). A 40-m buffer around farm GPS location is used to extract profiles.
Figure 12. Average temporal NDVI profile of farm I
Note. Farm 1, average temporal NDVI profile (current and previous year) for a circular area with radius 40 m, i.e. the report extent of the damaged area. Doy stands for day of year.
For all four examples farms, the NDVI profiles have similar patterns for the affected farm and the control farm. In other words, a larger reduction of NDVI in the affected farm was not observed, as compared to the control one after the reported infestation time.

35
Furthermore, focusing on the affected farm only, the 2020 NDVI trajectory is rather similar to that of 2019, and in many cases, we observed increased NDVI values in 2020 compared to 2019, attributed to the above-average rains this year that supported more vigorous crop growth.
These examples show that the impact of locust on crop conditions in the affected farms is not evident from RS imagery. Table 27 and Figure 13 summaries show NDVI variation from before to after infestation time is very similar between affected and control farm for each of example presented here.
Table 27. Variation of NDVI values between two periods.
Note. NDVI values variation for two periods, one month before and one month after the peak infestation date for
affected farms and control farms.
Figure 13. Average NDVI over a period of month before and after peak infestation date for the affected and control farms (data from Table 27)
We can therefore conclude that desert locust damage is not detectable with NDVI for the analysed farms. The RS analysis is not able to confirm the severity of the farmer’s reported damages. It is likely that desert locusts had actually visited the farms as reported by the farmers but the damage to standing green biomass has been limited and possibly compensated by the more vigorous than average growth of vegetation in 2020, due to abundant rainfalls. That is, the damage might not have been severe enough to be ascertained with satellite imagery and attributed unambiguously to desert locusts. Unfortunately, this analysis is not conclusive because the timing of our field visits (occurred in August, some months later than the reported infestation) did not allow us to collect clear traces of DL invasions (whether there were actual damages or not). However, the exercise clearly confirms the attribution challenges of remote sensing detected NDVI anomalies to desert locusts impacts that had already emerged during preliminary analysis and that leads us to call for careful evaluation of remote sensing based area impact assessments published by several sources in 2020 and which are not supported by extensive calibration and validation of the remote sensing methodology applied.
Farm
(ID) Avg Min, date Max, date Avg Min, date Max, date Avg Min, date Max, date Avg Min, date Max, date
1 0.48 0.34 0.63 0.58 0.54 0.64 0.59 0.45 0.78 0.54 0.34 0.62
01/04/20 01/05/20 01/04/20 01/05/20 16/05/20 21/05/20 16/05/20 06/05/20
2 0.33 0.22 0.46 0.4 0.23 0.58 0.42 0.37 0.47 0.5 0.47 0.55
17/03/20 22/03/20 27/03/20 22/03/20 11/04/20 01/04/20 06/04/20 16/04/20
3 0.53 0.43 0.59 0.49 0.41 0.56 0.53 0.48 0.58 0.5 0.43 0.53
27/01/20 11/02/20 27/01/20 11/02/20 26/02/20 21/02/20 26/02/20 22/03/20
4 0.52 0.33 0.64 0.57 0.34 0.66 0.39 0.35 0.44 0.45 0.42 0.49
26/02/20 11/02/20 26/02/20 11/02/20 12/03/20 07/03/20 07/03/20 12/03/20
NDVI affected farm NDVI control farm NDVI affected farm NDVI control farm
1 month before infestation 1 month after infestation
36
The second wave of the survey focusing on the Short Rain (SR) agricultural season will be executed in November closer to the expected vegetation peak, thus potentially allowing us to identify the impact of dessert locusts on vegetation in a more timely manner. In addition to that, the study plan to deploy a field survey independent from the farmers survey and aiming to maximize the utility of the field activity for desert locusts impacts only. With this new exercise the study will adapt to the current status of locust outbreak, expected to have a stronger impact on ASAL counties of Kenya. In addition to monitoring ASAL areas (agricultural and pastoral areas), the study will adopt a different procedure for the identification of the sites to be visited in the field. Instead of the selection based on the random sampling phone survey, the study will quickly react to the report of agriBORA agents in the ASAL area to promptly sample sites where DL infestation has just occurred. This new protocol is expected to improve the quality of the ground information as compared to the first wave of field visits.
37
4 Conclusions
The study examines the impact of COVID-19 and its containment measures, as well as floods and desert locusts, on the small holder’s food system using a telephone survey from 1,026 smallholder farmers in 19 counties in
Kenya, complemented with consultations from 20 agro-dealers and 15 aggregators or agro-processors. The survey is planned to be conducted in three consecutive cropping seasons: July-August 2020, November -December 2020 and July-August 2021. This report is based on the first phase of the survey and has shown impacts of COVID-19 on smallholder farmers in major crop growing regions in Kenya spanning the entire agricultural sector. The associated public health mitigation measures introduced by the government in mid-March 2020 to prevent further spread of the virus — particularly lockdowns, stay-at-home orders and the closing of borders and public spaces such as markets and schools —have negatively impacted livelihoods of many smallholder farmers, agro-dealers, aggregators and agro-processors. The containment measures affected farmers due to lack of access to farm inputs on time, in particular seeds and fertilizer, increased input costs and difficulties in accessing output markets for their harvest. While these challenges were most prominent during the March-June 2020 period, when the government measures had the maximum effect, they also persisted between July and August 2020, when farmers were harvesting and seeking markets for their crops. Decreasing household income due to job losses, reduced revenues from farming or other income generating activities as well as increase in price of food and low yields and/or grain quality experienced by farmers, contributed to reductions in both quantity and quality of food consumed by households during the pandemic period. The situation improved during the harvesting period as from July 2020. However, the food reserves of most households in August 2020 covered less than three months of consumption.
The study benefits from direct contact with individual farmers and other value chain actors to obtain quantitative and qualitative insights. Each interview lasts for around 30 minutes to provide insights about farm activities and multiple challenges farmers faced during the pandemic period. Because of the multiple stressors addressed and to keep the overall size limited, the standard food security and nutritional indicators could not be fully included in the phone survey. The priority was put on collecting indicators on the agricultural activity of households and impact of COVID-19 and desert locusts. In addition, the survey did not include potential differential effects by gender. Furthermore, the respondents are representatives only for farmers in the agriBORA database representing selected value chains. However, the farmers network was spread across the main cropping regions of the country and the value chains captured during the survey are varied enough to give a good picture of the situation in the food production areas. Key informant interviews (i.e., with agro-dealers, aggregators and agro-processors) were purely qualitative based on the selected interview partners and their experience and led to some valuable insights that helps to better understand challenges impacting farmers’ access to inputs.
The above average rainfall during the long rain season in most areas of the country led to good growing conditions but also resulted in floods in some parts of the country. The floods had affected crop fields of many farmers resulting in yield loss or low quality of produced commodities. Minimal impact on livestock was reported due to the floods.
While the Horn of Africa has suffered the worst desert locust invasion in decades, the survey has shown that the impact of the desert locusts on the investigated five crops in the sampled counties, which include Kenya’s most important production regions, was quite low. The findings confirm that the forecasted worst case scenario of desert locusts causing major crop losses during the long rain season, which had been of concern to the country in early 2020, has not materialized because the desert locust invasions did not reach the most productive areas. Also, in areas that have been affected by desert locusts it is assumed the positive effect of the exceptional rainfall on both crop and rangelands in March-May 2020 has to a large extent prevailed on the negative impact of desert locusts. The hypothesis is corroborated by the results of the remote sensing analysis which has not found clear signals of biomass decrease that can be attributed to desert locusts. The survey managed to collect GPS points and photographs of affected fields including maize, sorghum, pigeon peas, okra, green grams and Napier grass fields. However, no clear traces of locust damages were found at the time of survey, as most fields were at maturity stage or had already been harvested. In addition, we were not able to confirm the severity of the infestation reported by a number of farmers with the remote sensing analysis. The survey also revealed that apart from desert locusts, the fall armyworm pest was affecting many maize farmers in the country.
The results so far have provided some interesting indications which form a good basis for the following two phases of the study. Since the economic effects of COVID-19 are not limited in time to a single crop season, the

38
negative impact for example on access to farming inputs are expected to extend to the next seasons, leading to a progressive erosion of crop diversity and products quality. With the repetition of the survey during the next two crop seasons the study will focus on those protracted effects of the pandemic as well as looking more in detail at some specific aspects. The questionnaires will be further improved in order to include some more food security information and in order to improve the quality and timing of the desert locust information. The latter will of course also depend on the dynamics of further desert locusts breeding in the region.

39
5 Policy Recommendations
● The study has shown major negative impact of the COVID-19 containment measures on farm inputs availability and access as well as farmers’ access to output sales markets. It is recommended that, given the critical role of small scale farming for food security, farming input supply chains are as much as possible excluded from COVID-19 import and transport restrictions. Farming inputs supply chains should be monitored and agro-dealers supported towards keeping stocks of fertilizers and seeds. It is recommended to improve coordination efforts to ensure timely availability of inputs, support farmers
access to inputs (e.g. strengthening of E-voucher systems), support to farm extension services, transportation and value addition across the sector. In the longer term, decreasing the dependency of agriculture on inputs by developing low inputs agricultural practices or local procurement of inputs may help mitigate shocks on the input supply chain.
● The survey confirms that credit constraints and higher than usual prices limit the access of smallholder farmers to inputs. Scale up of access to finance programs to reach smallholder farmers are likely to help mitigate that constraint and potentially avoid the shortages of cash and income due to COVID during the long rain season 2020 results in further impact on the next season input use, production and farmers income. Access to social protection or social safety net programmes can also be recommended for poor households to protect against long-term effects of post COVID-19 containment measures in the effort to enhance their resilience to future shocks.
● Digital financial services to smallholders have the potential to provide faster delivery of credit either for agricultural inputs or of income support to farmers. If well designed, improved access to credit of farmers through digital solutions could be further supported.
● The shift of cultivation to maize should be further investigated. The 2020 above average maize production might to some extent have been obtained at the expense of crop diversity and shifts from cash crop to staple crops. With the constantly worrying nutrition situation in Kenya this quantity versus quality aspect could be an important factor to look. Planting of vegetables and diversified food crops should be further supported. Furthermore, some farmers may be planting maize with no qualified advice about which would be the best crop. Looking at ways of deriving and supplying such advice would help the decision.
● The 2020 crop production was overall not severely affected by the multiple stressors including COVID-19, floods and desert locusts and the abundant rainfall led to a close to average production in the main agricultural areas. However, in the case of low or irregular rainfall the impact of COVID on food production could be much more severe than during the 2020 long rains. Also it can be expected that the continuation of the COVID-19 pandemic with its detrimental effects on the economy will have negative impacts on food production which go beyond the 2020 long rains season. Further monitoring is recommended.
● For Desert Locust impact assessment we recommend more efficient ground data collection from the
early stages of the invasion and strengthening of the DL early warning systems. Although locusts control interventions have been scaled up in Kenya and are perceived to be adequate, monitoring and control systems have partially become obsolete and understaffed in neighbouring countries over time during the years with little invasions. Satellite data derived information has not yet proven to make a big difference in locusts swarms monitoring nor in impact assessment in this study, but this is to some extent due to lack of timely high-quality ground information and should be further investigated for areas with major impact (e.g. in Somalia and Ethiopia).
● Based on interviews done for this study the impression was gained (but not confirmed by a specific question) that transport restrictions led to an increase in the number of unserious middlemen in the sales chain resulting in lower-than-expected prices for farmers desperate to sell their crops in order to have cash for life in general but also to buy inputs. To reduce this kind of risk it is recommended to strengthen the warehouse receipt system, whereby farmers can store their harvests against receipts, which can then be used to obtain credits. This would avoid the need for panic sales at low prices.

40
● Extension services: Kenya operates a scheme whereby government employees travel the country, providing advice to farmers through their contacts at county and ward level. During COVID-19, this scheme, which relies on ease of physical movement, was severely disrupted. An obvious solution here is to strengthen e-extension services using digital technology. In general, it is recommended to support the capacity building of farmers on the use and benefits of digital agricultural tools such as e-extension, digital marketplace and digital transactions to ensure correct and timely flow of information and services amidst containment regulations. This can include supporting sensitization campaigns for Kenyans on the integral role of good nutrition in the fight against the pandemic.
● The survey shows that a computer assisted phone survey of farmers can be organized quickly and is flexible in terms of adapting the questionnaires to specific survey needs. Such surveys are a valid tool for COVID-19 impact assessment on food value chains and can be repeated easily in time (e.g. for different waves). The survey has been successful in reaching and engaging smallscale farmers quickly, though it is representative only for farmers already registered in the agriBORA database. Similar surveys could be scaled up by including also farmers from other networks and extending to other geographic areas.

41
References
Aerospace Information Research Institute, Chinese Academy of Sciences , Report of Monitoring and Assessment of Desert Locust in Africa and Asia 2020 (No. 1-12).
agriBORA (2020). Report on Impact of Desert Locust (and COVID-19) on Livelihoods in Selected Kenyan Counties. Initial draft B.
FAO, July 2020. Impact of COVID-19 on agriculture, food systems and rural livelihoods in Eastern Africa: Policy and programmatic options. https://reliefweb.int/sites/reliefweb.int/files/resources/CB0552EN.pdf.
60__Decibles (website). How are Kenyan Farmers Faring in the Face of COVID-19?: https://app.60decibels.com/COVID-19/agriculture#explore
FNSWG (Food Security and Nutrition Working Group), September 2020, East Africa Regional Desert Locust Impact Monitoring
Government of Kenya, 2020, THE 2020 LONG RAINS SEASON ASSESSMENT REPORT
Kenya Economic Survey 2017, KNBS , July 2017; Quarterly Gross Domestic Product Report 2017 Q1 Statistical Release, KNBS, July 2017.
Kenya Red Cross, June 2020, Impact of Desert Locust Invasion in Kenya,.
Meynard, C. N., Lecoq, M., Chapuis, M.-P., & Piou, C. (2020). On the relative role of climate change and management in the current desert locust outbreak in East Africa. Global Change Biology, 26(7), 3753–3755. https://doi.org/https://doi.org/10.1111/gcb.15137
Nechifor V., Ferrari E., Kihiu E., Laichena J. Omanyo D., Musamali R., Kiriga B., COVID-19 impacts and short-term economic recovery in Kenya, EUR 30296 EN, Publications Office of the European Union, Luxembourg, 2020, ISBN 978-92-76-19424-8,
doi:10.2760/767447, JRC121284Precision Agriculture for Development (website), Introducing our Updated COVID-19 Dashboard, https://precisionag.org/COVID-19-dashboard-2-0/#more-1181
Roussi, A. 2020. Kenya farmers face uncertain future as COVID-19 cuts exports to EU. Financial Times, June 4, 2020. (also available at https://www.ft.com/content/05284de8-c19f-46de-9fe7- 482689be364b).
Reliefweb, May 11, 2020. “Eastern Africa Region (2020). Floods and Locust Outbreak Snapshot (May 2020).”. https://reliefweb.int/report/ethiopia/eastern-africa-region-floods-and-locust-outbreak-snapshot-may-2020
Tillie, P., Boti, D., Zeze, P. et Gomez-Y-Paloma, S. 2020 Impacts du COVID-19 sur les ménages ruraux en Côte d’Ivoire. Draft.
42
Glossary
Term Meaning
Aggregator A person or organization which buys crops direct from the farmers.
Agro-processor An organisation which buys, directly or indirectly crops and processes them before selling on to consumers.
Agro-dealer A person or organisation which sells equipment, seeds, fertiliser, pesticide and other goods to farmers.
Contracted (crops) Crops grown under an agreement with a buyer.
COVID-19 Corona virus disease 2019
Non-contracted (crops) Crops grown without any pre-existing agreements between a farmer and a buyer.
NDVI Normalised Difference Vegetation Index - a spectral vegetation index commonly employed as a proxy of green standing biomass in Remote Sensing analysis.
Panel A list of farmers who have been selected to be contacted for the survey
Remote Sensing Images taken of the earth from altitude. In this document Remote Sensing refers to images taken from satellites.
Smallholder farmers Farmers cultivating farms under 2ha
Strata A partition of a large data sample that can be defined as homogeneous.
Value Chain Used interchangeably (1) to describe the different crops covered in the survey and (2) to describe the different actors in the agricultural chain from production to consumption.

43
List of figures
Figure 1. Counties of Agro-processors Interviewed 12
Figure 2. Counties where selected crops are growing 14
Figure 3. Crops grown during (LR) season. 17
Figure 4. Nature of main crops grown. 17
Figure 5. Farmer’s input stocks in July-August 2020 23
Figure 6. Proportion of Harvest Usually Sold 24
Figure 7. Counties Affected by Floods and Desert Locusts 25
Figure 8. Locust Presence peak months 28
Figure 9. Location of selected affected farmlands: Vihiga, Uasin Gishu, West Pokot and
Trans Nzoia 32
Figure 10. Satellite images of Vihiga farm (farm 1) 33
Figure 11. Temporal NDVI profile of Vihiga (Farm 1) 34
Figure 12. Average temporal NDVI profile of farm I 34
Figure 13. Average NDVI over a period of month before and after peak infestation date
for the affected and control farms (data from Table 27) 35

44
List of tables
Table 1. Summary of Key Points of the Survey 9
Table 2. Numbers of aggregators and agri- processors Consulted 11
Table 3. Smallholder farmers basic characteristics (N=1026) 15
Table 4. Respondents family size. 16
Table 5. Primary and secondary Sources of income 16
Table 6. Level of income generating from either primary or secondary sources per
annum 16
Table 7. Alternative income sources 18
Table 8. Main channels of COVID-19 pandemic and containment measures have affected
primary and secondary sources of income 20
Table 9. Comparison of contract farming before and after COVID-19 (July-August 2020)
20
Table 10. Main constraints during March-June (Planting period) 21
Table 11. Respondents reporting crops yet to be harvested and will expect to be
harvested 21
Table 12. Farmers experiencing challenges for selling harvested crops (July -August
2020) and will expect challenges 21
Table 13. Inputs Farmers had constrained during March-June 2020 and July-August
2020 22
Table 14. changes in inputs prices level after evolution of COVID-19 22
Table 15. Farmers access to farm loans and subsidy incentives (July-August 2020) 23
Table 16. Flooding and desert locust experienced during July-August 2020. 26
Table 17. If experienced flooding, extent of its impacts on: 26
Table 18. Stages at which the desert locust had affected crops 27
Table 19. Type of treatment applied to control desert locust 27
Table 20. Extent of farmland, crops and yields affected by desert locust 27
Table 21. Estimated crop loss due to desert locust 28
Table 22. Size of farm replanted due to desert locust infestation 28
Table 23. Extent of desert locust impacts on pastureland 28
Table 24. Reasons for reducing food quantity and diversity (N=635) 29
Table 25. If reduced quantity and diversity, changes in consumption July-August 2020
(Multiple responses) 30
Table 26. Peak interstation dates and images dates, ’before- and after-infestation’’
comparative analysis for the four farms 32
Table 27. Variation of NDVI values between two periods 35

45
Annex A
Annex A1. Access to inputs during March-June 2020 and July-August 2020
March-June 2020 July-August 2020
N % N %
Missing 63 6.14 Don't need inputs during the season 50 4.87 198 19.30 No 228 22.22 232 22.61 Yes 748 72.9 533 51.95
Total 1026 100 1026 100.0
Annex A2. Last conditions of your crops yet to harvest
N %
Don't Know 10 1.35 Exceptionally high 21 2.83 Exceptionally low 66 8.88 Less than average 302 40.65 On average 236 31.76 More than average 108 14.54
Total 743 100
Annex A3. What determines the current condition of your crops yet harvested?
N %
Crop Disease 32 4.31 Desert Locusts 29 3.9 Other pests 30 4.04 Below average rainfall 30 4.04 Average rainfall 110 14.8 Above average rainfall 187 25.17 Flooding 163 21.94 Inability to access farm due to COVID-19 4 0.54 Lack of inputs due to low availability 84 11.31 Lack of working force at field preparation 5 0.67 Other (Specify) 69 9.29
Total 674 100
Annex A4. Nature of desert locust
N %
Crawling only 53 32.73 Flying 110 67.27
Total 163 100
Annex A5. Number of times farmers faced desert locust
N %
Once 61 37.42 Twice 62 38.04 Thrice 28 17.18 >3 12 7.36 Total 163 100

46
Annex A6. Desert locust treatment period
Period 1 Period 2
N % N %
Before 12 17.14 61 87.14 During 58 82.86 9 12.86
Total 70 100 70 100
Note: Period 1 refers to when the locust appeared for the first time and period 2 when happened for the second time etc.
Annex A7. Treatment effectiveness for desert locust infestation on the farm
N %
I cannot tell 1 1.43 No 6 8.57 To some extent 32 45.71 Was too late 1 1.43 Yes 30 42.86
Total 70 100
Annex A8. Respondents perception about their pastureland conditions
N %
Don't Know 1 0.24 Exceptionally good 26 6.31 Exceptionally poor 11 2.67 Less than average 61 14.81 On average 231 56.07 More than average 82 19.9
Total 412 40.16
Annex A9. Key drivers of pastureland
N %
Crop Disease 4 0.97 Desert Locusts 11 2.67 Other pests 3 0.73 Above average rainfall 84 20.39 Average rainfall 190 46.12 Below average rainfall 32 7.77 Flooding 14 3.4 Lack of inputs due to low availability 11 2.67 Lack of working force at field preparation 1 0.24 Other (Specify) 62 15.05
Total 412 100
Annex A10. Changes in expenditure due to desert locust on pastureland
N %
Had to sale off animals 2 5.41 deteriorated body conditions 9 24.32 had to buy feed or had to buy more feed. 22 56.76
Total 33 100
Annex A11. Coping strategies to mitigate food insecurity and future major concerns
N %

47
Selling property 293 46.14
Receiving food assistance 101 15.91
Food shortage is a main concern 226 35.59
Note, percentage are computed from a total sample of 635 for insecure farmers.
Annex A12. Household reporting food stock for consumption and their level of income
Earnings label N %
Don’t want to say 112 17.64 < KES 25,000 219 34.49 KES 25,000- KES 50,000 146 22.99 KES 50,000 -KES 100,000 99 15.59 > KES 100,000 59 9.29
Total 635 100
Source: Authors’ computation from survey report

48
Annex B – Survey methods
The survey was carried out using Computer Assisted Telephone Interviewing (CATI). It is an interviewing mode in which an electronic device (computer/tablet/mobile) displays questions on its screen, the interviewer reads them to a respondent over a phone call and enters the respondent’s answers directly into the electronic device. While CATI will typically involve setting up call centers from where enumerators can make the phone calls to the respondents, due to the COVID-19 advisories on managing the spread of the virus by, among others, social distancing, we used the “one-person call centers” approach which basically meant that our enumerators were working from home to conduct telephone interviews with respondents. The prepared questionnaires were coded into a software platform (Survey CTO) which has both web and mobile applications for running the survey and submitting the forms after completion. The same tool was used for all phone surveys and field surveys as well. Enumerators were trained on the use of the platform. This was done remotely, keeping in mind the social distancing advisory. The data collected using the Survey CTO tool are in a .csv format and were further analyzed using python scripting language.

49
Annex C
Figure C1. Satellite images of Farm 2
Note: Satellite images of Farm 2 for the previous year (top row) and the current year (bottom row) before (left column) and after infestation (middle column). In the third column it is presented the NDVI difference for the previous (top) and the current year (below). The green circle is the farm affected and the blue circle is the control farm.

50
Figure C2. Temporal NDVI of farm 2
Note: profile for Farm 2 (above) and for the corresponding control farm (below). A 50-m buffer around farm GPS
location is used to extract profiles.
Figure C3. Average temporal NDVI profile of Farm 2
Note: average temporal NDVI profile of Farm 2 (current and previous year) for a circular area with radius 50 m, i.e. the report extent of the damaged area. doy stand for day of year.

51
Figure C4. Satellite images of Farm 3
Note: Satellite images for Farm 3 for the previous year (top row) and the current year (bottom row) before (left column) and after infestation (middle column). In the third column it is presented the NDVI difference for the previous (top) and the current year (below). The green circle is the farm affected and the blue circle is the control farm.
Figure C5. Temporal NDVI profile of Farm 3
Note. Temporal NDVI profile for Farm 3 (above) and for the corresponding control farm (below). A 30-m buffer around farm GPS location is used to extract profiles.

52
Figure C6. Average temporal NDVI of farm 3
Note: average temporal NDVI profile of Farm 3 (current and previous year) for a circular area with radius 30 m, i.e. the report extent of the damaged area. doy stand for day of year.
Figure C7. Satellite images of Farm 4
Note: Satellite images for Farm 4 for the previous year (top row) and the current year (bottom row) before (left column) and after infestation (middle column). In the third column it is presented the NDVI difference for the previous (top) and the current year (below). The green circle is the farm affected and the blue circle is the control farm.
Figure C8. Temporal NDVI profile of Farm 4

53
Note: Temporal NDVI profile for Farm 4 (above) and for the corresponding control farm (below). A 50-m buffer around farm GPS location is used to extract profiles.
Figure C9. Average temporal NDVI profile of farm 4
Note: Farm 4, average temporal NDVI profile (current and previous year) for a circular area with radius 50 m, i.e. the report extent of the damaged area. doy stand for day of year

GETTING IN TOUCH WITH THE EU
In person
All over the European Union there are hundreds of Europe Direct information centres. You can find the address of the centre nearest you at: https://europa.eu/european-union/contact_en
On the phone or by email
Europe Direct is a service that answers your questions about the European Union. You can contact this service:
- by freephone: 00 800 6 7 8 9 10 11 (certain operators may charge for these calls),
- at the following standard number: +32 22999696, or
- by electronic mail via: https://europa.eu/european-union/contact_en
FINDING INFORMATION ABOUT THE EU
Online
Information about the European Union in all the official languages of the EU is available on the Europa website at: https://europa.eu/european-union/index_en
EU publications You can download or order free and priced EU publications from EU Bookshop at: https://publications.europa.eu/en/publications. Multiple copies of free publications may be obtained by contacting Europe Direct or your local information centre (see https://europa.eu/european-union/contact_en).

XX
-N
A-
XX
XX
X-EN
-N
doi:10.2760/66626
ISBN 978-92-76-32073-9
KJ-N
A-30
628
-EN-N