impacts land clearing on australian...
TRANSCRIPT
WWF Australia Report
Authors: Dr Hal Cogger, Professor Hugh Ford,
Dr Christopher Johnson, James Holman & Don Butler.
January 2003
Impacts of Land Clearing
on Australian Wildlife
in Queensland
2
Impacts of Land Clearing on Australian Wildlife in Queensland
ABOUT THE AUTHORS
Dr Hal Cogger
Dr Hal Cogger is a leading Australian herpetologistand author of the definitive Reptiles and Amphibiansof Australia. He is a former Deputy Director of theAustralian Museum. He has participated on a rangeof policy and scientific committees, including theCommonwealth Biological Diversity AdvisoryCommittee, Chair of the Australian BiologicalResources Study, and Chair of the AustralasianReptile & Amphibian Specialist Group (IUCN’sSpecies Survival Commission). He also held aConjoint Professorship in the Faculty of Science &Mathematics at the University of Newcastle (1997-2001). He is a member of the InternationalCommission on Zoological Nomenclature and is apast Secretary of the Division of Zoology of theInternational Union of Biological Sciences. He iscurrently the John Evans Memorial Fellow at theAustralian Museum.
His research interests include the systematics andecology of Australian reptiles and frogs and the roleof threatened species in conservation biology andpolicy development.
He is senior author of the Action Plan for AustralianReptiles.
For his contribution to Australian herpetology Halwas awarded an AM by the Australian Governmentand an honorary Doctor of Science (DSc) from theUniversity of Sydney. He was awarded honorary lifemembership of the Australian Society ofHerpetologists and the American Society ofIchthyologists and Herpetologists. He is a recipient ofthe Whitley Medal of the Royal Zoological Society ofNSW.
Professor Hugh Ford
Professor Hugh Ford is one of Australia’s most seniorand respected bird scientists, with 29 years ofexperience in the ecology, behaviour andconservation of Australian birds, especially those ofeucalypt forests and woodlands.
Currently Head of School of Environmental Sciencesand Natural Resources Management, University ofNew England, he is the author of “Ecology of Birds:An Australian Perspective”, editor of two books onAustralian birds, as well as author of over 100 bookchapters and journal articles.
In 1980, Hugh Ford and Dr Howe published alandmark study of the long term conservation statusof birds in the Mount Lofty Ranges of SouthAustralia, where only about ten per cent of theoriginal 500 000 ha of native vegetation remainsintact. Using island biogeography principles, theypredicted that of the original terrestrial bird fauna ofabout 120 species, almost 50 would eventuallybecome extinct. This was the first Australian studyalerting us to the problem of an “extinction debt”.The recently started Mount Lofty Birds forBiodiversity Regional Recovery Project aims to tacklethis problem.
In 1993, Hugh Ford was awarded the Serventy Medalfor “Outstanding Services to Ornithology in the
Australasian region” by the Royal AustralasianOrnithologists Union. He is a WWF Australia Trusteeand former member of WWF’s Scientific AdvisoryPanel.
Dr Christopher Johnson
Dr Chris Johnson is an authority on the ecology andconservation of Australian marsupials. He has doneextensive research on herbivorous marsupials offorests and woodlands, including landmark studies ofthe behavioural ecology of kangaroos and wombats,the ecology of rat-kangaroos, and the sociobiology ofpossums. He has also worked on large-scale patternsin the distribution and abundance of marsupialspecies and the biology of extinction. He is a memberof the Marsupial and Monotreme Specialist Group ofthe IUCN Species Survival Commission, and hasworked on recovery plans for the northern hairy-nosed wombat, mahogany glider and northernbettong. He is currently Reader in Terrestrial Ecologyat the School of Tropical Biology, James CookUniversity, and has authored over 70 research papers.
James Holman & Don Butler
James Holman and Don Butler are the key personnelfor Canopy Consulting, a partnership specialising inthe assessment of ecological and vegetationmanagement issues.
For the past five years James Holman has assisted inproviding scientific analysis on issues pertaining tovegetation management and ecological researchactivities at the Queensland Herbarium, EPA. He hasalso been involved in the assessment of the extent ofvegetation thickening/dieback in Queensland and theNorthern Territory and also the effects of altered fireand grazing regimes on vegetation type.
James Holman’s Doctor of Philosophy (PhD)dissertation examined evolution, diversification andlevels of genetic diversity within the genusEucalyptus. Through his academic and appliedexperience he has developed an appreciation ofwoodland community dynamics and issues relevantto conservation. His experience as a molecularecologist provides another level to conservationmanagement by assessing decision options in termsof their impacts on the processes that affect levels ofgenetic diversity and therefore species/communitylong-term survival.
Don Butler has been studying, cataloguing, mappingand studying Queensland’s vegetation since 1994,including five years at the Queensland Herbarium,EPA. This experience has given Don a workingunderstanding of Queensland’s vegetation anddirectly involved him in its management.
Don Butler’s other main interest since 1995 has beena PhD on the association between seed dispersalsyndromes, other life history attributes and theireffects on the spatial distribution of rainforest plantsin south-east Queensland. His current researchinterests also include the process and impact ofenvironmental weed invasion across the state.
Impacts of Land Clearing on Australian Wildlife in Queensland
3
Executive Summary 4
1. Introduction 6Land Clearing and the Extinction Process 6
2. Definitions and Methodology 10Definitions of Native Vegetation 11Definition of Broad Vegetation Groups 11Methodology to Calculate Native Vegetation Change 13Methodology to Calculate Wildlife Impacts 14
3. Change in Extent of Native Vegetation 14Recent Clearing of Remnant Vegetation 15
4. Impacts of Land Clearing on Wildlife 17Mammals 18Birds 23Reptiles 28Remnant Trees 32
5. Future of Australia’s Wildlife 38
6. References 39
TablesTable 1: Pre-clearing (km2) and 1999 remnant (percentage of pre-clearing extent) area and 1997 - 1999
average annual clearing (km2 / yr) by Broad Vegetation Group and Bioregion XXTable 2: Summary of total number of selected mammals killed annually in Queensland by land clearing 19Table 3: Number of mammals killed annually in Queensland by land clearing (by bioregion) 19Table 4: Number of selected mammals killed annually in Queensland by land clearing (by bioregion) 20Table 5: Number of birds killed annually in Queensland by land clearing (by general vegetation type) 24Table 6: Estimates of the density of birds from a variety of habitats 25Table 7: Reductions in recording rates between the First (1980) and
the Second Bird Atlas (2000) for a selection of species 26Table 8: Number of reptiles killed annually in Queensland by land clearing 29Table 9: Number of trees cleared annually from remnant areas of
Queensland’s broad vegetation groups (1997-99) 33Table 10: Annual tree clearing in Queensland by bioregion (1997-99) 34Table 11: Number of Regional Ecosystems (REs) in each Broad Vegetation Group (BVG) 35Table 12: Ten Regional Ecosystems (RE's) with the greatest number of remnant trees cleared during 1997-99 36
FiguresFigure 1: Land clearing, landscape fragmentation and the process to extinction XXFigure 2: The extinction debt 9Figure 3: Bioregions of Queensland 13Figure 4: Native vegetation cleared since European settlement 14Figure 5: Current land clearing hot spots 15Figure 6: Diversity of native mammals by bioregion 18Figure 7: Rare or threatened mammals in each bioregion 18Figure 8: Diversity of bird species by bioregion 23Figure 9: Rare or threatened birds in each bioregion 23Figure 10: Diversity of reptile species by bioregion 28Figure 11: Rare or threatened reptiles in each bioregion 28Figure 12:Diversity of plant species (including naturalised plants) by bioregion 32Figure 13:Rare or threatened plants in each bioregion 32
TABLE OF CONTENTS
4
Impacts of Land Clearing on Australian Wildlife in Queensland
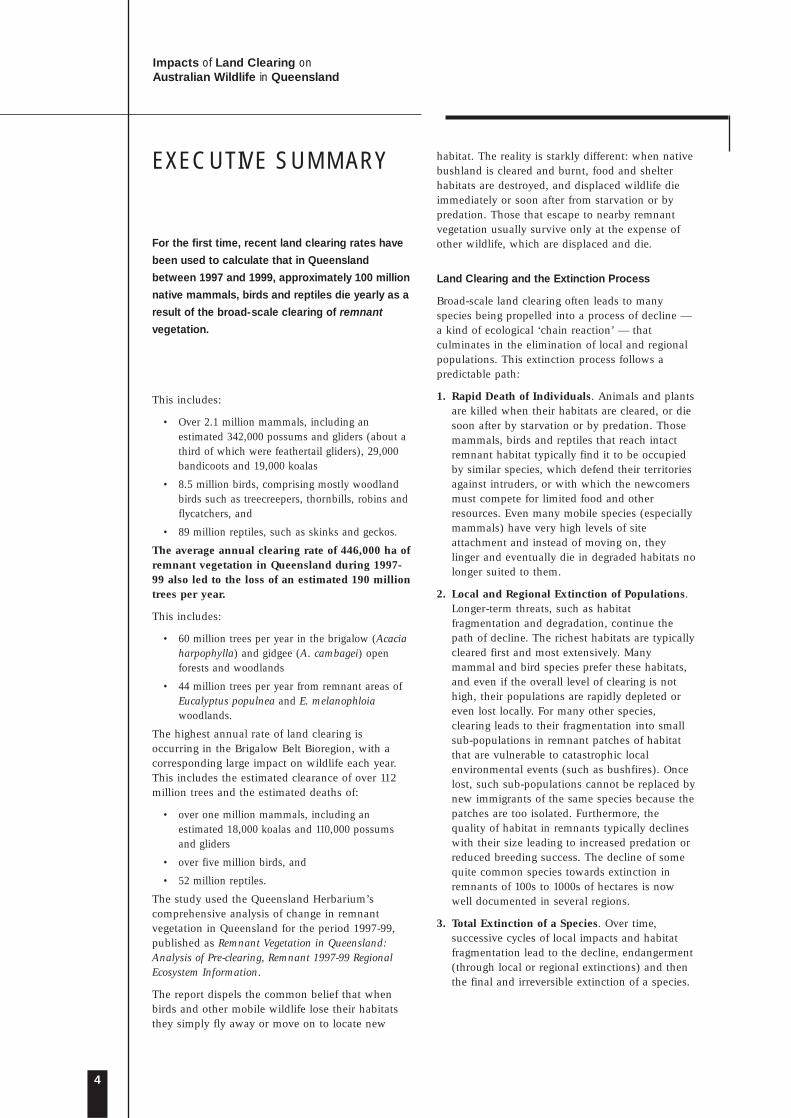
EXECUTIVE SUMMARY
For the first time, recent land clearing rates have
been used to calculate that in Queensland
between 1997 and 1999, approximately 100 million
native mammals, birds and reptiles die yearly as a
result of the broad-scale clearing of remnant
vegetation.
This includes:
• Over 2.1 million mammals, including anestimated 342,000 possums and gliders (about athird of which were feathertail gliders), 29,000bandicoots and 19,000 koalas
• 8.5 million birds, comprising mostly woodlandbirds such as treecreepers, thornbills, robins andflycatchers, and
• 89 million reptiles, such as skinks and geckos.
The average annual clearing rate of 446,000 ha ofremnant vegetation in Queensland during 1997-99 also led to the loss of an estimated 190 milliontrees per year.
This includes:
• 60 million trees per year in the brigalow (Acaciaharpophylla) and gidgee (A. cambagei) openforests and woodlands
• 44 million trees per year from remnant areas ofEucalyptus populnea and E. melanophloiawoodlands.
The highest annual rate of land clearing isoccurring in the Brigalow Belt Bioregion, with acorresponding large impact on wildlife each year.This includes the estimated clearance of over 112million trees and the estimated deaths of:
• over one million mammals, including anestimated 18,000 koalas and 110,000 possumsand gliders
• over five million birds, and
• 52 million reptiles.
The study used the Queensland Herbarium’scomprehensive analysis of change in remnantvegetation in Queensland for the period 1997-99,published as Remnant Vegetation in Queensland:Analysis of Pre-clearing, Remnant 1997-99 RegionalEcosystem Information.
The report dispels the common belief that whenbirds and other mobile wildlife lose their habitatsthey simply fly away or move on to locate new
habitat. The reality is starkly different: when nativebushland is cleared and burnt, food and shelterhabitats are destroyed, and displaced wildlife dieimmediately or soon after from starvation or bypredation. Those that escape to nearby remnantvegetation usually survive only at the expense ofother wildlife, which are displaced and die.
Land Clearing and the Extinction Process
Broad-scale land clearing often leads to manyspecies being propelled into a process of decline —a kind of ecological ‘chain reaction’ — thatculminates in the elimination of local and regionalpopulations. This extinction process follows apredictable path:
1. Rapid Death of Individuals. Animals and plantsare killed when their habitats are cleared, or diesoon after by starvation or by predation. Thosemammals, birds and reptiles that reach intactremnant habitat typically find it to be occupiedby similar species, which defend their territoriesagainst intruders, or with which the newcomersmust compete for limited food and otherresources. Even many mobile species (especiallymammals) have very high levels of siteattachment and instead of moving on, theylinger and eventually die in degraded habitats nolonger suited to them.
2. Local and Regional Extinction of Populations.Longer-term threats, such as habitatfragmentation and degradation, continue thepath of decline. The richest habitats are typicallycleared first and most extensively. Manymammal and bird species prefer these habitats,and even if the overall level of clearing is nothigh, their populations are rapidly depleted oreven lost locally. For many other species,clearing leads to their fragmentation into smallsub-populations in remnant patches of habitatthat are vulnerable to catastrophic localenvironmental events (such as bushfires). Oncelost, such sub-populations cannot be replaced bynew immigrants of the same species because thepatches are too isolated. Furthermore, thequality of habitat in remnants typically declineswith their size leading to increased predation orreduced breeding success. The decline of somequite common species towards extinction inremnants of 100s to 1000s of hectares is nowwell documented in several regions.
3. Total Extinction of a Species. Over time,successive cycles of local impacts and habitatfragmentation lead to the decline, endangerment(through local or regional extinctions) and thenthe final and irreversible extinction of a species.
Impacts of Land Clearing on Australian Wildlife in Queensland
5
% o
f exi
stin
g s
pecie
s
Year
100
95
90
85
80
75
Vegetationclearancestarts
Theextinction
debt
17
50
18
00
18
50
19
00
19
50
20
00
20
50
21
00
21
50
22
00
22
50
23
00
Vegetationclearanceends
Figure 1: The extinction debt
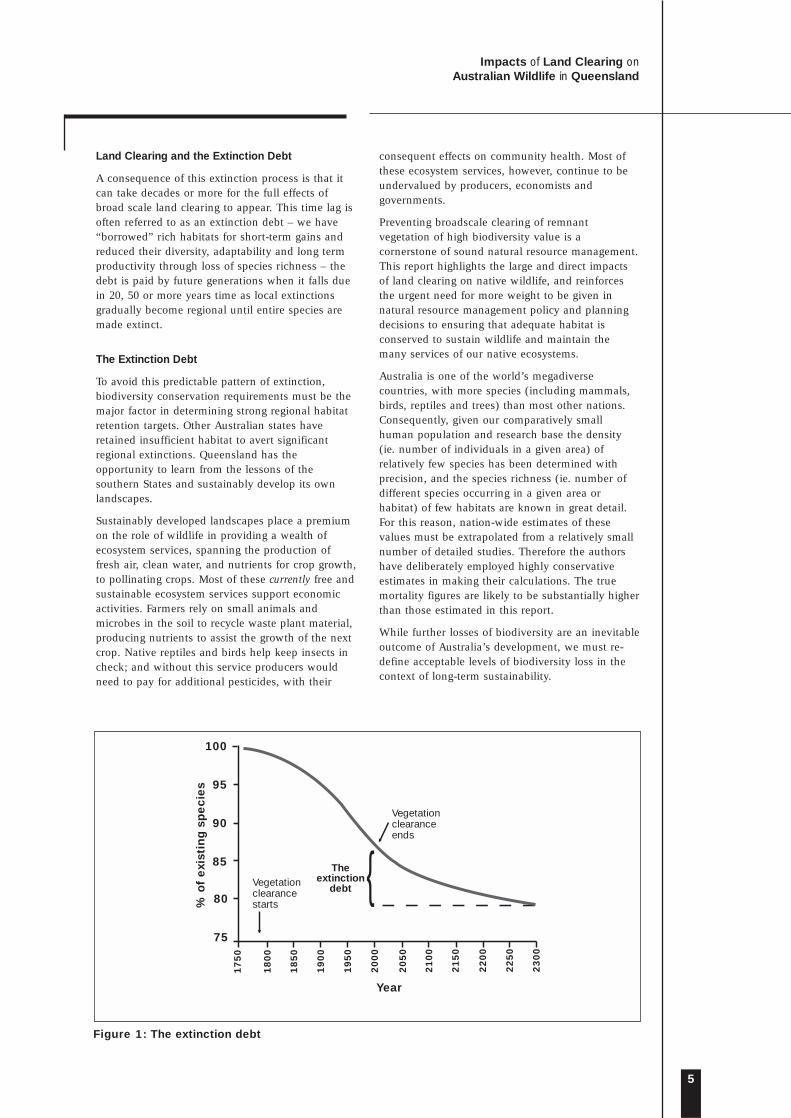
Land Clearing and the Extinction Debt
A consequence of this extinction process is that itcan take decades or more for the full effects ofbroad scale land clearing to appear. This time lag isoften referred to as an extinction debt – we have“borrowed” rich habitats for short-term gains andreduced their diversity, adaptability and long termproductivity through loss of species richness – thedebt is paid by future generations when it falls duein 20, 50 or more years time as local extinctionsgradually become regional until entire species aremade extinct.
The Extinction Debt
To avoid this predictable pattern of extinction,biodiversity conservation requirements must be themajor factor in determining strong regional habitatretention targets. Other Australian states haveretained insufficient habitat to avert significantregional extinctions. Queensland has theopportunity to learn from the lessons of thesouthern States and sustainably develop its ownlandscapes.
Sustainably developed landscapes place a premiumon the role of wildlife in providing a wealth ofecosystem services, spanning the production offresh air, clean water, and nutrients for crop growth,to pollinating crops. Most of these currently free andsustainable ecosystem services support economicactivities. Farmers rely on small animals andmicrobes in the soil to recycle waste plant material,producing nutrients to assist the growth of the nextcrop. Native reptiles and birds help keep insects incheck; and without this service producers wouldneed to pay for additional pesticides, with their
consequent effects on community health. Most ofthese ecosystem services, however, continue to beundervalued by producers, economists andgovernments.
Preventing broadscale clearing of remnantvegetation of high biodiversity value is acornerstone of sound natural resource management.This report highlights the large and direct impactsof land clearing on native wildlife, and reinforcesthe urgent need for more weight to be given innatural resource management policy and planningdecisions to ensuring that adequate habitat isconserved to sustain wildlife and maintain themany services of our native ecosystems.
Australia is one of the world’s megadiversecountries, with more species (including mammals,birds, reptiles and trees) than most other nations.Consequently, given our comparatively smallhuman population and research base the density(ie. number of individuals in a given area) ofrelatively few species has been determined withprecision, and the species richness (ie. number ofdifferent species occurring in a given area orhabitat) of few habitats are known in great detail.For this reason, nation-wide estimates of thesevalues must be extrapolated from a relatively smallnumber of detailed studies. Therefore the authorshave deliberately employed highly conservativeestimates in making their calculations. The truemortality figures are likely to be substantially higherthan those estimated in this report.
While further losses of biodiversity are an inevitableoutcome of Australia’s development, we must re-define acceptable levels of biodiversity loss in thecontext of long-term sustainability.
6
Impacts of Land Clearing on Australian Wildlife in Queensland
1 INTRODUCTION
According to the 2001 national State of the
Environment Report, land clearing is the biggest
threat to Australia’s wildlife. Currently, most
wildlife is killed in Queensland, which accounts
for over 80 per cent of the original and remnant
vegetation being cleared in Australia each year.1
Between 1997-99, an average of 446,000 hectares
of remnant vegetation were cleared each year: a
rate of over 50 hectares or 100 rugby football
fields cleared every hour.
While the role of land clearing as the main cause ofsalinity is well known, the direct and indirectimpacts of land clearing on wildlife are not widelyunderstood.
Many people believe that when birds and othermobile species have their habitats cleared, theysimply fly or move on to locate new habitat. Thereality is starkly different.
This report outlines the direct and long-termimpacts of land clearing on wildlife. For the firsttime, the estimated numbers of mammals, birds,and reptiles killed each year in Queensland hasbeen calculated, as well as the number of treescleared each year.
Land Clearing and the Extinction Process
Broad-scale land clearing often leads to manyspecies being propelled into a process of declinethat culminates in the elimination of local andregional populations. This extinction processfollows a predictable path:
1. Rapid Death of Individuals.
Animals and plants are killed when their habitatsare cleared, or die soon after by starvation orpredation. With broad-scale clearing, smallermammals and reptiles are unable to reach intacthabitat, and probably starve or are killed bypredators soon after clearing. Larger mammals andreptiles and birds may be able to reach intacthabitat. However, many mobile species (especiallymammals) have very high levels of site attachmentand instead of moving on, they linger andeventually die in degraded habitats no longer suitedto them. Those animals that do reach new habitatusually find that it is already occupied by similarspecies, many of which defend their territories
against intruders. It is improbable that manyrefugees from clearing settle into high quality sites -or if they do they may replace current occupants.Most end up in poor quality habitat, where foodand shelter are inadequate, or where they arevulnerable to predators. Even if displaced animalsdo crowd into uncleared remnants they almostcertainly do not survive for long, as the density ofmost species is no higher, and often lower, in thoseremnants compared with pre-clearing vegetation.
2. Local and Regional Extinction of Populations.
Longer-term threats, such as habitat fragmentationand degradation, continue the process of decline.The habitats on fertile soils are typically clearedfirst and most extensively. Many mammal and birdspecies prefer these habitats, and even if the overalllevel of clearing is not high, their populations arerapidly depleted or even lost locally. For manyother species, clearing leads to their fragmentationinto small sub-populations in remnant patches ofhabitat that are vulnerable to catastrophic localenvironmental events (such as bushfires). Oncelost, such sub-populations cannot be replaced bynew immigrants of the same species because thepatches are too isolated. Furthermore, the quality ofhabitat in remnants typically declines with theirsize leading to increased predation or reducedbreeding success. The decline of some quitecommon species towards extinction in remnants of100s to 1000s of hectares is now well documentedin several regions (for example see box [below/nextpage]). The pattern of local extinctions of small,isolated populations may be compounded inextensively cleared landscapes so that species maydisappear from an entire region.
3. Total Extinction of the Species.
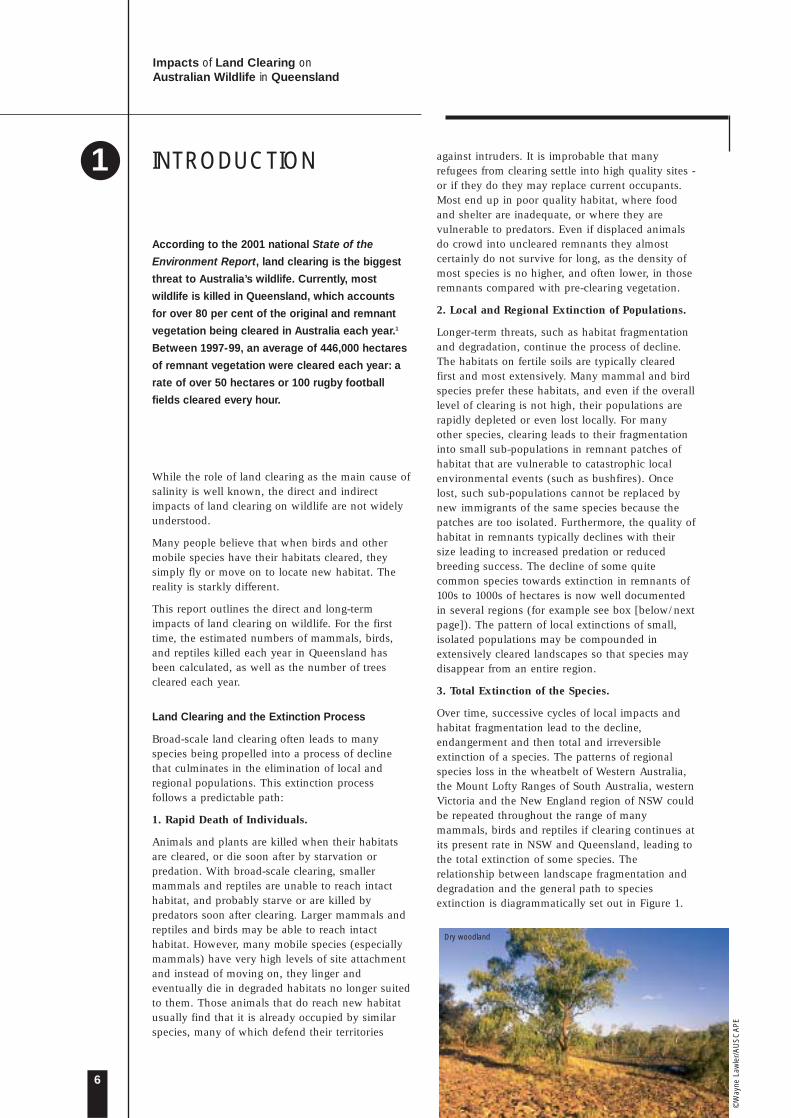
Over time, successive cycles of local impacts andhabitat fragmentation lead to the decline,endangerment and then total and irreversibleextinction of a species. The patterns of regionalspecies loss in the wheatbelt of Western Australia,the Mount Lofty Ranges of South Australia, westernVictoria and the New England region of NSW couldbe repeated throughout the range of manymammals, birds and reptiles if clearing continues atits present rate in NSW and Queensland, leading tothe total extinction of some species. Therelationship between landscape fragmentation anddegradation and the general path to speciesextinction is diagrammatically set out in Figure 1.
Dry woodland
©W
ayne
Law
ler/
AU
SC
AP
E

Degradationof bushremnantsDegradation of bush remnantsby weeds and animal pests,over-grazing, and changed fireregimes leads to further lossof food, shelter and breedingsites.
Fragmentationof landscapes
Stage 2: Local and regional extinctionsLonger term threats, such as habitat fragmentation, weedsand animal pests, continue the path of decline in caseswhere the remnant vegetation patches are too small tosustain viable populations.
Land Clearing
Stage 1: Rapid death of individualsIn Queensland, between 1997 and 1999 about 100 millionnative mammals, birds and reptiles died annually as a resultof land clearing, and an estimated 190 million remnant treeswere cleared annually.
Many of these animals, like the trees, are killed directly bythe clearing process, while the remainder die later fromstarvation, predators or stress.
The Path to Extinction
Impacts of Land Clearing on Australian Wildlife in Queensland
7
Figure 1: Land Clearing, landscape fragmentation and the path to extinction
Stage 3: Total extinctionFurther cycles of clearing, fragmentation and degradation result in the final and irreversibleextinction of a species.

8
Impacts of Land Clearing on Australian Wildlife in Queensland
The Redundancy Argument– should we worry about loss of biodiversity?
Ecosystems are intrinsically dynamic, non-linearand chaotic, making it very difficult to accuratelypredict the effects of any major disturbance on suchsystems, whether from local events such as fire orland clearing to planet-wide events such as globalwarming.2
However theoretical ecology suggests that for anyecosystem to be able to respond to the wide rangeof disturbances – perturbations – that it experiencesover time, then at any point in time somecomponents of the system (including species) mustbe redundant (ie. unnecessary) for maintaining thecurrent health and services of that ecosystem. Thishas led some ecologists to argue that some speciesare redundant and so their loss, especially of thoseon which humans do not depend for sustenance,should not significantly affect ecosystem processes.3
The same ecological theory, however, that arguesthe case for redundancy also postulates that ifredundancy is reduced in an ecosystem, so too isthe ability of that system to respond to short- and
long-term disturbances. In other words, loweringthe level of redundancy (rather than biodiversity perse) in a system may not have any immediate effectsbut results in lowered fitness of the system to beable to respond to change, so putting in jeopardythe long-term adaptability and viability of thatsystem and the range of services it can provide – ie.its resilience is compromised. The greater asystem’s resilience, the greater is its insurancevalue.4 Given current and anticipated levels ofclimate change, such reductions in fitness couldseriously reduce our future options in sustainablyutilising Australia’s diverse ecosystems.
Land clearing January 2003
©Fr
ance
sca
And
reon
i/WW
F/TW
S
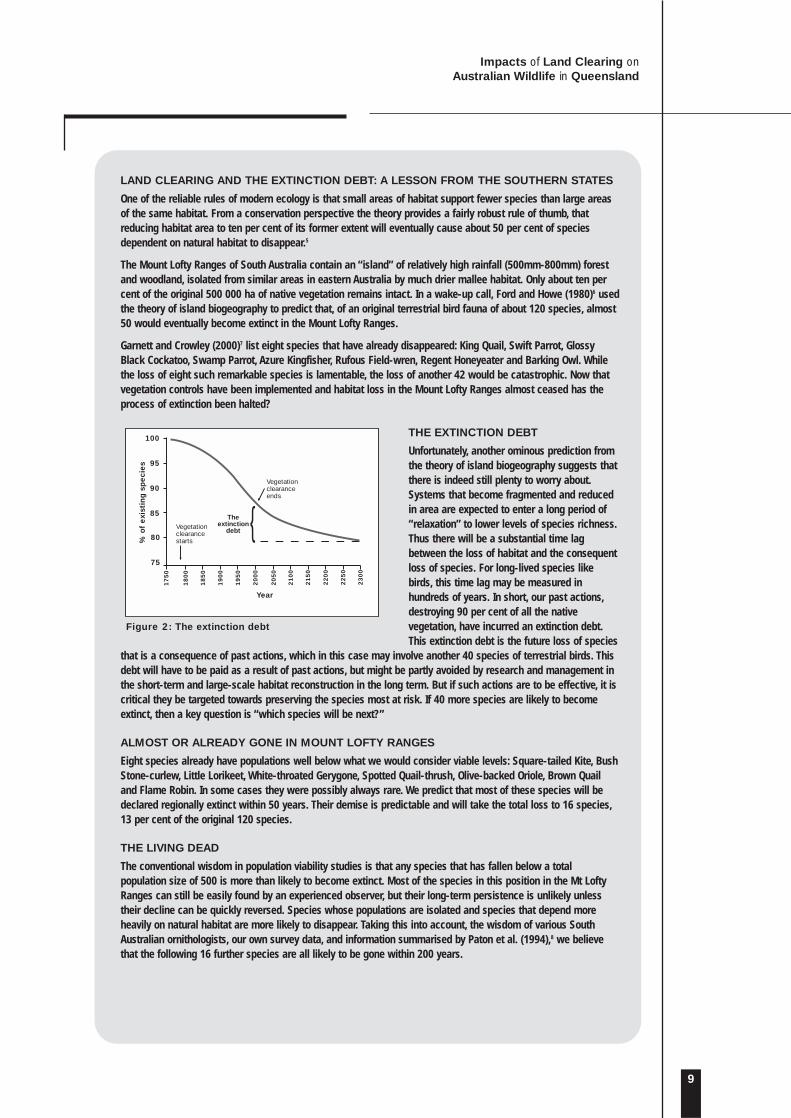
LAND CLEARING AND THE EXTINCTION DEBT: A LESSON FROM THE SOUTHERN STATES
One of the reliable rules of modern ecology is that small areas of habitat support fewer species than large areasof the same habitat. From a conservation perspective the theory provides a fairly robust rule of thumb, thatreducing habitat area to ten per cent of its former extent will eventually cause about 50 per cent of speciesdependent on natural habitat to disappear.5
The Mount Lofty Ranges of South Australia contain an “island” of relatively high rainfall (500mm-800mm) forestand woodland, isolated from similar areas in eastern Australia by much drier mallee habitat. Only about ten percent of the original 500 000 ha of native vegetation remains intact. In a wake-up call, Ford and Howe (1980)6 usedthe theory of island biogeography to predict that, of an original terrestrial bird fauna of about 120 species, almost50 would eventually become extinct in the Mount Lofty Ranges.
Garnett and Crowley (2000)7 list eight species that have already disappeared: King Quail, Swift Parrot, GlossyBlack Cockatoo, Swamp Parrot, Azure Kingfisher, Rufous Field-wren, Regent Honeyeater and Barking Owl. Whilethe loss of eight such remarkable species is lamentable, the loss of another 42 would be catastrophic. Now thatvegetation controls have been implemented and habitat loss in the Mount Lofty Ranges almost ceased has theprocess of extinction been halted?
THE EXTINCTION DEBT
Unfortunately, another ominous prediction fromthe theory of island biogeography suggests thatthere is indeed still plenty to worry about.Systems that become fragmented and reducedin area are expected to enter a long period of“relaxation” to lower levels of species richness.Thus there will be a substantial time lagbetween the loss of habitat and the consequentloss of species. For long-lived species likebirds, this time lag may be measured inhundreds of years. In short, our past actions,destroying 90 per cent of all the nativevegetation, have incurred an extinction debt.This extinction debt is the future loss of species
that is a consequence of past actions, which in this case may involve another 40 species of terrestrial birds. Thisdebt will have to be paid as a result of past actions, but might be partly avoided by research and management inthe short-term and large-scale habitat reconstruction in the long term. But if such actions are to be effective, it iscritical they be targeted towards preserving the species most at risk. If 40 more species are likely to becomeextinct, then a key question is “which species will be next?”
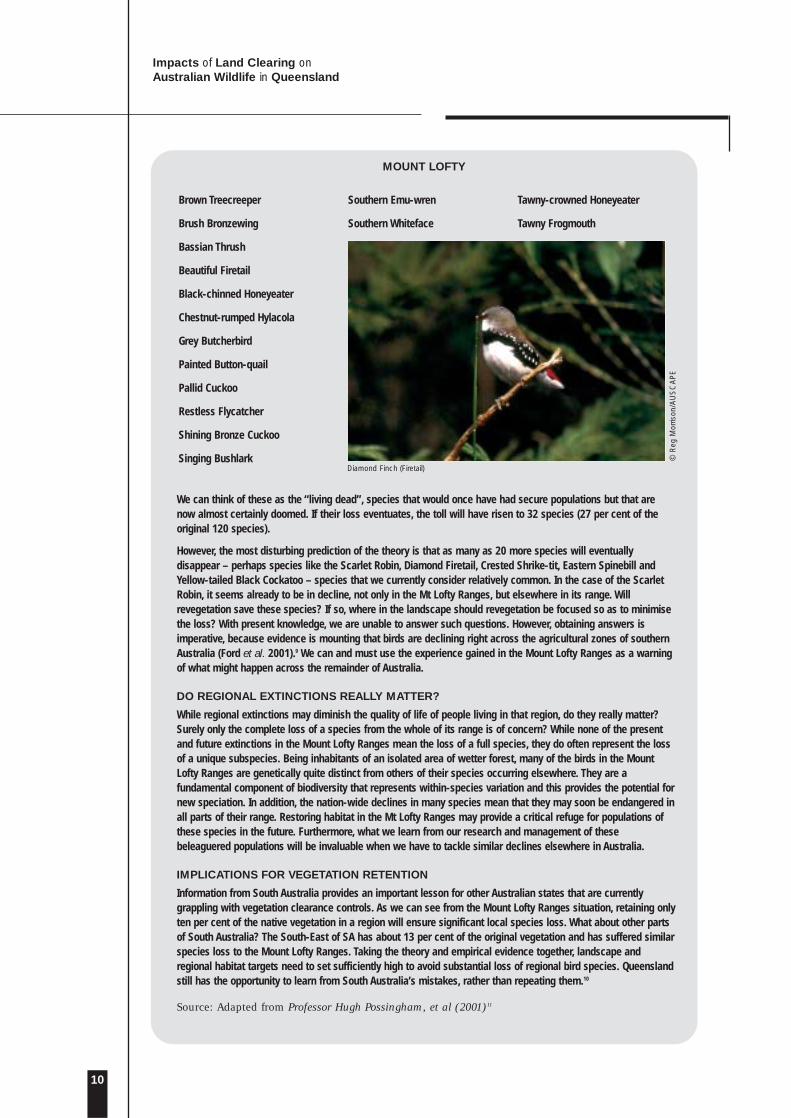
ALMOST OR ALREADY GONE IN MOUNT LOFTY RANGES
Eight species already have populations well below what we would consider viable levels: Square-tailed Kite, BushStone-curlew, Little Lorikeet, White-throated Gerygone, Spotted Quail-thrush, Olive-backed Oriole, Brown Quailand Flame Robin. In some cases they were possibly always rare. We predict that most of these species will bedeclared regionally extinct within 50 years. Their demise is predictable and will take the total loss to 16 species,13 per cent of the original 120 species.
THE LIVING DEAD
The conventional wisdom in population viability studies is that any species that has fallen below a totalpopulation size of 500 is more than likely to become extinct. Most of the species in this position in the Mt LoftyRanges can still be easily found by an experienced observer, but their long-term persistence is unlikely unlesstheir decline can be quickly reversed. Species whose populations are isolated and species that depend moreheavily on natural habitat are more likely to disappear. Taking this into account, the wisdom of various SouthAustralian ornithologists, our own survey data, and information summarised by Paton et al. (1994),8 we believethat the following 16 further species are all likely to be gone within 200 years.
Impacts of Land Clearing on Australian Wildlife in Queensland
9
% o
f exi
stin
g s
pecie
s
Year
100
95
90
85
80
75
Vegetationclearancestarts
Theextinction
debt
1750
1800
1850
1900
1950
2000
2050
2100
2150
2200
2250
2300
Vegetationclearanceends
Figure 2: The extinction debt
10
Impacts of Land Clearing on Australian Wildlife in Queensland
Brown Treecreeper
Brush Bronzewing
Bassian Thrush
Beautiful Firetail
Black-chinned Honeyeater
Chestnut-rumped Hylacola
Grey Butcherbird
Painted Button-quail
Pallid Cuckoo
Restless Flycatcher
Shining Bronze Cuckoo
Singing Bushlark
Southern Emu-wren
Southern Whiteface
Tawny-crowned Honeyeater
Tawny Frogmouth
We can think of these as the “living dead”, species that would once have had secure populations but that arenow almost certainly doomed. If their loss eventuates, the toll will have risen to 32 species (27 per cent of theoriginal 120 species).
However, the most disturbing prediction of the theory is that as many as 20 more species will eventuallydisappear – perhaps species like the Scarlet Robin, Diamond Firetail, Crested Shrike-tit, Eastern Spinebill andYellow-tailed Black Cockatoo – species that we currently consider relatively common. In the case of the ScarletRobin, it seems already to be in decline, not only in the Mt Lofty Ranges, but elsewhere in its range. Willrevegetation save these species? If so, where in the landscape should revegetation be focused so as to minimisethe loss? With present knowledge, we are unable to answer such questions. However, obtaining answers isimperative, because evidence is mounting that birds are declining right across the agricultural zones of southernAustralia (Ford et al. 2001).9 We can and must use the experience gained in the Mount Lofty Ranges as a warningof what might happen across the remainder of Australia.
DO REGIONAL EXTINCTIONS REALLY MATTER?
While regional extinctions may diminish the quality of life of people living in that region, do they really matter?Surely only the complete loss of a species from the whole of its range is of concern? While none of the presentand future extinctions in the Mount Lofty Ranges mean the loss of a full species, they do often represent the lossof a unique subspecies. Being inhabitants of an isolated area of wetter forest, many of the birds in the MountLofty Ranges are genetically quite distinct from others of their species occurring elsewhere. They are afundamental component of biodiversity that represents within-species variation and this provides the potential fornew speciation. In addition, the nation-wide declines in many species mean that they may soon be endangered inall parts of their range. Restoring habitat in the Mt Lofty Ranges may provide a critical refuge for populations ofthese species in the future. Furthermore, what we learn from our research and management of thesebeleaguered populations will be invaluable when we have to tackle similar declines elsewhere in Australia.
IMPLICATIONS FOR VEGETATION RETENTION
Information from South Australia provides an important lesson for other Australian states that are currentlygrappling with vegetation clearance controls. As we can see from the Mount Lofty Ranges situation, retaining onlyten per cent of the native vegetation in a region will ensure significant local species loss. What about other partsof South Australia? The South-East of SA has about 13 per cent of the original vegetation and has suffered similarspecies loss to the Mount Lofty Ranges. Taking the theory and empirical evidence together, landscape andregional habitat targets need to set sufficiently high to avoid substantial loss of regional bird species. Queenslandstill has the opportunity to learn from South Australia’s mistakes, rather than repeating them.10
Source: Adapted from Professor Hugh Possingham, et al (2001)11
MOUNT LOFTY
© R
eg M
orris
on/A
US
CA
PE
Diamond Finch (Firetail)
Impacts of Land Clearing on Australian Wildlife in Queensland
11
2
This study of the impact of land clearing on
Queenland’s wildlife is based on the Queensland
Herbarium’s definitions and analysis of clearing of
remnant vegetation 1997-99 in Queensland. The
report, Remnant Vegetation in Queensland:
Analysis of Pre-clearing, Remnant 1997-99
Regional Ecosystem Information, provides the
most robust and comprehensive analysis of
recent clearing patterns of remnant vegetation in
Queensland.12
Definitions of Native Vegetation
The Queensland Herbarium defines Pre-clearingvegetation as the vegetation present before clearing.This has been determined from remainingvegetation, aerial photographs, and from existingknowledge of the ecology and history of remnantareas.
Remnant vegetation is defined as vegetation wherethe predominant layer of the vegetation is stillintact, ie. has at least 50 per cent of the cover andmore than 70 per cent of the height, and is madeup of species characteristic of the vegetation’sundisturbed predominant layer. This definitionincludes all woody structural formations as well asthose dominated by shrubs, grasses and other lifeforms.
Definition of Land Clearing
Land clearing consists of the destruction of theabove ground biomass of native vegetation and itssubstantial replacement by non-local species or byhuman artefacts. It includes clearance of nativevegetation for crops, pasture, plantations, gardens,houses, mines, buildings and roads.
Definition of Broad Vegetation Groups
The Queensland Herbarium defines 18 BroadVegetation Groups (BVGs) to summarise the extentof each group and current clearing rates.
The BVGs used in the Herbarium analysisencompass vegetation types that are frequentlydominated by a single species, e.g. Eucalyptustetrodonta (BVG3), Acacia aneura (BVG12) or suite
DEFINITIONS ANDMETHODOLOGY
of species, e.g. the Acacia spp. usually on residualranges (BVG10) or Eucalypt woodlands on ranges(BVG1). Other groups are dominated by a structuralformation, e.g. grasslands (BVG14) or rainforestsand vine thickets (BVG15) or are defined byspecialised habitats such as the intertidal areas(BVG17) and wetlands (BVG16). Botanicalnomenclature here follows Henderson (2002),13 anda list of frequently used common names is given inAppendix 3.
1. Eucalypt woodlands on ranges. Widespreadacross coastal and subcoastal regions, generallyon steep hills and ranges with shallow rockysoils. Characteristic species include ironbarks(Eucalyptus crebra, E. cullenii, E. decorticans, E.dura, E. fibrosa, E. shirleyi), bloodwoods(Corymbia citriodora, C. erythrophloia, C.intermedia, C. clarksoniana, C. leichhardtii, C.trachyphloia), and a wide range of other speciessuch as E. cloeziana and E. acmenoides.
2. Eucalypt open forest. Occurs mainly in higherrainfall coastal and to a lesser extent subcoastalregions and generally on hills and ranges withshallow soils. Main species include Eucalyptusgrandis, E. saligna, E. pilularis, E. microcorys, E.acmenoides, Corymbia citriodora, E. laevopinea, E.montivaga, E. propinqua and E. major.
3. Eucalyptus tetrodonta woodlands – open forest.Occurs on flat to undulating plains with deepsandy, often red soils, in Cape York Peninsulaand adjacent parts of North Queensland.Associated species include Corymbia nesophila, C.stockeri, C. clarksoniana, C. hylandii, E. miniataand E. phoenicea.
4. Eucalyptus similis and E. whitei woodlands.Occurs on undulating plains with infertile redearth sandy soils in the Desert Uplands,Einasleigh Uplands and adjacent parts ofsurrounding regions. Associated species includeCorymbia setosa and E. melanophloia.
5. Eucalyptus populnea and E. melanophloiawoodlands. Generally occurs on flat toundulating plains and low hills usually withmoderately deep, often texture contrast soils.This vegetation type is widespread in theBrigalow Belt, Desert Uplands and eastern partof the Mulga Lands bioregions. E. browniireplaces E. populnea approximately north of 23oS(with both species present in different habitatsbetween 21oS and 23oS).
6. Mixed eucalypt woodlands on flat toundulating plains and low rises often withsandy texture contrast soils. Variable groupwhich is widespread in all regions apart fromthe more arid Channel Country and MulgaLands. Frequent dominant species includeEucalyptus mollucana, E. microcarpa, E. crebra, E.orgadophila, bloodwoods (Corymbia clarksoniana,
12
Impacts of Land Clearing on Australian Wildlife in Queensland
C. dallachiana, C. polycarpa, C. plena, C.terminalis, C. papuana, C tessellaris), E. conica,Angophora leiocarpa, and in northern areas E.platyphylla and E. chlorophylla. This type includesCypress Pine Callitris spp. dominated regionalecosystems that occur on sandy soils in theBrigalow Belt and western parts of the MulgaLands bioregions.
7. Eucalyptus microneura and other boxwoodlands. Restricted to the EinasleighUplands, Gulf Plains and North-west Highlandsbioregions. Associated species include Eucalyptuschlorophylla, E. pruinosa, E. tectifica, Lysiphyllumcunninghamii and Erythrophleum chlorostachys.
8. Eucalyptus leucophloia low open woodlands onranges with shallow soils. Associated speciesinclude E. persistens, E. normantonensis andCorymbia spp. E. leucophylla dominated regionalecosystems are widespread in the North-westHighlands and extend into adjacent parts of theMitchell Grass Downs, Gulf Plains and ChannelCountry bioregions. E. persistens dominatedregional ecosystems occur in the Brigalow Belt,Desert Uplands, Einasleigh Uplands and adjacentparts of neighboring bioregions.
9. Riparian eucalypt woodland. Wide range ofregional ecosystems fringing drainage lines andspreading onto adjacent floodplains. Frequent inall bioregions except the Central QueenslandCoast where rainforests usually fringe thedrainage lines. Eucalyptus tereticornis is acommon dominant along coastal drainage lineswhile E. camaldulensis is more frequent inland.Frequent dominants of western flood andalluvial plains include E. coolibah, E. ochrophloia,E. microtheca and E. largiflorens.
10.Acacia spp. woodlands and shrublands.Widespread on ranges with shallow, rocky soilsin the Gulf Plains and all inland bioregions.Characteristic species include Acacia catenulataor A. shirleyi, and A. stowardii in more westernregions.
11.Acacia harpophylla or A. cambagei open forestsand woodlands. Occur on flat to undulatingplains with fertile, clay soils. A. harpophyllacommunities occur mainly in the Brigalow Beltbut also the moister parts of the more westernbioregions. A. cambagei replaces A. harpophyllain the western parts of the Brigalow Belt and iswidespread across the Desert Uplands, MitchellGrass Downs, Mulga Lands and southern partsof the Gulf Plains bioregions. Associated orlocally dominant species include A.argyrodendron, A. melvillei, A. georginea,Casuarina cristata and/or Eucalyptus spp. such asE. populnea, E. cambageana, and E. thozetiana.
12.Acacia aneura woodlands and shrublands.Generally occurs on flat to undulating plains
with infertile red sandy earth soils in the MulgaLands and adjacent parts of the ChannelCountry, Desert Uplands and Mitchell GrassDowns bioregions. Emergent eucalypts such asEucalyptus populnea and E. melanophloia may bepresent in more eastern parts of its distribution.
13.Triodia spp. hummock grasslands. Occur onarid inland dunefields and sandplains which aremost extensive in the Channel Countrybioregion. Scattered shrubs and sometimes lowtrees can occur. Zygochloa paradoxa grasslandsand Crotalaria forblands which occur on thedunefields in the Simpson Desert are included inthis group.
14.Native Grasslands. Occur on flat to undulatingplains with clay soils, usually derived fromalluvium or sedimentary rocks. Dichanthium spp.characterise higher rainfall areas particularly inthe Brigalow Belt and Gulf Plains, while Astreblaspp. tend to dominate in the Mitchell GrassDowns (where scattered tree species may bepresent), Mulga Lands and Channel Countrybioregions. Areas seasonally dominated by shortgrasses (e.g. Eragrostis, Aristida spp.) or forbs(eg. Asteraceae and Chenopodiaceae spp.) arewidespread on alluvial or gravelly plains theChannel Country, Mitchell Grass Downs andMulga Lands. Grasslands in the coastal regionsare dominated by other species such as Themedaarguens, Imperata cylindrica or Sorghum spp.
15.Rainforests and vine thickets. Best developedin the extensive areas of complex tropical andsubtropical rainforests that occur in the WetTropics, Central Queensland Coast, South-eastQueensland and Cape York Peninsula bioregions.The Brigalow Belt and Einasleigh Uplandsbioregions support less complex and generallyless diverse drier rainforest and vine thicketswhich often occur in small scattered pockets.
16.Wetlands. Occur in all bioregions although oftenof limited extent. There are a wide range ofwetlands types including ephemeral topermanent lakes, billabongs and the northernfloodplains supporting sedgelands or mixedsedge/grasslands on northern floodplains. Bareclaypans and swamps supporting Chenopodiumauricomum, Eragrostis australasica, Muehlenbeckiaflorulenta or samphire species (eg. Halosarciaspp.) communities occur in arid parts of thestate. Includes Melaleuca (M. argentea, M.fluviatilis, M. leucadendra, M. dealbata, M.quinquenervia, M. viridiflora) swamps that occurin coastal regions.
17.Mangroves and strand communities. Occuralong the entire coast on tidally inundatedestuarine deposits. Frequent species includemangroves (eg. Avicennia marina, Rhizophoraspp., Ceriops tagal), samphire species (eg.
Impacts of Land Clearing on Australian Wildlife in Queensland
13
Halosarcia spp.), and the grass Sporobolusvirginicus. Strand communities occur on beachor coastal sand dunes and include Casuarinaequisetifloia woodlands, Spinifex spp. grasslandsand a range of eucalypt woodlands and mixedshrublands
18. Heath or mixed shrublands. Generally occuron sandy infertile soils, predominantly in thecoastal bioregions. Dominant species includeAsteromyrtus spp., Neofabricia spp., Micromyrtusspp., Acacia spp. and Leucopogon spp. Theground layer is dominated by Triodia spp. inseveral regional ecosystems in this group.Includes shrublands and woodlands dominatedby Banksia spp., Eucalyptus spp. or otherspecies on coastal dunes and rocky headlands.
Methodology to Calculate Native Vegetation Change
The Herbarium report provides referenceinformation and statistics for Queensland’s regionalecosystems based on the best available regionalscale mapping (1:100,000 scale) generated by theQueensland Herbarium’s vegetation and regionalecosystem survey and mapping program. Theregional ecosystem information has been compiledat a scale of 1:100,000. At this scale, areas that arebelow the recommended minimum area of 20hectares (or, if elongated, 27 hectares) for a mapscale of 1:100,000, and areas of heavily disturbedand/or regrowth may not be included.
Queensland Herbarium mapping uses 1:80 000scale aerial photography, flown in the 1960s,together with other historical data sources such assurvey reports, and extensive field survey toproduce maps of the pre-clearing extent of RegionalEcosystems. Remnant Regional Ecosystem maps arecreated by intersecting pre-clearing RegionalEcosystem maps with the distribution of remnantvegetation across the state delineated using rectifiedLANDSAT TM imagery and informed by fieldsurvey and aerial photography.
The report analyses the area of regional ecosystemsusing the same version of LANDSAT TM imageryused by the Statewide Landcover and Trees Study(SLATS, Queensland Department of NaturalResources and Mines) analysis of woody vegetationto provide complementary information. Thedefinition of remnant vegetation used in theHerbarium report, however, differs from thedefinition of woody vegetation used in theDepartment of Natural Resources and Mines, SLATSproject. The Herbarium definition of nativevegetation includes grasslands and consequentlytheir analysis records clearing of natural grasslands.The Herbarium report does not include clearing ofnon-remnant woody vegetation. Hence the figuresreported in the Herbarium report do not matchthose of the SLATS reports.
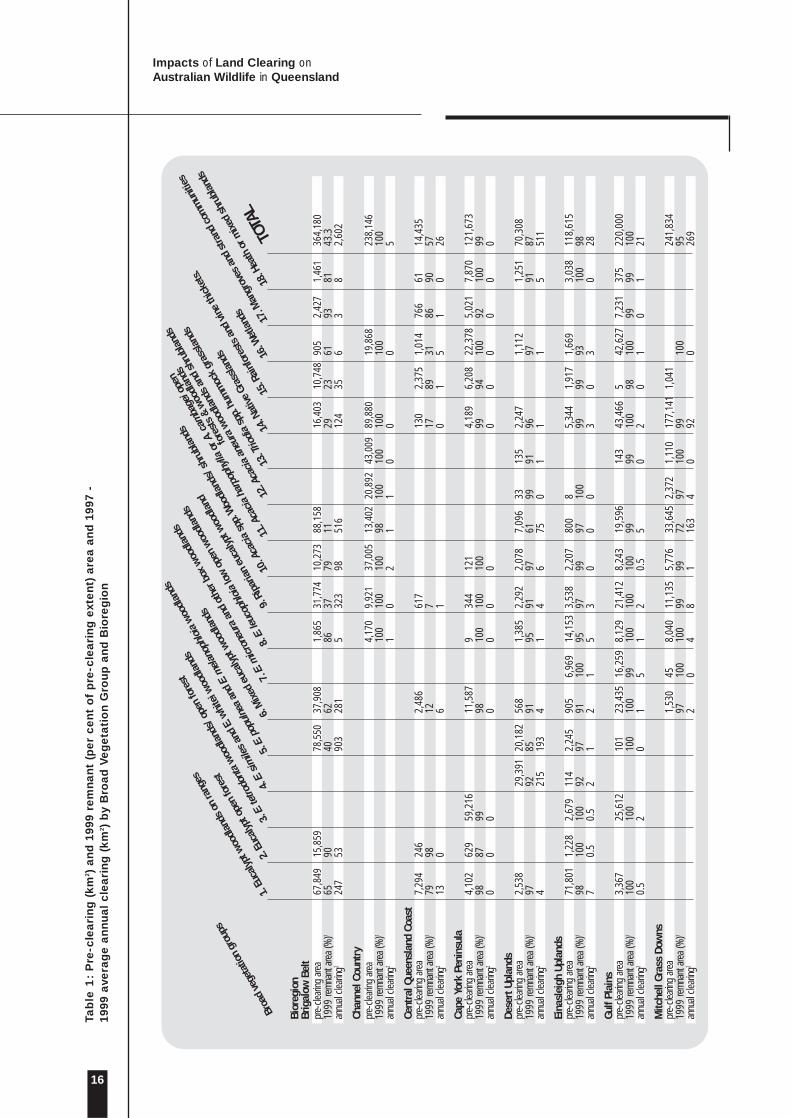
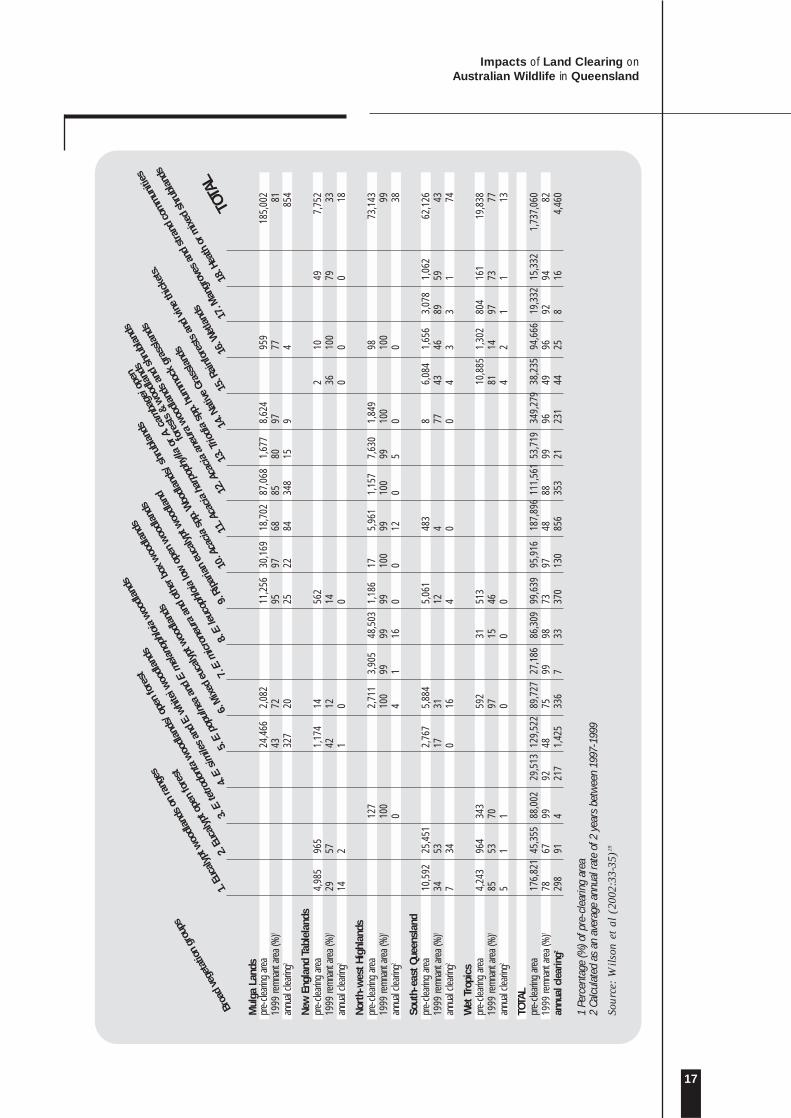
A breakdown of clearing patterns by BroadVegetation Type (BVT) and bioregion is provided inTable 1.
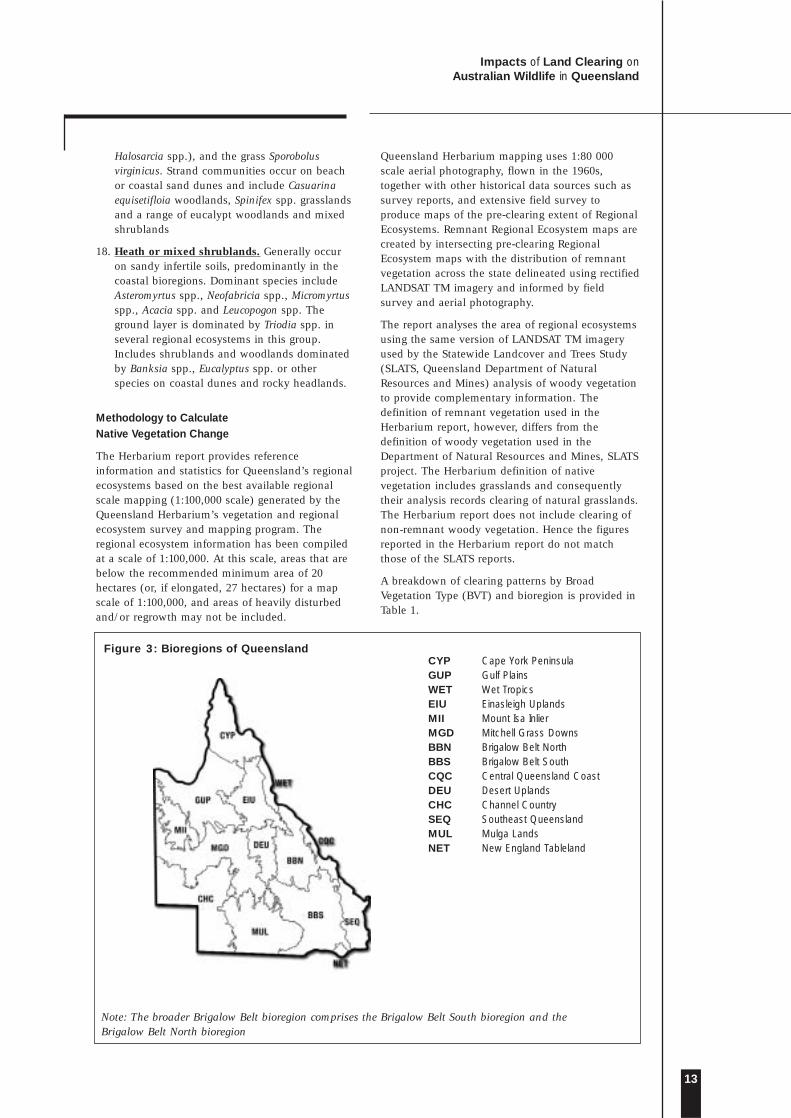
Figure 3: Bioregions of Queensland
Note: The broader Brigalow Belt bioregion comprises the Brigalow Belt South bioregion and theBrigalow Belt North bioregion
CYP Cape York PeninsulaGUP Gulf PlainsWET Wet TropicsEIU Einasleigh UplandsMII Mount Isa InlierMGD Mitchell Grass DownsBBN Brigalow Belt NorthBBS Brigalow Belt SouthCQC Central Queensland CoastDEU Desert UplandsCHC Channel CountrySEQ Southeast QueenslandMUL Mulga LandsNET New England Tableland
14
Impacts of Land Clearing on Australian Wildlife in Queensland
Methodology to Calculate Wildlife Impacts
The Queensland Herbarium analysis of clearing ofremnant vegetation in Queensland in the period1997-99 was used by the authors to calculate theimpacts on mammals, birds, reptiles and trees overthis period.
The data of clearing by Broad Vegetation Group(BVG) and/or bioregion used by the authors is setout in Table 1. The methodology used by each ofthe authors to determine wildlife densities in eachBVG and/or bioregion and calculate wildlifeimpacts is set out in the respective sections of part4.
One general assumption made in these calculations,based primarily on knowledge of the ecology of awide range of species, as well as the absence of anyevidence that remaining remnant vegetationsupports higher densities of a wide range of speciesfollowing adjacent land clearing, is that the vastmajority of animals displaced by clearing will die –either immediately or after a short space of time.Deaths result primarily from physical injury,exposure to lethal conditions of temperature orlowered microclimatic humidity, predation, or lackof food.
There are several specific reasons for this:
1. Many species lack the mobility to move intouncleared remnants, and if they could move fastand far enough may not have the tolerance ofhighly disturbed habitat to allow them to cross itto reach remnants.
2. Many species (mammals especially) have veryhigh levels of site attachment, and may not makethe ‘decision’ to leave until it is way too late tomake a successful move, even if they might havethe physical capacity to do so. Instead theylinger and eventually die in degraded habitats nolonger suited to them. An example of thisbehaviour is exhibited by the response of woylies
(or brush-tailed bettongs) to fire in WesternAustralia where a radio-tracking studyundertaken by Dr Christensen found that theattachment of individuals to their home areas isso strong that they double back through the firefront to remain in their home range, rather thancontinue to flee in front of the fire. As ithappens, these animals are so skilled that mostmanage this without being burnt. They continueto survive for a while in their original habitat,but most are gradually killed by foxes in theopen post-fire conditions.14
3. Even for those animals that might be able toescape into remnants (such as some birds), theprospects of surviving elsewhere are low,because in most undisturbed habitat, resourcesand space are fully utilised by residents and fewadditional animals can be packed in. Thus,although there might initially be an increase indensity as a result of an influx of refugees,density dependent reductions in survival andreproduction as a result of increased pressure onresources such as food or shelter mean thatdensity soon declines back to former levels - inshort the extra numbers can’t be absorbed. Thiswas demonstrated in a classic study of birds inrainforest fragments in Brazil – clearing ofsurrounding forest produced a transient increasein density in uncleared patches, but density soonre-adjusted to former levels.15
After an area of native bushland has been clearedfor cropping or grazing, some species of mammals,birds or reptiles will still be found on it. Theseremaining species may consist of some residualanimals from the original assemblages found thereprior to clearing (though usually in much reduceddensities) or more likely be species not present inthe original habitat but ones (such as grasslandspecies) that move in to the new habitat created bythe clearing process. In most studies to date, thetotal number of species present post-clearing ranges
from about 5-20 per cent of thenumber originally present, but withusually less than ten per cent of thetaxa originally present.
These residual original taxa fall wellwithin the standard error ranges ofthe estimated mortalities, and sohave not been specifically excludedfrom these conservative estimatesof mortalities. In other words, interms of the net effects of landclearing, it is assumed that for alltaxa the number of individualsdisplaced by land clearing equalsthe number that die as a directresult of the clearing process.
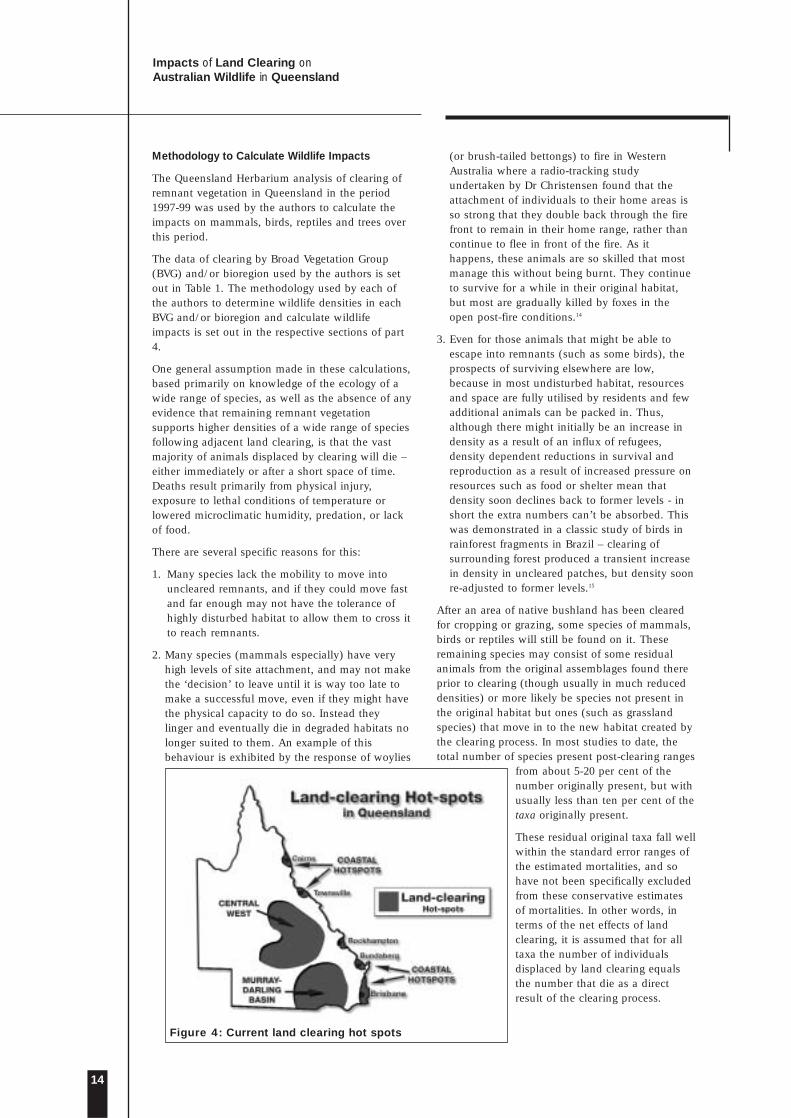
Figure 4: Current land clearing hot spots
Impacts of Land Clearing on Australian Wildlife in Queensland
15
3
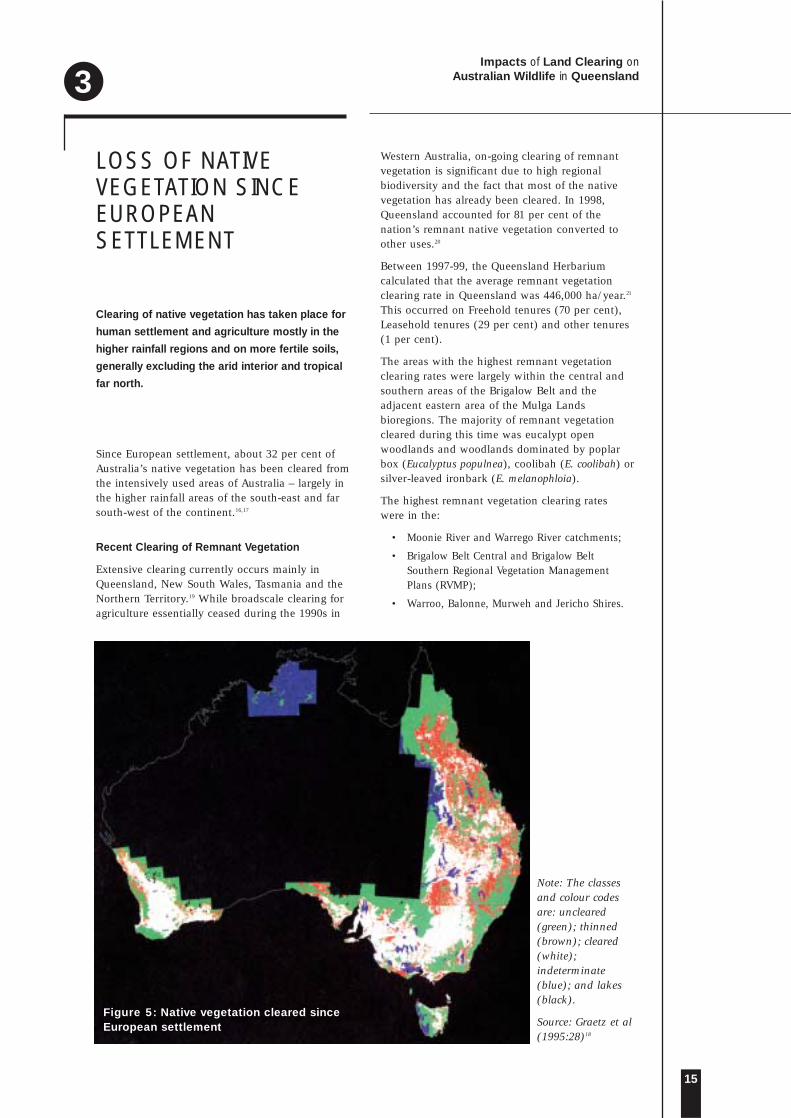
LOSS OF NATIVEVEGETATION SINCEEUROPEANSETTLEMENT
Note: The classesand colour codesare: uncleared(green); thinned(brown); cleared(white);indeterminate(blue); and lakes(black).
Source: Graetz et al(1995:28)18
Clearing of native vegetation has taken place for
human settlement and agriculture mostly in the
higher rainfall regions and on more fertile soils,
generally excluding the arid interior and tropical
far north.
Since European settlement, about 32 per cent ofAustralia’s native vegetation has been cleared fromthe intensively used areas of Australia – largely inthe higher rainfall areas of the south-east and farsouth-west of the continent.16,17
Recent Clearing of Remnant Vegetation
Extensive clearing currently occurs mainly inQueensland, New South Wales, Tasmania and theNorthern Territory.19 While broadscale clearing foragriculture essentially ceased during the 1990s in
Western Australia, on-going clearing of remnantvegetation is significant due to high regionalbiodiversity and the fact that most of the nativevegetation has already been cleared. In 1998,Queensland accounted for 81 per cent of thenation’s remnant native vegetation converted toother uses.20
Between 1997-99, the Queensland Herbariumcalculated that the average remnant vegetationclearing rate in Queensland was 446,000 ha/year.21
This occurred on Freehold tenures (70 per cent),Leasehold tenures (29 per cent) and other tenures(1 per cent).
The areas with the highest remnant vegetationclearing rates were largely within the central andsouthern areas of the Brigalow Belt and theadjacent eastern area of the Mulga Landsbioregions. The majority of remnant vegetationcleared during this time was eucalypt openwoodlands and woodlands dominated by poplarbox (Eucalyptus populnea), coolibah (E. coolibah) orsilver-leaved ironbark (E. melanophloia).
The highest remnant vegetation clearing rateswere in the:
• Moonie River and Warrego River catchments;
• Brigalow Belt Central and Brigalow BeltSouthern Regional Vegetation ManagementPlans (RVMP);
• Warroo, Balonne, Murweh and Jericho Shires.
Figure 5: Native vegetation cleared sinceEuropean settlement
16
Impacts of Land Clearing on Australian Wildlife in Queensland
Bior
egio
nBr
igal
ow B
elt
pre-
clear
ing a
rea
67,8
4915
,859
78,5
5037
,908
1,86
531
,774
10,2
7388
,158
16,4
0310
,748
905
2,42
71,
461
364,
180
1999
rem
nant
are
a (%
)165
9040
6286
3779
1129
2361
9381
43.3
annu
al cle
aring
224
753
903
281
532
398
516
124
356
38
2,60
2
Chan
nel C
ount
rypr
e-cle
aring
are
a4,
170
9,92
137
,005
13,4
0220
,892
43,0
0989
,880
19,8
6823
8,14
619
99 re
mna
nt a
rea
(%)1
100
100
100
9810
010
010
010
010
0an
nual
clear
ing2
10
21
10
00
5
Cent
ral Q
ueen
slan
d Co
ast
pre-
clear
ing a
rea
7,29
424
62,
486
617
130
2,37
51,
014
766
6114
,435
1999
rem
nant
are
a (%
)179
9812
717
8931
8690
57an
nual
clear
ing2
130
61
01
51
026
Cape
Yor
k Pe
nins
ula
pre-
clear
ing a
rea
4,10
262
959
,216
11,5
879
344
121
4,18
96,
208
22,3
785,
021
7,87
012
1,67
319
99 re
mna
nt a
rea
(%)1
9887
9998
100
100
100
9994
100
9210
099
annu
al cle
aring
20
00
00
00
00
00
00
Dese
rt U
plan
dspr
e-cle
aring
are
a2,
538
29,3
9120
,182
568
1,38
52,
292
2,07
87,
096
3313
52,
247
1,11
21,
251
70,3
0819
99 re
mna
nt a
rea
(%)1
9792
8591
9591
9761
9991
9697
9187
annu
al cle
aring
24
215
193
41
46
750
11
15
511
Eina
slei
gh U
plan
dspr
e-cle
aring
are
a71
,801
1,22
82,
679
114
2,24
590
56,
969
14,1
533,
538
2,20
780
08
5,34
41,
917
1,66
93,
038
118,
615
1999
rem
nant
are
a (%
)198
100
100
9297
9110
095
9799
9710
099
9993
100
98an
nual
clear
ing2
70.
50.
52
12
15
30
00
30
30
28
Gulf
Plai
nspr
e-cle
aring
are
a3,
367
25,6
1210
123
,435
16,2
598,
129
21,4
128,
243
19,5
9614
343
,466
542
,627
7,23
137
522
0,00
019
99 re
mna
nt a
rea
(%)1
100
100
100
100
9910
010
010
099
9910
098
100
9999
100
annu
al cle
aring
20.
52
01
51
20.
55
02
01
01
21
Mitc
hell
Gras
s Do
wns
pre-
clear
ing a
rea
1,53
045
8,04
011
,135
5,77
633
,645
2,37
21,
110
177,
141
1,04
124
1,83
419
99 re
mna
nt a
rea
(%)1
9710
010
099
9972
9710
099
100
95an
nual
clear
ing2
20
48
116
34
092
026
9
Broa
d ve
geta
tion
grou
ps
1.Eu
calyp
t woo
dlan
ds o
n ra
nges
2.Eu
calyp
t ope
n fo
rest
3.E.
tetro
dont
aw
oodl
ands
/ ope
n fo
rest
4.E.
simile
san
d E.
whi
tei w
oodl
ands
5.E.
popu
lnea
and
E.m
elan
ophl
oia
woo
dlan
ds
6.M
ixed
euc
alyp
t woo
dlan
ds
7.E.
mic
rone
ura
and
othe
r box
woo
dlan
ds
8.E.
leuc
ophl
oia
low
ope
n w
oodl
ands
9.Ri
paria
n eu
calyp
t woo
dlan
d
10.A
caci
asp
p.W
oodl
ands
/ shr
ubla
nds
11.A
caci
a ha
rpop
hylla
or A
.cam
bage
iope
n
fore
sts
& w
oodl
ands
12.A
caci
a an
eura
woo
dlan
ds a
nd s
hrub
land
s
13.T
riodi
asp
p.hu
mm
ock
gras
sland
s
14.N
ative
Gra
ssla
nds
15.R
ainf
ores
ts a
nd v
ine
thic
kets
.
16.W
etla
nds
17.M
angr
oves
and
stra
nd c
omm
uniti
es
18.H
eath
or m
ixed
shr
ubla
nds
Tab
le 1
:P
re-c
lea
rin
g (
km
2 ) a
nd
199
9 re
mn
an
t (p
er
ce
nt
of
pre
-cle
ari
ng
ext
en
t) a
rea
an
d 1
997
-19
99 a
vera
ge
an
nu
al
cle
ari
ng
(k
m2 )
by
Bro
ad
Ve
ge
tati
on
Gro
up
an
d B
iore
gio
n
TOTA
L
Impacts of Land Clearing on Australian Wildlife in Queensland
17
Mul
ga L
ands
pre-
clear
ing a
rea
24,4
662,
082
11,2
5630
,169
18,7
0287
,068
1,67
78,
624
959
185,
002
1999
rem
nant
are
a (%
)143
7295
9768
8580
9777
81an
nual
clear
ing2
327
2025
2284
348
159
485
4
New
Eng
land
Tab
lela
nds
pre-
clear
ing a
rea
4,98
596
51,
174
1456
22
1049
7,75
219
99 re
mna
nt a
rea
(%)1
2957
4212
1436
100
7933
annu
al cle
aring
214
21
00
00
018
Nort
h-w
est H
ighl
ands
pre-
clear
ing a
rea
127
2,71
13,
905
48,5
031,
186
175,
961
1,15
77,
630
1,84
998
73,1
4319
99 re
mna
nt a
rea
(%)1
100
100
9999
9910
099
100
9910
010
099
annu
al cle
aring
20
41
160
012
05
00
38
Sout
h-ea
st Q
ueen
slan
dpr
e-cle
aring
are
a10
,592
25,4
512,
767
5,88
45,
061
483
86,
084
1,65
63,
078
1,06
262
,126
1999
rem
nant
are
a (%
)134
5317
3112
477
4346
8959
43an
nual
clear
ing2
734
016
40
04
33
174
Wet
Tro
pics
pre-
clear
ing a
rea
4,24
396
434
359
231
513
10,8
851,
302
804
161
19,8
3819
99 re
mna
nt a
rea
(%)1
8553
7097
1546
8114
9773
77an
nual
clear
ing2
51
10
00
42
11
13
TOTA
Lpr
e-cle
aring
are
a17
6,82
145
,355
88,0
0229
,513
129,
522
89,7
2727
,186
86,3
0999
,639
95,9
1618
7,89
611
1,56
153
,719
349,
279
38,2
3594
,666
19,3
3215
,332
1,73
7,06
019
99 re
mna
nt a
rea
(%)1
7867
9992
4875
9998
7397
4888
9996
4996
9294
82an
nual
cle
arin
g229
891
421
71,
425
336
733
370
130
856
353
2123
144
258
164,
460
1 Pe
rcen
tage
(%) o
f pre
-cle
arin
g ar
ea
2 Ca
lcul
ated
as
an a
vera
ge a
nnua
l rat
e of
2 y
ears
bet
wee
n 19
97-1
999
Sour
ce:
Wils
on e
t al
(20
02:3
3-35
)19
Broa
d ve
geta
tion
grou
ps
1.Eu
calyp
t woo
dlan
ds o
n ra
nges
2.Eu
calyp
t ope
n fo
rest
3.E.
tetro
dont
aw
oodl
ands
/ ope
n fo
rest
4.E.
simile
san
d E.
whi
tei w
oodl
ands
5.E.
popu
lnea
and
E.m
elan
ophl
oia
woo
dlan
ds
6.M
ixed
euc
alyp
t woo
dlan
ds
7.E.
mic
rone
ura
and
othe
r box
woo
dlan
ds
8.E.
leuc
ophl
oia
low
ope
n w
oodl
ands
9.Ri
paria
n eu
calyp
t woo
dlan
d
10.A
caci
asp
p.W
oodl
ands
/ shr
ubla
nds
11.A
caci
a ha
rpop
hylla
or A
.cam
bage
iope
n
fore
sts
& w
oodl
ands
12.A
caci
a an
eura
woo
dlan
ds a
nd s
hrub
land
s
13.T
riodi
asp
p.hu
mm
ock
gras
sland
s
14.N
ative
Gra
ssla
nds
15.R
ainf
ores
ts a
nd v
ine
thic
kets
.
16.W
etla
nds
17.M
angr
oves
and
stra
nd c
omm
uniti
es
18.H
eath
or m
ixed
shr
ubla
nds
TOTA
L
18
Impacts of Land Clearing on Australian Wildlife in Queensland
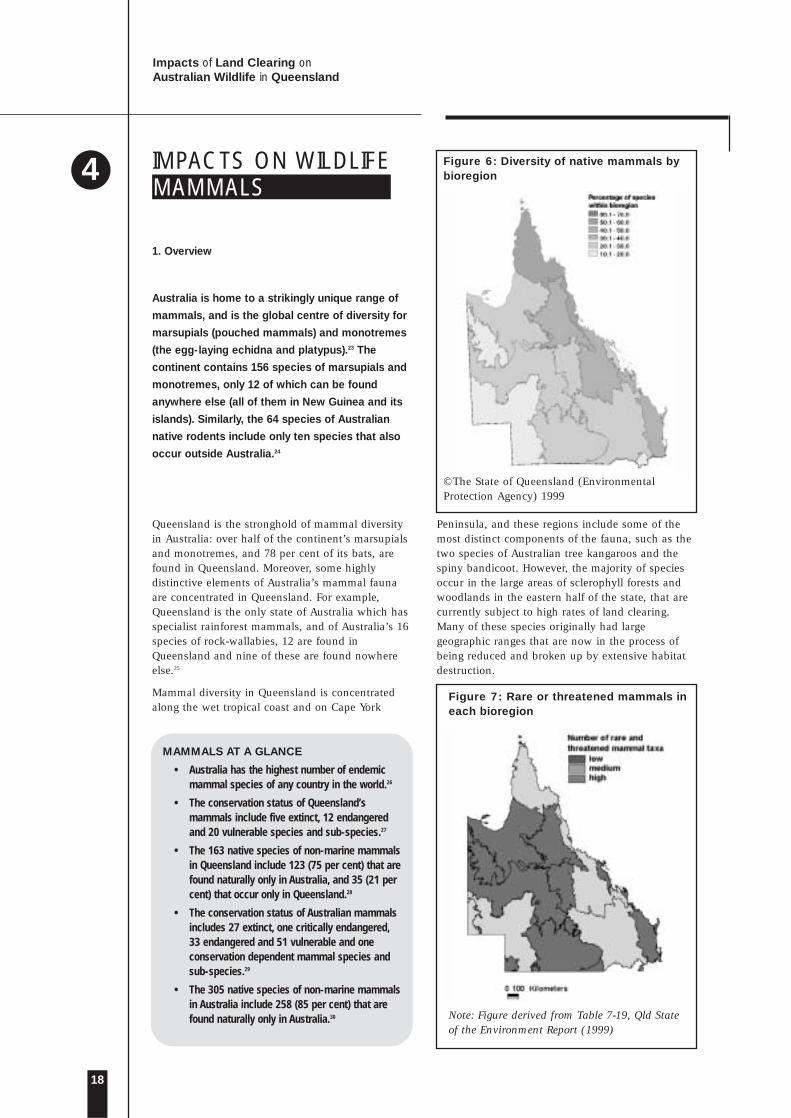
Figure 7: Rare or threatened mammals ineach bioregion
Note: Figure derived from Table 7-19, Qld Stateof the Environment Report (1999)
IMPACTS ON WILDLIFE Figure 6: Diversity of native mammals bybioregion
© The State of Queensland (EnvironmentalProtection Agency) 1999
MAMMALS AT A GLANCE
• Australia has the highest number of endemicmammal species of any country in the world.26
• The conservation status of Queensland’smammals include five extinct, 12 endangeredand 20 vulnerable species and sub-species.27
• The 163 native species of non-marine mammalsin Queensland include 123 (75 per cent) that arefound naturally only in Australia, and 35 (21 percent) that occur only in Queensland.28
• The conservation status of Australian mammalsincludes 27 extinct, one critically endangered,33 endangered and 51 vulnerable and oneconservation dependent mammal species andsub-species.29
• The 305 native species of non-marine mammalsin Australia include 258 (85 per cent) that arefound naturally only in Australia.30
4
1. Overview
Australia is home to a strikingly unique range of
mammals, and is the global centre of diversity for
marsupials (pouched mammals) and monotremes
(the egg-laying echidna and platypus).23 The
continent contains 156 species of marsupials and
monotremes, only 12 of which can be found
anywhere else (all of them in New Guinea and its
islands). Similarly, the 64 species of Australian
native rodents include only ten species that also
occur outside Australia.24
Queensland is the stronghold of mammal diversityin Australia: over half of the continent’s marsupialsand monotremes, and 78 per cent of its bats, arefound in Queensland. Moreover, some highlydistinctive elements of Australia’s mammal faunaare concentrated in Queensland. For example,Queensland is the only state of Australia which hasspecialist rainforest mammals, and of Australia’s 16species of rock-wallabies, 12 are found inQueensland and nine of these are found nowhereelse.25
Mammal diversity in Queensland is concentratedalong the wet tropical coast and on Cape York
Peninsula, and these regions include some of themost distinct components of the fauna, such as thetwo species of Australian tree kangaroos and thespiny bandicoot. However, the majority of speciesoccur in the large areas of sclerophyll forests andwoodlands in the eastern half of the state, that arecurrently subject to high rates of land clearing.Many of these species originally had largegeographic ranges that are now in the process ofbeing reduced and broken up by extensive habitatdestruction.
MAMMALS
Impacts of Land Clearing on Australian Wildlife in Queensland
19
Table 2: Summary of total number of selected mammals killed annually in Queensland by landclearing
Mammal Type Total Number Killed
Koalas 19 000
Possums and gliders 342 000
Echidnas Over 7 500
Macropods(kangaroos, wallabies and rat-kangaroos) 233 000
Bandicoots 29 000
Small carnivorous marsupials(dunnarts antechinuses and others) 1.25 million
Rodents (native rats) 196 000
2. Number of Mammals Killed by Land Clearing
• More than 2.1 million mammals die inQueensland each year as a result of landclearing
Over 2.1 million mammals are estimated to bekilled by land clearing each year in Queensland.The true figure is likely to be much higher than thisconservative estimate, which is based only onspecies for which abundance has been measured inthe habitats that are subject to land clearing. Thesemeasures are available for all species of macropods,possums and gliders and bandicoots that arevulnerable to clearing, but for only eight of 23species of small carnivorous marsupials and eight of25 species of rodents. The figure does not includeany estimate of the number of bats killed, becausethere is no information on population sizes of batsin these habitats. Land clearing reduces foodresources for bats and destroys the roost sites of
many species. Species like flying foxes that are ableto escape the immediate effects of land-clearing areforced to make increased use of fruit crops andother exotic vegetation, and this often puts them inconflict with people.31
Of the 342,000 possums and gliders killed annually,about half of the lost possums and gliders arecommon brushtail posssums (Trichosurus vulpecula):common brushtails are still widespread in dryforests and woodlands in Queensland but arebecoming less common in other parts of Australia.At least five other species are also seriouslyaffected. The tiny feathertail glider (Acrobatespygmaeus) contributes about a third of the totalnumber, and the remainder is made up of aboutequal numbers of sugar gliders (Petaurus breviceps),squirrel gliders (P. norfolcensis), greater gliders(Petauroides volans) and common ringtail possums(Pseudocheirus peregrinus).
Bioregion Annual Estimated (minimum) Number ofclearing rate mammal density mammals (ha/yr)32 (individuals/ha )33 displaced
killed/year
Brigalow Belt 260,200 3.93 1,022,586
Channel Country 500 10.26 5,130
Central Qld Coast 2,600 42.12 109,512
Cape York Peninsula 0 0
Desert Uplands 51,100 3.48 177,828
Einasleigh Uplands 2,800 1.42 3,976
Gulf Plains 2,100 0.58 1,218
Mitchell Grass Downs 26,900 2.86 76,934
Mulga Lands 85,400 2.87 245,098
New England Tablelands 1,800 45.11 81,198
North-west Highlands 3,800 0.16 608
South-east Queensland 7,400 51.24 379,176
Wet Tropics 1,300 50.46 65,598
TOTAL 445,900 2,168,862Roundeddown to2.1 million
Table 3: Number of selected mammals killed annually in Queensland by land clearing (bybioregion)
Bandicoot
©D
ave
Wat
ts
20
Impacts of Land Clearing on Australian Wildlife in Queensland
Method Used to Calculate Impacts of Clearing ofRemnant Vegetation on Mammals
Estimates of numbers of individual mammals killedby vegetation clearing were based on measurementsof population density for each species. Thesespecies-specific estimates of population densitywere then extrapolated over the areas cleared, andestimates of numbers of individuals of each specieswere accumulated to arrive at a figure for the totalnumber of individuals.
Measures of population density were taken from adatabase of abundances of Australian mammalscompiled by Dr Chris Johnson34. Entries in thisdatabase consist of data from the publishedliterature, unpublished reports and theses (a total of112 literature sources), and from unpublished datasupplied on request from mammal ecologists (24personal sources). In each case the estimate ofdensity represents a measurement produced by adetailed ecological study of a species in a definedlocality.
The complete database for Queensland speciesconsists of estimates of population density for 62species. This includes data on all species ofbandicoots, macropods (except for some species ofrock-wallabies), and almost all species of possumsand gliders occurring in the State. For many ofthese species density has been measured inmultiple locations. Where many independent
estimates of density are available, their distributionsare typically right-skewed; that is, most values arelow or moderate but a small number are very high.Such rare high values have a large effect on themean density for a species. To reduce this effect,means for each species were first calculated on log-transformed density measurements and were thenback-transformed to produce normal values. Thereare substantial gaps in information on populationdensities of species of carnivorous marsupials,especially the smaller-bodied species (data availablefor only eight of 23 species in the State) androdents (data available for only eight of 25 species).There are no estimates of population density of batspecies in Queensland.
Only those species considered to be vulnerable tothe effects of broad-scale vegetation clearance wereincluded in the calculations. Species that wereexcluded were:
1. predominantly aquatic species (the platypusOrnithorhynchus anatinus and water rat Hydromyschrysogaster);
2. species with distributions restricted to smallareas of rocky terrain (rock-wallabies, and thecommon rock-rat Zyzomys argurus);
3. the red kangaroo Macropus rufus, a species ofopen plains that may have benefited to someextent from past land clearing;
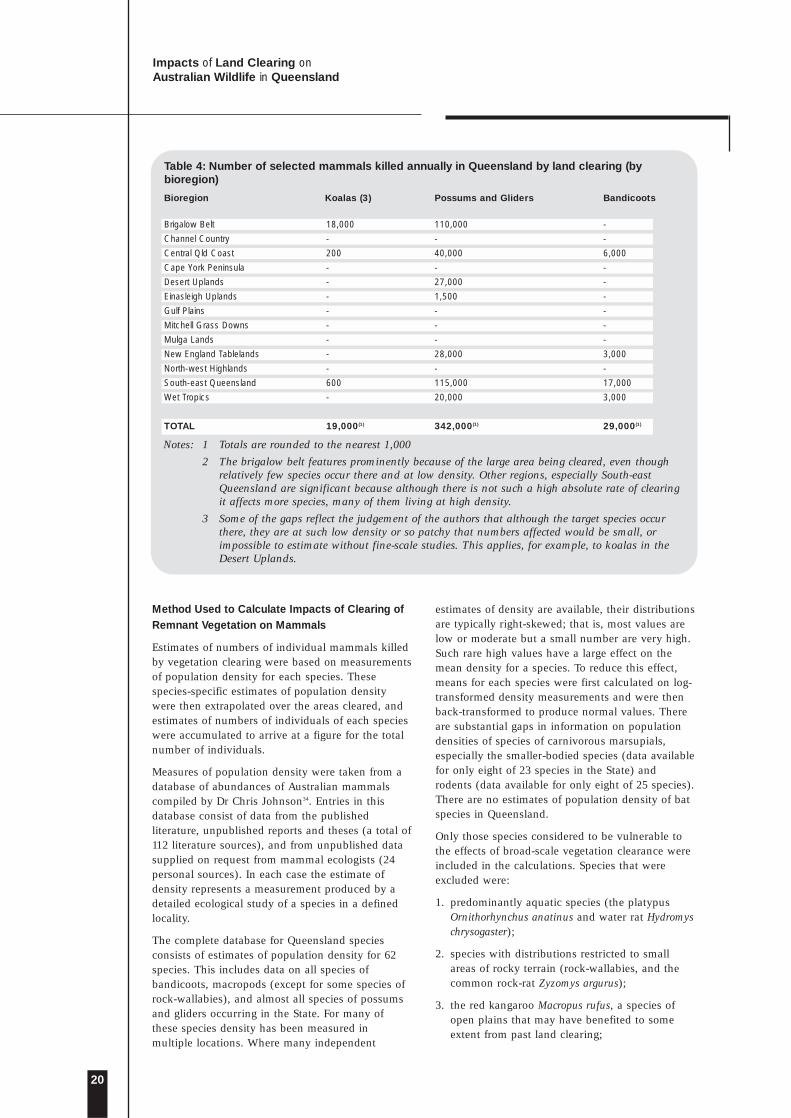
Bioregion Koalas (3) Possums and Gliders Bandicoots
Brigalow Belt 18,000 110,000 -
Channel Country - - -
Central Qld Coast 200 40,000 6,000
Cape York Peninsula - - -
Desert Uplands - 27,000 -
Einasleigh Uplands - 1,500 -
Gulf Plains - - -
Mitchell Grass Downs - - -
Mulga Lands - - -
New England Tablelands - 28,000 3,000
North-west Highlands - - -
South-east Queensland 600 115,000 17,000
Wet Tropics - 20,000 3,000
TOTAL 19,000(1) 342,000(1) 29,000(1)
Table 4: Number of selected mammals killed annually in Queensland by land clearing (bybioregion)
Notes: 1 Totals are rounded to the nearest 1,000
2 The brigalow belt features prominently because of the large area being cleared, even thoughrelatively few species occur there and at low density. Other regions, especially South-eastQueensland are significant because although there is not such a high absolute rate of clearingit affects more species, many of them living at high density.
3 Some of the gaps reflect the judgement of the authors that although the target species occurthere, they are at such low density or so patchy that numbers affected would be small, orimpossible to estimate without fine-scale studies. This applies, for example, to koalas in theDesert Uplands.
Impacts of Land Clearing on Australian Wildlife in Queensland
21
4. species that are restricted to the rainforests ofthe Wet Tropics World Heritage Area; and
5. species with very small geographic ranges (someof these, such as the northern hairy-nosedwombat, are protected from the direct effects ofvegetation clearing).
These exclusions are conservative, because some ofthese species may be indirectly affected by clearingof vegetation. For example, the core refuge habitatsof rock-wallabies may not be destroyed by broad-scale vegetation clearance, but clearing may impedemigration between populations and degradehabitats used for feeding.
The approach used here assumes that the densitiesmeasured by intensive ecological studies arerepresentative of those pertaining in intactvegetation across whole bioregions. If past studieshave tended to focus on sites and species whereabundance is relatively high, this could result inover-estimation of the total number of individualsaffected. The approach also suffers from theweakness that only species for which populationdensity has been measured directly by detailedecological study could be included in the estimates.It is for this latter reason that the final figure isconsidered to be probably an underestimate.
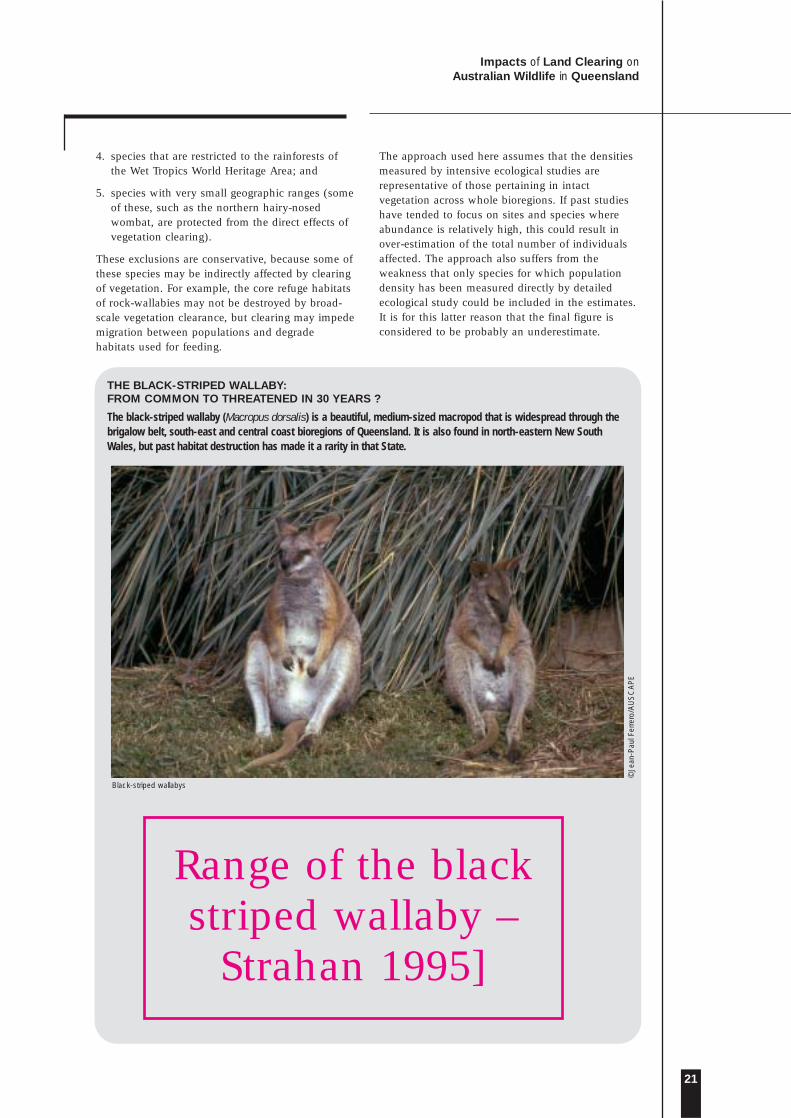
THE BLACK-STRIPED WALLABY:FROM COMMON TO THREATENED IN 30 YEARS ?
The black-striped wallaby (Macropus dorsalis) is a beautiful, medium-sized macropod that is widespread through thebrigalow belt, south-east and central coast bioregions of Queensland. It is also found in north-eastern New SouthWales, but past habitat destruction has made it a rarity in that State.
Range of the blackstriped wallaby –
Strahan 1995]
Black-striped wallabys
©Je
an-P
aul F
erre
ro/A
US
CA
PE

22
Impacts of Land Clearing on Australian Wildlife in Queensland
The species is most abundant in mixedbrigalow/eucalypt woodland. It rests in dense thicketsduring the day, often in large groups, and it followsregularly-used paths to reach open patches or forestedges to graze at night.
The black-striped wallaby is a wary animal that likes toretreat deep into dense vegetation for shelter35. Clearingof vegetation destroys these refuges, and throughoutmuch of its range the species is now restricted toisolated sites where dense woodland patches remain. Itcan be very abundant in such areas, and so is stillconsidered by most people to be a common animal.
However, continued clearing of its habitat could placethis species at risk in the near future. The total originalarea of suitable habitat for the black-striped wallaby inQueensland was approximately 247 600 km2. Only 84154 km2 (34 per cent) of this remained in 1999, and thisis being cleared at a rate of about 1 865 km2/year. Atthis rate, the total population of this currently commonspecies will be reduced to less than ten per cent of itsoriginal size by the year 2030.
3. The Future of Mammals
One in four Australian mammal species is nowextinct or threatened with extinction.36 Australia hasthe worst record of recent mammal extinctions ofany country in the world; around half of allmammal extinctions globally in the last 200 yearshave been in Australia.37 We have lost 17 mammalspecies and ten sub-species,38 with four speciesbecoming extinct in the last 50 years.39 A further 85species and sub-species species are classified asCritically Endangered, Endangered, or Vulnerable.40
To date, most of the serious mammal declines havebeen concentrated in the southern half of thecontinent.
So far, only two species that originally occurred inQueensland have become extinct (the desert rat-kangaroo and the Darling Downs hopping mouse).Nineteen mammal species and one sub-species thatoccur in Queensland are classified as CriticallyEndangered, Endangered or Vulnerable.41
Queensland’s mammals have fared relatively wellbecause there are large areas of the state whererabbits and foxes have not established or wherethey occur in low numbers, because the extensivecattle grazing that is practised over much of inlandQueensland is less damaging to the landscape thansheep grazing, and because more of Queensland’snatural vegetation cover remains intact than insouthern Australia. However, current rates of landclearing put many of Queensland’s mammal speciesat risk.
Mammals are especially sensitive to the effects ofhabitat reduction and fragmentation, This isbecause they typically occur at low populationdensities, and individuals may require large areasof habitat for survival. As a result, remnant patchesof vegetation must be large if they are to supportviable populations for most mammal species.Moreover, for the majority of species that dependon vegetation cover for survival, movement through
the landscape is severely curtailed by land clearing.This means that populations in isolated fragmentsof habitat can not be replenished by dispersal fromother areas. A study of mammal communities inwoodland habitat in Victoria showed thatmacropods, possums and gliders were generallyabsent from woodland patches of less than ten ha,and that the number of species in a woodlandpatch declined with time since isolation of thatpatch by clearing of the surrounding vegetation.42
Although relatively few Queensland mammals arecurrently classed as threatened, many are classedas ‘near threatened’; this currently applies to 20 ofQueensland’s marsupial species.43 These are speciesnot considered to be at immediate risk ofextinction, but which have suffered substantialdeclines in the past and might soon becomethreatened with extinction if their environmentdeteriorates further. Continued land clearing hasthe potential to push many of these species into thehigher threat categories making them morevulnerable to extinction.
Bilby
©Je
an-P
aul F
erre
ro/A
US
CA
PE
Impacts of Land Clearing on Australian Wildlife in Queensland
23
BIRDS AT A GLANCE
• Australia has the second highest number ofendemic bird species of any country in theworld, after Indonesia.47
• The conservation status of Queensland’s birdsincludes one extinct, 11 endangered and 22vulnerable bird species and sub-species.48
• 615 native bird species are found inQueensland.49
• The conservation status of Australian birdsinclude 23 extinct, five critically endangered,34 endangered and 62 vulnerable bird speciesand sub-species.50
• The 825 native bird species in Australia include45 per cent that are found naturally only inAustralia.51 Of these, about 535 are breedingnon-marine species. 52
1. Overview
Queensland has the highest number of native bird
species of any Australian State.44 The southern
brigalow belt of Queensland and northern NSW,
for example, is home to 328 species of birds,
almost half of those that live in Australia.45
Australia’s eucalypt forests and woodlands containthe highest number of bird species of anyecosystem in Australia. About 85 bird species arefound in highest densities in eucalypt forests, while149 species mostly occupy eucalypt woodlands.Almost all these birds are found only in Australia,or at most are also found in small areas of NewGuinea. Numerous species, for example theSpeckled Warbler and Diamond Firetail, haveranges that span the woodland belt along andinland from the Great Dividing Range whereclearing was most intense last century, andcontinues to this day in Queensland and NSW.46
Note: Figure derived from Table 7-19, Qld Stateof the Environment Report (1999)
Figures 8 and 9 shows that three bioregionscurrently impacted by land clearing (BrigalowBelt South (BBS), Brigalow Belt North (BBN)and South-Eastern Queensland (SEQ)) alsocontain high bird diversity and high numbers ofrare or threatened birds.
Figure 8: Diversity of bird species bybioregion
© The State of Queensland (EnvironmentalProtection Agency) 1999
Figure 9: Rare or threatened birds ineach bioregion
BIRDS
Hooded robin ©K
athi
e A
tkin
son/
AU
SC
AP
E
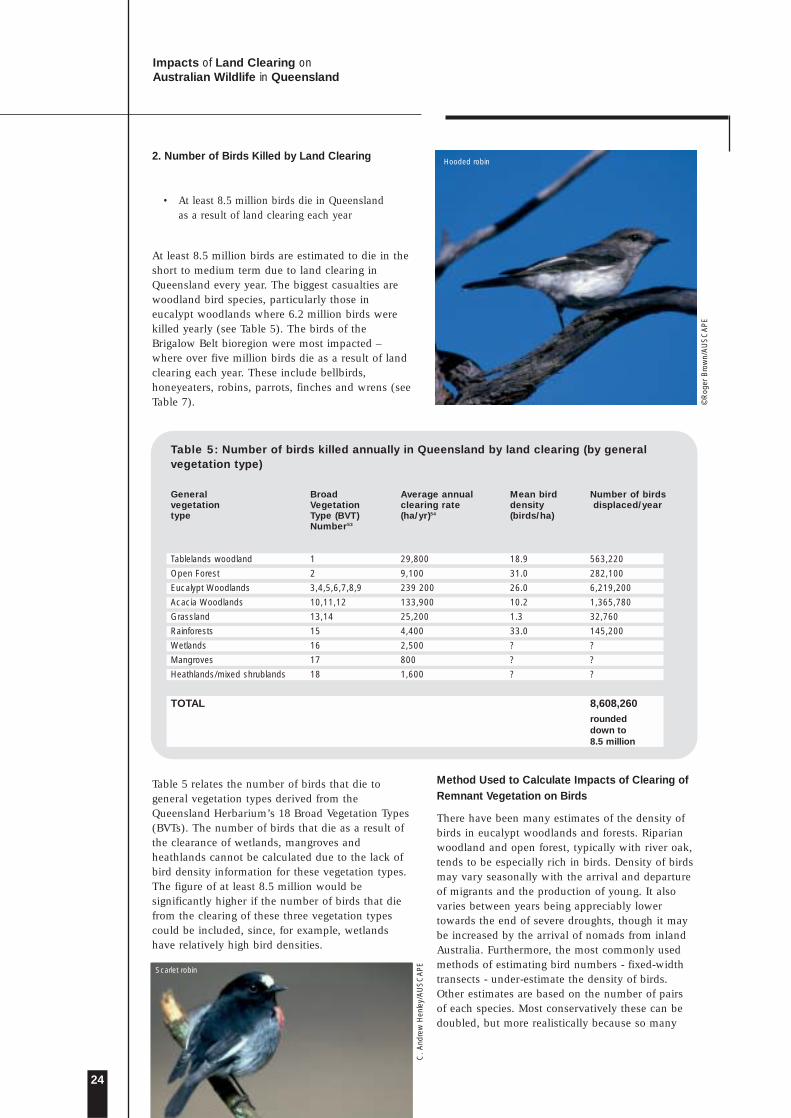
24
Impacts of Land Clearing on Australian Wildlife in Queensland
Table 5: Number of birds killed annually in Queensland by land clearing (by generalvegetation type)
General Broad Average annual Mean bird Number of birdsvegetation Vegetation clearing rate density displaced/yeartype Type (BVT) (ha/yr)54 (birds/ha)
Number53
Tablelands woodland 1 29,800 18.9 563,220
Open Forest 2 9,100 31.0 282,100
Eucalypt Woodlands 3,4,5,6,7,8,9 239 200 26.0 6,219,200
Acacia Woodlands 10,11,12 133,900 10.2 1,365,780
Grassland 13,14 25,200 1.3 32,760
Rainforests 15 4,400 33.0 145,200
Wetlands 16 2,500 ? ?
Mangroves 17 800 ? ?
Heathlands/mixed shrublands 18 1,600 ? ?
TOTAL 8,608,260roundeddown to8.5 million
2. Number of Birds Killed by Land Clearing
• At least 8.5 million birds die in Queenslandas a result of land clearing each year
At least 8.5 million birds are estimated to die in theshort to medium term due to land clearing inQueensland every year. The biggest casualties arewoodland bird species, particularly those ineucalypt woodlands where 6.2 million birds werekilled yearly (see Table 5). The birds of theBrigalow Belt bioregion were most impacted –where over five million birds die as a result of landclearing each year. These include bellbirds,honeyeaters, robins, parrots, finches and wrens (seeTable 7).
Table 5 relates the number of birds that die togeneral vegetation types derived from theQueensland Herbarium’s 18 Broad Vegetation Types(BVTs). The number of birds that die as a result ofthe clearance of wetlands, mangroves andheathlands cannot be calculated due to the lack ofbird density information for these vegetation types.The figure of at least 8.5 million would besignificantly higher if the number of birds that diefrom the clearing of these three vegetation typescould be included, since, for example, wetlandshave relatively high bird densities.
Method Used to Calculate Impacts of Clearing ofRemnant Vegetation on Birds
There have been many estimates of the density ofbirds in eucalypt woodlands and forests. Riparianwoodland and open forest, typically with river oak,tends to be especially rich in birds. Density of birdsmay vary seasonally with the arrival and departureof migrants and the production of young. It alsovaries between years being appreciably lowertowards the end of severe droughts, though it maybe increased by the arrival of nomads from inlandAustralia. Furthermore, the most commonly usedmethods of estimating bird numbers - fixed-widthtransects - under-estimate the density of birds.Other estimates are based on the number of pairsof each species. Most conservatively these can bedoubled, but more realistically because so many
Hooded robin
©R
oger
Bro
wn/
AU
SC
AP
E
Scarlet robin
C.
And
rew
Hen
ley/
AU
SC
AP
E

Impacts of Land Clearing on Australian Wildlife in Queensland
25
Table 6: Estimates of the density of birds from a variety of habitats.
Notes: 1 Broad Vegetation Groups 16, 17 and 18, bird densities not calculated – only small areas cleared.
2 Broad Vegetation Groups are from Appendix 3 and have been grouped together into moregeneral habitat types, for which there are data on bird density.
Habitat Region Density - Birds/ha Reference NotesBroad Vegetation Group - 1 Mean = 18.9Tablelands Woodland New England 21.5-23.6 Ford and Bell 198255 Large remnantTablelands Woodland New England 9.7 Ford et al. 198556 Same as above
but after severe drought
Tablelands Woodland/Open Forest New England 18.2 breeding, 32.5 winter Howe 198457 Continuous forestTablelands Woodland/Open Forest New England 16.1 breeding, 16.6 winter Howe 198458 RemnantsTablelands Woodland S NSW 16.4-20 Recher and Holmes 198559
Tablelands Open Forest S NSW 15-27.6 Recher and Holmes 198560
Broad Vegetation Group - 2 Mean = 31.0Open Forest and Woodland SE Queensland 9.9 summer, 25.5 winter Catterall et al. 199861
Dry Sclerophyll Forest Coastal NSW 23.6-51.3 Milledge and Recher 198562
Wet Sclerophyll Forest Coastal NSW 36.8-54.1 Milledge and Recher 198563
Dry sclerophyll Forest Coastal NSW 31.5 Shields et al. 198564
Wet Sclerophyll Forest Coastal NSW 25.9-35.5. Shields et al. 198565
Open Forest Sydney 23.3 Keast 198566
Broad Vegetation Groups - 3, 4, 5, 6, 7, 8, 9 Mean = 26.0Open Forest NW Slopes of NSW 42.8 Oliver et al. 199967
Poplar Box Central Queensland 9.2 Gilmore 198568 Number of pairs x 4Open Forest Pilliga Scrub 25.9 Date, pers comm
Broad Vegetation Groups - 10, 11, 12 Mean = 10.2
Gidgee Central Queensland 10.2 Gilmore 198569 Number of pairs x 4
Broad Vegetation Groups - 13, 14 Mean = 1.3
Grassland New England 0.8 Ford and Bell 198270 Native grassland,scattered trees
Grassland New England 1.9 Barrett 199571 Native or Exotic Pasture, ScatteredTrees
Broad Vegetation Group - 15 Mean = 33.0
Rainforest Coastal NSW 33.0 Shields et al. 198572
birds have helpers and there is a small floatingresidue of non-breeders, a multiplier of three ormore should be used. By the end of the breedingseason young birds are added, conservativelyadding another individual to the pair.Consequently, in this analysis the number of pairswere multiplied by four to estimate density of birds.Some of the information on density of birds in arange of habitats in NSW and Queensland is givenin Table 5. Although most of the data on density ofbirds are from New South Wales studies, mostvegetation communities (habitats) cross theQueensland state border and densities of birds aregenerally similar in both states. The mean densityfor each habitat has been calculated from the meandensities in each of the studies listed in Table 5.
Hence, the overall estimate is that at least 8.5million birds will be displaced from their habitat.They or the birds they subsequently displace die inthe short to medium term, due to clearing inQueensland every year at current rates of clearing.Note that the biggest losses in both area of habitatand birds is from eucalypt and acacia woodlands.The authors only found one estimate of density ofbirds in acacia woodland and none from brigalow.This habitat is typically a mix of acacia, eucalyptsand other trees, often with considerable structuraldiversity. It is likely to contain quite high birddensities.
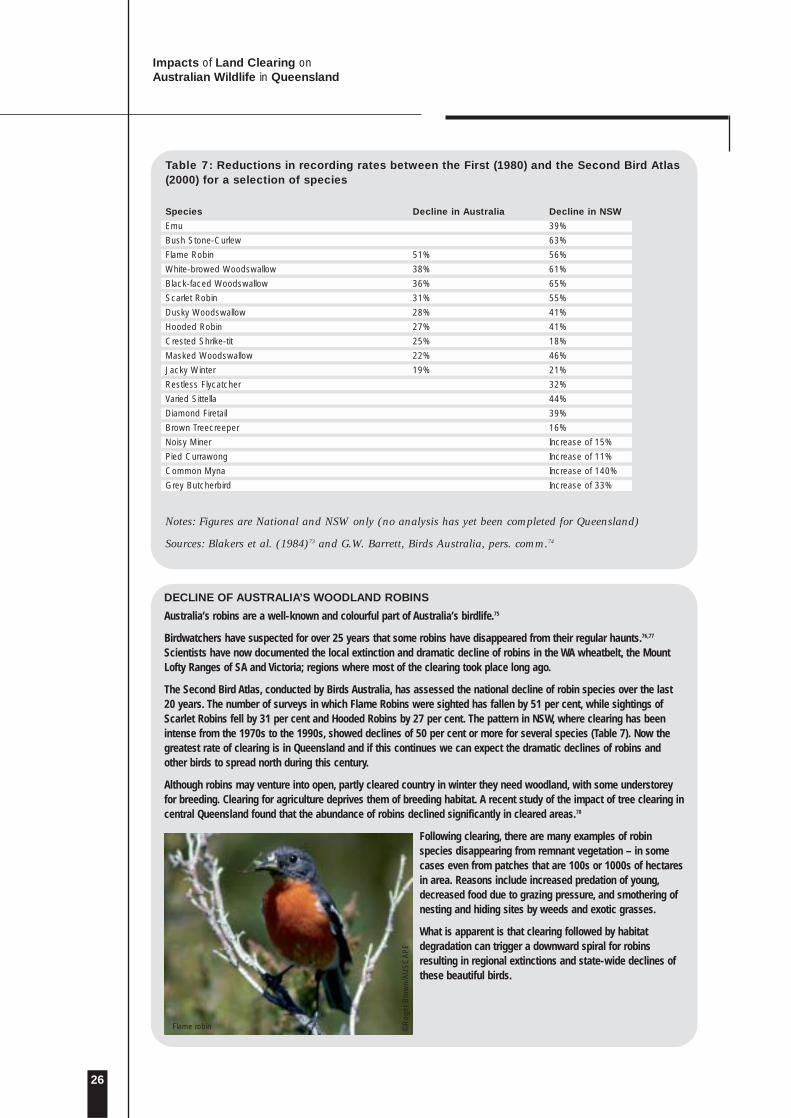
26
Impacts of Land Clearing on Australian Wildlife in Queensland
Table 7: Reductions in recording rates between the First (1980) and the Second Bird Atlas(2000) for a selection of species
Species Decline in Australia Decline in NSW
Emu 39%
Bush Stone-Curlew 63%
Flame Robin 51% 56%
White-browed Woodswallow 38% 61%
Black-faced Woodswallow 36% 65%
Scarlet Robin 31% 55%
Dusky Woodswallow 28% 41%
Hooded Robin 27% 41%
Crested Shrike-tit 25% 18%
Masked Woodswallow 22% 46%
Jacky Winter 19% 21%
Restless Flycatcher 32%
Varied Sittella 44%
Diamond Firetail 39%
Brown Treecreeper 16%
Noisy Miner Increase of 15%
Pied Currawong Increase of 11%
Common Myna Increase of 140%
Grey Butcherbird Increase of 33%
Notes: Figures are National and NSW only (no analysis has yet been completed for Queensland)
Sources: Blakers et al. (1984)73 and G.W. Barrett, Birds Australia, pers. comm.74
DECLINE OF AUSTRALIA’S WOODLAND ROBINS
Australia’s robins are a well-known and colourful part of Australia’s birdlife.75
Birdwatchers have suspected for over 25 years that some robins have disappeared from their regular haunts.76,77
Scientists have now documented the local extinction and dramatic decline of robins in the WA wheatbelt, the MountLofty Ranges of SA and Victoria; regions where most of the clearing took place long ago.
The Second Bird Atlas, conducted by Birds Australia, has assessed the national decline of robin species over the last20 years. The number of surveys in which Flame Robins were sighted has fallen by 51 per cent, while sightings ofScarlet Robins fell by 31 per cent and Hooded Robins by 27 per cent. The pattern in NSW, where clearing has beenintense from the 1970s to the 1990s, showed declines of 50 per cent or more for several species (Table 7). Now thegreatest rate of clearing is in Queensland and if this continues we can expect the dramatic declines of robins andother birds to spread north during this century.
Although robins may venture into open, partly cleared country in winter they need woodland, with some understoreyfor breeding. Clearing for agriculture deprives them of breeding habitat. A recent study of the impact of tree clearing incentral Queensland found that the abundance of robins declined significantly in cleared areas.78
Following clearing, there are many examples of robinspecies disappearing from remnant vegetation – in somecases even from patches that are 100s or 1000s of hectaresin area. Reasons include increased predation of young,decreased food due to grazing pressure, and smothering ofnesting and hiding sites by weeds and exotic grasses.
What is apparent is that clearing followed by habitatdegradation can trigger a downward spiral for robinsresulting in regional extinctions and state-wide declines ofthese beautiful birds.
Flame robin ©R
oger
Bro
wn/
AU
SC
AP
E
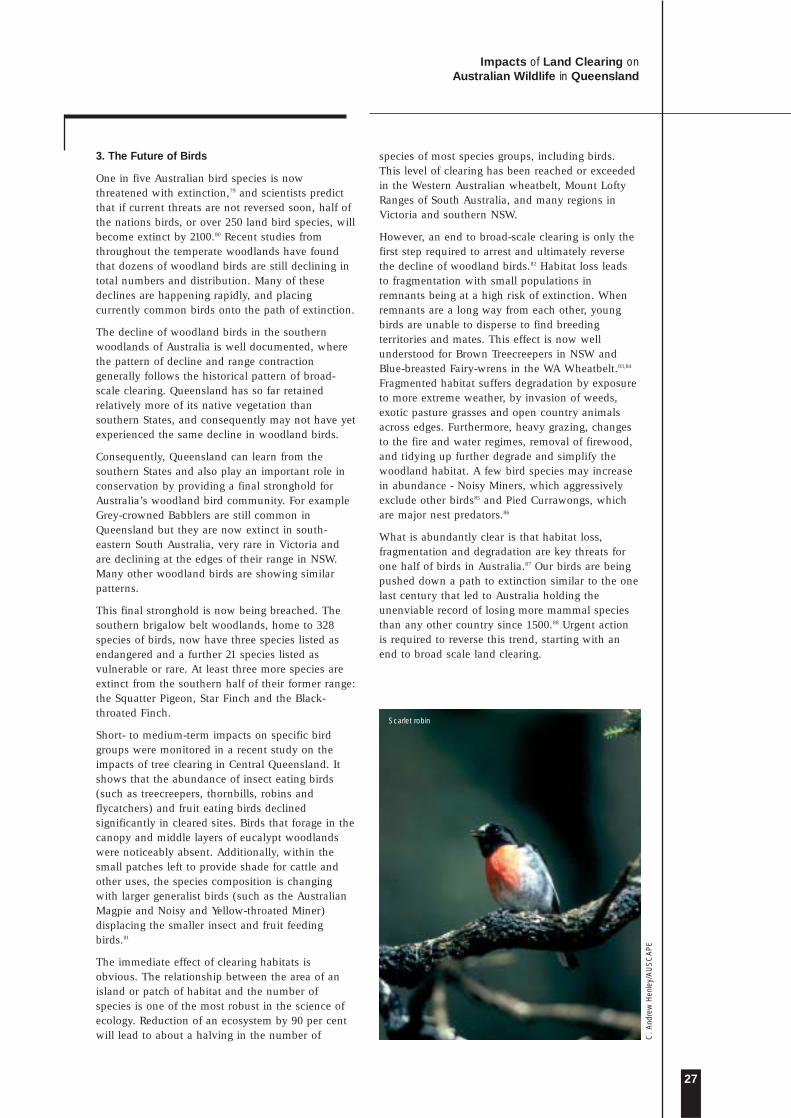
Impacts of Land Clearing on Australian Wildlife in Queensland
27
3. The Future of Birds
One in five Australian bird species is nowthreatened with extinction,79 and scientists predictthat if current threats are not reversed soon, half ofthe nations birds, or over 250 land bird species, willbecome extinct by 2100.80 Recent studies fromthroughout the temperate woodlands have foundthat dozens of woodland birds are still declining intotal numbers and distribution. Many of thesedeclines are happening rapidly, and placingcurrently common birds onto the path of extinction.
The decline of woodland birds in the southernwoodlands of Australia is well documented, wherethe pattern of decline and range contractiongenerally follows the historical pattern of broad-scale clearing. Queensland has so far retainedrelatively more of its native vegetation thansouthern States, and consequently may not have yetexperienced the same decline in woodland birds.
Consequently, Queensland can learn from thesouthern States and also play an important role inconservation by providing a final stronghold forAustralia’s woodland bird community. For exampleGrey-crowned Babblers are still common inQueensland but they are now extinct in south-eastern South Australia, very rare in Victoria andare declining at the edges of their range in NSW.Many other woodland birds are showing similarpatterns.
This final stronghold is now being breached. Thesouthern brigalow belt woodlands, home to 328species of birds, now have three species listed asendangered and a further 21 species listed asvulnerable or rare. At least three more species areextinct from the southern half of their former range:the Squatter Pigeon, Star Finch and the Black-throated Finch.
Short- to medium-term impacts on specific birdgroups were monitored in a recent study on theimpacts of tree clearing in Central Queensland. Itshows that the abundance of insect eating birds(such as treecreepers, thornbills, robins andflycatchers) and fruit eating birds declinedsignificantly in cleared sites. Birds that forage in thecanopy and middle layers of eucalypt woodlandswere noticeably absent. Additionally, within thesmall patches left to provide shade for cattle andother uses, the species composition is changingwith larger generalist birds (such as the AustralianMagpie and Noisy and Yellow-throated Miner)displacing the smaller insect and fruit feedingbirds.81
The immediate effect of clearing habitats isobvious. The relationship between the area of anisland or patch of habitat and the number ofspecies is one of the most robust in the science ofecology. Reduction of an ecosystem by 90 per centwill lead to about a halving in the number of
species of most species groups, including birds.This level of clearing has been reached or exceededin the Western Australian wheatbelt, Mount LoftyRanges of South Australia, and many regions inVictoria and southern NSW.
However, an end to broad-scale clearing is only thefirst step required to arrest and ultimately reversethe decline of woodland birds.82 Habitat loss leadsto fragmentation with small populations inremnants being at a high risk of extinction. Whenremnants are a long way from each other, youngbirds are unable to disperse to find breedingterritories and mates. This effect is now wellunderstood for Brown Treecreepers in NSW andBlue-breasted Fairy-wrens in the WA Wheatbelt.83,84
Fragmented habitat suffers degradation by exposureto more extreme weather, by invasion of weeds,exotic pasture grasses and open country animalsacross edges. Furthermore, heavy grazing, changesto the fire and water regimes, removal of firewood,and tidying up further degrade and simplify thewoodland habitat. A few bird species may increasein abundance - Noisy Miners, which aggressivelyexclude other birds85 and Pied Currawongs, whichare major nest predators.86
What is abundantly clear is that habitat loss,fragmentation and degradation are key threats forone half of birds in Australia.87 Our birds are beingpushed down a path to extinction similar to the onelast century that led to Australia holding theunenviable record of losing more mammal speciesthan any other country since 1500.88 Urgent actionis required to reverse this trend, starting with anend to broad scale land clearing.
Scarlet robin
C.
And
rew
Hen
ley/
AU
SC
AP
E

28
Impacts of Land Clearing on Australian Wildlife in Queensland
1. Overview
With a total of at least 850 species of reptiles
(including 820 non-marine species), Australia has
nearly ten per cent of the world’s known reptiles.
Moreover, some 87 per cent (92 per cent of non-
marine species) of Australia’s reptiles are found
nowhere else, so that the survival of these
species, globally, depends entirely upon the
actions of Australians.
Queensland is one of Australia’s most diverse Statesfor reptiles. Of Australia’s 820 non-marine reptilespecies, 51 per cent (421 species) are found inQueensland – about the same number as inWestern Australia but nearly twice the numberfound in NSW.89 Queensland has national hotspotsof exceptionally high species richness for severalmajor groups of reptiles such as skinks, geckos andsnakes.90
REPTILES AT A GLANCE
• Australia possesses nearly ten per cent of theworld’s reptile species.91
• Australia has the world’s highest number ofendemic reptile species.92
• The conservation status of Queensland’sreptiles includes four endangered and 15vulnerable species and sub-species.93
• Of the 421 native non-marine reptile speciesfound in Queensland, 35 per cent are foundnaturally only in that State.94
• The conservation status of Australian reptilesincludes 12 endangered and 38 vulnerablereptile species and sub-species.95
• Of the 820 native non-marine reptile speciesfound in Australia, 92 per cent are foundnaturally only in Australia.96
Note: Figure derived from Table 7-19, Qld Stateof the Environment Report (1999)
Figure 10: Diversity of reptile species bybioregion
© The State of Queensland (EnvironmentalProtection Agency) 1999
REPTILES
lowmediumhigh
Figure 11: Rare or threatened reptilesin each bioregion
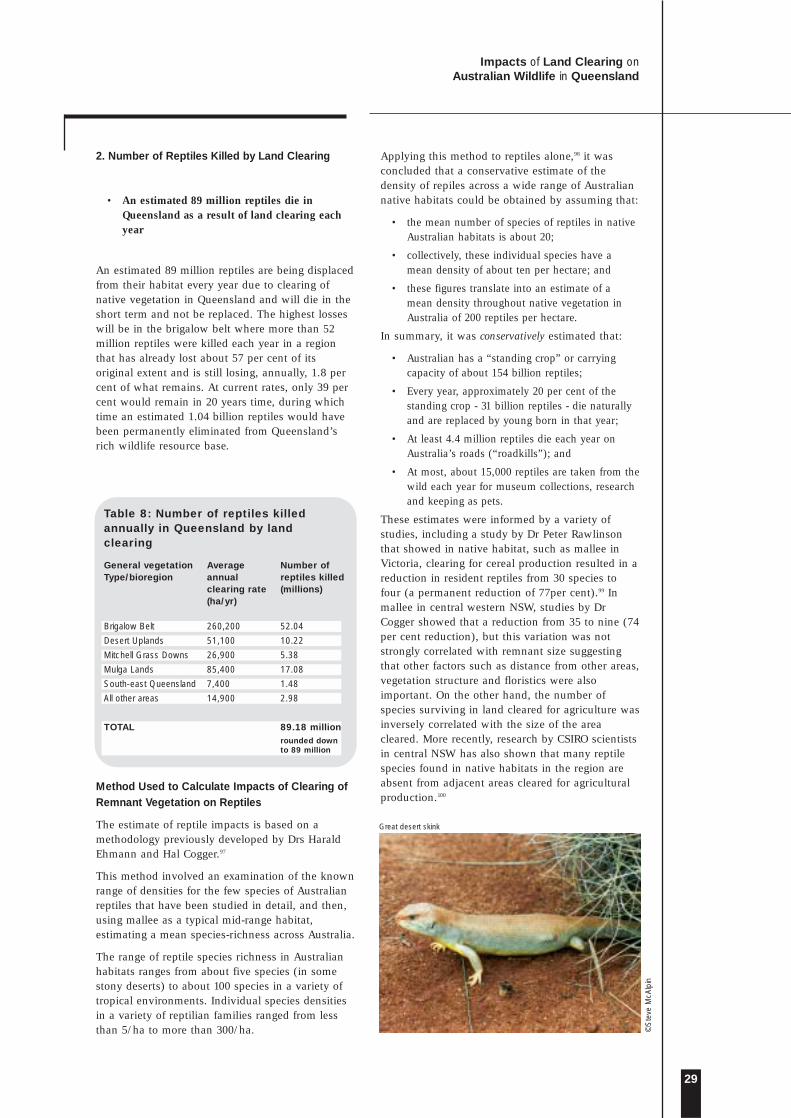
Impacts of Land Clearing on Australian Wildlife in Queensland
29
Table 8: Number of reptiles killedannually in Queensland by landclearing
General vegetation Average Number ofType/bioregion annual reptiles killed
clearing rate (millions)(ha/yr)
Brigalow Belt 260,200 52.04
Desert Uplands 51,100 10.22
Mitchell Grass Downs 26,900 5.38
Mulga Lands 85,400 17.08
South-east Queensland 7,400 1.48
All other areas 14,900 2.98
TOTAL 89.18 millionrounded down to 89 million
2. Number of Reptiles Killed by Land Clearing
• An estimated 89 million reptiles die inQueensland as a result of land clearing eachyear
An estimated 89 million reptiles are being displacedfrom their habitat every year due to clearing ofnative vegetation in Queensland and will die in theshort term and not be replaced. The highest losseswill be in the brigalow belt where more than 52million reptiles were killed each year in a regionthat has already lost about 57 per cent of itsoriginal extent and is still losing, annually, 1.8 percent of what remains. At current rates, only 39 percent would remain in 20 years time, during whichtime an estimated 1.04 billion reptiles would havebeen permanently eliminated from Queensland’srich wildlife resource base.
Method Used to Calculate Impacts of Clearing ofRemnant Vegetation on Reptiles
The estimate of reptile impacts is based on amethodology previously developed by Drs HaraldEhmann and Hal Cogger.97
This method involved an examination of the knownrange of densities for the few species of Australianreptiles that have been studied in detail, and then,using mallee as a typical mid-range habitat,estimating a mean species-richness across Australia.
The range of reptile species richness in Australianhabitats ranges from about five species (in somestony deserts) to about 100 species in a variety oftropical environments. Individual species densitiesin a variety of reptilian families ranged from lessthan 5/ha to more than 300/ha.
Applying this method to reptiles alone,98 it wasconcluded that a conservative estimate of thedensity of repiles across a wide range of Australiannative habitats could be obtained by assuming that:
• the mean number of species of reptiles in nativeAustralian habitats is about 20;
• collectively, these individual species have amean density of about ten per hectare; and
• these figures translate into an estimate of amean density throughout native vegetation inAustralia of 200 reptiles per hectare.
In summary, it was conservatively estimated that:
• Australian has a “standing crop” or carryingcapacity of about 154 billion reptiles;
• Every year, approximately 20 per cent of thestanding crop - 31 billion reptiles - die naturallyand are replaced by young born in that year;
• At least 4.4 million reptiles die each year onAustralia’s roads (“roadkills”); and
• At most, about 15,000 reptiles are taken from thewild each year for museum collections, researchand keeping as pets.
These estimates were informed by a variety ofstudies, including a study by Dr Peter Rawlinsonthat showed in native habitat, such as mallee inVictoria, clearing for cereal production resulted in areduction in resident reptiles from 30 species tofour (a permanent reduction of 77per cent).99 Inmallee in central western NSW, studies by DrCogger showed that a reduction from 35 to nine (74per cent reduction), but this variation was notstrongly correlated with remnant size suggestingthat other factors such as distance from other areas,vegetation structure and floristics were alsoimportant. On the other hand, the number ofspecies surviving in land cleared for agriculture wasinversely correlated with the size of the areacleared. More recently, research by CSIRO scientistsin central NSW has also shown that many reptilespecies found in native habitats in the region areabsent from adjacent areas cleared for agriculturalproduction.100
©S
teve
McA
lpin
Great desert skink
30
Impacts of Land Clearing on Australian Wildlife in Queensland
REPTILES IN THE QUEENSLAND BRIGALOW
Of the 148 reptile species found in Queensland’s brigalow belt, in 1998 scientists found that 13 species arevirtually restricted to the region, while a further 14 species have most of their range located within the region.101
When these 27 species were assessed against international threatened species criteria, 102 one was ranked ascritically endangered (and may well be extinct), one as endangered, ten as vulnerable and two as near-threatened.
This includes the Yakka Skink (Egernia rugosa), listed as vulnerable under both Queensland and Commonwealthlegislation, which is found in relatively small numbers from south-east Queensland to the lower eastern parts ofCape York Peninsula. It is a large, well-built lizard growing to a total length of nearly half a metre. It is a relativelyshy, basking lizard that retreats into its burrow at the slightest disturbance, and so is not often seen.
Its burrows are usually associated with rocky outcrops or tree root systems in a range of habitats from openforests to woodlands and shrublands. Land clearing results in extirpation of the lizard by removing its cover andexposing its burrows to destruction by farm machinery and grazing sheep and cattle.
Yet despite the threat to so many species, only two per cent of the region had been set aside in reserves – an areanot much larger than that cleared during each and every year of the previous decade. A further four per centconsisted of State forests and Timber Reserves offering some protection into the future. Of 163 regionalecosystems identified in the brigalow belt by plant ecologists, 33 were classified as endangered and 32 as being ofconcern. All of this in an area occupying nearly 20 per cent of Queensland.
So even when the major threat to maintaining the rich diversity of animals and plants of the brigalow belt – theclearing of native vegetation - had been clearly identified, nothing was done to stem the loss. Indeed, high rates ofland clearing continue.
The authors of this study concluded that the brigalow belt in Queensland “…is a fine example of how to diminishdiversity – encourage clearing of native forests, through taxation and other incentives; fail to secure inconservation reserves representatives of all vegetation types in the region; recognise late, after several specieshave become extinct or are in decline, that a major problem in maintaining diversity exists; and proceed with plansfor further development even though diversity is already known to be assailed.”103
Unfortunately this story is being repeated every day, on different scales but with similar outcomes, in many partsof Australia. Biodiversity, like water, can be degraded and overexploited to the point where whole ecosystems andtheir services – clean air, clean water, erosion control, moderation of climate and recreational facilities - eventuallycollapse.
Impacts of Land Clearing on Australian Wildlife in Queensland
31
3. The Future of Reptiles
One in four of Australia’s 850 reptile species are insignificant decline. Of these, Queensland has thehighest number (84 or 41 per cent) of the 204reptile species currently threatened.104 It also comessecond (after Western Australia) in the number ofspecies falling into the two highest categories ofthreat – endangered and vulnerable. Of the majorthreats contributing to the decline of the 52 speciesassessed nationally105 as endangered or vulnerable,land clearing was the threat most often implicated,followed by (but well ahead of) the degradingprocesses of overgrazing and cropping.
For a variety of reasons – small size, secretivehabits, fewer researchers – and despite their greaterdiversity, the ecology and distribution of reptiles ismuch less well known than that of either mammalsor birds. The majority of reptiles are declining innumbers, but those at the greatest risk of extinctionare those whose declines are driven largely byclearing of native vegetation and the consequentfragmentation of their populations.
The problem with land clearing is that the greatmajority of the reptiles displaced die immediately orsoon after clearing takes place, and are neverreplaced. If the land is allowed to revegetate overtime, some reptiles will eventually re-establishthemselves, but if the cleared land is replaced bycrops then the original reptiles – in their millions –are lost forever.
But other primary production activities, such asgrazing by livestock, also seriously degrade naturalecosystems and dramatically reduce their capacityto support the diversity and densities of reptiles thatwere originally present. Even rough estimates ofthese effects are difficult to determine on a nationalscale, but as lands used for grazing are primarilywoodlands, open woodlands and shrublands,106 andas these vegetation associations together made up
some 84 per cent of Australia’s original vegetationcover (now about 79 per cent), even modestdegradation of such lands results in a dramatic lossof reptilian diversity.
Few species of reptiles have had their populationsmonitored for long-term changes in health andnumbers. Such monitoring programs as exist areusually confined to already endangered species withsmall numbers and well-documented declines. Sowe have no idea of the state of health of most ofour 820 species of non-marine reptiles. Similarly,there have been virtually no studies conducted inAustralia of reptile communities or assemblages inwhich reliable estimates have been made of bothspecies richness and population numbers of each ofthe species present. Consequently estimates of thenumbers of reptiles affected by land clearing areextrapolated from a very limited database.Nevertheless the method used is essentiallyconservative in its assumptions.
Quite apart from the permanent loss resulting fromthe annual slaughter of millions of reptiles throughland clearing and related activities, the contributionof these lost reptiles to ecosystem services andfunctions, and the consequent loss of the land’sproductivity, remain unmeasured. Most reptiles areinsect eaters, and using the example ofQueensland’s brigalow belt cited above, the 520million reptiles killed by land clearing during thepast decade would otherwise have consumed aconservatively estimated 100 billion insectsannually during that period. Given otherinterdependencies and links in the complex ecologyof woodlands and forests, the loss of reptilenumbers and diversity is capable of seriouslycompromising the long-term viability (in terms ofecosystem services) of the affected land.
Many of the lizards and other reptiles that survive the initial clearing of remnant bush take refuge in thewood rows of cleared vegetation. Many of these die when the woodrows are burnt.
32
Impacts of Land Clearing on Australian Wildlife in Queensland
AUSTRALIA’S VEGETATION AT GLANCE
• Australia is the fifth ranked country in theworld for endemic higher plant species.114
• The conservation status of Queensland’s floraincludes 21 extinct, 81 endangered and 243vulnerable plant species and sub-species.115
• The 8,329 native species of vascular plants inQueensland include 2,582 (31 per cent) thatare found naturally only in Queensland.116
• The conservation status of Australian floraincludes 62 extinct, 35 critically endangered,489 endangered and 656 vulnerable plantspecies and sub-species.117
• The 15,638 native species of higher plants inAustralia include more than 13 000 that arefound naturally only in Australia.118,119
Figure 12: Diversity of plant species(including naturalised plants) by bioregion
1. Overview
Australia has a diverse and distinctive flora
dominated by eucalypts and acacias. Our native
higher plants include 15,638 species, of which
about 80-95 per cent are endemic.107,108
Queensland supports more higher plant speciesthan any other Australian state.109 Plant diversity ishighest in coastal areas of the state, and is mostconcentrated in the Wet Tropics and south-eastQueensland,110 which represent two of Australia’snine centres of vascular plant endemism.111 Thesetwo areas, which were productive and species rich,were extensively cleared by the 1960s.
During the 1990s about 80 per cent of Australia’sland clearing occurred in Queensland.112 WithinQueensland, tree clearing has moved from thehighly productive and fertile land types, forexample coastal and alluvial areas, to moremarginal ecosystems with lower fertility and/orrainfall.113 This trend reflects legislative protection ofthe more heavily cleared ecosystems and the factthat the most productive land types have alreadyhad more than 90 per cent of the remnant nativevegetation cleared.
© The State of Queensland (EnvironmentalProtection Agency) 1999
Figure 13: Rare or threatened plants ineach bioregion
Note: Figure derived from Table 7-19, Qld Stateof the Environment Report (1999)
MAPTO
COME
REMNANT TREES
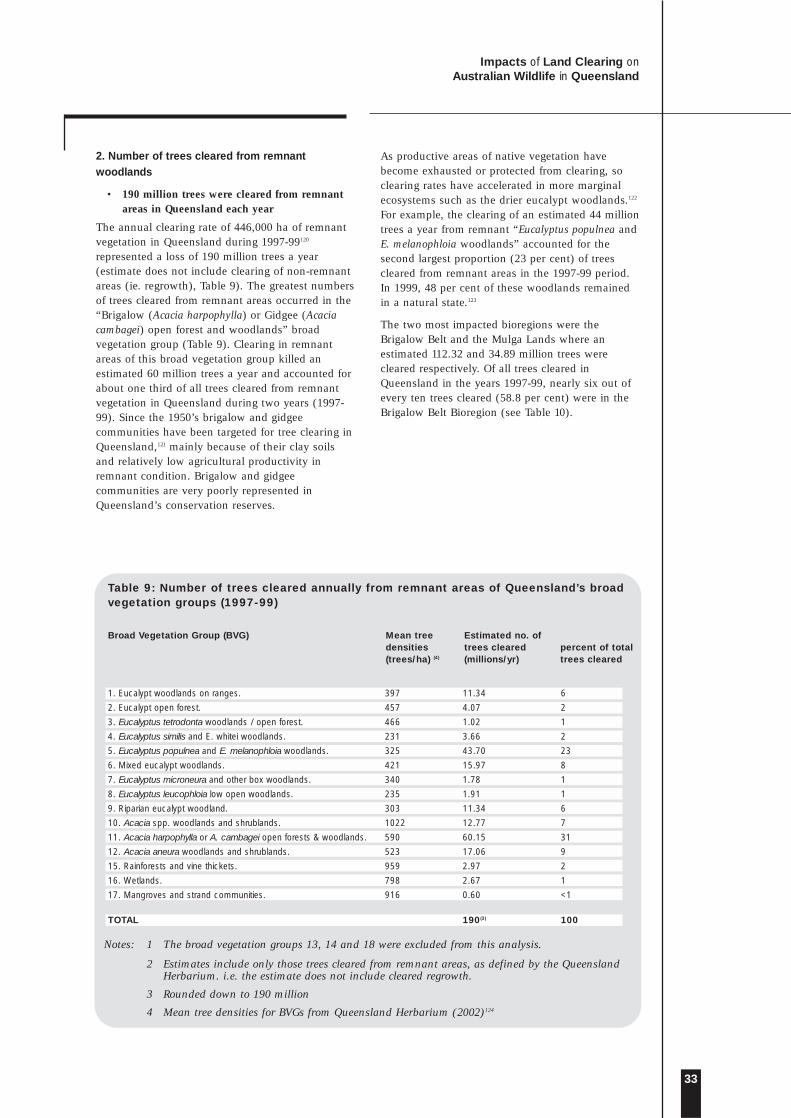
Impacts of Land Clearing on Australian Wildlife in Queensland
33
Broad Vegetation Group (BVG) Mean tree Estimated no. ofdensities trees cleared percent of total(trees/ha) (4) (millions/yr) trees cleared
1. Eucalypt woodlands on ranges. 397 11.34 6
2. Eucalypt open forest. 457 4.07 2
3. Eucalyptus tetrodonta woodlands / open forest. 466 1.02 1
4. Eucalyptus similis and E. whitei woodlands. 231 3.66 2
5. Eucalyptus populnea and E. melanophloia woodlands. 325 43.70 23
6. Mixed eucalypt woodlands. 421 15.97 8
7. Eucalyptus microneura and other box woodlands. 340 1.78 1
8. Eucalyptus leucophloia low open woodlands. 235 1.91 1
9. Riparian eucalypt woodland. 303 11.34 6
10. Acacia spp. woodlands and shrublands. 1022 12.77 7
11. Acacia harpophylla or A. cambagei open forests & woodlands. 590 60.15 31
12. Acacia aneura woodlands and shrublands. 523 17.06 9
15. Rainforests and vine thickets. 959 2.97 2
16. Wetlands. 798 2.67 1
17. Mangroves and strand communities. 916 0.60 <1
TOTAL 190(3) 100
Table 9: Number of trees cleared annually from remnant areas of Queensland’s broadvegetation groups (1997-99)
Notes: 1 The broad vegetation groups 13, 14 and 18 were excluded from this analysis.
2 Estimates include only those trees cleared from remnant areas, as defined by the QueenslandHerbarium. i.e. the estimate does not include cleared regrowth.
3 Rounded down to 190 million
4 Mean tree densities for BVGs from Queensland Herbarium (2002)124
2. Number of trees cleared from remnantwoodlands
• 190 million trees were cleared from remnantareas in Queensland each year
The annual clearing rate of 446,000 ha of remnantvegetation in Queensland during 1997-99120
represented a loss of 190 million trees a year(estimate does not include clearing of non-remnantareas (ie. regrowth), Table 9). The greatest numbersof trees cleared from remnant areas occurred in the“Brigalow (Acacia harpophylla) or Gidgee (Acaciacambagei) open forest and woodlands” broadvegetation group (Table 9). Clearing in remnantareas of this broad vegetation group killed anestimated 60 million trees a year and accounted forabout one third of all trees cleared from remnantvegetation in Queensland during two years (1997-99). Since the 1950’s brigalow and gidgeecommunities have been targeted for tree clearing inQueensland,121 mainly because of their clay soilsand relatively low agricultural productivity inremnant condition. Brigalow and gidgeecommunities are very poorly represented inQueensland’s conservation reserves.
As productive areas of native vegetation havebecome exhausted or protected from clearing, soclearing rates have accelerated in more marginalecosystems such as the drier eucalypt woodlands.122
For example, the clearing of an estimated 44 milliontrees a year from remnant “Eucalyptus populnea andE. melanophloia woodlands” accounted for thesecond largest proportion (23 per cent) of treescleared from remnant areas in the 1997-99 period.In 1999, 48 per cent of these woodlands remainedin a natural state.123
The two most impacted bioregions were theBrigalow Belt and the Mulga Lands where anestimated 112.32 and 34.89 million trees werecleared respectively. Of all trees cleared inQueensland in the years 1997-99, nearly six out ofevery ten trees cleared (58.8 per cent) were in theBrigalow Belt Bioregion (see Table 10).
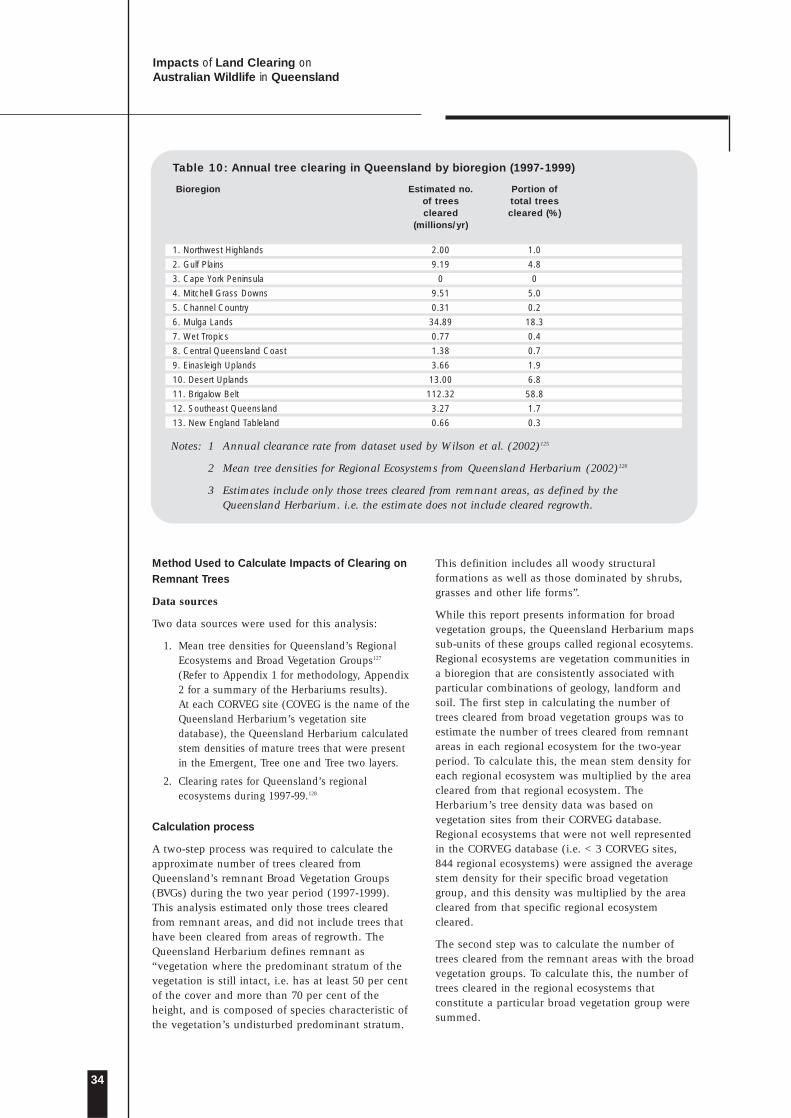
34
Impacts of Land Clearing on Australian Wildlife in Queensland
Table 10: Annual tree clearing in Queensland by bioregion (1997-1999)
Bioregion Estimated no. Portion ofof trees total treescleared cleared (%)
(millions/yr)
1. Northwest Highlands 2.00 1.0
2. Gulf Plains 9.19 4.8
3. Cape York Peninsula 0 0
4. Mitchell Grass Downs 9.51 5.0
5. Channel Country 0.31 0.2
6. Mulga Lands 34.89 18.3
7. Wet Tropics 0.77 0.4
8. Central Queensland Coast 1.38 0.7
9. Einasleigh Uplands 3.66 1.9
10. Desert Uplands 13.00 6.8
11. Brigalow Belt 112.32 58.8
12. Southeast Queensland 3.27 1.7
13. New England Tableland 0.66 0.3
Method Used to Calculate Impacts of Clearing onRemnant Trees
Data sources
Two data sources were used for this analysis:
1. Mean tree densities for Queensland’s RegionalEcosystems and Broad Vegetation Groups127
(Refer to Appendix 1 for methodology, Appendix2 for a summary of the Herbariums results).At each CORVEG site (COVEG is the name of theQueensland Herbarium’s vegetation sitedatabase), the Queensland Herbarium calculatedstem densities of mature trees that were presentin the Emergent, Tree one and Tree two layers.
2. Clearing rates for Queensland’s regionalecosystems during 1997-99.128
Calculation process
A two-step process was required to calculate theapproximate number of trees cleared fromQueensland’s remnant Broad Vegetation Groups(BVGs) during the two year period (1997-1999).This analysis estimated only those trees clearedfrom remnant areas, and did not include trees thathave been cleared from areas of regrowth. TheQueensland Herbarium defines remnant as“vegetation where the predominant stratum of thevegetation is still intact, i.e. has at least 50 per centof the cover and more than 70 per cent of theheight, and is composed of species characteristic ofthe vegetation’s undisturbed predominant stratum.
This definition includes all woody structuralformations as well as those dominated by shrubs,grasses and other life forms”.
While this report presents information for broadvegetation groups, the Queensland Herbarium mapssub-units of these groups called regional ecosytems.Regional ecosystems are vegetation communities ina bioregion that are consistently associated withparticular combinations of geology, landform andsoil. The first step in calculating the number oftrees cleared from broad vegetation groups was toestimate the number of trees cleared from remnantareas in each regional ecosystem for the two-yearperiod. To calculate this, the mean stem density foreach regional ecosystem was multiplied by the areacleared from that regional ecosystem. TheHerbarium’s tree density data was based onvegetation sites from their CORVEG database.Regional ecosystems that were not well representedin the CORVEG database (i.e. <3 CORVEG sites,844 regional ecosystems) were assigned the averagestem density for their specific broad vegetationgroup, and this density was multiplied by the areacleared from that specific regional ecosystemcleared.
The second step was to calculate the number oftrees cleared from the remnant areas with the broadvegetation groups. To calculate this, the number oftrees cleared in the regional ecosystems thatconstitute a particular broad vegetation group weresummed.
Notes: 1 Annual clearance rate from dataset used by Wilson et al. (2002)125
2 Mean tree densities for Regional Ecosystems from Queensland Herbarium (2002)126
3 Estimates include only those trees cleared from remnant areas, as defined by theQueensland Herbarium. i.e. the estimate does not include cleared regrowth.
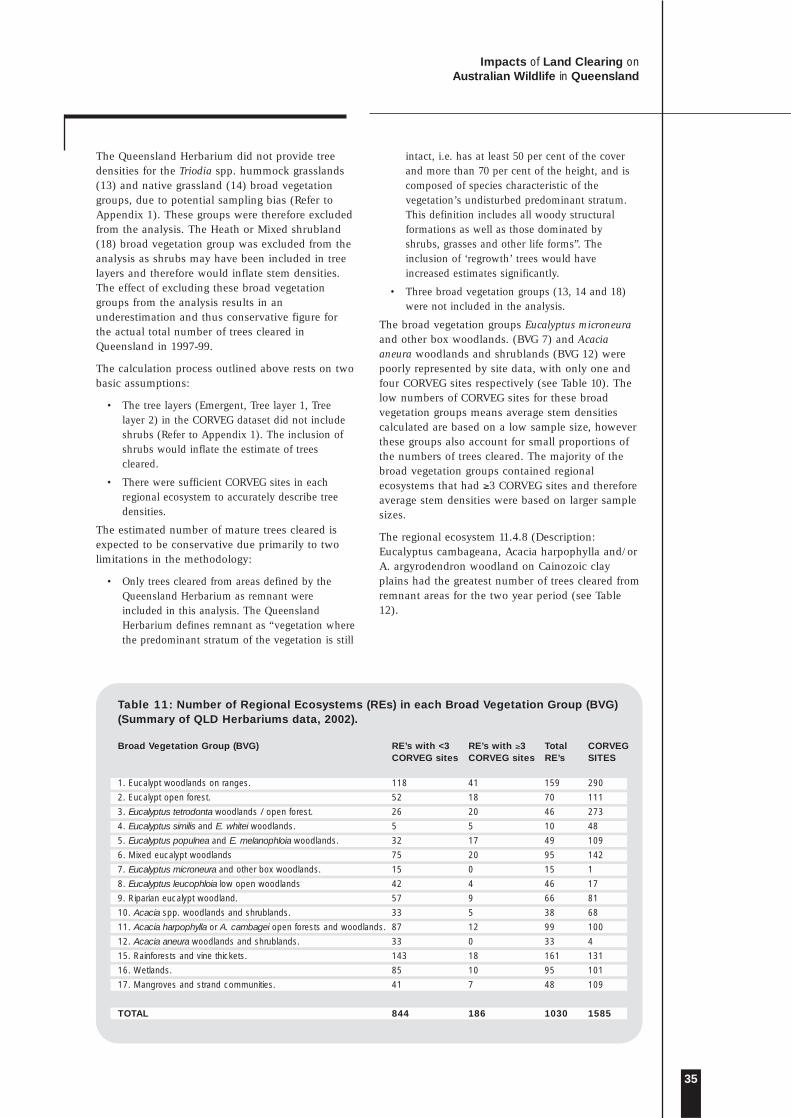
Impacts of Land Clearing on Australian Wildlife in Queensland
35
Table 11: Number of Regional Ecosystems (REs) in each Broad Vegetation Group (BVG)(Summary of QLD Herbariums data, 2002).
Broad Vegetation Group (BVG) RE’s with <3 RE’s with ≥3 Total CORVEGCORVEG sites CORVEG sites RE’s SITES
1. Eucalypt woodlands on ranges. 118 41 159 290
2. Eucalypt open forest. 52 18 70 111
3. Eucalyptus tetrodonta woodlands / open forest. 26 20 46 273
4. Eucalyptus similis and E. whitei woodlands. 5 5 10 48
5. Eucalyptus populnea and E. melanophloia woodlands. 32 17 49 109
6. Mixed eucalypt woodlands 75 20 95 142
7. Eucalyptus microneura and other box woodlands. 15 0 15 1
8. Eucalyptus leucophloia low open woodlands 42 4 46 17
9. Riparian eucalypt woodland. 57 9 66 81
10. Acacia spp. woodlands and shrublands. 33 5 38 68
11. Acacia harpophylla or A. cambagei open forests and woodlands. 87 12 99 100
12. Acacia aneura woodlands and shrublands. 33 0 33 4
15. Rainforests and vine thickets. 143 18 161 131
16. Wetlands. 85 10 95 101
17. Mangroves and strand communities. 41 7 48 109
TOTAL 844 186 1030 1585
The Queensland Herbarium did not provide treedensities for the Triodia spp. hummock grasslands(13) and native grassland (14) broad vegetationgroups, due to potential sampling bias (Refer toAppendix 1). These groups were therefore excludedfrom the analysis. The Heath or Mixed shrubland(18) broad vegetation group was excluded from theanalysis as shrubs may have been included in treelayers and therefore would inflate stem densities.The effect of excluding these broad vegetationgroups from the analysis results in anunderestimation and thus conservative figure forthe actual total number of trees cleared inQueensland in 1997-99.
The calculation process outlined above rests on twobasic assumptions:
• The tree layers (Emergent, Tree layer 1, Treelayer 2) in the CORVEG dataset did not includeshrubs (Refer to Appendix 1). The inclusion ofshrubs would inflate the estimate of treescleared.
• There were sufficient CORVEG sites in eachregional ecosystem to accurately describe treedensities.
The estimated number of mature trees cleared isexpected to be conservative due primarily to twolimitations in the methodology:
• Only trees cleared from areas defined by theQueensland Herbarium as remnant wereincluded in this analysis. The QueenslandHerbarium defines remnant as “vegetation wherethe predominant stratum of the vegetation is still
intact, i.e. has at least 50 per cent of the coverand more than 70 per cent of the height, and iscomposed of species characteristic of thevegetation’s undisturbed predominant stratum.This definition includes all woody structuralformations as well as those dominated byshrubs, grasses and other life forms”. Theinclusion of ‘regrowth’ trees would haveincreased estimates significantly.
• Three broad vegetation groups (13, 14 and 18)were not included in the analysis.
The broad vegetation groups Eucalyptus microneuraand other box woodlands. (BVG 7) and Acaciaaneura woodlands and shrublands (BVG 12) werepoorly represented by site data, with only one andfour CORVEG sites respectively (see Table 10). Thelow numbers of CORVEG sites for these broadvegetation groups means average stem densitiescalculated are based on a low sample size, howeverthese groups also account for small proportions ofthe numbers of trees cleared. The majority of thebroad vegetation groups contained regionalecosystems that had ≥3 CORVEG sites and thereforeaverage stem densities were based on larger samplesizes.
The regional ecosystem 11.4.8 (Description:Eucalyptus cambageana, Acacia harpophylla and/orA. argyrodendron woodland on Cainozoic clayplains had the greatest number of trees cleared fromremnant areas for the two year period (see Table12).
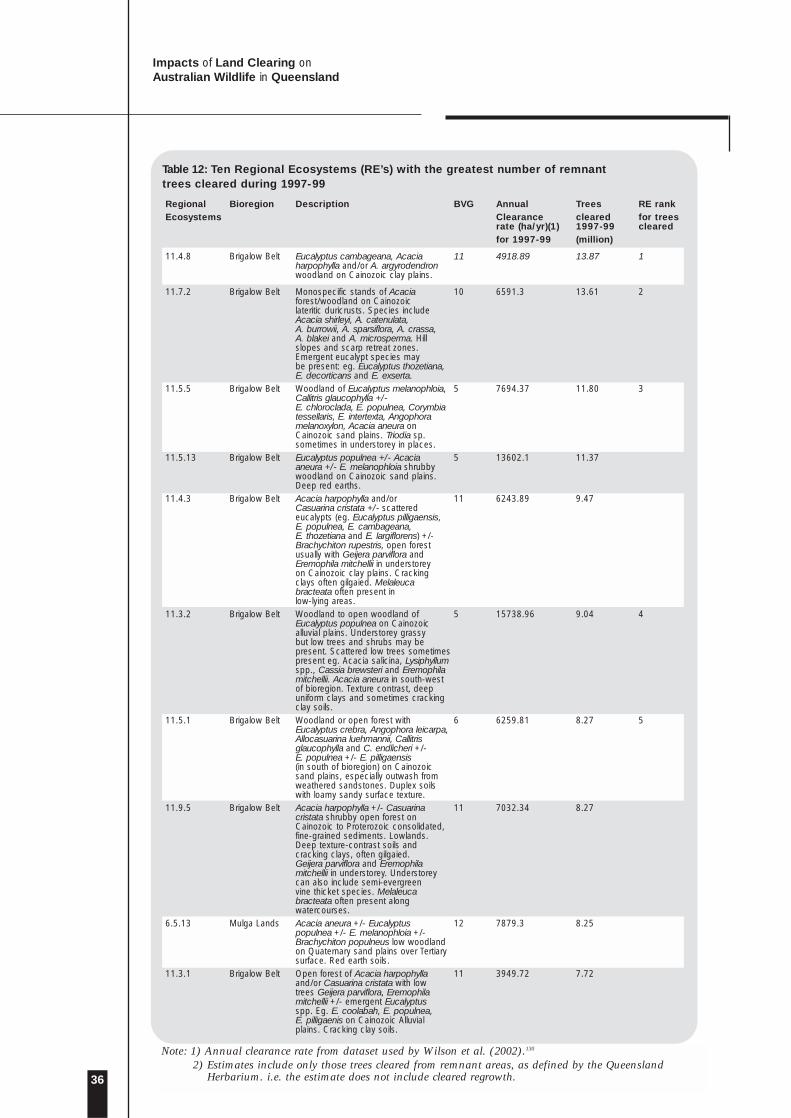
36
Impacts of Land Clearing on Australian Wildlife in Queensland
Table 12: Ten Regional Ecosystems (RE’s) with the greatest number of remnanttrees cleared during 1997-99
Regional Bioregion Description BVG Annual Trees RE rank Ecosystems Clearance cleared for trees
rate (ha/yr)(1) 1997-99 clearedfor 1997-99 (million)
11.4.8 Brigalow Belt Eucalyptus cambageana, Acacia 11 4918.89 13.87 1harpophylla and/or A. argyrodendronwoodland on Cainozoic clay plains.
11.7.2 Brigalow Belt Monospecific stands of Acacia 10 6591.3 13.61 2forest/woodland on Cainozoiclateritic duricrusts. Species includeAcacia shirleyi, A. catenulata,A. burrowii, A. sparsiflora, A. crassa,A. blakei and A. microsperma. Hillslopes and scarp retreat zones.Emergent eucalypt species maybe present: eg. Eucalyptus thozetiana,E. decorticans and E. exserta.
11.5.5 Brigalow Belt Woodland of Eucalyptus melanophloia, 5 7694.37 11.80 3Callitris glaucophylla +/-E. chloroclada, E. populnea, Corymbiatessellaris, E. intertexta, Angophora melanoxylon, Acacia aneura on Cainozoic sand plains. Triodia sp.sometimes in understorey in places.
11.5.13 Brigalow Belt Eucalyptus populnea +/- Acacia 5 13602.1 11.37aneura +/- E. melanophloia shrubbywoodland on Cainozoic sand plains.Deep red earths.
11.4.3 Brigalow Belt Acacia harpophylla and/or 11 6243.89 9.47Casuarina cristata +/- scatteredeucalypts (eg. Eucalyptus pilligaensis,E. populnea, E. cambageana,E. thozetiana and E. largiflorens) +/-Brachychiton rupestris, open forestusually with Geijera parviflora andEremophila mitchellii in understoreyon Cainozoic clay plains. Crackingclays often gilgaied. Melaleucabracteata often present inlow-lying areas.
11.3.2 Brigalow Belt Woodland to open woodland of 5 15738.96 9.04 4Eucalyptus populnea on Cainozoicalluvial plains. Understorey grassybut low trees and shrubs may bepresent. Scattered low trees sometimespresent eg. Acacia salicina, Lysiphyllumspp., Cassia brewsteri and Eremophilamitchellii. Acacia aneura in south-westof bioregion. Texture contrast, deepuniform clays and sometimes crackingclay soils.
11.5.1 Brigalow Belt Woodland or open forest with 6 6259.81 8.27 5Eucalyptus crebra, Angophora leicarpa,Allocasuarina luehmannii, Callitrisglaucophylla and C. endlicheri +/-E. populnea +/- E. pilligaensis(in south of bioregion) on Cainozoicsand plains, especially outwash fromweathered sandstones. Duplex soilswith loamy sandy surface texture.
11.9.5 Brigalow Belt Acacia harpophylla +/- Casuarina 11 7032.34 8.27cristata shrubby open forest onCainozoic to Proterozoic consolidated,fine-grained sediments. Lowlands.Deep texture-contrast soils andcracking clays, often gilgaied.Geijera parviflora and Eremophilamitchellii in understorey. Understoreycan also include semi-evergreenvine thicket species. Melaleucabracteata often present alongwatercourses.
6.5.13 Mulga Lands Acacia aneura +/- Eucalyptus 12 7879.3 8.25populnea +/- E. melanophloia +/-Brachychiton populneus low woodlandon Quaternary sand plains over Tertiarysurface. Red earth soils.
11.3.1 Brigalow Belt Open forest of Acacia harpophylla 11 3949.72 7.72and/or Casuarina cristata with lowtrees Geijera parviflora, Eremophilamitchellii +/- emergent Eucalyptusspp. Eg. E. coolabah, E. populnea,E. pilligaenis on Cainozoic Alluvialplains. Cracking clay soils.
Note: 1) Annual clearance rate from dataset used by Wilson et al. (2002).130
2) Estimates include only those trees cleared from remnant areas, as defined by the QueenslandHerbarium. i.e. the estimate does not include cleared regrowth.
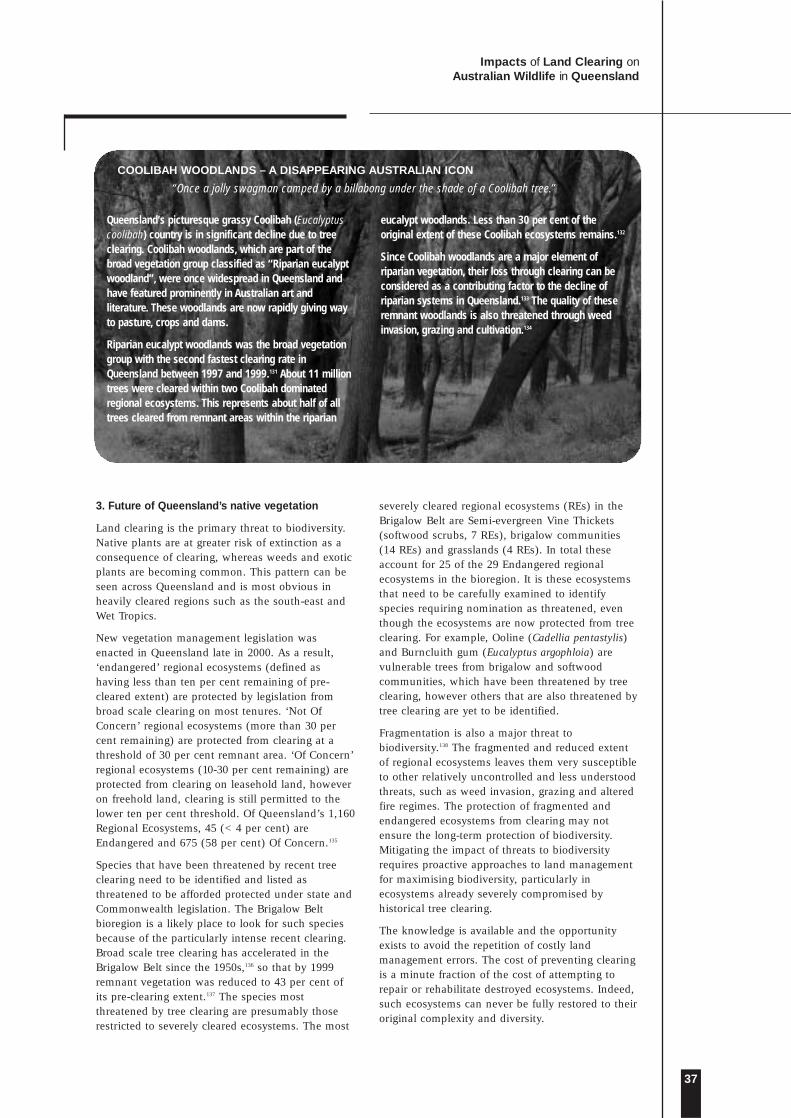
Impacts of Land Clearing on Australian Wildlife in Queensland
37
Queensland’s picturesque grassy Coolibah (Eucalyptuscoolibah) country is in significant decline due to treeclearing. Coolibah woodlands, which are part of thebroad vegetation group classified as “Riparian eucalyptwoodland”, were once widespread in Queensland andhave featured prominently in Australian art andliterature. These woodlands are now rapidly giving wayto pasture, crops and dams.
Riparian eucalypt woodlands was the broad vegetationgroup with the second fastest clearing rate inQueensland between 1997 and 1999.131 About 11 milliontrees were cleared within two Coolibah dominatedregional ecosystems. This represents about half of alltrees cleared from remnant areas within the riparian
3. Future of Queensland’s native vegetation
Land clearing is the primary threat to biodiversity.Native plants are at greater risk of extinction as aconsequence of clearing, whereas weeds and exoticplants are becoming common. This pattern can beseen across Queensland and is most obvious inheavily cleared regions such as the south-east andWet Tropics.
New vegetation management legislation wasenacted in Queensland late in 2000. As a result,‘endangered’ regional ecosystems (defined ashaving less than ten per cent remaining of pre-cleared extent) are protected by legislation frombroad scale clearing on most tenures. ‘Not OfConcern’ regional ecosystems (more than 30 percent remaining) are protected from clearing at athreshold of 30 per cent remnant area. ‘Of Concern’regional ecosystems (10-30 per cent remaining) areprotected from clearing on leasehold land, howeveron freehold land, clearing is still permitted to thelower ten per cent threshold. Of Queensland’s 1,160Regional Ecosystems, 45 (<4 per cent) areEndangered and 675 (58 per cent) Of Concern.135
Species that have been threatened by recent treeclearing need to be identified and listed asthreatened to be afforded protected under state andCommonwealth legislation. The Brigalow Beltbioregion is a likely place to look for such speciesbecause of the particularly intense recent clearing.Broad scale tree clearing has accelerated in theBrigalow Belt since the 1950s,136 so that by 1999remnant vegetation was reduced to 43 per cent ofits pre-clearing extent.137 The species mostthreatened by tree clearing are presumably thoserestricted to severely cleared ecosystems. The most
severely cleared regional ecosystems (REs) in theBrigalow Belt are Semi-evergreen Vine Thickets(softwood scrubs, 7 REs), brigalow communities(14 REs) and grasslands (4 REs). In total theseaccount for 25 of the 29 Endangered regionalecosystems in the bioregion. It is these ecosystemsthat need to be carefully examined to identifyspecies requiring nomination as threatened, eventhough the ecosystems are now protected from treeclearing. For example, Ooline (Cadellia pentastylis)and Burncluith gum (Eucalyptus argophloia) arevulnerable trees from brigalow and softwoodcommunities, which have been threatened by treeclearing, however others that are also threatened bytree clearing are yet to be identified.
Fragmentation is also a major threat tobiodiversity.138 The fragmented and reduced extentof regional ecosystems leaves them very susceptibleto other relatively uncontrolled and less understoodthreats, such as weed invasion, grazing and alteredfire regimes. The protection of fragmented andendangered ecosystems from clearing may notensure the long-term protection of biodiversity.Mitigating the impact of threats to biodiversityrequires proactive approaches to land managementfor maximising biodiversity, particularly inecosystems already severely compromised byhistorical tree clearing.
The knowledge is available and the opportunityexists to avoid the repetition of costly landmanagement errors. The cost of preventing clearingis a minute fraction of the cost of attempting torepair or rehabilitate destroyed ecosystems. Indeed,such ecosystems can never be fully restored to theiroriginal complexity and diversity.
eucalypt woodlands. Less than 30 per cent of theoriginal extent of these Coolibah ecosystems remains.132
Since Coolibah woodlands are a major element ofriparian vegetation, their loss through clearing can beconsidered as a contributing factor to the decline ofriparian systems in Queensland.133 The quality of theseremnant woodlands is also threatened through weedinvasion, grazing and cultivation.134
COOLIBAH WOODLANDS – A DISAPPEARING AUSTRALIAN ICON
“Once a jolly swagman camped by a billabong under the shade of a Coolibah tree.”
38
Impacts of Land Clearing on Australian Wildlife in Queensland
FUTURE OFAUSTRALIA’S WILDLIFE
Over the past decade, in a succession of reports
and submissions made to Governments – both
State and Commonwealth – Australia’s leading
scientists have emphasised what has long been
recognised by ecologists: that the management of
natural systems in this country has failed to
recognise the value of the services they provide to
Australia’s health and wealth, and that we have
consistently exploited those resources on an
unsustainable basis. In 2002, two major
reports139,140 specifically warned the Australian
Government of the dangerous consequences of
current rates of broad-scale clearing of native
vegetation.
In this document we have presented a differentperspective on one particular aspect of land clearing– its direct impacts on the wildlife occupying theland that is cleared.
We have pointed out that when any area of nativebushland is cleared it is widely assumed that,though a few animals may be killed by bulldozersor falling trees, most of the resident wildlife issimply “displaced” – that it will spread out to findnew homes in nearby areas. But in reality, the vastmajority of animals will die. Most will die quickly,but others survive for a time before dying fromstarvation or predation. Many reptiles andmammals may also survive for a while in the pilesof cleared vegetation, only to be incinerated whenthose piles are burned prior to preparing the landfor agriculture or grazing. Pre-and post-clearingsurveys show dramatic declines in numbers anddiversity – usually of the order of 70-90 per cent,but with no compensating increases in survivingbushland.
And so multi-millions of land vertebrates –mammals, birds and reptiles – are killed each yearthrough local and broad-scale clearing of nativeforest and woodlands in Australia. They are notreplaced over time. They are permanently removedfrom the Australian landscape.
While further losses of biodiversity arean inevitable outcome of Australia’sdevelopment, we must re-defineacceptable levels of loss in thecontext of sustainability.Unsustainable use of resourcesinvariably leads to system
declines and failures – salination, loss of soil andsoil fertility, inability to recover rapidly from naturaldisasters, eutrophication and toxification of riversand wetlands, and the inevitable decline andextinction – first at local and regional levels, later atnational levels – of uniquely Australian species.
There are many compelling reasons for conservingour wildlife. Not the least of these, apart from self-interest, is that Australia has more endemic species– species found nowhere else in the world – thanmost other countries. Declines and extinctionsreflect our failure as custodians of our own country.Furthermore, our vertebrate wildlife represents akey element in the attraction of Australia as a globaltourist destination.
There is also increasing evidence that the declineand extinction of species reflects decliningecosystem health. This is a complex process, withbroad-scale land clearing not only impactingimmediately on the animals and plants presentwhen it occurs, but impacting more subtly overtime through the slower-acting effects of habitatfragmentation and degradation.
Thus, the full effects of land clearing today may notbe felt for many years. We are building up a debt –an extinction debt – that will cost futuregenerations dearly. It will fall due in 20, 50 orperhaps 100 year’s time when the full effects oftoday’s actions are realised. In the meantime, localextinctions gradually become regional until entirespecies are extirpated. And with each passing yearthe prospects of mitigating the outcomes decreaseswhile the cost escalates. Because of this lag time, ifwe stop clearing now we have a relatively narrowwindow of opportunity in which to take action torecover this debt and to start reconstructingAustralian landscapes to maintain our wildlife,changed but nevertheless with most of its diversityintact.
Australia has now reached a point in its historywhen the management of the entire countrydemands a more holistic approach. Just as we mustreclaim our rivers by breaching personal andpolitical boundaries, so we must conserve ourremaining biodiversity on a sustainable basis. Thisdoes not mean stopping the development clock, butof balancing development needs with the need tomaintain the many services of natural ecosystems,including the reconstruction and restoration ofseriously degraded systems. Biodiversity loss, theeffective management of exotic animal and plantspests, and the recovery of our rivers and wetlands
are the major environmental threats to ahealthy and productive Australia.
5
Impacts of Land Clearing on Australian Wildlife in Queensland
39
REFERENCES
1 Australian Greenhouse Office. 2002.Greenhouse Gas Emissions From Land UseChange in Australia: Results of theNational Carbon Accountring System.Australian Greenhouse Office: Canberra.Pg.23.
2 Nicolis, G. 1992. Dynamical systems,biological complexity and global change.pp.21-32 in O.T. Solbrig, H.M. van Emdenand P.G.W.J. van Oordt (eds) Biodiversityand Global Change. International Union ofBiological Sciences, Monograph 8, Paris224 pp.
3 e.g. Mann, C.C. 1991. Extinction: Areecologists crying wolf? Science, 253:736-738; Solbrig, O.T. 1992. Biodiversity: anintroduction. pp.13-20 in O.T. Solbrig,H.M. van Emden and P.G.W.J. van Oordt(eds) Biodiversity and Global Change.International Union of Biological Sciences,Monograph 8, Paris 224 pp.
4 See Faith, D.P. 1997. Biodiversity,biospecifics, and ecological services. TrendsEcol. Evol., 12:66-67, including replies fromP.Williams et al. and C. Perrings.
5 MacArthur, R.H. and Wilson, E.O. 1967.The Theory of Island Biogeography.Princeton University Press: Princeton.
6 Ford, H.A. and Howe, R.W. 1980. Thefuture of birds in the Mount Lofty Ranges.South Australian Ornithologist. Vol.28: 85-89.
7 Garnett, S.T. and Crowley, G.M. 2000.The Action Plan for Australian Birds.Environment Australia: Canberra.
8 Paton, D.C., Carpenter, G. and Sinclair,R.G. 1994. A second bird atlas of theAdelaide region. Part 1: changes in thedistribution of birds: 1974-75 vs. 1984-85.South Australian Ornithologist. Vol. 31, pp.151-193.
9 Ford, H.A. Barrett, G.W., Saunders, D.A.and Recher, H.F. 2001. Why have birds inwoodlands of southern Australia declined?Biological Conservation. Vol. 97, pp.71-88.
10 See also: McAlpine, Fensham, R.J. andTemple-Smith, D.E. 2002. Biodiversityconservation and vegetation clearing inQueensland: principles and thresholds.The Rangeland Journal, Vol. 24(1):36-55.
11 Possingham, H., and Field, S.A. 2001.Regional bird extinctions and theirimplications for vegetation clearancepolicy, LifeLines. Vol. 7. No.2. pp.15-16.
12 Accad, A., Neldner V. J., Wilson, B. A, andNiehus, R. E. 2001. Remnant vegetation inQueensland: Analysis of Pre-clearing,Remnant 1997-1999 Regional EcosystemInformation. Queensland Herbarium,Environmental Protection Agency.
13 Henderson, R.J.F. 2002. Names anddistribution of Queensland Plants, Algae
and Lichens. Queensland EnvironmentalProtection Agency, Brisbane.
14 Christensen P. E. S. 1980. The biology ofBettongia penicillata (Gray 1837) andMacropus eugenii (Desmarest 1817) inrelation to fire. ForestsDepartment ofWestern Australia Bulletin 91.
15 Lovejoy T. E. et al. 1986 Edge and othereffects of isolation on Amazon forestfragments. pp 257-285 in Soule ME (ed.)Conservation Biology: the science of scarcityand diversity. Sinauer Associates:Sunderland Mass.
16 Graetz, R.D., Wilson, M.A. and Campbell,S.K. 1995. Landcover Disturbance over theAustralian Continent: a contemporaryassessment. Biodiversity Series Paper No.7. Department of the Environment, Sportand Territories: Canberra.
17 Cofinas, M. and Creighton, C. (Compilers).2001. Australia’s Native Vegetation: Asummary of the National Land and WaterResources Audit’s Australian NativeVegetation Assessment 2001. National Landand Water Resources Audit: Canberra.
18 Graetz, R.D., Wilson, M.A. and Campbell,S.K. 1995. Landcover Disturbance over theAustralian Continent: a contemporaryassessment. Biodiversity Series Paper No.7. Department of the Environment, Sportand Territories: Canberra.
19 Morgan, G. 2001. Landscape Health inAustralia. A rapid assessment of therelative condition of Australia’s bioregionsand subregions. Environment Australia andNational Land and Water Resources Audit:Canberra. pg.45.
20 Australian Greenhouse Office. 2002.Greenhouse Gas Emissions from Land UseChange in Australia: Results of theNational Carbon Accounting System.Australian Greenhouse Office: Canberra.
21 Accad, A., Neldner V. J., Wilson, B. A, andNiehus, R. E. 2001. Remnant vegetation inQueensland: Analysis of Pre-clearing,Remnant 1997-1999 Regional EcosystemInformation. Queensland Herbarium,Environmental Protection Agency.
22 Wilson, B.A., Neldner, V.J. and Accad, A.2002. The extent and status of remnantvegetation in Queensland and itsimplications for Statewide vegetationmanagement and legislation, TheRangeland Journal, 24(1):6-35.
23 Strahan, R. 1995. The Mammals ofAustralia. Reed Books: Sydney
24 Strahan, R. 1995. The Mammals ofAustralia. Reed Books: Sydney
25 Strahan, R. 1995. The Mammals ofAustralia. Reed Books: Sydney
26 Mittermeir, R.A., Goettsch-Mittermeier, C.,and Robles-Gil, P. 1997. Megadiversity:Earth’s Biologically Wealthiest Nations.Conservation International: WashingtonDC.
27 Queensland Environment Protection
6

40
Impacts of Land Clearing on Australian Wildlife in Queensland
Agency endangered species web site. [URL:http://www.epa.qld.gov.au/environment/plant/endangered/] last viewed 16December 2002.
28 Strahan, R. 1995. The Mammals ofAustralia. Reed Books: Sydney; Churchill,S. 1998. Australian Bats. Reed NewHolland: Sydney
29 Environment Australia EnvironmentProtection and Biodiversity ConservationAct web site. [URL:http://www.ea.gov.au/biodiversity/threatened/species/index.html] last viewed 16December 2002.
30 McKenzie, N. and Burbidge, A. 2002.Australian Mammal Audit. WATSNU.9(1):4-7.
31 Tidemann, C.R., Kelson, S. and Jamieson,J. 1997. Flying-fox damage to orchard fruitin Australia - incidence, extent andeconomic impact. Australian Biologist10:177-184.
32 Wilson, B. A., Neldner, V.J. and Accad, A.2002. The extent and status of remnantvegetation in Queensland and itsimplications for statewide vegetationmanagement and legislation. TheRangeland Journal 24: 6-35.
33 Australian Mammal Abundance Database,Dr C. Johnson, School of Tropical Biology,James Cook University.
34 Australian Mammal Abundance Database,Dr C. Johnson, School of Tropical Biology,James Cook University.
35 Evans, M. 1996. Home range andmovement schedule of sympatric bridlednailtail and black-striped wallabies.Wildlife Research 23:547-556.
36 State of the Environment Advisory Council.1996. State of the Environment: Australia1996. An independent report presented tothe Commonwealth Minister for theEnvironment by the State of theEnvironment Advisory Council. CSIROPublishing: Melbourne.
37 MacPhee, R. and Flemming, C. nd.Committee for Recently Extinct OrganismsList of Mammal Extinctions since AD 1500.Department of Mammalogy, AmericanMuseum of Natural History: New York.[URL: http://creo.amnh.org/] last viewed19 November 2002
38 Commonwealth Environment Protectionand Biodiversity Conservation Actthreatened fauna database [URL:http://www.ea.gov.au/biodiversity/threatened/species/index.html] last viewed 19November 2002
39 MacPhee, R. and Flemming, C. nd.Committee for Recently Extinct OrganismsList of Mammal Extinctions since AD 1500.Department of Mammalogy, AmericanMuseum of Natural History: New York.[URL: http://creo.amnh.org/] last viewed19 November 2002
40 Commonwealth Environment Protection
and Biodiversity Conservation Actthreatened fauna database [URL:http://www.ea.gov.au/biodiversity/threatened/species/index.html] last viewed 19November 2002
41 Commonwealth Environment Protectionand Biodiversity Conservation Actthreatened fauna database [URL:http://www.ea.gov.au/biodiversity/threatened/species/index.html] last viewed 19November 2002
42 Bennett, A.F. 1987. Conservation ofmammals within a fragmented forestenvironment: the contributions of insularbiogeography and autecology. Pages 41-52in Nature Conservation: the Role ofRemnants of Native Vegetation. Saunders,D.A., Arnold, G.W., Burbidge, A.A. andHopkins, A.J.M. (editors). Surrey Beattyand Sons: Sydney
43 Maxwell, S., Burbidge, A. and Morris, K.1996. The 1996 Action Plan for AustralianMarsupials and Monotremes. EnvironmentAustralia: Canberra
44 Qld EPA. 1999. State of EnvironmentQueensland 1999. Qld EnvironmentalProtection Agency: Brisbane. Pg. 7.48
45 Sparshott, P. 2000. Woodland birds and theBrigalow Belt woodlands of Queensland,LifeLines, 6(3):26-27.
46 Keast, J. A. 1985. Australia’s forest andwoodland avifauna: an ecological andevolutionary perspective. in Birds ofEucalypt Forests and Woodlands: Ecology,Conservation, Management (Ed by Keast,A., Recher, H. F., Ford, H. and Saunders,D.). Surrey Beatty and Sons: ChippingNorton, NSW. Pp 11-15.
47 Mittermeir, R.A., Goettsch-Mittermeier, C.,and Robles-Gil, P. 1997. Megadiversity:Earth’s Biologically Wealthiest Nations.Conservation International: WashingtonDC.
48 Queensland Environment ProtectionAgency endangered species web site. [URL:http://www.epa.qld.gov.au/environment/plant/endangered/] last viewed 16December 2002.
49 Qld EPA. 1999. State of EnvironmentQueensland 1999. Qld EnvironmentalProtection Agency: Brisbane. Pg. 7.46
50 Environment Australia EnvironmentProtection and Biodiversity ConservationAct web site. [URL:http://www.ea.gov.au/biodiversity/threatened/species/index.html] last viewed 16December 2002.
51 Williams, J., Read, C., Norton, A. Dovers,S., Burgman, M., Proctor, W. andAnderson, H. 2001. Biodiversity, AustraliaState of the Environment Report 2001(Theme Report), CSIRO Publishing onbehalf of the Department of theEnvironment and Heritage: Canberra. Pg.124.
52 Ford, H. A. 1989. Ecology of Birds: AnAustralian Perspective. Surrey Beatty and
Impacts of Land Clearing on Australian Wildlife in Queensland
41
Sons: Chipping Norton, NSW.53 Wilson, B.A., Neldner, V.J. and Accad, A.
2002. The extent and status of remnantvegetation in Queensland and itsimplications for Statewide vegetationmanagement and legislation. TheRangeland Journal, 24(1):6-35. Appendix3, pp.33-35.
54 Wilson, B.A., Neldner, V.J. and Accad, A.2002. The extent and status of remnantvegetation in Queensland and itsimplications for Statewide vegetationmanagement and legislation. TheRangeland Journal, 24(1):6-35. Appendix3, pp.33-35.
55 Ford, H. A. and Bell, H. 1982. Density ofbirds in eucalypt woodland affected tovarying degrees by dieback. Emu 81: 202-208.
56 Ford, H. A., Bridges, L. and Noske, S.1985. Density of birds in eucalyptwoodland near Armidale, north-easternNSW. Corella 9: 97-108.
57 Howe, R. W. 1984. Local dynamics of birdassemblages in small forest habitat islandsin Australia and North America. Ecology65: 1585-1601.
58 Howe, R. W. 1984. Local dynamics of birdassemblages in small forest habitat islandsin Australia and North America. Ecology65: 1585-1601.
59 Recher, H. F. and Holmes, R. T. 1985.Foraging ecology and seasonal pattern ofabundance in a forest avifauna. Pp 79-96in Birds of Eucalypt Forests and Woodlands:Ecology, Conservation, Management (Ed byKeast, A., Recher, H. F., Ford, H. andSaunders, D.). Surrey Beatty and Sons:Chipping Norton, NSW.
60 Recher, H. F. and Holmes, R. T. 1985.Foraging ecology and seasonal pattern ofabundance in a forest avifauna. Pp 79-96in Birds of Eucalypt Forests and Woodlands:Ecology, Conservation, Management (Ed byKeast, A., Recher, H. F., Ford, H. andSaunders, D.). Surrey Beatty and Sons:Chipping Norton, NSW.
61 Catterall, C. P., Driscoll, P. V., Hulsman,K., Muir, D. and Taplin, A. 1993. Birds andtheir Habitats: Status and Conservation inQueensland. QOS, Brisbane.
62 Milledge, D. R. and Recher, H. F. 1985. Acomparison of forest bird communities onthe New South Wales South and Mid-northcoasts. Pp 47-52 in Birds of Eucalypt Forestsand Woodlands: Ecology, Conservation,Management (Ed by Keast, A., Recher, H.F., Ford, H. and Saunders, D.). SurreyBeatty and Sons: Chipping Norton, NSW.
63 Milledge, D. R. and Recher, H. F. 1985. Acomparison of forest bird communities onthe New South Wales South and Mid-northcoasts. Pp 47-52 in Birds of Eucalypt Forestsand Woodlands: Ecology, Conservation,Management (Ed by Keast, A., Recher, H.F., Ford, H. and Saunders, D.). SurreyBeatty and Sons: Chipping Norton, NSW.
64 Shields, J. M., Kavanagh, R. P., Rohan-Jones, W. G. 1985. Forest avifauna of theUpper Hastings River. Pp 55-64 in Birds ofEucalypt Forests and Woodlands: Ecology,Conservation, Management (Ed by Keast,A., Recher, H. F., Ford, H. and Saunders,D.). Surrey Beatty and Sons: ChippingNorton, NSW.
65 Shields, J. M., Kavanagh, R. P., Rohan-Jones, W. G. 1985. Forest avifauna of theUpper Hastings River. Pp 55-64 in Birds ofEucalypt Forests and Woodlands: Ecology,Conservation, Management (Ed by Keast,A., Recher, H. F., Ford, H. and Saunders,D.). Surrey Beatty and Sons: ChippingNorton, NSW.
66 Keast, J. A. 1985. Bird communitystructure in southern forests and northernwoodlands. Pp 97-116 in Birds of EucalyptForests and Woodlands: Ecology,Conservation, Management (Ed by Keast,A., Recher, H. F., Ford, H. and Saunders,D.). Surrey Beatty and Sons: ChippingNorton, NSW.
67 Oliver, D. l., Ley, A. J., Ford, H. A. andWilliams, B. 1999. Habitat of the regentHoneyeater Xanthomyza phrygia and thevalue of the Bundarra-Barraba region forthe conservation of avifauna. PacificConservation Biology 5: 224-239.
68 Gilmore, A. M. 1985. The influence ofvegetation structure on the density ofinsectivorous birds. Pp 21-31. in Birds ofEucalypt Forests and Woodlands: Ecology,Conservation, Management (Ed by Keast,A., Recher, H. F., Ford, H. and Saunders,D.). Surrey Beatty and Sons: ChippingNorton, NSW.
69 Gilmore, A. M. 1985. The influence ofvegetation structure on the density ofinsectivorous birds. Pp 21-31. in Birds ofEucalypt Forests and Woodlands: Ecology,Conservation, Management (Ed by Keast,A., Recher, H. F., Ford, H. and Saunders,D.). Surrey Beatty and Sons: ChippingNorton, NSW.
70 Ford, H. A. and Bell, H. 1982. Density ofbirds in eucalypt woodland affected tovarying degrees by dieback. Emu 81: 202-208.
71 Barrett, G. W. 1995. Woodland BirdAssemblages on the New EnglandTablelands, North-eastern New SouthWales. PhD thesis, University of NewEngland.
72 Shields, J. M., Kavanagh, R. P., Rohan-Jones, W. G. 1985. Forest avifauna of theUpper Hastings River. Pp 55-64 in Birds ofEucalypt Forests and Woodlands: Ecology,Conservation, Management (Ed by Keast,A., Recher, H. F., Ford, H. and Saunders,D.). Surrey Beatty and Sons: ChippingNorton, NSW.
73 Blakers, M., Davies, S. J. J. F. and Reilly, P.N. 1984. The Atlas of Australian Birds.Melbourne University Press: Melbourne.
74 G.W. Barrett, Birds Australia. pers. comm.
42
Impacts of Land Clearing on Australian Wildlife in Queensland
75 Boles, W.E. 1988. The Robins andFlycatchers of Australia. Angus andRobertson: Sydney.
76 Heron, S.J. 1973. Birds of the Orangedistrict, NSW. Emu 73:1-8.
77 Baldwin, M. 1975. Birds of the Inverelldistrict, New South Wales. Emu 75:113-120.
78 Hannah, D. 2000. The response of somereptile and bird groups to tree clearing inCentral Queensland. LifeLines 6(3): 23-25.
79 Garnett, S.T. and Crowley, G.M. 2000. The Action Plan for Australian Birds.Environment Australia: Canberra.
80 Recher, H. 1999. The state of Australia’savifauna: a personal opinion andprediction for the new millennium,Australian Zoologist. 3(1):11-29.
81 Hannah, D. 2000. The response of somereptile and bird groups to tree clearing inCentral Queensland. LifeLines 6(3): 23-25.
82 Ford, H.A., Barrett, G.W., Saunders, D.A.and Recher, H.F. 2001. Why have birds inthe woodlands of southern Australiadeclined? Biological Conservation, 97:71-88.
83 Cooper, C. B. and Walters, J. R. 2002.Experimental evidence of disrupteddispersal causing decline of an Australianpasserine in fragmented habitat.Conservation Biology, 16: 471-478.
84 Brooker, L. C. and Brooker, M. G. 2002.Dispersal and population dynamics of theBlue-breasted Fairy-wren, Maluruspulcherrimus, in fragmented habitat in theWestern Australian Wheatbelt. WildlifeResearch, 29: 2215-233.
85 Grey, M.J., Clarke, M.F. and Loyn, R.H.1998. Influence of the Noisy MinerManorina melanocephala on aviandiversity and abundance in remnant greybox woodland. Pacific ConservationBiology, 4:55-69.
86 Fulton, G. and Ford, H.A. 2002. The PiedCurrawong’s role in avian nest predation:a predator removal experiment. PacificConservation Biology, 7:154-160.
87 Garnett, S.T. and Crowley, G.M. 2000.The Action Plan for Australian Birds.Environment Australia: Canberra.
88 Recher, H.F. and Lim, L. 1990. A review ofcurrent ideas of the extinction,conservation and management ofAustralia’s terrestrial vertebrate fauna.Proc. Ecol. Soc. Aust. 16:287-301. See alsoMacPhee, R. and Flemming, C. nd. CREOList of Mammal Extinctions since AD 1500.Department of Mammalogy, AmericanMuseum of Natural History: New York.Committee for Recently Extinct Organismsdatabase at: http://creo.amnh.org/
89 Cogger, H.G. unpublished data90 Cogger, H.G. and Heatwole, H. 1981. The
Australian reptiles: origins, biogeography,distribution patterns and island evolution.pp. 1331-1373 in A.J. Keast (ed.) EcologicalBiogeography of Australia. Dr W. Junk: The
Hague.91 Cogger, H.G. 2001. Conserving Australia’s
reptiles - are we serious?. Life Lines -Bulletin of the Community BiodiversityNetwork, 7(2):23-26.
92 Mittermeir, R.A., Goettsch-Mittermeier, C.,and Robles-Gil, P. 1997. Megadiversity:Earth’s Biologically Wealthiest Nations.Conservation International: WashingtonDC.
93 Queensland Environment ProtectionAgency endangered species web site. [URL:http://www.epa.qld.gov.au/environment/plant/endangered/] last viewed 16December 2002.
94 Cogger, H.G. unpublished data95 Environment Australia Environment
Protection and Biodiversity ConservationAct web site. [URL:http://www.ea.gov.au/biodiversity/threatened/species/index.html] last viewed 16December 2002.
96 Cogger, H.G. unpublished data97 Ehmann, H.F.W. and Cogger, H.G. 1985.
Australia’s endangered herpetofauna: areview of criteria and policies. pp. 435-447in G.C. Grigg, R. Shine and H.F.W.Ehmann (eds) The Biology of AustralasianFrogs and Reptiles. Surrey Beatty and Sonswith R. Zool. Soc. NSW: Sydney.
98 Cogger, H.G. 2001. Conserving Australia’sreptiles - are we serious?. Life Lines -Bulletin of the Community BiodiversityNetwork, 7(2):23-26.
99 Rawlinson, P.A. 1981. Conservation ofAustralian amphibian and reptilecommunities. In: C.B. Banks and A.A.Martin (eds) Proceedings of the MelbourneHerpetological Symposium, 1980.Zoological Board of Victoria: Melbourne.Pp.127-138.
100 Driscoll, D. 2000. Lizards of Oz go missing.CSIRO media release. 21 September 2000.Ref: 2000/244.
101 Covacevich, J.A., Couper, P.J. andMcDonald, K.R. 1998. Reptile diversity atrisk in the Brigalow Belt, Queensland.Memoirs of the Queensland Museum,42(2):475-486.
102 Baillie, J. and Groombridge, B. (eds.) 1996.1996 IUCN (World Conservation Union)Red List of Threatened Animals. IUCN:Gland: Switzerland.
103 Covacevich, J.A., Couper, P.J. andMcDonald, K.R. 1998. Reptile diversity atrisk in the Brigalow Belt, Queensland.Memoirs of the Queensland Museum,42(2):475-486.
104 Cogger, H.G., Cameron, E.E., Sadlier, R.A.and Eggler, P. 1993. The Action Plan forAustralian Reptiles. Australian NatureConservation Agency: Canberra. 254 pp.
105 Cogger, H.G., Cameron, E.E., Sadlier, R.A.and Eggler, P. 1993. The Action Plan forAustralian Reptiles. Australian NatureConservation Agency: Canberra. 254 pp.
Impacts of Land Clearing on Australian Wildlife in Queensland
43
106 State of the Environment Advisory Council.1996. State of the Environment: Australia1996. An independent report presented tothe Commonwealth Minister for theEnvironment by the State of theEnvironment Advisory Council. CSIROPublishing: Melbourne.
107 Hnatiuk R.J. 1990 Census of Australianvascular plants. Australian Flora andFauna Series Number 11. Canberra,Australian Government Publishing Service.
108 Crisp M.D., West J.G. and Linder H.P. 1999Biogeography of the terrestrial flora inAustralia. In Flora of Australia, volume 1,2nd edition. Australian Biological ResourcesStudy, Canberra pp. 321-368.
109 Hnatiuk R.J. 1990 Census of Australianvascular plants. Australian Flora andFauna Series Number 11. Canberra,Australian Government Publishing Service.
110 Environmental Protection Authority. 1999.State of the environment Queensland 1999/ Environmental Protection Authority.Brisbane, 1999.
111 Crisp M.D., West J.G. and Linder H.P.1999. Biogeography of the terrestrial florain Australia. In Flora of Australia, volume1, 2nd edition. Australian BiologicalResources Study, Canberra pp. 321-368.
112 Wilson, B. A., Neldner V. J., Accad, A.2002. The extent and status of remnantvegetation in Queensland and itsimplications for statewide vegetationmanagement and legislation. RangelandJournal 24(1):6-36.
113 Wilson, B. A., Neldner V. J., Accad, A.2002. The extent and status of remnantvegetation in Queensland and itsimplications for statewide vegetationmanagement and legislation. RangelandJournal 24(1):6-36.
114 Mittermeier, R.A., Fonseca, G.A.B. da,Rylands, A.B. and Mittermeier, C.G. 1997.Brazil. In: Megadiversity: Earth’sBiologically Wealthiest Nations, R.A.Mittermeier, P. Robles Gill and C.G.Mittermeier (eds.), CEMEX, S. A., Mexico.
115 Queensland Environment ProtectionAgency endangered species web site. [URL:http://www.epa.qld.gov.au/environment/plant/endangered/] last viewed 16December 2002.
116 Henderson R.J.F. 2002. Names anddistribution of Queensland Plants, Algaeand Lichens. Queensland EnvironmentalProtection Agency, Brisbane.
117 Environment Australia EnvironmentProtection and Biodiversity ConservationAct web site. [URL:http://www.ea.gov.au/biodiversity/threatened/species/index.html] last viewed 16December 2002.
118 Hnatiuk R.J. 1990 Census of Australianvascular plants. Australian Flora andFauna Series Number 11. Canberra,Australian Government Publishing Service.
119 Crisp M.D., West J.G. and Linder H.P. 1999Biogeography of the terrestrial flora inAustralia. In Flora of Australia, volume 1,2nd edition. Australian Biological ResourcesStudy, Canberra pp. 321-368.
120 Wilson, B. A., Neldner V. J., Accad, A.(2002) The extent and status of remnantvegetation in Queensland and itsimplications for statewide vegetationmanagement and legislation. RangelandJournal 24(1):6-36.
121 McAlpine, C. A.; Fensham, R. J., Temple-Smith D. E. 2002. Biodiversity conservationand vegetation clearing in Queensland.Rangeland Journal 24(1):36-55.
122 Wilson, B. A., Neldner V. J., Accad, A.2002. The extent and status of remnantvegetation in Queensland and itsimplications for statewide vegetationmanagement and legislation. RangelandJournal 24(1):6-36.
123 Wilson, B. A., Neldner V. J., Accad, A.2002. The extent and status of remnantvegetation in Queensland and itsimplications for statewide vegetationmanagement and legislation. RangelandJournal 24(1):6-36.
124 Queensland Herbarium. 2002. TreeDensities of Queenslands’ Broad VegetationGroups. Unpublished Report.
125 Wilson, B. A., Neldner V. J., Accad, A.2002. The extent and status of remnantvegetation in Queensland and itsimplications for statewide vegetationmanagement and legislation. RangelandJournal 24(1):6-36.
126 Queensland Herbarium. 2002. TreeDensities of Queenslands’ Broad VegetationGroups. Unpublished Report.
127 Queensland Herbarium. 2002. TreeDensities of Queenslands’ Broad VegetationGroups. Unpublished Report.
128 Accad, A., Neldner V. J., Wilson, B. A, andNiehus, R. E. (2001) Remnant vegetation inQueensland: Analysis of Pre-clearing,Remnant 1997-1999 Regional EcosystemInformation. Queensland Herbarium,Environmental Protection Agency.
129 Sattler, P.S., Williams, R.D. (eds) (1999)The Conservation Status of Queensland’sBioregional Ecosystems. Published byEnvironmental Protection Agency,Brisbane.
130 Wilson, B. A., Neldner V. J., Accad, A.2002. The extent and status of remnantvegetation in Queensland and itsimplications for statewide vegetationmanagement and legislation. RangelandJournal 24(1):6-36.
131 Wilson, B. A., Neldner V. J., Accad, A..2002. The extent and status of remnantvegetation in Queensland and itsimplications for statewide vegetationmanagement and legislation. RangelandJournal 24(1):6-36.
132 Accad, A., Neldner V. J., Wilson, B. A, and
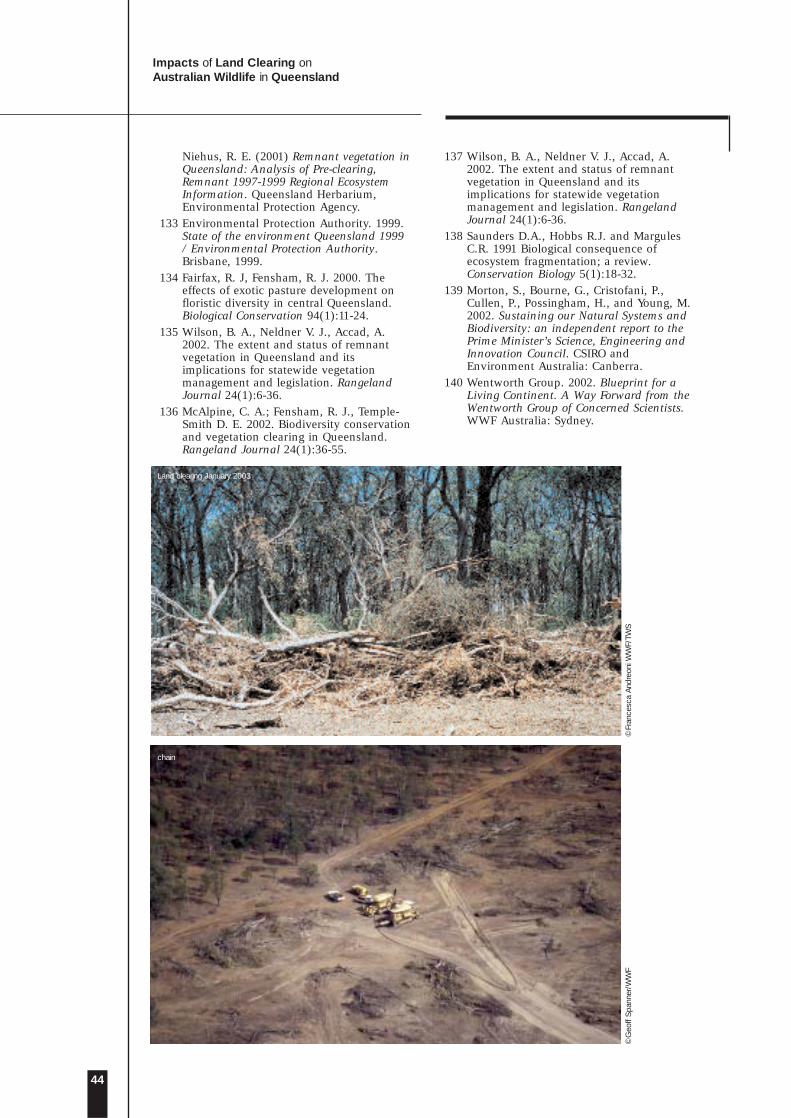
44
Impacts of Land Clearing on Australian Wildlife in Queensland
Niehus, R. E. (2001) Remnant vegetation inQueensland: Analysis of Pre-clearing,Remnant 1997-1999 Regional EcosystemInformation. Queensland Herbarium,Environmental Protection Agency.
133 Environmental Protection Authority. 1999.State of the environment Queensland 1999/ Environmental Protection Authority.Brisbane, 1999.
134 Fairfax, R. J, Fensham, R. J. 2000. Theeffects of exotic pasture development onfloristic diversity in central Queensland.Biological Conservation 94(1):11-24.
135 Wilson, B. A., Neldner V. J., Accad, A.2002. The extent and status of remnantvegetation in Queensland and itsimplications for statewide vegetationmanagement and legislation. RangelandJournal 24(1):6-36.
136 McAlpine, C. A.; Fensham, R. J., Temple-Smith D. E. 2002. Biodiversity conservationand vegetation clearing in Queensland.Rangeland Journal 24(1):36-55.
137 Wilson, B. A., Neldner V. J., Accad, A.2002. The extent and status of remnantvegetation in Queensland and itsimplications for statewide vegetationmanagement and legislation. RangelandJournal 24(1):6-36.
138 Saunders D.A., Hobbs R.J. and MargulesC.R. 1991 Biological consequence ofecosystem fragmentation; a review.Conservation Biology 5(1):18-32.
139 Morton, S., Bourne, G., Cristofani, P.,Cullen, P., Possingham, H., and Young, M.2002. Sustaining our Natural Systems andBiodiversity: an independent report to thePrime Minister’s Science, Engineering andInnovation Council. CSIRO andEnvironment Australia: Canberra.
140 Wentworth Group. 2002. Blueprint for aLiving Continent. A Way Forward from theWentworth Group of Concerned Scientists.WWF Australia: Sydney.
©Fr
ance
sca
And
reon
i WW
F/TW
S
Land clearing January 2003
©G
eoff
Spa
nner
/WW
F
chain
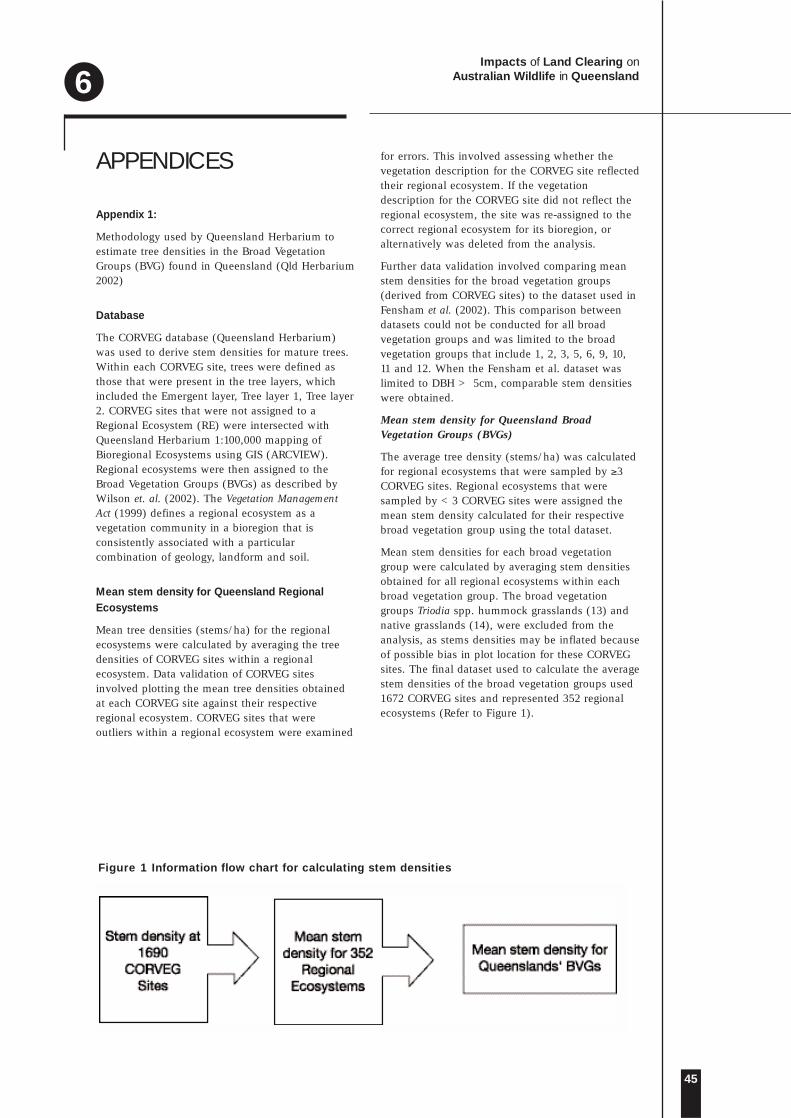
Impacts of Land Clearing on Australian Wildlife in Queensland
45
6
Figure 1 Information flow chart for calculating stem densities
APPENDICES
Appendix 1:
Methodology used by Queensland Herbarium toestimate tree densities in the Broad VegetationGroups (BVG) found in Queensland (Qld Herbarium2002)
Database
The CORVEG database (Queensland Herbarium)was used to derive stem densities for mature trees.Within each CORVEG site, trees were defined asthose that were present in the tree layers, whichincluded the Emergent layer, Tree layer 1, Tree layer2. CORVEG sites that were not assigned to aRegional Ecosystem (RE) were intersected withQueensland Herbarium 1:100,000 mapping ofBioregional Ecosystems using GIS (ARCVIEW).Regional ecosystems were then assigned to theBroad Vegetation Groups (BVGs) as described byWilson et. al. (2002). The Vegetation ManagementAct (1999) defines a regional ecosystem as avegetation community in a bioregion that isconsistently associated with a particularcombination of geology, landform and soil.
Mean stem density for Queensland RegionalEcosystems
Mean tree densities (stems/ha) for the regionalecosystems were calculated by averaging the treedensities of CORVEG sites within a regionalecosystem. Data validation of CORVEG sitesinvolved plotting the mean tree densities obtainedat each CORVEG site against their respectiveregional ecosystem. CORVEG sites that wereoutliers within a regional ecosystem were examined
for errors. This involved assessing whether thevegetation description for the CORVEG site reflectedtheir regional ecosystem. If the vegetationdescription for the CORVEG site did not reflect theregional ecosystem, the site was re-assigned to thecorrect regional ecosystem for its bioregion, oralternatively was deleted from the analysis.
Further data validation involved comparing meanstem densities for the broad vegetation groups(derived from CORVEG sites) to the dataset used inFensham et al. (2002). This comparison betweendatasets could not be conducted for all broadvegetation groups and was limited to the broadvegetation groups that include 1, 2, 3, 5, 6, 9, 10,11 and 12. When the Fensham et al. dataset waslimited to DBH > 5cm, comparable stem densitieswere obtained.
Mean stem density for Queensland BroadVegetation Groups (BVGs)
The average tree density (stems/ha) was calculatedfor regional ecosystems that were sampled by ≥3CORVEG sites. Regional ecosystems that weresampled by <3 CORVEG sites were assigned themean stem density calculated for their respectivebroad vegetation group using the total dataset.
Mean stem densities for each broad vegetationgroup were calculated by averaging stem densitiesobtained for all regional ecosystems within eachbroad vegetation group. The broad vegetationgroups Triodia spp. hummock grasslands (13) andnative grasslands (14), were excluded from theanalysis, as stems densities may be inflated becauseof possible bias in plot location for these CORVEGsites. The final dataset used to calculate the averagestem densities of the broad vegetation groups used1672 CORVEG sites and represented 352 regionalecosystems (Refer to Figure 1).

46
Impacts of Land Clearing on Australian Wildlife in Queensland
Broad Vegetation Group Mean trees/ ha SE n1. Eucalypt woodlands on ranges. 397 30 642. Eucalypt open forest. 457 51 273. Eucalyptus tetrodonta woodlands / open forest. 466 39 264. Eucalyptus similis and E. whitei woodlands. 231 60 85. Eucalyptus populnea and E. melanophloia woodlands. 325 33 266. Mixed eucalypt woodlands 421 39 357. Eucalyptus microneura and other box woodlands. 340 N/A 18. Eucalyptus leucophloia low open woodlands 235 46 59. Riparian eucalypt woodland. 303 38 1810. Acacia spp. woodlands and shrublands. 1022 73 511. Acacia harpophylla or A. cambagei open forests & woodlands. 590 79 3012. Acacia aneura woodlands and shrublands. 523 104 315. Rainforests and vine thickets. 959 106 3716. Wetlands. 798 118 2317. Mangroves and strand communities. 916 135 2018. Heath or mixed shrublands. 600* 91 24
(From Qld Herbarium 2002)
* May include shrub species in tree strata. n represents the number of regional ecosystems containedwithin the broad vegetation groups.
Standard error (SE) calculated for regional ecosystems contained with broad vegetation groups.
An estimate of pre-clearing and remnant trees(1999) present in Queensland
To calculate an estimate of pre-clearing treescontained in the regional ecosystems sampled by ≥3CORVEG sites, the mean stem density for theregional ecosystem was multiplied by the pre-clearing area. Regional ecosystems that were notwell represented in the CORVEG database (i.e. <3CORVEG sites) were assigned the average stemdensity for their specific broad vegetation group,and this density was multiplied by the pre-clearingarea. To estimate the number of remnant treespresent in 1999, stem densities for the regionalecosystems were multiplied by the 1999 regionalecosystem area.
Appendix 2: Mean density of trees for sixteen of the Broad Vegetation Groups (BVG)found in Queensland
References
Wilson, B. A., Neldner V. J., Accad, A. 2002 Theextent and status of remnant vegetation inQueensland and its implications for statewidevegetation management and legislation. RangelandJournal 24(1): 6-36.
Fensham, R. J., Fairfax, R. J., Holman J. E. 2002Quantitative assessment of vegetation structuralattributes from aerial photography. InternationalJournal of Remote Sensing 23: 2293-2317.
©G
eoff
Spa
nner
/WW
F
Land clearing

Impacts of Land Clearing on Australian Wildlife in Queensland
47
Botanical name Common Names
Acacia aneura mulgaAcacia argyrodendron blackwoodAcacia cambagei gidgeeAcacia catenulata bendeeAcacia georginea Georgina gidgeeAcacia harpophylla brigalowAcacia melvillei Melville’s wattleAcacia shirleyi lancewoodAcacia stowardii bastard mulgaAngophora leiocarpa apple, rusty gum, smooth-barked appleAstrebla species Mitchell grassAvicennia marina grey mangroveCallitris species cypress pineCasuarina cristata belahCasuarina equisetifolia beach casuarina, coast she-oak, beach she-oakCeriops tagal yellow leaved spurred mangroveCorymbia citriodora lemon-scented gum, spotted gumCorymbia clarksoniana Clarkson’s bloodwoodCorymbia dallachiana Dallachy’s gumCorymbia erythrophloia gum-topped bloodwood, variable-barked bloodwoodCorymbia hylandii Hyland’s bloodwoodCorymbia intermedia pink bloodwood, red bloodwoodCorymbia leichhardtii rustyjacket, yellowjacketCorymbia nesophila Melville Island bloodwoodCorymbia papuana ghost gumCorymbia plena bloodwoodCorymbia polycarpa long-fruited bloodwoodCorymbia setosa rough-leaved bloodwoodCorymbia stockerii blotchy bloodwoodCorymbia terminalis desert bloodwood, western bloodwoodCorymbia tessellaris carbeen, Moreton Bay ashCorymbia trachyphloia brown bloodwoodErythrophleum chlorostachys Cooktown ironwoodEucalyptus acmenoides yellow stringybark, white mahoganyEucalyptus brownii Reid River boxEucalyptus camaldulensis river red gumEucalyptus cambageana Dawson gum, blackbutt, coowarra boxEucalyptus chlorophylla boxEucalyptus cloeziana Gympie messmate, yellow messmateEucalyptus conica fuzzy boxEucalyptus coolibah coolibahEucalyptus crebra narrow-leaved ironbarkEucalyptus cullenii Cullen’s ironbarkEucalyptus decorticans gum-topped ironbarkEucalyptus dura gum-topped ironbarkEucalyptus eugenioides thin-leaved stringybark, white stringybarkEucalyptus exserta Queensland peppermint, bendoEucalyptus fibrosa broad-leaved ironbarkEucalyptus grandis flooded gum, rose gumEucalyptus laevopinea silvertop stringybarkEucalyptus largiflorens black box
Appendix 3: Botanical name - common name list
Common names vary greatly within interest groups, eg. standard trade names are used by foresters, whiledifferent common names may be used by naturalists. Common names may vary in different localities, andany one plant may have a number of common names. The species included are mainly trees and shrubs thatdominate and characterise the various broad vegetation groups. Derived from Bean et al. (1998) and Brookerand Kleinig (1994).

48
Impacts of Land Clearing on Australian Wildlife in Queensland
Eucalyptus leucophloia snappy gumEucalyptus leucophylla Cloncurry boxEucalyptus longirostrata grey gumEucalyptus major grey gum, mountain grey gumEucalyptus melanoleuca Yarraman ironbarkEucalyptus melanophloia silver-leaved ironbark, silver ironbarkEucalyptus melliodora yellow box, yellow jacketEucalyptus microcarpa grey boxEucalyptus microcorys tallow woodEucalyptus microneura Gilbert River boxEucalyptus microtheca coolibahEucalyptus miniata Darwin woollybuttEucalyptus moluccana gum-topped box, grey boxEucalyptus montivaga Queensland ashEucalyptus normantonensis Normanton boxEucalyptus ochrophloia YapunyahEucalyptus orgadophila mountain coolibahEucalyptus persistens boxEucalyptus phoenicea scarlet gumEucalyptus pilularis blackbuttEucalyptus platyphylla poplar gumEucalyptus populnea poplar box, bimble boxEucalyptus propinqua grey gum, small-fruited grey gumEucalyptus pruinosa silver boxEucalyptus racemosa scribbly gumEucalyptus resinifera red mahoganyEucalyptus saligna Sydney blue gumEucalyptus shirleyii silver-leaved ironbarkEucalyptus similis Queensland yellowjacketEucalyptus tectifica Darwin boxEucalyptus tereticornis blue gum, forest red gumEucalyptus tetrodonta Darwin stringybark, messmateEucalyptus thozetiana mountain yapunyahEucalyptus whitei White’s ironbarkImperata cylindrica blady grassLysiphyllum cunninghamii bauhiniaMelaleuca argentea silver-leaved paperbarkMelaleuca dealbata swamp tea-tree, paperbarkMelaleuca fluviatilis paperbarkMelaleuca leucadendra broad-leaved tea-treeMelaleuca quinquenervia swamp paperbark, paper-barked tea-treeMelaleuca viridiflora broad-leaved ti-tree, broad-leaved paperbarkMuehlenbeckia florulenta lignumSporobolus virginicus saltwater couchTriodia species spinifexZygochloa paradoxa sandhill cane grass
REFERENCES• Bean, A.R., Sparshott, K.M., McDonald,
W.J.F. and Neldner, V.J. (eds.) 1998. Forestecosys mapping and analysis of south-eastern Queensland biogeographic region.A. Vegetation survey and mapping. Reportfor Queensland CRA/RFA steeringcommittee. Queensland Herbarium andEnvironment Australia: Brisbane.
• Brooker, M.I.H. and Kleinig, D.A. 1994.Field guide to eucalypts. Volume 3.Northern Australia. Inkata Press: Sydney.
Dry woodland of Coolbah Eucalyptus
©W
ayne
Law
ler/
AU
SC
AP
E