impact of yeast nutrient supplementation strategies on
TRANSCRIPT

Impact of Yeast Nutrient Supplementation Strategies on Hydrogen Sulfide
Production during Cider Fermentation
Amy Nicole Moore
Thesis submitted to the faculty of the Virginia Polytechnic Institute and State
University in partial fulfillment of the requirements for the degree of
Master of Science in Life Sciences
In
Food Science and Technology
Amanda C. Stewart, Committee Chair
Jacob Lahne
Elizabeth Chang
Monday, April 13th, 2020
Blacksburg, Virginia
Key words: hard cider, hydrogen sulfide, yeast nutrients, sensory descriptors

Impact of Yeast Nutrient Supplementation Strategies on Hydrogen Sulfide
Production during Cider Fermentation
Amy Moore
ACADEMIC ABSTRACT
Hydrogen Sulfide (H2S), is a negative off aroma produced during yeast fermentation and
is common in cider and leads to consumer rejection. H2S has a very low odor detection threshold
(ODT) and is often described as “rotten egg”. H2S is produced when juice is deficient in yeast
nutrients, such as amino acids and yeast assimilable nitrogen (YAN), which is a common
problem in apples since they naturally low in nutrients. The purpose of this research was to
investigate the effects of yeast nutrient addition to cider fermentation by adding four different
nitrogen-rich supplements and evaluating the effects on H2S production, fermentation kinetics,
and aroma quality during cider. Three yeast strains (M2, EC1118 and ICV OKAY), four yeast
nutrients (Fermaid K, Fermaid O, Experimental Nutrient, and DAP) and single addition versus
split addition of nutrient were tested. For single addition, all nutrient was added pre-fermentation
and for split additions, the first addition was pre-fermentation and the second at one-third total
soluble solid (TTS) depletion as measured by °Brix. Sensory evaluation was conducted on
selected treatments. The greatest H2S was produced by M2 yeast strain (525 .63 ± 53.31 µg mL-
1) while the least H2S on average was produced by EC1118 (118.26 ± 26.33 µg mL-1) and ICV
OKAY produced an intermediate amount of H2S (209.26 ± 31.63 µg mL-1). Significant
differences were observed between treatments and total H2S production within yeast strains.
Yeast strain had the largest effect on H2S production. The second largest effect was yeast
nutrient type. Classical text analysis of descriptions of cider aroma were evaluated and 25
attributes were chosen to describe the ciders. Check- all-that-apply (CATA), a rapid sensory

technique that askes panelists, revealed that there was no clear pattern between variables
tested. This work demonstrates that yeast nutrient type and yeast strain affect H2S production
during cider fermentation. These findings provide a basis for improving the effectiveness of
strategies used to prevent H2S production in cider fermentation.

Impact of Yeast Nutrient Supplementation Strategies on Hydrogen Sulfide
Production during Cider Fermentation
Amy Moore
GENERAL AUDIENCE ABSTRACT
Cider, an alcoholic beverage made from fermenting apple juice, has grown in popularity
and production in the United States in recent years. With increased in production and sales there
is increase demand for high quality cider, but cider is prone to sensory faults. A common fault in
cider aroma includes negative off aromas know as volatile sulfur compounds (VSCs). These
aromas are often described as “rotten eggs”, or “cabbage” and lead to consumer rejection of the
product. One of the most recognized VSCs is hydrogen sulfide (H2S) which has a characteristic
smell of “rotten eggs”. These negative off aromas are thought to be produced during yeast
fermentation under nutrient lacking conditions. Apples, depending on cultivar, ripeness, and
other factors, naturally lack yeast assimilable nitrogen, vitamins, amino acids, and other nutrients
needed for a successful yeast fermentation leading to off aromas. Yeast nutrients can be added to
apple juice to increase nutrient availability, but little research has been focused on nutrient
addition and timing of additions to prevent H2S production in cider. Most research focused on
H2S production has been studied in wine must or grape juice. This knowledge may be limited
when applying practices to apple juice due to differences in juice chemistry. Providing cider
makers with specific scientific strategies to prevent off aromas, such as H2S, is important to the
continued growth of the cider industry. This research is focused on exploring aroma quality and
H2S prevention strategies in cider by evaluating how yeast nutrient addition via four exogenous
nitrogen rich yeast nutrient and timing of yeast nutrient addition affect H2S production,
fermentation kinetics, and consumer perception of aroma in cider fermentation.

v
Acknowledgments
First and foremost, I would like to thank my graduate advisor Dr. Amanda Stewart for all
her support and knowledge, not only in my graduate career but also as an undergraduate. Her
help and guidance made working on this degree a wonderful experience. Secondly, I would like
to thank my committee members Dr. Jacob Lahne and Dr. Elizabeth Chang for their guidance,
enthusiasm, expertise, and invaluable input as I worked on this project. Thirdly, I would like to
thank all the other student in this department who have helped me along on the way. A thank you
to Paulette Cairns who always offered guidance and help whenever she could and a special thank
you to Dr. Lahne’s lab group. I wanted to specifically thank Leah Hamilton and Katherine
Phetxumphou for their patience’s with R coding and dedication to the sensory lab. A special
thank you to Grace Earnheart for all her hard work in the lab running chemical analysis. It was a
great pleasure to work with Grace both in and out of lab. I would like to thank Brian Wiersema
for his guidance in the pilot plant and access to ordering supplies. I would also like to thank Ann
Sandbrook with her endless advice on amino acid analysis and troubleshooting. Finally, I would
like to thank my friends and family for all their love and support over the past two years.
Especially to Alex Haring for his constant love and understanding. Without friends, family and
colleagues, this journey would have been less enjoyable and fulfilling.

vi
Table of Contents
List of Tables ............................................................................................................................ viii
List of Figures ............................................................................................................................ ix
Chapter 1: Introduction ............................................................................................................... 1
1.1 Long Term Objective ....................................................................................................... 2
1.2 Overall Objective and Hypothesis.................................................................................... 2
1.3 Specific Objectives and Hypothesis ................................................................................. 3
Chapter 2: Literature Review...................................................................................................... 4
2.1 Cider Definition and Production in the United States ...................................................... 4
2.1.1 Cider Production ....................................................................................................... 5
2.2 Starting Material for Cider Fermentation ......................................................................... 6
2.2.1 Pre-fermentation Additions and Treatments ........................................................... 12
2.2.2 Negative Sensory Attributes of Hydrogen Sulfide ................................................. 14
2.2.3 Hydrogen Sulfide Quantification ............................................................................ 16
2.3 Yeast Strain and Hydrogen Sulfide ................................................................................ 18
2.4 Yeast Assimilable Nitrogen, Yeast Nutrients and Hydrogen Sulfide ............................ 22
2.4.1 Yeast Assimilable Nitrogen and Nitrogen Utilization ............................................ 22
2.4.2 Addition of Yeast Nutrients and Timing of Nutrient Addition ............................... 24
2.4.3 Vitamin Deficiencies and Amino Acid Deficiencies .............................................. 30
2.5 Cider Sensory Analysis .................................................................................................. 31
2.6 Conclusion ...................................................................................................................... 36
Chapter 3: Complex Yeast Nutrient Addition and Timing of Additions Influence on Hydrogen
Sulfide Production and Aroma in Cider Fermentations ................................................................ 51
3.1 Introduction .................................................................................................................... 51
3.2 Experimental .................................................................................................................. 54
3.2.1 Apple Juice.............................................................................................................. 54
3.2.2 Microscale Fermentations ....................................................................................... 55
3.2.3 Cider Chemistry and Nutrient Evaluation............................................................... 57
3.2.4 Statistical analysis ................................................................................................... 58
3.2.5 Pilot Scale Fermentation for Sensory Evaluation ................................................... 58
3.2.6 Sensory Evaluation ................................................................................................. 59
3.2.7 Samples ................................................................................................................... 59

vii
3.2.8 Panelists .................................................................................................................. 60
3.2.9 Lexicon Generation ................................................................................................. 60
3.2.10 Check-all-that-apply ............................................................................................... 60
3.2.11 Sensory Statistical Analysis .................................................................................... 61
3.3 Results and Discussion ................................................................................................... 61
3.3.1 Starting Juice Chemistry and Yeast Nutrient Evaluation ....................................... 61
3.3.2 Microscale Cider Chemistry ................................................................................... 65
3.3.3 Total H2S Production .............................................................................................. 65
3.3.4 Results for Total Fermentation Duration ................................................................ 71
3.3.5 Aroma Results ......................................................................................................... 73
3.4 Conclusion ...................................................................................................................... 77
3.5 References ...................................................................................................................... 79
3.6 Supplemental Tables and Figures .................................................................................. 92
Chapter 4: Conclusions and Future Work ................................................................................ 97
4.1 H2S Production and Fermentation Kinetics in Microscale Fermentations ..................... 97
4.1.1 Key Findings ........................................................................................................... 97
4.1.2 Limitations .............................................................................................................. 97
4.1.3 Future Work ............................................................................................................ 98
4.2 Sensory Evaluation of H2S and Off aromas ................................................................... 99
4.2.1 Key Findings ........................................................................................................... 99
4.2.2 Limitations ............................................................................................................ 100
4.2.3 Future Work .......................................................................................................... 100
4.3 Overall Conclusion ....................................................................................................... 100
Appendices 102
Appendix A ............................................................................................................................. 102
Appendix B ............................................................................................................................. 104
Appendix C ............................................................................................................................. 106
References 38

viii
List of Tables Table 1: Classification of Cider Apples Based on Tannin and Acid Content
Table 2: Volatile Sulfur Compounds Found in Wine
Table 3: Amino Acids Additions and Reported Results
Table 4: Fermentation Problems Reported when Vitamin is Deficient in Matrix
Table 5. Primary Juice Chemistry of Reconstituted Apple Juice used for all Microscale
Fermentations and Scale Up Fermentations
Table 6. Yeast Nutrient Composition of all four yeast nutrient in AJ
Table 7: Contingency Table from Check-All-That-Apply (CATA) Task of Selected Cider
Treatments with Variations of Yeast Strain, Yeast Nutrient and Timing of Yeast Nutrient
Table 8: Cider Chemistry Parameters
Table 9. Completed Cider Total H2S Production and Total Duration of Fermentation

ix
List of Figures Figure 1: Total H2S Production Grouped by Different Yeast Strains used for Fermentation.
Figure 2: Total H2S Produced (µg L-1) Grouped by Type of Yeast Nutrient Used.
Figure 3: Total H2S Produced (µg L-1) Grouped by Timing of Yeast Nutrient.
Figure 4: Partition tree for total H2S (µg L-1) production.
Figure 5: Total Fermentation Duration (hrs).
Figure 6: Partition tree for total fermentation duration (hrs) production.
Figure7: Selected sensory ciders were evaluated for aroma overall liking
Figure 8: CA Factor Map for Ciders Evaluated by CATA Task.
Figure 9: Total H2S Production across all Cider Treatments.
Figure 10: Interaction Plot for Cider Chemical Analysis.
Figure 11: Interaction plots for total H2S production (µg L-1 H2S) (Graph A) and total
fermentation duration (hrs) (Graph B).

1
Chapter 1: Introduction
Cider, a fermented beverage made from apple juice, is a popular drink around the world.
Cider is rapidly growing in popularity in the United States and is a well-established alcoholic
beverage in Europe (A. Lea & Drilleau, 2003). In the United States in 2018, there were 877
operating cider producers located in 49 states (Lombardo, 2018). With the increased
consumption of cider, there is also an increase in demand for high quality cider. In addition to
the marked effect of Prohibition in the United States, past decreases in cider sales volume have
been attributed to poor product quality, with the vast majority of ciders being considered
“scrumpy” and a source of cheap alcohol for poor farmers (Bamforth, 2005; A. Lea & Drilleau,
2003). Poor quality ciders are often a result of off flavors and aromas. The most commonly
known and widely recognized off aromas are hydrogen sulfide (H2S) and other volatile sulfur
compounds (VSCs) such as dimethyl sulfide, furfurylthiol, and methanethiol (Marchand, Gilles
de, & Bertrand, 2000). These VSCs are typically described as “rotten eggs”, “cabbage” or
“reductive” aromas.
The process of cider making is closely related to white wine making, but there are key
differences in fruit chemistry between apples and grapes, making it necessary to research apples
and cider processing independently. Unlike grapes, apples lack key nutrients needed for yeast
metabolism (A. Lea & Drilleau, 2003). Apple chemical composition differs from grapes in
carbohydrates, organic acids, amino acids, minerals, polyphenols and yeast assimilable nitrogen
(ammonium ions and primary amino nitrogen), all of which can effect fermentation outcomes
(Downing, 1989; Guyot, Marnet, Sanoner, & Drilleau, 2003). The chemical composition of both
apples and grapes are variable and depend on many factors including cultivar, ripeness, climate,
and agricultural practices. Nonetheless, the differences between the category apple and grape are
2
more significant than differences observed within each category (Downing, 1989; Guyot et al.,
2003). The primary organic acid found in apples is malic acid while the primary acid in grapes is
tartaric acid (Lamikanra, Inyang, & Leong, 1995; Wu et al., 2007). They also differ in polyphenol
composition. Apples have six predominant classes of polyphenols which include flavanols,
procyanidins, hydroxycinnamic acids, dihydrochalcones, flavonols, and anthocyanins while in
grapes the five main classes of polyphenols are anthocyanins, flavanols, flavonols, stilbenes, and
phenolic acids (Verdu et al., 2014; Xia, Deng, Guo, & Li, 2010). Preliminary data also suggests
that grapes have different amino acid compositions and yeast assimilable nitrogen (YAN)
concentrations than apples (S. Ma et al., 2018; Spayd & Andersen-Bagge, 1996). All of these
factors may influence fermentation outcomes (Lamikanra et al., 1995; A. Lea & Drilleau, 2003;
Wu et al., 2007; Xia et al., 2010). Wine fermentation (i.e. fermentation of grape juice or must) has
been the subject of decades of research, but limited research reports on fermentation of apple juice
and cider quality exist. With the increase in cider popularity and production, it is important to have
research focused on apple juice fermentation as opposed to extrapolating research knowledge from
grape must, considering the differences in juice chemistry and the potential of these differences to
affect fermentation outcomes.
1.1 Long Term Objective
The long term objective of this research project is to develop and test yeast nutrition
strategies for cider fermentation, focusing on identifying nutrient source and timing protocols for
specific combinations of juice or concentrate matrices and yeast strains.
1.2 Overall Objective and Hypothesis
The overall objective of this project is to examine and understand the relationship between
yeast strain (high vs. medium vs. low hydrogen sulfide producing strains), nitrogen

3
supplementation via complex yeast nutrient addition, and timing of nitrogen supplementation
additions on hydrogen sulfide production (H2S) during cider fermentation in a juice-from-
concentrate matrix.
1.3 Specific Objectives and Hypothesis
Specific Objective 1:
Determine how pre-fermentation addition of a yeast nutrient (Fermaid K, Fermaid C,
Fermaid O, or Diammonium Phosphate) influence fermentation duration and total hydrogen
sulfide production by three yeast strains (M2, EC1118, ICV OKAY)
Working Hypothesis 1:
Addition of a yeast nutrient (Fermaid K, Fermaid C, Fermaid O, or Diammonium
Phosphate) pre-fermentation will decrease fermentation duration and decrease total
hydrogen sulfide production, and this effect will vary depending on yeast strain (M2,
EC1118 and ICV OKAY).
Specific Objective 2:
Determine whether adding a yeast nutrient (Fermaid K, Fermaid C, Fermaid O, or
Diammonium Phosphate) in two steps (rather than adding all nutrients at one time, pre-
fermentation) influences fermentation duration and total hydrogen sulfide production based
on three different yeast strains (M2, EC1118 and ICV OKAY).
Working Hypothesis 2:

4
Two step nutrient addition for a specific yeast nutrient (Fermaid K, Fermaid C, Fermaid O,
or Diammonium Phosphate) will decrease fermentation duration and decrease overall total
H2S produced depending on yeast strain (M2, EC1118, ICV OKAY).
Chapter 2: Literature Review
2.1 Cider Definition and Production in the United States
In the United States, the term “cider” may refer to several different beverages made from
apple juice. In the United States, the term “cider” may be used to refer to unfiltered, unpasteurized
non-alcoholic apple juice (i.e. “sweet cider”) whereas the term “hard cider” refers to a fermented
apple product. In Europe, the fermented product is simply referred to as “cider” (A. Lea & Drilleau,
2003). In this document, the term “cider” will be used to refer to the fermented, alcoholic beverage
made from apples.
The popularity of cider in the United States has increased over the past decade. The number
of cider makers drastically increased from 400 in 2014 to a total of 877 cider producers in 2018
(Lombardo, 2018). In the United States in 2018, cider profits reached $23.5 million with an annual
growth rate of 19.8% between 2013 and 2018. The cider category in the United States is predicted
to continue to grow at an Annual Growth Rate of 2.0% between years 2018 and 2023. There are
now cider producers in almost every state in the U.S, with the largest numbers of producers found
in New York followed by Michigan and California (Lombardo, 2018). With the continuing
increase in popularity in the cider category, additional research focused on cider production
methods and the chemical and sensory characteristics of cider is needed.

5
2.1.1 Cider Production
Cider, like wine, can be produced using a wide variety of techniques and practices chosen
by the cider maker to produce the desired finished product. There is high variability between
producers that depends on agriculture practices, apple cultivars, juice chemistry, fermentation
practices, and multiple other factors, some of which will be discussed further in this review.
Several, processing steps are needed for cider production: harvesting apples, milling,
pressing, and fermentation. Apples are often harvested at peak ripeness to ensure high sugar
content in the fruit. Peak ripeness can vary between cultivar, region and producer but some have
suggested that dessert or eating apples should be picked when 9.0%-12.0%_total soluble solids
(TSS) (Blanpied & Kenneth, 1992; Mohebi, Babalar, Askari, & Talaei, 2017). Apples can be
harvested in different manners depending on the size of the cider producer or apple orchard. Some
large producers may use mechanical harvesters such as limb shakers and air blasters, while smaller
producers hand pick apples (P. Li, Lee, & Hsu, 2011). A common harvesting practice for certain
cultivars in Europe is to allow apples to fall off the tree and be harvested from the ground, instead
of being picked of the branches to ensure that the fruit is ripe (A. Lea & Drilleau, 2003). However
this practice in the United States may not be legal under the new Food Safety Modernization Act
due to food safety concerns (Ewing & Rasco, 2019).
After harvest, fruit can be stored for several weeks in refrigeration to allow more
unfermentable sugars (starch) to be converted to fermentable sugars. Postharvest storage can be
used as method to potentially increase polyphenols for certain cultivars (Ewing, Peck, Ma, Neilson,
& Stewart, 2019; A. Lea & Drilleau, 2003). Apples may also be pressed immediately after harvest
with no storage period. A good practice after harvest is to sorted and eliminate rotten or moldy
apples and then wash apples to reduce unwanted microbial hazards such as patulin, a mycotoxin

6
produced by mold, but this is not always done (Acar, Gökmen, & Taydas, 1998; A. Lea & Drilleau,
2003). Once the fruit is ready to be juiced, apples can be milled to reduce the size of the apple
particles prior to pressing. Size reduction increases juice yield and ease of pressing. Milling
produces a pulp which is then pressed to yield apple juice (A. Lea, 2015; A. Lea & Drilleau, 2003).
Different kinds of presses may be used including basket press, bladder press, rack, and cloth press
and among many other variations of presses. Pressing aids such as rice hulls or cotton hulls can be
used to increase drainage of juice when pulp is too milled or naturally too soft which can be a
problem when pressing dessert apples (A. Lea, 2015). Juice can then be clarified using the enzyme
pectinase to remove solids and sometimes is clarified further through filtration to produce a clear
juice. Juice is then fermented using Saccharomyces cerevisiae or allowed to ferment “naturally”
with yeast and bacteria present from the fruit itself or the environment (this process can be called
a wild, native or ambient fermentation) (A. Lea & Drilleau, 2003). Commercial yeast strains are
readily available and commonly used to inoculate cider. Different commercial yeast strains are
available due to their different nutrient needs, fermentation rates and have been known to have an
effect on many cider attributes (Fairbairn, McKinnon, Musarurwa, Ferreira, & Bauer, 2017;
Giudici & Kunkee, 1994; Manginot, Roustan, & Sablayrolles, 1998). After fermentation, cider is
separated from dead yeast (lees) and the final cider can be stored until it is ready to be consumed.
2.2 Starting Material for Cider Fermentation
The starting raw material for cider fermentation is apple juice. This juice can be obtained
from fresh pressed apples or from apple juice concentrate (AJC). It may be blended from a variety
of sources and may have been treated physically or chemically prior to fermentation.
For certain cider styles, juice from cider apple cultivars is highly desired to achieve an
optimal balance of sugar, tannins, and acids (Bamforth, 2005; A. Lea & Drilleau, 2003). Cider

7
apples are grouped in four different categories, as determined by their chemical composition:
sharp, bittersharp, bittersweet, and sweet. Bittersharps and bittersweets are particularly important
for cider due to their tannin compositions and acid content. Some cider apples cultivars, compared
to dessert or culinary apples, may have a high fibrous structure that makes pressing apples easier
(Guillermin et al., 2006; A. Lea & Drilleau, 2003). Table 1 illustrates the two major chemical
components that determine these four traditional cider apple classifications: tannin content and
acid content. Tannins are critical for overall mouthfeel and body of the cider by contributing to
bitterness and astringency in the finished cider (Bamforth, 2005; A. Lea, 2015; A. Lea & Drilleau,
2003). Blending of different cultivars is common to achieve the desired balance of acids and
tannins (A. Lea, 2015; A. Lea & Drilleau, 2003). It is also common to blend cider apple juice with
non-cider apple cultivars such as dessert apples or with AJC to extend juice volume and reduce
cost compared to cider apples alone, which are higher value products. Dessert apples, such as
Granny Smith, Golden Delicious, and Honeycrisp, are more commonly grown and in higher supply
than the traditional cider cultivars, especially in the US. AJC is relatively inexpensive (“Milne
Fruit Apple Juice Concentrate,” n.d.; “Tree Top Apple Juice Concentrate,” n.d.), widely available
year-round, and can be stored for long periods of time before use (Bamforth, 2005; A. Lea, 2015;
A. Lea & Drilleau, 2003).
Table 3: Classification of Cider Apples Based on Tannin and Acid Content
Type of Apple Tannin content (%) Acid Content (%) Example
Bittersharp >0.2 >0.45 Backwell Red,
Bittersweet >0.2 <0.45 Dabinett
Sharp <0.2 >0.45 Brown’s Apple
Sweet <0.2 <0.45 Northwood (A. Lea, 2015)

8
Apple juice concentration is the process of removing water from apple juice. This can be
achieved in various ways, including by thermal evaporation, membrane separation (reverse
osmosis, nanofiltration and other methods), freeze drying, filtration, distillation, vacuum
evaporation, or drying by clathrate hydrates to decrease weight and volume and increase storage
capabilities of juice (Adnan, Mushtaq, & Islam, 2017; Downing, 1989; Jiao, Cassano, & Drioli,
2004). Apple juice is usually concentrated five to seven times depending on the concentration
method and desired final sugar concentration. Most apple juices are concentrated from 11°Brix to
70°Brix (Adnan et al., 2017). Juice must be clarified before concentration to avoid more difficult
filtering post concentration (Adnan et al., 2017; A. G. H. Lea, 1995). During processing, especially
thermal processing and during storage above 5°C, vitamins, minerals, antioxidants, flavors, and
aromas can be easily degraded (Downing, 1989; A. G. H. Lea, 1995; Polydera, Stoforos, &
Taoukis, 2003). These are clear disadvantages of using AJC for cider production, compared to
fresh juice.
Amino acids are also consumed during Maillard browning which does not occur in fresh
apple juice. Maillard browning occurs when food products are heated, especially during apple juice
processing, concentration and storage. During thermal concentration methods, Maillard browning
(non-enzymatic browning) occurs when reducing sugars and amino acids in juice are heated in the
presence of oxygen. Essential amino acids are consumed during Maillard browning and as a result
Maillard by-products such 5-hydroxymethyl furfural (HMF) and furfural are produced (Camire et
al., 1990; Martins, Jongen, & Boekel, 2001). Furfural has been shown to inhibit yeast, such as
Saccharomyces cerevisiae, and inhibits growth and alcohol production (Banerjee, Bhatnagar, &
Viswanathan, 1981b, 1981a; Sanchez & Bautista, 1988). HMF is an indicator of nutrient loss

9
(amino acids and sugars) in AJC and may also have slight inhibitory effects on yeast fermentation
(A. G. H. Lea, 1995; Taherzadeh, Gustafsson, Niklasson, & Lidén, 2000).
Monitoring levels of HMF and color indexes of AJC are commonly used as an indicator
for quality in apple juice. HMF can represent the presence of other inhibitory Maillard products
and amino acid consumption (Bengoechea et al., 1997; Z. Li et al., 2019). HMF continues to be
formed during AJC storage if not properly stored below 5°C (A. Lea & Drilleau, 2003). Babsky
(1986) observed a significant loss of amino acids during AJC storage at 35°C. Glutamic acid were
decreased from 57.6 mg 100g-1 to 1.5 mg 100g-1, asparagine were depleted from 296.8 mg 100 ml-
1 to 28.7mg 100 ml-1 and glutamine decreased from 296.8 mg 100 ml-1 to trace amounts. As a result
of the amino acid consumption, a total of 44 mg 100 mL-1 of HMF was reported when AJC was
stored for 110 days (Babsky, Toribio, & Lozano, 1986). Temperature of storage also effects how
amino acids are degraded during storage. Beudo (2000) found in peach juice concentrate storage
at 15°C, 30°C and 36°Cover 42 days, decreased total amino acid content by 8%, 35% and 60%
respectively (Buedo, Elustondo, & Urbicain, 2000). Although no know studies have addressed
degradation of B vitamins in AJC processing, it is reasonable to believe that B vitamins, that are
essential to yeast fermentation, could be degraded during heat processing (Edwards & Bohlscheid,
2007). Further research needs to be conducted to elucidate amino acids and vitamin degradation
in AJC so knowledge can be applied to cider making and the interactive effects of H2S production.
Total HMF concentration in AJC has been investigate. Bengoechea (1997), observed a
range of HMF from 0.38 to 2.48 mg L-1 in ten different store bought AJC along with other Maillard
browning by-products (Bengoechea et al., 1997). In a newer study Kus (2005), found that a store
bought AJC had 4.5mg-1L of HMF which was significantly higher than other concentrates
observed (peach, strawberry, cherry and orange) (Kus, Gogus, & Eren, 2005). Burdurlu (2003),

10
reported increased HMF concentration in AJC with increased storage temperatures and TSS
measured as °Brixvalues after 4 months of storage, demonstrating that storage temperature and
brix value of AJC can effect HMF concentration (Selen Burdurlu & Karadeniz, 2003). In AJC,
the European Fruit Juice Association recommend a maximin level of 20 mg L -1 of HMF due to its
cancerogenic effects in humans (Z. Li et al., 2019). All the above reported values are below this
recommend limit for human health but there is no recommendation for cider making or yeast
fermentation. It has been suggested that improvements in concentration technologies such as
vacuum concentration can limit Maillard reactions to less than 20 ppm, while older concentration
methods like thermal evaporation have HMF ranges from 100 ppm to 700 pm (A. Lea & Drilleau,
2003; A. G. H. Lea, 1995).
Another by-product from Maillard browning, furfural, has been shown to inhibit yeast
growth and alcohol production in Saccharomyces cerevisiae (Banerjee et al., 1981b, 1981a;
Sanchez & Bautista, 1988). Banerjee (1981) found that furfural above 1mg mL-1 decreased CO2
production in S. cerevisiae and Sanchez (1987) observed inhibition effects of furfural at 1.5mg
mL-1 and complete inhibition above 2mg mL-1 in S. cerevisiae (Banerjee et al., 1981b; Sanchez &
Bautista, 1988). Limited studies show amount of furfural in apple juice concentrate but one study
suggested concentrations of 20 ppb in AJC (A. Lea & Drilleau, 2003). HMF has also been studied
for inhibition effect on yeast growth. Sanchez (1988), reported a prolonged lag phase in yeast
fermentation with 2 g L-1 of HMF but complete inhibition was not observed. Pfeife (1984),
reported that concentrations of 5 mg mL-1 of HMF showed little change in glucose conversion in
Saccharomyces carlsbergensis W34 (Pfeife, Bonn, & Bobletter, 1984). Although this paper
studied a different yeast species, it demonstrates metabolic differences across yeast. More research

11
should be conducted on the inhibitory effects of Maillard products in AJC and levels of furfural in
AJC in specific terms of cider fermentation.
Cider producers must consider storage time and temperature of storage when choosing AJC
for these reasons. If the product is subjected to temperature abuse or very long periods of storage,
HMF and furfural could be higher than originally thought. Even with observed advances in
concentration technologies such as vacuum evaporation, that use less heat, the most common
method of concentration currently used is thermal concentration evaporators (Adnan et al., 2017).
Maillard browning, consumption of amino acids and production of yeast inhibiters such as
furfural, continue during storage, especially during incorrect storage and may result in an apple
juice deficient in nutrients needed for yeast growth and an inhibitory medium for yeast growth.
These compounding factors could all have negative consequences in cider production and cider
aroma. These factors should be considered when using AJC as the base for cider making. Issues
like production of furfural and HMF are not associated with fresh apple juice adding to problematic
fermentations in AJC based fermentations (Banerjee et al., 1981b; A. Lea & Drilleau, 2003).
Despite these issues, AJC is extensively used in cider making for several reasons. AJC is
sometimes chosen over fresh apple juice because it can be stored for long periods of time without
apparent negative deterioration compared to fresh juice or fresh apples. AJC is convenient for Just-
In-Time cider production businesses and year round operations when fresh apples are unavailable
and there are limited apple producing trees (A. Lea & Drilleau, 2003). AJC is commonly made
from a variety of apple cultivars that are not cider apples cultivar and some producers make cider
solely from AJC. While most AJC are not made from 100% cider apples, it is more common for
fresh juice made from dessert apples, culinary apples and cider apples to be reinforced with AJC
to achieve ideal levels of tannins and acidity (A. Lea & Drilleau, 2003).

12
2.2.1 Pre-fermentation Additions and Treatments
Several different pre-fermentation juice treatments can be applied to alter the juice
chemistry. These treatments can include altering the pH, acid concentration, sugar level, tannin
level, and nutrient level. These pre-fermentation juice treatments are used to improve fermentation
performance and/or create different sensory and taste outcomes.
Fermentable sugars in juice are converted into alcohols during yeast fermentation
(Zoecklein, Fugelsang, Gump, & Nury, 1995). This is important to overall flavor and style of the
beverage. Some producers may add sugar in the form of cane sugar or beet sugar to the apple juice
or grape must prior to fermentation to get a higher percent alcohol, increase fermentation
performance or achieve a specific style in the finished product (A. Lea, 2015). In grapes and apples,
sugar accumulation occurs as the fruit maturation occurs (Jackson & Lambard, 1993). The total
amount of sugar found in the fruit can be affected by growing temperatures, season length,
agriculture practices, harvest time and many of other factors (Jackson & Lambard, 1993). Apples
consist of three types of sugar: fructose, glucose and sucrose. Fructose is usually present in the
highest concentrations followed by glucose, but sugar concentrations can vary greatly between
cultivars (Fuleki, Pelayo, & Palabay, 1994; B. Ma et al., 2015; Wu et al., 2007). If the fruit does
not have the desired level of sugar wine makers may add sugar to achieve desired final products.
Lowing the pH is another pre-fermentation treatment that can affect the fermentation. If
the pH of a starting juice is above 3.6 it can become subject to unwanted microbial contamination
and low quality taste (Boulton, Singleton, Bisson, & Kunkee, 1997; Jackson & Lambard, 1993;
Kodur, 2011). To prevent this unwanted microbial growth, juice can be acidified to below 3.8 and
sulfur dioxide (SO2) can be added. SO2 is added pre-fermentation to prevent unwanted microbial
growth such as Acetobactor aceti or Brettanomyces species that are already present on the skins

13
of fruit (Zoecklein et al., 1995). Allowing SO2 to stand overnight to 24 hours allows enough time
to inactive any existing microbes and bacteria in the juice. Acidification is important for SO2
addition because SO2 is pH dependent and at a pH above 3.8, SO2 may not be as effective against
microbes (Deniz Bozoglu et al., 2015; Zoecklein et al., 1995).
Addition of tannins has become a widely accepted practice in wine making, especially with
regards to red wine. A wide range of exogenous tannins are commercially available that are
marketed to improve texture, perception of sweetness, color and ageing of wine or cider (García-
Estévez, Alcalde-Eon, Puente, & Escribano-Bailón, 2017; “Scott Laboratories Cider Handbook,”
2018). These tannins can be derived from a variety of sources including grapes, chestnuts and other
wood or plant extracts (Sanz, Martínez-Castro, & Moreno-Arribas, 2008; “Scott Laboratories
Cider Handbook,” 2018). Some research has explored replacing the use of SO2 with addition of
tannins and lysozyme in grape must fermentations due to tannins antioxidant capacity and
lysozymes ability to act on cell walls of unwanted microorganism that contribute to malolactic
fermentation (Sonni, Chinnici, Natali, & Riponi, 2011). In this research, tannins are used to
prevent oxidation of stored wine (Sonni, Cejudo Bastante, Chinnici, Natali, & Riponi, 2009). Other
research has explored how tannins affect red wine color with some studies finding a positive
increase in anthocyanin-derived colors and other seeing no effect on color (García-Estévez et al.,
2017; Parker et al., 2007).(Parker et al., 2007)(Parker et al., 2007) This area remains a topic of
current research, with conflicting results, notwithstanding both wine and cider producers may
purchase and add commercially available exogenous tannins for these potential increases in
positive attributes in the finished product.
Additional yeast nutrients, to increase total nitrogen available and other nutrients, are
common pre-fermentation additions. A variety of yeast nutrients are commercially available,

14
including Diammonium Phosphate (DAP) which consists of only inorganic nitrogen, and
inactive dry yeast nutrient (IDY) which consist of varying nutrients such as amino acids,
thiamine and ammonia ions. Addition of IDY products and DAP have the potential to increase
fermentation rate, increase completeness of sugar consumption and retention of aroma
compounds but increasing total YAN concentrations and available nutrients (Bell & Henschke,
2005).
2.2.2 Negative Sensory Attributes of Hydrogen Sulfide
The transformation of fruit juice into an alcoholic beverage such as cider or wine is
possible due to alcoholic fermentation by yeast strains that convert fermentable sugars into
ethanol, gases, and acids. The most important yeast in beverage fermentation is Saccharomyces
cerevisiae (Swiegers & Pretorius, 2005). During yeast metabolism, byproducts (other than
ethanol and CO2) are produced that provide aroma and flavor in the end product. The pathways
by which these flavor-active compounds are produced are influenced by many factors, including
but not limited to available nutrients in the juice, aroma precursors in the juice, and fermentation
temperature and rate. Common negative byproducts of yeast metabolism during alcoholic
fermentation are VSCs such as dimethyl sulfide, furfurylthiol, methanethiol, and H2S. VSCs are
commonly descried as rotten eggs, decaying seaweed, or reductive taste and have very low
sensory thresholds that often lead to poor product quality and even consumer rejection of the
product (Marchand et al., 2000; Swiegers & Pretorius, 2005). In general, these VSCs have
varying limits of detection in different matrixes (Mestres, Busto, & Guasch, 2000). Table 2 lists
common VSCs formed during yeast fermentation in wine and the observed sensory thresholds in
wine (Davis & Qian, 2011; Manginot et al., 1998; Swiegers & Pretorius, 2005). Similar VSCs
can be expected in yeast fermentation in apple juice since there are similar fermentation methods

15
and yeast strains used in cider and wine making. However, there is still a gap in knowledge of
factors influencing production of VSCs specifically in the cider matrix. Grape juice or must and
apple juice differ in juice chemistry which can have a large effect on sensory outcomes. Sensory
impacts of VSCs in cider could have a larger effect in cider matrix due to cider having relatively
fewer complex aromas compared to the complexity of aroma in wine.
H2S is the most commonly recognized VSC, generally considered as a negative sensory
attribute. It is possible for humans to detect H2S in extremely low concentrations, with a wide
range of sensory thresholds reported, from 1ng L-1 to 105µg L-1 (Mestres et al., 2000). H2S can
also affect the perception of other positive aroma compounds in wine. A study by Franco-
Luesmam (2016), found that when H2S was present in concentrations ranging from 0-40 µg L-1,
decreased positive aroma attributes such as cooked, candied, and floral aromas and increased
negative attributes such as rotten eggs and reductions aromas were reported (Franco-Luesma et
al., 2016). With H2S being a very common negative off aroma produced in wine and cider it is
important to understand the mechanisms that contribute to its production such as agricultural
crop treatments, yeast strain, nutrient additions, nutrient limitations, beverage processing, and
storage.

16
Table 4: Volatile Sulfur Compounds Found in Wine
Compound Name Aroma descriptor Aroma Threshold in Wine
(µg L-1)
Hydrogen Sulfide Rotten Egg 0.001 -150
Methanethiol Rotten egg, cabbage 0.3-1.82
Ethanethiol Onion, rubber 0.19-1.1
S-methyl thioacetate Cheesy, onion, burnt
sulfury
300
S-ethyl thioacetate Cheesy, onion, burnt
sulfury
40
Dimethyl sulfide Quince, truffle,
asparagus, corn
10-160
Diethyl disulfide Cooked vegetables,
onions, garlic
4.3-40
Dimethyl disulfide Garlic, burnt rubber
20-45
Benzothiazole Rubber 24-50
Thiazole Popcorn, peanut 38
4-methylthiazole Green hazelnut 55
Acetythiazole Roasted hazelnut 3
2-furanmethanethiol Roasted coffee, burnt
rubber
1 ng L-1
Thiophene-2-thiol Burnt rubber, roasted
coffee
0.8
Adapted and compiled from Swiegers 2005, Yeast Modulation of Wine Flavor and Davis and
Qian 2011, Progress on Volatile Sulfur Compound Analysis in Wine.
2.2.3 Hydrogen Sulfide Quantification
In order to evaluate strategies for prevention of H2S production during beverage
fermentation, the H2S must be measured during fermentation. H2S has been measured using
selective gas traps by trapping targeted gas and preforming colorimetric analysis to quantify H2S
(C. S. Thomas, Boulton, Silacci, & Gubler, 1993; Vos & Gray, 1978). This method is not ideal
as it requires a significant amount of time, expensive materials, and toxic chemicals (Acree,

17
Sonoff, & Splittstoesser, 1971; Ugliano & Henschke, 2010). Another method to measure H2S
used paper strips coated with lead acetate or silver nitrate that darken when H2S comes in contact
with the strip (Natusch, Sewell, & Tanner, 1974). This method is less time-consuming but can
only test for the presence of H2S and cannot give quantitative concentrations of H2S (Ugliano &
Henschke, 2010). Until more recently quantifying H2S was inconvenient and expensive until
Park (2008) developed an easy, rapid, and convenient way to quantify H2S with minimal cost
using coulometric H2S pre-calibrated detector tubes packed with silver nitrate or lead acetate that
darken upon exposure to H2S (Park, 2008). The tubes are commercially available, require
minimal training to use, and are most often used in environmental safety monitoring. They are
pre-calibrated to a known concentration of H2S. Park ran a standardization study on the tubes and
found a good linear relationship (R2=0.9997) between a known injected amount of H2S and the
reading on calibrated scale on the tube (Park, 2008). Using the same method Ugliano and
Henschke (2009) found 95-98% recovery of known concentrations of H2S and no interference
from SO2 and mercaptans (Ugliano & Henschke, 2010). Since then, H2S detector tubes have
been used in many studies to detect and quantify H2S concentration.
H2S tubes are convenient for measuring H2S but there are drawbacks to this method
including the precision of the method. Depending on the pre-calibrated scale on the tube, the
marked intervals indicating H2S concentration are large. For example, 120SF tubes are calibrated
with intervals of 100 µg mL-1. When the darkened silica gel is in between the intervals,
concentration readings must be estimated and small increased from day to day may not be visible
on this scale. Another downfall to using H2S tubes is the need to be replace the tubes when the
pre-calibrated scale has reached its maximum. To replace the tubes, the tube must be removed
from the stopper and replaced with a new one. This could be a source of error, as H2S and CO2

18
gas may be lost from the head space. Although these draw backs exist, the H2S tubes still provide
relative and quantitative information for testing different treatments.
2.3 Yeast Strain and Hydrogen Sulfide
Saccharomyces cerevisiae is one of the most widely used yeast species for winemaking
and cider making. Yeast strain is a major factor affecting total H2S produced during fermentation
(Manginot et al., 1998; C. S. Thomas et al., 1993; Ugliano et al., 2009). H2S is formed as a
metabolic intermediate during yeast metabolism as part of the sulfate reduction sequence (SRS).
The SRS pathway is responsible for the biosynthesis of sulfur-containing amino acids needed for
yeast growth. In matrices that lack sulfur-containing amino acids (methionine and cystine) the
SRS pathway is triggered to meet metabolic requirements of cystine, methionine, and glutathione
(Bell & Henschke, 2005). Metabolic requirements of sulfur-containing amino acids and the SRS
pathway may vary by yeast strain which can contribute to the varying ranges of H2S produced by
different yeast strains (Fairbairn et al., 2017; Giudici & Kunkee, 1994).
Apple juice and grape juice commonly lack sulfur-containing amino acid concentrations
needed and have high sulfate concentrations, activating the SRS which reduces sulfate to sulfide
that will bond with o-acetyldserine or o-acetylhomoserine to form cystine and methionine
respectively (Swiegers & Pretorius, 2005; Ugliano & Henschke, 2009). Simply put, under
nitrogen limiting conditions, amino acid precursors o-acetyldserine and o-acetylhomoserine will
be limited, halting the pathway after sulfide is reduced. This reduced sulfide will be converted
into H2S that will then accumulate in the cell and diffuse into the media (Jiranek, Langridge, &
Henschke, 1995b). H2S binds with o-acetylhomoserine to form serine but with limited precursors
H2S will likely remain unbound or react with ethanol to produce mercaptans which can also be

19
oxidized to form polysulfide, both of which have negative sensory attributes (Swiegers &
Pretorius, 2005).
Several genetic variations among S. cerevisiae strains have been demonstrated to affect
total H2S production by altering the SRS pathway. In the case where amino acid precursors are
limited, over-expression of the MET17 gene, which encodes for o-acetylersine (OAS) and o-
acetylhomoserine sulfuhyrylase (OAH SHLase), is thought to decrease H2S formation in some
strains by increasing production in OAS and OAH SHLase needed for sulfite binding
(Spiropoulos & Bisson, 2000). Bisson (2000) modified yeast strains to overexpress the MET17
gene and saw no decrease in H2S formation in UCD522 when OAS/OAH SHLase production
was increased, but a significant reduction of H2S formation in UCD713 was observed without an
increase in OAS/OAH SHLase production (Spiropoulos & Bisson, 2000). In this study, a
decrease in H2S production was observed when MET17 was overexpressed in one yeast strain
(UCD713) and not in the other yeast strain (UCD552). This study alludes to the complexity of
yeast strains genetics, expression and regulation as relates to hydrogen sulfide production. A
study by Mendes-Ferreira (2010) backed up the idea of complexity in yeast strain genetics,
expression and regulation by showing that different MET genes (MET3, MET7, MET10,
MET17 and SSU1) in two yeast strains (UCD522 and PYCC4072) were expressed differently
under different nitrogen conditions (267 mg N L-l and 402 mg N L-1)(Mendes-Ferreira, Barbosa,
Jiménez-Martí, Del Olmo, & Mendes-Faia, 2010).
Other genes can also regulate the SRS pathway and lower H2S production. Hansen (1994)
was the first to observed that yeast strains with the MET10 gene grown on a BIGGY plate that
detects H2S, produced much lighter color plates indicating lower H2S after six days of growth on
the media compared to strains without the MET10 gene (Hansen, Cherest, & Kielland-Brandt,

20
1994). Linderholm’s study (2010) backed up Hansen’s theory when he added the MET10 gene to
a high H2S producing yeast strain and resulted in prevention of H2S formation in BIGGY plates
(Linderholm, Dietzel, Hirst, & Bisson, 2010). The MET10 gene, encodes for the alpha portion of
sulfate reductase that reduces sulfate to sulfide, has been linked to UDC935 yeast that is known
as a very low H2S producing yeast strain (Linderholm et al., 2010). These are just a few
examples of the vast research field studying yeast strain genetics and how genes expressed
regulate SRS pathway and affect H2S production. This body of work underscores the important
influence of yeast strain on H2S production during fermentation.
Table 3 provides reports of the addition of single amino acids, methionine and cystine, and
the reported effects of additions on H2S production and yeast strain differences. Methionine
additions can lower H2S production by acting as an inhibitor in the SRS pathway although
interactive effects have been reported with yeast strain and concentration of total YAN
(Boudreau, Peck, O’keefe, & Stewart, 2017; Wainwright, 1970) Additions of methionine and
cysteine have been found to increase H2S liberation when these amino acids are the only source
of nitrogen. Jiranek (1994) found that when the sole source of nitrogen in media was either
methionine or cystine, H2S liberation increased in both AWRI 77 and AWRI 72 yeast strains
compared to un-supplemented media (Jiranek et al., 1995b). When methionine is added in
addition to other nitrogen sources it can decrease H2S formation. Bourdeau (2017) found the
addition of 5mg L-1 of methionine decreased H2S production in EC1118 yeast when total YAN
was 53mg L-1 of YAN but 50mg L-1 of methionine was needed to decrease H2S formation when
YAN was 153 mg L-1 while no amount of methionine added decreased H2S in UCD522 yeast
(Boudreau Iv et al., 2017). One potential explanation for this observation is that the increase in
YAN increased the cell biomass. The increased cell biomass could lead to a higher methionine

21
concentration needed to inhibit the SRS pathway and in turn lower the H2S production
(Boudreau Iv et al., 2017). There are considerable complex interactions between total YAN
concentration, amino acids, vitamins, yeast strain, and starting material that all play a role in H2S
production, but amino acids and the lack thereof can certainly affect H2S production during cider
fermentation.
Table 3: Amino Acids Additions and Reported Results
Amino Acid
Reported Results with
Addition of Specific Amino
Acid
Matrix Tested In References
Methionine
Decreased H2S dependent on
YAN concentration and yeast
strain Increase H2S liberation
Cider
Wine
Cultured media
(Boudreau Iv et al., 2017)
(Wainwright, 1970)
(Jiranek et al., 1995b)
Cystine Resulted in increased H2S Cultured media (Jiranek et al., 1995b)
The total amount of VSCs and H2S produced during beverage fermentation is affected by
several different factors including yeast strain, availability of sulfur containing amino acids and
gene expression. Even if VSC compounds do not seem to be present during or after fermentation
based on sensory evaluation, VSCs may still be present in subthreshold concentrations that are
not detectable by analytical or sensory means. This can, however, result in increased levels of
VSCs or other negative aromas occurring via chemical reduction reactions when stored in very
low oxygen and ambient conditions. This, in turn, can result in high H2S and methyl mercaptan,
another undesirable aroma, when uncorked (Ugliano et al., 2011). Although the mechanism
behind post bottling evolution of H2S is still poorly understood, it has been hypothesized that
metal ions such as Cu+2 added as a fining agent to reduce reductive off aromas such as H2S in
finished wine can later act as a catalyst for H2S formation and other VSC during storage (Chen,
Jastrzembski, & Sacks, 2017; Ugliano & Henschke, 2010). Other additives to wine post-

22
fermentation but pre-bottling such as tripeptide glutathione used to reduce free SO2 have also
been shown to be associated with increases in H2S during storage (Ugliano et al., 2011). SO2,
added post-fermentation as an antioxidant and antimicrobial has been linked to increased VSCs
(Bekker, Smith, Smith, & Wilkes, 2016). Further research needs to be conducted to elucidate the
mechanism behind post bottling H2S formation.
For now, prevention of production of H2S seems to be the best strategy to reduce negative
sensory aromas. If negative sensory compounds are never produced during fermentation, there is
no need to find post fermentation strategies to deal with H2S after the fact. The research cited in
this literature review is almost all conducted in wine matrices. The cider fermentation matrix
specifically, has seen very limited research in all of these areas, and the extrapolation of research
from grape must fermentation should be done with caution due to differences in juice chemistry
that has been mentioned in previous sections. Due to these factors, there is a need for research
specifically focused on the cider matrix, and how cider matrix factors influence the production of
H2S and other aroma compounds during fermentation.
2.4 Yeast Assimilable Nitrogen, Yeast Nutrients and Hydrogen Sulfide
2.4.1 Yeast Assimilable Nitrogen and Nitrogen Utilization
Nitrogen found in amino acids and ammonium ions are essential yeast for yeast
metabolism. A lack of nitrogen in juice can lead to a “stuck” or “sluggish” fermentation which
can result in slow fermentation rates, incomplete fermentation of sugars, production of higher
alcohols, low fatty acid production, and production off flavors and aromas (Alexandre &
Charpentier, 1998; Bell & Henschke, 2005; Blateyron & Sablayrolles, 2001; Sablayrolles,
Dubois, Manginot, Roustan, & Barre, 1996). Yeast assimilable nitrogen (YAN) refers to the
23
nitrogen in apple juice and grape juice that is present in a form that is available for yeast
metabolism. YAN is generally defined as being composed of two parts: Free Amino Nitrogen
(FAN) also known as Primary Amino Nitrogen (PAN) which is composed of organic nitrogen
(amino acids, some definitions also include small peptides) and of inorganic nitrogen
(ammonium ions).
Ammonium is one of the first nitrogen sources to be internalized into the yeast cell for
metabolism in S. cerevisiae (Bell & Henschke, 2005). Amino acids contribute to the PAN but
have varying rates of utilization dependent on the yeast strain and on the total amount of nitrogen
present in the environment which is known as nitrogen catabolite repression (NCR) (Broach,
2012; Jiranek, Langridge, & Henschke, 1995a; Magasanik & Kaiser, 2002). Nitrogen sources in
the literature have been loosely grouped into “preferred” and “non-preferred sources” depending
on how well the individual nitrogen source can support yeast growth and how well it can repress
non-preferred nitrogen utilization, and this is all yeast strain dependent (Ljungdahl & Daignan-
Fornier, 2012). Dependent on the yeast strain, almost all amino acids can be used for yeast cell
growth except for lysine, cystine and histidine (Gobbi et al., 2013; Ljungdahl & Daignan-
Fornier, 2012) In has been reported that glutamine and asparagine are considered by some to be
more “preferable” nitrogen sources after the depletion of ammonia ions occurs (Bell &
Henschke, 2005). Some research has found that supposed “preferable” nitrogen sources such as
arginine did not support growth of S. cerevisiae well which could be due to differences in yeast
strains (Fairbairn et al., 2017). Proline has been reported to have limited viability as a nitrogen
source for yeast due to anaerobic conditions of fermentation and is not typically included in PAN
concentrations (Bell & Henschke, 2005).This demonstrates the importance of yeast strain and the
need for more research on how nitrogen sources are utilized in fermentations. In general, it is

24
thought that a “balanced” mixture of amino acid and ammonia ions are ideal for fermentation by
S. cerevisiae (Bell & Henschke, 2005), although the specific concentrations of each component
that make up this “balance” are not well-defined and seem to vary depending on yeast strain and
other factors. The suggested minimum amount of YAN in grape must for a complete
fermentation is between 120-140 N mgL-1 in starting matrix, all though some have suggested
even higher concentration of nitrogen of 267 mg N L-1 or 350 mg N L-1(Alexandre &
Charpentier, 1998; A. Mendes-Ferreira, Mendes-Faia, & Leão, 2004). Grape must can have a
wide range of YAN concentration between 40 N mgL-1 to 559 N mgL-1(Alexandre &
Charpentier, 1998; Christian E. Butzke, 1998). Boudreau (2017 ) surveyed PAN and YAN
concentrations in 12 apple cultivars grown in Virginia and found an average YAN of 59 mg N L-
1 which some cultivars being as high as 249 mg N L-1 and 94% of the cultivars having
concentrations lower than 140 mg N L-1 (Boudreau, Peck, O’Keefe, Stewart, & Stewart, 2018).
This was a small survey, and further data is needed to better understand the global variation in
YAN concentration and composition of cider apples. Apple juice and AJC is generally believed
to have lower available nitrogen than grapes, however as very limited reports are available for
ranges of YAN concentrations in apples, this is a subject that merits further study. Similarly, the
YAN requirements for cider fermentation and factors that interact with these requirements, are
also not well-established.
2.4.2 Addition of Yeast Nutrients and Timing of Nutrient Addition
Often total YAN is increased by winemakers or cidermakers through pre-fermentation
supplementation with Diammonium Phosphate (DAP). DAP is added to apple juice or grape
must to increase ammonium ion concentration, resulting in increased yeast population and

25
fermentation rate. Other forms of yeast nutrients such as inactive dry yeast products (IDY) can
be used to increase available nitrogen and other nutrient sources in juice.
Many products are commercially available for yeast nutrient supplementation. IDY
products are produced in a variety of ways depending on the manufacturer and application.
These products often are made of either inactive yeast, yeast autolysates, yeast cell walls, or
yeast extracts and can provide a variety of nutrients such as proteins, peptides, amino acids,
sterols, fatty acids, vitamins, and minerals (Ángeles Pozo-Bayón et al., 2009). Some IDY
products are also mixed with DAP or vitamins such as thiamine to provide both ammonium ions
and nutrients for inactive yeast. The addition of IDY products and DAP have been linked to
increased fermentation rates, flavor intensity, reduction of H2S production and positive aroma
compounds and are being further investigated for their positive impact on fermentation duration
and effect on aroma (Ángeles Pozo-Bayón et al., 2009; Bell & Henschke, 2005; Gobbi et al.,
2013; Pozo-Bayón, Andújar-Ortiz, & Moreno-Arribas, 2009). In a study by Soulbeyrand (2005)
IDY added at high levels (100 mgL-1) during active dry yeast rehydration showed an increase in
fermentation rate. It was proposed that the IDY served to help repair active dry yeast that was
damaged during freeze drying (Soubeyrand et al., 2005). IDY products can also be used to
decrease fermentation duration during exponential growth phase by the addition of nitrogen
sources (inorganic and organic) thought the soluble fraction (yeast cell walls, amino acids, and
ammonia) and the insoluble fraction (cellulose) (Ángeles Pozo-Bayón et al., 2009). In this study
the effectiveness of IDY depended on their composition and processing methods.
IDY, have also been used to increase positive aromas in wine and grape must. Suklje
(2016) reported the addition of two separated IDY to Sauvignon blanc grapes during vine
ripening and reported increased fruity aromas in grapes treated with IDY compared to control

26
wine with no IDY additions. Control wines were associated with greener sensory descriptors
(Šuklje et al., 2016). Different aromas attributes were associated with each of the different IDY
tested; one wine was described as gooseberry, apricot or banana while the other wine using the
second IDY was described as peach, citrus, and apples aromas (Šuklje et al., 2016). Another
study by Pozo-Bayón (2009), reported aroma compounds in wine were effected differently
depending on the type of IDY, how the IDY was produced and the concentration of addition of
IDY (Pozo-Bayón, Andujar-Ortiz, Alcaide-Hidalgo, Martín-Álvarez, & Moreno-Arribas, 2009).
Yet another report suggested that addition of glutathione rich IDY to rosé, increased fruity
aromas and decreased yeasty aromas when observed by a trained panel (Andújar-Ortiz, Chaya,
Martín-Álvarez, Moreno-Arribas, & Pozo-Bayón, 2014).
Limited research on the addition of IDY effects on aroma have been reported and it is
unknown the specific type of IDY being applied since product names and composition of IDY
were not revealed. The mentioned above studies give a limited glimpse of how IDY products
could be used in wine making and how it might affect wine aroma. These studies does not
represent cider production or cider aroma with IDY additions and further research into cider
aromas.
Not only is the total concentration of YAN important to yeast fermentations for metabolic
growth and preventing stuck or slow fermentations, timing of nutrient additions has also been
suggested to affect H2S production and aroma. It is believed that H2S is produced during the
exponential growth phase after the yeast have consumed the most preferred nitrogen sources and
start to consume lesser preferred sources of nitrogen (Ugliano, Kolouchova, & Henschke, 2010).
Addition of nutrient during the exponential growth phase is thought to reduce nitrogen depletion
and increase fermentation rate. Beltran (2005) found regardless of timing of addition (30, 72, 144

27
or 240 hours), nitrogen addition from DAP decreased fermentation duration. He also concluded
that addition of DAP during the exponential growth phase decreased total fermentation duration
even more compared to addition in lag phase growth. The consumption of ammonia ions also
depended on timing, if ammonia was added towards the end of the fermentation (114 or 240
hours) it was hardly consumed and remained in the cider environment, but when added during
the first half (30 or 72 hours) of the fermentation it was highly consumed (Beltran, Esteve-
zarzoso, Rozes, Mas, & Guillamo, 2005). Typically, in wine making, nutrient additions are made
at 1/3 brix depletion and no later due to the threat of unwanted microbial growth. This practice
is done to prevent residual yeast nutrients that are not taken up by the yeast remaining in the
wine post-fermentation, which would promote unwanted microbial growth.
The timing of yeast nutrient additions can influence the production of H2S. Mendes-
Ferreira (2009) evaluated timing of DAP additions in fermentation using the UCD522 yeast
strain and found that adding 145 mg L-1 of DAP to fermentations pre-fermentation increased H2S
compared to grape juiced with no DAP addition pre-fermentation (824.2 µg L-1 compared to
403.8 µg L-1) while addition of 145 mg L-1 of DAP at 72 hrs after inoculation resulted in less
H2S being produced (537.7 µg L-1) (A Mendes-Ferreira, Barbosa, Inê, & Mendes-Faia, 2009).
Another study by Mendes-Ferreira (2004) found that when DAP was added during the stationary
phase, to a grape juice medium inoculated with PYCC 4072 yeast, maximum cell population and
maximum fermentation rate increased (A. Mendes-Ferreira et al., 2004). Jimenez-Marti found
similarly, that when adding amino acids, ammonia or a combination of both to sluggish and
nitrogen-depleted synthetic grape must using Fermicru Primeur yeast, increasing the total YAN
to 240 mg N L-1, increased sugar consumption rate, ethanol production and shortened
fermentation duration (Jiménez-Martí, Aranda, Mendes-Ferreira, Mendes-Faia, & del Olmo,
28
2007). Jiranek (1995) hypothesized when nitrogen depletion occurs later in the fermentations,
there is less time for H2S to accumulate and be released from the cell. Addition of nutrients, such
as DAP, may delay nitrogen depletion until later stages in the fermentation and allowing less
accumulation of H2S (Jiranek et al., 1995b).
Further research focused on timing of nutrient additions is needed to elucidate the
interaction between timing and H2S production in cider as well as wine. Cider may differ from
wine for a wide variety of reasons including natural chemical differences in grapes and apples.
Cider may differ in pH, macro- and micro-nutrient content, sugar concentration, acid content,
polyphenols and ethanol concentration among other traits. These matrices will also differ due to
production practices including source of fruit, fruit cultivar or species, agriculture practices and
many other factors. These differences make it difficult to extrapolate and directly apply wine
research to cider. While insufficient YAN has been directly linked to H2S production, recent
studies suggest that meeting a recommended value for total YAN does not completely safeguard
against H2S formation (C .E. Butzke & Park, 2011; Giudici & Kunkee, 1994; Huang, Walker,
Fedrizzi, Gardner, & Jiranek, 2017; Jiranek et al., 1995b; A Mendes-Ferreira et al., 2009; Vos &
Gray, 1978; Wainwright, 1971). Some studies have shown that when nitrogen levels (total YAN)
are increased using DAP additions (inorganic nitrogen), H2S production by yeast during
fermentation can increase. Mendes-Ferreira (2009) found that in two specific yeast strains
(UCD522 and PYCC4072) the highest levels of H2S were formed when YAN was 267mg N L-1
in the initial media and the lowest H2S formation was in media containing 66mg N L-1(Ana
Mendes-Ferreira, Barbosa, Falco, Leão, & Mendes-Faia, 2009), demonstrating that increasing
YAN may in some cases actually increase H2S production. Ugliano (2010) found similar
correlations with moderate initial YAN (260mg N L-1) producing the highest concentration of

29
H2S and interestingly the highest levels of initial nitrogen (410 mg N L-1) producing similar or
lower H2S than the non-supplemented (110 mg N L-1) (Ugliano et al., 2010). Yet another study
by Ugliano (2009) supports increased YAN from DAP supplementation to final YAN
concentration of 250 and 400 mg L-1 increased H2S compared to non-supplement YAN of 100
mg L-1 (Ugliano et al., 2009). Again Boudreau (2017), found that fermentations using EC1118
yeast with a total YAN concentrations of 153 mg N L-1 had the highest total production of H2S
compared to fermentations with a total YAN of 53 mg N L-1 and 253 mg N L-1(Boudreau Iv et
al., 2017). While cell mass or maximum cell concentration during fermentation was not
monitored in these studies, one potential explanation for these observations is that the high initial
concentrations of nitrogen are depleted early, resulting in a higher population of yeast that are
then nitrogen-deficient by mid-fermentation. This theory underlies the interest in strategies
involving splitting the yeast nutrient additions into an early and mid-fermentation addition. With
recent research calling into question the general notion that increasing YAN concentrations
decreases H2S, other factors that affect H2S production by yeast have been explored. In recent
years, H2S production has been known to be affected by elemental sulfur addition in vineyard
pesticide treatments, amount of pantothenic acid, and other vitamins and amino acids, yeast
strain, bottling and storage conditions.
Almost all the above cited research has been conducted in wine or synthetic grape juice
media. These studies provide a sound starting point for cider fermentation strategies; however,
the findings may not translate wholly into cider matrices due to the differences in matrix
constituents that may interact with YAN requirements. When extrapolating knowledge and
methods developed for wine making to cider making, unexpected outcomes can result. The
increasing evidence of factors that are not usually measured in fruit juice (e.g. vitamins,

30
minerals, fungicide residues, etc.) to influence fermentation further justifies the need for more
research focused specifically on the cider matrix and how processing techniques, total YAN, pre-
treatment additions and aroma compounds affect quality.
2.4.3 Vitamin Deficiencies and Amino Acid Deficiencies
Deficiencies of vitamins such as biotin and pantothenic acid have been shown to
contribute to problematic fermentations as seen in Table 4. Pantothenic acid (pantothenate or
vitamin B5) deficient fermentations may lead to H2S production by depletion of metabolic
precursors such as O- acetylserine and O-acetylhomoserine in the SRS pathways responsible for
H2S formation (Wainwright, 1971; Wang, Bohlscheid, & Edwards, 2003). Wainwright (1970)
identified that using Guinness yeast strain 1164 fermentations with less than 160µg L-1 of
pantothenic acid had no H2S formation (Wainwright, 1970). This is in alignment with Edwards
(2007) study that found when using EC1118 and UCD522 yeast strains in grape juice, addition
of 200 µg L-1 of pantothenic acid pre-fermentation or early-fermentation and mid-fermentation
(48hr or 96hrs) ceased all H2S production for both yeast strains (Edwards & Bohlscheid, 2007).
Interaction effects between assimilable nitrogen and pantothenic acid were also reported. Wang’s
(2003) study found that when using yeast strains EC1118 and UCD522 that H2S production was
higher in fermentations that contained high concentrations of nitrogen and lower concentrations
of pantothenic acid compared to those that had high nitrogen and high pantothenic acid (Wang et
al., 2003). Bohlscheid (2011) concluded that YAN, biotin, pantothenic acid, and fermentation
temperature affect H2S production by yeast strains EC1118 and UCD 522 and found that the
YAN concentration alone did not significantly affect H2S production (P>0.05) while
fermentation temperature and vitamins (biotin and pantothenic acid) did have significant effects
on H2S production (Jeffri C. Bohlscheid, Osborne, Ross, & Edwards, 2011).

31
Table 4: Fermentation Problems Reported when Vitamin is Deficient in Matrix
Vitamin Reported Problems when
Deficient
Matrix
Tested In Refences
Pantothenic Acid
Vitamin B5
Decrease cell growth
Increase H2S production
Wine
Cider
(Hosono, Ko, & Uemura, 1972)
(Edwards & Bohlscheid, 2007)
(J. C. J. C. Bohlscheid, Osborne, Ross, &
Edwards, 2011)
(Wang et al., 2003)
(Slaughter & McKernan, 1988)
Biotin
Vitamin B7
Decrease in viable yeast cell
count
Decreased fermentation rate
Remaining residual sugars
Increase H2S production
Wine
(Ough, Davenport, & Joseph, 1989)
(J. C. Bohlscheid, Fellman, Wang, Ansen, &
Edwards, 2007)
The research mentioned above demonstrated the importance of understanding the starting
concentrations of vitamins in the apple juice. It is important to evaluate the components that
contribute to the total YAN concentration. Different components that add to YAN concentration
can influence the SRS pathway that leads differing H2S concentrations. Low concentrations of
vitamins can contribute to the problems found in both grapes must and apple juice dependent on
yeast strain used for fermentation.
2.5 Cider Sensory Analysis
Aroma plays a large role in consumer acceptance of fermented beverages. Even with a
quantitative method to measure total H2S production during fermentation, it is still unknown how
the measured H2S values translate to consumer liking and descriptors associated with cider
aroma. Due to the quantitative nature of the method used in this study to measure H2S and the
exclusivity of the method (only H2S was monitored), final H2S values measured is an indication
of the total H2S produced over the entire fermentation time. This may not, however, provide an
accurate or useful representation of the overall aroma from the consumer’s perception. VSCs that
are considered highly volatile (boiling point <90°C) like H2S, are released more easily, and may

32
decrease over time. Other VSCs that are less volatile (boiling point >90°C) such as methionol,
may be present in fermented beverages and attribute to negative off aromas (Moreira et al.,
2002). Other aromas (sulfur containing or not) produced during fermentation should also be
taken into consideration during the evaluation of the cider aroma since H2S is only one of many
aromas that could be produced during fermentation (Rita, Zanda, Daina, & Dalija, 2011; Xu,
Fan, & Qian, 2007), and the production of which has been linked to nitrogen concentration and
composition in the juice. For this reason, sensory evaluation can be used to understand
consumers’ overall liking of the aroma and used to identify descriptors for the cider aroma.
Sensory evaluation is used to evoke, measure, analyze and interpret characteristics of
products based on consumer perception using the five human senses (H. T. Lawless & Heymann,
2012). Conventional sensory evaluation techniques such as Descriptive Analysis (DA) require
highly trained judges that produce a standardized list, known as a lexicon, of descriptors to
describe a group of products. This can be very time consuming and expensive to conduct (H. T.
Lawless & Heymann, 2012). In traditional lexicon generation, panelists need to be trained on the
sample set that is considered the “frame of reference” which is a product category or group of
products being evaluated (Drake & Civille, 2003). For this reason, rapid methods to achieve
similar results with untrained consumers have been developed to evaluate products in a more
time efficient manner. Rapid methods such as Projective Mapping, Check-All-That-Apply
(CATA), Free Sorting Tasks and Flash Profiling can be used to evaluate product properties with
untrained consumers (Dehlholm, Brockhoff, Meinert, Aaslyng, & Bredie, 2012; Dooley, Lee, &
Meullenet, 2010).
In a CATA task, untrained consumers are provided with a list of predetermined attributes
and asked to choose which attributes describe each product. CATA has been used to describe

33
many products and in some cases has provided results similar to traditional DA (Gastón Ares,
Varela, Rado, & Giménez, 2011; Bruzzone, Ares, & Giménez, 2012). One of the main
challenges in CATA method is the development of the attribute list (Varela & Ares, 2012). Some
CATA studies develop a list of attributes using a trained panel of judges, conducting a DA and
developing a lexicon. A lexicon is defined as a standardized vocabulary that helps in the
communication of perceived sensory attribute including flavor, aromas, taste and mouthfeel
(Drake & Civille, 2003; L. Lawless & Civille, 2013; Phetxumphou, Cox, & Lahne, 2020).
CATA lists can be developed from a pre-existing lexicon, or untrained consumers can create a
lexicon using free choice profiling (FCP) (Alencar et al., 2019; Gastón Ares et al., 2011; Dooley
et al., 2010; Phetxumphou et al., 2020). Using a pre-existing lexicon already developed by
trained panelists can be time saving but these lexicons may not exist for the desired product (G.
Ares & Jaeger, 2015; L. Lawless & Civille, 2013). For example, the aroma wheel developed for
wine by Dr. Ann C. Noble could be used to develop a list of attributes to describe wine (Noble et
al., 1987). In the case of hard cider there is no such lexicon of standardized words. It has been
observed that there is confusion among cider consumers when using terms to describe cider
leading indicating the need for more standardized vocabulary (Jamir, Stelick, & Dando, 2020).
Using a frame of reference in conjunction with rapid lexicon development that uses untrained
consumers the development of attributes used for a CATA task becomes less expensive and less
time consuming.
When a pre-existing lexicon is not an option, the development of a lexicon using
untrained panelists and open ended response questions can be used to generate terms. Open
ended responses allows consumers to freely describe the product in their own words free of
restrictions from researchers in the form of providing a list of attributes (Varela & Ares, 2012).

34
The disadvantage of this method is that many different descriptors that may be highly unique to a
given individual and hard to interpret by others may be used to describe the same perceived
attribute making the data more subjective and timing consuming to review after the test (ten
Kleij & Musters, 2003).
In order to create a standard list of attributes, responses from open ended comments can
be analyzed using text analysis (ten Kleij & Musters, 2003). The three phases of text analysis
include 1) breaking up phrases into single words, 2) lemmatization of works and 3) groups word
into synonyms (Lahne, Trubek, & Pelchat, 2013). The third step takes several assessors to
evaluate the lemmatized words separately and group them by similarity. Assessors then meet and
agree on groupings to words to condense the list of attributes to a reasonable number of terms
(Jaeger et al., 2015; Lahne et al., 2013) This method of analyzing free text from open-ended
coments has been used to evaluate free text on products such cheese, milk dessert and apples
(Gastón Ares & Deliza, 2010; Lahne et al., 2013; Symoneaux, Galmarini, & Mehinagic, 2012).
Using this method creates a standardized list that can then be used in a CATA task.
There are several ways to interpret attribute data from CATA tasks. CATA data is usually
transformed into numerical values (0 or 1) to represent checked or uncheck attributes, where 1
represents a checked attribute and 0 represents an unchecked attribute. A common statistical test
used on CATA data is Cochran’s Q test. Cochran’s Q test investigates differences between
treatments applied to the samples using binary outcomes to determine how well each attribute
was discriminated between samples (Varela & Ares, 2008). In other words, Cochran’s Q can be
used to determine whether consumers detected differences between samples for each term
presented in the CATA task (G. Ares & Jaeger, 2015; Meyners, Castura, & Carr, 2013; Varela &
Ares, 2008).

35
A common multivariate analysis applied to CATA data is Correspondence Analysis
(CA), which can be used to evaluate a relationship between checked attributes and products
(Greenacre, 2013). CA uses categorical data collected from CATA tasks to create a contingency
table and displays the data on a two dimensional biplot (Greenacre, 2013). The contingency table
formed from the CATA responses can be organized by rows and columns where rows represent
consumers response to a product and columns represent each attribute (Lahne et al., 2013; ten
Kleij & Musters, 2003). The cell count is the number of times the specific attribute was checked
for that sample (Greenacre, 2013; Lahne et al., 2013).Relationships between the rows and
columns of the contingency table can be evaluated by the chi-square distance (𝑋2-distance). 𝑋2-
distance can be computed by subtracting the expected value from the original value for each
attribute (Greenacre, 2013). Then a simple mathematical transformation of 𝑋2-distance can be
performed so that 𝑋2-distance can be accurately represented in plain ordinary space on the biplot
(Greenacre, 2013; Varela & Ares, 2008). The total inertia, which is a measure of how much
variance is in the contingency table, is also used in the visualization the biplot to determines the
spread of the points in the represented two dimensions. The higher the total inertia the greater the
association between the rows and columns (Greenacre, 2013). The resulting graph of the 𝑋2-
distance and the total inertia of the contingency table gives a visual representation of the
differences of the two variables applied to the samples(Greenacre, 2013; Varela & Ares, 2008).
From the CA biplot, product descriptions can be suggested based off the most commonly
selected attribute associated with the product.
Hedonic liking is often used in conjunction with a CATA task There are several ways to
test liking, but the most commonly used method is using a 9-point hedonic scales with 9 equally
spaced points anchored go from “Like Extremely” to “Dislike Extremely” with “Neither Dislike

36
nor Like” as the middle point. The 9-point scale has been widely used to evaluate product
liking(H. T. Lawless & Heymann, 2012). For analysis of hedonic liking data, each of the 9-
points on the scale are assigned a value of one through nine with nine being “like extremely”.
Sensory evaluation can be used to give insight on which sensory attributes are associated
with a products and connect those attrbiures to overall liking for that product. In this project
sensory evaluation can be used to understand how yeast nutrients, H2S and aroma effect
consumer perception of cider aroma as well as giving insight on liking of the product. The
generation of a lexicon by untrained consumers rather than trained judges for a specific group of
ciders could achieve a more accurate representation of the descriptors to be used in a CATA task.
Lexicon generation using untrained consumers followed by CATA task was used in the
experiment to generate a list of descriptors that represents the specific group of cider samples.
2.6 Conclusion
Pre-fermentation additions such as sugar, SO2, tannins, and yeast nutrients to juice are
often chosen by the cider or wine maker depending on the style of the finished product and
chemistry of the starting juice or must. All pre-fermentation additions can influence fermentation
outcomes and a wide diversity of different style products result from the differences. Cider
makers should carefully consider what pre-fermentation additions are used when producing cider
due to these effects on cider outcomes. Cider markers should also consider what type of starting
juice to ferment there are pros and cons to both fresh juice and AJC. Fresh juice must be
fermented quickly and cannot be stored for long periods of time like AJC, but AJC can contain
Maillard browning products that could inhibit yeast fermentation and lack amino acids which
could lead to off aromas like H2S.

37
The presence of H2S can have a large effect on consumer acceptance of fermented
beverages, including cider. Many factors affect how much H2S is formed. Yeast strain selection,
nutrient availability in juice and total YAN, vitamin availability and type of juice being used
during fermentation are all known to contribute to H2S formation in wine fermentation but the
vast majority of research investigating H2S formation is in grape juice or must, which limits the
knowledge when applied to cider matrix. Differences in in polyphenols, tannins, sugar content,
nutrient availability, pH, amino acids among many other matrix differences needs to be taken
into consideration while considering H2S formation in cider. The need to study H2S in cider
matrix is of importance because of the growth in cider production and popularity. Research in a
wine must is a good starting point for cider research but cannot be applied directly without the
possibility of differences due to the nature of the two starting matrixes. The purpose of this
research is to explore how nitrogen source, timing of nitrogen source and yeast strain affect total
production of H2S, fermentation duration, cider chemistry and quality of cider aroma.

38
2.7 References Abdi, H., & Williams, L. J. (2008). Partial Least Squares Methods: Partial Least Squares
Correlation and Partial Least Square Regression. In Computational Toxicology (Vol. 27, pp.
258–284). https://doi.org/10.1007/978-1-62703-059-5
Acar, J., Gökmen, V., & Taydas, E. E. (1998). The effects of processing technology on the
patulin content of juice during commercial apple juice concentrate production. European
Food Research and Technology, 207(4), 328–331.
Acree, T. E., Sonoff, E. P., & Splittstoesser, D. F. (1971). Determination of Hydrogen Sulfide in
Fermentation Broths Containing SO2. Applied Microbiology, 22, 110–112. Retrieved from
http://aem.asm.org/
Adnan, A., Mushtaq, M., & Islam, T. ul. (2017). Fruit Juice Concentrates. In G. Rajauria & B. K.
Tiwari (Eds.), Fruit Juices: Extraction, Composition, Quality and Analysis (pp. 217–240).
Elsevier. https://doi.org/10.1016/B978-0-12-802230-6.00012-6
Alencar, N. M. M., Ribeiro, T. G., Barone, B., Barros, A. P. A., Marques, A. T. B., & Behrens, J.
H. (2019). Sensory profile and check-all-that-apply (cata) as tools for evaluating and
characterizing syrah wines aged with oak chips. Food Research International, 124(August
2018), 156–164. https://doi.org/10.1016/j.foodres.2018.07.052
Alexandre, H., & Charpentier, C. (1998). Biochemical aspects of stuck and sluggish fermentation
in grape must. Journal of Industrial Microbiology & Biotechnology, 20, 20–27. Retrieved
from https://link.springer.com/content/pdf/10.1038%2Fsj.jim.2900442.pdf
Andújar-Ortiz, I., Chaya, C., Martín-Álvarez, P. J., Moreno-Arribas, M. V., & Pozo-Bayón, M.
A. (2014). Impact of using new commercial glutathione enriched inactive dry yeast
oenological preparations on the aroma and sensory properties of wines. International
Journal of Food Properties, 17(5), 987–1001.
https://doi.org/10.1080/10942912.2012.685682
Ángeles Pozo-Bayón, M., Andújar-Ortiz, I., & Moreno-Arribas, M. V. (2009). Scientific
evidences beyond the application of inactive dry yeast preparations in winemaking. Food
Research International, 42(7), 754–761. https://doi.org/10.1016/J.FOODRES.2009.03.004
Ares, G., & Jaeger, S. R. (2015). Check-all-that-apply (CATA) questions with consumers in
practice: Experimental considerations and impact on outcome. Rapid Sensory Profiling
Techniques and Related Methods: Applications in New Product Development and
Consumer Research. Woodhead Publishing Limited.
https://doi.org/10.1533/9781782422587.2.227
Ares, Gastón, & Deliza, R. (2010). Studying the influence of package shape and colour on
consumer expectations of milk desserts using word association and conjoint analysis. Food
Quality and Preference, 21(8), 930–937. https://doi.org/10.1016/j.foodqual.2010.03.006
Ares, Gastón, Varela, P., Rado, G., & Giménez, A. (2011). Identifying ideal products using three
different consumer profiling methodologies. Comparison with external preference mapping.
Food Quality and Preference, 22(6), 581–591.
https://doi.org/10.1016/j.foodqual.2011.04.004

39
Babsky, N. E., Toribio, J. L., & Lozano, J. E. (1986). Influence of Storage on the Composition of
Clarified Apple Juice Concentrate. Journal of Food Science, 51(3), 564–567.
https://doi.org/10.1111/j.1365-2621.1986.tb13879.x
Bamforth, C. W. (2005). Food, Fermentation and Micro-organisms Blackwell Science. Retrieved
from www.blackwellpublishing.com
Banerjee, N., Bhatnagar, R., & Viswanathan, L. (1981a). Development of resistance in
Saccharomyces cerevisiae against inhibitory effects of Browning reaction products. Enzyme
Microbial Technology, 3(1), 24–28. https://doi.org/10.1016/0141-0229(81)90030-2
Banerjee, N., Bhatnagar, R., & Viswanathan, L. (1981b). Inhibition of glycolysis by furfural in
Saccharomyces cerevisiae. European Journal of Applied Microbiology and Biotechnology,
11(4), 226–228. https://doi.org/10.1007/BF00505872
Bekker, M. Z., Smith, M. E., Smith, P. A., & Wilkes, E. N. (2016). Formation of Hydrogen
Sulfide in Wine: Interactions between Copper and Sulfur Dioxide. Molecules, 21.
https://doi.org/10.3390/molecules21091214
Bell, S. J., & Henschke, P. A. (2005). Implications of nitrogen nutrition for grapes, fermentation
and wine. Australian Journal of Grape and Wine Research, 11(3), 242–295.
https://doi.org/10.1111/j.1755-0238.2005.tb00028.x
Beltran, G., Esteve-zarzoso, B., Rozes, N., Mas, A., & Guillamo, J. M. (2005). Influence of the
Timing of Nitrogen Additions during Synthetic Grape Must Fermentations on Fermentation
Kinetics and Nitrogen Consumption. Journal of Agricultural and Food Chemistry, 53, 996–
1002. https://doi.org/10.1021/jf0487001
Bengoechea, M. L., Sancho, A. I., Bartolomé, B., Estrella, I., Gómez-Cordovés, C., &
Hernández, M. T. (1997). Phenolic Composition of Industrially Manufactured Purées and
Concentrates from Peach and Apple Fruits. Journal of Agricultural and Food Chemistry,
45(10), 4071–4075. https://doi.org/10.1021/jf9703011
Blanpied, G., & Kenneth, J. (1992). Predicting Harvest Date Windows for Apples. A Cornell
Cooperative Extension.
Blateyron, L., & Sablayrolles, J. M. (2001). Stuck and slow fermentations in enology: statistical
study of causes and effectiveness of combined additions of oxygen and diammonium
phosphate. Journal of Bioscience and Bioengineering, 91(2), 184–189.
https://doi.org/10.1016/S1389-1723(01)80063-3
Bohlscheid, J. C., Fellman, J. K., Wang, X. D., Ansen, D., & Edwards, C. G. (2007). The
influence of nitrogen and biotin interactions on the performance of Saccharomyces in
alcoholic fermentations. Journal of Applied Microbiology, 102(2), 390–400.
https://doi.org/10.1111/j.1365-2672.2006.03180.x
Bohlscheid, J. C. J. C., Osborne, J. P., Ross, C. F., & Edwards, C. G. (2011). Interactive Effects
of Selected Nutrients and Fermentation Temperature on H2S Production By Wine Strains
Of SACCHAROMYCES. Journal of Food Quality, 34(1), 51–55.
https://doi.org/10.1111/j.1745-4557.2010.00365.x
Bohlscheid, Jeffri C., Osborne, J. P., Ross, C. F., & Edwards, C. G. (2011). Interactive Effects of

40
Selected Nutrients and Fermentation Temperature on H2S Production By Wine Strains Of
SACCHAROMYCES. Journal of Food Quality, 34(1), 51–55.
https://doi.org/10.1111/j.1745-4557.2010.00365.x
Boudreau Iv, T. F., Peck, G. M., Ma, S., Patrick, N., Duncan, S., O’keefe, S. F., & Stewart, A. C.
(2017). Hydrogen sulphide production during cider fermentation is moderated by pre-
fermentation methionine addition. Journal of the Institute of Brewing, 553–561.
https://doi.org/10.1002/jib.449
Boudreau, T. F., Peck, G. M., O’keefe, S. F., & Stewart, A. C. (2017). The interactive effect of
fungicide residues and yeast assimilable nitrogen on fermentation kinetics and hydrogen
sulfide production during cider fermentation. Journal of Food Agriculutre, 97, 693–704.
https://doi.org/10.1002/jsfa.8096
Boudreau, T. F., Peck, G. M., O’Keefe, S. F., Stewart, A. C., & Stewart, A. C. (2018). Free
amino nitrogen concentration correlates to total yeast assimilable nitrogen concentration in
apple juice. Food Science & Nutrition, 6(1), 119–123. https://doi.org/10.1002/fsn3.536
Boulton, R., Singleton, V., Bisson, L., & Kunkee, R. (1997). Principles and Practices of
Winemaking (first). CBS publishers & Distributors.
Broach, J. R. (2012). Nutritional control of growth and development in yeast. Genetics, 192(1),
73–105. https://doi.org/10.1534/genetics.111.135731
Bruzzone, F., Ares, G., & Giménez, A. (2012). Consumers’ texture perception of milk desserts.
II - comparison with trained assessors’ data. Journal of Texture Studies, 43(3), 214–226.
https://doi.org/10.1111/j.1745-4603.2011.00332.x
Buedo, A. ., Elustondo, M. ., & Urbicain, M. . (2000). Amino acid loss in peach juice
concentrate during storage. Innovative Food Science & Emerging Technologies, 1(4), 281–
288. https://doi.org/10.1016/S1466-8564(00)00030-8
Butzke, C .E., & Park, S. K. (2011). Impact of Fermentation Rate Changes on Potential
Hydrogen Sulfide Concentrations in Wine. Journal of Microbiology and Biotechnology,
21(5), 519–524. https://doi.org/10.4014/jmb.1010.10058
Butzke, Christian E. (1998). Survey of yeast assimilable nitrogen status in musts from California,
Oregon, and Washington. American Journal of Enology and Viticulture, 49(2), 220–224.
Calton, L. J., Gillingwater, S. D., Hammond, G. W., & Cooper, D. P. (2007). ACQUITY UPLC
for the Rapid Analysis of Amino Acids In Wine, 1–4.
Camire, M. E., Camire, A., Krumhar, K., Ellen, M., Camire, A., & Chemical, K. K. (1990).
Chemical and nutritional changes in foods during extrusion. Food Science & Nutrition,
29(1), 35–57. https://doi.org/10.1080/10408399009527513
Chen, Y., Jastrzembski, J. A., & Sacks, G. L. (2017). Copper-Complexed Hydrogen Sulfide in
Wine: Measurement by Gas Detection Tubes and Comparison of Release Approaches.
American Journal of Enology and Viticulture, 68(1), 91–99.
https://doi.org/10.5344/ajev.2016.16024
Davis, P. M., & Qian, M. C. (2011). Progress on Volatile Sulfur Compound Analysis in Wine. In

41
M. C. Qian & X. Fan (Eds.), Volatile Sulfur Compounds in Food. American Chemical
Society. Retrieved from https://pubs.acs.org/sharingguidelines
Dehlholm, C., Brockhoff, P. B., Meinert, L., Aaslyng, M. D., & Bredie, W. L. P. (2012). Rapid
descriptive sensory methods - Comparison of Free Multiple Sorting, Partial Napping,
Napping, Flash Profiling and conventional profiling. Food Quality and Preference, 26(2),
267–277. https://doi.org/10.1016/j.foodqual.2012.02.012
Deniz Bozoglu, M., Ertunc, S., Akay, B., Bursali, N., Vural, N., Hapoglu, H., & Demirci, Y.
(2015). The Effect of Temperature, pH and SO2 on Ethanol Concentration and Sugar
Consumption Rate (SCR) in Apple Wine Process. Journal of The Chemical Society of
Pakistan, 37(03), 431. Retrieved from
https://www.jcsp.org.pk/PublishedVersion/cb131447-6df6-4e29-a097-
0879ace3bbabManuscript no 3, Final Gally Proof of 10352 (Yavuz DEMIRCI).pdf
Dooley, L., Lee, Y. seung, & Meullenet, J. F. (2010). The application of check-all-that-apply
(CATA) consumer profiling to preference mapping of vanilla ice cream and its comparison
to classical external preference mapping. Food Quality and Preference, 21(4), 394–401.
https://doi.org/10.1016/j.foodqual.2009.10.002
Downing, D. L. (1989). Concentration of Apple Juice. In D. L. Downing (Ed.), Processed Apple
Products (pp. 137–166). New York: Van Nostrand Reinhold.
Drake, M. A., & Civille, G. V. (2003). Flavor Lexicons. Comprehensive Reviews in Food
Science and Food Safety, 2(1), 33–40. https://doi.org/doi:10.1111/j.1541-
4337.2003.tb00013.x
Edwards, C. G., & Bohlscheid, J. C. (2007). Impact of pantothenic acid addition on H2S
production by Saccharomyces under fermentative conditions. Enzyme and Microbial
Technology, 41(1–2), 1–4. https://doi.org/10.1016/j.enzmictec.2007.03.002
Ewing, B. L., Peck, G. M., Ma, S., Neilson, A. P., & Stewart, A. C. (2019). Management of
apple maturity and postharvest storage conditions to increase polyphenols in cider.
HortScience, 54(1), 143–148. https://doi.org/10.21273/HORTSCI13473-18
Ewing, B. L., & Rasco, B. A. (2019). Food Safety Modernization Act Produce Safety Rule
Compliance for United States Hard Cider Producers Using Ground-harvested Apples.
HortTechnology, 28(December), 698–705. https://doi.org/10.21273/horttech04096-18
Fairbairn, S., McKinnon, A., Musarurwa, H. T., Ferreira, A. C., & Bauer, F. F. (2017). The
Impact of Single Amino acids on Growth and Volatile aroma production by Saccharomyces
cerevisiae strains. Frontiers in Microbiology, 8(DEC), 1–12.
https://doi.org/10.3389/fmicb.2017.02554
Franco-Luesma, E., Saenze-Navajas, M.-P., Valentin, D., Ballerster, J., Rodrigues, H., &
Ferreira, V. (2016). Study of the effect of H2S, MeSH and DMS on the sensory profile of
wine model solutions by Rate-All-That-Apply (RATA). Food Research International, 87,
152–160. Retrieved from
http://resolver.ebscohost.com.ezproxy.lib.vt.edu/openurl?sid=google&auinit=E&aulast=Fra
nco-
Luesma&atitle=Study+of+the+effect+of+H2S%2C+MeSH+and+DMS+on+the+sensory+pr

42
ofile+of+wine+model+solutions+by+Rate-All-That-
Apply+(RATA)&id=doi%3A10.1016%2Fj.foodres.2
Fuleki, T., Pelayo, E., & Palabay, R. B. (1994). Sugar Composition of Varietal Juices Produced
from Fresh and Stored Apples. Journal of Agricultural and Food Chemistry, 42(6), 1266–
1275. https://doi.org/10.1021/jf00042a003
García-Estévez, I., Alcalde-Eon, C., Puente, V., & Escribano-Bailón, M. T. (2017). Enological
tannin effect on red wine color and pigment composition and relevance of the yeast
fermentation products. Molecules, 22(12). https://doi.org/10.3390/molecules22122046
Giudici, P., & Kunkee, R. E. (1994). The Effect of Nitrogen Deficiency and Sulfur-Containing
Amino Acids on the Reduction of Sulfate to Hydrogen Sulfide by Wine Yeasts. American
Journal of Enology and Viticulture, 45, 107–112. Retrieved from
http://www.ajevonline.org/content/ajev/45/1/107.full.pdf
Gobbi, M., Comitini, F., D’Ignazi, G., & Ciani, M. (2013). Effects of nutrient supplementation
on fermentation kinetics, H2S evolution, and aroma profile in Verdicchio DOC wine
production. European Food Research and Technology, 236(1), 145–154.
https://doi.org/10.1007/s00217-012-1870-0
Greenacre, M. (2013). Correspondence Analysis in Practice (Vol. 53).
https://doi.org/10.1017/CBO9781107415324.004
Guillermin, P., Dupont, N., Le Morvan, C., Le Quéré, J. M., Langlais, C., & Mauget, J. C.
(2006). Rheological and Technological Properties of Two Cider Apple Cultivars. LWT -
Food Science and Technology, 39(9), 995–1000. https://doi.org/10.1016/j.lwt.2006.02.025
Guyot, S., Marnet, N., Sanoner, P., & Drilleau, J.-F. O. (2003). Variability of the Polyphenolic
Composition of Cider Apple (Malus domestica) Fruits and Juices. Agriculture and Food
Chemistry. https://doi.org/10.1021/jf0301798
Hansen, J., Cherest, H., & Kielland-Brandt, M. C. (1994). Two Divergent MET10 Genes, One
from Saccharomyces cerevisiae and One from Saccharomyces carlsbergensis, Encode the
co Subunit of Sulfite Reductase and Specify Potential Binding Sites for FAD and NADPH.
Journal of Bacteriology, 176(19), 6050–6058. Retrieved from
https://www.ncbi.nlm.nih.gov/pmc/articles/PMC196824/pdf/jbacter00037-0182.pdf
Hosono, K., Ko, A., & Uemura, T. (1972). Effect of Pantothenic Acid on Respiratory Activity of
Aerobically Grown Saccharomyces Cerevisiae. Journal of General Applied Microbiology,
18, 189–199.
Huang, C. W., Walker, M. E., Fedrizzi, B., Gardner, R. C., & Jiranek, V. (2017). Hydrogen
sulfide and its roles in Saccharomyces cerevisiae in a winemaking context. FEMS Yeast
Research, 17(6), 1–10. https://doi.org/10.1093/femsyr/fox058
Jackson, D. ., & Lambard, P. . (1993). Environmental and Management Practices Affecting
Grape Composition and Wine Quality - A Review. American Journal of Enology and
Viticulture, 44(4), 409–430.
Jaeger, S. R., Beresford, M. K., Paisley, A. G., Antúnez, L., Vidal, L., Cadena, R. S., … Ares, G.
(2015). Check-all-that-apply (CATA) questions for sensory product characterization by

43
consumers: Investigations into the number of terms used in CATA questions. Food Quality
and Preference, 42, 154–164. https://doi.org/10.1016/j.foodqual.2015.02.003
Jamir, S. M. R., Stelick, A., & Dando, R. (2020). Cross-cultural examination of a product of
differing familiarity (Hard Cider) by American and Chinese panelists using rapid profiling
techniques. Food Quality and Preference, 79(May 2019), 103783.
https://doi.org/10.1016/j.foodqual.2019.103783
Jiao, B., Cassano, A., & Drioli, E. (2004). Recent advances on membrane processes for the
concentration of fruit juices: A review. Journal of Food Engineering, 63(3), 303–324.
https://doi.org/10.1016/j.jfoodeng.2003.08.003
Jiménez-Martí, E., Aranda, A., Mendes-Ferreira, A., Mendes-Faia, A., & del Olmo, M. L.
(2007). The Nature of The Nitrogen Source Added to Nitrogen Depleted Vinifications
Conducted by a Saccharomyces cerevisiae Strain in Synthetic Must Affects Gene
Expression and the Levels of Several Volatile Compounds. Antonie van Leeuwenhoek,
International Journal of General and Molecular Microbiology, 92(1), 61–75.
https://doi.org/10.1007/s10482-006-9135-1
Jiranek, V., Langridge, P., & Henschke, P. A. (1995a). Amino Acid and Ammonium Utilization
by Saccharomyces cerevisiae Wine Yeasts Amino Acid and Ammonium Utilization by
Saccharomyces cerevisiae Wine Yeasts From a Chemically Defined Medium
Saccharomyces cerevisiae Wine Yeasts From a Chemically Defined Medium. American
Journal of Enology and Viticulture, 46(1).
Jiranek, V., Langridge, P., & Henschke, P. A. (1995b). Regulation of Hydrogen Sulfide
Liberation in Wine-Producing Saccharomyces cerevisiae Strains by Assimilable Nitrogen.
Applied and Environmental Microbiology, 61(2), 461–467. Retrieved from
http://aem.asm.org/
Kodur, S. (2011). Effects of juice pH and potassium on juice and wine quality, and regulation of
potassium in grapevines through rootstocks (Vitis): A short review. Vitis - Journal of
Grapevine Research, 50(1), 1–6.
Kus, S., Gogus, F., & Eren, S. (2005). Hydroxymethyl furfural content of concentrated food
products. International Journal of Food Properties, 8(2), 367–375.
https://doi.org/10.1081/JFP-200060257
Lahne, J., Trubek, A. B., & Pelchat, M. L. (2013). Consumer sensory perception of cheese
depends on context: A study using comment analysis and linear mixed models. Food
Quality and Preference, 32, 184–197. https://doi.org/10.1016/j.foodqual.2013.10.007
Lamikanra, O., Inyang, I. D., & Leong, S. (1995). Distribution and Effect of Grape Maturity on
Organic Acid Content of Red Muscadine Grapes. Journal of Agricultural and Food
Chemistry, 43, 3026–3028. https://doi.org/10.1021/jf00060a007
Lawless, H. T., & Heymann, H. (2012). Sensory Evaluation of Food. Sensory Evaluation
Practices (second). https://doi.org/10.1007/978-1-4419-6488-5
Lawless, L., & Civille, G. V. (2013). Developing Lexicons: A Review. Journal of Sensory
Studies, 28(4), 270–281. https://doi.org/10.1111/joss.12050

44
Lea, A. (2015). Craft Cider Making (thrid). The Crowod Press. Retrieved from
https://books.google.es/books?id=Fso6CgAAQBAJ&pg=PT226&lpg=PT226&dq=chitosan
+cider&source=bl&ots=cNkyk8aBBi&sig=05gT3fp_Q44nvhefbIHZD0CIQtY&hl=es&sa=
X&ved=0ahUKEwiWyLDyj6PZAhXFmVkKHdShA7MQ6AEIVTAF#v=onepage&q=chit
osan cider&f=false
Lea, A., & Drilleau, J.-F. (2003). Cidermaking. In Andrew G.H. Lea & J. R. Piggott (Eds.),
Fermented Beverage Production (2nd ed., p. 217). https://doi.org/10.1016/s0924-
2244(00)89080-9
Lea, A. G. H. (1995). Apple Juice. In P. R. Ashurst (Ed.), Production and Packaging of Non-
Carbonated Fruit Juices and Fruit Beverages (2nd ed., pp. 153–193). Retrieved from
https://link.springer.com/content/pdf/10.1007%2F978-1-4615-0949-3.pdf
Li, P., Lee, S., & Hsu, H.-Y. (2011). Review on fruit harvesting method for potential use of
automatic fruit harvesting systems. Procedia Engineering, 23, 351–366.
https://doi.org/10.1016/j.proeng.2011.11.2514
Li, Z., Yuan, Y., Yao, Y., Wei, X., Yue, T., & Meng, J. (2019). Formation of 5-
hydroxymethylfurfural in industrial-scale apple juice concentrate processing. Food Control,
102(March), 56–68. https://doi.org/10.1016/j.foodcont.2019.03.021
Linderholm, A., Dietzel, K., Hirst, M., & Bisson, L. F. (2010). Identification of MET10-932 and
Characterization as an Allele Reducing Hydrogen Sulfide Formation in Wine Strains of
Saccharomyces cerevisiae †. Applied and Environmental Microbiology, 76(23), 7699–7707.
https://doi.org/10.1128/AEM.01666-10
Ljungdahl, P. O., & Daignan-Fornier, B. (2012). Regulation of amino acid, nucleotide, and
phosphate metabolism in Saccharomyces cerevisiae. Genetics, 190(3), 885–929.
https://doi.org/10.1534/genetics.111.133306
Lombardo, C. (2018). Ripe for growth : New operators are expected to introduce new products ,
boosting demand Cider Production in the US About this Industry.
Ma, B., Chen, J., Zheng, H., Fang, T., Ogutu, C., Li, S., … Wu, B. (2015). Comparative
assessment of sugar and malic acid composition in cultivated and wild apples. Food
Chemistry, 172, 86–91. https://doi.org/10.1016/j.foodchem.2014.09.032
Ma, S., Neilson, A. P., Lahne, J., Peck, G. M., O’Keefe, S. F., & Stewart, A. C. (2018). Free
amino acid composition of apple juices with potential for cider making as determined by
UPLC-PDA. Journal of the Institute of Brewing, 124(4), 467–476.
https://doi.org/10.1002/jib.519
Magasanik, B., & Kaiser, C. A. (2002). Nitrogen regulation in Saccharomyces cerevisiae. Gene,
290(1–2), 1–18. https://doi.org/10.1016/S0378-1119(02)00558-9
Manginot, C., Roustan, J. L., & Sablayrolles, J. M. (1998). Nitrogen demand of different yeast
strains during alcoholic fermentation. Importance of the stationary phase. Ezmyes and
Microbioal Technology, 23, 511–517. Retrieved from https://ac.els-
cdn.com/S0141022998000805/1-s2.0-S0141022998000805-main.pdf?_tid=e9da1c13-4317-
4bc7-b71e-84ef63f0fbe3&acdnat=1552060795_e3fb7d28eb5e5fb6258b649a3e9d6094

45
Marchand, S., Gilles de, R., & Bertrand, A. (2000). Approaches to Wine Aroma: Release of
Aroma Compounds from Reactions between Cysteine and Carbonyl Compounds in Wine.
Journal of Agricultural and Food Chemistry, 48, 4890–4895. Retrieved from
https://pubs.acs.org/sharingguidelines
Martins, S. I. F. S., Jongen, W. M. F., & Boekel, M. A. J. S. Van. (2001). A review of Maillard
reaction in food and implications to kinetic modelling. Food Science & Technology, 11,
364–373.
Mendes-Ferreira, A., Mendes-Faia, A., & Leão, C. (2004). Growth and fermentation patterns of
Saccharomyces cerevisiae under different ammonium concentrations and its implications in
winemaking industry. Journal of Applied Microbiology, 97(3), 540–545.
https://doi.org/10.1111/j.1365-2672.2004.02331.x
Mendes-Ferreira, A, Barbosa, C., Inê, A., & Mendes-Faia, A. (2009). The Timing of
Diammonium Phosphate Supplementation of Wine Must Affects subsequent H2S Release
During Fermentation. Journal of Applied Microbiology, 108, 540–549.
https://doi.org/10.1111/j.1365-2672.2009.04457.x
Mendes-Ferreira, A, Mendes-Faia, A., & Leao, C. (2002). Survey of Hydrogen Sulphide
Production by Wine Yeasts. Journal of Food Protection, 65(6), 1033–1037. Retrieved from
https://jfoodprotection.org/doi/pdf/10.4315/0362-028X-65.6.1033
Mendes-Ferreira, Ana, Barbosa, C., Falco, V., Leão, C., & Mendes-Faia, A. (2009). The
production of hydrogen sulphide and other aroma compounds by wine strains of
Saccharomyces cerevisiae in synthetic media with different nitrogen concentrations.
Journal of Industrial Microbiology & Biotechnology, 36(4), 571–583.
https://doi.org/10.1007/s10295-009-0527-x
Mendes-Ferreira, Barbosa, C., Jiménez-Martí, E., Del Olmo, M., & Mendes-Faia, A. (2010). The
Wine Yeast Strain-Dependent Expression of Genes Implicated in Sulfide Production in
Response to Nitrogen Availability. Article in Journal of Microbiology and Biotechnology,
20(9), 1314–1321. https://doi.org/10.4014/jmb.1003.03039
Mestres, M., Busto, O., & Guasch, J. (2000). Analysis of organic sulfur compounds in wine
aroma. Journal of Chromatography A, 881, 569–581. Retrieved from
www.elsevier.com/locate/chroma
Meyners, M., Castura, J. C., & Carr, B. T. (2013). Existing and new approaches for the analysis
of CATA data. Food Quality and Preference, 30(2), 309–319.
https://doi.org/10.1016/j.foodqual.2013.06.010
Milne Fruit Apple Juice Concentrate. (n.d.). Retrieved from https://milnefruit.com/apple.html
Mohebi, M., Babalar, M., Askari, M. A., & Talaei, A. (2017). Effects of Harvest Date on Apple
Fruit Quality at Harvesting and after Cold Storage. International Journal of Horticultural
Science and Technology, 4(1), 21–27. https://doi.org/10.22059/ijhst.2018.210156.134
Moreira, N., Mendes, F., Pereira, O., Guedes de Pinho, P., Hogg, T., & Vasconcelos, I. (2002).
Volatile sulphur compounds in wines related to yeast metabolism and nitrogen composition
of grape musts. Analytica Chimica Acta, 458(1), 157–167. https://doi.org/10.1016/S0003-

46
2670(01)01618-X
Natusch, D. F. S., Sewell, J. R., & Tanner, R. L. (1974). Determination of Hydrogen Sulfide in
Air—An Assessment of Impregnated Paper Tape Methods. Analytical Chemistry, 46(3),
410–415. https://doi.org/10.1021/ac60339a001
Noble, A., ARNOLD, R., BUECHSENSTEIN, J., LEACH, E., SCHMIDT, J., & STERN, P.
(1987). Modification of a standardized system of wine aroma terminology. American
Journal of Enology and Viticulture, 38(2), 143–146.
Ough, C. ., Davenport, M., & Joseph, K. (1989). Effects of Certain Vitamins on Growth and
Fermentation Rate of Several Commercial Active Dry Wine Yeasts. American Journal of
Enology and Viticulture, 40(3), 208–213.
Park, S. K. (2008). Development of a method to measure hydrogen sulfide in wine fermentation.
Journal of Microbiology and Biotechnology, 18(9), 1550–1554.
Parker, M., Smith, P. A., Birse, M., Francis, I. L., Kwiatkowski, M. J., Lattey, K. A., …
Herderich, M. J. (2007). The effect of pre- and post-ferment additions of grape derived
tannin on Shiraz wine sensory properties and phenolic composition. Australian Journal of
Grape and Wine Research, 13(1), 30–37. https://doi.org/10.1111/j.1755-
0238.2007.tb00069.x
Pfeife, P. A., Bonn, G., & Bobletter, O. (1984). Influence of Biomass Degradation Productus on
the Fermentation of Glucose to Ethanl by Sacchromyces Carsbergensis W 32.
Biotechnology Letters, 6(8), 541–546.
Phetxumphou, K., Cox, A. N., & Lahne, J. (2020). Development and Characterization of a
Check-All-That-Apply (CATA) Lexicon for Virginia Hard (Alcoholic) Ciders.
Polydera, A. C., Stoforos, N. G., & Taoukis, P. S. (2003). Comparative shelf life study and
vitamin C loss kinetics in pasteurised and high pressure processed reconstituted orange
juice. Journal of Food Engineering, 60(1), 21–29. https://doi.org/10.1016/S0260-
8774(03)00006-2
Pozo-Bayón, M. Á., Andujar-Ortiz, I., Alcaide-Hidalgo, J. M., Martín-Álvarez, P. J., & Moreno-
Arribas, M. V. (2009). Characterization of commercial inactive dry yeast preparations for
enological use based on their ability to release soluble compounds and their behavior
toward aroma compounds in model wines. Journal of Agricultural and Food Chemistry,
57(22), 10784–10792. https://doi.org/10.1021/jf900904x
Pozo-Bayón, M. Á., Andújar-Ortiz, I., & Moreno-Arribas, M. V. (2009). Volatile profile and
potential of inactive dry yeast-based winemaking additives to modify the volatile
composition of wines. Journal of the Science of Food and Agriculture, 89(10), 1665–1673.
https://doi.org/10.1002/jsfa.3638
Rita, R.-D., Zanda, K., Daina, K., & Dalija, S. (2011). Composition of aroma compounds in
fermented apple juice: effect of apple variety, fermentation temperature and inoculated
yeast concentration. Procedia Food Science, 1, 1709–1716.
https://doi.org/10.1016/j.profoo.2011.09.252
Sablayrolles, J. M., Dubois, C., Manginot, C., Roustan, J. L., & Barre, P. (1996). Effectiveness

47
of combined ammoniacal nitrogen and oxygen additions for completion of sluggish and
stuck wine fermentations. Journal of Fermentation and Bioengineering, 82(4), 377–381.
https://doi.org/10.1016/0922-338X(96)89154-9
Sanchez, B., & Bautista, J. (1988). Effects of furfural and 5-hydroxymethylfurfural on the
fermentation of Saccharomyces cerevisiae and biomass production from Candida
guilliermondii. Enzyme and Microbial Technology, 10(5), 315–318.
https://doi.org/10.1016/0141-0229(88)90135-4
Sanz, M. L., Martínez-Castro, I., & Moreno-Arribas, M. V. (2008). Identification of the origin of
commercial enological tannins by the analysis of monosaccharides and polyalcohols. Food
Chemistry, 111(3), 778–783. https://doi.org/10.1016/j.foodchem.2008.04.050
Scott Laboratories Cider Handbook. (2018). Scott Laboratories.
Selen Burdurlu, H., & Karadeniz, F. (2003). Effect of storage on nonenzymatic browning of
apple juice concentrates. Food Chemistry, 80(1), 91–97. https://doi.org/10.1016/S0308-
8146(02)00245-5
Siebert, T. E., Solomon, M. R., Pollnitz, A. P., & Jeffery, D. W. (2010). Selective determination
of volatile sulfur compounds in wine by gas chromatography with sulfur
chemiluminescence detection. Journal of Agricultural and Food Chemistry, 58(17), 9454–
9462. https://doi.org/10.1021/jf102008r
Slaughter, J. C., & McKernan, G. (1988). The Influence of Pantothenate Concentration and
Inoculum Size on the Fermentation of a Defined Medium By Saccharomyces Cerevisiae.
Journal of the Institute of Brewing, 94(1), 14–18. https://doi.org/10.1002/j.2050-
0416.1988.tb04547.x
Sonni, F., Cejudo Bastante, M. J., Chinnici, F., Natali, N., & Riponi, C. (2009). Replacement of
sulfur dioxide by lysozyme and oenological tannins during fermentation: influence on
volatile composition of white wines. Journal of the Science of Food and Agriculture, 89(4),
688–696. https://doi.org/10.1002/jsfa.3503
Sonni, F., Chinnici, F., Natali, N., & Riponi, C. (2011). Pre-fermentative replacement of sulphur
dioxide by lysozyme and oenological tannins: Effect on the formation and evolution of
volatile compounds during the bottle storage of white wines. Food Chemistry, 129(3),
1193–1200. https://doi.org/10.1016/j.foodchem.2011.05.104
Soubeyrand, V., Luparia, V., Williams, P., Doco, T., Vernhet, A., Ortiz-Julien, A., & Salmon, J.
M. (2005). Formation of Micella Containing Solubilized Sterols During Rehydration of
Active Dry easts Improves Their Fermenting Capacity. Journal of Agricultural and Food
Chemistry, 53(20), 8025–8032. https://doi.org/10.1021/jf050907m
Spayd, S. E., & Andersen-Bagge, J. (1996). Free amino acid composition of grape juice from 12
Vitis vinifera cultivars in Washington. American Journal of Enology and Viticulture, 47(4),
389–402.
Spiropoulos, A., & Bisson, L. F. (2000). MET17 and Hydrogen Sulfide Formation in
Saccharomyces cerevisiae. Applied and Environmental Microbiology, 66(10), 4421–4426.
Retrieved from https://www.ncbi.nlm.nih.gov/pmc/articles/PMC92319/pdf/am004421.pdf

48
Šuklje, K., Antalick, G., Buica, A., Coetzee, Z. A., Brand, J., Schmidtke, L. M., & Vivier, M. A.
(2016). Inactive dry yeast application on grapes modify Sauvignon Blanc wine aroma. Food
Chemistry, 197, 1073–1084. https://doi.org/10.1016/j.foodchem.2015.11.105
Swiegers, J. H., & Pretorius, I. S. (2005). Yeast Modulation of Wine Flavor. Advances in Applied
Microbiology, 57, 131–175. https://doi.org/10.1016/S0065-2164(05)57005-9
Symoneaux, R., Galmarini, M. V., & Mehinagic, E. (2012). Comment analysis of consumer’s
likes and dislikes as an alternative tool to preference mapping. A case study on apples. Food
Quality and Preference, 24(1), 59–66. https://doi.org/10.1016/j.foodqual.2011.08.013
Taherzadeh, M. J., Gustafsson, L., Niklasson, C., & Lidén, G. (2000). Physiological effects of 5-
hydroxymethylfurfural on Saccharomyces cerevisiae. Applied Microbiology and
Biotechnology, 53(6), 701–708. https://doi.org/10.1007/s002530000328
ten Kleij, F., & Musters, P. A. D. (2003). Text analysis of open-ended survey responses: A
complementary method to preference mapping. Food Quality and Preference, 14(1), 43–52.
https://doi.org/10.1016/S0950-3293(02)00011-3
Thomas, C. S., Boulton, R. B., Silacci, M. W., & Gubler, W. D. (1993). The Effect of Elemental
Sulfur, Yeast Strain, and Fermentation Medium on Hydrogen Sulfide Production During
Fermentation. American Journal of Enology and Viticulture, 44(2). Retrieved from
https://www.ajevonline.org/content/ajev/44/2/211.full.pdf?casa_token=iBOC-
45E2JIAAAAA:8pM_gsWOtFZzZyCU5CE_PCOgTSGQtAG23WW6_0kCWTSs-
HNIywSvomiih7cIwdy9J7exk-4YIK8
Thomas, D., & Surdin-Kerjan, Y. (1997). Metabolism of Sulfur Amino Acids in Saccharomyces
cerevisiae. Microbiology and Molecular Biology Reviews, 61(4), 503–532. Retrieved from
https://www.ncbi.nlm.nih.gov/pmc/articles/PMC232622/pdf/610503.pdf
Tree Top Apple Juice Concentrate. (n.d.). Retrieved from
https://foodingredients.treetop.com/fruit-ingredients/fruit-juice-concentrate/apple-juice-
concentrate/
Ugliano, M., Fedrizzi, B., Siebert, T., Travis, B., Magno, F., Versini, G., & Henschke, P. A.
(2009). Effect of nitrogen supplementation and saccharomyces species on hydrogen sulfide
and other volatile sulfur compounds in Shiraz fermentation and wine. Journal of
Agricultural and Food Chemistry, 57(11), 4948–4955. https://doi.org/10.1021/jf8037693
Ugliano, M., & Henschke, P. A. (2009). Yeast and Wine Flavour. In M. V. Moreno-Arribas &
M. C. Polo (Eds.), Wine Chemistry and Biochemistry (pp. 313–393). New York: Springer.
https://doi.org/10.1007/978-0-387-74118-5
Ugliano, M., & Henschke, P. A. (2010). Comparison of three methods for accurate quantification
of hydrogen sulfide during fermentation. Analytica Chimica Acta, 660(1–2), 87–91.
https://doi.org/10.1016/j.aca.2009.09.049
Ugliano, M., Kolouchova, R., & Henschke, P. A. (2010). Occurrence of hydrogen sulfide in wine
and in fermentation: influence of yeast strain and supplementation of yeast available
nitrogen. Journal of Industrial Microbiology & Biotechnology, 38, 423–429.
https://doi.org/10.1007/s10295-010-0786-6

49
Ugliano, M., Kwiatkowski, M., Vidal, S., Capone, D., Siebert, T., Dieval, J. B., … Waters, E. J.
(2011). Evolution of 3-mercaptohexanol, hydrogen sulfide, and methyl mercaptan during
bottle storage of Sauvignon blanc wines. Effect of glutathione, copper, oxygen exposure,
and closure-derived oxygen. Journal of Agricultural and Food Chemistry, 59(6), 2564–
2572. https://doi.org/10.1021/jf1043585
Varela, P., & Ares, G. (2008). Novel techniques in Sensory Characterization and Consumer
Profiling (Vol. 88). https://doi.org/10.1046/j.1474-1644.2003.2314p28_01.x
Varela, P., & Ares, G. (2012). Sensory profiling, the blurred line between sensory and consumer
science. A review of novel methods for product characterization. Food Research
International, 48(2), 893–908. https://doi.org/10.1016/j.foodres.2012.06.037
Verdu, C. F., Childebrand, N., Marnet, N., Lebail, G., Dupuis, F., Laurens, F., … Guyot, S.
(2014). Polyphenol variability in the fruits and juices of a cider apple progeny. Journal of
the Science of Food and Agriculture, 94, 1305–1315. https://doi.org/10.1002/jsfa.6411
Vos, P. J. A., & Gray, R. S. (1978). The Origin and Control of Hydrogen Sulfide During
Fermentation of Grape Must. American Journal of Enology and Viticulture, 30(3), 187–197.
Retrieved from https://www.ajevonline.org/content/ajev/30/3/187.full.pdf
Wainwright, T. (1970). Hydrogen Sulphide Production by Yeast under Conditions of
Methionine, Pantothenate or Vitamin B, Deficiency. Journal of General Microbiology, 61,
19. Retrieved from
https://www.microbiologyresearch.org/docserver/fulltext/micro/61/1/mic-61-1-
107.pdf?expires=1566228268&id=id&accname=guest&checksum=94268E45F987FB9C52
568DE6E06E09AF
Wainwright, T. (1971). Production of H2S by Yeasts: Role of Nutrients. Journal of Applied
Bacteriology, 34(1), 161–171. Retrieved from
https://onlinelibrary.wiley.com/doi/abs/10.1111/j.1365-2672.1971.tb02275.x
Wang, X. D., Bohlscheid, J. C., & Edwards, C. G. (2003). Fermentative activity and production
of volatile compounds by Saccharomyces grown in synthetic grape juice media deficient in
assimilable nitrogen and/or pantothenic acid. Journal of Applied Microbiology, 94(3), 349–
359. https://doi.org/10.1046/j.1365-2672.2003.01827.x
Waterhouse, A. L., Sacks, G. L., & Jeffery, D. W. (2016). Thiols and Related Sulfur
Compounds. Understanding Wine Chemistry, 88–98.
https://doi.org/10.1002/9781118730720.ch10
Wu, J., Gao, H., Zhao, L., Liao, X., Chen, F., Wang, Z., & Hu, X. (2007). Chemical
Compositional Characterization of Some Apple Cultivars. Food Chemistry, 103(1), 88–93.
https://doi.org/10.1016/J.FOODCHEM.2006.07.030
Xia, E.-Q., Deng, G.-F., Guo, Y.-J., & Li, H.-B. (2010). Biological Activities of Polyphenols
from Grapes. International Journal of Molecular Sciences, 11(2), 622.
https://doi.org/10.3390/IJMS11020622
Xu, Y., Fan, W., & Qian, M. C. (2007). Characterization of aroma compounds in apple cider
using solvent-assisted flavor evaporation and headspace solid-phase microextraction.

50
Journal of Agricultural and Food Chemistry, 55(8), 3051–3057.
https://doi.org/10.1021/jf0631732
Ye, M., Yue, T., & Yuan, Y. (2014). Changes in the profle of volatile compounds and amino
acids during cider fermentation using dessert variety of apples. European Food Research
and Technology, 239(1), 67–77. https://doi.org/10.1007/s00217-014-2204-1
Zoecklein, B. W., Fugelsang, K. C., Gump, B. H., & Nury, F. S. (1995). Wine Analysis and
Production.

51
Chapter 3: Complex Yeast Nutrient Addition and Timing of Additions Influence
on Hydrogen Sulfide Production and Aroma in Cider Fermentations
3.1 Introduction Cider, an alcoholic beverage made from apples, is rapidly growing in popularity in the
United States. In 2018, the US had a total of 877 cider producers with cider sales reaching
$520.5 million in 2018 (Lombardo, 2018). With the increased consumption of cider, there is also
an increase in demand for high quality cider. Past decreases in cider sales volume have been
attributed to poor product quality caused by suboptimal processing practices, including poor
nutrient availability for yeast during fermentation (Bamforth, 2005). Cider processing is closely
related to white wine processing, but there are key differences in fruit chemistry between apples
and grapes that may result in poor quality cider when winemaking practices are directly applied
(A. Lea & Drilleau, 2003). One of these key differences is nutrient availability for yeast
fermentation in apple juice.
Saccharomyces cerevisiae is the most used yeast strain for wine and cider fermentation.
Yeast used for alcoholic fermentation, need specific nutrients such as sulfur containing amino
acids, B vitamins, and ammonium ions among other nutrients to ferment juice into
ethanol(Boudreau Iv et al., 2017; Edwards & Bohlscheid, 2007; Jiranek et al., 1995a; Magasanik
& Kaiser, 2002; D. Thomas & Surdin-Kerjan, 1997). Lack of nutrients, including yeast
assimilable nitrogen (YAN), can lead to “stuck” or “sluggish” fermentations which can result in
slow fermentation rates, incomplete fermentation of sugars, production of higher alcohols, low
fatty acid production, and production off flavors or aromas (Abdi & Williams, 2008; Alexandre
& Charpentier, 1998; Bell & Henschke, 2005; Blateyron & Sablayrolles, 2001; J. C. Bohlscheid
et al., 2007; Sablayrolles et al., 1996). One of the most common aroma compounds that causes of
off aromas in cider is hydrogen sulfide (H2S) which is described as “rotten eggs”, “cabbage” or

52
“vegetal” and leads to consumer rejection (Marchand et al., 2000; Waterhouse, Sacks, & Jeffery,
2016). H2S has a very odor detection threshold; the literature suggests it to be as low as 1 µg L-1
and may negatively interact with positive fermentation aromas (Davis & Qian, 2011; Franco-
Luesma et al., 2016; Mestres et al., 2000; Siebert, Solomon, Pollnitz, & Jeffery, 2010). Apples
are naturally low in YAN needed for yeast fermentation and processed apple juices may have
even fewer nutrients available due to amino acids consumption during heat processing (Banerjee
et al., 1981b; Boudreau et al., 2018; Martins et al., 2001).
Many factors contribute to H2S production in wine fermentation. Yeast strain has a large
effect on the potential for H2S production during wine fermentation, due to differences in
metabolic pathways and nutrient demands (Manginot et al., 1998; C. S. Thomas et al., 1993;
Ugliano et al., 2009) among yeast strains. While this phenomenon has been researched for
decades in wine systems, less is known about factors affecting H2S production during cider
fermentation. Yeast nutrient availability been linked to H2S production. In grape juice, the
generally recommend minimum YAN concentration is between 120-140 mg N L-1 and if juice
falls below the range, nitrogen additions are typically recommended. Diammonium phosphate
(DAP), which only consists of ammonium ions, is commonly added to increase YAN and
prevent stuck and slow fermentation, although increasing YAN does not completely safeguard
against H2S formation (C .E. Butzke & Park, 2011; Giudici & Kunkee, 1994; Huang et al., 2017;
Jiranek et al., 1995b; A Mendes-Ferreira et al., 2009; Vos & Gray, 1978; Wainwright, 1971).
Some studies have shown that increasing YAN levels with DAP additions actually increased H2S
production, contrary to the general assumption that this addition would decrease H2S production
(Boudreau Iv et al., 2017; Ana Mendes-Ferreira et al., 2009; Ugliano et al., 2010). With
increasing recent findings challenging the general notion that increasing YAN concentrations

53
decrease H2S, other factors that effect H2S production in fermentation have been explored,
including addition of micronutrients and lipids, and nutrient addition timing strategies, wherein
nutrients are added at different stages during the fermentation, rather than all being added pre-
fermentation(Andújar-Ortiz et al., 2014; Ángeles Pozo-Bayón et al., 2009; “Scott Laboratories
Cider Handbook,” 2018).
Yeast nutrient formulations other than DAP, such as inactive yeast products, are
increasingly used to improve nutrient availability and subsequent wine aroma. These products
contain more than just ammonia ions such as such as proteins, peptides, amino acids, sterols,
fatty acids, vitamins, and minerals (Ángeles Pozo-Bayón et al., 2009). Inactive yeast products
can be made of either inactive yeast, yeast autolysates, yeast cell walls, or yeast extracts and are
suggested to increase fermentation rate and produce positive aroma compounds, but these
products have not been investigated on their ability to lower H2S production.(Ángeles Pozo-
Bayón et al., 2009). These nitrogen rich products could provide more complex nutrients
compared to only ammonia additions in the hope to prevent H2S production but no know
research is available on these nutrient types.
Nutrient addition timing has also been suggested to affect H2S production. It is believed
that H2S is produced during the exponential growth phase after the yeast have consumed the
most preferred nitrogen sources and start to consume lesser preferred sources of nitrogen
(Ugliano et al., 2010). Addition of nutrient during the exponential growth phase is thought to
reduce nitrogen depletion and increase fermentation rate. It has been reported that addition of
DAP during exponential growth phase, decreased fermentation duration and addition of DAP at
72 hours into fermentation produced less H2S than when adding DAP pre-fermentation (Beltran
et al., 2005; A Mendes-Ferreira et al., 2009). Research is limited in this area and further research

54
focused on timing of nutrient additions are needed to elucidate the interaction between timing
and H2S production in cider as well as wine.
Almost all the above cited research has been conducted in wine or synthetic grape juice
mediums. With the increase in cider popularity and production, it is important to have research
focused on apple juice fermentation as opposed to extrapolating research knowledge from grape
must, considering the differences in juice chemistry and the potential effects of these differences
on fermentation outcomes. The complexity of H2S production related to cider nutrient
availability is limited and so is the information on timing. The objective of this study was to
evaluate the effects of four different exogenous nitrogen-rich supplements on H2S production,
fermentation kinetics, and aroma quality for cider fermentation.
3.2 Experimental
3.2.1 Apple Juice
Kroger Brand Frozen 100% Apple Juice Concentrate with vitamin C (Kroger CO.,
Cincinnati, Ohio 45202) was chosen for this study because there are no added sorbates or other
preservatives that would be expected to inhibit yeast growth during fermentation. Ascorbic acid,
or Vitamin C, is not known to affect yeast growth. A total of 150 (354 mL each) cans of frozen
apple juice concentrate (AJC) were mixed together for homogeneity. The proportion of apples
from each country and cultivar are unknown but 54 AJC cans where labeled as “Juice form USA,
China and Poland” and 96 cans were labeled “Juice from USA, China and Ukraine”. Once
mixed, concentrate was poured into pre-sanitized 3.5 gallon plastic buckets and frozen at -20°C
and saved for further use. Upon use, AJC was thawed at 18°C until it could be poured with ease.
AJC was rehydrated with water by adding one part AJC and three parts MilliQ water.
Rehydrated AJC yielded apple juice (AJ) used for fermentation.

55
The following parameters were used to measure unfermented apple juice: pH (probe,
Thermo Scientific ROSS Ultra Triode Electrode Model 107BNUMD, Thermo Fisher Scientific,
Waltham, MA,USA) total soluble solids (Brix Refractometer Model RF10, Extech Instruments
Corporation, Nasgua, NH, USA) titratable acidity (AOAC procedure 962.12 and 936.16), total
YAN consisting of Primary Amino Nitrogen (PAN)(Megazyme PANOPA Enzyme Kit,
Megazyme International, Wicklow, Ireland) and ammonia (rapid) (Megazyme Ammonia ion
(rapid) Enzyme Kit, Megazyme International, Wicklow, Ireland), UPLC amino acid analysis
(ACQUITY UPLC H-Class Bio Amino Analysis, Waters Corporations, Milford, USA) (Calton,
Gillingwater, Hammond, & Cooper, 2007), and total sugars (HPLC method sugar analysis).
3.2.2 Microscale Fermentations
All fermentation treatments were conducted in triplicate. AJC was rehydrated to apple
juice (AJ) as described above and AJ was treated with potassium metabisulfite at 0.8mg L -1 of
molecular SO2 to prevent microbial spoilage (Boulton et al., 1997).A sanitizer solution was used
to sanitize equipment, stoppers, and H2S tubes. Sanitizer was made up each day by mixing 11.36
L of water, 8.00 g of potassium metabisulfite and 12 g of citric acid. Sanitized equipment,
stoppers, and H2S tubes were airdried before use. 200 mL of apple juice was aliquoted into
previously autoclaved 250 mL Erlenmeyer flasks with autoclaved stir bars.
Four yeast nutrients used for this experiment were provided by Lallemand Inc.
(Lallemand Inc. Petaluma, CA). Fermaid K is described by the producers as a blend of inactive
yeast hulls, amino acids from the inactive yeast hulls, sterols, unsaturated fatty acids, DAP,
niacin, calcium pantothenate, folic acid, and thiamine(“Scott Laboratories Cider Handbook,”
2018). Fermaid O is listed as containing inactive yeast hulls rich in organic nitrogen (“Scott
Laboratories Cider Handbook,” 2018). DAP contains inorganic nitrogen in the form of

56
ammonium slats(“Scott Laboratories Cider Handbook,” 2018). Experimental yeast nutrient, not
commercially available, is 35% organic nitrogen and contains 30% of the same nitrogen source
as Fermaid O.(“Scott Laboratories Cider Handbook,” 2018) Reported concentration of total
YAN added by a 25g hL-1 nutrient addition is as follows: Feramid K provide 25 mg N L-1,
Fermaid O provides 10 mg N L-1, and DAP provides 50 mg N L-1.
Each yeast nutrient formulation, four total (Experimental yeast nutrient, Fermaid K,
Fermaid O and DAP), were dissolved in 35°C milliQ water and mixed for 20 minutes. Each
yeast nutrient solution was added either in one single addition or in two split additions. For
single addition treatments, 25 g hL-1 of yeast nutrient was pipetted in one dose pre-fermentation.
For split yeas nutrient addition, half the amount of yeast nutrient (12.5 g hL-1nutrient) was added
pre-fermentation and remaining half (12.5 g hL-1) of yeast nutrient was added during the
fermentation at 1/3 °Brix depletion. Control fermentations received the same amount of water to
substitute for yeast nutrient in other treatments. Each nutrient treatment was fermented with one
of three different yeast strains (EC1118, ICV OKAY and M2). Each yeast strain was rehydrated
for 20 minute and inoculated at 25g hL-1. Treatments were applied in a full factorial design.
To measure H2S over fermentation time (hrs), hydrogen sulfide sampling tubes supplied
by Kitagawa America (Pompton Lakes, New Jersey) were utilized as airlocks to measure total
H2S production as described by Ugliano and Henschke (Ugliano & Henschke, 2010) and by Park
(Park, 2008). Tubes Total H2S production was calculated by taking the sum of all H2S tube
reading over the entire fermentation duration. Two different detector tubes were used based on
preliminary test fermentations: 120SF tubes (50-1,000 ppm) for M2 yeast strain fermentations
and 120SB (6-150 ppm) for EC1118 and ICV OKAY yeast strain fermentations. Via
fermentation-derived CO2 entrainment, H2S reacted with lead acetate or silver nitrate packed

57
silica gel in tubes, resulting in a color change. Tubes were pre-calibrated and color change
readings on tube were recorded in µg L-1 of H2S gas.
After inoculation, both ends of the H2S tubes were broken and placed into the rubber
stopper acting as an airlock. Fermentation flasks were wrapped in parafilm around the stopper to
minimize gas leakage around stopper. Fermentations were carried out at 18°C. Flasks were
stirred at 600 RPM for 5 minutes twice per day. After being stirred, the flasks were weighed to
track CO2 loss and evaluate fermentation progression. When the second addition of yeast nutrient
was added, H2S tubes were removed from stopper, nutrient was added through stopper hole and
H2S tubes was replaced back into stopper. This may have allowed some gas to escape and could
be a source of error for the method. H2S tube concentrations were recorded twice per day and
replaced when approaching maximin range.
Fermentations were considered complete when weight measurements were consistent for
four data points (2 total days). Fermentation performance was also tested by residual sugars
using the D-fructose and D-glucose enzyme kit. Fermentations were considered complete when
there was less than 2 g L-1 of total sugar remaining in the fermentation. Samples were collected
from each individual fermentation in a 50 mL centrifuge tube and frozen at -80°C until further
use.
3.2.3 Cider Chemistry and Nutrient Evaluation
Cider chemistry metrics were measured using analysis described above for apple juice
materials section. In addition to the previously listed chemical analysis, residual sugars (D-
Fructose/ D-Glucose Liquid Ready Reagents (K-FRGLQR) (Assay Kit, Megazyme International,
Wicklow, Ireland) , ethanol content (AOC 984.14 using Gas Chromatography), total H2S (µg L-
1) and total fermentation duration (hours) tracked through CO2 loss.

58
Each yeast nutrient was evaluated for chemical composition including total YAN
consisting of Primary Amino Nitrogen and ammonia ions and amino acid using the same
methods listed above in apple juice materials section. methods
3.2.4 Statistical analysis
All cider chemistry data is reported as mean ± standard error of the mean (SEM) for n=3
analytical replicates. A 3-Way-ANOVA was performed on the influence of three variables (yeast
strain, yeast nutrient type and timing) for pH, TA, residual sugars, total H2S production, total
fermentation duration, and ethanol data. For each data set, there were three yeast strain levels
(M2, EC1118, ICV OKAY), five nutrient type levels (control, K, experimental, O, and DAP) and
two timing of nutrient addition levels (single and split). Significance was defined as 0.05.
Interaction plots were used to evaluate three way interactions effects between yeast strain type,
yeast nutrient type and yeast nutrient timing. Tukey’s HSD was performed as a post hoc test to
evaluate the differences between average means of all chemistry data.
3.2.5 Pilot Scale Fermentation for Sensory Evaluation
Results from previous cider chemical analysis, preliminary sensory evaluation and the
limitation of sensory panelists lead to the selection of specific cider treatments. Two yeast strain
levels (M2 and EC1118), three nutrients (Fermaid O, experimental yeast nutrient and DAP) and
two timing of nutrient additions (single addition and split). Yeast strains were chosen based on
largest differences between total H2S produced in microscale fermentations and the thought that
higher H2S concentration would lead to more off aromas. Yeast nutrients were chosen based on
differences in composition. Experimental yeast nutrient consists of both ammonia ions and
amino acids fractions. Fermaid O only consists of organic nitrogen and DAP is only ammonium
ions. The two timing additions were kept for sensory evaluation because this is the recommended
use of the products. A total of twelve treatments were chosen for evaluation in order to prevent

59
panelist fatigue. Selected treatments were scale up and fermented in triplicate in 1 gallon glass
jugs. Fermentations were conducted in the same manner using a scaled up method based off the
microscale fermentations. Nutrient additions and yeast strains remained the same at 25 g hL-1.
All scale up cider fermentations treatments were conducted in triplicate.
Fermentations were carried out at 18°C and gently hand mixed twice per day.
Fermentation performance was monitored by testing residual sugars using the D-fructose and D-
glucose enzyme kit. Fermentations were considered complete when there was less than 2 g L-1 of
sugar remaining in the fermentation. H2S tube could not be used as airlock for scale up
fermentations due to the pre-calibrated scale of the tubes and the size of the scale up
fermentations. Maximum readings would be reached too quickly before researchers could change
the tubes. To measure H2S produced in scaled up fermentation, H2S of the head space for each
fermentation vessel was measured using a hand pump and a H2S tube (Kitagawa America).Post-
fermentation, the triplicate treatments were combined into a homogeneous lot. The homogenate
was then aliquoted into 375 mL bottles that had previously been purged with nitrogen and
capped. Bottles was stored at 0°C prior to sensory evaluation.
3.2.6 Sensory Evaluation
Sensory analysis was conducted on selected cider formulations to determine differences
in aroma between treatments. The goal was to understand differences in consumer liking and
descriptions of the cider aromas among the treatments. Sensory evaluation was conducted in two
separate parts: lexicon generation and Check-All-That-Apply (CATA) task.
3.2.7 Samples
For both portions of the study, cider samples were evaluated at room temperature and
about 22mLof cider was poured into a black wine glass to conceal any color variation. Sample

60
glasses were covered with a watch glass to concentrate aromas. Samples were labeled with 3
digit blinded code. Each panelist received 6 of the 12 cider samples to prevent sensory fatigue.
The samples were presented in randomized design. Samples for lexicon generation were
presented as a modification of Williams Latin Square designed using R statistical software and
samples for CATA were presented using Series 36 Raghavarao predetermined by Compusense
sensory evaluation software.
3.2.8 Panelists
All panelists were 21 years of age or older and recruited from the Virginia Tech and
Blacksburg area. Each panelist could take part in each part of the test only once. Panelist that
took part in the first portion of the study could participate in the second part of the study. Panelist
were asked to only smell the cider. No consumption of cider was allowed.
3.2.9 Lexicon Generation
For lexicon generation, panelists (N1=45) were presented with a single cider at a time and
asked to remove the watch glass and smell the sample. First for each cider, they were asked to
rate the aroma on based on liking. The 9-point hedonic scale was used with 1 being “dislike
extremely” and 9 being “like extremely”. They were then instructed to smell the cider again and
describe the aroma in their own words posed as an open ended response.
3.2.10 Check-all-that-apply
Data collected from the lexicon generation was used to generate a list of 25 descriptors
presented in the CATA task. For lexicon generation, panelists (N1=63) were presented with a
single cider at a time and asked to remove the watch glass and smell the sample. First for each
cider, they were asked to rate the aroma on based on liking using the same 9-point hedonic scale.
They were then instructed to smell the cider again and asked to select at least one but as many
descriptors from the list of 25 attributes that describe the aroma of the sample. Panelists also had

61
the option to enter attributes in the “other “options when an attribute could not be found on the
list.
3.2.11 Sensory Statistical Analysis
Responses from lexicon generation were compiled and used to generate the list of
attributes for the CATA portion. This was done by the use of classical text analysis (Lahne et al.,
2013; Phetxumphou et al., 2020; Symoneaux et al., 2012). Words that were duplicates were
combined, non-descriptive words were deleted, and synonyms were combine. Words with
similarities were grouped into one word that described the attribute. Analysis was performed
independently by two researchers to minimize bias. Researches met after grouping words
individually and then discussed differences to merge descriptors into one list.
Liking scores collected for CATA task were averaged for each of the induvial ciders and
presented as average liking score ± STD and graphed as a box and whisker plot and Tukey’s
HSD test was used to determine differences between average mean liking scores with
significance set at 0.05. Responses from the CATA study were compiled and analysis using R
statistical software. CATA attribute data was analyzed with correspondence analysis (CA) to
visually represent attributes and ciders(Greenacre, 2013; Meyners et al., 2013).
3.3 Results and Discussion
3.3.1 Starting Juice Chemistry and Yeast Nutrient Evaluation
Primary juice chemistry of initial starting apple juice (AJ) is shown in Table 5. All
parameters for juice chemistry (pH, TA, total YAN, and total sugars) are within the recommend
ranges for cider fermentation (A. Lea & Drilleau, 2003). This specific AJ was chosen for the low
total YAN concentration of 53.16 ± 2.94 mg N L-1 because it is a general representation of YAN
concentrations found in apples and the goal of this research was to evaluate how addition of
yeast nutrient and timing of nutrients, affects H2S production (Boudreau et al., 2018). Ammonia

62
concentration in initial AJ was below the enzymatic kits limit of detection of 0.07 mg N L-1.
Amino acids were measured and is reported in Table 5. AJ was highest in asparagine followed
by aspartate (33.83 ± 0.00 mg L-1 and 10.19 ± 0.00 mg L-1 respectively) with other trace amino
acids present. This amino acids profile is typical of amino acids found in reconstituted apple
juice (Wu et al., 2007; Ye, Yue, & Yuan, 2014).
Table 5. Primary Juice Chemistry of Reconstituted Apple Juice used for all microscale
fermentations and scale up fermentations
Primary Juice Chemistry Average SEM
pH 3.68 0.02
Titratable Acidity
(g L-1 as malic acid equivalents)
4.62 0.03
Ammonia Concentration (mg N L-1) 0.00 0.00
PAN Concentration (mg N L-1) 53.16 2.94
Fructose (g L-1) 57.80 0.70
Glucose (g L-1) 29.56 0.36
Sucrose (g L-1) 9.55 0.12
Total Sugars (g/L) 96.91
Amino Acids (mg L-1) Average SEM
Histidine 0.24 0.01
Asparagine 33.83 0.00
Serine 1.25 0.36
Glutamine 1.18 0.01
Arginine 0.30 0.00
Glycine 0.22 0.00
Aspartate 10.19 0.00
Glutamate 1.72 0.03
Threonine 0.42 0.00
Alanine 1.46 0.02
Gamma Aminobutyric acid 0.63 0.01
Proline 0.32 0.00
Cysteine 0.00 0.00
Lysine 0.00 0.00
Tyrosine 0.22 0.00

63
Methionine 0.11 0.00
Valine 0.31 0.00
Isoleucine 0.42 0.00
Leucine 0.12 0.00
Phenyalanine 0.14 0.00
Yeast nutrient chemistry of all four yeast nutrients are shown in Table 6. Reported total
YAN concentrations in the manufacturer’s handbook are similar to total YAN concentrations
measured via enzymatic kit during nutrient evaluations. Most notably, each yeast nutrient had
different concentrations of PAN and ammonia. Experimental yeast nutrient and Fermaid K
consisted of both ammonia ions and PAN, Fermaid O consisted only of PAN, and DAP is
comprised of ammonia ions. The faction of PAN and ammonia ions each yeast nutrient agrees
with the reported compositions in the manufacturer’s handbook. Amino acids in each yeast
nutrient varied in concentration and presence. Experimental yeast nutrient contained 19 amino
acids and Fermaid O contained 17 amino acids out of 20 amino acids measured. In Fermaid K
only 7 of the 20 amino acids measured amino acids were detected. Each yeast nutrient provided
different levels of amino acids and total YAN concentrations to the AJ. No specific amino acid
information was provided by the manufacturers for the use of comparisons. The Waters
ACQUITY UPLC H-Class Bio Amino Analysis uses a derivatization agent that must not be fully
consumed in the reaction and remain in excess in order to measure amino acids. With the high
levels of ammonia ions, reagent concentration was doubled and may be a source of error for this
method. Additional method development should be conducted to measure amino acids in
samples with high ammonia ions but is beyond the scope of this experiment and paper.

64
Table 6. Yeast Nutrient Composition of all Four Yeast Nutrient in Water
Yeast Nutrient Composition
25g h L-1 total yeast
nutrient in water Fermaid K
Experimental
Yeast Nutrient Fermaid O DAP Average SEM Average SEM Average SEM Average SEM
pH 3.63 0.00 3.63 0.00 3.63 0.00 3.67 0.00
Titratable Acidity
(g L-1 as malic acid
equivalents)
4.59 0.07 4.65 0.05 4.65 0.05 4.59 0.02
Ammonia
Concentration (mg
N L-1)
21.33 0.12 38.25 0.26 0.00 0.00 46.74 6.288
PAN Concentration
(mg N L-1) 3.59 0.71 4.79 0.16 10.02 0.04 0.00 0.00
Amnio Acids
25g h L-1 total yeast
nutrient in water Fermaid K
Experimental
Yeast Nutrient Fermaid O
mg L-1 Average SEM Average SEM Average SEM
Histidine 0.00 0.00 0.10 0.01 0.31 0.00
Asparagine 0.00 0.00 0.24 0.01 0.00 0.00
Serine 0.00 0.00 0.32 0.00 0.58 0.04
Glutamine 0.02 0.06 0.08 0.00 0.28 0.01
Arginine 0.00 0.00 0.26 0.00 0.17 0.03
Glycine 0.00 0.00 0.18 0.00 0.41 0.01
Aspartate 0.00 0.00 0.39 0.00 0.91 0.02
Glutamate 0.00 0.00 0.94 0.01 0.28 0.01
Threonine 0.07 0.01 0.25 0.00 0.56 0.01
Alanine 0.01 0.02 0.52 0.01 0.15 0.01
Gamma
Aminobutyric acid 0.01 0.02 0.14 0.00 0.19 0.00
Proline 0.01 0.02 0.18 0.00 0.52 0.01
Cysteine 2.49 2.13 0.00 0.00 0.00 0.00
Lysine 0.00 0.00 0.37 0.00 0.37 0.00
Tyrosine 0.00 0.00 0.27 0.00 0.32 0.14
Methionine 0.00 0.00 0.27 0.13 2.13 0.85
Valine 0.00 0.00 0.31 0.10 0.39 0.00
Isoleucine 1.91 3.53 0.34 0.00 0.64 0.01
Leucine 0.00 0.01 0.58 0.00 0.33 0.00
Phenyalanine 0.00 0.00 0.61 0.03 0.00 0.00

65
3.3.2 Microscale Cider Chemistry
Cider chemistry parameters (pH, TA, total residual sugars, and ethanol; see
supplementary Table 8) were all measured as indicators of fermentation health and progression.
Ciders were considered complete if residual sugars remaining after fermentation were less than 2
g L-1. All fermentations were considered complete because sugars were below the detectible limit
of the enzymatic kit at 133 mg N L-1. Ethanol content ranged from 6.06% to 6.30% confirming
that alcoholic cider was produced. pH of ciders ranged from 3.53 to 3.67 and titratable acidity
presented in malic acid equivalent ranged from 5.07% to 6.37% malic acid equivalent. Three
way ANOVA results indicated interaction effects (plotted in interaction plot supplementary
Figure 10) between treatment factors. The ranges of percent ethanol, pH, and TA were
significantly different from one another when performing Tukey’s HSD test (𝑝 < 0.05) to test
for significant differences between averages (supplemental data Table 8).In the grander scheme
of cider aroma and cider taste, there is likely little discernable differences between ciders based
off cider chemistry alone. The differences among pH, TA and so on would likely not be of
concern in practical cider maker.
3.3.3 Total H2S Production
A 3-Way-ANOVA was performed on the influence of three variables (Yeast strain, yeast
nutrient type, and timing) on the total H2S production. For total H2S production there was a
significant main effect for both yeast strain and nutrient timing. There were significant
interaction effects between yeast strain and nutrient. All other interactions were not significant.
Interactions plots for total H2S production and total duration (supplemental Figure 11, panel A).
Total H2S concentration (µg L-1) over the entire fermentation duration for all treatments
were grouped by the three treatment variables (yeast strain, yeast nutrient type and timing of
yeast nutrient addition) in order to easily visual treatment effects. Total H2S concentrations

66
across all treatments can be found in supplementary figures (Figure 9). Total H2S concentrations
are presented in bar graphs (mean of triplicate fermentations ± SEM) in Figure 1, Figure 2, and
Figure 3. Ciders in this figure are coded with three letter codes. The first letter represent the yeast
strain (M =M2, E =EC1118 and I= ICV OKAY). The second letter represents the yeast nutrient
(CON = control, K = Fermaid K, E = Experimental, O = Fermaid O and D = DAP). The final
letter will represent the timing of yeast nutrient, (S = single addition and D = split level addition).
In Figure 1, total H2S concentration grouped by yeast strain. It is clear in Figure 1 that
that fermentations with M2 yeast produced the most H2S over all with an average of 525.63 ±
53.31 µg L-1 across all M2 treatments. EC1118 fermentations produced the least H2S on average
118.26 ± 26.33 µg L-1. Surprisingly, ICV OKAY produced more H2S than EC1118 yeast on
average over all treatments (209.26 ± 31.63 µg L-1 vs. 118.26 ± 23.33 µg L-1 respectively). ICV
OKAY is considered “no/low H2S producing yeast strain” when used in wine. This yeast strain
may have specific nutrient requirements that were absent in the AJ matrix such as B vitamins,
higher concentration of total YAN or other juice chemistry differences compared to grape juice
(Jeffri C. Bohlscheid et al., 2011; Lamikanra et al., 1995; Wu et al., 2007; Xia et al., 2010).
When observing total H2S production, Figure 1 shows that yeast nutrient type did not affect H2S
production of ciders fermented with ICV OKAY but had a significant effect on H2S production
in cider fermented with M2 and EC1118 yeast strain. Within M2 yeast strain MCD, MES, and
MCS produced the least H2S. Within EC1118 yeast strain EED, EED, and EDS produced the
least H2S. It has been demonstrated by many others that yeast strain has are large effect on
determining amount of H2S produced (Manginot et al., 1998; A Mendes-Ferreira, Mendes-Faia,
& Leao, 2002; Ana Mendes-Ferreira et al., 2009; Ugliano et al., 2009). Different yeast also
require different nutrients which can explain why nutrient type influenced H2S production on M2

67
and EC1118 but not ICV OKAY. Fermentation with ICV OKAY yeast strain may not have
received the required nutrients from the tested yeast nutrients (Fairbairn et al., 2017; Gobbi et al.,
2013; Ljungdahl & Daignan-Fornier, 2012). No yeast nutrient reduced H2S production
consistently across all yeast strains, suggesting that yeast nutrient should be selected based off of
the yeast strain used rather than a one-size-fits-all yeast nutrient.
Figure 1: Total H2S Production Grouped by Different Yeast Strains used for Fermentation.
Tukey’s HSD test was preformed to product letter groupings. If any one letter is shared between
a bar there is no significant difference between the means. No common letter identifies
significant difference at α = 0.05.
In Figure 2, total H2S concentrations are grouped by yeast nutrient type to clearly visually
nutrient effect on H2S production across all yeast trains. M2 yeast strain produced the highest
levels of concentration regardless of the nutrient type added followed by ICY OKAY treatments.
Yeast strain effect could not be overcome by nutrient type addition in this experiment. The
highest concentration of H2S produced and the worst treatment combinate of yeast trains and
nutrient type was MED (716.66 ± 72.6 µg L-1). The lowest H2S production and best treatment
combination was EED (50.66 ± 13.96 µg L-1).

68
Figure 2:Total H2S Produced (µg L-1) Grouped by Type of Yeast Nutrient Used. Tukey’s HSD
test was preformed to product letter groupings. If any one letter is shared between a bar there is
no significant difference between the means. No common letter identifies significant difference
at α = 0.05.
In Figure 3 total H2S concentrations are grouped by yeast nutrient timing. Figure 3
suggests that timing of yeast nutrient did not significantly lower H2S production between all
treatments and in one case split nutrient addition increased total H2S between MES and MED
(Figure2 panel A). This could be due to the concentration of yeast nutrient used and the total
amount of YAN in each cider treatment. The suggested minimum amount of YAN in grape must
for a complete fermentation is between 120-140 N mgL-1 in starting matrix, although some have
suggested even higher concentration of nitrogen of 267 mg N L-1 or 350 mg N L-1 (Alexandre &
Charpentier, 1998; A. Mendes-Ferreira et al., 2004). The nutrient treatment with the highest level

69
of YAN in this experiment was DAP, which raised the total YAN to about 103 mg N L-1, far
below the minimum amount recommended.
Figure 3: Total H2S Produced (µg L-1) Grouped by Timing of Yeast Nutrient. Tukey’s HSD test
was preformed to product letter groupings only within single and split nutrient timing of specific
treatments. If any one letter is shared between a bar there is no significant difference between the
means. No common letter identifies significant difference at α = 0.05.
With multiple interacting factors on total H2S production determination the most
influential predictors factors to provide better understanding of factors was desired. Partition
trees were made to identify the most important predictor factors for H2S production (Figures 4).
Figure 4, the partition tree for total H2S, indicates the most important factor for total H2S
production was yeast strain, as indicated by the first split in the tree followed by nutrient type
indicated in the split in the tree within yeast strain nodes. This figure demonstrates that yeast
strain was the most important deciding factor for total H2S production. This is not surprising as it
has been reported that yeast strain plays a large role in H2S formation (Manginot et al., 1998; C.
S. Thomas et al., 1993; Ugliano et al., 2009). This also suggests that yeast strains could
potentially be paired with specific yeast nutrients to provide optimal nutrient availability
depending on the yeast strain. For example, if a cider producer wishes to use ICV OKAY yeast,

70
DAP or experimental yeast nutrient be used in rather than Fermaid K or Fermaid O. These yeast
strain and nutrient type combination would likely yield lower overall total H2S production.
Different nutrient and yeast strain combinations can be further explored in cider research to
provide optimization of nutrient additions.
Figure 4: Partition tree for total H2S (µg L-1) production. Each split line represents the split
value of the tree that shows where the predictor is less (splits left) or higher than the predictor
value (split right side) ultimately leading to the final leaves (bottom blue boxes). Predictor values
not shown. The percentage presented in each leaf, represents the total percent of observations
included in that leaf. The numerical value presented is the average H2S (µg L-1) production of
observations included in the leaf.

71
3.3.4 Results for Total Fermentation Duration
For total fermentations duration (hrs) was also evaluated in microscale fermentations. A
3-Way-ANOVA was performed on the influence of three variables (Yeast strain, yeast nutrient
type, and timing) on total fermentation duration. The main effect of yeast nutrient type and yeast
nutrient timing was significant. The interaction effect between yeast strain and nutrient type was
significant. The remaining interactions were not significant. Interactions plots for both total H2S
production and total duration (supplemental data Figure 11, panel B). Interaction effects are not
surprising due to the complex nature of yeast fermentation and metabolic pathways for H2S
production.
Figure 5 shows the total fermentation duration of all cider treatment. The longest
fermentation, EDS, reached completion in and average of 312 hours while the shortest, MDD,
completed in an average of 240 hours. The difference between these two fermentations is about
72 hours (3 days). To determine which factors were most relevant for producing fermentation
duration, a partition tree was made. Figure 6, the partition tree for total fermentation duration,
shows that the most important factor for duration of fermentation was yeast nutrient type,
followed by timing of addition. When considering how to ferment cider, producers should
consider the tradeoffs between H2S production and total duration of fermentation. If shortening
the fermentation time is most concerning, then producers should consider what type of yeast
nutrients they would like to use, although in practical cider making a 3 day difference between
cider fermentation times may be insignificant. If aroma and reduction of H2S are the main
priority for the producer then yeast strain should be the highest consideration.

72
Figure 5: Total Fermentation Duration (hrs). Three way ANOVA with Tukey’s HSD test was
preformed to product letter groupings. If any one letter is shared between a bar there is no
significant difference between the means. No common letter identifies significant difference at α
= 0.05.
Figure 6: Partition tree for total fermentation duration (hrs) production. Each split line
represents the split value of the tree that shows where the predictor is less (splits left) or higher
than the predictor value (split right side) ultimately leading to the final leaves (bottom blue
boxes). Predictor values not shown. The percentage presented in each leaf, represents the total

73
percent of observations included in that leaf. The numerical value presented is the average
duration of fermentation (hrs) production of observations included in the leaf.
3.3.5 Aroma Results
A total of 375 descriptors were obtained from lexicon generation. After classical text
analysis, a final list of 25 descriptors were derived and used in the CATA study as seen in the
CATA contingency table in Table 7. The attributes represent the scaled cider samples from this
study rather than all ciders on the market. The attributes are helpful to understand what aromas
are produced the treatment variables chosen. The most frequently used aroma term in the CATA
study were apple and alcohol followed by fruit, sweet and wine-like as seen in Table 7. The
aroma descriptors used the least to describe this sample set were vegetal and meaty. Sulfur was
checked a total of 37 times with it being selected the most for MED.

74
Table 7: Contingency Table from Check-All-That-Apply (CATA) Task of Selected Cider
Treatments with Variations of Yeast Strain, Yeast Nutrient and Timing of Yeast Nutrient.
Cider Treatments Evaluated
Aroma MES MOS MDS MED MOD MDD EES EOS EDS EED EOD EDD Total
Apple 8 17 17 9 15 11 12 11 18 7 17 8 150
Sweet 6 14 16 10 8 6 9 8 15 9 11 9 121
Sour 7 7 6 7 4 9 10 5 7 8 5 8 83
Alcohol 11 11 17 14 17 13 10 11 13 12 12 9 150
Fruit 12 13 13 10 8 13 9 9 13 9 15 8 132
Rotten 2 1 3 4 4 0 3 3 4 1 3 7 35
Sulfur 2 2 2 6 3 3 2 3 4 3 4 3 37
Wine Like 12 9 15 10 11 8 8 8 11 10 8 11 121
Floral 2 10 7 1 4 6 5 2 4 4 6 5 56
Musty 11 5 6 11 6 7 10 8 7 8 6 8 93
Earthy 6 4 5 3 5 8 9 8 4 4 2 4 62
Chemical 6 3 3 4 2 7 5 1 2 2 1 4 40
Candy 2 5 6 2 1 1 3 2 5 2 3 3 35
Vinegar 3 5 4 5 4 3 11 5 3 7 4 4 58
Green
Apple 4 5 8 8 4 5 6 3 7 4 6 5 65
Grape 5 7 5 4 2 5 3 2 6 5 4 5 53
Vegetal 0 2 2 3 3 2 2 3 1 3 3 1 25
Meaty 4 0 1 1 3 3 4 2 0 2 3 3 26
Bready 4 0 3 7 5 5 4 5 0 1 5 2 41
Ripe 4 5 4 1 5 5 4 6 5 1 4 4 48
Band-Aid 1 3 0 4 1 2 3 6 3 2 1 0 26
Yeasty 5 4 8 8 8 5 4 5 6 7 6 7 73
Astringent 5 2 2 3 3 4 5 3 5 2 3 1 38
Juicy 1 6 6 2 2 6 5 6 7 2 1 5 49
Metallic 2 4 3 1 3 2 2 3 2 2 1 4 29
Other 2 2 0 1 2 5 1 2 1 5 1 1 23
Average liking of each cider aroma was calculated and tested for Tukey’s HSD (𝑝 <
0.05) and graphically presented in Figure 7. MOS average liking score was significantly
different from MED, EOD, MES, and EES average liking score as seen in Figure 7 represented
by treatment not sharing grouping letters. The remaining ciders were not significantly different
from any of the other cider average liking scores. The highest average liking was 6.42 ± 1.65 SD

75
for MOS which is in the range of “like slightly” and the lowest average liking of cider aromas
was 5.00 ± 1.84 SD for EES which corresponds to “neither like nor dislike”. Average liking
scores suggest that panelists were indifferent about the cider aromas over the whole sample set.
Figure 7: Selected sensory ciders were evaluated for aroma overall liking. Box and whisker plots
represent the average liking score for specific ciders. Interquartile ranges, median and minimum
and maximum ranges are included for each cider. Ciders were presented to panelist with a an
incomplete block design and as a results each cider was evaluated different total number of times
an replicates values (n) are as followed: EED(), EDS (n = 32), EES (n = 30), EOS (n = 32), EDD
(n=31), EED (n=31), EOD (n = 32), MDS (n = 32), MES (n = 32), MOS= 31, MDD (n = 32),
MED (n = 32), and MOD (n= 32).
Figure 8 depicts attributes checked for each cider in a correspondence analysis (CA)
symmetrical biplot. A total of 51.92% of variance was explained by the first two dimensions in
the CA. Dimension 1 separates meaty from candy and chemical from floral attributes while
dimension 2 separates rotten from floral/chemical aroma attribute. Descriptors in the same

76
direction as a plotted cider signify aromas associated with that cider. For example, MOS is in the
same direction as descriptors “floral” and “candy”. Figure 8 shows little indication of cider
aromas being groups by any treatment used in this study (yeast strain, yeast nutrient type or
timing). Regardless of a lack of a clear pattern by treatment, the biplot in Figure 8 indicates that
two ciders, MCD and MOD, were more associated that sulfur and rotten attributes that other
ciders like MOS as seen in the contingency table in Table 3. This could suggest that the
combination of M2 yeast and the split addition of Fermaid O nutrients produced more noticeable
sulfur aromas than other yeast strain and nutrient combinations. Single addition of Fermaid O,
MOS, was more associated with floral, candy and grape attribute which indicated that a single
addition of Fermaid O while using M2 yeast resulted in less sulfur aroma and more commonly
used attributes to wine. Yeast nutrients, yeast type and yeast timing did contribute to different
aromas attributes for each cider but there was not overall most liked cider aroma or clear
grouping of ciders based off attributes for tested treatments.

77
Figure 8: CA Factor Map for Ciders Evaluated by CATA Task.
3.4 Conclusion This study evaluated the effects of four yeast nutrient supplements three of which were
inactive yeast nutrients and the timing of addition of the yeast nutrients on H2S production,
fermentation kinetics and aroma quality in cider fermentation. Yeast strain was the most
influential factor in H2S production. M2 yeast strain produced the highest level of H2S while
EC1118 produced the least. Yeast nutrients only affected H2S production in M2 yeast strain and
ICV OKAY. The most important factor for total fermentation duration was yeast nutrient type
followed by yeast nutrient timing. When evaluating cider aroma, selected ciders used in CATA
sensory study showed no correlation by any variables tested in this study. This study
demonstrates the need for more specific research focused of H2S prevention strategies in cider

78
because wine making practices that are commonly used to prevent H2S production does not
reliably or consistently work in the cider matrix. For practical cider processing, cider makers
should consider selection of yeast strain a prevention strategy for H2S as well as continuing to
consider the historical recommendations for YAN concentration.
Acknowledgments
We would like to thank Grace Earnhart for her help with chemical analysis and fermentation of
the ciders. We would also like to thank Sihui Ma and Ann Sandbrook for their help with amino
acid analysis. We would like to thank Eldon Hurley of the Virginia Tech Enology Service Lab
for running Ethanol content and advising students on analytical methods.
Declaration of Interest Statement
There are no potential conflicts of interest reported by authors.
Funding
This work was funded by Lallemand Inc and VDACS-SCBG.

79
3.5 References Abdi, H., & Williams, L. J. (2008). Partial Least Squares Methods: Partial Least Squares
Correlation and Partial Least Square Regression. In Computational Toxicology (Vol. 27, pp.
258–284). https://doi.org/10.1007/978-1-62703-059-5
Acar, J., Gökmen, V., & Taydas, E. E. (1998). The effects of processing technology on the
patulin content of juice during commercial apple juice concentrate production. European
Food Research and Technology, 207(4), 328–331.
Acree, T. E., Sonoff, E. P., & Splittstoesser, D. F. (1971). Determination of Hydrogen Sulfide in
Fermentation Broths Containing SO2. Applied Microbiology, 22, 110–112. Retrieved from
http://aem.asm.org/
Adnan, A., Mushtaq, M., & Islam, T. ul. (2017). Fruit Juice Concentrates. In G. Rajauria & B. K.
Tiwari (Eds.), Fruit Juices: Extraction, Composition, Quality and Analysis (pp. 217–240).
Elsevier. https://doi.org/10.1016/B978-0-12-802230-6.00012-6
Alencar, N. M. M., Ribeiro, T. G., Barone, B., Barros, A. P. A., Marques, A. T. B., & Behrens, J.
H. (2019). Sensory profile and check-all-that-apply (cata) as tools for evaluating and
characterizing syrah wines aged with oak chips. Food Research International, 124(August
2018), 156–164. https://doi.org/10.1016/j.foodres.2018.07.052
Alexandre, H., & Charpentier, C. (1998). Biochemical aspects of stuck and sluggish fermentation
in grape must. Journal of Industrial Microbiology & Biotechnology, 20, 20–27. Retrieved
from https://link.springer.com/content/pdf/10.1038%2Fsj.jim.2900442.pdf
Andújar-Ortiz, I., Chaya, C., Martín-Álvarez, P. J., Moreno-Arribas, M. V., & Pozo-Bayón, M.
A. (2014). Impact of using new commercial glutathione enriched inactive dry yeast
oenological preparations on the aroma and sensory properties of wines. International
Journal of Food Properties, 17(5), 987–1001.
https://doi.org/10.1080/10942912.2012.685682
Ángeles Pozo-Bayón, M., Andújar-Ortiz, I., & Moreno-Arribas, M. V. (2009). Scientific
evidences beyond the application of inactive dry yeast preparations in winemaking. Food
Research International, 42(7), 754–761. https://doi.org/10.1016/J.FOODRES.2009.03.004
Ares, G., & Jaeger, S. R. (2015). Check-all-that-apply (CATA) questions with consumers in
practice: Experimental considerations and impact on outcome. Rapid Sensory Profiling
Techniques and Related Methods: Applications in New Product Development and
Consumer Research. Woodhead Publishing Limited.
https://doi.org/10.1533/9781782422587.2.227
Ares, Gastón, & Deliza, R. (2010). Studying the influence of package shape and colour on
consumer expectations of milk desserts using word association and conjoint analysis. Food
Quality and Preference, 21(8), 930–937. https://doi.org/10.1016/j.foodqual.2010.03.006
Ares, Gastón, Varela, P., Rado, G., & Giménez, A. (2011). Identifying ideal products using three
different consumer profiling methodologies. Comparison with external preference mapping.
Food Quality and Preference, 22(6), 581–591.

80
https://doi.org/10.1016/j.foodqual.2011.04.004
Babsky, N. E., Toribio, J. L., & Lozano, J. E. (1986). Influence of Storage on the Composition of
Clarified Apple Juice Concentrate. Journal of Food Science, 51(3), 564–567.
https://doi.org/10.1111/j.1365-2621.1986.tb13879.x
Bamforth, C. W. (2005). Food, Fermentation and Micro-organisms Blackwell Science. Retrieved
from www.blackwellpublishing.com
Banerjee, N., Bhatnagar, R., & Viswanathan, L. (1981a). Development of resistance in
Saccharomyces cerevisiae against inhibitory effects of Browning reaction products. Enzyme
Microbial Technology, 3(1), 24–28. https://doi.org/10.1016/0141-0229(81)90030-2
Banerjee, N., Bhatnagar, R., & Viswanathan, L. (1981b). Inhibition of glycolysis by furfural in
Saccharomyces cerevisiae. European Journal of Applied Microbiology and Biotechnology,
11(4), 226–228. https://doi.org/10.1007/BF00505872
Bekker, M. Z., Smith, M. E., Smith, P. A., & Wilkes, E. N. (2016). Formation of Hydrogen
Sulfide in Wine: Interactions between Copper and Sulfur Dioxide. Molecules, 21.
https://doi.org/10.3390/molecules21091214
Bell, S. J., & Henschke, P. A. (2005). Implications of nitrogen nutrition for grapes, fermentation
and wine. Australian Journal of Grape and Wine Research, 11(3), 242–295.
https://doi.org/10.1111/j.1755-0238.2005.tb00028.x
Beltran, G., Esteve-zarzoso, B., Rozes, N., Mas, A., & Guillamo, J. M. (2005). Influence of the
Timing of Nitrogen Additions during Synthetic Grape Must Fermentations on Fermentation
Kinetics and Nitrogen Consumption. Journal of Agricultural and Food Chemistry, 53, 996–
1002. https://doi.org/10.1021/jf0487001
Bengoechea, M. L., Sancho, A. I., Bartolomé, B., Estrella, I., Gómez-Cordovés, C., &
Hernández, M. T. (1997). Phenolic Composition of Industrially Manufactured Purées and
Concentrates from Peach and Apple Fruits. Journal of Agricultural and Food Chemistry,
45(10), 4071–4075. https://doi.org/10.1021/jf9703011
Blanpied, G., & Kenneth, J. (1992). Predicting Harvest Date Windows for Apples. A Cornell
Cooperative Extension.
Blateyron, L., & Sablayrolles, J. M. (2001). Stuck and slow fermentations in enology: statistical
study of causes and effectiveness of combined additions of oxygen and diammonium
phosphate. Journal of Bioscience and Bioengineering, 91(2), 184–189.
https://doi.org/10.1016/S1389-1723(01)80063-3
Bohlscheid, J. C., Fellman, J. K., Wang, X. D., Ansen, D., & Edwards, C. G. (2007). The
influence of nitrogen and biotin interactions on the performance of Saccharomyces in
alcoholic fermentations. Journal of Applied Microbiology, 102(2), 390–400.
https://doi.org/10.1111/j.1365-2672.2006.03180.x
Bohlscheid, J. C. J. C., Osborne, J. P., Ross, C. F., & Edwards, C. G. (2011). Interactive Effects
of Selected Nutrients and Fermentation Temperature on H2S Production By Wine Strains
Of SACCHAROMYCES. Journal of Food Quality, 34(1), 51–55.
https://doi.org/10.1111/j.1745-4557.2010.00365.x

81
Bohlscheid, Jeffri C., Osborne, J. P., Ross, C. F., & Edwards, C. G. (2011). Interactive Effects of
Selected Nutrients and Fermentation Temperature on H2S Production By Wine Strains Of
SACCHAROMYCES. Journal of Food Quality, 34(1), 51–55.
https://doi.org/10.1111/j.1745-4557.2010.00365.x
Boudreau Iv, T. F., Peck, G. M., Ma, S., Patrick, N., Duncan, S., O’keefe, S. F., & Stewart, A. C.
(2017). Hydrogen sulphide production during cider fermentation is moderated by pre-
fermentation methionine addition. Journal of the Institute of Brewing, 553–561.
https://doi.org/10.1002/jib.449
Boudreau, T. F., Peck, G. M., O’keefe, S. F., & Stewart, A. C. (2017). The interactive effect of
fungicide residues and yeast assimilable nitrogen on fermentation kinetics and hydrogen
sulfide production during cider fermentation. Journal of Food Agriculutre, 97, 693–704.
https://doi.org/10.1002/jsfa.8096
Boudreau, T. F., Peck, G. M., O’Keefe, S. F., Stewart, A. C., & Stewart, A. C. (2018). Free
amino nitrogen concentration correlates to total yeast assimilable nitrogen concentration in
apple juice. Food Science & Nutrition, 6(1), 119–123. https://doi.org/10.1002/fsn3.536
Boulton, R., Singleton, V., Bisson, L., & Kunkee, R. (1997). Principles and Practices of
Winemaking (first). CBS publishers & Distributors.
Broach, J. R. (2012). Nutritional control of growth and development in yeast. Genetics, 192(1),
73–105. https://doi.org/10.1534/genetics.111.135731
Bruzzone, F., Ares, G., & Giménez, A. (2012). Consumers’ texture perception of milk desserts.
II - comparison with trained assessors’ data. Journal of Texture Studies, 43(3), 214–226.
https://doi.org/10.1111/j.1745-4603.2011.00332.x
Buedo, A. ., Elustondo, M. ., & Urbicain, M. . (2000). Amino acid loss in peach juice
concentrate during storage. Innovative Food Science & Emerging Technologies, 1(4), 281–
288. https://doi.org/10.1016/S1466-8564(00)00030-8
Butzke, C .E., & Park, S. K. (2011). Impact of Fermentation Rate Changes on Potential
Hydrogen Sulfide Concentrations in Wine. Journal of Microbiology and Biotechnology,
21(5), 519–524. https://doi.org/10.4014/jmb.1010.10058
Butzke, Christian E. (1998). Survey of yeast assimilable nitrogen status in musts from California,
Oregon, and Washington. American Journal of Enology and Viticulture, 49(2), 220–224.
Calton, L. J., Gillingwater, S. D., Hammond, G. W., & Cooper, D. P. (2007). ACQUITY UPLC
for the Rapid Analysis of Amino Acids In Wine, 1–4.
Camire, M. E., Camire, A., Krumhar, K., Ellen, M., Camire, A., & Chemical, K. K. (1990).
Chemical and nutritional changes in foods during extrusion. Food Science & Nutrition,
29(1), 35–57. https://doi.org/10.1080/10408399009527513
Chen, Y., Jastrzembski, J. A., & Sacks, G. L. (2017). Copper-Complexed Hydrogen Sulfide in
Wine: Measurement by Gas Detection Tubes and Comparison of Release Approaches.
American Journal of Enology and Viticulture, 68(1), 91–99.
https://doi.org/10.5344/ajev.2016.16024

82
Davis, P. M., & Qian, M. C. (2011). Progress on Volatile Sulfur Compound Analysis in Wine. In
M. C. Qian & X. Fan (Eds.), Volatile Sulfur Compounds in Food. American Chemical
Society. Retrieved from https://pubs.acs.org/sharingguidelines
Dehlholm, C., Brockhoff, P. B., Meinert, L., Aaslyng, M. D., & Bredie, W. L. P. (2012). Rapid
descriptive sensory methods - Comparison of Free Multiple Sorting, Partial Napping,
Napping, Flash Profiling and conventional profiling. Food Quality and Preference, 26(2),
267–277. https://doi.org/10.1016/j.foodqual.2012.02.012
Deniz Bozoglu, M., Ertunc, S., Akay, B., Bursali, N., Vural, N., Hapoglu, H., & Demirci, Y.
(2015). The Effect of Temperature, pH and SO2 on Ethanol Concentration and Sugar
Consumption Rate (SCR) in Apple Wine Process. Journal of The Chemical Society of
Pakistan, 37(03), 431. Retrieved from
https://www.jcsp.org.pk/PublishedVersion/cb131447-6df6-4e29-a097-
0879ace3bbabManuscript no 3, Final Gally Proof of 10352 (Yavuz DEMIRCI).pdf
Dooley, L., Lee, Y. seung, & Meullenet, J. F. (2010). The application of check-all-that-apply
(CATA) consumer profiling to preference mapping of vanilla ice cream and its comparison
to classical external preference mapping. Food Quality and Preference, 21(4), 394–401.
https://doi.org/10.1016/j.foodqual.2009.10.002
Downing, D. L. (1989). Concentration of Apple Juice. In D. L. Downing (Ed.), Processed Apple
Products (pp. 137–166). New York: Van Nostrand Reinhold.
Drake, M. A., & Civille, G. V. (2003). Flavor Lexicons. Comprehensive Reviews in Food
Science and Food Safety, 2(1), 33–40. https://doi.org/doi:10.1111/j.1541-
4337.2003.tb00013.x
Edwards, C. G., & Bohlscheid, J. C. (2007). Impact of pantothenic acid addition on H2S
production by Saccharomyces under fermentative conditions. Enzyme and Microbial
Technology, 41(1–2), 1–4. https://doi.org/10.1016/j.enzmictec.2007.03.002
Ewing, B. L., Peck, G. M., Ma, S., Neilson, A. P., & Stewart, A. C. (2019). Management of
apple maturity and postharvest storage conditions to increase polyphenols in cider.
HortScience, 54(1), 143–148. https://doi.org/10.21273/HORTSCI13473-18
Ewing, B. L., & Rasco, B. A. (2019). Food Safety Modernization Act Produce Safety Rule
Compliance for United States Hard Cider Producers Using Ground-harvested Apples.
HortTechnology, 28(December), 698–705. https://doi.org/10.21273/horttech04096-18
Fairbairn, S., McKinnon, A., Musarurwa, H. T., Ferreira, A. C., & Bauer, F. F. (2017). The
Impact of Single Amino acids on Growth and Volatile aroma production by Saccharomyces
cerevisiae strains. Frontiers in Microbiology, 8(DEC), 1–12.
https://doi.org/10.3389/fmicb.2017.02554
Franco-Luesma, E., Saenze-Navajas, M.-P., Valentin, D., Ballerster, J., Rodrigues, H., &
Ferreira, V. (2016). Study of the effect of H2S, MeSH and DMS on the sensory profile of
wine model solutions by Rate-All-That-Apply (RATA). Food Research International, 87,
152–160. Retrieved from
http://resolver.ebscohost.com.ezproxy.lib.vt.edu/openurl?sid=google&auinit=E&aulast=Fra
nco-

83
Luesma&atitle=Study+of+the+effect+of+H2S%2C+MeSH+and+DMS+on+the+sensory+pr
ofile+of+wine+model+solutions+by+Rate-All-That-
Apply+(RATA)&id=doi%3A10.1016%2Fj.foodres.2
Fuleki, T., Pelayo, E., & Palabay, R. B. (1994). Sugar Composition of Varietal Juices Produced
from Fresh and Stored Apples. Journal of Agricultural and Food Chemistry, 42(6), 1266–
1275. https://doi.org/10.1021/jf00042a003
García-Estévez, I., Alcalde-Eon, C., Puente, V., & Escribano-Bailón, M. T. (2017). Enological
tannin effect on red wine color and pigment composition and relevance of the yeast
fermentation products. Molecules, 22(12). https://doi.org/10.3390/molecules22122046
Giudici, P., & Kunkee, R. E. (1994). The Effect of Nitrogen Deficiency and Sulfur-Containing
Amino Acids on the Reduction of Sulfate to Hydrogen Sulfide by Wine Yeasts. American
Journal of Enology and Viticulture, 45, 107–112. Retrieved from
http://www.ajevonline.org/content/ajev/45/1/107.full.pdf
Gobbi, M., Comitini, F., D’Ignazi, G., & Ciani, M. (2013). Effects of nutrient supplementation
on fermentation kinetics, H2S evolution, and aroma profile in Verdicchio DOC wine
production. European Food Research and Technology, 236(1), 145–154.
https://doi.org/10.1007/s00217-012-1870-0
Greenacre, M. (2013). Correspondence Analysis in Practice (Vol. 53).
https://doi.org/10.1017/CBO9781107415324.004
Guillermin, P., Dupont, N., Le Morvan, C., Le Quéré, J. M., Langlais, C., & Mauget, J. C.
(2006). Rheological and Technological Properties of Two Cider Apple Cultivars. LWT -
Food Science and Technology, 39(9), 995–1000. https://doi.org/10.1016/j.lwt.2006.02.025
Guyot, S., Marnet, N., Sanoner, P., & Drilleau, J.-F. O. (2003). Variability of the Polyphenolic
Composition of Cider Apple (Malus domestica) Fruits and Juices. Agriculture and Food
Chemistry. https://doi.org/10.1021/jf0301798
Hansen, J., Cherest, H., & Kielland-Brandt, M. C. (1994). Two Divergent MET10 Genes, One
from Saccharomyces cerevisiae and One from Saccharomyces carlsbergensis, Encode the
co Subunit of Sulfite Reductase and Specify Potential Binding Sites for FAD and NADPH.
Journal of Bacteriology, 176(19), 6050–6058. Retrieved from
https://www.ncbi.nlm.nih.gov/pmc/articles/PMC196824/pdf/jbacter00037-0182.pdf
Hosono, K., Ko, A., & Uemura, T. (1972). Effect of Pantothenic Acid on Respiratory Activity of
Aerobically Grown Saccharomyces Cerevisiae. Journal of General Applied Microbiology,
18, 189–199.
Huang, C. W., Walker, M. E., Fedrizzi, B., Gardner, R. C., & Jiranek, V. (2017). Hydrogen
sulfide and its roles in Saccharomyces cerevisiae in a winemaking context. FEMS Yeast
Research, 17(6), 1–10. https://doi.org/10.1093/femsyr/fox058
Jackson, D. ., & Lambard, P. . (1993). Environmental and Management Practices Affecting
Grape Composition and Wine Quality - A Review. American Journal of Enology and
Viticulture, 44(4), 409–430.
Jaeger, S. R., Beresford, M. K., Paisley, A. G., Antúnez, L., Vidal, L., Cadena, R. S., … Ares, G.
84
(2015). Check-all-that-apply (CATA) questions for sensory product characterization by
consumers: Investigations into the number of terms used in CATA questions. Food Quality
and Preference, 42, 154–164. https://doi.org/10.1016/j.foodqual.2015.02.003
Jamir, S. M. R., Stelick, A., & Dando, R. (2020). Cross-cultural examination of a product of
differing familiarity (Hard Cider) by American and Chinese panelists using rapid profiling
techniques. Food Quality and Preference, 79(May 2019), 103783.
https://doi.org/10.1016/j.foodqual.2019.103783
Jiao, B., Cassano, A., & Drioli, E. (2004). Recent advances on membrane processes for the
concentration of fruit juices: A review. Journal of Food Engineering, 63(3), 303–324.
https://doi.org/10.1016/j.jfoodeng.2003.08.003
Jiménez-Martí, E., Aranda, A., Mendes-Ferreira, A., Mendes-Faia, A., & del Olmo, M. L.
(2007). The Nature of The Nitrogen Source Added to Nitrogen Depleted Vinifications
Conducted by a Saccharomyces cerevisiae Strain in Synthetic Must Affects Gene
Expression and the Levels of Several Volatile Compounds. Antonie van Leeuwenhoek,
International Journal of General and Molecular Microbiology, 92(1), 61–75.
https://doi.org/10.1007/s10482-006-9135-1
Jiranek, V., Langridge, P., & Henschke, P. A. (1995a). Amino Acid and Ammonium Utilization
by Saccharomyces cerevisiae Wine Yeasts Amino Acid and Ammonium Utilization by
Saccharomyces cerevisiae Wine Yeasts From a Chemically Defined Medium
Saccharomyces cerevisiae Wine Yeasts From a Chemically Defined Medium. American
Journal of Enology and Viticulture, 46(1).
Jiranek, V., Langridge, P., & Henschke, P. A. (1995b). Regulation of Hydrogen Sulfide
Liberation in Wine-Producing Saccharomyces cerevisiae Strains by Assimilable Nitrogen.
Applied and Environmental Microbiology, 61(2), 461–467. Retrieved from
http://aem.asm.org/
Kodur, S. (2011). Effects of juice pH and potassium on juice and wine quality, and regulation of
potassium in grapevines through rootstocks (Vitis): A short review. Vitis - Journal of
Grapevine Research, 50(1), 1–6.
Kus, S., Gogus, F., & Eren, S. (2005). Hydroxymethyl furfural content of concentrated food
products. International Journal of Food Properties, 8(2), 367–375.
https://doi.org/10.1081/JFP-200060257
Lahne, J., Trubek, A. B., & Pelchat, M. L. (2013). Consumer sensory perception of cheese
depends on context: A study using comment analysis and linear mixed models. Food
Quality and Preference, 32, 184–197. https://doi.org/10.1016/j.foodqual.2013.10.007
Lamikanra, O., Inyang, I. D., & Leong, S. (1995). Distribution and Effect of Grape Maturity on
Organic Acid Content of Red Muscadine Grapes. Journal of Agricultural and Food
Chemistry, 43, 3026–3028. https://doi.org/10.1021/jf00060a007
Lawless, H. T., & Heymann, H. (2012). Sensory Evaluation of Food. Sensory Evaluation
Practices (second). https://doi.org/10.1007/978-1-4419-6488-5
Lawless, L., & Civille, G. V. (2013). Developing Lexicons: A Review. Journal of Sensory

85
Studies, 28(4), 270–281. https://doi.org/10.1111/joss.12050
Lea, A. (2015). Craft Cider Making (thrid). The Crowod Press. Retrieved from
https://books.google.es/books?id=Fso6CgAAQBAJ&pg=PT226&lpg=PT226&dq=chitosan
+cider&source=bl&ots=cNkyk8aBBi&sig=05gT3fp_Q44nvhefbIHZD0CIQtY&hl=es&sa=
X&ved=0ahUKEwiWyLDyj6PZAhXFmVkKHdShA7MQ6AEIVTAF#v=onepage&q=chit
osan cider&f=false
Lea, A., & Drilleau, J.-F. (2003). Cidermaking. In Andrew G.H. Lea & J. R. Piggott (Eds.),
Fermented Beverage Production (2nd ed., p. 217). https://doi.org/10.1016/s0924-
2244(00)89080-9
Lea, A. G. H. (1995). Apple Juice. In P. R. Ashurst (Ed.), Production and Packaging of Non-
Carbonated Fruit Juices and Fruit Beverages (2nd ed., pp. 153–193). Retrieved from
https://link.springer.com/content/pdf/10.1007%2F978-1-4615-0949-3.pdf
Li, P., Lee, S., & Hsu, H.-Y. (2011). Review on fruit harvesting method for potential use of
automatic fruit harvesting systems. Procedia Engineering, 23, 351–366.
https://doi.org/10.1016/j.proeng.2011.11.2514
Li, Z., Yuan, Y., Yao, Y., Wei, X., Yue, T., & Meng, J. (2019). Formation of 5-
hydroxymethylfurfural in industrial-scale apple juice concentrate processing. Food Control,
102(March), 56–68. https://doi.org/10.1016/j.foodcont.2019.03.021
Linderholm, A., Dietzel, K., Hirst, M., & Bisson, L. F. (2010). Identification of MET10-932 and
Characterization as an Allele Reducing Hydrogen Sulfide Formation in Wine Strains of
Saccharomyces cerevisiae †. Applied and Environmental Microbiology, 76(23), 7699–7707.
https://doi.org/10.1128/AEM.01666-10
Ljungdahl, P. O., & Daignan-Fornier, B. (2012). Regulation of amino acid, nucleotide, and
phosphate metabolism in Saccharomyces cerevisiae. Genetics, 190(3), 885–929.
https://doi.org/10.1534/genetics.111.133306
Lombardo, C. (2018). Ripe for growth : New operators are expected to introduce new products ,
boosting demand Cider Production in the US About this Industry.
Ma, B., Chen, J., Zheng, H., Fang, T., Ogutu, C., Li, S., … Wu, B. (2015). Comparative
assessment of sugar and malic acid composition in cultivated and wild apples. Food
Chemistry, 172, 86–91. https://doi.org/10.1016/j.foodchem.2014.09.032
Ma, S., Neilson, A. P., Lahne, J., Peck, G. M., O’Keefe, S. F., & Stewart, A. C. (2018). Free
amino acid composition of apple juices with potential for cider making as determined by
UPLC-PDA. Journal of the Institute of Brewing, 124(4), 467–476.
https://doi.org/10.1002/jib.519
Magasanik, B., & Kaiser, C. A. (2002). Nitrogen regulation in Saccharomyces cerevisiae. Gene,
290(1–2), 1–18. https://doi.org/10.1016/S0378-1119(02)00558-9
Manginot, C., Roustan, J. L., & Sablayrolles, J. M. (1998). Nitrogen demand of different yeast
strains during alcoholic fermentation. Importance of the stationary phase. Ezmyes and
Microbioal Technology, 23, 511–517. Retrieved from https://ac.els-
cdn.com/S0141022998000805/1-s2.0-S0141022998000805-main.pdf?_tid=e9da1c13-4317-
86
4bc7-b71e-84ef63f0fbe3&acdnat=1552060795_e3fb7d28eb5e5fb6258b649a3e9d6094
Marchand, S., Gilles de, R., & Bertrand, A. (2000). Approaches to Wine Aroma: Release of
Aroma Compounds from Reactions between Cysteine and Carbonyl Compounds in Wine.
Journal of Agricultural and Food Chemistry, 48, 4890–4895. Retrieved from
https://pubs.acs.org/sharingguidelines
Martins, S. I. F. S., Jongen, W. M. F., & Boekel, M. A. J. S. Van. (2001). A review of Maillard
reaction in food and implications to kinetic modelling. Food Science & Technology, 11,
364–373.
Mendes-Ferreira, A., Mendes-Faia, A., & Leão, C. (2004). Growth and fermentation patterns of
Saccharomyces cerevisiae under different ammonium concentrations and its implications in
winemaking industry. Journal of Applied Microbiology, 97(3), 540–545.
https://doi.org/10.1111/j.1365-2672.2004.02331.x
Mendes-Ferreira, A, Barbosa, C., Inê, A., & Mendes-Faia, A. (2009). The Timing of
Diammonium Phosphate Supplementation of Wine Must Affects subsequent H2S Release
During Fermentation. Journal of Applied Microbiology, 108, 540–549.
https://doi.org/10.1111/j.1365-2672.2009.04457.x
Mendes-Ferreira, A, Mendes-Faia, A., & Leao, C. (2002). Survey of Hydrogen Sulphide
Production by Wine Yeasts. Journal of Food Protection, 65(6), 1033–1037. Retrieved from
https://jfoodprotection.org/doi/pdf/10.4315/0362-028X-65.6.1033
Mendes-Ferreira, Ana, Barbosa, C., Falco, V., Leão, C., & Mendes-Faia, A. (2009). The
production of hydrogen sulphide and other aroma compounds by wine strains of
Saccharomyces cerevisiae in synthetic media with different nitrogen concentrations.
Journal of Industrial Microbiology & Biotechnology, 36(4), 571–583.
https://doi.org/10.1007/s10295-009-0527-x
Mendes-Ferreira, Barbosa, C., Jiménez-Martí, E., Del Olmo, M., & Mendes-Faia, A. (2010). The
Wine Yeast Strain-Dependent Expression of Genes Implicated in Sulfide Production in
Response to Nitrogen Availability. Article in Journal of Microbiology and Biotechnology,
20(9), 1314–1321. https://doi.org/10.4014/jmb.1003.03039
Mestres, M., Busto, O., & Guasch, J. (2000). Analysis of organic sulfur compounds in wine
aroma. Journal of Chromatography A, 881, 569–581. Retrieved from
www.elsevier.com/locate/chroma
Meyners, M., Castura, J. C., & Carr, B. T. (2013). Existing and new approaches for the analysis
of CATA data. Food Quality and Preference, 30(2), 309–319.
https://doi.org/10.1016/j.foodqual.2013.06.010
Milne Fruit Apple Juice Concentrate. (n.d.). Retrieved from https://milnefruit.com/apple.html
Mohebi, M., Babalar, M., Askari, M. A., & Talaei, A. (2017). Effects of Harvest Date on Apple
Fruit Quality at Harvesting and after Cold Storage. International Journal of Horticultural
Science and Technology, 4(1), 21–27. https://doi.org/10.22059/ijhst.2018.210156.134
Moreira, N., Mendes, F., Pereira, O., Guedes de Pinho, P., Hogg, T., & Vasconcelos, I. (2002).
Volatile sulphur compounds in wines related to yeast metabolism and nitrogen composition

87
of grape musts. Analytica Chimica Acta, 458(1), 157–167. https://doi.org/10.1016/S0003-
2670(01)01618-X
Natusch, D. F. S., Sewell, J. R., & Tanner, R. L. (1974). Determination of Hydrogen Sulfide in
Air—An Assessment of Impregnated Paper Tape Methods. Analytical Chemistry, 46(3),
410–415. https://doi.org/10.1021/ac60339a001
Noble, A., ARNOLD, R., BUECHSENSTEIN, J., LEACH, E., SCHMIDT, J., & STERN, P.
(1987). Modification of a standardized system of wine aroma terminology. American
Journal of Enology and Viticulture, 38(2), 143–146.
Ough, C. ., Davenport, M., & Joseph, K. (1989). Effects of Certain Vitamins on Growth and
Fermentation Rate of Several Commercial Active Dry Wine Yeasts. American Journal of
Enology and Viticulture, 40(3), 208–213.
Park, S. K. (2008). Development of a method to measure hydrogen sulfide in wine fermentation.
Journal of Microbiology and Biotechnology, 18(9), 1550–1554.
Parker, M., Smith, P. A., Birse, M., Francis, I. L., Kwiatkowski, M. J., Lattey, K. A., …
Herderich, M. J. (2007). The effect of pre- and post-ferment additions of grape derived
tannin on Shiraz wine sensory properties and phenolic composition. Australian Journal of
Grape and Wine Research, 13(1), 30–37. https://doi.org/10.1111/j.1755-
0238.2007.tb00069.x
Pfeife, P. A., Bonn, G., & Bobletter, O. (1984). Influence of Biomass Degradation Productus on
the Fermentation of Glucose to Ethanl by Sacchromyces Carsbergensis W 32.
Biotechnology Letters, 6(8), 541–546.
Phetxumphou, K., Cox, A. N., & Lahne, J. (2020). Development and Characterization of a
Check-All-That-Apply (CATA) Lexicon for Virginia Hard (Alcoholic) Ciders.
Polydera, A. C., Stoforos, N. G., & Taoukis, P. S. (2003). Comparative shelf life study and
vitamin C loss kinetics in pasteurised and high pressure processed reconstituted orange
juice. Journal of Food Engineering, 60(1), 21–29. https://doi.org/10.1016/S0260-
8774(03)00006-2
Pozo-Bayón, M. Á., Andujar-Ortiz, I., Alcaide-Hidalgo, J. M., Martín-Álvarez, P. J., & Moreno-
Arribas, M. V. (2009). Characterization of commercial inactive dry yeast preparations for
enological use based on their ability to release soluble compounds and their behavior
toward aroma compounds in model wines. Journal of Agricultural and Food Chemistry,
57(22), 10784–10792. https://doi.org/10.1021/jf900904x
Pozo-Bayón, M. Á., Andújar-Ortiz, I., & Moreno-Arribas, M. V. (2009). Volatile profile and
potential of inactive dry yeast-based winemaking additives to modify the volatile
composition of wines. Journal of the Science of Food and Agriculture, 89(10), 1665–1673.
https://doi.org/10.1002/jsfa.3638
Rita, R.-D., Zanda, K., Daina, K., & Dalija, S. (2011). Composition of aroma compounds in
fermented apple juice: effect of apple variety, fermentation temperature and inoculated
yeast concentration. Procedia Food Science, 1, 1709–1716.
https://doi.org/10.1016/j.profoo.2011.09.252

88
Sablayrolles, J. M., Dubois, C., Manginot, C., Roustan, J. L., & Barre, P. (1996). Effectiveness
of combined ammoniacal nitrogen and oxygen additions for completion of sluggish and
stuck wine fermentations. Journal of Fermentation and Bioengineering, 82(4), 377–381.
https://doi.org/10.1016/0922-338X(96)89154-9
Sanchez, B., & Bautista, J. (1988). Effects of furfural and 5-hydroxymethylfurfural on the
fermentation of Saccharomyces cerevisiae and biomass production from Candida
guilliermondii. Enzyme and Microbial Technology, 10(5), 315–318.
https://doi.org/10.1016/0141-0229(88)90135-4
Sanz, M. L., Martínez-Castro, I., & Moreno-Arribas, M. V. (2008). Identification of the origin of
commercial enological tannins by the analysis of monosaccharides and polyalcohols. Food
Chemistry, 111(3), 778–783. https://doi.org/10.1016/j.foodchem.2008.04.050
Scott Laboratories Cider Handbook. (2018). Scott Laboratories.
Selen Burdurlu, H., & Karadeniz, F. (2003). Effect of storage on nonenzymatic browning of
apple juice concentrates. Food Chemistry, 80(1), 91–97. https://doi.org/10.1016/S0308-
8146(02)00245-5
Siebert, T. E., Solomon, M. R., Pollnitz, A. P., & Jeffery, D. W. (2010). Selective determination
of volatile sulfur compounds in wine by gas chromatography with sulfur
chemiluminescence detection. Journal of Agricultural and Food Chemistry, 58(17), 9454–
9462. https://doi.org/10.1021/jf102008r
Slaughter, J. C., & McKernan, G. (1988). The Influence of Pantothenate Concentration and
Inoculum Size on the Fermentation of a Defined Medium By Saccharomyces Cerevisiae.
Journal of the Institute of Brewing, 94(1), 14–18. https://doi.org/10.1002/j.2050-
0416.1988.tb04547.x
Sonni, F., Cejudo Bastante, M. J., Chinnici, F., Natali, N., & Riponi, C. (2009). Replacement of
sulfur dioxide by lysozyme and oenological tannins during fermentation: influence on
volatile composition of white wines. Journal of the Science of Food and Agriculture, 89(4),
688–696. https://doi.org/10.1002/jsfa.3503
Sonni, F., Chinnici, F., Natali, N., & Riponi, C. (2011). Pre-fermentative replacement of sulphur
dioxide by lysozyme and oenological tannins: Effect on the formation and evolution of
volatile compounds during the bottle storage of white wines. Food Chemistry, 129(3),
1193–1200. https://doi.org/10.1016/j.foodchem.2011.05.104
Soubeyrand, V., Luparia, V., Williams, P., Doco, T., Vernhet, A., Ortiz-Julien, A., & Salmon, J.
M. (2005). Formation of Micella Containing Solubilized Sterols During Rehydration of
Active Dry easts Improves Their Fermenting Capacity. Journal of Agricultural and Food
Chemistry, 53(20), 8025–8032. https://doi.org/10.1021/jf050907m
Spayd, S. E., & Andersen-Bagge, J. (1996). Free amino acid composition of grape juice from 12
Vitis vinifera cultivars in Washington. American Journal of Enology and Viticulture, 47(4),
389–402.
Spiropoulos, A., & Bisson, L. F. (2000). MET17 and Hydrogen Sulfide Formation in
Saccharomyces cerevisiae. Applied and Environmental Microbiology, 66(10), 4421–4426.

89
Retrieved from https://www.ncbi.nlm.nih.gov/pmc/articles/PMC92319/pdf/am004421.pdf
Šuklje, K., Antalick, G., Buica, A., Coetzee, Z. A., Brand, J., Schmidtke, L. M., & Vivier, M. A.
(2016). Inactive dry yeast application on grapes modify Sauvignon Blanc wine aroma. Food
Chemistry, 197, 1073–1084. https://doi.org/10.1016/j.foodchem.2015.11.105
Swiegers, J. H., & Pretorius, I. S. (2005). Yeast Modulation of Wine Flavor. Advances in Applied
Microbiology, 57, 131–175. https://doi.org/10.1016/S0065-2164(05)57005-9
Symoneaux, R., Galmarini, M. V., & Mehinagic, E. (2012). Comment analysis of consumer’s
likes and dislikes as an alternative tool to preference mapping. A case study on apples. Food
Quality and Preference, 24(1), 59–66. https://doi.org/10.1016/j.foodqual.2011.08.013
Taherzadeh, M. J., Gustafsson, L., Niklasson, C., & Lidén, G. (2000). Physiological effects of 5-
hydroxymethylfurfural on Saccharomyces cerevisiae. Applied Microbiology and
Biotechnology, 53(6), 701–708. https://doi.org/10.1007/s002530000328
ten Kleij, F., & Musters, P. A. D. (2003). Text analysis of open-ended survey responses: A
complementary method to preference mapping. Food Quality and Preference, 14(1), 43–52.
https://doi.org/10.1016/S0950-3293(02)00011-3
Thomas, C. S., Boulton, R. B., Silacci, M. W., & Gubler, W. D. (1993). The Effect of Elemental
Sulfur, Yeast Strain, and Fermentation Medium on Hydrogen Sulfide Production During
Fermentation. American Journal of Enology and Viticulture, 44(2). Retrieved from
https://www.ajevonline.org/content/ajev/44/2/211.full.pdf?casa_token=iBOC-
45E2JIAAAAA:8pM_gsWOtFZzZyCU5CE_PCOgTSGQtAG23WW6_0kCWTSs-
HNIywSvomiih7cIwdy9J7exk-4YIK8
Thomas, D., & Surdin-Kerjan, Y. (1997). Metabolism of Sulfur Amino Acids in Saccharomyces
cerevisiae. Microbiology and Molecular Biology Reviews, 61(4), 503–532. Retrieved from
https://www.ncbi.nlm.nih.gov/pmc/articles/PMC232622/pdf/610503.pdf
Tree Top Apple Juice Concentrate. (n.d.). Retrieved from
https://foodingredients.treetop.com/fruit-ingredients/fruit-juice-concentrate/apple-juice-
concentrate/
Ugliano, M., Fedrizzi, B., Siebert, T., Travis, B., Magno, F., Versini, G., & Henschke, P. A.
(2009). Effect of nitrogen supplementation and saccharomyces species on hydrogen sulfide
and other volatile sulfur compounds in Shiraz fermentation and wine. Journal of
Agricultural and Food Chemistry, 57(11), 4948–4955. https://doi.org/10.1021/jf8037693
Ugliano, M., & Henschke, P. A. (2009). Yeast and Wine Flavour. In M. V. Moreno-Arribas &
M. C. Polo (Eds.), Wine Chemistry and Biochemistry (pp. 313–393). New York: Springer.
https://doi.org/10.1007/978-0-387-74118-5
Ugliano, M., & Henschke, P. A. (2010). Comparison of three methods for accurate quantification
of hydrogen sulfide during fermentation. Analytica Chimica Acta, 660(1–2), 87–91.
https://doi.org/10.1016/j.aca.2009.09.049
Ugliano, M., Kolouchova, R., & Henschke, P. A. (2010). Occurrence of hydrogen sulfide in wine
and in fermentation: influence of yeast strain and supplementation of yeast available
nitrogen. Journal of Industrial Microbiology & Biotechnology, 38, 423–429.

90
https://doi.org/10.1007/s10295-010-0786-6
Ugliano, M., Kwiatkowski, M., Vidal, S., Capone, D., Siebert, T., Dieval, J. B., … Waters, E. J.
(2011). Evolution of 3-mercaptohexanol, hydrogen sulfide, and methyl mercaptan during
bottle storage of Sauvignon blanc wines. Effect of glutathione, copper, oxygen exposure,
and closure-derived oxygen. Journal of Agricultural and Food Chemistry, 59(6), 2564–
2572. https://doi.org/10.1021/jf1043585
Varela, P., & Ares, G. (2008). Novel techniques in Sensory Characterization and Consumer
Profiling (Vol. 88). https://doi.org/10.1046/j.1474-1644.2003.2314p28_01.x
Varela, P., & Ares, G. (2012). Sensory profiling, the blurred line between sensory and consumer
science. A review of novel methods for product characterization. Food Research
International, 48(2), 893–908. https://doi.org/10.1016/j.foodres.2012.06.037
Verdu, C. F., Childebrand, N., Marnet, N., Lebail, G., Dupuis, F., Laurens, F., … Guyot, S.
(2014). Polyphenol variability in the fruits and juices of a cider apple progeny. Journal of
the Science of Food and Agriculture, 94, 1305–1315. https://doi.org/10.1002/jsfa.6411
Vos, P. J. A., & Gray, R. S. (1978). The Origin and Control of Hydrogen Sulfide During
Fermentation of Grape Must. American Journal of Enology and Viticulture, 30(3), 187–197.
Retrieved from https://www.ajevonline.org/content/ajev/30/3/187.full.pdf
Wainwright, T. (1970). Hydrogen Sulphide Production by Yeast under Conditions of
Methionine, Pantothenate or Vitamin B, Deficiency. Journal of General Microbiology, 61,
19. Retrieved from
https://www.microbiologyresearch.org/docserver/fulltext/micro/61/1/mic-61-1-
107.pdf?expires=1566228268&id=id&accname=guest&checksum=94268E45F987FB9C52
568DE6E06E09AF
Wainwright, T. (1971). Production of H2S by Yeasts: Role of Nutrients. Journal of Applied
Bacteriology, 34(1), 161–171. Retrieved from
https://onlinelibrary.wiley.com/doi/abs/10.1111/j.1365-2672.1971.tb02275.x
Wang, X. D., Bohlscheid, J. C., & Edwards, C. G. (2003). Fermentative activity and production
of volatile compounds by Saccharomyces grown in synthetic grape juice media deficient in
assimilable nitrogen and/or pantothenic acid. Journal of Applied Microbiology, 94(3), 349–
359. https://doi.org/10.1046/j.1365-2672.2003.01827.x
Waterhouse, A. L., Sacks, G. L., & Jeffery, D. W. (2016). Thiols and Related Sulfur
Compounds. Understanding Wine Chemistry, 88–98.
https://doi.org/10.1002/9781118730720.ch10
Wu, J., Gao, H., Zhao, L., Liao, X., Chen, F., Wang, Z., & Hu, X. (2007). Chemical
Compositional Characterization of Some Apple Cultivars. Food Chemistry, 103(1), 88–93.
https://doi.org/10.1016/J.FOODCHEM.2006.07.030
Xia, E.-Q., Deng, G.-F., Guo, Y.-J., & Li, H.-B. (2010). Biological Activities of Polyphenols
from Grapes. International Journal of Molecular Sciences, 11(2), 622.
https://doi.org/10.3390/IJMS11020622
Xu, Y., Fan, W., & Qian, M. C. (2007). Characterization of aroma compounds in apple cider

91
using solvent-assisted flavor evaporation and headspace solid-phase microextraction.
Journal of Agricultural and Food Chemistry, 55(8), 3051–3057.
https://doi.org/10.1021/jf0631732
Ye, M., Yue, T., & Yuan, Y. (2014). Changes in the profle of volatile compounds and amino
acids during cider fermentation using dessert variety of apples. European Food Research
and Technology, 239(1), 67–77. https://doi.org/10.1007/s00217-014-2204-1
Zoecklein, B. W., Fugelsang, K. C., Gump, B. H., & Nury, F. S. (1995). Wine Analysis and
Production.

92
3.6 Supplemental Tables and Figures
Table 8: Cider Chemistry Parameters
Fermentation
Treatment
pH Titratable Acidity Ethanol Total Residual Sugars
pH Standard
Error
pH
Groups
%
Malic
Acid
Standard
Error
TA
groups
%
Ethanol
Ethanol
Groups
Ethanol
Groups
D-
Glucose
+ D-
Fructose
(mg/L)
Standard
Error
Residual
Sugars
Groups
MCONS 3.63 0.02 abcde 5.64 0.06 defgh 6.21 0.012 a 0.00 0.00 a
MKS 3.63 0.01 abcde 5.68 0.06 defgh 6.18 0.020 a 0.00 0.00 a
MES 3.65 0.01 abc 5.91 0.04 bcdef 6.21 0.032 a 0.00 0.00 a
MOS 3.61 0.01 bcdefg 5.56 0.21 efghi 6.22 0.009 a 0.00 0.00 a
MDS 3.58 0.01 fghi 5.87 0.11 cdef 6.20 0.043 a 0.00 0.00 a
ECONS 3.57 0.02 ghi 6.37 0.42 ab 6.23 0.030 a 0.00 0.00 a
EKS 3.59 0.01 defgh 6.37 0.25 ab 6.23 0.015 a 0.00 0.00 a
EES 3.55 0.02 hi 6.18 0.11 abc 6.16 0.027 a 0.00 0.00 a
EOS 3.53 0.01 i 6.19 0.14 abc 6.21 0.017 a 0.00 0.00 a
EDS 3.53 0.03 i 6.52 0.10 a 6.14 0.023 a 0.00 0.00 a
ICONS 3.63 0.01 abcdef 5.91 0.05 bcdef 6.17 0.031 a 0.00 0.00 a
IKS 3.64 0.01 abcd 6.06 0.04 abcd 6.30 0.009 a 0.00 0.00 a
IES 3.63 0.01 abcde 6.06 0.07 abcd 6.21 0.009 a 0.00 0.00 a
IOS 3.65 0.02 abc 5.74 0.12 cdefg 6.21 0.054 a 0.00 0.00 a
IDS 3.64 0.01 abcde 6.00 0.12 bcde 6.27 0.043 a 0.00 0.00 a
MCOND 3.62 0.01 abcdefg 6.10 0.09 abcd 6.16 0.038 a 0.00 0.00 a
MKD 3.61 0.01 bcdefg 5.96 0.07 bcde 6.18 0.013 a 0.00 0.00 a
MED 3.63 0.01 abdcef 5.74 0.09 cdefg 6.06 0.098 a 0.00 0.00 a
MOD 3.65 0.01 abc 5.56 0.08 efghi 6.21 0.032 a 0.00 0.00 a
MDD 3.59 0.01 defgh 5.70 0.04 defg 6.16 0.032 a 0.00 0.00 a
ECOND 3.60 0.01 cdefgh 6.03 0.04 bcde 6.14 0.038 a 0.00 0.00 a
EKD 3.62 0.01 abcdef 5.79 0.01 cdefg 6.15 0.067 a 0.00 0.00 a
EED 3.65 0.01 abc 5.64 0.14 defgh 6.27 0.052 a 0.00 0.00 a
EOD 3.64 0.01 abcde 5.37 0.03 ghij 6.21 0.021 a 0.00 0.00 a
EDD 3.58 0.01 efghi 5.46 0.02 fghij 6.20 0.040 a 0.00 0.00 a
ICOND 3.66 0.01 ab 5.84 0.06 cdefg 6.26 0.018 a 0.00 0.00 a
IKD 3.66 0.01 ab 5.11 0.05 ij 6.33 0.013 a 0.00 0.00 a
IED 3.65 0.01 abc 5.07 0.03 j 6.35 0.009 a 0.00 0.00 a
IOD 3.67 0.01 a 5.09 0.05 j 6.24 0.042 a 0.19 0.11 b
IDD 3.65 0.01 ab 5.19 0.02 hij 6.30 0.015 a 0.00 0.00 a

93
Table 9: Completed Cider Total H2S Production and Total Duration of Fermentation
Fermentation
Treatment
Total H2S Production Total Hours Fermentation
Total H2S (µg L-
1) SEM
Total H2S
Groups
Total Hours
(hrs) SEM
Total Hours
Groups
MCS 430.00 21.23 bcde 296.00 4.62 abcd
MKS 487.50 10.21 abcd 272.00 10.58 abcde
MES 453.75 44.19 bcd 276.00 6.93 abcde
MOS 475.00 14.43 bcd 288.00 0.00 abcde
MDS 583.33 44.09 ab 272.00 16.00 abcde
ECS 127.00 19.09 fg 296.00 4.00 abcd
EKS 95.67 11.92 fg 252.00 0.00 cde
EES 73.33 14.53 fg 264.00 6.93 abcde
EOS 162.66 4.33 fg 292.00 10.58 abcde
EDS 75.00 21.52 fg 312.00 0.00 a
ICS 235.33 19.38 defg 300.00 5.93 abc
IKS 241.00 30.64 defg 276.00 6.93 abcde
IES 215.00 70.06 efg 252.00 6.93 cde
IOS 243.33 13.95 defg 296.00 4.00 abcd
IDS 119.00 17.15 fg 256.00 10.58 bcde
MCD 433.33 33.33 bcde 308.00 4.00 ab
MKD 550.00 76.37 ab 244.00 4.00 de
MED 716.66 72.65 a 264.00 0.00 abcde
MOD 505.00 5.00 abc 288.00 6.93 abcde
MDD 621.66 66.23 ab 240.00 0.00 e
ECD 175.66 34.65 fg 300.00 6.93 abc
EKD 146.60 18.55 fg 256.00 17.44 bcde
EED 50.66 13.96 g 252.00 12.00 cde
EOD 163.00 21.73 fg 252.00 12.00 cde
EDD 95.66 4.70 fg 260.00 8.00 abcde
ICD 290.00 55.08 cdef 276.00 24.98 abcde
IKD 280.33 33.99 cdefg 284.00 4.00 abcde
IED 211.00 71.63 efg 256.00 17.44 bcde
IOD 200.00 94.65 efg 288.00 6.93 abcde
IDD 138.33 6.01 fg 264.00 13.86 abcde

94
Figure 9: Total H2S Production across all Cider Treatments. Ciders in this figure are coded with
three letter codes. The first letter represent the yeast strain (M =M2, E =EC1118 and I= ICV
OKAY). The second letter represents the yeast nutrient (CON = control, K = Fermaid K, E =
Experimental, O = Fermaid O and D = DAP). The final letter will represent the timing of yeast
nutrient, (S = single addition and D = split level addition). Each bar represents the mean (n=3)
and standard error of the mean (SEM). Tukey’s HSD test was preformed to product letter
groupings. If any one letter is shared between a bar there is no significant difference between the
means. No common letter identifies significant difference at α = 0.05.

95
Figure 10: Interaction Plot for Cider Chemical Analysis. Parallel lines indicated no interactions
effects. Non-parallel lines indicate interaction effects between the treatments.

96
Figure 41: Interaction plots for total H2S production (µg L-1 H2S) (Graph A) and total
fermentation duration (hrs) (Graph B). Interactions are represented by non-parallel lines. Parallel
lines indicate not interaction.

97
Chapter 4: Conclusions and Future Work
4.1 H2S Production and Fermentation Kinetics in Microscale Fermentations
4.1.1 Key Findings
H2S was produced in different concentrations across many of the treatments. The most
important factor for H2S production was yeast strain followed by yeast nutrients. M2 and
EC1118 yeast strain were significantly affected by yeast nutrient additions while ciders
fermented with ICV OKAY were not affected by yeast nutrient addition. Yeast nutrient timing
did not make a difference in total H2S production except for one case in which yeast nutrient
addition increased H2S production when added in two dosages (MES vs. MED). There were
many interactive effects between tested variables which was to be expected. M2 yeast strain
produced the highest levels of H2S while EC1118 produced the lowest levels of H2S.
For total fermentation duration, yeast nutrient type as the most important deciding factor
for followed by nutrient timing. The fastest fermentation was complete at 240 hours while the
slowest was 319.3 hours which is a difference of 79.3 three hours (about 3.3 days). There were
several significant interactive effects between the variables tested and total duration of
fermentation. There did not seem to be a clear pattern linking treatment variables to shortening or
increasing total duration of fermentation.
4.1.2 Limitations
Detector tubes used in this experiment were used to quantify H2S based on their ease
of use and advantage compared to other method of H2S detection as discussed in the literature
review, but tubes did have limitations. Tubes had to be removed from the stopper several times;
when pre-calibrated scale had reached maximum detection and when second yeast nutrient

98
additions occurred. Tubes had to be removed from the stopper and replaced with a new tube.
This could have caused loss of quantification H2S in the head space. H2S tubes also had to be
removed during second nutrient addition. The second nutrient addition occurred during the
exponential growth phase and H2S gas could have been released when removing the tube from
the stopper. H2S tubes pre-calibrated scales also have large intervals which varied (100 mg µL-1
to 25 mg µL-1) by the type of tube used. This resulted in a wide range of error between triplicate
showing that this method of quantification of H2S concentrations is not as accurate as other
methods could be like HPLC. More difference may have been seen if there was lower SEM
values.
In terms of nutrient addition, yeast nutrient does not completely dissolve in water.
After adding yeast nutrients to water, an insoluble fraction remained and quickly settling out of
solution. This could contribute to lower levels of available yeast nutrients than desired in the
cider fermentation since yeast may not be able to utilize the insoluble fraction of the nutrient.
AJC could have also been a source of limitation in this experiment. Apple juice
concentrate was purchased from Kroger and apples cultivars used in juice was unknown.
Processing methods were also unknown which could have added to factors that would limit yeast
fermentation in apple juice concentrate. Storage temperatures and duration was also unknown
prior to purchasing the AJC.
4.1.3 Future Work
Future work would include increasing the amount of yeast nutrient added from 25 g hL-1.
The highest level of total YAN in this experiment was 103 mg N L-1 which is far below the
recommend level of total YAN concentration. Increasing all nutrient additions so each treatment

99
is above 140 mg N L-1 of total YAN may yield different results and show more significant
difference between H2S production and fermentation kinetics.
More future research could be conducted on how frozen AJC effect H2S production.
Investigating deeper into nutrients availability and how processing methods affect nutrients in
AJC could elucidate which nutrients are lacking. Many cider producers use apple juice
concentrate for cider fermentation but there is little know about the effects of concentration
methods on amino acids or nutrient available. Surveying different kinds of apple juice
concentrates for nutrients such as pantothenic acid and amino acids that are very important to
H2S production may elucidate more information on how apple juice concentrate may play a role
in H2S production.
4.2 Sensory Evaluation of H2S and Off aromas
4.2.1 Key Findings
Through classical text analysis 25 attributes were chosen to represent the selected cider
samples. These attributes ranged from both positive and negative attribute. Through CA of the
CATA data, ciders with different treatments were described by different attributes. Two
treatments, MCD and MOD, were most often described as sulfur and vegetal which are likely
attributes describing VSCs and H2S. There were no clear patterns of groupings within CATA
data suggesting that treatment variables did not predictably affect aroma. Through average
liking scores of cider treatments, there was no clear best treatments as all average liking scores
ranged from “neither dislike nor like” and “slightly like”.

100
4.2.2 Limitations
A limitation for sensory evaluation, was the total number of ciders tested. Only 12 out of
the 30 samples were tested due to time limitations and the ability of panelist to evaluate cider
before sensory fatigue. Another limitation was that there was no control in the sensory study. If a
control cider was presented, differences between the control cider with no yeast nutrients and
ciders with nutrient additions could have been evaluated for aroma attributes. Since a control
cider was not presented, this was not possible.
Total subject sample size was also a limitation for this study. The ideal number of
participants for the CATA study would have been closer to 100 people but only 63 total panelists
evaluated the ciders. An increased number of panelists might have given more separation of
treatments by descriptors.
4.2.3 Future Work
Future sensory work could include testing ciders fermented with different yeast nutrients
against control cider. This could help identify different aromas due to treatment variables. Ciders
with higher addition levels of yeast nutrient additions could also be investigated. Higher level of
yeast nutrients could increase the total YAN, vitamins and increase metabolic pathways in yeast
strains in the hopes to produce more positive aromas. Finally, more research could be conducted
on the taste of the cider to investigate whether there are discernable differences between
treatments since taste of ciders which were not investigated in this study.
4.3 Overall Conclusion
In this experiment, yeast strain played the largest role in reducing H2S production which
has been heavily reported on in previous wine research. The effect of yeast nutrient on H2S was

101
yeast strain dependent, but not significantly affected by addition timing. Total duration of
fermentation was most significantly affected by nutrient type, followed by nutrient timing, while
yeast strain showed little impact on the duration of fermentation. CATA data revealed that
treatment variables made no distinguishable patterns when observing the aroma attributes
evaluated by untrained panelists. Continued research is needed to elucidate the full effect of
yeast nutrient addition timing on H2S production as well as the effects of nutrient composition on
yeast metabolism and aroma production.
Production of H2S in cider fermentation is extremely complex and dependent upon many
interacting factors but cider is an import value added product that has gained national attention.
In order to continue and encourage growth of cider production and consumption, research is
needed to help provide scientific evidence on how to improve cider quality and aroma. Without
targeted research, cider popularity could decline as it has in the past due to low quality. By
continuing the investigation into the complex nature of H2S production in cider better
recommendations can be developed for cider producers to prevent H2S. Overall, it is important to
try to provide help and knowledge to the cider category to continue growth and enthusiasm.

102
Appendices
Appendix A Microscale Fermentation Fitted with Hydrogen Sulfide Tubes Protocol
1) Autoclave Pyrex flasks (250mL) and stir bars by placing a small amount of water inside the
flask and cover opening with foil. Add autoclave tape to ensure proper temperature is
reach. Autoclave on Gravity 15 setting (~30min).
2) Make sanitizer by add 3 gallons of water (11.36L), 2 teaspoon of potassium metabisulfite
(8g), 1 tablespoon Citric Acid (12g) to a large container. Place stoppers and H2S tubes in
sanitizer. Allow sanitizer to air dry completely before use.
3) Dissolve frozen apple juice concentrate by adding 1,062 mL of DI water for every one can
of AJC (345 ml). Add all cans and water into a large container and mix thoroughly.
Measure and pour 200 mL of juice into each 250 mL flask.
4) It is generally recommended 100mg L-1 potassium metabisulfite which yields 58.8 mg L-1
free SO2 but due to large surface area, targeted free SO2 is higher. Create a 0.02g mL-1
solution by dissolving 2.60 g potassium metabisulfite in 130mL distilled water. Add 1 mL
of 0.02g mL-1 to each flask. Allow to stand for about 24 hours before yeast addition.
5) Add stoppers & tubes to flask to close off fermentation vessel to the environment and let
stand overnight.
6) After letting juice stand overnight, rehydrate yeast. Add yeast at the recommended 25 g
HL-1 by adding 3.25 g yeast to 65 mL of water that is 35°C. Stir gently to remove clumps.
Let stand for 20 min and stir again. Take temperature of yeast to make sure difference
between yeast solution and juice is NO more than 10°C difference. If more than 10°C yeast
will go into cold shock. Add 1 mL of yeast solution to each flask.

103
7) Add yeast nutrients at recommend 25 g hl-1 by dissolving nutrient in water (30 - 40°C).
Add 10 g of yeast nutrient in 200 mL water (.05 g ml-1). Mixed for 20 minutes and allow to
cool to room temperature. For fermentation receiving only one addition of yeast nutrients
add 1mL of solution to each flask except for control. Add 1mL of water to the control
flask. For fermentations receiving split additions add 500 µL of yeast nutrient solution into
each treatment except for control. Add 500 µL of water to the control flask.
8) Break H2S tubes on BOTH ends, place into stopper and add to each flask and ensure that
stopper is firmly in place.
9) Tightly wrap stopper and opening of flask with parafilm to ensure an airtight deal. This is
to ensure that all gas from the fermentation is pushed through the H2S tube.
10) Stir each flask at 600 rpm for 5 minutes twice a day.
11) Weight each flask and record its weight after being stirred each time.
12) For fermentations that receive as second nutrient addition, addition will be added at 1/3
brix depletion (in this case start of day 3) by dissolving 10 g of nutrients in 200 mL water
(30 - 40°C) and mixed for 20 minutes. Allow to cool to room temperature.
13) Record weight of flasks before addition to obtain original weight and remove H2S tube and
insert thermo pipet with nutrient in tip into stopper hole. Add 500 µL of nutrient through
stopper hole and quickly replace H2S tube. Stir for 5 minutes at 600 rpm and reweigh flask.
14) Continue to stir flasks at 600 rpm for 5 minutes twice per day and weighing flasks until
weight of flask has not changed for four data points (2 days).

104
Appendix B Scale Up Fermentation Protocol
Materials
36 carboys 1 gallon carboy, Yeast (EC1118 and M2), 36 stoppers, 36 air locks, Kroger AJC 25
liters, DI Water, Sanitizer, Nitrogen Gas, 75 (375mL) wine bottles , 75 caps for wine bottles, SO2
(Potassium metabisulfite), Yeast Nutrient (Fermaid C, Fermaid O and DAP), Large 5 gallon
Nalgene container with spout & lid , tubing for racking , H2S tubes for head space & pump
Day 1:
Juice Rehydration
1. Thaw AJC at 0°C overnight so it can be measured in its liquid form. Stir buckets well and
make sure they are not settled from freezing. Then measure out 625 mL AJC and 1875
mL water. Pour directly into 1 gallon jug using a funnel and mix by shacking carboy.
Sample apple juice for chemical analysis.
2. Add SO2 by weighing 10 g of KMS and adding to 40 mL of cold water and stir until
dissolved. Add 1 mL of solution per juice of juice. Once SO2 is added, add stoppers and
airlock to jug and allow to sit overnight at 18°C.
3. Yeast Nutrient rehydration: Dissolve 100 g of yeast nutrient in 320 mL water to make
.3125 g L-1 solution and add 2 mL of nutrient to each jug for single addition treatments
and add 1 mL for split level. Yeast nutrient was added at recommend 25g hL-1.
Day 2: Addition of yeast
4. Rehydrate yeast by mixing yeast with water. Yeast was added at 25g hL-1. Once yeast
was added allow cider to ferment at 18°C. Check cider twice per day to make sure yeast

105
hasn’t settle. If yeast have settled, then gently stir jug by hand. Add water when needed to
air locks.
Day 4: Second Nutrient Addition
5. Add second yeast nutrient addition at end of 3rd day. Remake nutrient fresh and add 1 mL
of nutrient solution to cider by following directions in step 3.
End fermentations
6. Test cider towards the end of fermentation for total residual sugar using D-fructose and
D-glucose enzymatic kit from Megazyme. Fermentation were considered complete when
less than 2 g per liter of sugar was remaining in the cider
Bottling
7. Using H2S tubes and H2S pump, measure the H2S remaining the measurements of
headspace of each cider jug by removing airlock and sampling headspace as quickly as
possible.
8. Once fermentation was completed, cider was rack off lees and combined replicates to
ensure homogeneity. All tubing and materials were sanitized and allowed to air dry
before use. Dispense cider into 375 mL bottles that have been purged with nitrogen.
Ensure that fill line on each bottle is constant. Purge headspace for 30 seconds with
nitrogen. Store in refrigeration at 0°C until sensory test.
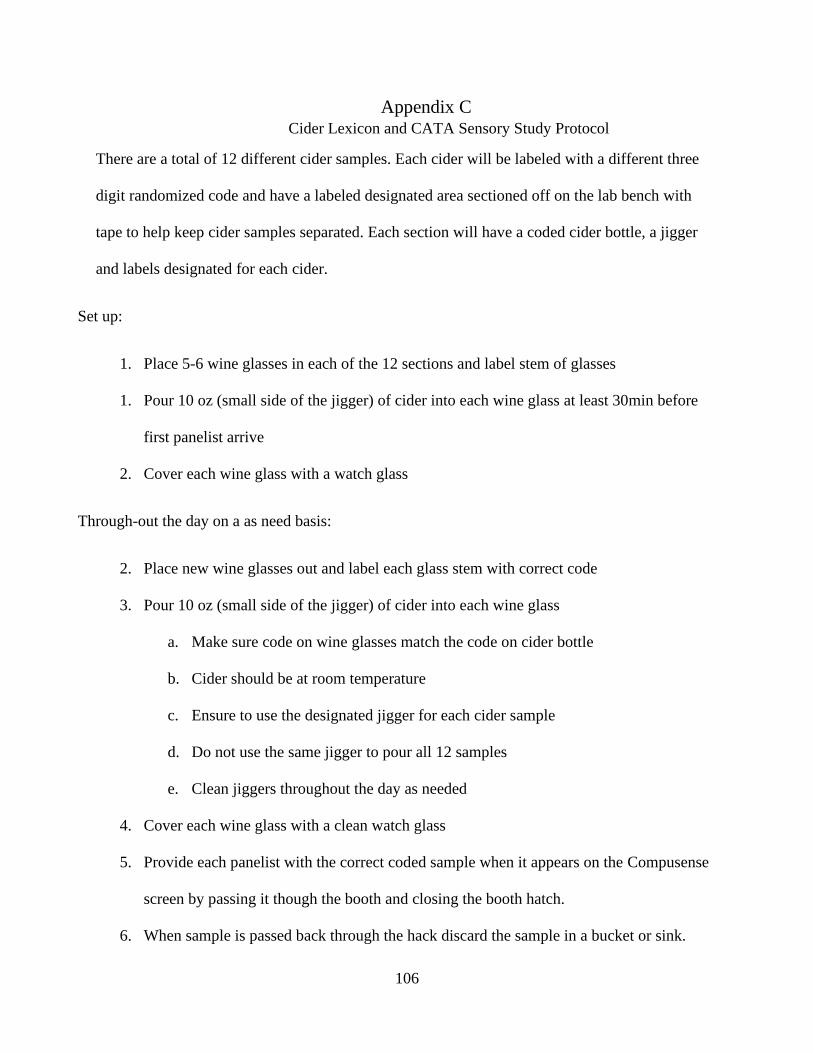
106
Appendix C Cider Lexicon and CATA Sensory Study Protocol
There are a total of 12 different cider samples. Each cider will be labeled with a different three
digit randomized code and have a labeled designated area sectioned off on the lab bench with
tape to help keep cider samples separated. Each section will have a coded cider bottle, a jigger
and labels designated for each cider.
Set up:
1. Place 5-6 wine glasses in each of the 12 sections and label stem of glasses
1. Pour 10 oz (small side of the jigger) of cider into each wine glass at least 30min before
first panelist arrive
2. Cover each wine glass with a watch glass
Through-out the day on a as need basis:
2. Place new wine glasses out and label each glass stem with correct code
3. Pour 10 oz (small side of the jigger) of cider into each wine glass
a. Make sure code on wine glasses match the code on cider bottle
b. Cider should be at room temperature
c. Ensure to use the designated jigger for each cider sample
d. Do not use the same jigger to pour all 12 samples
e. Clean jiggers throughout the day as needed
4. Cover each wine glass with a clean watch glass
5. Provide each panelist with the correct coded sample when it appears on the Compusense
screen by passing it though the booth and closing the booth hatch.
6. When sample is passed back through the hack discard the sample in a bucket or sink.

107
7. Remove coded sticker from the stem of the glass and place dirty wine glass in dishwasher
rack.
8. Clean wine glasses when rack is full.
9. Pour new samples throughout the day as needed
a. Each panelist will receive a new cider sample
b. Discard of each sample after being presented to a panelist
c. DO NOT reuse cider samples after it has been evaluated by a panelist