impact of volatility and equity market uncertainty on herd
TRANSCRIPT

Impact of Volatility and Equity Market Uncertainty on Herd Behaviour: Evidence from
UK REITs
Abstract
Purpose
This paper examines herding behaviour among investors in UK-listed Real Estate
Investment Trusts (REITs) within three market regimes (low, high and extreme volatility
periods) from the period June 2004 to April 2016.
Design/methodology/approach
Observations of investors in 36 REITs that trade on the London Stock Exchange as at April
2016 were used to analyse herding behaviour among investors of shares of UK REITs,
employing a Markov regime-switching model.
Findings
Although a static herding model rejects the existence of herding in REITs markets, estimates of
the regime-switching model reveal substantial evidence of herding behaviour within the low
volatility regime. Most interestingly, we observed a shift from anti-herding behaviour within the
high volatility regime to herding behaviour within the low volatility regime, with this having
been caused by the FTSE 100 Volatility Index (UK VIX).
Originality/value
The results have various implications for decisions concerning asset allocation, diversification
and value management within UK REITs. Market participants and analysts may take into
account that collective movements and market sentiment/psychology are determinative factors of
risk-return of UK REITs. In addition, general uncertainty in the equity market, proxied by the
impact of the UK VIX, may also provide a signal for increasing herding-related risks within UK
REITs.
JEL Classification Code: C32, G11, G15
Keywords: Herd behaviour; UK REITs; Markov-switching; Time-varying probabilities.

1. Introduction The temper of the multitude is fickle.
Machiavelli
Decision-making in finance may inevitably involve shortfalls arising from reasons such as
information asymmetries or market-/person-specific investment psychology. The literature
reveals that irrational features and behavioural aspects of the investment process, ranging from
non-financial assets to financial assets are among the reasons for anomalies and boom-bust
cycles. In this respect, despite well-established theoretical frameworks and empirical evidence on
the efficient market hypothesis, financial markets involve widespread irrationalities. Global-
/market-specific uncertainties/volatilities have also exacerbated irrationalities in the
leading/developing financial markets. It is not wrong to expect in light of past experiences that
market and specific investment psychologies may go hand in hand, which may result in a
market-wide roller-coaster effect during up- and down-market conditions in stock markets. As
the signal of a crowd movement reflecting mass consensus, herd behaviour in direct/indirect
property investments maybe also be analyzed in the context of this irrational/inefficient roller-
coaster effect.
Herding behaviour in property stocks has received increasing attention in the property literature.
However, studies that have attempted to capture herding behaviour under different market
regimes in Real Estate Investment Trusts (REITs) are still at an embryonic stage in the empirical
literature. By employing static and dynamic herding models, this study aims to explore herding
behaviour in UK-listed REITs over the period June 2004 to April 2016. Based on static
modelling, we followed Chang et al's. (2000) methodology, involving cross-sectional absolute
standard deviations (CSAD) among individual firm returns, to define non-linear relations
between equity return dispersions and market returns. In addition, we allowed the regime
transition probabilities to be time varying, by using the time-varying transition probability
Markov-Switching model (TVTP-MS). Because the observation period involves nine years with,
during and after the Global Financial Crisis period, the evidence may imply that the UK REITs
market inherently involves long-run and persistent herding patterns. Due to the highly
sophisticated nature of the London Stock Exchange (LSE), this behavioural phenomenon
provides interesting evidence of herd behaviour from a developed-market perspective.
The UK REIT market was introduced in January 2007. Its introduction resulted in a number of
prior UK-listed property firms converting to REITs, as well as in the initial public offerings of
newly formed REITs being listed on the LSE. As at September 2017, the UK REIT market
capitalization was valued at around £56 billion1. The top five UK-listed REITs in market
capitalization as at September 2017 included the Land Securities Group plc (£7.21 billion),
British Land (£6.14 billion), SEGRO plc (£5.36 billion), Hammerson plc (£4.26 billion) and Intu
properties plc (£3.12 billion)2. The UK market is a significant global REIT market; for instance,
according to the FTSE EPRA/NAREIT global REITs index as at 29 September 2017, UK REITs
rank at number four in terms of weightage, with 5.34% having a value of US$63.28 billion,
behind Japan (6.48%, US$76.75 billion), Australia (6.90%, US$81.71 billion) and the United
States, which ranks number one, with a weight of 64.63% and a value of US$765.51 billion).3
The contribution of this study is twofold. Firstly, to the best of our knowledge, this paper is the
1
The value of UK REITs was calculated by adding the market capitalization of UK REITs as seen on
http://www.bpf.org.uk/reits-and-property-companies as at 30 September 2017. 2 The market capitalisation of the UK REIT market as well as the top five UK REITs were sourced from the LSE.
http://www.londonstockexchange.com/statistics/companies-and-issuers/companies-and-issuers.htm 3 The information was extracted from the FTSE Russell factsheet (the FTSE EPRA/NAREIT global REITs index) as
at 29 September 2017.

first study to examine herding behaviour among investors in UK REITs. The intuition behind this
investigation was to determine behavioural aspects in decision-making among investors in UK
REITs, connected to the relations among uncertainty, volatility, and herding behaviour. Secondly,
the study provides a critical observation for the role of the different regimes on herding
behaviour in the UK REIT market. Based on the selected analysis period, we provide
comparative knowledge on herding in low, high and extreme market regimes. Third, using time-
varying transition probabilities for herding behaviour, we also provide significant knowledge on
the shifts between positive and negative herding behaviour during different volatility periods. In
doing so, we employed a new framework for analysing the destabilizing effects of herding in the
UK REIT market. This analysis provides evidence from a developed country’s REIT market,
such as that of the UK, which may be found to be interesting as the prior literature reveals that
herding is more likely to take place in emerging markets (Zhou and Anderson, 2013), and
emerging markets have been found to accommodate higher herding levels compared with their
developed market counterparts (Andronikidi and Kallinterakis, 2010). Overall, by focusing on
UK REIT stocks during and after the Global Financial Crisis, the study opens a debate on
whether UK REIT stocks show irrationalities from a herding perspective, as well as on whether
the existing strategies of global portfolio managers and policy makers are compatible with a
herding-based market structure.
The paper has four further sections. Section 2 reviews prior studies. Section 3 introduces the data
and the testing methodology. The results based on the analysis of cross-sectional absolute
standard deviations (CSAD) and time-varying transition probabilities are presented in section 4.
Finally, the last section concludes.
2. Literature review
As indicated in Keynes' beauty-contest analogy, stock market investments would be driven by
the expectations of other investors, rather than by rational decisions based on analysis of the
fundamentals of the asset. This 'animal sprit' may be typically apparent during bubble
(Kindleberger and Aliber, 2005; Akerlof and Shiller, 2009) or herding periods connected with
mass psychology and irrational price movements in stock markets. The main consensus among
theoretical herding studies is that herding can be construed as being either a rational or irrational
form of investment behaviour (Zhou and Anderson, 2013).
Herding is broadly perceived as an exuberant and irrational synchronized movement of asset
prices that is not justified by their fundamental values (Babalos et al., 2015). Bikhchandani and
Sharma (2001) suggest that herding results from an obvious intent by investors to copy the
behaviour of other investors and that imperfect information, concern for reputation, and
compensation structures are the potential reasons for rational herd behaviour in financial
markets. Devenow and Welch (1996) postulate that despite the difficulty of precisely defining
herding, it could be defined as behaviour patterns that are correlated across individuals, and it is
closely linked to such distinct phenomena as imperfect expectations, fickle changes without
much new information, bubbles, fads, frenzies, and sunspot equilibria.
Empirical studies on herding focus on either the behaviour of specific groups (i.e.
mutual/pension fund managers, financial analysts) or on the overall market. For example, by
examining the quarterly holdings of 155 mutual funds over the period 1975-1984, Grinblatt et al.
(1995) found relatively weak evidence for mutual funds tending to buy and sell the same stocks
at the same time. The studies selected – Chevalier and Ellison (1999), Graham (1999), Wermers
(1999), Welch (2000), Hong et al. (2000), Gleason and Lee (2003), and Clement and Tse (2005)
– also provided evidence for group-wide herding. On the other hand, by analyzing 769 funds and
the behaviour of pension managers, Lakonishok et al. (1992) found no market-wide herding, but
weak evidence of herding among smaller stocks, and relatively little of either herding or
positive-feedback trading among the largest stocks.
Herding analyses under different market regimes provide interesting country-level outcomes.
Hwang and Salmon (2004) analyzed herding in the US and South Korean stock markets and
found evidence of herding towards market portfolios in both bull and bear markets. The authors
further show that, contrary to common belief, the Asian Crisis and particularly the Russian crisis,
involved limited herding. Andronikidi and Kallinterakis (2010) found in the case of Israel that
the presence of thin trading tends to conceal the actual magnitude of herding. Analyzing
Taiwanese open-end equity mutual fund herding behaviour over the period of 1996-2008, Hou et
al. (2014) found evidence of both directional and directionless herding, and the abolition of
qualified foreign institutional investors has reduced directionless and sell-side herding but has
had no effect on buy-side herding. Luo and Schinckus (2015) investigated herding behaviour in
asymmetric (bearish versus bullish contexts) and extreme market conditions, through daily data
from the Shanghai and Shenzhen stock exchange markets, and found that a bullish context
generates herding behaviour among investors of B-shares, while a bearish situation rather
favours crowd movement among A-shares.
Herding in REIT stocks, the particular interest of this study, is a newly developing research area
in the literature. As the first attempt to test herding in the REIT market, Zhou and Anderson
(2011) investigated market-wide herding behaviour in the US equity REIT market by utilizing
the quantile regression method, and found that herding is more likely to be present in the high
quantiles of the REIT return dispersion. Authors further indicate that REIT investors tend to herd
under turbulent market conditions, and that herding is more likely to occur, and becomes
stronger in declining markets, rather than in rising markets, implying asymmetry in herding
behaviour. Moreover, the findings also show that during the Global Financial Crisis, REIT
investors may not have started to herd until the market became extremely turbulent. By
examining the existence of herding effects in the US REIT market during the period of January
2004 to December 2011, Philippas et al. (2013) found that a deterioration of investor sentiment
and adverse macro-shocks to REIT funding conditions were significantly related to the
emergence of herding behaviour, contrary to the common belief that the recent Financial Crisis
did not seem to contribute to this phenomenon. The authors also documented asymmetric
herding effects during the days of negative market returns. Babalos et al. (2015) explored
herding under low, high and extreme market volatility regimes among US-listed REIT investors
during January 2004 and June 2013, and using a regime-switching model, reveal substantial
evidence of herding behaviour for the crash regime for almost all sectors, despite the static
herding model's rejection of the existence of herding. Moreover, the study suggests a shift from
negative herding behaviour during low- and high-volatility regimes to positive herding behaviour
under crash regimes for almost all REITs sectors. Using a Markov-switching time-varying
parameter (MS-TVP) herding model for South African REITs, Akinsomi et al. (2017a) found
that higher levels of gold market speculation considerably contribute to herding behaviour in the
South African REIT market, and argue that herding and market volatility creates a vicious cycle
in which market volatility contributes to the formation of herding, and herding drives up market
volatility, making it especially challenging for policy makers. By utilizing Chang et al's. (2000)
methodology over the period of July 2007 to May 2016 for Turkish REITs, Akinsomi et al.
(2017b) found herding behaviour, the presence of directional asymmetry and linear relations
between volatility and herding. The authors argue that herding is a persistent phenomenon and
increases during periods of market stress in Borsa, Istanbul.

Maitland-Smith and Brooks (1999) applied and compared the properties of two regime-switching
models for the value indices of commercial real estate in the US and the UK, and found that the
Markov-switching model is better able to capture the non-stationary features of the data than the
threshold autoregressive model. By employing a Markov-switching model, Krystalogianni and
Tsolacos (2004) examined the structure of yields among broad asset classes (real estate, equities
and government bonds) and its implications for portfolio allocation decisions and real estate
investment. Liow and Zhu (2007) employed a Markov-switching model to characterize real
estate security markets’ risk‐return and detected strong evidence of regimes in the six real
estate security markets. In a different research field, Corradin and Fontana (2013) examined
the house price dynamics of thirteen European countries, using a Markov-switching error
correction model. Lee et al. (2013) applied the bivariate Markov-switching autoregressive model
(MS-ARX) and the Markov-switching vector auto-regression model (MSVAR) to identify the
turning points of real estate cycles in Taiwan.
Despite a lack of studies on herding, the literature reveals interesting market characteristics of
UK REITs. For example, Barkham and Ward (1999) provide evidence regarding the relationship
between the NAV discounts of UK property companies and their market capitalizations, based on
various hypotheses. Analyzing long memory in the returns and volatility of REITs markets in the
USA, UK, Hong Kong, Australia, and Japan, Assaf (2015) confirms that long memory in
volatility is real, and is not caused by shifts in variance for all markets. Lee (2013) found a high
correlation between the various property types and regions in the UK and raises the question of
how well diversified current institutional portfolios are in the UK. Galariotis et al. (2015) found
that there have been herding spillover effects from the US to the UK during earlier financial
crises and suggest that the drivers of herding behaviour are period- and country-specific.
Analyzing UK REITs seems interesting for a number of reasons. The first point is that the UK
real estate industry plays an important role in the national and international economy. As a
reflection of this economic role, UK REITs are receiving increasing attention from investors. As
indicated by Newell et al. (2016), UK REITs are an important property investment vehicle, being
the fourth-largest REIT market globally and having delivered strong risk-adjusted returns since
the post-global financial crisis. Second, although our study is the first in the literature, the
literature reveals that UK REITs show some anomalies and inefficiencies, implying that the
industry may have further implicit irrationalities. For example, Jadevicius Lee (2017) provide
evidence that return anomalies exist among UK REITs, and investors can buy and sell them more
effectively by recognising the day-of-the-week effect. Morri and Baccarin (2016) investigated
the NAV discount puzzle for REITs listed in France, the Netherlands and the United Kingdom
between 2003 and 2014. The study suggests that in the UK and France, REITs with more debt
are traded at higher discounts, and larger REITs trade at higher discounts in France and the UK,
even though the relationship is not significant in all cases.
3. Data and testing methodology
3.1. Cross-sectional absolute standard deviations (CSAD)
Following Chang et al. (2000), this study uses cross-sectional absolute standard deviations
(CSAD) among individual firm returns within REITs to define the non-linear relation between
the level of equity return dispersions and the overall market return.
The CSAD statistic, used as a measure of return dispersion, is formulated as follows:

𝐶𝑆𝐴𝐷𝑡 = √∑ (𝑟𝑖,𝑡−𝑟𝑚,𝑡)2𝑁𝑖=1
𝑁−1 (1)
where and is the return on stock i and the value of an equally weighted average of all
REITs returns for period t, respectively, and n is the number of stocks in the portfolio. Herd
behaviour assumes that individual investors make investment decisions following the collective
actions of the market, and that these actions will lead security returns to converge with the
overall market return. Therefore, herd behaviour implies that security dispersions (i.e. CSADt)
will decrease with the absolute value of the market return, since each asset becomes similar with
regard to sensitivity to the market return.
Chang et al. (2000) suggest that during periods of market stress, one would expect return
dispersion (i.e. CSADt) and market return (i.e. rm,t) to have a nonlinear relationship. Christie and
Huang (1995) suggest that the probability of herd behaviour increases during periods of market
stress and large price movements; therefore, we have a benchmark model based on the following
quadratic model of return dispersion and market return:
(2)
The presence of herding is tested through the following hypotheses:
H0: In the absence of herding effects, we expect in Eq (2) that α1>0 and α2=0.
H11. If herding behaviour exists, we expect α2<0.
H12. If anti-herding behaviour exists, we expect α2>0.
Because it is suggested in the herding literature that investor herding would be more likely
to present itself within sufficiently homogeneous groups of market participants (e.g. Christie and
Huang, 1995; Bikhchandani and Sharma, 2001), we focused on securities that are classified as
real estate investment trusts. As mentioned earlier, the choice of REITs was largely motivated by
the fact that, to the best of our knowledge, no studies exist on herding involving UK REITs. In
addition, securitized real estate markets, i.e., REITs, have experienced tremendous growth in the
global economy. According to the National Association of Real Estate Investment Trusts
(NAREIT), global real estate markets represented more than $1.22 trillion of equity
capitalization in July of 2016. In addition, with REITs being exchange-traded funds that earn
most of their income from investments in real estate, REITs have been at the epicentre of
research interest because their returns do not suffer from measurement error and high transaction
costs compared with other real estate investments. As indicated by Akinsomi et al. (2016),
REITs constitute a very good proxy for the real estate market, simultaneously providing high
frequency observable data, since REITs shares trade as common stocks. Because REITs are
accessible to all investors, irrespective of their portfolio size, this asset class has been particularly
successful in attracting investment capital.
For our analysis, we used daily data comprising 36 primary REITs4 on the LSE for the
period June 2004 to April 2016,5 with a total of 3070 observations. The source for the closing
4 As at April 2016, there were 36 listed UK REITs. Our sample of firms involves listed REITs on the LSE as at
April 2016; for instance, our sample includes REITs such as Land Securities group plc, with a market cap of 7.21
billion pounds as at September 2017, and Redefine International, an offshore REIT with a market cap of 686.64
million pounds that trades on the LSE. Our sample size begins with 16 REITs in June 2004 and ends with 36 REITs
on 5 April 2016, highlighting the dynamic nature of our data. 5 In this paper, we recognize that the REITs regime begins in 2007. However, we expanded our data to 2004 to
extend our timeline: the period from 2004 to 2007 tracks all REITs that converted in 2007; the year 2004 presented a
significant count of 16 individual firms for estimating the CSAD. Our robustness tests also examine the REITs
regimes solely between 2007 to 2016, and our results remain consistent with earlier results when we employ the
tiR , tmR ,
ttmtmt RRCSAD 2
.2.10

prices of the various REITs is Datastream of Thomson Reuters. In addition, we considered the
FTSE 100 VIX (VIX) in estimating the regime transition probabilities of the Markov-Switching
model. The VIX data was derived from the same source, with the aim of capturing aggregate
equity market uncertainty in the UK.
3.2. The TVTP-MS model with VIX
It is argued that the static model in Equation (2) leads to a misleading conclusion
regarding herd behaviour, as parameters are assumed to be constant over time (Balcilar et al,
2013a, b; Ngene, et al., 2017). To distinguish and examine whether herding behaviour is
contingent for different market phases, we estimated the following three-state Markov switching
model of the cross-sectional returns dispersions:
(3)
where 𝜀𝑡~𝑖𝑖𝑑(0, 𝜎𝑆𝑡
2 ) and is a discrete regime variable taking values in {0,1,2} and following a
three-state Markov process6
. The volatility term in Equation (3), t is modelled to be
heteroscedastic with three states such that
𝜎𝑡2 = 𝜎1
2𝑆1𝑡 + 𝜎22𝑆2𝑡 + 𝜎3
2𝑆3𝑡
(4)
where if and zero otherwise (k = 1, 2, 3). The specification of allowing the
volatility term in to be heteroscedastic differentiates market regimes in terms of the level of
volatility in each regime, i.e. for regimes k =1, 2, 3, and allows the variance of cross-
sectional dispersions to switch across different regimes. In addition, we allowed the regime
transition probabilities to be time varying by using the time-varying transition probability
Markov-Switching model (TVTP-MS) to assess the role of uncertainty in the overall UK equity
market in herding regimes in the British REIT market. The main advantage of the TVTP-MS
model against the constant transition probability specification is that it allows the duration of
herd behaviour to vary across different regimes of market volatility and the gauging of fear and
market sentiment, as measured by the FTSE 100 VIX index (VIXUK). Hence after modelling the
role of VIXUK shock, we could define the transition probabilities of the Markov chain in
Equation (3) as:
(5)
where is a vector of exogenous VIX variables.7 We could also define as the vector of
parameters of exogenous variables associated with the transition probability of switching from
period prior to REIT conversion, similar to authors such as Akinsomi et al (2017a), who extended and justified the
extension of REIT timelines in the case of South African (SA) REITs, which was not investigated due to data
constraints. In addition, we ideally needed data at higher frequencies, to pick up herding and to estimate the Markov-
switching model precisely, which tends to have a lot of parameters, especially in our case as we allowed for time-
varying transition probabilities. In essence, the starting point of 2004 was driven by the need to use high-frequency
firm-level data for the REITs sector of the UK, which begins only in 2007. 6 Previous studies found that a three-state Markov process fits the stock return model well (see, for example,
Guidolin and Timmermann, 2006; Maheu et al., 2009; and Charfeddine and Ajmi, 2013). 7 The variables in impact the transition probabilities with one lag, since the transition probabilities governing
the regime switches that occur from t-1 to t must be determined at time t-1.
CSADt
= a0,S
t
+a1,S
t
Rm,t
+a2,S
t
Rm,t
2 + et
tS
S
kt= 1
S
t= k
s
t
2 = sk
2
p
ij,t= P(S
t= i S
t-1= j,Z
t-1)
Z
t q
ij
Z
t

state j at time t-1 to state i at time t. The time-varying transition probabilities can be written as
𝑝𝑖𝑗,𝑡 = Φ(Ζ𝑖𝑗,𝑡−1𝜃𝑖𝑗), 𝑖 = 0,1 𝑎𝑛𝑑 𝑗 = 1, 2, 3 (6)
where is the normal cumulative distribution function (CDF), and the transition probabilities
satisfy for t=1, 2, …, T.
Therefore, we include in the TVTP model the vector Z = [zi] (i=0,1,…,2) in Equation (6)
is defined as Z = (1,VIXUK), with the UK VIX variable being measured in returns.
4. Empirical results
This section presents the findings for the TVTP-MS model described in Equations (3)
through (6). The findings for the static model in Equation (2) are reported in Table 1. First, we
find that coefficient α1 in Equation (2) is positive and statistically significant, as predicted by the
equilibrium model of CAPM, and the cross-sectional absolute deviation of REITs returns with
respect to the market return is increasing with the absolute magnitude of market returns. Second,
we find anti-herding behaviour, as illustrated by the statistically significant coefficient α2, even
though the magnitude is small.
Table 2 presents our findings for the TVTP-MS model specified in Equations (4) through
(6). As is evident, the TVTP-MS model is clearly a better fit to the data than is the static model,
as the former has a much lower AIC.8 This result is not surprising given that we obtained strong
evidence (the highest possible level of significance at all possible dimensions involved in the
test) of nonlinearity when we applied the Brock et al. (1996, BDS test) to the residuals of the
static model (Equation 2). The results are reported in Table A1, in the Appendix of the paper. In
addition, we detected as many as four breaks (3 May 2006; 27 May 2008; 2 March 2010; and 16
February 2012) in this equation when we implemented the test of multiple structural breaks,
based on the global information criteria as developed by Bai and Perron (2003).
The regime-specific volatility estimates ( , k=1, 2, 3) are reported in Table 2. Market
regimes are clearly identified in terms of low (i.e. regime 2), high (i.e. regime 1) and extreme
volatility (i.e. regime 3) in terms of the level of return, with the low volatility regime being
primarily concentrated post the financial crisis, especially for 2011. Our main finding is that
there is significant evidence of herding in the UK REITs market during the low volatility regime,
which is opposite to what was detected for the US REITs market by Babalos et al. (2015), who
found strong evidence of herding in the crash-regime. Our results suggest that in the UK, herding
occurs when uncertainty, i.e., volatility is low, with anti-herding being observed at high and
crash-regimes of volatility. However, most important is the observation that, unlike the linear
static model, the TVTP-MS model detects evidence of herding in a specific regime, which
happens to be the low-volatility regime. Thus our result highlights the importance of modelling
nonlinearity when analyzing herding behaviour – a result similar to that of Babalos et al. (2015).
In January 2007 the legislation set out the rules for REITs in the United Kingdom. As a result, a
number of listed property groups converted to this regime; this change provided opportunities
for the growth of the property investment sector, because property companies could now get
8 The TVTP-MS model’s AIC was also lower than that of the MS model, with constant probabilities of transition,
with the latter having an AIC of 0.4965. Complete details of the results from the MS model's constant transition
probabilities, which were qualitatively similar to those of the TVTP-MS model, are available upon request from the
authors. We chose to work with the TVTP-MS model due its better fit, and to use the VIX in explaining the
movements of the transition probabilities.
F(.)
p
ij ,t= 1
j=0
2
å
s
k
2

access to capital markets, and investors would have wider investment opportunities than with
alternative asset classes, due to the underlying property assets, without significant tax leakage.
Therefore, we carried out a robustness check for the period 2007-2016 to see whether the results
are robust before and after 2007; in particular, we found that the results for 2007-2016 are
similar compared with the results in Table 1. For the TVTP-MS model, the results for 2007-2016
are similar to those for 2004-2016 (i.e. our main finding is that there is significant evidence of
herding in the UK REITs market during the low volatility regime)9.
The first break, which occurred on 3 May 2006, is associated with the implementation of the
2007 rules for REITs in the United Kingdom, when a number of listed property groups converted
to REITs. This regime change enabled UK REITs to undertake activities other than running a
property rental business (for example, to be involved in property trading or services where a
minimum of 75% of the business entails running a property rental business). The UK REIT
regime is set out in Part 4 of the Finance Act 2006, and the date that Royal Assent was received
was 19 July 2006, which is one month after the date of the first break, on 3 May 2016. The date
(i.e. 27 May 2008) of the second break is associated with the global financial crisis, including the
nationalization and splitting of Bradford & Bingley and the part-nationalization of RBS and
Lloyds TSB. The date of the third break was 2 March 2010, which is associated with the
Corporation Tax Act 2010, Part 12. This Act received Royal Assent on 3 March 2010. The act
specified that “no one property or leasehold interest can account for more than 40% of the fair
value of the gross assets of the property rental business” and that “In the accounting period, at
least 75% of a REIT’s total income-profits (before tax) must arise from its tax-exempt property
rental business”. The date of the last break (i.e. 16 February 2012) is also associated with a
significant REIT regime change, namely the draft legislation that was published on 29 March
2012. The change reduced the entry barriers and increased the incentives for investors to invest
in REITs, which included the abolition of the 2% entry charge for companies entering the REITs.
[Insert Tables 1 and 2 Here]
4.1. Persistence of market regimes
The estimated regime durations in Table 2 indicate that the low volatility regime is the
most persistent, with the longest average duration across market regimes. We observed that the
longest average duration of the low volatility regime is 174 days for the All Equity REIT sector.
This suggests that the low volatility regime is the most persistent, while the average duration for
the extreme volatility regime is 14.9 days, as it has the most frequent regime switches. Our
findings are consistent with the current literature on herding, using MS models (see, for example,
Balcilar and Demirer, 2013)
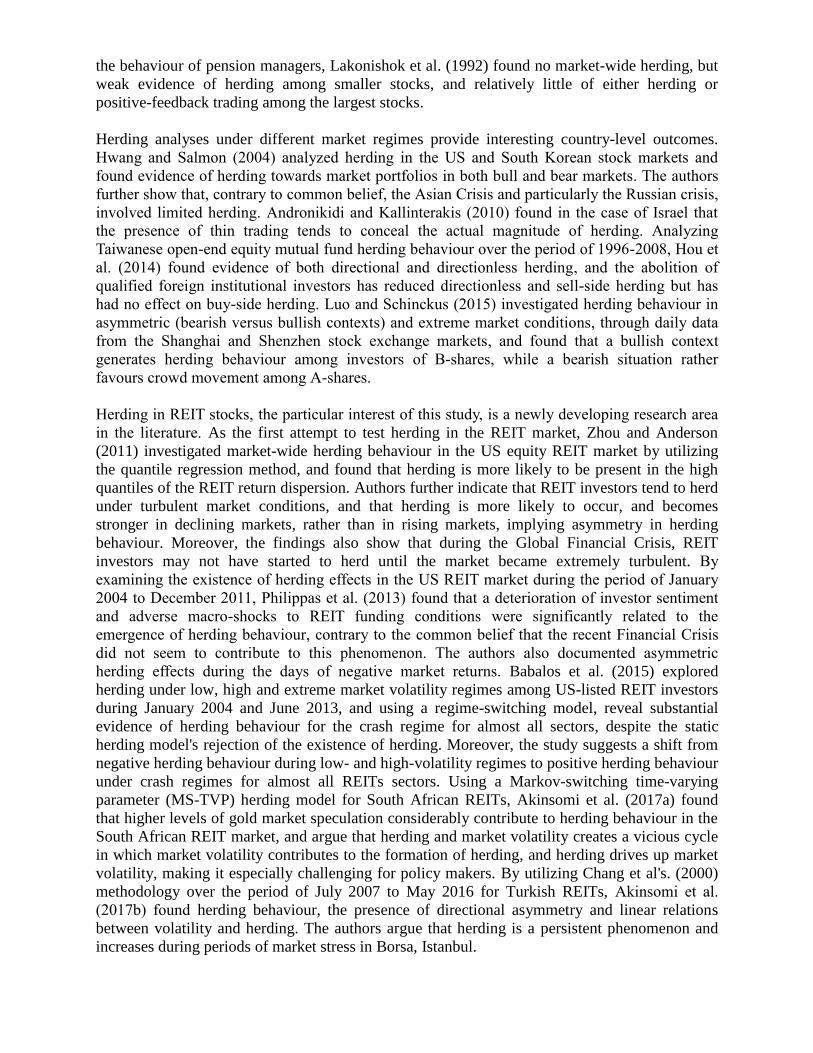
The transition probability estimate pij and its relevant smoothed probabilities, plotted in
Figure 1, provide a visual examination of the dynamic nature of regime transitions and herd
behaviour in the UK REITs market. The smoothed regime probabilities for the three-regime
nonlinear TVTP-MS model is plotted in Figures (a)-(c).
The smoothed probability plots generally suggest a low-high-extreme (LHE) volatility
9 Detailed results are available upon request.

transition order, in which the high-volatility regime (i.e. regime 1) follows the low volatility
regime (i.e. regime 2), and the extreme volatility/crash regime (i.e. regime 3) follows the high
volatility regime (i.e. regime 1). This finding is consistent with the evidence for advanced
markets and provides market regulators with a warning signal before the extreme volatility
regime (see, for example, Babalos et al., 2015). It is evident that the crash regime is followed by
the high volatility one10
. Another interesting pattern is exhibited by the fact that from late 2010
the market regime had entered a period of low volatility (regime 2).
4.2. VIX and time-varying transition probabilities
As explained earlier, the parameters, 𝜃𝑖𝑗 , 𝑖 = 0,1 𝑎𝑛𝑑 𝑗 = 1, 2, 3. in Equation (6) capture
the dynamic effects of the UK VIX return on transition probabilities across regimes. Significant
parameter estimates imply that the VIX plays a role in leading the UK REITs market from one
regime to another, possibly driving herding regimes. As described earlier, the lth
element of the
vector , that is, for 𝑖 = 0,1 𝑎𝑛𝑑 𝑗 = 1, 2, 3, is defined as {l = 0 (constant), 1 (VIXUK
return)} with two parameter estimates for the variable.
We find that the VIXUK is significant in driving regime transitions in the UK REITs
market, as indicated by the significant θ21,1 estimate. Our attention was drawn to the significant
transition probability estimates for switching from the high volatility regime (i.e. regime 1) to the
low volatility regime (i.e. regime 2), where the herding takes place. We therefore conclude that
the UK VIX does play a role in driving regime transition from high to low volatility.
[Insert Figure1 Here]
5. Conclusion
Due to globally increasing investment volumes in property, real estate has become an important
asset class since the 1990s. The Global Financial Crisis and the recent Brexit shock have also
showed that direct and indirect real estate investments in the UK are also highly sensitive to
uncertainties. This picture makes it of paramount importance to understand the risk-return
characteristics of UK REIT stocks for asset/portfolio managers and policy makers. The market
facts also confirm this approach. According to the LSE data, the market value of REITs –
involving diversified, specialty, retail, industrial and offices, residential, and diversified REITs –
is worth £ 43,544 million, and the overall market value of real estate holding and development,
real estate investment trusts, and real estate service sub-sectors is worth £ 82,386 million as at 31
November 2016.11
Moreover, the British Property Federation and Toscafund Asset Management
(2016) estimated that the market value of commercial real estate was £1,662 billion, just over
20% of net wealth, and contributed £94bn to GDP in 2014 in the UK.
As a first in the literature, the study employs static and dynamic models to explore herding in UK
REITs over the period June 2004 to April 2016. The study provides various elements of evidence
and interesting implications of herding behaviour in UK REITs.
From a methodology perspective, the study first suggests, in parallel with Babalos et al. (2015),
that a TVTP-MS model is a better fit for the data than is the static model. In this respect, the
10
For example, we observed that UK REITs were in the low volatility regime until the beginning of 2007, and then
from the beginning 2007 to the middle of 2008, the market return was driven mainly by the global financial crisis.
The market was dominated by extreme volatility between the end of 2008 and early 2009. 11
Available at: http://www.londonstockexchange.com/statistics/companies-and-issuers/companies-and-issuers.htm.
q̂
ij q̂
ij ,l

study defines the importance of modelling nonlinearity in a herding analysis. Second, given the
importance of nonlinearity, the static model, which suggests anti-herding behaviour, is
econometrically misspecified. Third, although the static herding model rejects the existence of
herding, the Markov regime-switching model defines three market regimes, namely the low,
high, and crash volatility regimes, and provides evidence of herding behaviour under the low
volatility regime but anti-herding behaviour in the high and crash regimes of volatility. In the
presence of nonlinearity, the Markov-switching model is clearly the correctly specified
econometric framework, and should be relied upon to draw inferences. Fourth, the evidence
further suggests that the low volatility regime is the most persistent market regime, with the
longest average regime duration involving 174 days, primarily in the post-2011 period (and to
some extent before the global financial crisis). Interestingly, this low-volatility herding period
essentially coincides with the bull market conditions of the LSE. Fifth, the model outcomes also
suggest a low-high-extreme (LHE) volatility transition order, and that the UK VIX does play a
role in driving regime transition from high to low volatility. In this respect, the high volatility
regime follows the low volatility regime, and the extreme volatility/crash regime follows the
high volatility regime. This herding cycle may translate as a shift from anti-herding behaviour
during high volatility regimes to herding behaviour under low volatility regimes.
These results have implications for decisions concerning asset allocation and portfolio
diversification in the UK REITs market. First, regarding the order of regime transitions, moving
from low to high and to extreme volatility suggests that the market follows a consistent pattern,
which warns investors and regulators of potential or imminent extreme volatility in the UK REIT
market. This behavioural pattern may provide significant foresight for market participants about
changes in REITs returns, depending on the consistent chain pattern in the REITs market. This
behaviour in the UK REIT market is similar to those of general stocks in developed markets,
where volatility transmits from low to high to crash (Balcilar et al., 2013). This result, however,
contradicts the findings of studies on developing markets, such as those of the Gulf States, which
shows that the market moves from low volatility to extreme volatility to high volatility (Balcilar
et al., 2013). Second, defining the low volatility regime of UK REITs as the most persistent
herding market regime in the rising period of the LSE suggests another interesting market
insight. This evidence implies that when the general stock market is doing well, which in turn
corresponds to low volatility, and hence, lower risks, agents in the REITs sector tend to herd, i.e.
to behave similarly. However, when the markets are highly volatile and risky, economic agents
operating in the REITs sector tend to behave differently from one another, in an attempt to
maximize their profits. Third, the source of the fluctuations in risk in the REITs sector originates
from the VIX, i.e. aggregate equity market risks, which spill over into the REITs sector as well,
implying that there are no diversification opportunities between conventional equities and the
REITs sector. Therefore, market participants in LSE and UK REITs may perceive that the risk
profile in the overall stock market and the property sector may be interconnected.
Overall, the aspects of evidence in this study collectively imply that UK REITs market
participants may improve their decision-making by utilizing the herding characteristics and
cycles of the REITs market during different volatility regimes, in addition to signals of overall
market behaviours through the LSE market index and the UK VIX.
REFERENCES
Akinsomi, O., Aye, G.C., Babalos, V., Fotini, E., and Gupta, R. (2016). “Real estate returns
predictability revisited: novel evidence from the US REITs market”. Empirical
Economics, Vol 51 No 3, pp. 1165-1190.
Akinsomi, O., Balcilar, M., Demirer, R., and Gupta, R. (2017a). “The effect of gold market

speculation on REIT returns in South Africa: a behavioural perspective”. Journal of
Economics and Finance, Vol. 41 No 4, pp. 774-793.
Akinsomi, O., Coskun, Y., and Gupta, R. (2017b). “Analysis of Herding in REITs of an
Emerging Market: The Case of Turkey”. Journal of Real Estate Portfolio Management
(Forthcoming).
Akerlof, G.A., and Shiller, R.J. (2009). Animal Spirits: How Human Psychology Drives the
Economy, and Why It Matters for Global Capitalism. Ninth Edition. Princeton University
Press.
Andronikidi, A., and Kallinterakis, V. (2010). “Thin trading and its impact upon herding: the case
of Israel”. Applied Economics Letters, Vol 17 No 18, pp. 1805-1810.
Assaf, A. (2015). “Long Memory and Level Shifts in REITs Returns and Volatility”.
International Review of Financial Analysis, Vol 42, pp. 172-182.
Barkham, R.J., and Ward, C.W.R. (1999), “Investor sentiment and noise traders: discount to net
asset value in listed property companies in the UK”. Journal of Real Estate Research, Vol 18
No 2, pp. 291-312.
Babalos, V., Balcilar, M., and Gupta, R. (2015). “Herding behaviour in real estate markets: Novel
evidence from a Markov-switching model”. Journal of Behavioural and Experimental
Finance, Vol 8, pp.40-43.
Bai, J., and Perron, P. 2003. “Computation and analysis of multiple structural change models”.
Journal of Applied Econometrics, Vol 18 No 1, pp. 1-22.
Balcilar, M., Demirer, R., and Hammoudeh, S. (2013a). “Investor herds and regime-switching:
Evidence from Gulf Arab stock markets”. Journal of International Financial Markets,
Institutions & Money, Vol 23, pp. 295-321.
Balcilar, M., Demirer, R., Hammoudeh, S.M., and Khalifa, A.A. (2013b). “Do Global Shocks
Drive Investor Herds in Oil-Rich Frontier Markets”? Working paper, Department of
Economics, Eastern Mediterranean University, pp. 1-30.
Bikhchandani, S., and Sharma, S. (2001). “Herd behaviour in financial markets”. IMF Staff
Papers, Vol 47 No 3, pp. 279-310.
Brock, W., Dechert, D., Scheinkman, J., LeBaron, B. (1996). “A test for independence based on
the correlation dimension”. Econometric Reviews, Vol 15 No 3, pp. 197-235.
Chang, E. C., Cheng, J. W., and Khorana, A. (2000). "An Examination of Herd Behaviour in
Equity Markets: An International Perspective." Journal of Banking and Finance, Vol 24 No
10, pp. 1651-1699.
Chevalier, J., and Ellison, G. (1999). “Career Concerns of Mutual Fund Managers”. Quarterly
Journal of Economics, Vol 114 No 2, pp. 389-432.
Christie, W. G. and Huang, R. D. (1995). “Following the Pied Piper: Do individual Returns Herd
around the Market”? Financial Analyst Journal, Vol 51 No 4, pp. 31-37.
Clement, M. B., and Tse, S. Y. (2005). “Financial analyst characteristics and herding behaviour
in forecasting”. Journal of Finance, Vol 60 No 1, pp. 307-341.
Corradin, S. and Fontana, A. (2013). “House Price Cycles in Europe”. Working Paper. No. 1613.
European Central Bank, pp. 1-43.
Devenow, A., and Welch, I. (1996). “Rational herding in financial economics”. European
Economic Review, Vol 40 No 3-5, pp. 603-615.
Galariotis, E.C., Rong, W., and Spyrou, S.I. (2015). “Herding on fundamental information: A
comparative study”. Journal of Banking & Finance, Vol 50, pp. 589-598.
Gleason, C. A., and Lee, C. M. C. (2003). “Analyst forecast revisions and market price
discovery”. The Accounting Review, Vol 78 No 1, pp. 193-225.
Grinblatt, M., Titman, S., and Wermers, R. (1995). “Momentum Investment Strategies, Portfolio
Performance, and Herding: A Study of Mutual Fund Behaviour”. American Economic
Review, Vol 85 No 5, pp. 1088-1105.
Graham, J. R. (1999). “Herding among investment newsletters: theory and evidence”. Journal of

Finance, Vol 54 No 1, pp. 237-268.
Hong, H., Kudik, J. D., and Solomon, A. (2000). “Security Analysts’ Career Concerns and
Herding of Earnings Forecasts”. RAND Journal of Economics, Vol 31 No 1, pp. 121-44.
Hou, T.C-T., McKnight, P.J., and Weir, C. (2014). “The impacts of stock characteristics and
regulatory change on mutual fund herding in Taiwan”. Applied Financial Economics, Vol 24
No 3, pp. 175-186.
Hwang, S., Salmon, M. (2004). “Market stress and herding". Journal of Empirical Finance, Vol
11 No 4, pp. 585-616.
Jadevicius, A., and Lee, S. (2017). “UK REITs don’t like Mondays”. Journal of Property
Investment & Finance, Vol. 35 No 1, pp. 58-74.
Kindleberger, C.P., and Aliber, R.Z. (2005). Manias, Panics, and Crashes: A History of
Financial Crises. Fifth Edition. Wiley.
Krystalogianni, A., and Tsolacos, S. (2004). "Regime switching in yield structures and real estate
investment". Journal of Property Research, Vol 21 No 4, pp. 279-299.
Lakonishok, J., Shleifer, A., and Vishny, R. W. (1992). “The Impact of Institutional Trading on
Stock Prices”. Journal of Financial Economics, Vol 32 No 1, pp. 23-43.
Lee, C-C., Liang, C-M., and Chou, H-J. (2013). “Identifying Taiwan real estate cycle turning
points – An application of the multivariate Markov-switching autoregressive Model”. Advances
in Management & Applied Economics, Vol 3 No 2, pp. 1-23.
Lee, S. (2013). The Effective Number of Risk Factors in UK Property Portfolios. No. 15.
Working Paper Series. Cass Business School.
Liow, K.H., and Zhu, H. (2007) "Regime switching and asset allocation: Evidence from
international real estate security markets"., Journal of Property Investment & Finance,
Vol. 25 Issue 3, pp.274-288, https://doi.org/10.1108/14635780710746920.
Luo, Z., and Schinckus, C. (2015). “Herding behaviour in asymmetric and extreme situations:
the case of China”. Applied Economics Letters, Vol 22 No 11, pp. 869-873.
Maitland-Smith, J. K., and Brooks, C. (1999). “Threshold autoregressive and Markov switching
models: an application to commercial real estate”. Journal of Property Research. Vol 16,
Issue 1, pp. 1-19.
Morri, G. and Baccarin, A. (2016). “European REITs NAV discount: do investors believe in
property appraisal”? Journal of Property Investment & Finance. Vol 34 No 4, pp. 347-374.
Newell, G., Marzuki, B., and Jufri, M. (2016). “The Significance and Performance of UK-REITs
in a Mixed-Asset Portfolio”. Journal of European Real Estate Research, Vol 9 No 2, pp.
171- 182.
Ngene, G.M., Sohn, D.P., and Hassan, M.K. (2017). “Time-Varying and Spatial Herding
Behaviour in the US Housing Market: Evidence from Direct Housing Prices”. Journal of
Real Estate Finance and Economics, Vol 54 No 4, pp. 482-514.
Philippas, N., Economou, F., Babalos, V., Kostakis, A. (2013). “Herding behaviour in REITs:
Novel tests and the role of financial crisis”. International Review of Financial Analysis, Vol
29, pp. 166-174.
British Property Federation and Toscafund Asset Management (2016). “Britain’s Property
credentials”. Available at: http://www.bpf.org.uk/sites/default/files/resources/Britains-
Property-CREdentials-Report-Jan-2016.pdf.
Welch, I. (2000). “Herding among security analysts”. Journal of Financial Economics, Vol 58
No 3, pp. 369-396.
Wermers, R. (1999). “Mutual fund herding and the impact on stock prices”. Journal of Finance,
Vol 54 No 2, pp. 581–622.
Zhou, J. and Anderson, R.I. (2013). “An Empirical Investigation of Herding Behaviour in the
U.S. REIT Market”. The Journal of Real Estate Finance and Economics, Vol 47 No 1, pp.
83-108.

Table 1. Estimates of the static model
α0 α1 α2 RSS logL AIC adj.R2
0.6975*** 0.7320*** 0.03784*** 1149.17 -2847.37 1.857 0.8314
Note: The table reports the estimates for CSAD in Equation (2). All estimations were done using the ordinary least
squares (OLS) with the Newey-West heteroskedasticity and autocorrelation consistent (HAC) standard errors. RSS
denotes residual sum of squares, log L denotes the log likelihood of the OLS model, AIC denotes the Akaike
information criterion, and adj. R2 denotes the adjusted coefficient of determination. *** represent significance at the
1% level. A significant and positive α2 estimate implies anti-herding behaviour.

Table 2. Estimates for the regime-based herding model with the UK VIX
Parameter All Equity REITs
1.0574***
0.5746***
2.1972***
0.2666***
0.6346***
0.0721
Herding coefficients
0.0473***
-0.0734***
0.1002***
Regime volatilities
0.0700***
0.0245***
0.8391**
Time-varying transition probabilities
3.8434***
0.0813
0.8527***
0.1858*
-0.2056***
-0.0379
6.0929***
0.0326
-2.8175***
-0.0597
-4.6643***
0.0223
Regime durations
37.5
174
14.9
AIC 0.431
log L -643.521
Notes: This table presents the estimates of the three regime TVTP-MSH model given in Equations (3) through (6).
The asterisks ***, ** and * represent significance at the 1%, 5%, and 10% levels, respectively.

Table A1. Estimates of the static model (2007-2016)
Table A1. Estimates of the static model (2007-2016)
α0 α1 α2 RSS logL AIC adj.R2
0.76431*** 0.72106*** 0.03813*** 1052.35 -2424.7 2.0088 0.8396
Note: The table reports the estimates for CSAD in Equation (2). All estimations were done using the ordinary least
squares (OLS) with the Newey-West heteroskedasticity and autocorrelation consistent (HAC) standard errors. RSS
denotes residual sum of squares, log L denotes the log likelihood of the OLS model, AIC denotes the Akaike
information criterion, and adj. R2 denotes the adjusted coefficient of determination. *** represents significance at
the 1% level. A significant and positive α2 estimate implies anti-herding behaviour.

Table A2. Estimates for the regime-based herding model with UK VIX (2007-2016)
Parameter All Equity REITs
0.87334***
1.85006***
0.66114***
0.73757***
0.5531***
0.4751***
Herding coefficients
-0.1064***
0.0426***
-0.0351***
Regime volatilities
0.0999***
1.8448***
0.01414**
Time-varying transition probabilities
2.7332***
0.0562
2.9816**
-0.2267**
-1.399***
0.00412
6.3322***
-0.1168
-2.9491***
0.0536**
-22.693
0.0033
Regime durations
14.4 29.6 21.4
AIC 0.647
log L -757.449
Notes: This table presents the estimates of the three regime TVTP-MSH model given in Equations (3) through (6).
The asterisks ***, ** and * represent significance at the 1%, 5%, and 10% levels, respectively.
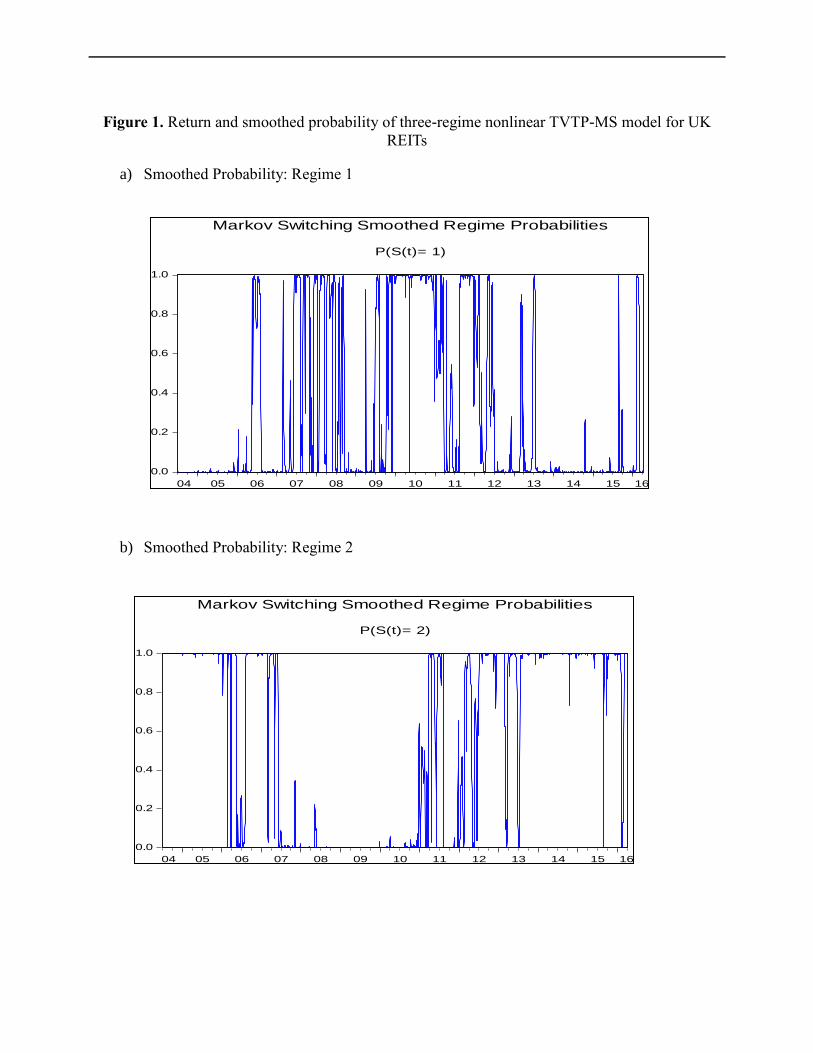
Figure 1. Return and smoothed probability of three-regime nonlinear TVTP-MS model for UK
REITs
a) Smoothed Probability: Regime 1
b) Smoothed Probability: Regime 2
0.0
0.2
0.4
0.6
0.8
1.0
04 05 06 07 08 09 10 11 12 13 14 15 16
P(S(t)= 1)
Markov Switching Smoothed Regime Probabilities
0.0
0.2
0.4
0.6
0.8
1.0
04 05 06 07 08 09 10 11 12 13 14 15 16
P(S(t)= 2)
Markov Switching Smoothed Regime Probabilities

c) Smoothed Probability: Regime 3
0.0
0.2
0.4
0.6
0.8
1.0
04 05 06 07 08 09 10 11 12 13 14 15 16
P(S(t)= 3)
Markov Switching Smoothed Regime Probabilities

d) Time-Varying Markov Transition Probabilities
0.0
0.2
0.4
0.6
0.8
1.0
04 05 06 07 08 09 10 11 12 13 14 15 16
Pr(S(t)=1| S(t-1)=1)
0.0
0.2
0.4
0.6
0.8
1.0
04 05 06 07 08 09 10 11 12 13 14 15 16
Pr(S(t)=2| S(t-1)=1)
0.0
0.2
0.4
0.6
0.8
1.0
04 05 06 07 08 09 10 11 12 13 14 15 16
Pr(S(t)=3| S(t-1)=1)
0.0
0.2
0.4
0.6
0.8
1.0
04 05 06 07 08 09 10 11 12 13 14 15 16
Pr(S(t)=1| S(t-1)=2)
0.0
0.2
0.4
0.6
0.8
1.0
04 05 06 07 08 09 10 11 12 13 14 15 16
Pr(S(t)=2| S(t-1)=2)
0.0
0.2
0.4
0.6
0.8
1.0
04 05 06 07 08 09 10 11 12 13 14 15 16
Pr(S(t)=3| S(t-1)=2)
0.0
0.2
0.4
0.6
0.8
1.0
04 05 06 07 08 09 10 11 12 13 14 15 16
Pr(S(t)=1| S(t-1)=3)
0.0
0.2
0.4
0.6
0.8
1.0
04 05 06 07 08 09 10 11 12 13 14 15 16
Pr(S(t)=2| S(t-1)=3)
0.0
0.2
0.4
0.6
0.8
1.0
04 05 06 07 08 09 10 11 12 13 14 15 16
Pr(S(t)=3| S(t-1)=3)
Time-varying Markov Transition Probabilities

Table A1. BDS test on residual of
Equation 2 (Static Model)
Dimension
BDS
Statistic Std. Error z-Statistic Prob.
2 0.0652 0.0020 32.7078 0.0000
3 0.1203 0.0032 37.9167 0.0000
4 0.1571 0.0038 41.5370 0.0000
5 0.1794 0.0039 45.4485 0.0000
6 0.1907 0.0038 50.0301 0.0000
Raw epsilon 0.0058
Pairs within epsilon 6628888 V-Statistic 0.7033
Triples within epsilon 1.59E+10 V-Statistic 0.5499
Dimension C(m,n) c(m,n)
C(1,n-(m-
1))
c(1,n-(m-
1))
c(1,n-(m-
1))^k
2 2634800 0.5597 3310342 0.7032 0.4944
3 2200863 0.4678 3307738 0.7031 0.3475
4 1886874 0.4013 3305260 0.7030 0.2442
5 1649088 0.3510 3302663 0.7029 0.1716
6 1461537 0.3113 3300162 0.7028 0.1205
Note: m stands for the number of (embedded) dimensions that embed the time series into m-dimensional vectors, by
taking each m successive point in the series. The BDS z-statistic tests for the null of i.i.d. residuals.