impact of tumour microenvironmental factors on … · impact of tumour microenvironmental factors...
TRANSCRIPT

Aus dem Fachbereich Pharmazie
der Johann Wolfgang Goethe-Universität
Frankfurt am Main
Institut für Biochemie I – Pathobiochemie
Impact of tumour microenvironmental factors on dendritic cell
differentiation and function
Dissertation for attaining the PhD degree of Natural Sciences
Submitted to the Faculty
of the Johann Wolfgang Goethe University
in Frankfurt am Main
by
Divya Sekar
Shimoga, India
Frankfurt 2012

Accepted by the Faculty of Pharmacy of the
Johann Wolfgang Goethe University as a dissertation.
Dean: Prof. Dr. rer. nat. Thomas Prisner
Expert assessor : Prof. Dr. rer. nat. Manfred Schubert-Zsilavecz
Expert co-assessor : Prof. Dr. rer. nat. B. Brüne
Date of the disputation:

Inquiry is the highest wisdom
(Translated from Sanskrit)
INDEX
1 Summary 1
2 Zusammenfassung 4
3 Introduction 10
3.1 The inflammatory tumor microenvironment 10
3.2 Dendritic cells 13
3.3 DC subtypes and their role in immunity 13
3.4 Role of mDC in effector immunity 15 3.4.1 mDC in tumour tolerance induction 16 3.4.2 mDC and T cell interaction 16 3.4.3 DC-Treg interaction in tumour-bearers 18 3.4.4 Different states of immunosuppressive DC in tumour-bearing animals 18 3.4.5 Uptake of dying tumour cell-derived factors by DC 19 3.4.6 Types of cell death 19 3.4.7 Cell death-induced immune responses 21
3.5 pDC roles in immunotherapy 22
3.6 DC development 24 3.6.1 Precursors involved in DC subset development 24 3.6.2 Cytokines that shape pDC development and the myeloid progenitor hypothesis 26 3.6.3 Transcriptional machinery involved in pDC development 26 3.6.4 Hypoxia as a microenvironmental factor in hematopoiesis 28
3.7 Aims of this study 29
4 Materials 31
4.1 Chemicals and Reagents 31
4.2 Buffers and Solutions 33
4.3 Pre-made Buffers 36
4.4 Dye and beads 36
4.5 Kits 37
4.6 Antibodies 37 4.6.1 Human FACS antibodies: 37 4.6.2 Human Neutralizing antibodies 38
4.6.3 Murine FACS antibodies 39 4.6.4 Primary human antibodies: 40 4.6.5 Secondary human antibodies: 40
4.7 Microbeads: 40
4.8 Media and reagents for cell culture 40
4.9 Cytokines 41
4.10 ELISA 41
4.11 Stimulators and Inhibitors 41
4.12 Oligonucleotides 42
4.13 Cells and cell lines 43
4.14 Instruments 43
4.15 Plastic material 45
4.16 Software 45
5 Methods 46
5.1 Cell culture 46
5.2 Primary human immune cell isolation and expansion 46
5.3 Animals 46
5.4 Generation and maturation of plasmacytoid and myeloid DC 47
5.5 Isolation of primary pDC 47
5.6 Murine pDC generation from bone marriow and hypoxic culture 47
5.7 Preparation of tumour cell supernatants 48
5.8 DC-T cell co-culture 49
5.9 Treg isolation and CD39+ cell isolation 49
5.10 Stimulation of human monocyte-derived DC 49
5.11 Cytotoxicity assay 50
5.12 Flow cytometry of human DC 51
5.13 Murine Polychromatic flow cytometry 52
5.14 RNA isolation, cDNA synthesis and qPCR 53
5.15 Cytokine quantitation 53
5.16 T lymphocyte proliferation assay 54
5.17 Apoptotic cell phagocytosis assay 54
5.18 Western blot analysis 55
5.19 IFN-α intracellular staining (ICS) 55
5.20 IFN-α bioassay 55
5.21 Statistical analysis 55
6 Results 56
6.1 Ex-vivo mo-pDC generation and study under hypoxia 56 6.1.1 Generation and characterization of mo-pDC from human monocytes using Flt3-L 56 6.1.2 Expression of pDC developmental transcription factors by mo-pDC 60 6.1.3 Functional validation of mo-pDC 61 6.1.4 IFN-α production by mo-pDC 62 6.1.5 Augmenting IFN-α production by mo-pDC 64 6.1.6 Phenotypical differences between normoxia and hypoxia differentiated mo-pDC 66
6.2 Study of mice pDC development under the influence of HIF-1 and hypoxia 69 6.2.1 Increased pDC frequency in HIF-1fl/fl LysM-Cre mice 69 6.2.2 Hypoxia/HIF-1 represses pDC differentiation from whole bone marrow in vitro 70 6.2.3 Altered immune cell populations in Flt3L-expanded bone marrow cultures dependent on
O2 supply 72
6.3 Generation of regulatory T cells by IL-27 secreting DC under the impact of
apoptotic cell-derived factors 74 6.3.1 Priming with apoptotic tumour cell supernatants suppresses DC-dependent tumour cell
killing 75 6.3.2 Accumulation of CD39/CD69-expressing FoxP3+ Treg in ACM-primed co-cultures 77 6.3.3 S1P in ACM confers suppression of cytotoxicity by activating S1PR4 on DC 82 6.3.4 ACM-primed DC secrete IL-27 to activate suppressive Treg 84 6.3.5 Suppression of cytotoxicity is reduced by interference with adenosine generation 89
7 Discussion 96
7.1 mo-pDC generation ex-vivo brought about by evoking pDC developmental genes 96
7.2 Under hypoxia mo-pDC development is halted to produce non-functional cells 99
7.3 Mouse pDC differentiation in vitro is inhibited by hypoxia-induced HIF-1 100
7.4 Apoptotic cell priming in reducing cytotoxicity and inducing Tregs in DC dependent
priming 103

7.5 The Adenosine pathway is utilized by Treg to cause immunosuppression 105
8 Concluding remarks 108
9 References 111
10 Publications 119
11 Acknowledgements 120
12 Curriculum Vitae 121
13 Ehrenwörtliche Erklärung 122
LIST OF FIGURES
Figure 1: Tumour microenviromental stress factors. 10 Figure 2: Immune cells infiltrating the tumour microenvironment 12 Figure 3: DC play multiple roles in immunity. 14 Figure 4: Role of mDC in effector Th immunity 15 Figure 5: Modes of cell death and the factors released 20 Figure 6: Exposure of phagocytes to NC or AC-derived signals 22 Figure 7: pDC roles in immunity 23 Figure 8: DC subset development theories 25 Figure 9: Transcription factors (TF) involved in pDC development 27 Figure 10: Cytotoxicity assay was performed as depicted 50 Figure 11. Morphology of mo-pDC compared to mDC and macrophages 57 Figure 12. Mo-pDC differ in surface marker expression compared to mDC 58 Figure 13. Expression of pDC lineage determining transcription factor E2-2 and E2-2-
controlled BDCA2. 60 Figure 14. Functional validation of mo-pDC versus mDC 61 Figure 15. IFN-α production by mo-pDC 63 Figure 16. Expression of E2-2, ID2 and E2-2-controlled BDCA2 in normoxia and hypoxia
differentiated mo-pDC. 66 Figure 17. Mo-pDC generated under normoxia vs. hypoxia express different surface and
functional markers 68 Figure 18: Generation of HIF-1fl/fl LysM-Cre mice 70 Figure 19. Hypoxia-induced HIF-1 suppresses pDC differentiation in vitro 71 Figure 20. Differentiation of bone marrow under 5% O2 blocks pDC differentiation and
expands cDC. 73 Figure 21. Basal DC phenotype upon activation with tumour cell supernatants 74 Figure 22. Experimental outline 75 Figure 23. Viable cancer cell supernatants prime whereas supernatants of apoptotic cells
suppress specific cytotoxicity. 76 Figure 24. Relative amounts of T cell subsets and FoxP3-expressing Tregs 77 Figure 25. Apoptotic cell supernatants induce CD39 and CD69-expressing Treg 78 Figure 26. Purity of isolated CD4+CD25+ Treg 79 Figure 27. Treg confer ACM-induced suppression of cytotoxicity 80 Figure 28. CD39 depletion restores ACM-induced suppression of cytotoxicity 81 Figure 29. ACM-dependent suppression of cytotoxicity functions through S1P receptors 82 Figure 30. S1PR4 on DC conveys ACM-dependent suppression of cytotoxicity 83 Figure 31. Addition of S1P to VCM mimics ACM 84 Figure 32. ACM-induced IDO expression and the effect of IDO inhibition on ACM-induced
suppression of cytotoxicity. 85
Figure 33. Influence of ACM on cytokine induction 86 Figure 34. ACM induces IL-27 in DC in a S1PR4-dependent manner to generate Treg 88 Figure 35. OXA-ACM exhibits higher cytotoxicity compared to STS-ACM 89 Figure 36. IL-10 and TGF-β are not involved in suppressing cytotoxicity 90 Figure 37. Relative expression of ectonucleotidases CD39 or CD73 by T cells 91 Figure 38. Inhibition of ectonucleotidases and adenosine receptor A2a restores cytotoxicity 92 Figure 39. Surface profiling of doublet T cell populations. 93 Figure 40. CD39/CD69-expressing Treg are enriched in CD4+CD8+ doublet events. 94 Figure 41. CD69 neutralization reduces the doublet T cell population 95 Figure 42: Transcription factors (TF) profile during pDC development under normoxia and
hypoxia 97 Figure 43: pDC development under normoxia and hypoxia 101 Figure 44: Pathway leading to suppression of anti-tumour immunity by apoptotic tumour cell
priming of DC: 106
LIST OF TABLES
Table 1: Quantification of surface marker expression 59 Table 2: Surface marker expression at normoxia versus hypoxia’ 67

Abbreviations A2a adenosine receptor
AC Apoptotic cells
ACM Apoptotic cell conditioned medium
ANOVA Analysis of variance
APS Ammonium persulfate
ARNT Aryl hydrocarbon receptor nuclear translocator
ATP Adenosine triphosphate
ATRA All-trans retinoic acid
BDCA Blood dendritic cell antigen
BFA Brefeldin A
BSA Bovine serum albumin
CCR C-C chemokine receptor
CD Cluster of differentiation
CFSE Carboxyfluorescein succinimidyl ester
CMAC 7-amino-4-chloromethylcoumarin
CpG —C—phosphate—G—
CSF Colony stimulating factor
CXCL Chemokine (C-X-C motif) ligand
DMEM Dulbecco’s modified eagle medium
DMSO Dimethylsulfoxide
DNA Deoxyribonucleic acid
DTT Dithiothreitole
EDTA Ethylene diamine tetra acetate
FCS Fetal calf serum
Flt3-L Fms-related tyrosine kinase 3 ligand
FITC Fluoreszeinisothiocyanat
FMO fluorescence minus one
GM-CSF Granulocyte macrophage-colony stimulating factor
HIF Hypoxia-inducible factor
HMGB High-mobility group box
ICAM Intercellular adhesion molecule
ID Inhibitor of DNA-binding/differentiation proteins
IDO indolamine-2,3-dioxygenase
IFN Interferon
Ig Immunoglobulin
IL Interleukin
KCl Potassium chloride
KH2PO4 Potassium hydrogen phosphate
KHCO3 Potassium hydrogen carbonate
LPC Lysophosphatidylcholine
LPS Lipopolysacharide
MCP Monocyte chemotactic protein-1
MFG-EF Milk fat globule-EGF factor
MgCl2 Magnesium chloride
MgSO4 Magnesium sulfate
MHC Major histocompatibility complex
Na2HPO4 Sodium hydrogen phosphate
NaCl Sodium chloride
NC Necrotic cells
NCM Necrotic condition medium
NH4Cl Ammonium chloride
ODN Oligonucleotides
OXA Oxaliplatin
PBMCs Peripheral blood mononuclear cells
PBS Phosphate buffered saline
PI Propidium iodide
PtdSer Phosphatidylserine
RAGE Receptor for Advanced Glycation Endproducts
RANTES Regulated upon Activation, Normal T-cell Expressed,
and Secreted
RPMI Roswell park memorial institute
S1P Sphingosine-1-phosphate
S1PR S1P receptor
SD Standard deviation
SDF Stromal cell derived factor
SDS Sodium dodecyl sulfate
STAT Signal Transducers and Activators of Transcription
Sts Staurosporine
Tc cytotoxic T cells
TCR T-cell receptor (TCR)
TEMED Tetraethylendiamine
TGF Transforming growth factor
Th Helper T cells
TIM T-cell immunoglobulin- and mucin-domain-containing
molecule
TLR Toll-like receptor
TNF Tumor necrosis factor
UTP Uridine triphosphate

VCM Viable condition medium
VEGF Vascular endothelial growth factor
Summary 1
1 Summary
Tumour cells that exhibit aberrant outgrowth have evolved various ways to
escape detection by the immune system. In addition to modifications in the
surface repertoire of its individual cells to avoid immune surveillance, the
tumour exhibits alterations in its microenvironment. These are among others
altered oxygen levels in the tumour core or shedding of biochemical factors by
tumour cells that in turn modify the functions of phagocytes such as Dendritic
cells (DC). DC are professional antigen-presenting cells, which play mutiple
roles in immunity, achieved by specialization into different functional subsets.
Myeloid DC (mDC) are efficient in antigen presentation, thereby activating
immunity, whereas plasmacytoid DC (pDC) act as rheostats of the immune
system. PDC activate natural killer cells and cause activation of bystander
mDC, but also interact with T cells to induce tolerance. This ambiguity
positions pDC at the centre of inflammatory diseases such as cancer, arthritis
and autoimmune diseases.
Protocols to generate human mDC ex vivo made it possible to engineer these
cells to suit therapeutic needs. Unfortunately, a similar easily accessible
system to generate human pDC was not available. A first goal of this study
was therefore to develop a method to generate human pDC equivalents ex
vivo from peripheral blood monocytes, termed mo-pDC (monocyte-derived
pDC), using Fms-related tyrosine kinase 3 ligand (Flt3-L). Mo-pDC showed a
characteristic pDC surface protein marker profile, as well as a low capacity to
induce autologous lymphocyte proliferation and to phagocytose apoptotic
debris in comparison to mDC. Furthermore, mo-pDC upregulated the pDC
lineage-determining transcription factor E2-2 during differentiation and
expressed the E2-2 target gene BDCA2. Importantly, mo-pDC produced high
levels of interferon-α (IFN-α), the main functional parameter of pDC, when
pre-treated with tumour necrosis factor-α (TNF-α) and/or when differentiated
additionally with vitamin D3 or all-trans retinoic acid. When differentiated
under hypoxia, E2-2 and its target gene BDCA2 were downregulated in mo-
pDC. Furthermore, mo-pDC differentiated under hypoxia did not secrete
Summary 2
IFN-α, but produced high levels of other inflammatory cytokines. Hence, mo-
pDC can be used to study differentiation and function of human pDC.
Strikingly, hypoxia also blocked differentiation of mouse pDC from bone
marrow precursors. Hypoxia-inducible factor 1 (HIF-1α)-dependent
repression of E2-2 via its transcriptional counterpart ID2 seemed to be a
crucial factor in disturbing the differentiation of precursors into pDC, since
pDC differentiation was normal when culturing HIF-1fl/fl LysM-Cre bone
marrow under hypoxia. In addition, the differentiation of mouse pDC under
hypoxia followed a similar transcription factor regulation pattern compared
with human mo-pDC.
Hypoxia plays an important role in the pathogenesis of pulmonary disease,
stroke, heart disease and cancer. In cancer, hypoxia is one of the tumour
stress factors that topple anti-tumour immunity. Intrinsic immunosuppression
is a major obstacle for successful therapy of tumours. Despite some progress,
mechanisms how immunosuppression is induced and regulated in cancer
patients are ill-defined. Besides hypoxia, a microenvironmental component
that might prevent anti-tumour immunity is the presence of dying tumour cells.
Apoptosis of tumour cells is abundant in tumour under steady-state conditions
and is largely increased following conventional cancer ablation methods such
as chemo- or radiotherapy. Shedding of apoptotic debris and/or secretion of
factors to the tumour bed or draining lymph nodes might have a profound
impact on professional phagocytes such as dendritic cells (DC) and the
subsequent priming of lymphocyte responses. To clarify this, we exposed
human myeloid DC to supernatants of living, apoptotic or necrotic human
breast cancer cell supernatants, followed by their co-culture with autologous T
cells. Priming with apoptotic debris prevented DC from establishing
cytotoxicity towards living human tumour cells by inducing a regulatory T cell
(Treg) population, defined by co-expression of CD39 and CD69.
Immunosuppression via Treg was transferable to viable tumour cell-primed
co-cultures and required the bioactive lipid sphingosine-1-phosphate (S1P),
present in apoptotic cell supernatants and acting via S1P receptor 4 on DC to

Summary 3
induce IL-27 secretion. We propose that CD69-expression on CD39+ Treg
enables them to interact with CD73-expressing CD8+ T cells to generate
adenosine, which acts via adenosine receptor A2a on cytotoxic T cells to
suppress their function. These findings might aid the understanding how dying
tumour cells limit anti-tumour immunity and might provide cues to improve
anti-tumour immunotherapy. In conclusion, the findings described here identify
mechanisms how tumour microenvironmental factors influence human DC
subtype function. Understanding these mechanisms can give valuable hints
for choosing functional immunotherapy targets or chemotherapy regimens for
the treatment of cancer.

Zusammenfassung 4
2 Zusammenfassung
Um aberrant auswachsen zu können müssen Tumorzellen in vielfältiger
Weise evolutive Prozesse durchlaufen, die es Ihnen ermöglichen der
Erkennung durch das körpereigene Immunsystem zu entkommen. Zusätzlich
zur Modifikation der Oberflächensignatur einzelner Tumorzellen, zur
Vermeidung einer effizienten Immun-Überwachung, weisen Tumore eine
Modifikation ihrer Mikroumgebung auf. Diese Veränderungen entstehen
einerseits passiv, z.B. durch veränderte Sauerstoffkonzentrationen
überwiegend im Tumorkern, aber andererseits auch aktiv, durch die
Freisetzung biochemischer Faktoren aus Tumorzellen. Diese Faktoren sind in
der Lage die Funktion von Tumor-assoziierten Phagozyten, wie z.B.
Dendritischen Zellen (DC) zu modifizieren. Solcherart durch die
Tumormikroumgebung polarisierte Immunzellen fördern das Tumorwachstum
in vielfältiger Weise.
Bei DC handelt es sich um professionelle Antigen-präsentierende Zellen, die
ihre vielfältigen Rollen im Immunsystem durch Spezialisierung in
verschiedene funktionale Subtypen sicherstellen. Beispielsweise sind
myeloische DC (mDC) besonders effizient in Hinsicht auf die Präsentation von
Antigenen, wohingegen plasmazytoide DC (pDC) eher regulatorisch auf das
Immunsystem einwirken. Sie sind in der Lage natürliche Killerzellen oder
benachbarte mDC zu aktivieren, interagieren aber auch mit T Zellen um
Immuntoleranz zu erzeugen. Diese doppelsinnige Funktionsweise positioniert
pDC im Zentrum der Regulation inflammatorischer Erkrankungen zu denen
u.a. die Karzinogenese, aber auch Arthritis und Autoimmunerkrankungen
gehören.
Auch mDC spielen eine wichtige Rolle bei der Karzinogenese. Weiterhin wird
Ihnen ein großes Potential zur Initiation einer Anti-Tumor-Immunreaktion
zugeschrieben. Humane mDC können ex vivo aus Monozyten hergestellt
werden. Folgerichtig werden aus Monozyten hergestellte, funktionell
maßgeschneiderte humane mDC schon heute zur Therapie von Tumoren
Zusammenfassung 5
klinisch erprobt. In Mausmodellen wird das Anti-Tumor-Potential von ex vivo
generierten mDC durch pDC extrem verstärkt. Leider war es bisher nicht
möglich humane pDC in ausreichender Menge für therapeutische
Applikationen, in Analogie zur Generierung von mDC, herzustellen.
Aus diesem Grund war ein erstes Ziel dieser Arbeit eine Methode zur
Generierung von humanen pDC, oder zumindest Zellen mit äquivalenter
Funktion, aus Vorläuferzellen zu entwickeln. In Analogie zur Herstellung von
mDC wurden Monozyten peripherem Humanblut als Vorläuferzellen
eingesetzt. Diese wurden mittels des Wachstumsfaktors Fms-related tyrosine
kinase 3 ligand (Flt3-L) zu pDC-Äquivalenten differenziert, welche als
monocyte-derived pDC (mo-pDC) bezeichnet wurden. In der Tat zeigten mo-
pDC ein für humane pDC charakteristisches Oberflächenmarkerprofil, u.a.
eine hohe Expression des Interleukin 3 (IL-3) Rezeptors CD123 und des
blood dendritic cell antigen 4 (BDCA4). Weiterhin zeigten mo-pDC eine
geringe Expression des kostimulatorischen Moleküls CD86 und des toll-like
receptor 4 (TLR4) welche für mDC charakteristisch sind. Auch funktional
waren mo-pDC klar von mDC zu unterscheiden. Sie wiesen, im Vergleich zu
mDC, eine geringe Kapazität zur Induktion der Proliferation autologer T Zellen
auf. Auch die Phagozytose apoptotischer Zellen war in mo-pDC in Vergleich
zu mDC verringert. Die Flt3-L-vermittelte Differenzierung von Monozyten zu
pDC-Äquivalenten war auch auf der Ebene der Expression
populationsspezifischer Transkriptionsfaktoren ersichtlich. Mo-pDC erwarben
im Verlauf ihrer Differenzierung aus Monozyten eine kontinuierlich erhöhte
Expression des pDC-spezifischen Transkriptionfaktors E2-2 und exprimierten
erhöhte Mengen des pDC-spezifischen Oberflächenmarkers BDCA2, welcher
unter der transkriptionellen Kontrolle von E2-2 steht. Die wichtigste Funktion
von pDC ist die Produktion großer Mengen von Interferon-α (IFN-α) in Antwort
auf eine Virusinfektion oder Agonisten der Rezeptoren TLR7 und TLR9. Mo-
pDC waren ebenfalls in der Lage große Mengen an IFN-α zu sekretieren,
allerdings nur nach vorheriger Aktivierung mit Tumornekrosefaktor-α (TNF-α)
und/oder wenn zu ihrer Differenzierung neben Flt3-L auch Vitamin D3 oder
all-trans-Retinolsäure verwendet wurde. Nach der erfolgreichen Etablierung
eines Protokolls zur Generierung von funktionalen pDC-Äquivalenten aus
Zusammenfassung 6
humanen Monozyten war es das Ziel den Phänotyp dieser Zellen unter dem
Einfluss eines Faktors der Tumormikroumgebung, in diesem Fall geringe
Sauerkonzentrationen (Hypoxie), zu untersuchen. Die Differenzierung von
Monozyten mittels Flt3-L unter Hypoxie veränderte die Differenzierung zu
pDC in drastisch. Die Expression des spezifischen Transkriptionsfaktors E2-2
war stark vermindert, wie auch die Expression von BDCA2, CD86 und des
Haupthistokompatibilitätskomplexes I (MHCI). Mo-pDC welche unter Hypoxie
generiert wurden waren weiterhin nicht in der Lage IFN-α zu produzieren,
sekretierten jedoch als Antwort auf eine Stimulation des TLR9 hohe Mengen
anderer inflammatorischer Zytokine. Diese Daten zeigten zunächst, dass mo-
pDC für das Studium von Differenzierung und Funktion humaner pDC
eingesetzt werden können. Weiterhin lieferten sie Hinweise auf eine
veränderte Differenzierung humaner pDC unter Hypoxie.
In einem nächsten Schritt wurde folglich untersucht, ob Hypoxie die
Differenzierung von pDC auch aus deren physiologischen Vorläufern aus dem
Knochenmark beeinflusst. Für diese Studien wurde ein gut etabliertes System
unter Verwendung von Knochenmarkszellen der Maus eingesetzt. Diese
wurden mit Flt3-L unter Normoxie oder Hypoxie zu pDC differenziert. In der
Tat war die Differenzierung von Knochenmarkstammzellen zu pDC unter
Hypoxie unterdrückt, was sich auch in der Expression von E2-2
widerspiegelte. Hypoxie aktiviert u.a. spezifische Transkriptionsfaktoren, die
sogenannten Hypoxie-induzierten Faktoren (HIF). HIF-1 kann die Expression
des funktionell antagonistischen Transkriptionsfaktors zu E2-2, inhibitor of
DNA binding 2 (ID2), induzieren. Interessanterweise war die Expression von
ID2 in Knochenmarkskulturen unter Hypoxie induziert. Wurden jedoch
Knochenmarksstammzellen von HIF-1fl/fl LysM-Cre Mäusen, bei denen die
Expression von HIF-1 in pDC-Vorläuferzellen ausgeschaltet ist, mit Flt3-L
unter Hypoxie generiert, so war die Differenzierung zu pDC wiederhergestellt,
die Expression von E2-2 normalisiert und die Induktion von ID2 unterdrückt.
Zusammenfassend kann also gesagt werden, dass die Hypoxie-induzierte
Aktivierung von HIF-1 die Differenzierung von pDC unterdrückt,
wahrscheinlich in Abhängigkeit von ID2, was die Expression des pDC-
Zusammenfassung 7
spezifischen Transkriptionsfaktors E2-2 verhindert. Hypoxie ist ein wichtiger
Faktor der Mikroumgebung vieler pathologischer Zustände/Erkrankungen wie
z.B. Schlaganfall, Herzinfarkt und Krebs. In Tumoren ist Hypoxie einer der
Tumor-induzierten Stressfaktoren, die die Anti-Tumor-Immunantwort negativ
beeinflussen. Da pDC eine potente Anti-Tumor-Immunantwort bewirken
können, diese jedoch in vivo oft unterbleibt, könnte der hier aufgezeigte
Mechanismus für das Verständnis der Hypoxie-induzierten Immunsuppression
hilfreich sein und zur Entwicklung neuer innovativer Immuntherapien gegen
Tumore beitragen.
Neben Hypoxie tragen viele andere Faktoren zur Immunsuppression in
Tumoren bei. Diese intrinsische Immunsuppression ist eines der größten
Hindernisse für die erfolgreiche Therapie von Tumoren, vor allem von soliden
Tumoren. So wird z.B. der Erfolg einer Immuntherapie mit ex vivo-aktivierten
DC oder T Zellen durch immunsuppressive Faktoren der
Tumormikroumgebung gemindert. Obwohl es in den letzten 10 Jahren einige
Fortschritte gegeben hat, sind die Mechanismen wie die Immunsuppression in
Krebspatienten induziert und reguliert wird weiterhin weitestgehend unklar.
Eine Komponente der Mikroumgebung in Tumoren ist das Vorhandensein
sterbender Tumorzellen. Besonders physiologischer Zelltod, Apoptose, von
Tumorzellen findet, im Kontrast zur generellen Sicht von Tumoren als
Apoptose-resistente Entitäten, im Überfluss statt. Die Präsenz von sterbenden
Tumorzellen kann dann durch konventionelle Tumortherapien wie Chemo-
oder Radiotherapie noch stark erhöht werden. Apoptotische körpereigene
Zellen unterdrücken unter physiologischen Bedingungen das Immunsystem.
Deshalb könnte das Freisetzen von apoptotischem Material oder die
Sekretion von Faktoren aus sterbenden Tumorzellen in den Tumor selbst oder
in assoziierte Lymphknoten einen starken Einfluss auf die Funktion von
professionellen Phagozyten wie z.B. DC und die damit verbundene
Aktivierung von tumoriziden Lymphozyten haben.
Zweites Ziel der vorliegenden Arbeit war es, den möglichen
immunsuppressiven Einfluss von apoptotischen Tumorzellen auf die Funktion
humaner mDC zu untersuchen. Humane, aus Monozyten hergestellte mDC
Zusammenfassung 8
wurden zu diesem Zweck mit Überständen lebender, apoptotischer oder
nekrotischer humaner Brustkrebszellen inkubiert, welche sowohl Fragmente
apoptotischer Zellen (AC) als auch von AC freigesetzte Mediatoren enthalten.
Solcherart aktivierte mDC wurden im Anschluß mit autologen T Zellen ko-
kultiviert. Danach wurde das Potential der ko-kultivierten T Zellen zum
Abtöten lebender Tumorzellen analysiert. Interessanterweise stattete die
Aktivierung mit Überständen lebender Tumorzellen humane mDC mit der
Fähigkeit aus tumorizide T Zellen zu induzieren, wohingegen die Aktivierung
mit Überständen apoptotischer Tumorzellen diese Fähigkeit stark
unterdrückte. Ko-Kultur von AC-aktivierten mDC mit autologen T Zellen
resultierte in der Ausbildung einer Population von regulatorischen T Zellen
(Treg), die durch die gleichzeitige Expression der Oberflächenmoleküle CD39
und CD69 charakterisiert war. Diese Treg Zellen waren kritisch für die
Unterdrückung der Aktivierung von zytotoxischen T Zellen. Dies wurde durch
Depletions- und Transferexperimente belegt. Depletion der CD39- und CD69-
exprimierenden Treg Zellen aus AC-aktivierten Ko-Kulturen resultierte in der
Aktivierung von T Zellen, welche effizient lebende Tumorzellen lysierten, und
Zugabe der Treg Zellen zu Ko-Kulturen von mit lebenden Tumorzellen
aktivierten mDC und autologen T Zellen unterdrückte die sonst ausgeprägte
Generierung zytotoxischer T Zellen.
Die Ausprägung der CD39-und CD69-exprimierenden Treg Zell-Population
war abhängig von der Freisetzung des bioaktiven Lipids Sphingosin-1-
Phosphat (S1P), welches den S1P-Rezeptor 4 auf mDC aktivierte. Nach
S1PR4 Aktivierung setzten mDC das immunregulatorische Zytokin IL-27 frei.
Neutralisierung von IL-27 in AC-aktivierten Ko-Kulturen von mDC und T Zellen
blockierte die Generierung von CD39- und CD69-exprimierenden Treg Zellen
und resultierte deshalb in der Aktivierung zytotoxischer T Zellen. In einem
nächsten Schritt wurde der Mechanismus der Treg Zell-induzierten Hemmung
zytotoxischer T Zellen untersucht. Die Bildung von Adenosin in den Ko-
Kulturen und die Aktivierung des Adenosin-Rezeptors A2a, potentiell auf
zytotoxischen T Zellen, waren hierfür vonnöten. Erste Experimente lieferten
Hinweise auf eine direkte Interaktion von CD69- und CD39-exprimierenden
Treg Zellen mit CD73-exprimierenden zytotoxischen T Zellen. Da CD39 und

Zusammenfassung 9
CD73 für die Bildung von Adenosin aus ATP benötigt werden, könnte die
Interaktion von Treg Zellen und zytotoxischen T Zellen diese erst
ermöglichen, was in der Folge in der Hemmung zytotoxischer T Zellen
resultiert. Diese Beobachtungen können dem Verständnis von Mechanismen
der Immunsuppression dienlich sein und könnten Hinweise zur Unterstützung
einer effektiven Tumor-Immuntherapie liefern.
Zusammenfassend zeigen die hier präsentierten Ergebnisse wie Faktoren der
Tumormikroumgebung die Funktion von humanen DC Subtypen beeinflussen
können. Ein Verständnis der zugrundeliegenden Mechanismen kann wertvolle
Informationen für die Wahl effektiver Immuntherapien oder Chemotherapien
liefern und so die Therapie humaner Tumore unterstützen.
Introduction 10
3 Introduction
3.1 The inflammatory tumor microenvironment
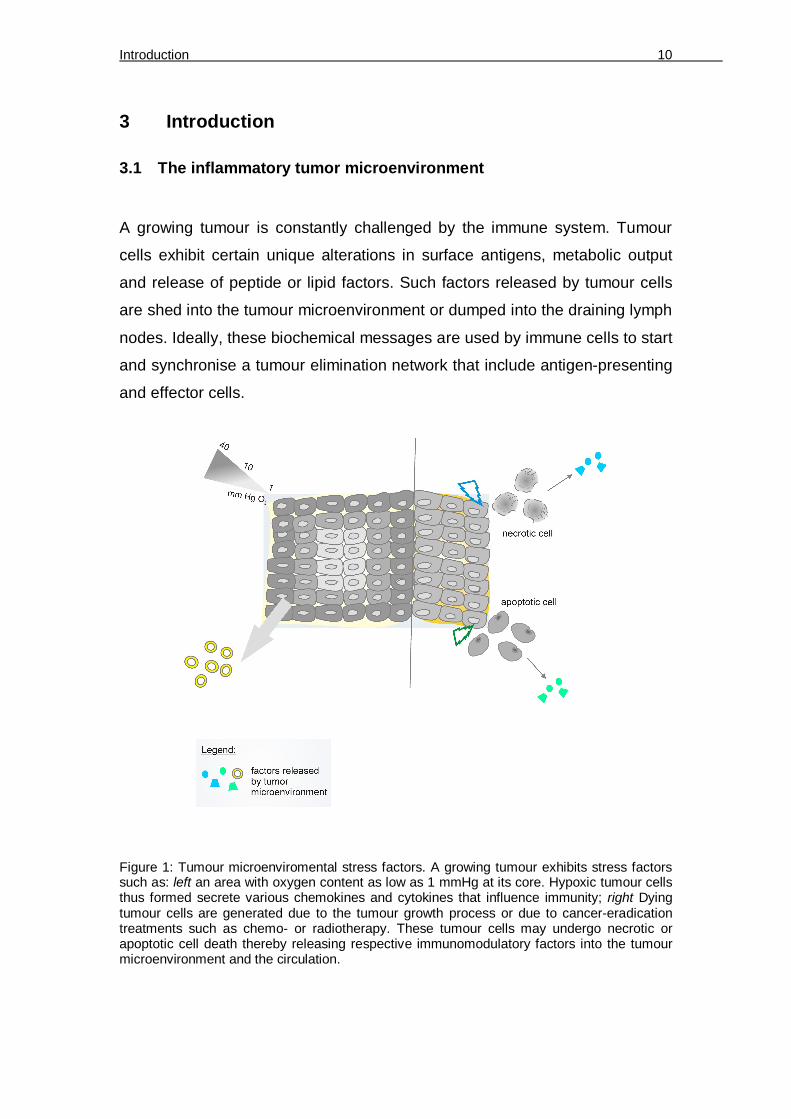
A growing tumour is constantly challenged by the immune system. Tumour
cells exhibit certain unique alterations in surface antigens, metabolic output
and release of peptide or lipid factors. Such factors released by tumour cells
are shed into the tumour microenvironment or dumped into the draining lymph
nodes. Ideally, these biochemical messages are used by immune cells to start
and synchronise a tumour elimination network that include antigen-presenting
and effector cells.
Figure 1: Tumour microenviromental stress factors. A growing tumour exhibits stress factors such as: left an area with oxygen content as low as 1 mmHg at its core. Hypoxic tumour cells thus formed secrete various chemokines and cytokines that influence immunity; right Dying tumour cells are generated due to the tumour growth process or due to cancer-eradication treatments such as chemo- or radiotherapy. These tumour cells may undergo necrotic or apoptotic cell death thereby releasing respective immunomodulatory factors into the tumour microenvironment and the circulation.

Introduction 11
However, in order to avoid their eradication, tumour cells have evolved
strategies, which are largely dictated by their microenvironmental status. In
this regard, stress factors that are most abundant in the tumour bed are the
presence of 1) hypoxia and 2) dying tumour cells. Under these specialized
conditions, the tumour sheds many factors that recruit immune cells from the
bone marrow or from the circulation (Figure 1).
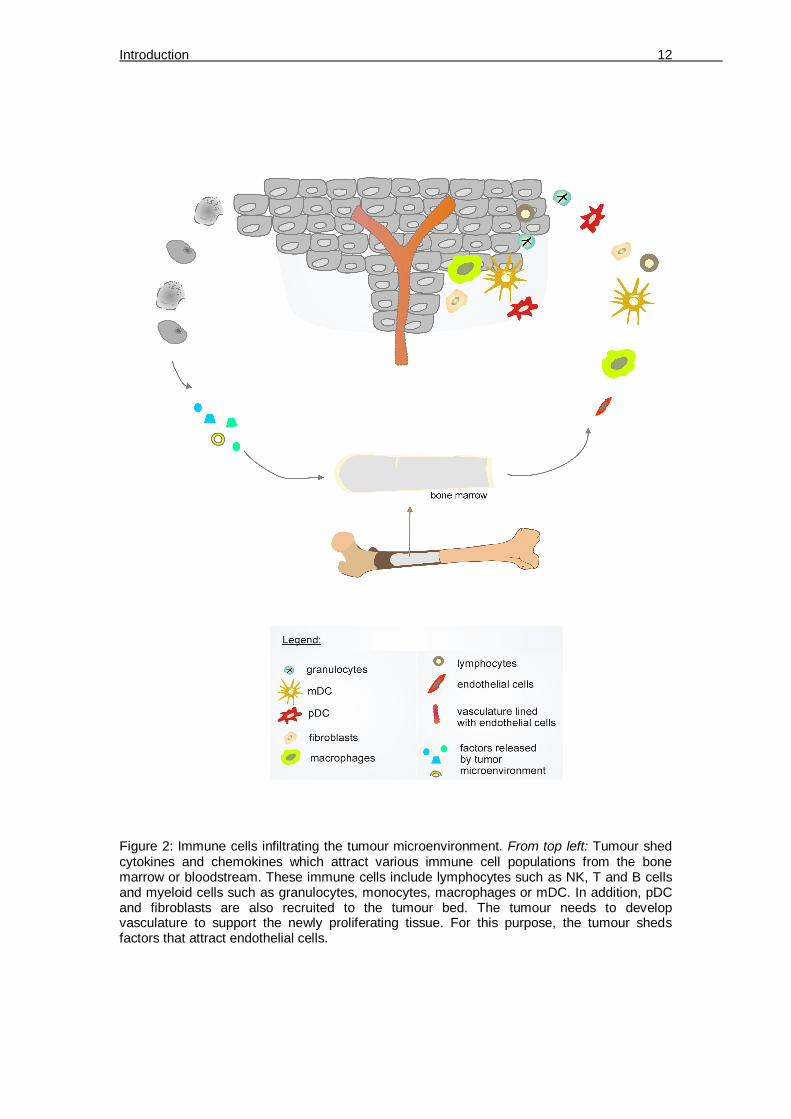
A growing tumour may secrete soluble interleukins, cytokines and chemokines
(Figure 2). Factors such as monocyte chemotactic protein-1 (MCP-1), colony
stimulating factor-1 (CSF-1), vascular endothelial growth factor-A (VEGF-A),
TNFα, and stromal cell derived factor-1 alpha (SDF-1α) are secreted by
hypoxic tumour cells to attract myeloid cells in general. Specifically, regulated
upon activation, normal T-cell expressed and secreted (RANTES) and MCP-1
attract macrophages, β-defensin attracts mDC, IL-8 attracts mainly
monocytes, chemokine (C-X-C motif) ligand 5 (CXCL5) recruits granulocytes
[1] and CXCL12 attracts pDC [2]. Lymphocytes (NK cells, T cells, B cells) are
also recruited by the tumour. For instance, tumour-secreted ligands binding to
C-C chemokine receptor type 5 (CCR5) (chemoattractants MCP-2, MIP-1α/ß,
RANTES) or CXCR3 (chemoattractants CCL9/10) on T cells recruits them to
the tumour microenvironment [3]. In addition, a tumour under hypoxic stress
releases VEGF, which promotes neo-angiogenesis during which, recruitment
and proliferation of endothelial cells secures blood supply to the growing
tumour.
Of all the immune cells that infiltrate tumour tissues or lymph nodes of tumour-
bearing animals/patients, antigen presenting cells (APC) such as DC are
crucial in modulating immunity. DC are phagocytes that fullfil various tasks in
immunity. They shape the tumour immunity towards anti-tumour inflammation
or tolerance, depending on the microenvironmental factors that they are
exposed to.
Introduction 12
Figure 2: Immune cells infiltrating the tumour microenvironment. From top left: Tumour shed cytokines and chemokines which attract various immune cell populations from the bone marrow or bloodstream. These immune cells include lymphocytes such as NK, T and B cells and myeloid cells such as granulocytes, monocytes, macrophages or mDC. In addition, pDC and fibroblasts are also recruited to the tumour bed. The tumour needs to develop vasculature to support the newly proliferating tissue. For this purpose, the tumour sheds factors that attract endothelial cells.

Introduction 13
3.2 Dendritic cells
The interaction pattern of living organisms amongst each other extends
beyond a predator-prey relationship to include an internal ‘sensing-reacting’
relationship. This interaction is brought about by a highly evolved network of
immune cells. Higher organisms are constantly confronted with externally-
derived antigens that can be microbial or viral, or self-antigens that are e.g.
tumoural in nature. For eradication of the invaders, the cells of the immune
system have evolved a repertoire of receptors to ‘sense’ the antigens and
engulf them through sophisticated antigen uptake machinery. Afterwhich,
these cells aptly termed APC, train the effector immune cells to ‘react’ and
mount an immune response against the antigen-bearing invaders. This
ultimately leads to the eradication of the latter. Antigen sensing and
presentation are the two key functions of these specialized cells that include
macrophages and DC. DC are the professional APC of the immune system
that link the innate and adaptive immunity. DC display a wide array of antigen-
capturing molecules on their surface and in intracellular compartments. For
instance, molecules such as TLR4 on the surface of DC serve to capture
microbial antigens such as lipopolysaccharide (LPS) or intracellular molecules
like TLR7/9 recognize CpG sequences in bacterial genomes or viral
DNA/RNA. In addition to capturing antigens and presenting them to effector T
cells of the adaptive immunity, DC are also important for B cell activation,
proliferation and antibody production [4].
3.3 DC subtypes and their role in immunity
DC are highly plastic cells that appear in the ‘twilight zone’ of the immune
system, under more than one classification of immunity. 1) DC bridge the
interface between peripheral tissues and lymphoid tissues, 2) depending on
the environment that foster them, they can be immunostimulatory or
tolerogenic in nature. DC exert multiple roles in immunity (Figure 3) that
include activation of innate immune cells, antigen-presentation to T cells,
mounting immunological tolerance and anti-viral responses.

Introduction 14
The varied functions performed by DC are possible due to the division of
labour between cellular DC subsets which are specialized to perform distinct
functions. Myeloid DC (mDC) are key players in immunity against bacteria or
tumours. They produce pro-inflammatory cytokines and perform antigen
presentation [5]. In contrast, plasmacytoid DC (pDC) are the producers of type
I interferons (IFN-α/β) in response to viral infection. On the one hand, pDC
maintain the immune system by activation of NK cells, influencing the primary
antibody response [6] and by causing bystander mDC activation [7]. On the
other hand, pDC are less efficient in priming antigen specific T cells compared
to mDC [8] and favour the generation of regulatory T cells (Tregs) [9].
Figure 3: DC play multiple roles in immunity. These functions are shared between the DC subsets. Myeloid DC (yellow) have important functions (depicted as yellow-lined boxes) in cellular immunity, humoral immunity, allergy, tissue repair and tolerance. Plasmacytoid DC (red) play a role (depicted as red-lined boxes) principally in anti-viral defence but also aid in innate immune cell activation as well as humoral cell and effector T cell expansion.
Introduction 15
3.4 Role of mDC in effector immunity
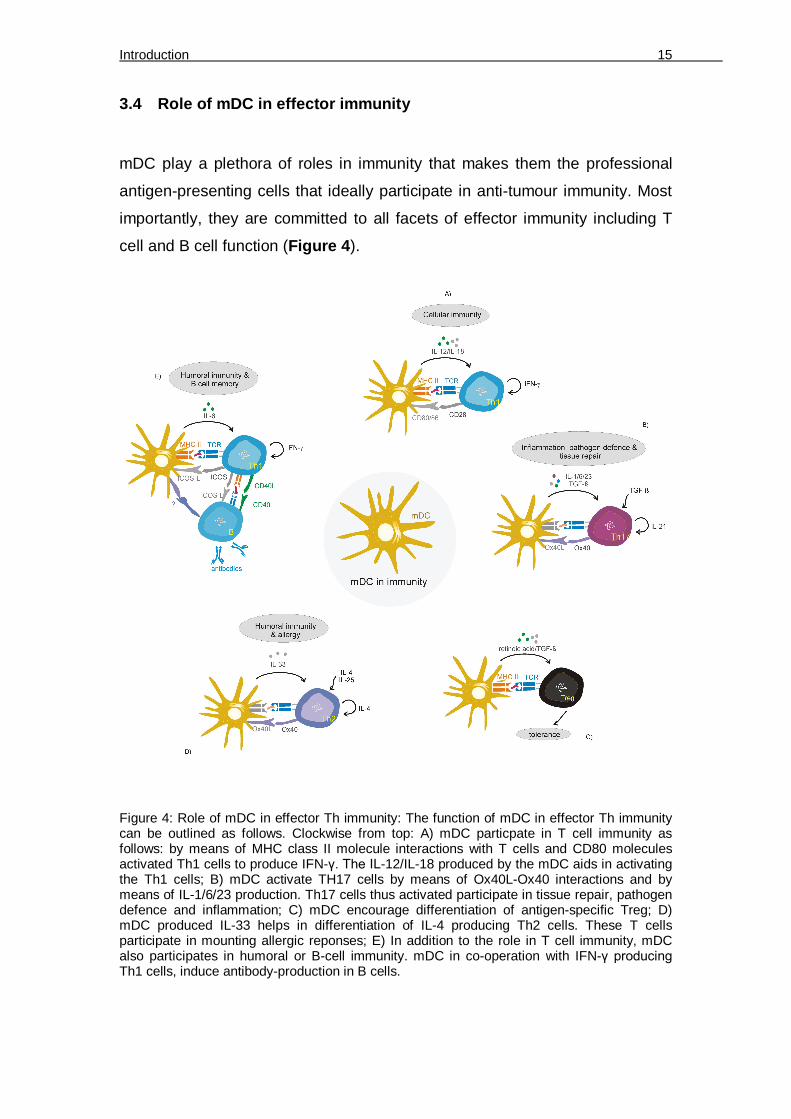
mDC play a plethora of roles in immunity that makes them the professional
antigen-presenting cells that ideally participate in anti-tumour immunity. Most
importantly, they are committed to all facets of effector immunity including T
cell and B cell function (Figure 4).
Figure 4: Role of mDC in effector Th immunity: The function of mDC in effector Th immunity can be outlined as follows. Clockwise from top: A) mDC particpate in T cell immunity as follows: by means of MHC class II molecule interactions with T cells and CD80 molecules activated Th1 cells to produce IFN-γ. The IL-12/IL-18 produced by the mDC aids in activating the Th1 cells; B) mDC activate TH17 cells by means of Ox40L-Ox40 interactions and by means of IL-1/6/23 production. Th17 cells thus activated participate in tissue repair, pathogen defence and inflammation; C) mDC encourage differentiation of antigen-specific Treg; D) mDC produced IL-33 helps in differentiation of IL-4 producing Th2 cells. These T cells participate in mounting allergic reponses; E) In addition to the role in T cell immunity, mDC also participates in humoral or B-cell immunity. mDC in co-operation with IFN-γ producing Th1 cells, induce antibody-production in B cells.
Introduction 16
3.4.1 mDC in tumour tolerance induction
According to the theory of immunosurveillance, new cancer cells arise and
these ‘altered’ cells are destroyed by the immune system, preventing the
tumour outgrowth. To escape its elimination, a growing tumour activates the
immune system in ways to ensure its own survival and further on, encourage
its invasion to other areas of the body. Polarization to a tumour-supportive
state can be principally observed for every immune cell population, including
APC of the innate immune system such as macrophages [39] or DC [40].
These phagocytes program the cells of the adaptive immunity [41] to
selectively induce immunosuppression and thereby dampen the inflammatory
anti-tumour attack. This principle is exemplified for Treg cells in this study.
3.4.2 mDC and T cell interaction
DC undergo maturation, in order to be functionally active. Such mature DC
present antigen to effector cells and produce cytokines to activate immune
cells such as NK cells. Initially DC exist in an immature state in peripheral
tissues. These immature DC have a capacity to phagocytose bacteria, viruses
or tumour antigens or exosomes through pattern recognition receptors present
on their surface. Once having phagocytosed, the DC undergo maturation. The
maturation process is linked to changes in costimulatory molecules, cytokine
production, changes in cytoskeleton, shutting down of the cell cycle and up-
regulation of chemokine molecules [42]. During maturation, the changes in the
cytoskeleton and chemokine receptor profiles induce DC to migrate to lymph
node where they present antigens to T cells.
T cells are thymus-derived white blood cells that play a major role in effector
immunity. They exhibit a specialized receptor called the T cell receptor (TCR)
that allows them to communicate with phagocytes. Through the TCR, T cells
establish contact with the major histocompatibility complex (MHC) molecules
on DC. Antigens bound to MHC molecules are then recognized by T cells.
Based on their functions T cells can be divided into several subtypes. The

Introduction 17
helper T cells (Th) and cytotoxic T cells (Tc) recognize antigens presented by
the DC through MHC II [43] or MHC I molecules [44] respectively. Th cells can
be subdivided into Th1, Th2, Th17 and Treg depending on their functional
profile [45]. They are also called CD4+ T cells since they express CD4
molecule on their surface, which is needed as a co-receptor in the TCR-MHC
II complex. Th cells can produce cytokines that modulate the immune milieu
but cannot kill pathogen-infected cells or aberrantly growing cancer cells. Th1
cells produce cytokines such as IFN-γ that facilitates cellular immunity [46] by
activating other immune cells such as NK cells, cytotoxic CD8+ T-cells and
macrophages. IFN-γ promotes antigen presentation in macrophages and
increases expression of MHC molecules, leukocyte migration and expression
of intrinsic anti-viral defense factors. Th2 cells participate in allergy and
antibody production. Th2 cells produce IL-4 which activates B-cell class
switching to IgE and induce their auto-proliferation. IFN-γ and IL-4 are
cytokines that participate in T cell immunity by tilting the Th1/Th2 balance [47,
48]. Besides promoting Th1 immunity as described above, IFN-γ suppresses
Th2 differentiation which would cause a humoral (antibody) response. IL-4
contributes to anti-inflammatory response by decreasing the production of
macrophage and dendritic cell-derived IL-12. Th17 cells are another subtype
of Th cells that mainly produce IL-17 and contribute to chronic inflammation
and tissue repair. They cause autoimmune responses and in addition, Th17
cells produce IL-22 which is important for defence against pathogens such as
Candida [49]. Regulatory T cells (Treg) are another subtype of Th cells that
are central mediators of immune tolerance. Treg produce TGF-ß or IL-10
which keep hyperinflammation in check [50]. Tc or cytotoxic T cells have the
capacity to kill pathogen or viral infested cells and cancer cells. They are
called CD8+ T cells since they express CD8 molecule on their surface, which
is a co-receptor in the TCR-MHC I complex. Tc cells produce various
molecules such as granzyme or perforin which cause lysis of pathogen-
infected or tumour cells [51].

Introduction 18
3.4.3 DC-Treg interaction in tumour-bearers
DC dampen anti-tumour immunity among other mechanisms, by generating
tumour-specific Treg cells. The Treg cells have been demonstrated to be a
major obstacle for anti-tumour immunity [52] due to their role in suppressing
anti-tumour immunity. Treg can be primed and activated predominantly in the
tumour-adjacent draining lymph nodes (TDLN), by factors shed from the
tumour [53] or within the tumour bed itself [54]. Evidently Treg are often
detected in the sentinel/regional lymph nodes (LNs) of tumour-bearing hosts
that exhibit poor clinical prognosis [55]. Once primed in the TDLN, Treg travel
to the tumour site, where they prevent effector T cells from eradicating the
tumour and furthermore stimulate metastasis of tumour cells [56]. The aim of
adoptive cellular immunotherapy against tumours is to generate tumour-
directed cytotoxic T cells. However, the TDLN-derived suppressive Treg can
potentially curb the benefit of an adoptive immunotherapy by suppressing the
function of transferred or endogenous cytotoxic T cells. In addition,
conventional cytotoxic therapy would need an active immune system to keep
the residual tumour masses in check, which might be prevented by Treg [57].
Hence, the mechanisms of Treg generation within the TDLN have to be
defined in order to design effective therapeutic strategies.
3.4.4 Different states of immunosuppressive DC in tumour-bearing animals
Generation/priming of tumour-specfic Treg, requires antigen uptake and
presentation by professional APC, i.e, DC. To exhibit their regulatory function,
DC probably undergo tumour-dependent phenotypical alterations that enables
them to foster immune escape [40, 58]. Initially, DC were thought to promote
T cell tolerance due to being trapped in an immature state in tumour-bearing
animals. However, it emerges that depending on the tumour
microenvironment they are exposed to, DC may exist in different states of
maturation, activation, i.e immunostimulatory capacity [59, 60]. Thus, even DC
within the tumour might be capable of presenting tumour-derived antigens.
Tumour-derived antigens are acquired by DC directly at the tumour site [61],

Introduction 19
from metastasing tumour cells [60], or through tumour-released
exosomes/microvesicles [62, 63], which are primarily drained to the TDLN.
3.4.5 Uptake of dying tumour cell-derived factors by DC
In addition to antigens, DC receive other tumour-derived signals that shape
their phenotype and the subsequent profiling of T cells. A prominent source of
such signals are dying tumour or stromal cells that are continuously produced
during tumour growth [64] or by conventional cancer-ablation methods such
as chemotherapy or radiotherapy. With regard to the immunological outcome,
the two extremes are: 1) effective antigen cross-presentation and induction of
an inflammatory response elicited by DC that eventually prepares immune
effectors to eradicate malfunctioning cells or 2) tolerance to dampen an over-
activated immune reaction [65, 66]. The decision towards inflammation versus
tolerance depends on the surface protein/lipid signatures as well as immune-
modulating factors released by dying cells, which are primarily determined by
the mode of cell death [67].
3.4.6 Types of cell death
There are two broad classifications of how cells may undergo death. This
includes: 1) necrosis, which occurs when a cell is exposed to extreme
physiological conditions such as hypoxia/anoxia or hypothermia that leads to
rupture of the plasma membrane and release of contents that elicit an immune
response; or 2) apoptosis, which occurs under normal physiological conditions
ensuring cell turnover and tissue homeostasis (Figure 5).
Introduction 20
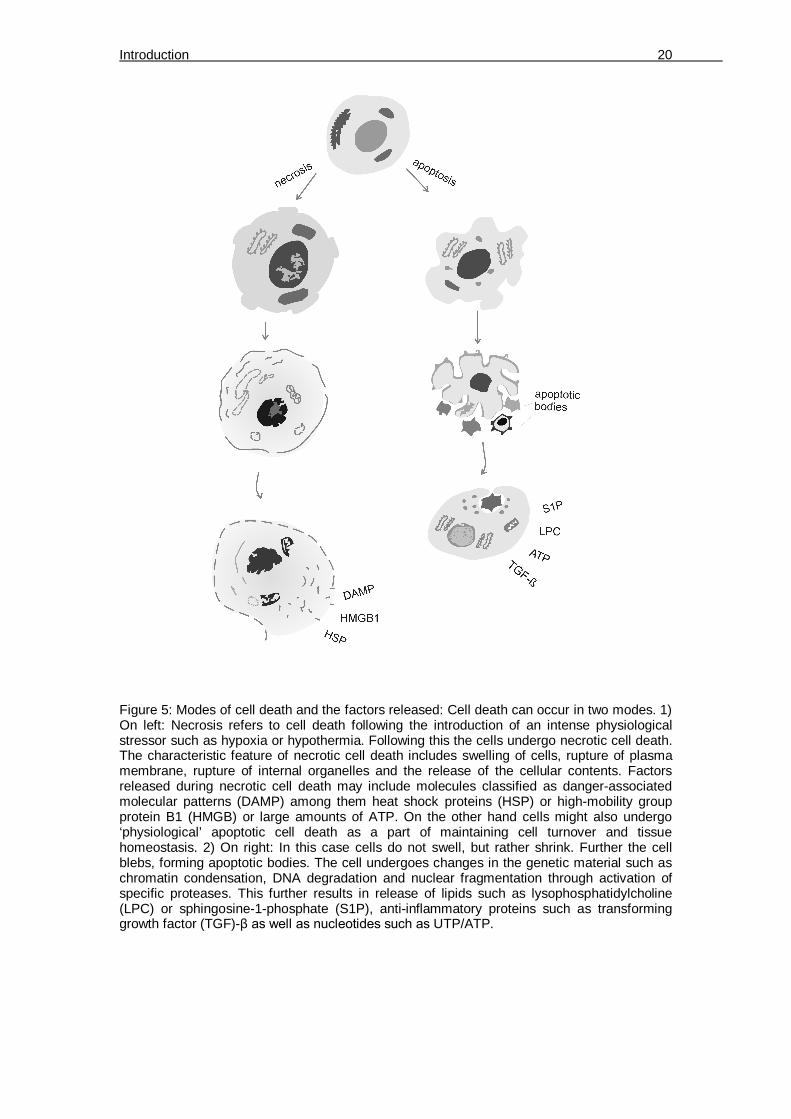
Figure 5: Modes of cell death and the factors released: Cell death can occur in two modes. 1) On left: Necrosis refers to cell death following the introduction of an intense physiological stressor such as hypoxia or hypothermia. Following this the cells undergo necrotic cell death. The characteristic feature of necrotic cell death includes swelling of cells, rupture of plasma membrane, rupture of internal organelles and the release of the cellular contents. Factors released during necrotic cell death may include molecules classified as danger-associated molecular patterns (DAMP) among them heat shock proteins (HSP) or high-mobility group protein B1 (HMGB) or large amounts of ATP. On the other hand cells might also undergo ‘physiological’ apoptotic cell death as a part of maintaining cell turnover and tissue homeostasis. 2) On right: In this case cells do not swell, but rather shrink. Further the cell blebs, forming apoptotic bodies. The cell undergoes changes in the genetic material such as chromatin condensation, DNA degradation and nuclear fragmentation through activation of specific proteases. This further results in release of lipids such as lysophosphatidylcholine (LPC) or sphingosine-1-phosphate (S1P), anti-inflammatory proteins such as transforming growth factor (TGF)-β as well as nucleotides such as UTP/ATP.
Introduction 21
3.4.7 Cell death-induced immune responses
Necrosis induces shedding of danger-associated molecular patterns
(DAMPs), which activate corresponding TLRs on DC. For example high-
mobility group box 1 (HMGB1) is recognized by TLR2, TLR4 or the receptor
for advanced glycation end products (RAGE) on the surface of APC [68]. In
contrast, heat shock proteins (HSP) are taken up through scavenger
receptors. For apoptosis, the immunological outcome is ambiguous, because
of the varying nature of the apoptotic cell surface proteome. These may
include ligand-receptor interactions such as phosphatidylserine (PtdSer)-
MER/BAI1/ T-cell immunoglobulin- and mucin-domain-containing molecule-4
(TIM-4), intercellular adhesion molecule-3 (ICAM-3)-CD14 or milk fat globule-
EGF factor 8 (MFG-E8)-lipid rafts between apoptotic cells and phagocytes
respectively. In addition, apoptotic cells shed lipids, nucleotides and other
immunomodulating factors that interact with the DC by means of appropriate
receptors [69]. Apoptosis can be immunogenic as demonstrated by an
increase in antigen-cross-presentation and the induction of cytotoxic T cells
upon priming with AC in vivo [70]. On the other hand, triggering of multiple
immunosuppressive pathways upon priming with AC has been recognized
[71]. In case of cancer-ablation treatments such as chemotherapy, the
decision towards generating an anti-tumour response or tolerance might be
determined by the drug being used, as recent evidence suggests that certain
chemotherapeutic drugs such as oxaliplatin trigger immunogenic cancer cell
death [72]. However, cross-presentation of AC-derived antigens after
chemotherapy does not necessarily culminate in anti-tumour immunity [73].
Interestingly, forced expression of (heat shock proteins) HSP, which are
usually present on necrotic cells, can render AC immunogenic [74].

Introduction 22
Figure 6: Exposure of phagocytes to NC or AC-derived signals. Left: The signals released
from necrotic cells (NC) are usually factors such as HSP, HMGB1 or DAMP those are sensed
by DC. Right: Apoptotic cells expose ligands such as PtdSer, ICAM-3, MFG-E8, between
which interact with receptors TIM-4, CD14 or rafts on the surface phagocytes. In addition
apoptotic cells may shed soluble factors such as lipids LPC or S1P that are taken up by the
phagocytes.
Studies have focused on immunogenicity of surface alterations on dying cells.
However, the signalling molecules secreted from dying cells that drain the
adjacent lymph nodes together with tumour antigens may also be important
for inducing tolerance and possibly favour relapse [53]. AC secrete
immunomodulators in a regulated manner, among them lipids such as
lysophosphatidylcholine (LPC) or sphingosine-1-phosphate (S1P), anti-
inflammatory proteins such as transforming growth factor (TGF)-β as well as
nucleotides, which have the capacity to modify DC-dependent immunity [67]
(Figure 6).
3.5 pDC roles in immunotherapy
Myeloid DC have been widely used in immunotherapy against cancer at least
in model systems [10]. Furthermore, the use of the viral mimetic CpG that
activates pDC or using pDC themselves along with mDC in cancer therapy
resulted in favourable outcomes [11, 12]. In addition, IFN-α production by pDC
was required to cause tumour rejection by the immune system [13]. On the
other hand, pDC might also have a tumour-inducing capacity, which could

Introduction 23
offset promising therapeutic implications [14]. On the contrary, the ‘tolerance-
inducing’ properties of pDC (Figure 7) were harnessed for therapy in diseases
such as allograft rejection [15] or rheumatoid arthritis [16].
Figure 7: pDC roles in immunity: The functions of pDC in modulating immunity can be viewed in detail as follows: (clockwise from left) A) pDC are the vital immune cells in the body that are involved in anti-viral defence. Upon virus instigated TLR-9 activation, pDC drive IFN-α-dependent inflammation. pDC are the principal producers of IFN-α and together with production of IL-12 they activate Th1 immunity; B) pDC produce TGF-β or retinoic acid which help in differentiation of FoxP3-expressing regulatory-T cells (Treg). These Treg in turn produce immunosuppressive IL-10 thereby encouraging tolerance; C) The IFN-α produced by pDC can activate CD8+ T cells and likewise Th1 cells to produce IFN-γ. Thus pDC play a vital role in expanding and/or, activating T cells; D) In addition pDC-produced IFN-α helps in differentiation of antibody-secreting plasma cells from precursor plasmablasts; E) finally pDC are crucial for innate immune cell activation. pDC encourage IL-12 production by mDC and enhance the cytotoxic function of NK cells.
The importance of pDC in research and therapy necessitates a system to
generate pDC equivalents from easily available sources in humans. In

Introduction 24
addition, these cells are rare in human blood forming up to 0.32% of all
immune cells in peripheral blood [17]. In addition, if such pDC-like cells could
be manipulated during their development, they might be engineered according
to specific therapeutic needs.
3.6 DC development
3.6.1 Precursors involved in DC subset development
In order to understand DC function or to generate functional subsets for
cellular therapy in vitro, it is necessary to understand the biology and
classification of DC precursor development. Hematopoeisis is the process
responsible for generation of the various cells that make up the blood. The
principal precursors are called hematopoietic stem cells (HSC). They have an
innate capacity to give rise to different progenitor cells which include common
myeloid progenitors (CMP) or common lymphoid progenitors (CLP). These
ultimately give rise to the different immune cell populations. For example
downstream of CMP, 1) erythropoiesis gives rise to reticulocytes and
erythrocytes, 2) thrombopoiesis gives rise to thrombocytes, 3) granulopoiesis
gives rise to basophils, neutrophils and eosinophils, 4) Mast cells form directly
from CMP and 5) monocytopoiesis gives rise to monocytes and myeloid DC.
Downstream of CLP, lymphopoiesis takes place giving rise to: 1) B
lymphocytes or plasma cells, 2) T lymphocytes and 3) lymphoid DC. Thus, DC
precursors are also formed as a result of hematopoiesis in the bone marrow.
Classically, the development of DC subsets was assumed to result from
radically different precursor sources. mDC were reported to develop from
myeloid precursors and the development of pDC was assumed to be entirely
lymphoid. However, recently common progenitors were identified for both
mDC and pDC. Whereas HSC-derived multipotent progenitors give rise to
either CMP or CLP, both these progenitors were able to generate pDC [18].
Interestingly, at least in the mouse, the functions of common myeloid
progenitor (CMP)-derived and common lymphoid progenitor (CLP)-derived

Introduction 25
pDC were found to be distinct. Whereas CLP were prone to pDC generation,
thus yielding higher numbers of pDC, MP developed faster into pDC which
also produced higher levels of IFN-α [19]. In addition following another, more
recent hypothesis, the common precursor of DC subtypes can be a myeloid
progenitor-monocyte/DC progenitor (MP-MDP) or yet another unidentified
progenitor further downstream of MP-MDP. Following the current perception,
the MP-MDP then give rise to respective mDC or pDC precursors [20] (Figure 8). To add further complicaction to the whole scenario, the above described
theories may be true for DC development only in mice. DC development in
humans may operate independently of conventional myeloid or lymphoid
pathways [21].
Figure 8: DC subset development theories: (Left) Distinct precursor theory: This classical theory suggests that the DC subsets arise from distinct precursors. Hematopoietic stem cells (HSC) give rise to multipotent progenitor (MPP) which forks into two distinct precursors - the common myeloid precursor (CMP) and the common lymphoid precursor (CLP). The CMP gives rise to Langerhans DC, interstitial DC or cDC through a series of steps involving one or two precursors. In detail, cDC arise from pre-DC1 or monocytes under the CMP precursor pathway. PDC arise from the CLP arm through a pre-DC2 precursor. (Middle) The common precursor theory suggests that a common precursor downstream of the HSC-MPP pathway differentiates to either CMP or CLP. cDC arise from CMP, whereas pDC arise from both CMP and CLP. (Right) The common DC precursor theory suggests that a common DC progenitor (CDP) differentiating along the myeloid progenitor-monocyte/DC progenitor (MP)-(MDP) pathway is reponsible for cDC or pDC differentiation from respective precursors.
Introduction 26
3.6.2 Cytokines that shape pDC development and the myeloid progenitor
hypothesis
A crucial determinant for pDC generation is the Fms-related tyrosine kinase 3
ligand (Flt3-L). Flt3-L overexpressing transgenic mice had increased numbers
of pDC, whereas Flt3-L deficient mice had less [18]. Importantly, the
administration of Flt3-L to humans led to increased numbers of peripheral
pDC [22]. Common precursors for mDC and pDC were identified as common
pro-DCs in the mouse bone marrow [18]. Also, Flt3high and Flt3low CD34+
progenitor cells, isolated from human bone marrow, were described. CD14+
monocytes were the major cell type generated from Flt3high cells, whereas
cells generated from Flt3low cells were mainly erythroid cells [23]. Furthermore,
Flt3 was detected on a subset on CD34+ CD14+ CD64+ monocytic precursors
in addition to being detected on a subset of CD34+ CD38- bone marrow cells
and CD34+ CD19+ B lymphoid progenitors. Thus, it is tempting to speculate
that administration of Flt3-L to humans results in high pDC numbers which are
mobilized to differentiate along the myeloid lineage. Interestingly, monocytes
are easily available myeloid-derived cells in human peripheral blood. This
opens the possibility to employ them for pDC generation. Besides Flt3-L, GM-
CSF might be important for pDC generation. PDC progenitors were less in
Flt3-L-deficient mice as compared to GM-CSF-deficient mice, and
interestingly the latter had less pDC progenitors than wildtype mice [24].
3.6.3 Transcriptional machinery involved in pDC development
The basic helix-loop-helix transcription factor E2-2 was recently defined as the
critical pDC lineage-determining transcription factor in humans and mice [25].
E2-2 haploinsufficiency in humans leads to the development of a condition
called the Pitt-Hopkins syndrome characterized by cranio-facial/neural
abnormalities, mental retardation and motor dysfunction. In addition, such
individuals exhibit a reduced capacity to fight viral diseases due to decreased
number of pDCs and an impaired type I IFN production/response of these

Introduction 27
cells [25]. E2-2 is inhibited by ID proteins (inhibitor of differentiation/DNA
binding) [26]. Of this protein family, ID2 was found to be essential for mDC
development, but loss of ID2 did not affect pDC development [27]. In addition,
genes that are enriched in pDC such as SpiB, Irf7 and Irf8 are under the
transcriptional control of E2-2 [25] (Figure 9). SpiB, which was considered to
be the crucial pDC determining factor, serves to suppress ID proteins and
additionally requires E2-2 to determine pDC development [28]. Importantly,
E2-2 is also required to maintain the function of pDC after they are generated
[29].
Figure 9: Transcription factors (TF) involved in pDC development. A) TF profile in DC subsets: mDC express high levels of ID2 and do not express E2-2. This is in contrast to pDC which express high levels of E2-2 but a low ID2; B) E2-2 is a TF that is crucial for pDC development. The TF is active as a dimer. An active E2-2 dimer binds to E-Box element in genes such as Irf-7/8, Spi-B and activates their transcription; C) In the presence of E2-2 inhibiting protein ID2, E2-2 monomers are not able to dimerize, which is required to initiate transcription. In this case the E-Box is not occupied by the E2-2 dimer and gene expression is switched off. Therefore in the presence of high levels of ID2, the E2-2 dependent transcription of pDC-defining genes is shut down, thereby inhibiting pDC function and differentiation.
Introduction 28
3.6.4 Hypoxia as a microenvironmental factor in hematopoiesis
In addition to its effects regarding angiogeneis and modulation of immune
responses, hypoxia may also participate in hematopoiesis in the bone
marrow. The oxygen content (O2) in the bone marrow may range from close to
anoxia (0%) to 6% as opposed to a well oxygenated tissue such as the blood,
where O2 levels range from 4% to 14% [30, 31]. The O2-gradient within the
bone marrow is a determining factor for either keeping hematopoietic stem
cells (HSC) in a low-replicating pluripotent state or to induce differentiation
along the hematopoietic lineage. HSC are located in an extremely hypoxic
niche as demonstrated by dye-perfusion and engraftment studies [32, 33].
The primary hypoxia-induced transcription factors, the hypoxia-inducible
factors (HIF)-1 to 3 are stabilized under low O2 concentrations. They are
heterodimers consisting of a variable O2-sensitive subunit and a stable
common β subunit, also known as aryl hydrocarbon receptor nuclear
translocator (ARNT) [34]. Both HIF-1 and HIF-2 were recently connected to
HSC biology. HIF-1 is needed for HSC quiescence in their hypoxic niche [35],
whereas HIF-2 is activated downstream of STAT5 in HSC to maintain their
self-renewing capacity [36]. Beside HSC maintenance, HIF-1 plays a major
role in hematopoiesis in embryos [37] and in the adult organism [38].
However, whether HIFs affect myeloid cell development in the adult bone
marrow of mammals was unknown.
Introduction 29
3.7 Aims of this study
Tumour antigens are recognized by APC, which take up and present the
antigens to effector cells. These effector cells then ideally eradicate the
tumour. In patients that develop a clinically detectable tumour, the immune
status is dysregulated. Most often they exhibit increased levels of alternatively
activated APC such as DC and regulatory T cells. These together suppress
anti-tumour immunity.
Dendritic cells act as professional APC that are central in regulating various
immune processes including tumour immunity. The ability of DC to perform
opposing functions spans across the whole immune spectrum, including
antigen presentation and immune cell activation, anti-viral immunity, tolerance
induction or tissue repair. These functions are met by at least two distinct DC
subsets. The unique property of mDC to activate effector T cells towards
tumour killing made them likely candidates for use in cancer immunotherapy.
Whereas the generation of mDC generation in vitro has been long
established, a similar protocol to generate pDC was lacking. Hence, the first
part of the thesis, addresses the aim of establishing a protocol to generate
pDC equivalents from an easily and abundantly available source, so that they
might be studied under the influence of tumour microenvironmental factors
such as hypoxia or dying tumour cells. Since monocytes meet the criteria for
the latter, we asked if they could be harnessed for generation of pDC-like
cells. Further on, the mo-pDC thus generated had to be characterized in detail
to identify similarities to their physiological counterparts or to check in which
features these cells behaved differently to primary pDC. Therefore, mo-pDC
were characterized along these levels: 1) lineage-determining transcription
factor profile, 2) specific surface markers and 3) functional profile. The mo-
pDC differentiation was also studied under the tumour stress factor hypoxia.
Interestingly, the bone marrow exhibits a low-oxygen environment as opposed
to other tissues. Therefore, we also asked for the impact of hypoxia on pDC
generation from mouse bone marrow precursors to support findings in from
the studies with human cells as outlined above. Of particular interest was the

Introduction 30
impact of the hypoxia-induced transcription factor HIF-1, which we
investigated by using bone marrow from conditional HIF-1α-deficient mice.
In order to keep immune hyperinflammation in check, the immune system has
evolved a regulatory network that shuts down its over-activation. This includes
the APC that produce regulatory cytokines such as IL-10 or TGF-β to limit
inflammation. In addition, these alternatively activated APC modulate effector
immunity to mount tolerance. By way of producing tolerance-inducing factors,
cancer cells use this APC-effector regulatory network to their benefit. At the
top of the trigger of this regulatory network lie tumour microenvironmental
stress factors such as hypoxia or the presence of dying cells. Therefore, in the
second part of the thesis we focused on elucidating the influence of apoptotic
tumour cells on the mDC phenotype with a focus on their ability to shape T
cell responses. Since tumour cells are thought to evade immunity by shedding
certain factors that mount tolerance, we specifically asked if supernatant of
apoptotic tumour cells can prime DC to trigger T cell differentiation that
borders along tolerance. T cells were characterized along these levels: 1)
cytotoxic function, 2) surface marker profile and 3) secreted cytokines. Indeed,
apoptotic tumour cells induced tolerogenic DC that expanded a certain
subpopulation of Treg cells. Hence, we investigated the factor released from
apoptotic tumour cells that was responsible for this shift in the T cell profile.
Also we checked mechanisms how DC achieved Treg generation. Last, we
wanted to know how the specific Treg in our system suppressed CD8+ T cells
from eradicating tumour cells. The impact of adenosine generation was
investigated as a candidate responsible for the suppression of cytotoxicity.
Materials 31
4 Materials
4.1 Chemicals and Reagents
The commercially purchased chemicals used were of the highest grade of
purity:
β-mercaptoethanol Sigma-Aldrich Chemie GmbH,
Deisenhofen
40% Acrylamide/Bis-acrylamide
(37.5% : 1.0% w/v)
Roth GmbH, Karlsruhe
Accutase PAA Laboratories GmbH, Cölbe
Acrylamide/Bis-acrylamide Bio-Rad Laboratories GmbH,
München
Ammonium chloride (NH4Cl) Sigma-Aldrich Chemie GmbH,
Deisenhofen
Ammonium persulfate (APS) Sigma-Aldrich Chemie GmbH,
Deisenhofen
Brefeldin A Sigma-Aldrich Chemie GmbH,
Deisenhofen
Blocking buffer Rockland Immunochemicals Inc,
Gilbertsville (USA)
Bovine Serum Albumin (BSA) Sigma-Aldrich Chemie GmbH,
Deisenhofen
Bromophenol blue Fluka GmbH, Buchs
Caspase-3 substrate (Ac-DEVD-
AMC)
Alexis Biochemicals, Grünberg
Chloroform Merk Eurolab GmbH, Darmstadt
Collagenase IA Sigma, Steinheim, Germany
Dimethylsulfoxide (DMSO) Roth GmbH, Karlsruhe
Disodium hydrogen phosphate
(Na2HPO4)
Merck EuroLab GmbH, Darmstadt
Dithiothreitole (DTT) Roth GmbH, Karlsruhe
DNAse I Promega, Mannheim Germany
Materials 32
Ethanol Roth GmbH, Karlsruhe
Ethylenediaminetetraacetic acid
(EDTA)
Sigma-Aldrich Chemie GmbH,
Deisenhofen
HEPES Roth GmbH, Karlsruhe
Isopropanol Merck EuroLab GmbH, Darmstadt
L-glutamine PAA Laboratories GmbH, Cölbe
Lymphocyte separation medium
(Ficoll)
PAA Laboratories GmbH, Cölbe
Magnesium chloride (MgCl2) Roth GmbH, Karlsruhe
Magnesium sulfate (MgSO4) Roth GmbH, Karlsruhe
Methanol (MeOH) Roth GmbH, Karlsruhe
1-Methyl-tryptophan (L/D-1MT) Sigma-Aldrich Chemie GmbH,
Deisenhofen
Milk powder Merck EuroLab GmbH, Darmstadt
Monopottasium phosphate
KH2PO4
Sigma-Aldrich Chemie GmbH,
Deisenhofen
Neomycin (G 418) PAA Laboratories GmbH, Cölbe
Nonidet P-40 Sigma, Steinheim, Germany
Oxaliplatin Sigma, Steinheim, Germany
Paraformaldehyde (PFA) Sigma-Aldrich Chemie GmbH,
Deisenhofen
Phenylmethanesulfonylfluoride
(PMSF)
Sigma-Aldrich Chemie GmbH,
Deisenhofen
Potassium bicarbonate (KHCO3)
Sigma-Aldrich Chemie GmbH,
Deisenhofen
Potassium chloride (KCl) Merck EuroLab GmbH, Darmstadt
Protease inhibitor mix Roche Diagnostics GmbH,
Mannheim
Tetramethylethylenediamine
(TEMED)
Sigma-Aldrich Chemie GmbH,
Deisenhofen
Tris Sigma-Aldrich Chemie GmbH,
Deisenhofen
Tris buffered saline (TBS) Sigma-Aldrich Chemie GmbH,

Materials 33
Deisenhofen
Triton X-100 Sigma-Aldrich Chemie GmbH,
Deisenhofen
Trypsin Sigma-Aldrich Chemie GmbH,
Deisenhofen
Tween 20 Sigma-Aldrich Chemie GmbH,
Deisenhofen
Sodium chloride (NaCl) Merck EuroLab GmbH, Darmstadt
Tetraethylendiamine (TEMED) Roth GmbH, Karlsruhe
Tris-HCl Roth GmbH, Karlsruhe
Triton X-100 Roth GmbH, Karlsruhe
Tryptone Sigma-Aldrich Chemie GmbH,
Deisenhofen
Tween 20 Roth GmbH, Karlsruhe
Yeast extract Life Technologies, Scotland
4.2 Buffers and Solutions
Rinsing buffer: (for cell separation) (in PBS)
EDTA 0.5 M
Running buffer: (for cell separation) (in PBS)
BSA 0.5%
EDTA 0.5 M
FACS wash buffer (in PBS)
BSA 0.2%
Antibody solution
TBS 50% (v/v)
Blocking Buffer 50% (v/v)
Tween 20 0.06% (v/v)
Materials 34
Blocking solution (in PBS)
Triton X-100 0.1%
BSA 3%
10 x blotting buffer (pH 7.4) (in PBS)
Tris-HCl 250 mM
Glycine 1.9 M
pH 8.3
NaCl 137 mM
KCl 2.7 mM
Na2HPO4 8.1 mM
KH2PO4 1.5 mM
Potassium phosphate buffer (pH 8.5)
KH2PO4 1 M
Lower Tris Buffer (pH 8.8)
Tris/HCl 1.5 M
HIF lysis buffer (pH 8.0)
Tris/HCl 50 mM
EDTA 5 mM
NaCl 150 mM
Nonidet P-40 150 mM
PMSF 0.5 mM
DTT 1 mM
Protease inhibitor mix 1 x
4 x SDS-PAGE sample buffer (pH 6.9)
Tris/HCl 125 mM
10% SDS 2% (v/v)
Glycerol 20% (v/v)
Bromophenol blue 0.002% (w/v)
DTT 5 mM

Materials 35
SDS separating gel (10%)
H20 distilled 4.9 ml
Lower Tris buffer 2.5 ml
40% Acrylamide/Bis-acrylamide 2.5 ml
(37.5% : 1.0% w/v)
SDS 10% (w/v) 100 µl
Ammonium persulfate 10% (w/v) 50 µl
TEMED 5 µl
SDS stacking gel (4%) (pH 7.1)
H20 distilled 6.4 ml
Upper Tris buffer 2.5 ml
40% Acrylamide/Bis-acrylamide 1 ml
(37.5% : 1.0% w/v)
SDS 10% (w/v) 100 µl
Ammonium persulfate 10% (w/v) 50 µl
TEMED 5 µl
10 x SDS running buffer:
Tris/HCl 250 mM
Glycine 1.9 M
SDS 7 mM
10 x TBS (pH 7.4)
Tris/HCl 500 mM
NaCl 1.5 M
TE (Trypsin/EDTA in PBS)
Trypsin 0.5 g/l
EDTA 0.2 g/l
1 x TTBS
TBS 1 x
Tween 20 0.06% (v/v)

Materials 36
Upper Tris Buffer pH 6.8
Tris/HCl 0.5 M
Erythrocyte lysis buffer (in 1L distilled H2O)
NH4Cl 8.26g KHCO3 1 g EDTA 0.037 g
4.3 Pre-made Buffers
autoMACS running buffer Miltenyi Biotec, Bergisch Gladbach,
Germany
BD Cytofix/Cytoperm Buffer BD Pharmingen, San Jose, CA USA
BD perm/wash buffer BD Pharmingen, San Jose, CA USA
FACS wash buffer Miltenyi Biotec, Bergisch Gladbach,
Germany
FoxP3 buffer set BD Biosciences, Heidelberg
4.4 Dye and beads
CFSE (carboxyfluorescein
succinimidyl ester)
Molecular probes, Invitrogen,
Karlsruhe, Germany
CMAC (CellTracker Blue -
amino-4-chloromethylcoumarin)
Invitrogen, CA, USA
CompBeads BD Biosciences, Heidelberg
Cytometer Setup and Tracking
(CST) beads BD Biosciences, Heidelberg
Flow-Count Fluorospheres Beckman-Coulter, Krefeld, Germany
Propidium iodide (PI) Sigma-Aldrich Chemie GmbH,
Deisenhofen

Materials 37
4.5 Kits
4.6 Antibodies
4.6.1 Human FACS antibodies:
anti-IFN-α-PE BD Pharmingen, San Jose, CA USA
anti-CD14-APC Immunotools, Friesoythe, Germany
anti-CD45RA-APC Immunotools, Friesoythe, Germany
anti-CD123-APC Immunotools, Friesoythe, Germany
anti-CD86-FITC Immunotools, Friesoythe, Germany
anti-CD135-FITC Immunotools, Friesoythe, Germany
anti-CD1a-FITC Immunotools, Friesoythe, Germany
anti-BDCA2-PE Miltenyi Biotec, Bergisch Gladbach,
Germany
anti-CD11b-APC Miltenyi Biotec, Bergisch Gladbach,
Germany
anti-HLA-ABC (MHC I)-FITC Miltenyi Biotec, Bergisch Gladbach,
Germany
anti-HLA-DR (MHC II)-PE-Cy7 BD Biosciences, Heidelberg,
Annexin V-FITC/PI Apoptosis Kit Coulter-Immunotech GmbH, Hamburg
BD Cytometric Bead Array
Human Inflammation Kit
BD Biosciences, Heidelberg
BD Human Th1/TH2/TH17 kit BD Biosciences, Heidelberg
iLite human IFN-α kit PBL InterferonSource, Piscataway,
NJ, USA
Peq Gold Peqlab, Erlangen, Germany
RNeasy micro kit Qiagen, Hilden, Germany
Sensiscript RT kits Qiagen, Hilden, Germany
Standard DC Protein Assay Kit Bio-Rad Laboratories GmbH, Munich
VeriKine ELISA kit PBL InterferonSource, Piscataway,
NJ, USA
Materials 38
Germany
Anti-TLR4-PE Imgenex, San Diego, CA, USA
Human Fc Receptor Binding
Inhibitor
eBioscience, San Diego, CA USA
Anti-CD3-V450 BD Biosciences, Heidelberg,
Germany
Anti-CD4-V500 BD Biosciences, Heidelberg,
Germany
Anti-CD8-APC-H7 BD Biosciences, Heidelberg,
Germany
Anti-CD25-PE-Cy7 BD Biosciences, Heidelberg,
Germany
Anti-CD69-AlexaFlour 700 BD Biosciences, Heidelberg,
Germany
Anti-CD73-PE BD Biosciences, Heidelberg,
Germany
Anti-CD39-FITC Miltenyi Biotec, Bergisch Gladbach,
Germany
Anti-CD19-Qdot 655 Invitrogen, Carlsbad, CA, USA
Anti-FoxP3-APC BD Biosciences, Heidelberg,
Germany
Anti-TGF-β1-PE IQ products, Groningen, Netherlands
Anti-CD80-PE Biolegend, Fell, Germany
Anti-CD83-APC Biolegend, Fell, Germany
Anti-CD40-FITC Biolegend, Fell, Germany
4.6.2 Human Neutralizing antibodies
IL-27 neutralizing antibody R&D Systems, Wiesbaden-
Nordernstadt, Germany
IgG1 isotype control R&D Systems, Wiesbaden-
Nordernstadt, Germany

Materials 39
TGF-ß neutralizing antibody R&D Systems, Wiesbaden-
Nordernstadt, Germany
4.6.3 Murine FACS antibodies
CD19-APC-Cy7-PE BD Biosciences, Heidelberg,
Germany
CD115-PE BD Biosciences, Heidelberg,
Germany
CD45-V450 BD Biosciences, Heidelberg,
Germany
B220-V450 BD Biosciences, Heidelberg,
Germany
CD11c-AlexaFluor700 BD Biosciences, Heidelberg,
Germany
Ly6C-PerCP-Cy5.5 BD Biosciences, Heidelberg,
Germany
CD11b-eFluor605 ebioscience, San Diego,
CA, USA
CD8-eFluor650 ebioscience, San Diego,
CA, USA
HLA-DR-APC Miltenyi, Bergisch Gladbach,
Germany
CD11b-APC Miltenyi, Bergisch Gladbach,
Germany
SiglecH-PerCP-Cy5.5 Biolegend, Fell, Germany
CD317/120G8 Dendritics, Lyon, France
Mouse BD Fc Block BD Biosciences, Heidelberg,
Germany

Materials 40
4.6.4 Primary human antibodies:
Anti-E2-2 (rabbit polyclonal) ABCAM, Cambridge, UK
Anti-IDO (mouse monoclonal) ABCAM, Cambridge, UK
4.6.5 Secondary human antibodies:
IRDye680-labelled anti-rabbit Li-COR Biosciences GmbH, Bad
Homburg
IRDye800-labelled anti-rabbit Li-COR Biosciences GmbH, Bad
Homburg
4.7 Microbeads:
Human CD14 microbeads Miltenyi, Bergisch Gladbach,
Germany
Human CD4+ CD25+ regulatory
T cell isolation kit
Miltenyi, Bergisch Gladbach,
Germany
Anti-FITC microbeads Miltenyi, Bergisch Gladbach,
Germany
4.8 Media and reagents for cell culture
Bovine insulin Sigma-Aldrich Chemie GmbH,
Deisenhofen
Dulbecco’s Modified Eagle
Medium (DMEM)
PAA Laboratories GmbH, Cölbe
FCS PAA Laboratories GmbH, Cölbe
L-glutamine PAA Laboratories GmbH, Cölbe
Lymphocyte separation medium PAA Laboratories GmbH, Cölbe
Non essential amino acids PAA Laboratories GmbH, Cölbe

Materials 41
PBS (Instamed 9.55 g/ml) Biochrom AG, Berlin
Penicillin/Streptomycin PAA Laboratories GmbH, Cölbe
Roswell Park Memorial Institute
(RPMI) 1640
PAA Laboratories GmbH, Cölbe
Sodium pyruvate PAA Laboratories GmbH, Cölbe
4.9 Cytokines
4.10 ELISA
4.11 Stimulators and Inhibitors
APCP (CD73 inhibitor 5′-[αβ-
methylene] diphosphate)
Sigma, Steinheim, Germany
ARL67156 Sigma, Steinheim, Germany
all-trans retinoic acid (ATRA) Sigma-Aldrich, St. Louis, MO, USA
1x Brefeldin A (BFA) BD fastimmune, San Jose, CA USA
CpG-A (2336) oligonucleotides InvivoGen, San Diego, CA, USA
Human Flt3-L Immunotools, Friesoythe, Germany
Murine Flt3-L PeproTech, London, UK
Human GM-CSF Miltenyi, Bergisch Gladbach,
Germany
Human IL-2 Immunotools, Friesoythe, Germany
Human IL-4 Immunotools, Friesoythe, Germany
Human TNF-α Peprotech Inc. NJ, USA
IL-27 sandwich ELISA Biolegend, San Diego, CA USA
VeriKineTM Mouse Interferon-
Alpha ELISA Kit
PBL interferon source, NJ, USA
Materials 42
(ODN)
CSC (Adenosine receptor A2a
antagonist 8 (3-chlorostyryl)
caffeine)
Sigma, Steinheim, Germany
CYM50358 Courtesy: E. Roberts, The Scripps
Institute, La Jolla, CA, USA
CYM50374 Courtesy: E. Roberts, The Scripps
Institute, La Jolla, CA, USA
JTE-013 Biomol, Hamburg Germany
Lipopolysaccharide Sigma, Steinheim, Germany,
Staurosporine Sigma, Steinheim, Germany
Vitamin D3 Fluka, Biochemica, St. Louis, MO,
USA
VPC23019 Avanti Polar Lipids, Alabaster, AL,
USA
4.12 Oligonucleotides
The below given oligonucleotides were from biomers.net GmbH (Ulm):
p35: sense 5’-AGATAAAACCAGCACAGT-GGAGGC-3’, antisense: 5’-
GCCAGGCAACTCCCATTAGTTAT-3';
p28 sense: 5’-AGGA-GCTGCGGAGGGAGTT-3’, antisense: 5’-
AGGGGCAGGAGGTACAGGTTC-3’;
IL-10 sense: 5’-AAGCCTGACCACGCTTTCTA3-’, antisense: 5’-
TAGCAGTTAGGAAGCCCC-AA-3’.
The below given oligonucleotides were from Qiagen, Hilden, Germany:

Materials 43
Human E2-2 (QT00031829), human ID2 (QT00210637), human IFN-α1
(QT00201964), IFN-α2 (QT00212527), IFN-α16 (QT00202671), and human
IRF7 (QT00210595). Actin (QT01680476) and 18S (QF00530467) served as
the internal controls.
4.13 Cells and cell lines
Primary human monocytes: Primary human monocytes were isolated from
Buffy Coats, which were obtained from DRK-Blutspendedienst Baden-
Württemberg-Hessen, Frankfurt.
MCF-7 cells: MCF-7 human breast adenocarcinoma cells were established
from the pleural effusion of a 69-year-old Caucasian woman with metastatic
mammary carcinoma (after radio- and hormone therapy) in 1970 [75].
Mouse pDC: Mouse bone marrow cells were used as a precursor source for
generating pDC. Bone marrow cells were obtained from hindlimbs of HIF-1fl/fl
LysM-Cre mice under sterile conditions followed by erythrocyte lysis. The
bone marrow cells were cultured in low adhesion plates with appropriate
cytokines such as murine FLT3-L to obtain mouse pDC.
4.14 Instruments
Autoclave HV 85 BPW GmbH, Süssen
autoMACS™ Separator (Miltenyi Biotec, Bergisch Gladbach,
Germany)
AxioScope fluorescence
microscope
Carl Zeiss MicroImaging, Jena,
Germany
B250 Sonifier Branson Ultrasonics, Danbury (USA)
Bioanalyzer Agilent , Böblingen, Germany
CASY® Schärfe System, Reutlingen
Centrifuge 5415 R Eppendorf GmbH, Hamburg

Materials 44
Centrifuge CR 3.22 Jouan GmbH, Unterhaching
Centrifuge MR 23i Jouan GmbH, Unterhaching
Centrifuge ZK380 Hermle GmbH, Wehingen
FACSCanto flow cytometer BD Biosciences GmbH, Heidelberg
Fluorescence microscope
Axiovert 200M
Carl Zeiss MicroImaging Inc,
Göttingen
Holten LaminAir clean bench Jouan GmbH, Unterhaching
Hypoxia workstation incubator In vivo 400, Ruskin Technology, UK
IG 150 (cell culture incubator) Jouan GmbH, Unterhaching
LabLine Orbit Shaker Uniequip GmbH, Martinsried
LSRII/Fortessa flow cytometer BD Biosciences
Magnetic stirrer Combimag RCH IKA Labortechnik GmbH & Co. KG,
Staufen
Mastercycler Thermocycler Eppendorf GmbH, Hamburg
MediMachine BD Biosciences GmbH, Heidelberg
Mini-PROTEAN 3 System (SDS-
PAGE)
Bio-Rad Laboratories GmbH,
München
Mithras LB940 multimode reader Berthold Technologies, Bad Wildbad
NanoDrop spectrophotometer NanoDrop, Wilmington, USA
Odyssey infrared imaging
system
Li-COR Biosciences GmbH, Bad
Homburg
Pure water system Purelab Plus ELGA LabWater GmbH, Siershahn
Sub-Cell® GT electrophoresis
system
Bio-Rad Laboratories GmbH,
München
Thermomixer 5436 Eppendorf GmbH, Hamburg
Ultra-Sonifier MSE, Loughborough (England)
UV-Transilluminator gel
documentation system
Raytest GmbH, Straubenhardt

Materials 45
4.15 Plastic material
12-well Ultra-Low attachment
plates
Corning, Amsterdam, Netherlands
Nylon mesh BD Biosciences GmbH, Heidelberg
Pipettes (10 µl, 100 µl, 1.000 µl) Eppendorf GmbH, Hamburg
Cell culture dishes) Greiner Bio-One GmbH,
Frickenhausen
4.16 Software
Aida Image Analyzer v 3.11 Raytest GmbH, Straubenhardt
AxioVision Software Carl Zeiss MicroImaging Inc,
Göttingen
BD FACSDivaTM Software BD Biosciences GmbH, Heidelberg
FCAP software BD Biosciences, San Jose, CA USA
FlowJo software 7.6.1 Treestar, Ashland, OR, USA
Gene Expression Macro Bio-Rad, München, Germany
GraphPad Prism 5.0 GraphPad Software, San Diego, CA,
USA
MikroWin 2000 Berthold Technologies Bad Wildbad
Methods 46
5 Methods
5.1 Cell culture
MCF-7 breast carcinoma cells were maintained in RPMI 1640 supplemented
with 5 mM glutamine, 100 U/ml penicillin, 100 µg/ml streptomycin and 10%
heat-inactivated FCS supplemented with 1mM sodium pyruvate, 1 x non
essential amino acids and 10 µg/ml bovine insulin. Cells were kept in a
humidified atmosphere of 5% CO2 in air at 37°C and were transferred twice a
week.
5.2 Primary human immune cell isolation and expansion
Primary human blood cells were obtained from Buffy Coats (DRK-
Blutspendedienst Baden-Württemberg-Hessen, Institut für
Transfusionsmedizin und Immunhämatologie, Frankfurt, Germany) using
Ficoll-Hypaque gradients. For isolation of CD14+ human monocytes, total
Buffy Coats were layered on a Ficoll-Isopaque gradients (P=1077 g/ml) and
the interphase containing PBMC was obtained by centrifugation (440 g, 35
min). PBMC were washed with PBS/2 mM EDTA/0.5% BSA and CD14+
monocytes were isolated by magnetic cell sorting using human CD14
microbeads in the autoMACS™ Separator. The negative fraction consisting of
CD14- PBMC was used for T cell enrichment. Therefore, cells were cultured in
T cell medium [76] containing IL-2 (100 U/ml) for 6 days. Every two days, cells
adhering to the culture flask were depleted and expanding lymphocytes were
split 1:2. Or using a similar protocol, the negative fraction was used to
separate CD3+ lymphocytes from the same donor using human CD3
microbeads. CD3+ T lymphocytes were cultured with IL-2 (100 U/ml) for up to
6 days [77].
5.3 Animals
Animal handling followed the guidelines of the Hessian animal care and use
committee. Mice carrying loxP-flanked alleles of HIF-1 [78] were bred with

Methods 47
LysM-Cre transgenic mice [79] in the C57BL/6 background. Age-matched
C57BL/6 wildtype mice were controls.
5.4 Generation and maturation of plasmacytoid and myeloid DC
Human primary monocytes were cultured in 12 well cell culture plates in RPMI
1640 containing 10% FCS for 5 days with GM-CSF (100 ng/ml) and IL-4 (5
ng/ml) to generate myeloid DCs and Flt3-L (100 ng/ml) to generate mo-pDC.
On day 5, Lipopolysaccharide (LPS) (1 µg/ml) was added to mDC cultures
and 5 µg/ml CpG-A (2336) oligonucleotides (ODN) were added to mo-pDC
cultures to induce maturation. In some experiments immature mo-pDC were
used or mo-pDC were allowed to differentiate for 10 days. To investigate the
impact of vitamins on mo-pDC development, monocytes were cultured with
Flt3-L in combination with 3 nM all-trans retinoic acid (ATRA) or 3 µM Vitamin
D3. In some experiments mo-pDC were prestimulated overnight with 10 ng/ml
TNF-α prior to addition of CpG-A oligonucleotides. Also, human peripheral
CD14+ human monocytes were differentiated with Flt3-L under hypoxia (1%
O2, 5% CO2) in a hypoxia workstation incubator. The resulting mo-pDC
cultured under hypoxia were then compared with mo-pDC differentiated under
normoxia (20% O2, 5% CO2). Morphology of mo-pDC and mDC was routinely
analyzed using an AxioScope fluorescence microscope at room temperature,
using a charge-coupled device camera and the AxioVision Software.
5.5 Isolation of primary pDC
Primary untouched pDC were isolated from human PBMC using a
Plasmacytoid DC Isolation Kit that employs an indirect magnetic labeling
system.
5.6 Murine pDC generation from bone marriow and hypoxic culture
pDC were differentiated from bone marrow as described [80]. Briefly, mouse
bone marrow cells were obtained from the hindlimbs after disinfection with
70% ethanol. The limb was dissected at the knee to obtain upper and lower
Methods 48
limb. A 26-gauge needle filled with PBS was used to flush out the bone
marrow contents. The elution was passed through a 76µM nylon mesh in
order to obtain a single cell suspension. Cells were centrifuged at 500xg for 5
minutes. Erythrocyte lysis was performed on the pellet using an hypotonous
solution. The resulting erythrocyte-free cell suspension was seeded in a
concentration of 2 x 10⁶ total bone marrow cells/ml in RPMI1640
supplemented with 10% FCS and 200 ng/ml recombinant murine Flt3-L were
seeded to 12-well Ultra-Low attachment plates. Culture was maintained for up
to 9 d, with medium change every 3rd day. Cells were cultured either under
high (20%) or low (1-5%) O2 levels as indicated using a InVivo2 400 hypoxia
workstation.
5.7 Preparation of tumour cell supernatants
MCF-7 human breast carcinoma cells were grown in RPMI 1640 medium plus
10% FCS. Generation of supernatants of living (VCM), apoptotic (ACM) or
necrotic (NCM) MCF-7 cells was performed essentially as described To
produce apoptotic cell conditioned medium (ACM), cells were exposed to 1
µg/ml staurosporine (Sts) 1 h to induce apoptosis). Cells were washed twice
with PBS subsequent to apoptosis-induction, followed by an incubation for
another 4 h in appropriate medium (1.2.1). Alternatively, [81]. MCF-7 cells
remained untreated (living), or 30 µM oxaliplatin for 16 h (immunogenic cell
death) or were incubated at 56°C for 30 min (necrosis), followed by washing
and further incubating for at least another 5 h in full medium. The resulting
conditioned medium were called viable condition medium (VCM) or
Oxaliplatin-ACM (OXA-ACM) or necrotic condition medium (NCM)
respectively Thereafter, conditioned media were harvested by centrifugation
(13.000 x g, 5 min) and filtration through 0.2 µm pore filters, to remove
apoptotic bodies (incase of ACM or OXA-ACM) [82], [83] or residual cellular
particles (in case of NCM or VCM).

Methods 49
5.8 DC-T cell co-culture
Tumour cell supernatants were added to 2 x 10⁵ human monocyte-derived DC
at ratios of 1:1 for 16 h, followed by washing. Afterwards 2 x 10⁶ T cell-
enriched PBMC were added and co-cultures were maintained for another 3
days without changing media.
5.9 Treg isolation and CD39+ cell isolation
Treg were isolated from DC-T cell co-cultures using the CD4+CD25+
Regulatory T Cell isolation Kit by magnetic separation. Treg-depleted
populations were added back to the respective co-cultures. Isolated Treg
(controlled via FACS, Figure 26) were either used for RNA isolation or were
interchanged between ACM and VCM groups at ratios reconstituting mean
FoxP3-expressing cells (0.5%) to monitor their specific suppressive potential.
CD39-expressing T cells from IL-2 enriched T cell cultures were removed by
staining with CD39-FITC antibody and magnetic separation using anti-FITC
microbeads. The CD39-depleted populations were then used for co-cultures.
5.10 Stimulation of human monocyte-derived DC
S1P and the S1PR1/3 inhibitor VPC23019 (1 µM) were dissolved according to
the manufacturer’s instructions. The S1PR2/4 antagonist JTE-013 (15 µM)
and the S1PR4 antagonists CYM50358 and CYM50374 (each 200 nM) [84]
were dissolved in DMSO. These reagents were pre-incubated for 30 min with
DC prior to addition of tumour cell supernatants. The indolamine-2,3-
dioxygenase (IDO) inhibitors L-1MT or D-1MT (1 mM) [85] were added to DC
2 h prior to T cell addition. IL-27 neutralizing pab and the isotype control were
added at 1 µg/ml to DC 30 min before addition of T cells. The CD39 inhibitor
ARL67156 (250 µM), the CD73 inhibitor 5′-[αβ-methylene] diphosphate
(APCP) [86] (100 µM) dissolved in ddH2O and the adenosine receptor A2a
antagonist 8 (3-chlorostyryl) caffeine (CSC) [87] (10 mM) dissolved in DMSO
as well as the CD69 antibody, TGF-ß neutralizing antibody [88] and the
respective isotype controls were added to DC-T cell co-cultures at day 2.

Methods 50
5.11 Cytotoxicity assay
Cytotoxicity was quantified using a slightly modified established assay [89]
(Figure 10). The T cells from DC-T cell coculture was harvested into FACS
tubes. These were pelleted at 500 xg for 5 minutes. The pellet was
resuspended in 500µl FACS buffer (PBS + 0.2% BSA). 20µl of this
suspension was pipetted into FACS tubes along with 80µl FACS buffer. These
cells were stained with propidium iodide (PI) for 10 min.
Figure 10: Cytotoxicity assay was performed as depicted: 1. DC were cocultured for 3 days with T cell-enriched PBMC, here depicted as DC-T cell coculture; 2. Live MCF-7 cells were stained with Cell Tracker Blue (CMAC) dye for 45 minutes. The resulting cells were called CMAC-MCF-7 cells. 3. T cells were stained with flourospheres and absolute cell counting was done using flow cytometry; 4. T cells were added to CMAC-MCF-7 cells at different ratios and cocultured for 4h; 5. The CMAC-MCF-7-T cell coculture was stained with PI and flourospheres. The number of living MCF-7 cells and their absolute count was determined by comparing PI and flourocount flouresence respectively with that of the non co-cultured MCF-7 control.
Directly before sample acquisition, Flow-Count Fluorospheres (Beckman-
Coulter, Krefeld, Germany) were added as an internal cell counting standard.
103 events of living lymphocytes were recorded. The value of flourospheres
required to attain the number was used to calculate the absolute number of
lymphocytes. Human breast carcinoma cells (MCF-7 and T47D), 2 x 10⁶ each

Methods 51
were suspended in FACS buffer. The cells were stained with 100 µM
CellTracker Blue (7-amino-4-chloromethylcoumarin, CMAC) (Invitrogen, CA,
USA) according to manufacturer’s instructions for 45 min. This was followed
by washing with FACS buffer and the cells were centrifuged at 500 xg for 5
minutes. Afterwards, 5 x 10⁴ breast cancer cells were seeded in FACS tubes
together with T cells from DC co-cultures in ratios as indicated for 4 h. The
reaction mix was then stained with propidium iodide (PI) for 10 min. Directly
before sample acquisition, Flow-Count Fluorospheres (Beckman-Coulter,
Krefeld, Germany) were added as an internal cell counting standard and 2 x
103 living (PI-, CMAC+, FSChigh) breast cancer cells were recorded for each
sample in comparison to unstimulated breast cancer cells. Cytotoxicity was
calculated as described [89]. In some experiments, blocking of CD8 in T cells
was triggered using CD8 antibody [90] or the respective isotype control (BD
Biosciences) 1 h before performing cytotoxicity experiments.
5.12 Flow cytometry of human DC
Antibodies used for mo-pDC staining in comparison to mDC; monocytes or
primary pDC were APC-labelled CD14, CD45RA, CD123, FITC-labelled
CD86, CD1a, Alexa 488-labelled CXCR3, PE-labelled CD135, BDCA2, APC-
labelled BDCA4 and CD11b, HLA-ABC (MHC I)-FITC, FITC-labelled TLR7,
PE-labelled TLR9 and TLR4 and respective isotype controls. For analysis of
surface marker expression, monocytes or DC were detached from the dishes
by treatment with accutase [91] and washed with ice-cold PBS. Cells were
then stained with respective antibodies, incubated on ice for 30 min and
analyzed by flow cytometry. Appropriate isotype controls or monocytes
stained with respective antibodies were used as controls.
For analysis of DC maturation, DC were detached from the wells by treatment
with accutase [91] (PAA), washed with ice-cold PBS/0.2% BSA and incubated
on ice for 20 min with CD86-FITC, HLA-DR (MHC II)-PE-Cy7 or HLA-ABC
(MHC I)-FITC or CD80-PE, CD83-APC and CD40-FITC. For polychromatic
flow cytometry analysis of T cells from DC co-cultures, cells were harvested
using a pipette, transferred to FACS tubes and washed with ice-cold PBS.

Methods 52
Next, non-specific antibody binding to FC-γ receptors was blocked using
Human Fc Receptor Binding Inhibitor for 20 min, cells were resuspended in
FACS staining buffer and incubated with a pre-mixed antibody cocktail
consisting of CD3-V450, CD4-V500, CD8-APC-H7, CD25-PE-Cy7, CD69-
AlexaFlour 700 and CD73-PE, CD39-FITC, CD19-Qdot 655 on ice for 30 min.
Then, cells were fixed and permeabilized using the FoxP3 buffer set from BD
Biosciences according to manufacturer’s intructions, washed with PBS/0.2%
BSA and incubated with FoxP3-APC antibody for 60 min at RT. For analysis
of TGF-β expression, cells were pre-treated with 500 ng/ml Brefeldin A and
TGF-β1-PE antibody was used alongside with the FoxP3 antibody. Samples
were acquired using a LSRII/Fortessa flow cytometer and analyzed using
FlowJo software 7.6.1. All antibodies were titrated to determine optimal
concentrations. Antibody-capturing CompBeads were used for single-color
compensation to create the multi-color panel compensation matrix. For gating,
fluorescence minus one (FMO) controls and/or isotype controls were used.
The instrument calibration was controlled and adjusted daily using Cytometer
Setup and Tracking (CST) beads.
5.13 Murine Polychromatic flow cytometry
pDC were identified from in vitro bone marrow cultures, whole bone marrow,
spleen or whole blood using the following antibodies: CD19-APC-Cy7,
CD115-PE, CD45-V450, B220-V450, CD11c-AlexaFluor700, (CD11b-
eFluor605, CD8-eFluor650 ; HLA-DR-APC, CD11b-APC; SiglecH-PerCP-
Cy5.5; CD317/120G8. Single cell suspensions were generated from solid
tissues by digestion with 3 mg/ml Collagenase IA, 1 U/ml DNAse I in 50%
DMEM for 30 min at 37°C, followed by processing with MediMachine, RBC
lysis and filtering through a 70 µm nylon mesh. Cells were transferred to
FACS tubes, non-specifc antibody binding to FC-γ receptors was blocked with
Mouse BD Fc Block for 20 min on ice. This was followed by incubation with
individual antibody cocktails for 30 min on ice. Samples were acquired with a
LSRII/Fortessa flow cytometer and analyzed using FlowJo software 7.6.1. All
antibodies were titrated to determine optimal concentrations. Antibody-
capturing CompBeads were used for single-color compensation to create
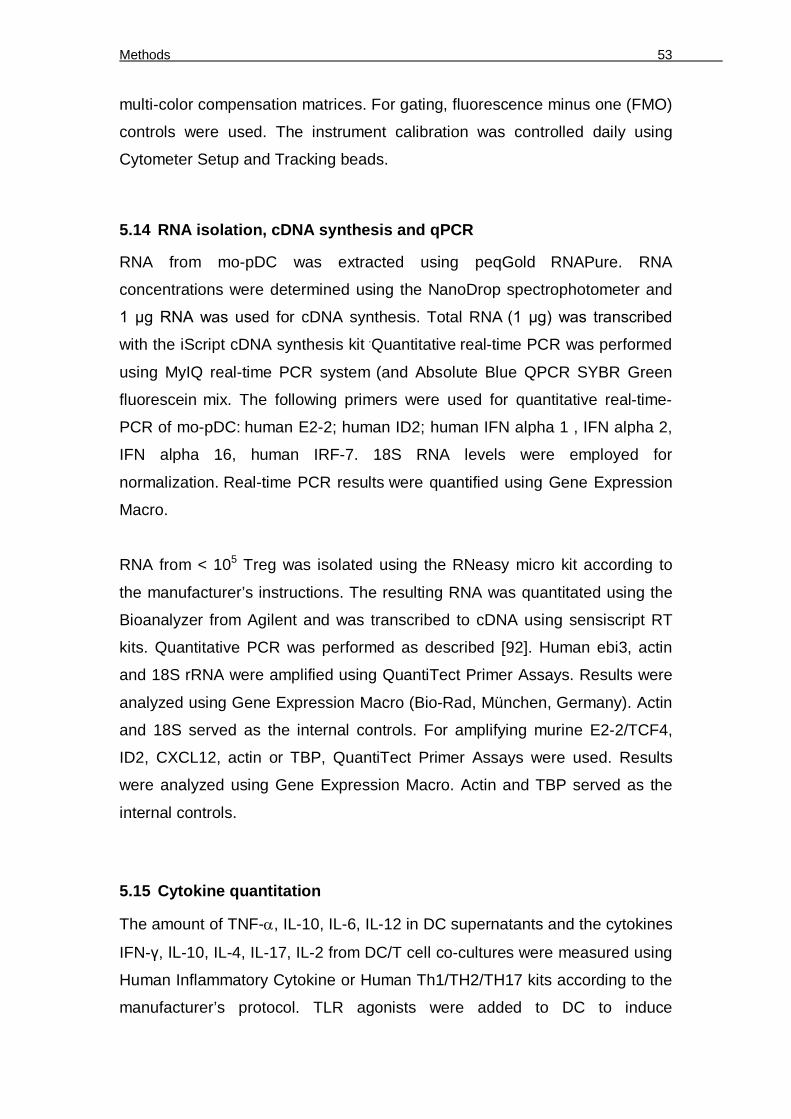
Methods 53
multi-color compensation matrices. For gating, fluorescence minus one (FMO)
controls were used. The instrument calibration was controlled daily using
Cytometer Setup and Tracking beads.
5.14 RNA isolation, cDNA synthesis and qPCR
RNA from mo-pDC was extracted using peqGold RNAPure. RNA
concentrations were determined using the NanoDrop spectrophotometer and
1 µg RNA was used for cDNA synthesis. Total RNA (1 µg) was transcribed
with the iScript cDNA synthesis kit .Quantitative real-time PCR was performed
using MyIQ real-time PCR system (and Absolute Blue QPCR SYBR Green
fluorescein mix. The following primers were used for quantitative real-time-
PCR of mo-pDC: human E2-2; human ID2; human IFN alpha 1 , IFN alpha 2,
IFN alpha 16, human IRF-7. 18S RNA levels were employed for
normalization. Real-time PCR results were quantified using Gene Expression
Macro.
RNA from < 105 Treg was isolated using the RNeasy micro kit according to
the manufacturer’s instructions. The resulting RNA was quantitated using the
Bioanalyzer from Agilent and was transcribed to cDNA using sensiscript RT
kits. Quantitative PCR was performed as described [92]. Human ebi3, actin
and 18S rRNA were amplified using QuantiTect Primer Assays. Results were
analyzed using Gene Expression Macro (Bio-Rad, München, Germany). Actin
and 18S served as the internal controls. For amplifying murine E2-2/TCF4,
ID2, CXCL12, actin or TBP, QuantiTect Primer Assays were used. Results
were analyzed using Gene Expression Macro. Actin and TBP served as the
internal controls.
5.15 Cytokine quantitation
The amount of TNF-, IL-10, IL-6, IL-12 in DC supernatants and the cytokines
IFN-γ, IL-10, IL-4, IL-17, IL-2 from DC/T cell co-cultures were measured using
Human Inflammatory Cytokine or Human Th1/TH2/TH17 kits according to the
manufacturer’s protocol. TLR agonists were added to DC to induce

Methods 54
maturation. After 24h, the supernatants were harvested and centrifuged. The
amount of TNF-α, IL-10, IL-6, IL-1ß in the supernatants of mature DC and the
amounts of TNF-α in the supernatants from immature DC were measured
using human inflammation kits according to manufacturer. Samples were
analyzed by FACS and processed with BD Biosciences’ FCAP software.
Samples were acquired in the flow cytometer and processed with BD
Biosciences FCAP software. An IL-27 sandwich ELISA was used to quantify
IL-27 levels in treated DC supernatants following the manufacturer’s
instructions. Measurement of murine IFN- in supernatants of 5 µg/ml CpG-A-
stimulated pDC was performed using VeriKine ELISA kit.
5.16 T lymphocyte proliferation assay
CD3+ T lymphocytes were loaded with 0.5 µM carboxyfluorescein succinimidyl
ester (CFSE) according to manufacturer’s protocol. CFSE loaded CD3+ T
lymphocytes were cocultured with autologous mature DC subsets at a 5:1
ratio for 5 days. Afterwards, the supernatant from the cocultures was
harvested. DC were gated from the CD3+ T lymphocyte population, following
which, CFSE-dependent green fluorescence was quantitated using FACS
analysis.
5.17 Apoptotic cell phagocytosis assay
Jurkat cells were stained with CFSE according to the manufacturer’s protocol.
CFSE-labelled Jurkat cells were treated with 1 µg/ml staurosporine for 2.5 h in
RPMI 1640 without serum. The resulting apoptotic Jurkat cells were added to
mDC and mo-pDC in a 50:1 ratio and cultures were incubated at 37 0C for 3.5
h. Then, the cells were harvested and placed on ice to arrest phagocytosis.
Cells were incubated for 30 min with APC labelled anti-CD11b antibody and
the fluorescence was quantitated using FACS analysis. CD11b+ cells, which
were double-positive for CFSE were considered to be phagocytic. Apoptotic
Jurkat cells (only CFSE+) served as negative control.
Methods 55
5.18 Western blot analysis
Generally, immature mo-pDC were used for Western analysis, which was
performed as described [81]. A Rabbit polyclonal antibody to E2-2 was used.
Blots were counterstained with IRDye infrared secondary antibodies, which
were visualized with the Odyssey infrared imaging system.
5.19 IFN-α intracellular staining (ICS)
DC or PBMC were suspended in 500 µl culture medium. Cells were treated
with CpG ODN for 2 h and incubated with 10 µl of 1x Brefeldin A (BFA) to
block anterograde protein transport. After 2 h, 50 µl of 20 mM EDTA was
added and cells were incubated overnight at 4C. Thereafter, cells were
washed with FACS wash buffer) and stained with anti-CD123 or anti-CD45RA
antibody for 30 min. Subsequently, cells were fixed and permeabilized using
BD Cytofix/Cytoperm Buffer and washed with BD perm/wash buffer, followed
by staining for 60 min with anti-IFN-α PE antibody, that is described by the
manufacturers to react with human IFN-α2b and to lesser extent with IFN-α7.
After subsequent washing steps, staining was analyzed in FACS.
5.20 IFN-α bioassay
TLR agonists were added to DC to induce maturation or immature DC were
used. Supernatants were harvested 24 h after stimulation. In order to
quantitatively determine bioactivity of IFN-α in the supernatants, the iLite
Human interferon alpha kit was used according to the manufacturer’s
instructions.
5.21 Statistical analysis
FlowJo 7.5 software was used for generating FACS traces and for quantifying
the mean flourescence intensities. p-values were calculated by ANOVA with
Bonferroni’s correction or paired Student’s t-test. Differences were considered
significant at p < 0.05. Data were analyzed using GraphPad Prism 5.0 for
Windows (GraphPad Software, San Diego, CA, USA)

Results 56
6 Results
6.1 Ex-vivo mo-pDC generation and study under hypoxia
The study of dendritic cell populations under the influence of tumour
microenvironmental factors required easily available cell sources for in vitro
analysis of their function. Since pDC are rare in human blood and suitable cell
lines do not exist, we wondered if these cells could be generated in vitro in a
comparable manner as described for mDC [93]. Therefore, in this study,
monocytes present in human peripheral blood were exploited for the
generation of pDC-like cells using Flt3-L. The mo-pDC thus obtained were
analyzed for expression of surface markers, which are known to be
differentially expressed on pDC compared to mDC. Mo-pDC mimicked pDC
characteristics but retained some properties of monocytes from which they
were differentiated. In addition, the functional behaviour of mo-pDC, such as
the ability to cause autologous lymphocyte proliferation and the capacity of
mo-pDC to phagocytose apoptotic cells were determined. Mo-pDC expressed
E2-2 as well as markers, which are under the transcriptional control of E2-2.
Further, functional human pDC equivalents were generated by standardizing
appropriate cytokine or agonist combinations that accentuate IFN-α
production. Finally, the influence of hypoxia on pDC generation and the
resulting mo-pDC phenotype was investigated.
6.1.1 Generation and characterization of mo-pDC from human monocytes
using Flt3-L
Though the developmental origin of pDC was long considered to be entirely
lymphoid, recently common myeloid progenitors were identified for both mDC
and pDC [18]. Besides, Flt3-L was identified as a vital determinant for pDC
generation in humans [22] and mice [18]. Therefore, we questioned whether
pDC equivalents could be generated from monocytes using Flt3-L.
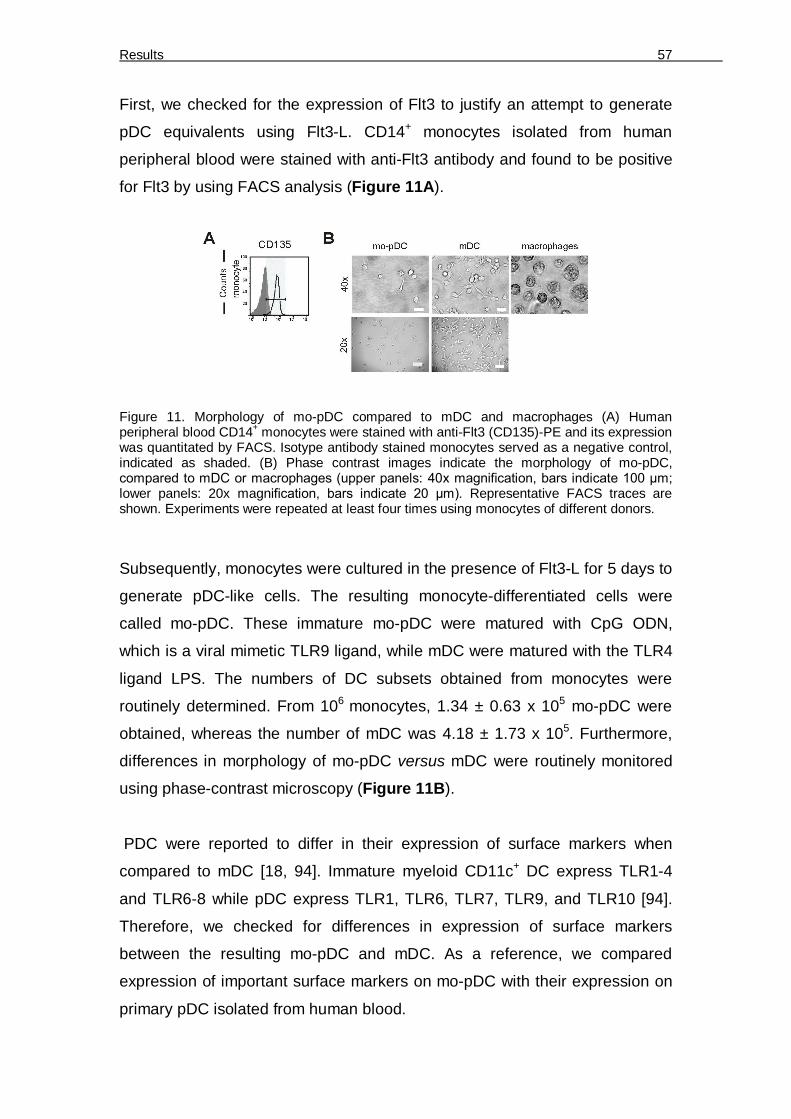
Results 57
First, we checked for the expression of Flt3 to justify an attempt to generate
pDC equivalents using Flt3-L. CD14+ monocytes isolated from human
peripheral blood were stained with anti-Flt3 antibody and found to be positive
for Flt3 by using FACS analysis (Figure 11A).
Figure 11. Morphology of mo-pDC compared to mDC and macrophages (A) Human peripheral blood CD14+ monocytes were stained with anti-Flt3 (CD135)-PE and its expression was quantitated by FACS. Isotype antibody stained monocytes served as a negative control, indicated as shaded. (B) Phase contrast images indicate the morphology of mo-pDC, compared to mDC or macrophages (upper panels: 40x magnification, bars indicate 100 µm; lower panels: 20x magnification, bars indicate 20 µm). Representative FACS traces are shown. Experiments were repeated at least four times using monocytes of different donors.
Subsequently, monocytes were cultured in the presence of Flt3-L for 5 days to
generate pDC-like cells. The resulting monocyte-differentiated cells were
called mo-pDC. These immature mo-pDC were matured with CpG ODN,
which is a viral mimetic TLR9 ligand, while mDC were matured with the TLR4
ligand LPS. The numbers of DC subsets obtained from monocytes were
routinely determined. From 106 monocytes, 1.34 ± 0.63 x 10⁵ mo-pDC were
obtained, whereas the number of mDC was 4.18 ± 1.73 x 10⁵. Furthermore,
differences in morphology of mo-pDC versus mDC were routinely monitored
using phase-contrast microscopy (Figure 11B).
PDC were reported to differ in their expression of surface markers when
compared to mDC [18, 94]. Immature myeloid CD11c+ DC express TLR1-4
and TLR6-8 while pDC express TLR1, TLR6, TLR7, TLR9, and TLR10 [94].
Therefore, we checked for differences in expression of surface markers
between the resulting mo-pDC and mDC. As a reference, we compared
expression of important surface markers on mo-pDC with their expression on
primary pDC isolated from human blood.

Results 58
Figure 12. Mo-pDC differ in surface marker expression compared to mDC. (A) Ex-vivo untouched human pDC were isolated from different donors and activated for 24 hours with 5µg/ml CpG-A 2336. Monocytes were differentiated with GM-CSF (100 ng/ml)/IL-4 (5 ng/ml) for 5 days and resulting mDC were matured with LPS. Monocytes were differentiated with Flt3-L (100 ng/ml) for 5 days and resulting immature mo-pDC were analyzed (dotted FACS traces) or matured with CpG ODN or LPS prior to analysis. The mo-pDC or mDC and primary pDC were stained with anti-BDCA4, CD123, CD11c, CD86, MHCI, CD45RA, CD1a, TLR7, TLR9, CXCR3 antibodies; (B) For some surface marker analysis mo-pDC were differentiated for up to 10 days (long-term mo-pDC). The mo-pDC or mDC, primary pDC and long-term mo-pDC were stained with anti-TLR4, CD14 (here CD14 stained monocyte served as positive control indicated by dashed-line), CD11b antibodies. Expression of the surface markers was quantitated by FACS. Isotype antibody-stained mDC or mo-pDC or primary pDC or long-term mo-pDC respectively served as appropriate negative controls (shaded FACS traces). Representative FACS traces are shown. Experiments were repeated at least four times using monocytes of different donors.
In human blood and bone marrow, BDCA4 is exclusively expressed on pDC
[95], while CD123 is also a prominent pDC marker [94]. Indeed BDCA4 and
CD123 surface expression was higher in mo-pDC compared to mDC, and
similar to primary pDC (Figure 12A). In contrast, CD11c and CD86 which are
co-stimulatory molecules for T cell activation were lower in mo-pDC and
primary pDC (Figure 12A). In addition mo-pDC generated with Flt3-L
expressed MHCI, CD1a and higher CD45RA compared to mDC (Figure 12A).

Results 59
Table 1: Quantification of surface marker expression
MFI ± S.D of surface marker expression displayed in Figure 11A, 12A, 12B, 13D
In addition mo-pDC expressed CD14, a monocytic marker and TLR4, a
prominent mDC marker, which were however lost upon long-term culture for
10 days. Mo-pDC expressed slightly lowered CD11b which was retained even
through long-term culturing (Figure 12B). Primary pDC are reported to
express TLR7 and TLR9 as opposed to myeloid DC [94]. Mo-pDC expressed
high TLR7 compared to mDC and similar to primary pDC, whereas TLR9 was
highly expressed on mo-pDC, but surprisingly also on mDC. Plasmacytoid DC
Surface
markers
Monocytes
CD135 68±11
Surface
markers
mDC Immature
mo-pDC
Mature
mo-pDC
Primary
pDC
Long-term
mo-pDC
BDCA4 40±9 64±0.4 45±6 51±2
CD123 28±5 58±4 57±22 77±5
CD11c 48±9 24±16 5±7 26±10
CD86 55±14 9±0.7 10±1 4±2
MHCI 189±45 72±51 113±83 84±3
CD45RA 66±3 59±8 74±4 88±7
CD1a 113±22 37±4 39±2
CD14 165±36 640±74 390±87 77±4 40±15.8
TLR4 1440±101 341±14 327±19 84±3 5±1.6
CD11b 80±3 69±13 62±4 5±0.2 41±16.2
TLR7 9±14 1±2 45±6 99±12
TLR9 92±3 3±2.5 84±2.2 85±4
CXCR3 7.2±4 10±1.2 14±1.2 60±6
BDCA2 37±12.6 51±3.5 79±2

Results 60
were characterized by CXCR3 expression [96]. Mo-pDC were slightly CXCR3
positive compared to primary pDC, but CXCR3 was not expressed on mDC
(Figure 12A). Quantification of the expression data is shown in Table 1.
6.1.2 Expression of pDC developmental transcription factors by mo-pDC
E2-2, a specific transcriptional regulator of the pDC lineage, was shown to be
absent in monocytes, macrophages and CD11chigh CD11b+ mDC [25].
Therefore, we compared E2-2 protein expression in monocytes, which were
frozen directly after isolation vs. mo-pDC generated from monocytes of the
same donor.
Figure 13. Expression of pDC lineage determining transcription factor E2-2 and E2-2-controlled BDCA2. (A) E2-2 protein expression in monocytes and immature mo-pDC from the same donor was analyzed by Western blotting. Actin serves as a loading control. A representative blot of three independent experiments using different donors is shown. (B) E2-2 mRNA expression in mo-pDC and mDC was quantitated by qPCR. Asterisks marks statistically significant differences (p < 0.05). (C) ID2 mRNA expression in mo-pDC and mDC was quantitated by qPCR. Asterisk marks statistically significant differences (p < 0.05). (D) Monocytes were differentiated with Flt3-L or GM-CSF/IL-4 for 5 days and matured with CpG ODN or LPS. Resulting mo-pDC or mDC and primary pDC, immature mo-pDC (dotted FACS trace) were stained with the anti-BDCA2 antibody. BDCA2 expression was quantitated by FACS along with isotype controls. Representative FACS traces are shown. Experiments were repeated at least four times using monocytes of different donors. Mo-pDC showed strong E2-2 protein expression, while it was absent in
monocytes (Figure 13A). Furthermore, on mRNA level, mo-pDC expressed
significantly higher E2-2 compared to mDC (Figure 13B), whereas mRNA
levels of ID2, the functional inhibitor of E2-2 [26] were significantly lower
(Figure 13C). E2-2 regulates the synthesis of BDCA2 [97], which is
specifically expressed by pDC and internalizes antigen for presentation to T
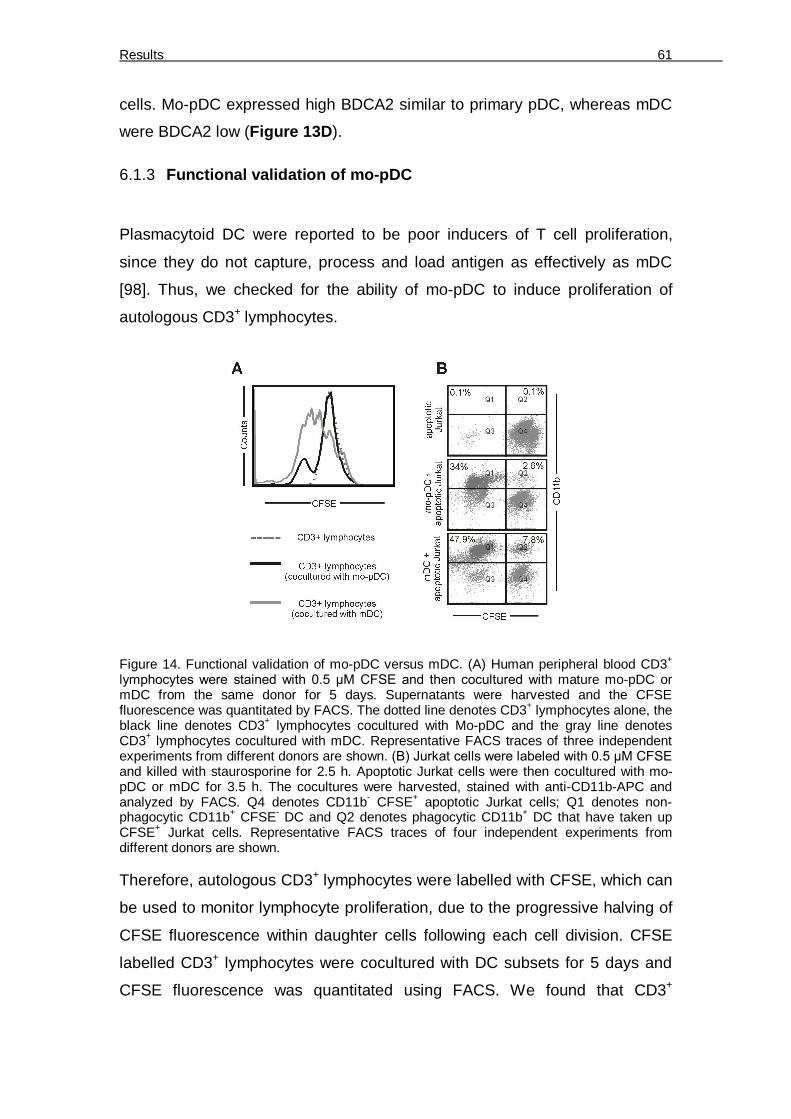
Results 61
cells. Mo-pDC expressed high BDCA2 similar to primary pDC, whereas mDC
were BDCA2 low (Figure 13D).
6.1.3 Functional validation of mo-pDC
Plasmacytoid DC were reported to be poor inducers of T cell proliferation,
since they do not capture, process and load antigen as effectively as mDC
[98]. Thus, we checked for the ability of mo-pDC to induce proliferation of
autologous CD3+ lymphocytes.
Figure 14. Functional validation of mo-pDC versus mDC. (A) Human peripheral blood CD3+ lymphocytes were stained with 0.5 µM CFSE and then cocultured with mature mo-pDC or mDC from the same donor for 5 days. Supernatants were harvested and the CFSE fluorescence was quantitated by FACS. The dotted line denotes CD3+ lymphocytes alone, the black line denotes CD3+ lymphocytes cocultured with Mo-pDC and the gray line denotes CD3+ lymphocytes cocultured with mDC. Representative FACS traces of three independent experiments from different donors are shown. (B) Jurkat cells were labeled with 0.5 µM CFSE and killed with staurosporine for 2.5 h. Apoptotic Jurkat cells were then cocultured with mo-pDC or mDC for 3.5 h. The cocultures were harvested, stained with anti-CD11b-APC and analyzed by FACS. Q4 denotes CD11b- CFSE+ apoptotic Jurkat cells; Q1 denotes non-phagocytic CD11b+ CFSE- DC and Q2 denotes phagocytic CD11b+ DC that have taken up CFSE+ Jurkat cells. Representative FACS traces of four independent experiments from different donors are shown. Therefore, autologous CD3+ lymphocytes were labelled with CFSE, which can
be used to monitor lymphocyte proliferation, due to the progressive halving of
CFSE fluorescence within daughter cells following each cell division. CFSE
labelled CD3+ lymphocytes were cocultured with DC subsets for 5 days and
CFSE fluorescence was quantitated using FACS. We found that CD3+
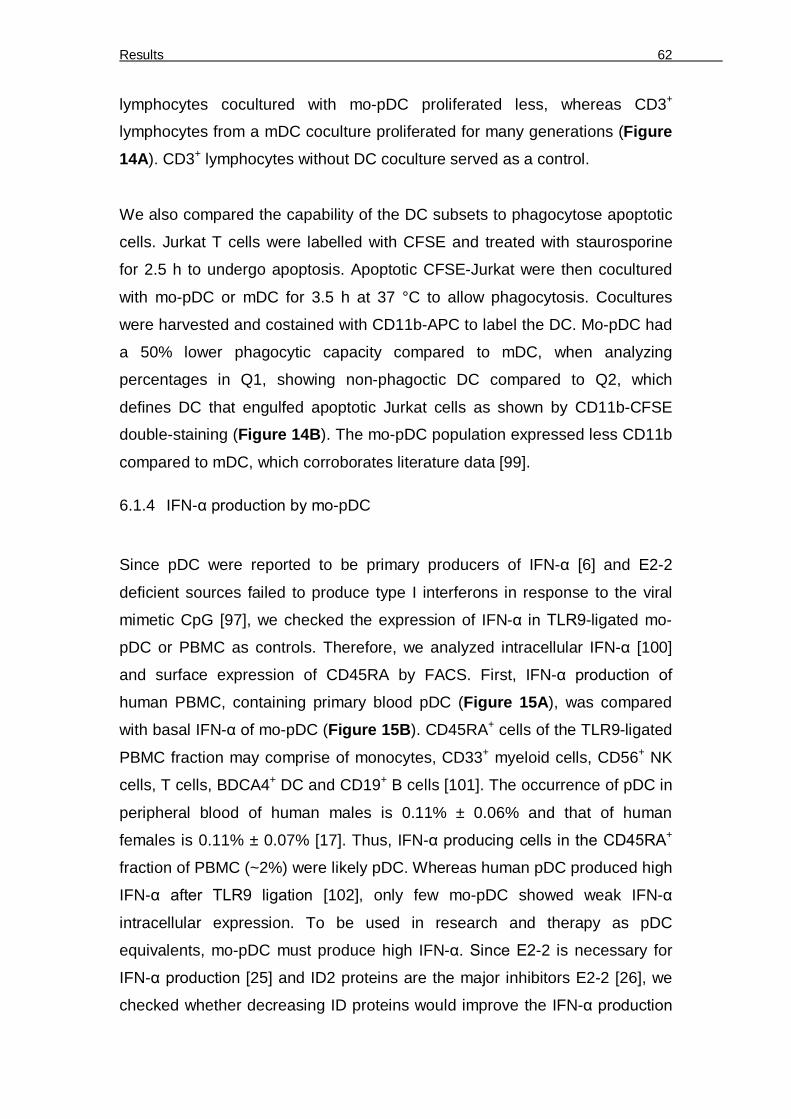
Results 62
lymphocytes cocultured with mo-pDC proliferated less, whereas CD3+
lymphocytes from a mDC coculture proliferated for many generations (Figure 14A). CD3+ lymphocytes without DC coculture served as a control.
We also compared the capability of the DC subsets to phagocytose apoptotic
cells. Jurkat T cells were labelled with CFSE and treated with staurosporine
for 2.5 h to undergo apoptosis. Apoptotic CFSE-Jurkat were then cocultured
with mo-pDC or mDC for 3.5 h at 37 °C to allow phagocytosis. Cocultures
were harvested and costained with CD11b-APC to label the DC. Mo-pDC had
a 50% lower phagocytic capacity compared to mDC, when analyzing
percentages in Q1, showing non-phagoctic DC compared to Q2, which
defines DC that engulfed apoptotic Jurkat cells as shown by CD11b-CFSE
double-staining (Figure 14B). The mo-pDC population expressed less CD11b
compared to mDC, which corroborates literature data [99].
6.1.4 IFN-α production by mo-pDC
Since pDC were reported to be primary producers of IFN-α [6] and E2-2
deficient sources failed to produce type I interferons in response to the viral
mimetic CpG [97], we checked the expression of IFN-α in TLR9-ligated mo-
pDC or PBMC as controls. Therefore, we analyzed intracellular IFN-α [100]
and surface expression of CD45RA by FACS. First, IFN-α production of
human PBMC, containing primary blood pDC (Figure 15A), was compared
with basal IFN-α of mo-pDC (Figure 15B). CD45RA+ cells of the TLR9-ligated
PBMC fraction may comprise of monocytes, CD33+ myeloid cells, CD56+ NK
cells, T cells, BDCA4+ DC and CD19+ B cells [101]. The occurrence of pDC in
peripheral blood of human males is 0.11% ± 0.06% and that of human
females is 0.11% ± 0.07% [17]. Thus, IFN-α producing cells in the CD45RA+
fraction of PBMC (~2%) were likely pDC. Whereas human pDC produced high
IFN-α after TLR9 ligation [102], only few mo-pDC showed weak IFN-α
intracellular expression. To be used in research and therapy as pDC
equivalents, mo-pDC must produce high IFN-α. Since E2-2 is necessary for
IFN-α production [25] and ID2 proteins are the major inhibitors E2-2 [26], we
checked whether decreasing ID proteins would improve the IFN-α production
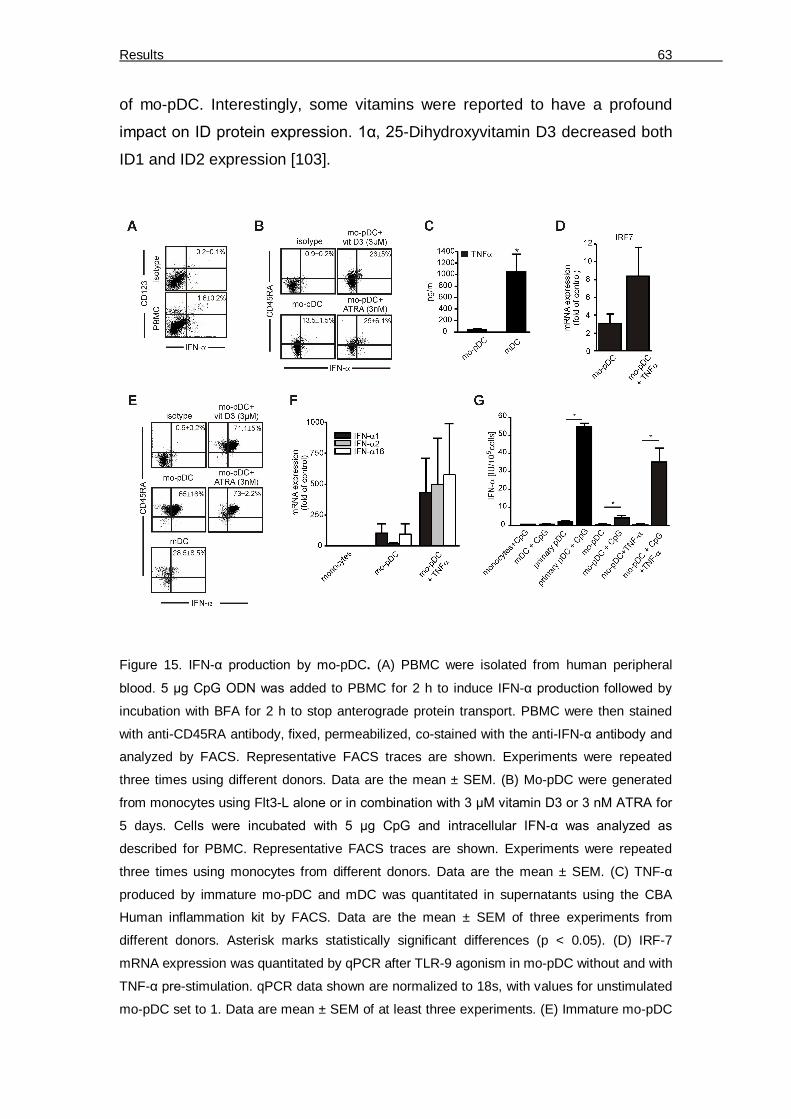
Results 63
of mo-pDC. Interestingly, some vitamins were reported to have a profound
impact on ID protein expression. 1α, 25-Dihydroxyvitamin D3 decreased both
ID1 and ID2 expression [103].
Figure 15. IFN-α production by mo-pDC. (A) PBMC were isolated from human peripheral
blood. 5 µg CpG ODN was added to PBMC for 2 h to induce IFN-α production followed by
incubation with BFA for 2 h to stop anterograde protein transport. PBMC were then stained
with anti-CD45RA antibody, fixed, permeabilized, co-stained with the anti-IFN-α antibody and
analyzed by FACS. Representative FACS traces are shown. Experiments were repeated
three times using different donors. Data are the mean ± SEM. (B) Mo-pDC were generated
from monocytes using Flt3-L alone or in combination with 3 µM vitamin D3 or 3 nM ATRA for
5 days. Cells were incubated with 5 µg CpG and intracellular IFN-α was analyzed as
described for PBMC. Representative FACS traces are shown. Experiments were repeated
three times using monocytes from different donors. Data are the mean ± SEM. (C) TNF-α
produced by immature mo-pDC and mDC was quantitated in supernatants using the CBA
Human inflammation kit by FACS. Data are the mean ± SEM of three experiments from
different donors. Asterisk marks statistically significant differences (p < 0.05). (D) IRF-7
mRNA expression was quantitated by qPCR after TLR-9 agonism in mo-pDC without and with
TNF-α pre-stimulation. qPCR data shown are normalized to 18s, with values for unstimulated
mo-pDC set to 1. Data are mean ± SEM of at least three experiments. (E) Immature mo-pDC

Results 64
were pretreated overnight with 10 ng/ml TNF-α. TNF-α pretreated mo-pDC and immature
mDC were incubated with CpG ODN and IFN-α intracellular staining was performed.
Representative FACS traces are shown. Experiments were repeated three times using
monocytes from different donors. Data are the mean ± SEM. (F) IFN-α1, 2 and 16 mRNA
expression was quantitated by qPCR after TLR-9 agonism in mo-pDC without and with TNF-α
pre-stimulation and in monocytes. (G) Bioactivity of IFN-α in the supernatants of CpG-treated
monocytes, mDC, primary pDC and mo-pDC (without and with TNF-α pre-stimulation) was
quantitated using bioassay. Experiments were repeated three times using monocytes from
different donors. Data are the mean ± SEM expressed in IU for 105 cells. Asterisks mark
statistically significant differences (p < 0.05).
Also, all-trans retinoic acid (ATRA) decreased ID1 and ID2 expression [104].
Accordingly, we investigated the effects of vitamin D3 or ATRA on mo-pDC
differentiation from monocytes, by adding them together with Flt3-L. IFN-α
production increased during differentiation of mo-pDC with Flt3-L in
combination with Vitamin D3 or ATRA (Figure 15B).
6.1.5 Augmenting IFN-α production by mo-pDC
Additionally, we asked whether triggering IFN-α upstream pathways enhances
IFN-α production in mo-pDC. IRF7 is the critical transcriptional regulator of
IFN-α [105] and TNF-α stimulates IRF7 expression through NFκB [106].
Checking basal TNF-α produced we noticed that mo-pDC produced only
insignificant amounts of TNF-α, especially when compared to mDC (Figure 15C). Therefore we checked the outcome of TNF-α pre-treatment on IRF-7
expression and further on CpG-elicited IFN-α expression. Indeed, IRF-7
mRNA expression in mo-pDC was increased after TNF-α prestimulation
(Figure 15D).
In line, IFN-α production was strongly enhanced by TNF-α-priming and TNF-
α-priming further increased CD45RA expression in mo-pDC (Figure 15E).
During differentiation along with vitamin D3 or ATRA followed by priming with
TNF-α, the number of cells producing high levels of IFN-α could be further
enhanced. Here, IFN-α produced by TNF-α-pretreated mo-pDC was
compared with TLR9 ligated mDC (Figure 15E). It was reported that pDC
express CD45RA in comparison to mDC [94], which is also reflected by our

Results 65
observations showing that mo-pDC are more CD45RA+ compared to mDC or
with respect to their respective isotypes (Figure 15E and Figure 15B).
Primary human pDC are reported to show a certain IFN-α mRNA subtype
profile compared to myeloid cells [107]. We checked the differential
expression of representative IFN-α mRNA subtypes in mo-pDC after TLR9
agonism. TNF-α prestimulation increased the mRNA levels of all the three
IFN-α subtypes that were tested (IFN-α1, 2, 16) (Figure 15F). Interestingly,
there was a nice correlation regarding the increase in IFN-α2 expression
between the intracellular staining that specifically detects IFN-α2 and IFN-α2
expression on mRNA levels with respect to TNF-α pre-stimulated and un-
primed mo-pDC.
To finally confirm IFN-α production by mo-pDC, we first used a conventional
ELISA to quantitatively validate the amount of IFN-α produced after TLR-9
agonism. However, the outcome was not satisfactory when compared to
primary pDC (data not shown). Since there was no information available
regarding the specific subtype of IFN-α detected in the ELISA, we next used a
cell-based bioassay to detect biologically active IFN-α regardless of the
subtype. IFN-α production was quantitated after TLR-9 agonism in
monocytes, mDC, primary pDC, mo-pDC without and with TNF-α
prestimulation (Figure 15G). As expected, primary pDC produced high
amounts of biologically active IFN-α after CpG administration. Un-primed mo-
pDC produced around 10% biologically IFN-α after TLR9 agonism compared
to primary pDC, whereas secretion of bioactive IFN-α was strongly increased
when mo-pDC were pre-stimulated with TNF-α (Figure 15G). Pre-stimulated
mo-pDC produced more than 50% of bioactive IFN-α when compared with
primary pDC. Thus, the data obtained by intracellular staining as well as by
evaluating mRNA expression were reflected satisfactorily by the amount of
secreted bioactive IFN-α.

Results 66
6.1.6 Phenotypical differences between normoxia and hypoxia differentiated
mo-pDC
Inflammation, infection [108] and cancer [109] share the occurrence of
hypoxic episodes. Interestingly, pDC became non-functional when they
infiltrated human head and neck carcinoma tissue [14].
Figure 16. Expression of E2-2, ID2 and E2-2-controlled BDCA2 in normoxia and hypoxia differentiated mo-pDC. (A) Monocytes were differentiated with Flt3-L for 2 days under normoxia and hypoxia (1% O2, 5% CO2) and E2-2 expression was analyzed by Western blotting. Actin served as the loading control. A representative blot of three independent experiments using different donors is shown. (B) Immature mo-pDC from two donors were generated under normoxia and hypoxia for 5 days. E2-2 expression in these cells and monocytes from the same donors was analyzed by Western blotting. A representative blot of three independent experiments using different donors is shown. (C) E2-2 and ID2 mRNA expression of mo-pDC differentiated under normoxia or hypoxia for 2 or 5 days was quantitated by qPCR. Experiments were repeated three times using monocytes of different donors. Asterisk marks statistically significant differences (p < 0.05). (D) Surface expression of BDCA2 was measured by FACS after staining mo-pDC generated under normoxia or hypoxia for 2 or 5 days with an anti-BDCA2 antibody along with isotype controls. Representative FACS traces are shown. Isotype – shaded, day 2 - solid line, day 5 – dotted line. Experiments were repeated four times using monocytes of different donors. Data are the mean flourescence intensity ± SEM.
Besides, E2-2 is downregulated in human neuroblastoma cells exposed to
hypoxia [110]. Therefore, we investigated the impact of hypoxia on E2-2
expression during differentiation of monocytes to mo-pDC. E2-2 expression
was low in both normoxia and hypoxia differentiated mo-pDC, which were
differentiated for two days with Flt3-L (Figure 16A).
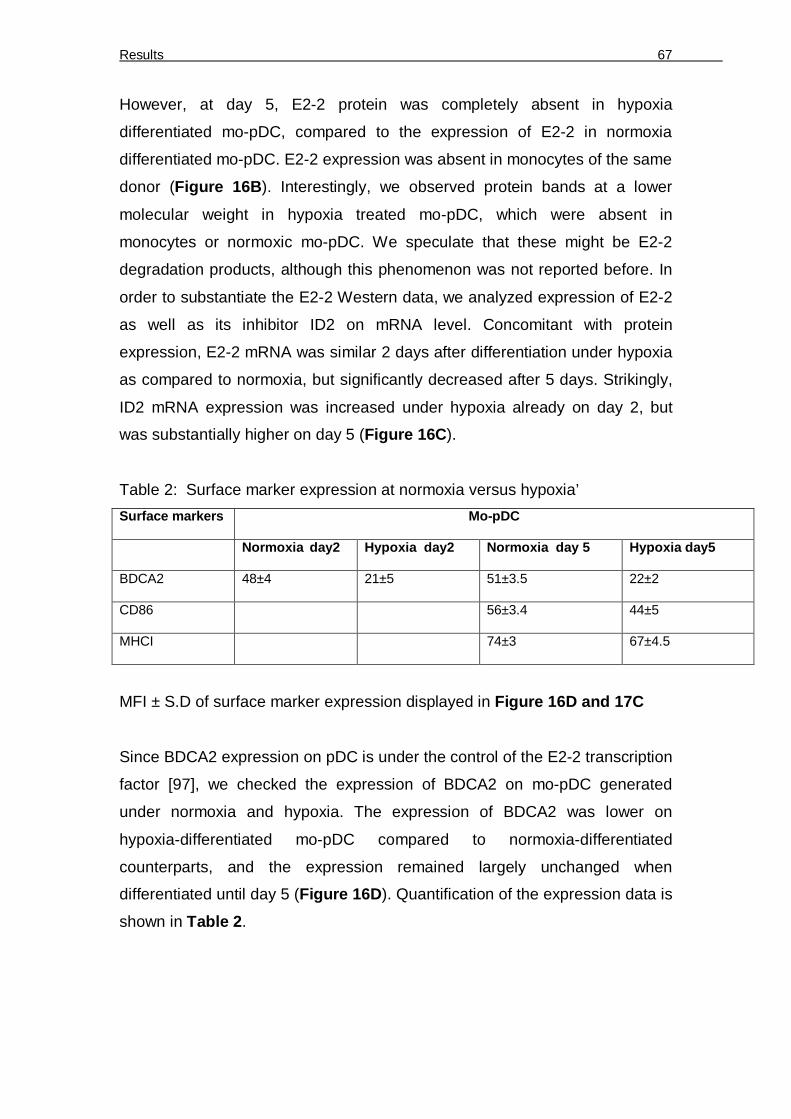
Results 67
However, at day 5, E2-2 protein was completely absent in hypoxia
differentiated mo-pDC, compared to the expression of E2-2 in normoxia
differentiated mo-pDC. E2-2 expression was absent in monocytes of the same
donor (Figure 16B). Interestingly, we observed protein bands at a lower
molecular weight in hypoxia treated mo-pDC, which were absent in
monocytes or normoxic mo-pDC. We speculate that these might be E2-2
degradation products, although this phenomenon was not reported before. In
order to substantiate the E2-2 Western data, we analyzed expression of E2-2
as well as its inhibitor ID2 on mRNA level. Concomitant with protein
expression, E2-2 mRNA was similar 2 days after differentiation under hypoxia
as compared to normoxia, but significantly decreased after 5 days. Strikingly,
ID2 mRNA expression was increased under hypoxia already on day 2, but
was substantially higher on day 5 (Figure 16C).
Table 2: Surface marker expression at normoxia versus hypoxia’ Surface markers Mo-pDC
Normoxia day2 Hypoxia day2 Normoxia day 5 Hypoxia day5
BDCA2 48±4 21±5 51±3.5 22±2
CD86 56±3.4 44±5
MHCI 74±3 67±4.5
MFI ± S.D of surface marker expression displayed in Figure 16D and 17C
Since BDCA2 expression on pDC is under the control of the E2-2 transcription
factor [97], we checked the expression of BDCA2 on mo-pDC generated
under normoxia and hypoxia. The expression of BDCA2 was lower on
hypoxia-differentiated mo-pDC compared to normoxia-differentiated
counterparts, and the expression remained largely unchanged when
differentiated until day 5 (Figure 16D). Quantification of the expression data is
shown in Table 2.
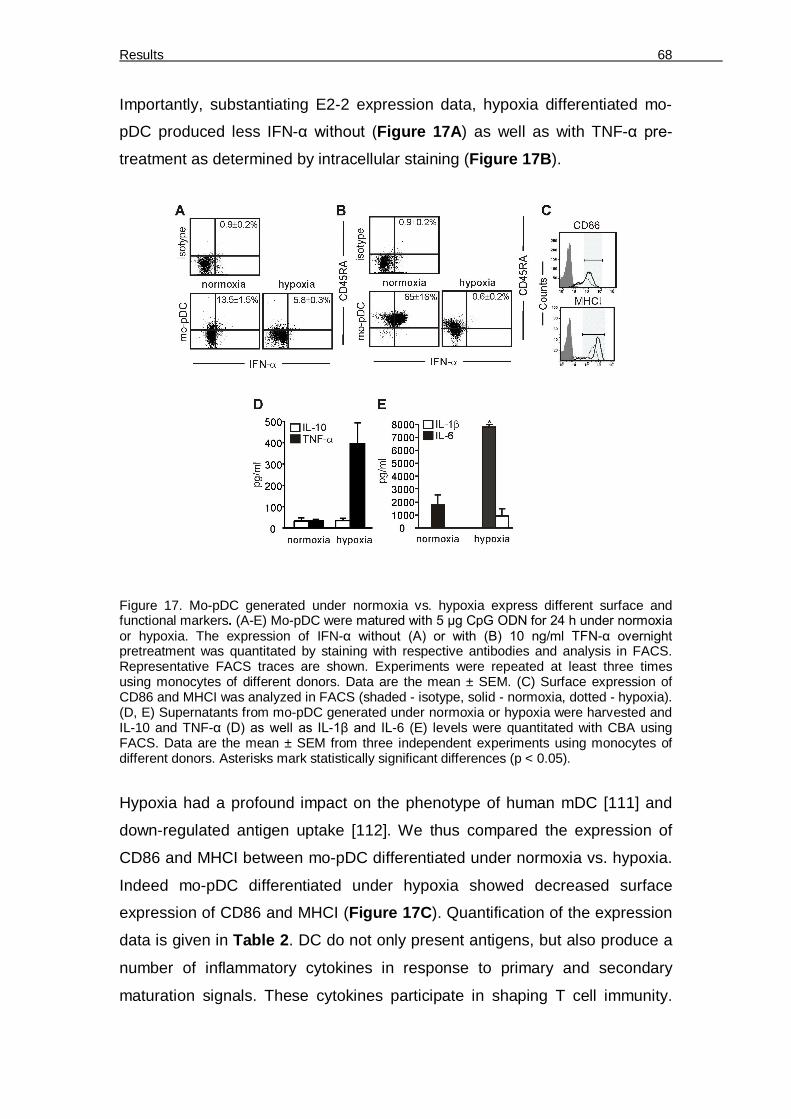
Results 68
Importantly, substantiating E2-2 expression data, hypoxia differentiated mo-
pDC produced less IFN-α without (Figure 17A) as well as with TNF-α pre-
treatment as determined by intracellular staining (Figure 17B).
Figure 17. Mo-pDC generated under normoxia vs. hypoxia express different surface and functional markers. (A-E) Mo-pDC were matured with 5 µg CpG ODN for 24 h under normoxia or hypoxia. The expression of IFN-α without (A) or with (B) 10 ng/ml TFN-α overnight pretreatment was quantitated by staining with respective antibodies and analysis in FACS. Representative FACS traces are shown. Experiments were repeated at least three times using monocytes of different donors. Data are the mean ± SEM. (C) Surface expression of CD86 and MHCI was analyzed in FACS (shaded - isotype, solid - normoxia, dotted - hypoxia). (D, E) Supernatants from mo-pDC generated under normoxia or hypoxia were harvested and IL-10 and TNF-α (D) as well as IL-1β and IL-6 (E) levels were quantitated with CBA using FACS. Data are the mean ± SEM from three independent experiments using monocytes of different donors. Asterisks mark statistically significant differences (p < 0.05).
Hypoxia had a profound impact on the phenotype of human mDC [111] and
down-regulated antigen uptake [112]. We thus compared the expression of
CD86 and MHCI between mo-pDC differentiated under normoxia vs. hypoxia.
Indeed mo-pDC differentiated under hypoxia showed decreased surface
expression of CD86 and MHCI (Figure 17C). Quantification of the expression
data is given in Table 2. DC do not only present antigens, but also produce a
number of inflammatory cytokines in response to primary and secondary
maturation signals. These cytokines participate in shaping T cell immunity.
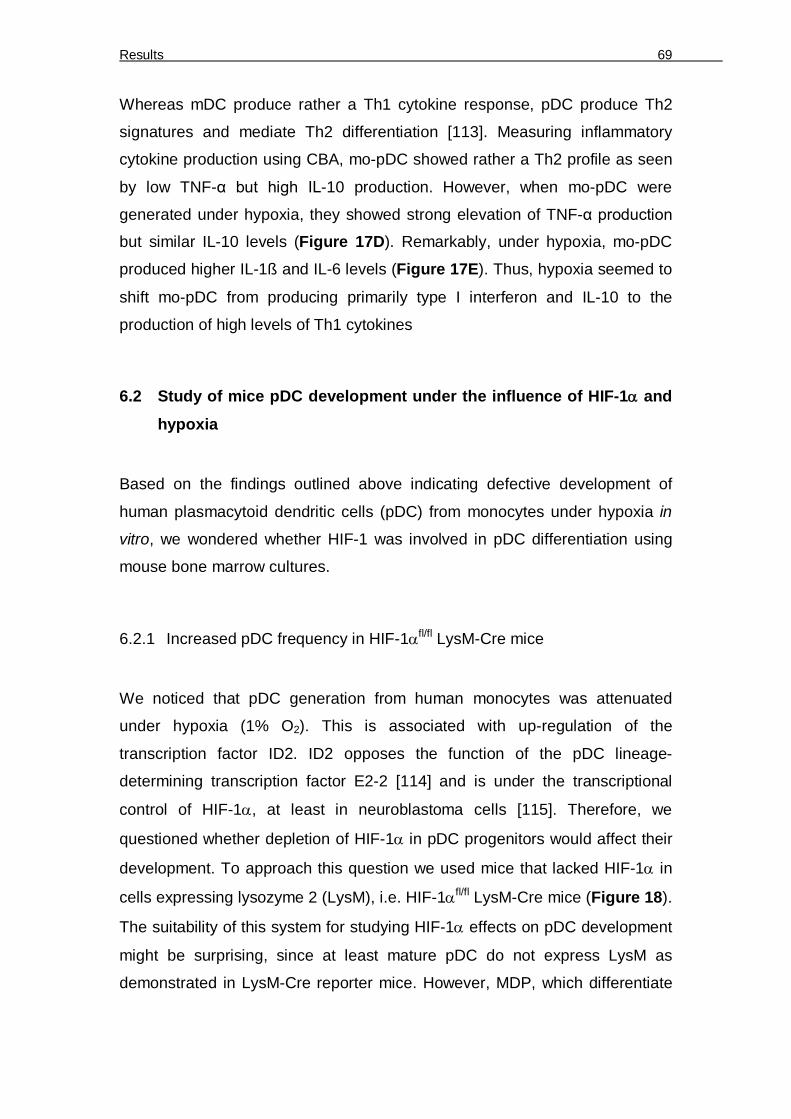
Results 69
Whereas mDC produce rather a Th1 cytokine response, pDC produce Th2
signatures and mediate Th2 differentiation [113]. Measuring inflammatory
cytokine production using CBA, mo-pDC showed rather a Th2 profile as seen
by low TNF-α but high IL-10 production. However, when mo-pDC were
generated under hypoxia, they showed strong elevation of TNF-α production
but similar IL-10 levels (Figure 17D). Remarkably, under hypoxia, mo-pDC
produced higher IL-1ß and IL-6 levels (Figure 17E). Thus, hypoxia seemed to
shift mo-pDC from producing primarily type I interferon and IL-10 to the
production of high levels of Th1 cytokines
6.2 Study of mice pDC development under the influence of HIF-1 and
hypoxia
Based on the findings outlined above indicating defective development of
human plasmacytoid dendritic cells (pDC) from monocytes under hypoxia in
vitro, we wondered whether HIF-1 was involved in pDC differentiation using
mouse bone marrow cultures.
6.2.1 Increased pDC frequency in HIF-1fl/fl LysM-Cre mice
We noticed that pDC generation from human monocytes was attenuated
under hypoxia (1% O2). This is associated with up-regulation of the
transcription factor ID2. ID2 opposes the function of the pDC lineage-
determining transcription factor E2-2 [114] and is under the transcriptional
control of HIF-1, at least in neuroblastoma cells [115]. Therefore, we
questioned whether depletion of HIF-1 in pDC progenitors would affect their
development. To approach this question we used mice that lacked HIF-1 in
cells expressing lysozyme 2 (LysM), i.e. HIF-1fl/fl LysM-Cre mice (Figure 18).
The suitability of this system for studying HIF-1 effects on pDC development
might be surprising, since at least mature pDC do not express LysM as
demonstrated in LysM-Cre reporter mice. However, MDP, which differentiate

Results 70
into CDP and can further develop to pDC, express LysM although at a lower
frequency compared to granulocytes or monocytes [116].
Figure 18: Generation of HIF-1fl/fl LysM-Cre mice. Mice expressing Cre recombinase
downstream of the LysM promoter were crossed with mice genetically engineered to express
HIF-1α flanked by LoxP sites. In the resulting HIF-1fl/fl LysM-Cre mice, in LysM expressing
cells, HIF-1α will be deleted by Cre recombinase upon recognition of the LoxP sites. On the
other hand, in cells that do not express LysM, HIF-1α persists.
6.2.2 Hypoxia/HIF-1 represses pDC differentiation from whole bone marrow
in vitro
We used the HIF-1fl/fl LysM-Cre system to investigate the function of
hypoxia-induced HIF-1 in pDC development in detail. We started with
differentiating whole bone marrow single cell suspensions derived from HIF-
1fl/fl LysM-Cre or control mice to pDC using fms-related tyrosine kinase 3-
ligand (Flt3-L) as described before [117] at high or low O2 supply.
We used SiglecH as the determining marker for bone marrow-derived pDC
[118, 119]. Most cells derived from the Flt3-L cultures were CD11b- CD19-
CD11c+ SiglecH+ pDC that also expressed B220 (CD45RA) and CD317, also
known as bone marrow stromal antigen-2 or tetherin (not shown). Whereas
B220 and CD317 are highly but not exclusively expressed by pDC, SiglecH
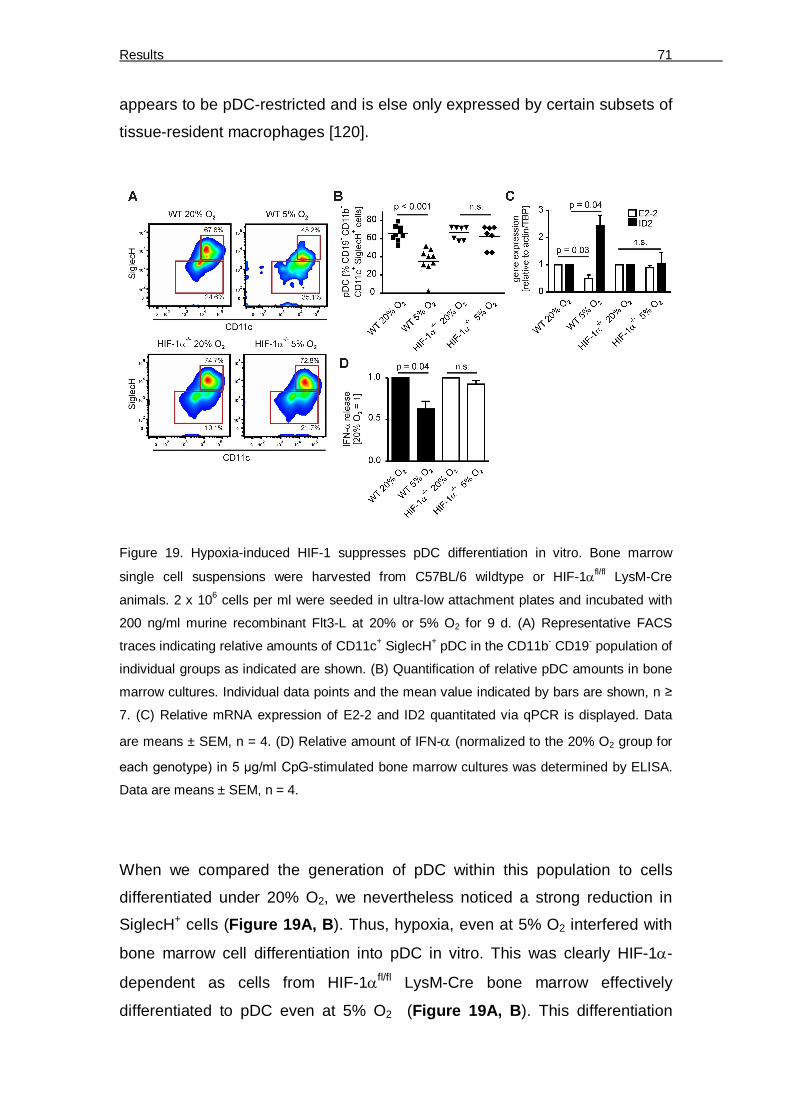
Results 71
appears to be pDC-restricted and is else only expressed by certain subsets of
tissue-resident macrophages [120].
Figure 19. Hypoxia-induced HIF-1 suppresses pDC differentiation in vitro. Bone marrow
single cell suspensions were harvested from C57BL/6 wildtype or HIF-1fl/fl LysM-Cre
animals. 2 x 10⁶ cells per ml were seeded in ultra-low attachment plates and incubated with
200 ng/ml murine recombinant Flt3-L at 20% or 5% O2 for 9 d. (A) Representative FACS
traces indicating relative amounts of CD11c+ SiglecH+ pDC in the CD11b- CD19- population of
individual groups as indicated are shown. (B) Quantification of relative pDC amounts in bone
marrow cultures. Individual data points and the mean value indicated by bars are shown, n ≥
7. (C) Relative mRNA expression of E2-2 and ID2 quantitated via qPCR is displayed. Data
are means ± SEM, n = 4. (D) Relative amount of IFN- (normalized to the 20% O2 group for
each genotype) in 5 µg/ml CpG-stimulated bone marrow cultures was determined by ELISA.
Data are means ± SEM, n = 4.
When we compared the generation of pDC within this population to cells
differentiated under 20% O2, we nevertheless noticed a strong reduction in
SiglecH+ cells (Figure 19A, B). Thus, hypoxia, even at 5% O2 interfered with
bone marrow cell differentiation into pDC in vitro. This was clearly HIF-1-
dependent as cells from HIF-1fl/fl LysM-Cre bone marrow effectively
differentiated to pDC even at 5% O2 (Figure 19A, B). This differentiation

Results 72
pattern was reflected at the transcription factor level. Wildtype bone marrow
cells differentiated for 9 days under 5% O2 expressed significantly lower levels
of E2-2 mRNA and higher levels of ID2 compared to cells differentiated at
20% O2. In contrast, we observed neither a difference in E2-2 nor in ID2
mRNA levels of differentiated HIF-1fl/fl LysM-Cre bone marrow-derived cells
(Figure 19C). Importantly, activation of in vitro-generated pDC using 5 µg/ml
CpGA resulted in diminished production of IFN-α when pDC from wildtype
bone marrow were cultured under 5% O2 but not when pDC from HIF-1fl/fl
LysM-Cre bone marrow were generated under 5% O2 (Figure 19D). Thus,
limited pDC development due to HIF-1 was also demonstrated on a functional
level. These data indicate that differentiation of pDC in vitro under low O2
levels, which corresponds to in situ normoxia in the bone marrow [30], limits
pDC generation in a HIF-1-dependent manner.
6.2.3 Altered immune cell populations in Flt3L-expanded bone marrow
cultures dependent on O2 supply
Next, we asked for the fate of cells that did not differentiate into pDC under
5% O2 since we did not observe significant changes in overall cell numbers
from 20% O2 compared to 5% O2 cultures (not shown). First, when analyzing
the total single cell population, we observed a significant increase in the
CD11bhigh CD115- cell population, which corresponds to cDC or their
precursors [20] in 5% O2 versus 20% O2 cultures (Figure 20A, B).
Furthermore, CD11b- CD115+ cells, which likely are pDC precursors (not
shown) were expanded under 5% O2, whereas CD11b- CD115- pDC were
significantly reduced (Figure 20A, B). These differences were strongly
accentuated when analyzing only the specific Flt3-L expanded single cell
population (Figure 20A, C). Our data imply that differentiation of bone marrow
cells using Flt3-L in vitro gives rise to pDC under high levels of O2, whereas
their numbers are attenuated at low O2 tension. In the latter case, the majority
of pDC remain in a premature state, as reflected by reduced E2-2 expression
(Figure 19C), but some cells seem to differentiate along an alternative route
to cDC corresponding to increased expression of ID2 (Figure 19C).

Results 73
Figure 20. Differentiation of bone marrow under 5% O2 blocks pDC differentiation and
expands cDC. Bone marrow single cell suspensions were harvested from C57BL/6 wildtype.
2 x 10⁶ cells per ml were seeded in ultra-low attachment plates and incubated with 200 ng/ml
murine recombinant Flt3-L at 20% or 5% O2 for 9 d. (A) Representative FACS traces
indicating expression of CD11b and CD115 in either total single cells (right density plots) or
the specific Flt3-L-expanded population (left density plots) are shown. (B) Quantification of
individual cell populations from total single cells based on CD11b and CD115 expression. (C)
Quantification of individual cell populations from the Flt3-L-expanded single cell population
based on CD11b and CD115 expression. Individual data points and the mean value indicated
by bars are shown, n = 4. Asterisks indicate significant differences between groups, * = p <
0.05, ** = p < 0.01, *** = p < 0.01.
Taken together, our data indicate that HIF-1 limits murine pDC differentiation
from precursors in vitro. Low oxygen levels in the bone marrow might be an
environmental explanation why pDC numbers in the body are low compared
to other immune cell populations.

Results 74
6.3 Generation of regulatory T cells by IL-27 secreting DC under the impact of apoptotic cell-derived factors
We aimed to investigate how priming of DC by factors/exosomes shed by
dying versus living tumour cells affects their ability to initiate tumour cell-
specific cytotoxic T cell responses. Conditioned media of apoptotic, necrotic,
or viable MCF7 cells (ACM, NCM, VCM) were incubated with primary
monocyte-derived human DC at a ratio of one tumour cell/DC. Higher ratios of
tumour cells/DC induced cell death in DC, especially when using NCM
(Figure 21A).
Figure 21. Basal DC phenotype upon activation with tumour cell supernatants. (A), Human
monocyte-derived DC were incubated with supernatants of viable (VCM), apoptotic (ACM) or
necrotic (NCM) MCF-7 cells at different ratios as indicated (1:1 = supernatant of 2 x 10⁵ MCF-
7 cells added to 2 x 10⁵ DC) for 16 h, followed by staining with Annexin-V and propidium
iodide (PI). Representative density plots of at least five independent experiments indicate size
(FSC) and granularity (SSC) of the individual populations as well as the amount of dying cells
(Annexin V versus PI). (B) Human monocyte-derived DC were controls or incubated with
supernatants of viable (VCM), apoptotic (ACM) or necrotic (NCM) MCF-7 cells at a ratio of 1:1
for 16 h followed by FACS-analysis of CD86, HLA-DR, HLA-ABC, CD80, CD83 and CD40
surface expression. Representative histograms of at least four independent experiments are
displayed.

Results 75
This might be a mechanism of suppressing DC-dependent immunity by highly
abundant dying tumour cells occurring e.g. after chemo/radiotherapy. Tumour
cell supernatant-primed or unstimulated DC were co-cultured with IL-2-
enriched autologous PBMC for 3 d (Figure 22).
6.3.1 Priming with apoptotic tumour cell supernatants suppresses DC-
dependent tumour cell killing
IL-2 enriched PBMCs were mainly T cells, lacking significant amounts of
mononuclear phagocytes, B cells or NK cells (< 1%) (not shown).
Lymphocytes derived from these co-cultures were then added to living
CellTracker Blue-stained MCF-7 cells for 4 h at different ratios and MCF-
7/lymphocyte co-cultures were assessed for tumour cell death.
Figure 22. Experimental outline. Human monocyte-derived DC were controls or incubated
with supernatants of viable (VCM), apoptotic (ACM) or necrotic (NCM) MCF-7 cells at a ratio
of 1:1 (Supernatants of 2 x 10⁵ MCF-7 added to 2 x 10⁵ DC) for 16 h. Subsequently,
supernatants were removed by washing and autologous T cell-enriched PBMC were added at
a ratio of 10:1 (Tcells/DC) and cultured for another 3 d. The resulting polarized T cells were
then co-cultured with living tumour cells for 4 h to determine cytotoxicity as described under
Materials and Methods. Experimental interventions as outlined in the manuscript are indicated
as dotted arrows.
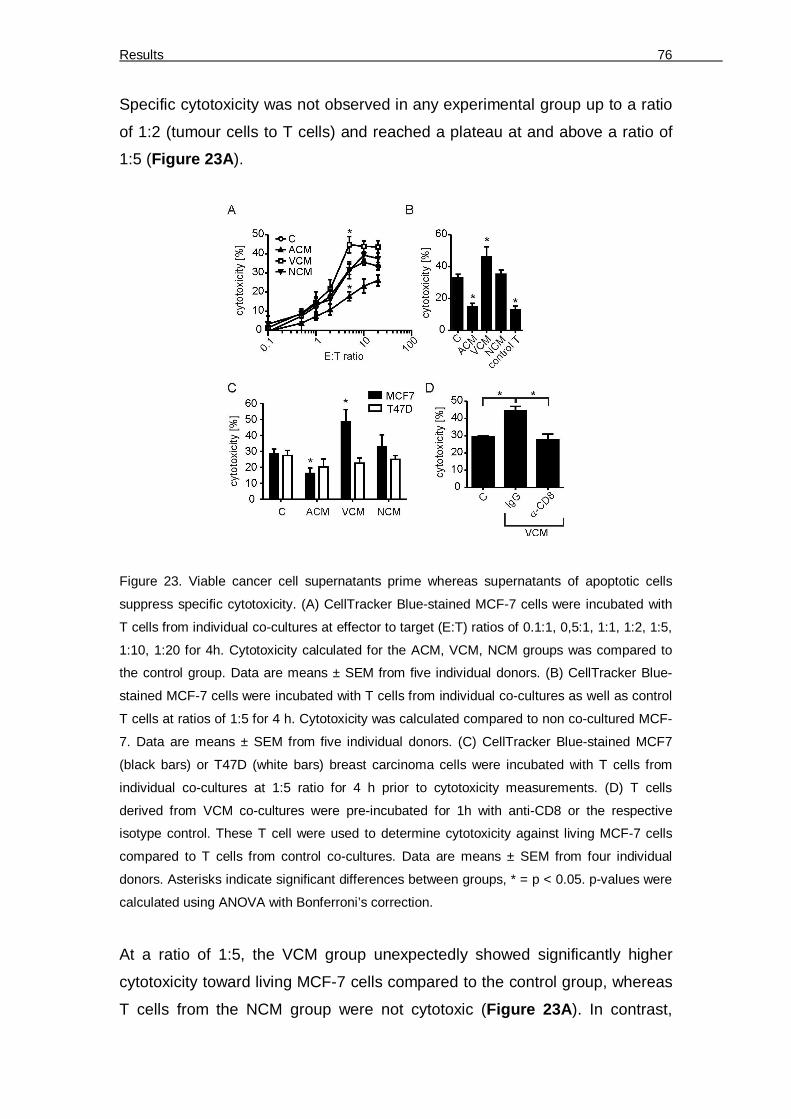
Results 76
Specific cytotoxicity was not observed in any experimental group up to a ratio
of 1:2 (tumour cells to T cells) and reached a plateau at and above a ratio of
1:5 (Figure 23A).
Figure 23. Viable cancer cell supernatants prime whereas supernatants of apoptotic cells
suppress specific cytotoxicity. (A) CellTracker Blue-stained MCF-7 cells were incubated with
T cells from individual co-cultures at effector to target (E:T) ratios of 0.1:1, 0,5:1, 1:1, 1:2, 1:5,
1:10, 1:20 for 4h. Cytotoxicity calculated for the ACM, VCM, NCM groups was compared to
the control group. Data are means ± SEM from five individual donors. (B) CellTracker Blue-
stained MCF-7 cells were incubated with T cells from individual co-cultures as well as control
T cells at ratios of 1:5 for 4 h. Cytotoxicity was calculated compared to non co-cultured MCF-
7. Data are means ± SEM from five individual donors. (C) CellTracker Blue-stained MCF7
(black bars) or T47D (white bars) breast carcinoma cells were incubated with T cells from
individual co-cultures at 1:5 ratio for 4 h prior to cytotoxicity measurements. (D) T cells
derived from VCM co-cultures were pre-incubated for 1h with anti-CD8 or the respective
isotype control. These T cell were used to determine cytotoxicity against living MCF-7 cells
compared to T cells from control co-cultures. Data are means ± SEM from four individual
donors. Asterisks indicate significant differences between groups, * = p < 0.05. p-values were
calculated using ANOVA with Bonferroni’s correction.
At a ratio of 1:5, the VCM group unexpectedly showed significantly higher
cytotoxicity toward living MCF-7 cells compared to the control group, whereas
T cells from the NCM group were not cytotoxic (Figure 23A). In contrast,

Results 77
cytotoxicity towards living MCF-7 cells was reduced below controls when T
cells from the ACM group were used. Cytotoxicity in this group was
comparable to the basal cytotoxicity exhibited by IL-2 activated T cells without
DC co-culture (Figure 23B). Importantly, VCM-induced cytotoxicity was cell-
specific, since alterations in cytotoxicity were not observed when lymphocytes
from MCF-7 supernatant-primed DC co-cultures where added to T47D cells
(Figure 23C). In addition, CD8 depletion experiments suggested that CD8+ T
cells were required for VCM-induced cytotoxicity in our system (Figure 23D).
6.3.2 Accumulation of CD39/CD69-expressing FoxP3+ Treg in ACM-primed
co-cultures
Figure 24. Relative amounts of T cell subsets and FoxP3-expressing Tregs. A-C, The profile
of human T cell subpopulations from 3 d co-cultures with unprimed ACM-, VCM- or NCM-
primed human monocyte-derived autologous DC were quantified using polychromatic flow
cytometry. (A) Representative FACS traces for each co-culture setting are displayed. CD3+ T
cells were sub-classed depending on expression of CD4 and CD8. CD4+ T cells were
analyzed for expression CD25+ versus FoxP3+. CD4+CD25+FoxP3+ cells were further sub-
divided based on expression of CD39 and CD69. (B) Graphs display statistical quantitation of
relative CD4 versus CD8 expression by CD3+ T cells. Data displayed as mean ± SEM from

Results 78
five individual donors. (C) Statistical quantification of FoxP3-expressing CD4+CD25+ T cells
(Treg). Individual data points and the mean of seven individual donors are shown.
Since ACM-priming of DC suppressed cytotoxicity compared to the VCM- or
NCM-primed groups, we determined whether alterations in the T cell
populations occurred and if such alterations accounted for suppression of
tumour cell killing. We analyzed the T cell profile in the co-cultures using
polychromatic flow cytometry (Figure 24A). Regarding whole T cell numbers
or basal T cell subsets, CD3+ T cell levels (not shown) and the ratio of CD4+
versus CD8+ T cells (Figure 24B) remained unchanged throughout the
experimental groups. Next, we checked for a possible expansion of Treg,
which were detected by intracellular staining of FoxP3 in CD4+CD25+ T cells
(Figure 24A). The relative amount of FoxP3+ cells in the different
experimental groups was unchanged (Figure 24C).
However, a different picture emerged when we investigated markers of Treg
function. We stained Treg for expression of CD39 and CD69 (Figure 24A).
The ectonucleotidase CD39 is expressed on naturally occurring FoxP3+ Treg
[121], while the lymphocyte activation marker CD69 was shown to be
expressed by Treg of cervical cancer patients [122].
Figure 25. Apoptotic cell supernatants induce CD39 and CD69-expressing Treg. (A-C)
Statistical quantification of CD39+ CD69- Treg (AD) CD39- CD69+ Treg (B) CD39+ CD69+
Treg (C). Individual data points and the mean of six individual donors are shown. Asterisks
indicate significant differences between groups, * = p < 0.05, ** =p < 0.01. p-values were
calculated using ANOVA with Bonferroni’s correction.

Results 79
Whereas the expression of CD39 by Treg was not significantly different
between the co-culture set-ups (Figure 25A), there were significant
differences with regard to CD69 expression. CD69 was upregulated on Treg
selectively in the ACM group (Figure 25B), which was most significant in the
population co-expressing CD39 (Figure 25C).
This regulation pattern was Treg-specific, since neither CD39 nor CD69 were
significantly upregulated in the total CD4+CD25+ population. CD39 was
usually not expressed by CD8+ T cells. However, in approximately 20% of all
donors, a small subpopulation of CD8+ T cells expressed CD39, which was
selectively elevated in the ACM group, whereas CD69 expression was
unaltered (not shown). Conclusively, ACM-primed, but not VCM or NCM-
primed DC significantly induce surface CD69 expression in co-cultured CD39+
Treg.
Next, we asked if the accumulation of CD69-expressing Treg in the ACM
group (Figure 25B, 25C) contributed to reduced MCF-7 cell killing (Figure 23A). In a first approach, we depleted Treg from unprimed, ACM-primed or
VCM-primed co-cultures using commercial kits, before subjecting the
remaining cells to the cytotoxicity assay.
Figure 26. Purity of isolated CD4+CD25+ Treg. Left panel shows representative FACS trace
indicating Foxp3 expression by CD4+CD25+ cells isolated from T cell co-cultures by magnetic
bead sorting. Right panel displays co-expression of CD39 in subpopulations of isolated
CD4+CD25+ T cells. T cell isolation was routinely controlled. Representative histograms of at
least 6 independent experiments are displayed.

Results 80
Of the isolated CD4+ CD25+ T cells, 40% expressed intracellular FoxP3,
largely co-expressed CD39, and thus likely represent functional Treg (Figure 26).
Figure 27. Treg confer ACM-induced suppression of cytotoxicity. (A) Treg were isolated from
2 d co-cultures of ACM- or VCM-primed human monocyte-derived autologous DC using
automated magnetic bead-sorting. Residual T cells were added back to co-cultures for 24 h.
MCF7 cells were then incubated with T cells from the ACM or VCM groups with or without
(Dpl) Treg as well as controls and cytotoxicity was analyzed. Data are means ± SEM from five
individual donors. (B) Treg were isolated from 2 d co-cultures of ACM- or VCM-primed human
monocyte-derived autologous DC using automated magnetic bead-sorting. Treg from ACM
groups were then mixed with Treg-depleted T cells from VCM groups and vice versa and
added back to the co-cultures for 24 h. MCF-7 cells were subsequently incubated with T cells
from the Treg exchange groups (Ex) compared to non-exchanged groups and the control. T
cells alone cultured without DC are indicated as control T. Data are means ± SEM from six
individual donors. Data are means ± SEM from four individual donors. Asterisks indicate
significant differences between groups, * = p < 0.05, ** = p < 0.01, *** = p < 0.001. p-values
were calculated using ANOVA with Bonferroni’s correction.
Interestingly, Treg-depleted lymphocytes from the ACM group were
significantly more cytotoxic compared to the complete lymphocyte fraction,
whereas Treg-depletion from the VCM-primed co-culture did not affect the
enhanced cytotoxicity observed in the VCM group (Figure 27A).
Next, we asked whether the Treg-dependent suppression of cytotoxicity in the
ACM group might be transferable. We isolated Treg from ACM-primed or
VCM-primed co-cultures on day 2 and added the Treg from the ACM group to
the Treg-depleted lymphocytes of the VCM group and vice versa. After
another 24 h of co-incubation, these mixed lymphocyte populations were used

Results 81
in the cytotoxicity assay. Indeed, Treg from the ACM group significantly
suppressed cytotoxicity of Treg-depleted lymphocytes from the VCM group.
On the other hand Treg from the VCM group were unable to suppress
cytotoxicity in the ACM group (Figure 27B). Thus, ACM-priming provided
FoxP3+ T cells with the ability to suppress cytotoxicity, which was correlated to
expression of CD39 and CD69. Depletion of these cells restored cytotoxicity
to a level comparable to the VCM-primed group.
Figure 28. CD39 depletion restores ACM-induced suppression of cytotoxicity. (A, B) CD39+
cells were depleted from IL-2 enriched PBMC using anti-FITC microbeads after labeling with
CD39-FITC antibody by automated magnetic bead-sorting. CD39-depleted (CD39 Dpl) T cells
were added to co-cultures in the same ratio as unmodified T cells. (A) Representative FACS
traces displaying the relative amount of CD39+CD69+ cells in CD4+CD25+FoxP3+ T cells in
ACM co-cultures of CD39-depleted and unmodified T cells. (B) MCF7 cells were incubated
with T cells from the VCM group, the ACM group with or without CD39+ T cell depletion (Dpl)
as well as controls and cytotoxicity was analyzed. Data are means ± SEM from four individual
donors. Asterisks indicate significant differences between groups, * = p < 0.05, ** = p < 0.01,
*** = p < 0.001. p-values were calculated using ANOVA with Bonferroni’s correction.
We explored the relationship of CD39 and CD69-expressing Treg with
suppression of cytotoxicity by further depleting CD39+ cells from IL-2-enriched
lymphocytes before adding them to DC co-cultures. T cells from these co-
cultures displayed lower levels of Treg and completely lacked the CD39+
subpopulation, indicating that CD39+ Treg upregulate CD69 expression in

Results 82
ACM co-cultures, whereas upregulation of CD39 by CD69+ cells could be
ruled out (Figure 28A). Importantly, depletion of CD39+ T cells restored
cytotoxicity in the ACM group as observed when depleting total CD25+ cells
(Figure 28B).
6.3.3 S1P in ACM confers suppression of cytotoxicity by activating S1PR4 on
DC
Next, we performed experiments to interfere with the immunosuppressive
properties of ACM in order to determine whether CD69 expression on FoxP3+
T cells accounted for reduced cytotoxicity.
Figure 29. ACM-dependent suppression of cytotoxicity functions through S1P receptors. (A-D)
T cells were co-cultured with control or ACM-primed autologous DC with or without the
S1PR2/4 antagonist JTE-013 or the S1PR1/3 antagonist VPC23019. (A) Cytotoxicity induced
by T cells from individual co-cultures towards living MCF-7 cells. Data are means ± SEM from
six individual donors. (B) Representative FACS traces of CD39 and CD69 expression by Treg
from the individual co-cultures. C,D, Statistical evaluation of CD39+ CD69+ Treg (C) or CD39-
CD69+ Treg (D). Individual data points and the mean of six individual donors are shown.
Asterisks indicate significant differences between groups, * = p < 0.05, **.= p < 0.01, *** = p <
0.001. p-values were calculated using ANOVA with Bonferroni’s correction.

Results 83
We asked for the factor(s) in ACM inducing DC-dependent suppression of
cytotoxicity. Among the immunomodulatory factors secreted by AC is the lipid
mediator S1P [67]. which was present in ACM (~ 10 nM, determined routinely
[123]. S1P couples to five specific receptors (S1PR), with human DC
expressing S1PR1-4.
Pharmacological inhibition of S1PRs during ACM-priming of human DC was
used to test an impact of AC-derived S1P on DC-dependent T cell activation.
JTE-013, a partial inhibitor for S1PR2 (IC50 1.5 µM) and a full inhibitor of
S1PR4 (IC50 4.5 µM) [124] significantly prevented ACM-induced suppression
of cytotoxicity when used at high concentrations (15 µM), whereas the
S1PR1/3 inhibitor VPC23019 (1µM) did not (Figure 29A).
Figure 30. S1PR4 on DC conveys ACM-dependent suppression of cytotoxicity. (A-C) T cells
were co-cultured with control or ACM-primed autologous DC with or without the S1PR4
antagonists CYM74 or CYM58 (A) Cytotoxicity induced by T cells from individual co-cultures
towards living MCF-7 cells. Data are means ± SEM from four individual donors. (B)
Representative FACS traces of CD39 and CD69 expression by Treg from the individual co-
cultures. (C) Statistical evaluation of CD39+ CD69+ Treg from individual co-cultures. Individual
data points and the mean of four individual donors are shown. Asterisks indicate significant
differences between groups, * = p < 0.05, **.= p < 0.01, *** = p < 0.001. p-values were
calculated using ANOVA with Bonferroni’s correction.
Diminishing cytotoxicity by the S1PR2/4 inhibitor JTE-013 correlated with a
significant reduction of the CD39+CD69+ Treg population, whereas the relative
proportion of CD69+CD39- Treg population was unchanged (Figure 29B-D).
Results 84
To substantiate these findings and to explicitly identify the S1PR subtype we
used the recently described highly specific S1PR4 antagonists CYM50374
and CYM50358 (200 nM each) [84]. Both substances reversed suppression of
cytotoxicity induced by ACM priming (Figure 30A) and decreased the
expansion of CD39+CD69+ Treg (Figure 30B, 30C).
Figure 31. Addition of S1P to VCM mimics ACM (A,B) T cells were co-cultured with control,
ACM- or NCM-primed autologous DC with or without adding 1 µM S1P (A), Cytotoxicity
induced by T cells from individual co-cultures towards living MCF-7 cells. Data are means ±
SEM from six individual donors. (B), Statistical evaluation of CD39+ CD69+ Treg from
individual co-cultures. Individual data points and the mean of four individual donors are
shown. Asterisks indicate significant differences between groups, * = p < 0.05, **.= p < 0.01,
*** = p < 0.001. p-values were calculated using ANOVA with Bonferroni’s correction.
Moreover, supplying S1P (1 µM) during VCM-priming of DC suppressed the
VCM-induced cytotoxicity (Figure 31A) and increased the amount of
CD39+CD69+ Treg (Figure 31B). These findings indicate that S1PR4
activation by S1P in ACM enabled DC to induce CD69 expression on Treg,
correlating to suppressed cytotoxicity.
6.3.4 ACM-primed DC secrete IL-27 to activate suppressive Treg
Apparently tumour-associated DC exist in different functional states
depending on the microenvironment they are exposed to (i.e. tumour mass
versus TDLN) [59]. We asked which parameters of DC functionality were
altered by ACM. For maturation markers, each tumour supernatant slightly
induced HLA-DR expression on DC as compared to the control group. CD80

Results 85
expression remained unchanged. CD83 expression was induced slightly only
in the ACM group. HLA-ABC expression remained largely unchanged, except
for a reduction with NCM, whereas CD86 and CD40 expression were strongly
induced with all conditioned media (Figure 21B). Conclusively,
immunosuppression by ACM-priming was not dependent on altered
maturation.
Apart from maturation, functional markers of tolerogenic DC include proteins
such as IDO. IDO is an intracellular enzyme involved in tryptophan
metabolism along the kynurenine pathway. IDO has been implicated in
tolerance induction mediated through depleting tryptophan, which halts T cell
proliferation and/or by accumulation of 3-hydroxykynurenine or 3-
hydoxyanthranilic acid, which is toxic to lymphocytes [125]. IDO is expressed
by DC interacting with AC [126]. We saw a marked upregulation of IDO
protein expression in DC treated with ACM (Figure 32A).
Figure 32. ACM-induced IDO expression and the effect of IDO inhibition on ACM-induced
suppression of cytotoxicity. (A) IDO protein expression in untreated DC (C), or in ACM-
stimulated DC (ACM) from the same donor was analyzed by Western blotting. Actin serves as
a loading control. Representative blot of three independent experiments using different
donors is shown. (B) DC were unprimed or treated with or treated with VCM, NCM or ACM
with or without pre-incubation with 1mM of the IDO inhibitors D-1MT (dextro-1-methyl
tryptophan) or L-1MT (levo-1-methyl tryptophan) for 2 h. These DC were co-cultured with
autologous T cells for 3 d. Cytotoxicity of resulting T cells towards living MCF-7 cells is
shown. Cytotoxicity was calculated compared to non co-cultured MCF-7. Data are means ±
SEM, n = 5. Individual data points and the mean of five individual donors are shown. Asterisks

Results 86
indicate significant differences between groups, * = p < 0.05, ** = p < 0.01, *** = p < 0.001. p-
values were calculated using ANOVA with Bonferroni’s correction.
Thus, we asked whether this enzyme had any impact on the observed
immunosuppression in the ACM co-cultures. We found that neither inhibition
of IDO1 using D-1MT nor IDO2 with L-1MT was able to significantly restore
cytotoxicity compared to the VCM group (Figure 32B). However, in some
experiments L-1MT had minor efficiency in elevating cytotoxicity.
Figure 33. Influence of ACM on cytokine induction. (A-C) Human monocyte-derived DC were
controls or incubated with VCM, NCM or ACM with or without the addition of JTE-013 (15 µM)
or VPC23019 (1µ M) for 16 h. (A) Secreted cytokines were quantified using Human
inflammatory cytokine Cytometric Bead Arrays. Quantification of IL-6, TNF-α, IL-12 and IL-10
in DC supernatants is shown. Individual data points and the mean of five individual donors are
shown. (B) Relative mRNA expression of ebi3, p28 and p35 quantitated via qPCR is
displayed. Data are means ± SEM from four individual donors. (C) ELISA quantification of IL-
27 protein secretion by DC from the individual groups is shown. Individual data points and the
mean of five individual donors are shown. Asterisks indicate significant differences between
groups, * = p < 0.05, ** = p < 0.01, *** = p < 0.001. p-values were calculated using ANOVA
with Bonferroni’s correction.
Next we measured the release of inflammatory cytokines by Cytometric Bead
Arrays using flow cytometry 16 h after stimulation of DC with tumour cell

Results 87
supernatants, including ACM stimulation in the presence of S1PR antagonists
to detect meaningful regulation patterns. We did not observe release of
significant amounts of IL-12, although there was a tendency towards
enhanced IL-12 secretion by VCM-primed DC versus their ACM-primed
counterparts (Figure 33A).
IL-6 showed a trend towards enhanced production in the VCM group, which
was significant for TNF-. However, compared to ACM, secretion of these
cytokines was enhanced when using VPC23019, but not JTE-013, which did
not correlate with changes in cytotoxicity. Release of the anti-inflammatory
cytokine IL-10 followed a meaningful regulation pattern, since it was enhanced
with ACM treatment as compared to all other treatments except for the
ACM+VPC23019 group (Figure 33A). However, release of IL-10 was in the
low pg/ml range, largely restricting its potential impact in the co-culture setting.
Searching for other candidates, we recognized that among cytokines that
shape T cell-mediated immunity IL-12 family members play a central role.
Despite having structurally similar subunits or even sharing identical subunits,
these cytokines may enhance generation of Th1, Th17 or Treg [127].
For instance, the protein encoded by Epstein-Barr virus induced gene 3 (ebi3)
is a common subunit of IL-35 and IL-27, both of which are recently emerging
cytokines implicated in T cell biology. Analyzing mRNA expression in human
DC in analogy to secreted cytokines as mentioned above, we noticed that
ebi3 mRNA was upregulated upon incubation of DC with ACM after 16 h. This
was S1PR2/4-dependent as determined by using JTE-013 or VPC23019
along with ACM (Figure 33B). Since expression of p28 and p35, the
complementary subunits for IL-27 or IL-35 respectively, were unchanged with
ACM treatment (Figure 33B); we quantified secretion of ebi3 subunit
containing cytokines using commercial ELISA kits. While detecting IL-35 was
unsuccessful, IL-27 was significantly upregulated in ACM-treated DC
compared to controls or VCM-primed DC. This effect was completely
abolished when inhibiting the S1PR2/4 (Figure 33C).

Results 88
Figure 34. ACM induces IL-27 in DC in a S1PR4-dependent manner to generate Treg. (A-C)
T cells were co-cultured with control, VCM- or ACM-primed autologous DC with or without the
addition of an IL-27-neutralizing antibody (-IL27) or the isotype control (IgG). (A) Cytotoxicity
induced by T cells from individual co-cultures towards living MCF-7 cells. Data are means ±
SEM from seven individual donors. (B) Representative FACS traces of CD39 and CD69
expression by Treg from the individual co-cultures. (C) Statistical quantification of CD39+
CD69+ Treg. Individual data points and the mean of seven individual donors are shown, n = 7.
Asterisks indicate significant differences between groups, * = p < 0.05, ** = p < 0.01, *** = p <
0.001. p-values were calculated using ANOVA with Bonferroni’s correction.
To validate the role of IL-27 released by DC in generating suppressive Treg,
we blocked its function by adding a specific IL-27-neutralizing antibody versus
a non-specific isotype control (each 1 µg/ml) to DC before adding autologous
T cells. Blocking IL-27 potently reduced ACM-induced suppression of
cytotoxicity as compared to the isotype control (Figure 34A), which again
correlated with attenuated ACM-induced CD69 expression in CD39+ Treg
(Figure 34B, 34C).
We wondered whether induction of cell death using immunogenic drugs would
deliver comparable results with regard to IL-27-dependent CD39+ CD69+ Treg
expansion. When we compared effects of supernatants of oxaliplatin-treated
MCF-7 cells (OXA-ACM) with staurosporine-treated cells (STS-ACM) on DC,
we noticed significantly lower ebi-3 expression in OXA-ACM-treated DC
(Figure 35A). Correlating to that, we observed reduced CD69+CD39+ Treg in
OXA-ACM co-cultures compared to STS-ACM co-cultures (Figure 35B).

Results 89
Figure 35. OXA-ACM exhibits higher cytotoxicity compared to STS-ACM. (A-C) MCF-7 cells
were subjected to 0.5 µg/ml staurosporine (STS) or 30 µM oxaliplatin (OXA) to induce cell
death and supernatants were harvested. (A) Expression of ebi3 mRNA in DC treated with
STS-ACM or OXA-ACM compared to control DC is displayed. Data are means ± SEM from
four individual donors. (B) T cells were co-cultured with control, VCM-, or STS-ACM- or OXA-
ACM-primed autologous DC. Representative FACS traces of CD39 and CD69 expression by
Treg from the individual co-cultures are shown. (C) Cytotoxicity induced by T cells from
individual co-cultures towards living MCF-7 cells. Data are means ± SEM from five individual
donors. Asterisks indicate significant differences between groups, * = p < 0.05, ** = p < 0.01,
*** = p < 0.001. p-values were calculated using ANOVA with Bonferroni’s correction.
This difference in the Treg population was again reflected by the cytotoxic
potential of co-cultured T cells as T cells from the OXA-ACM group were
significantly more cytotoxic compared to T cells from the STS-ACM group
(Figure 35C). Hence, also in our hands oxaliplatin induced immunogenic cell
death, which correlated with reduced ebi-3 expression and thus, likely IL-27
production, as well as reduced CD69 expression on CD39+ Treg.
6.3.5 Suppression of cytotoxicity is reduced by interference with adenosine
generation
We went on to identify a mechanism of how Treg suppressed cytotoxicity,
which likely required functional CD8+ T cells. Analyzing the contents of the T
cell-derived cytokines IFN-γ, IL-10, IL-4, IL-17, IL-2 from co-cultures after day
3, did not reveal any regulation patterns (not shown). Immunosupression by
Treg can be mediated by various mechanisms including production of effector
cytokines such as TGF-β and IL-10 [128].

Results 90
Figure 36. IL-10 and TGF-β are not involved in suppressing cytotoxicity. (A) Magnetic bead-
isolated Treg from the individual co-cultures at day 3 were analyzed for relative IL-10 mRNA
expression via qPCR. Data are means ± SEM from five individual donors. (B) TGF-β
expression in CD4+CD25+FoxP3+ Treg from whole individual co-cultures was determined via
intracellular staining and polychromatic flow cytometry. Statistical evaluation TGF-β-
dependent mean fluorescence intensity (MFI) is displayed. Data are means ± SEM from four
individual donors. (C) T cells were co-cultured with control, VCM- or ACM-primed autologous
DC with or without the addition of a TGF-ß-neutralizing antibody (-TGF-ß) or the isotype
control (IgG). Cytotoxicity induced by T cells from individual co-cultures towards living MCF-7
cells was determined. Data are means ± SEM from five individual donors. Asterisks indicate
significant differences between groups, * = p < 0.05, ** =p < 0.01. p-values were calculated
using ANOVA with Bonferroni’s correction.
We checked the expression of these cytokines specifically in Treg using two
different approaches. IL-10 expression was determined on mRNA level after
isolation of Treg from the different treatment groups as mentioned above,
whereas TGF-β was quantified by intracellular staining using flow cytometry.
Unexpectedly, neither IL-10 (Figure 36A) nor TGF-β expression (Figure 36B)
was significantly altered in Treg upon ACM-stimulation. In addition,
neutralizing TGF-ß in ACM co-cultures with a specific antibody did not restore
cytotoxicity (Figure 36C), thus ruling out TGF-ß as a candidate for
immunosuppression in this set-up.

Results 91
Figure 37. Relative expression of ectonucleotidases CD39 or CD73 by T cells. (A) Relative
FACS traces indicating CD39-expression by CD8- T cells from control co-cultures. Gating on
these cells and evaluation of FoxP3 versus CD73 expression reveals that CD39 is selectively
expressed by CD4+ Treg. (B) Relative FACS traces indicating CD73-expression by CD8+ T
cells from control co-cultures. Gating on these cells and evaluation of FoxP3 versus CD39
expression reveals that CD73 is selectively expressed by CD8+ FoxP3- T cells. (C)
Quantification of CD73 expression by CD8+ T cells from individual co-cultures as indicated
analyzed by flow cytometry is displayed. Individual data points and the mean of seven
individual donors are shown. Asterisks indicate significant differences between groups, * = p <
0.05, ** =p < 0.01. p-values were calculated using ANOVA with Bonferroni’s correction.
Another molecule known for its immunosuppressive function is the purine
nucleotide adenosine. Extracellular adenosine inhibits various T cell functions
among them proliferation and/or priming of CD8+ T cells [129]. We saw the
involvement of CD8 T cells in VCM-induced cytotoxicity (Figure 23D).
Adenosine is produced by the sequential breakdown of ATP by e.g. the
ectonucleotidases CD39 and CD73.
Previous reports indicated that CD39 is expressed by human Treg, whereas
CD73 might not be co-expressed by these cells [130], which we confirmed in
our system. Whereas CD39 was mainly expressed by CD4+ Treg, which did
not express CD73 (Figure 37A), CD73 was expressed by CD8+ cells (Figure 37B). We did not observe alterations in CD73 expression by CD8+ T cells
upon priming with either ACM or VCM (Figure 37C).
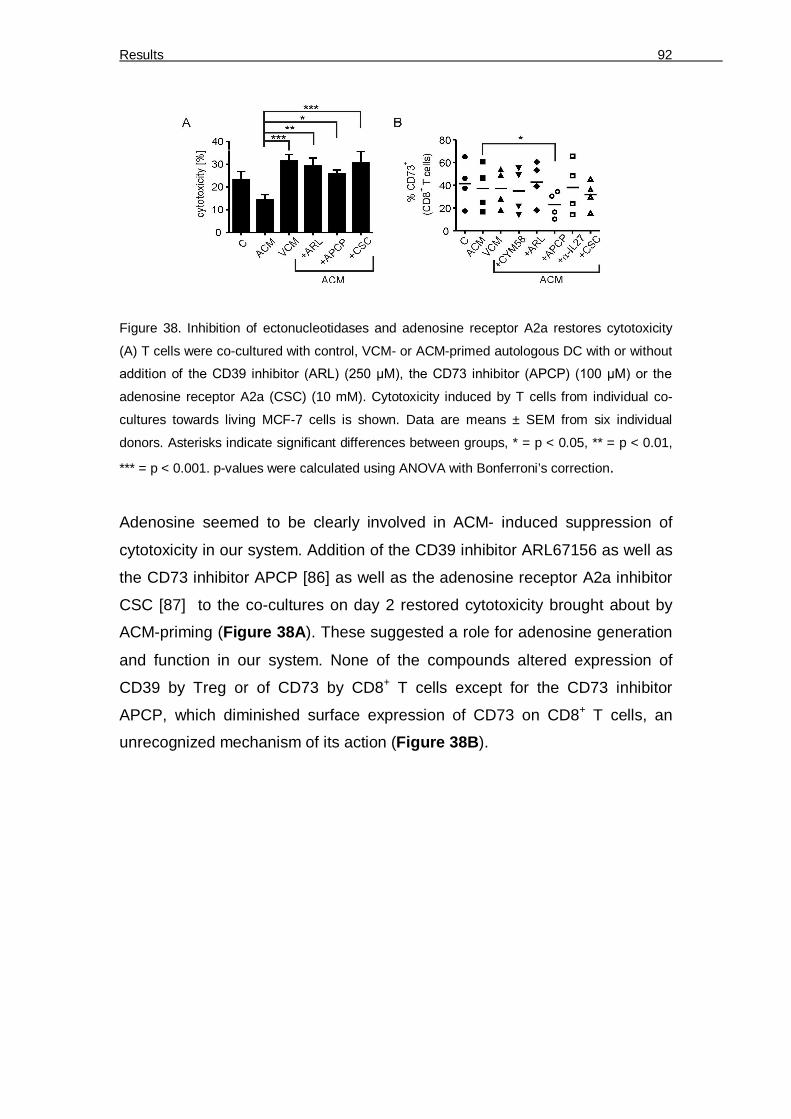
Results 92
Figure 38. Inhibition of ectonucleotidases and adenosine receptor A2a restores cytotoxicity
(A) T cells were co-cultured with control, VCM- or ACM-primed autologous DC with or without
addition of the CD39 inhibitor (ARL) (250 µM), the CD73 inhibitor (APCP) (100 µM) or the
adenosine receptor A2a (CSC) (10 mM). Cytotoxicity induced by T cells from individual co-
cultures towards living MCF-7 cells is shown. Data are means ± SEM from six individual
donors. Asterisks indicate significant differences between groups, * = p < 0.05, ** = p < 0.01,
*** = p < 0.001. p-values were calculated using ANOVA with Bonferroni’s correction.
Adenosine seemed to be clearly involved in ACM- induced suppression of
cytotoxicity in our system. Addition of the CD39 inhibitor ARL67156 as well as
the CD73 inhibitor APCP [86] as well as the adenosine receptor A2a inhibitor
CSC [87] to the co-cultures on day 2 restored cytotoxicity brought about by
ACM-priming (Figure 38A). These suggested a role for adenosine generation
and function in our system. None of the compounds altered expression of
CD39 by Treg or of CD73 by CD8+ T cells except for the CD73 inhibitor
APCP, which diminished surface expression of CD73 on CD8+ T cells, an
unrecognized mechanism of its action (Figure 38B).

Results 93
Figure 39. Surface profiling of doublet T cell populations. (A) Representative FACS traces
show analysis of the FSC-W gated CD3+ doublet population of cells from control, ACM- or
VCM-primed co-cultures. CD4+CD8+ events in the doublets, most likely aggregates of CD4+
and CD8+ T cells were analyzed for expression of CD25, FoxP3, CD39 and CD69.
Representative FACS traces are shown.
So far, we observed accumulation of CD69-expressing CD39+ Treg in ACM-
primed co-cultures, which directly correlated to suppression of cytotoxicity. We
wondered whether CD69 expression on Treg might be directly involved in
suppressing CD8+ T cell function.
The concerted action of CD39 and CD73 seemed to be important for
suppression of cytotoxicity induced by ACM-priming although these molecules
were expressed by different cells. CD69 is a member of the c-type lectin
family, proteins which regulate cell-cell contact. We hypothesize that CD69-
bearing CD39+ Treg might establish direct contact with CD73-expressing
CD8+ T cells to ensure efficient adenosine generation and subsequent
immunosuppression.
To approach this question, we analyzed CD4+CD8+ events within CD3+
doublets from control, ACM and VCM co-cultures using polychromatic flow
cytometry. These CD4+CD8+ doublets were generally enriched in
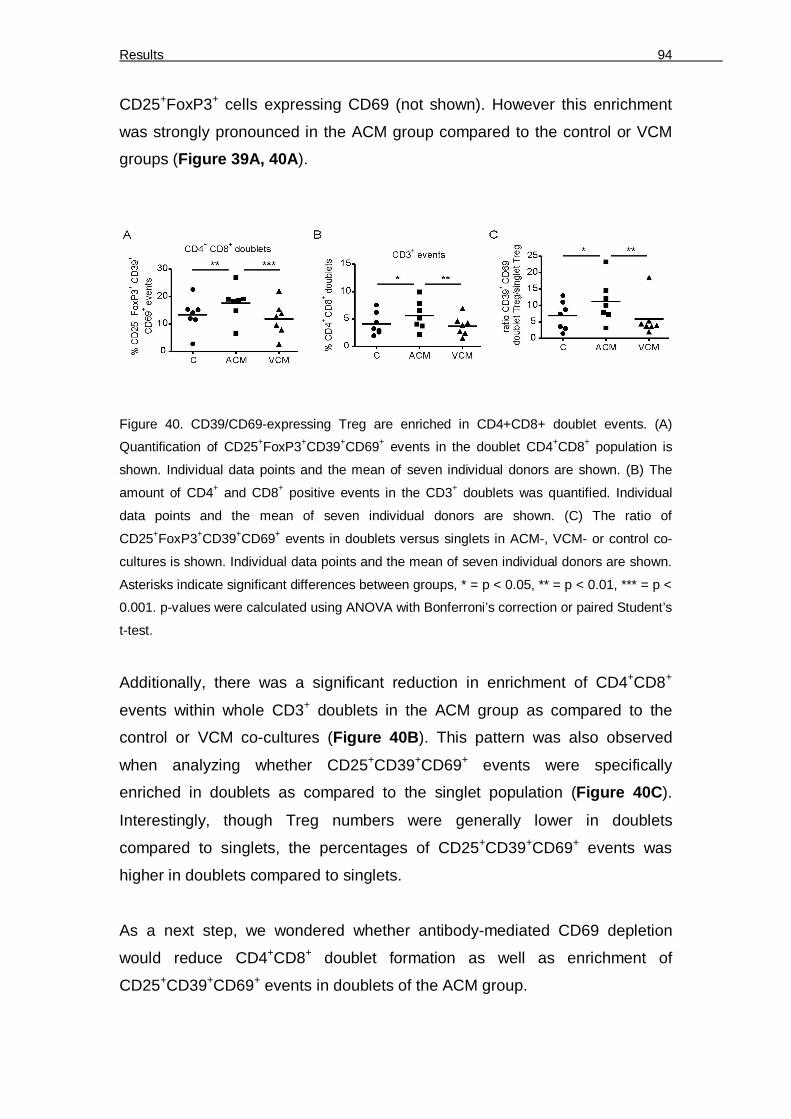
Results 94
CD25+FoxP3+ cells expressing CD69 (not shown). However this enrichment
was strongly pronounced in the ACM group compared to the control or VCM
groups (Figure 39A, 40A).
Figure 40. CD39/CD69-expressing Treg are enriched in CD4+CD8+ doublet events. (A)
Quantification of CD25+FoxP3+CD39+CD69+ events in the doublet CD4+CD8+ population is
shown. Individual data points and the mean of seven individual donors are shown. (B) The
amount of CD4+ and CD8+ positive events in the CD3+ doublets was quantified. Individual
data points and the mean of seven individual donors are shown. (C) The ratio of
CD25+FoxP3+CD39+CD69+ events in doublets versus singlets in ACM-, VCM- or control co-
cultures is shown. Individual data points and the mean of seven individual donors are shown.
Asterisks indicate significant differences between groups, * = p < 0.05, ** = p < 0.01, *** = p <
0.001. p-values were calculated using ANOVA with Bonferroni’s correction or paired Student’s
t-test.
Additionally, there was a significant reduction in enrichment of CD4+CD8+
events within whole CD3+ doublets in the ACM group as compared to the
control or VCM co-cultures (Figure 40B). This pattern was also observed
when analyzing whether CD25+CD39+CD69+ events were specifically
enriched in doublets as compared to the singlet population (Figure 40C).
Interestingly, though Treg numbers were generally lower in doublets
compared to singlets, the percentages of CD25+CD39+CD69+ events was
higher in doublets compared to singlets.
As a next step, we wondered whether antibody-mediated CD69 depletion
would reduce CD4+CD8+ doublet formation as well as enrichment of
CD25+CD39+CD69+ events in doublets of the ACM group.

Results 95
Figure 41. CD69 neutralization reduces the doublet T cell population (A) ACM co-cultures
were treated with either anti-CD69 or the isotype control on day 2. Representative FACS
traces show CD39 and CD69 expression in CD4+ T cells on day 3. (B) The amount of CD4+
and CD8+ positive events in CD3+ doublets in ACM-co-cultures with anti-CD69 (-CD69) or
the isotype control (IgG) on day 3 is displayed. Individual data points and the mean of six
individual donors are shown, n = 6. (C) The ratio of CD25+FoxP3+CD39+ events in doublets
versus singlets of ACM-co-cultures with anti-CD69 (-CD69) or the isotype control (IgG) on
day 3 is shown. Individual data points and the mean of six individual donors are shown.
Asterisks indicate significant differences between groups, * = p < 0.05, ** = p < 0.01, *** = p <
0.001. p-values were calculated using ANOVA with Bonferroni’s correction or paired Student’s
t-test.
CD69 depletion was efficiently induced in ACM co-cultures using CD69
antibody compared to the isotype, without altering the total amount of CD39+
cells (Figure 41A). Strikingly, CD4+CD8+ doublets (Figure 41B) as well as
CD25+CD39+ events in the doublet population (Figure 41C) of the ACM group
were decreased upon CD69 neutralization. These findings provide a first hint
that CD69-expressing Treg may bind to an unidentified ligand on CD8+ T
cells, which might aid efficient adenosine production and subsequent
suppression of cytotoxicity.

Discusssion 96
7 Discussion
7.1 mo-pDC generation ex-vivo brought about by evoking pDC developmental genes
We successfully generated donor-specific plasmacytoid DC equivalents ex
vivo from monocytes, which can be further manipulated by environmental
stimuli such as hypoxia, vitamin D3 or ATRA. The availability of easy systems
to generate mDC ex vivo made them attractive for cancer therapy with the
advantage of manipulating DC during differentiation. Another subset of DC,
the pDC are appreciated for their importance in therapy, to prevent allograft
rejection, rheumatoid arthritis [15, 16] or cancer [12]. In mice, bone marrow
cells have been used to generate pDC using Flt3-L [99], but in humans there
is a need to generate pDC from easily available precursors instead of using
cells from cumbersome sources such as bone marrow-derived cells.
Peripheral blood monocytes constitute an available source of cells from
human subjects to generate mo-pDC cells as demonstrated in this study.
Since monocytes produce basal levels of GM-CSF [101], we asked whether
differentiating them with Flt3-L could generate pDC equivalents. Our method
offers the possibility to manipulate these cells during differentiation and to
study the impact of various stimuli on their differentiation and maturation.
Flt3-L is a pDC-determining cytokine [22]. The expression of Flt3 on
peripheral human monocytes made them responsive to Flt3-L. Mo-pDC
obtained after differentiation of monocytes with Flt3-L exhibited surface
marker profiles that characterize pDC such as high CD123 and BDCA4 but
lower CD11c, CD86 and TLR4 expression. Whereas pDC do not express
CD14 [131] the expression of CD14 seen in mo-pDC likely points to the partial
retention of some monocyte phenotypical features, which was however lost
upon long-term culture up to 10 days. Mo-pDC showed high TLR7 and TLR9
expression, making them likely candidates for being responsive to viruses and
produce IFN-α. Though also mDC express high TLR9 levels, they express
less IFN-α, as they are probably deficient in expression of proteins in the

Discusssion 97
upstream IFN-α pathway that are under transcriptional control of E2-2. Mo-
pDC also expressed CXCR3 like their primary pDC counterpart, though in
lower quantity. However, CXCR3 expression was higher compared to mDC.
Thus, mo-pDC are likely to respond to CXCR3-dependent trafficking.
Figure 42: Transcription factors (TF) profile during pDC development under normoxia and
hypoxia. (Left) In general, pDC express high levels of E2-2 but a low ID2. Under normoxia,
the levels of these transcription factors are unaltered. In the absence of adequate levels of
ID2, the E2-2 molecules are free to dimerize. The resulting, active E2-2 dimer binds to E-Box
element in genes such as Irf-7/8, Spi-B and activates their transcription. (Right) However,
under hypoxia, HIF induces ID2. In the presence of increased levels of E2-2 inhibiting TF ID2,
E2-2 monomers are not able to dimerize. Since the E-Box is not occupied by the E2-2 dimer,
the gene expression can not be initiated. Hence, the expression genes involved in pDC
development and function are switched off under hypoxia.
E2-2 was identified as the critical pDC lineage determining marker, which is
absent in conventional myeloid DC, monocytes and macrophages [25]. In
humans it binds directly to the regulatory regions of multiple genes that are
enriched in pDC such as ILT7, BDCA2, Spi-B, IRF7 and IRF8. A prominent
E2-2 protein expression was observed in mo-pDC, whereas E2-2 expression
was absent in monocytes of the same donor. Also, mo-pDC expressed
significantly higher E2-2 and lower ID2 mRNA levels compared to mDC. Thus,
mo-pDC might qualify as pDC equivalents, as they also differ in expression of
pDC lineage markers compared to mDC generated from the same donor. Flt3-
L most likely prompted E2-2 induction. Mo-pDC differentiated under hypoxia
(1% O2) for 2 days had similar levels of E2-2 like those differentiated under

Discusssion 98
normoxia, but with continuing differentiation under hypoxia, E2-2 expression
was completely lost. It is interesting to note that E2a, another E protein like
E2-2, was down-regulated after 1 to 3 days of exposure to hypoxia (1 % O2)
[132]. Likely, E2-2 as well as E2a was decreased under hypoxia by a yet
unknown mechanism. ID proteins are the naturally occurring dominant
negative inhibitors for E proteins. ID2 is a functional inhibitor of E2-2 (Figure 42) in human placenta [26]. On differentiation under hypoxia, we noticed that
ID2 mRNA expression was progressively induced compared to normoxia. ID2
and ID3 inhibited development of pDC but not mDC [133]. 1α, 25-
Dihydroxyvitamin D3, an active form of vitamin D3 was reported to decrease
both ID1 and ID2 expression [103]. Moreover, ATRA decreased ID1 and ID2
expression [104]. Consequently, we investigated the effect of vitamins on mo-
pDC differentiation. As expected, mo-pDC differentiated with Flt3-L together
with vitamin D3 or ATRA increased IFN-α production. Interestingly, vitamin D3
is reported to be beneficial for cancer treatment [134] and ATRA has been
used along with GM-CSF and chemotherapy for treatment of acute myeloid
leukaemia [135]. Besides, retinoic acid inhibited measles virus through type I
interferon production [136]. Therefore, the anti-tumour and anti-virus effects of
vitamins may hint towards increased production of type I interferons by pDC.
In addition, ID2 is crucial for mDC development [27]. ID2 is expressed in
human peripheral monocytes and its expression increases upon differentiation
into terminal myeloid cells [137]. It is tempting to speculate that vitamins used
in this study decreased ID proteins in monocytes. When ID levels are low, E2-
2 may be free to form homodimers and activate downstream transcriptional
pathways (Figure 42).
We checked the expression of markers in mo-pDC, which are reported to be
under the control of E2-2. BDCA2 expression was higher in mo-pDC
compared to mDC, which was likely due to a lack of E2-2 in the latter [25].
Furthermore, we determined the levels of IFN-α in E2-2 expressing mo-pDC.
TLR9-ligated PBMC served as a positive control. IFN-α produced by mo-pDC
was marginal compared to the high levels of IFN-α, which were produced by
blood derived pDC [6]. Since mo-pDC expressed TLR7 and TLR9, we
reasoned that the downstream IFN-α production machinery might be
Discusssion 99
incomplete. First we focussed on IRF-7, since the IRF-7 gene is
transcriptionally activated by E2-2 [97] and it is critical to induce IFN-α
production, which was impaired in pDC from E2-2 haplosufficient individuals
[25]. IRF-7 gene expression could be stimulated by TNF-α through NFκB
[106]. Therefore, we checked the basal expression of TNF-α in mo-pDC and
mDC. Mo-pDC produced significantly lower basal TNF-α amounts compared
to mDC. Although IFN-α expression by mDC was low despite the high basal
expression of TNF-α by these cells, priming of mo-pDC with TNF-α strongly
increased their IFN-α expression on mRNA and protein level as well as
secretion of bioactive IFN-α. Strikingly, TNF-α-treated mo-pDC expressed
higher levels of IRF7 compared to control mo-pDC. However, basal TNF-α
production from cells such as mDC alone was not sufficient to induce IFN-α.
Rather, the cells had to be equipped with both the IFN-α-producing upstream
machinery as well as IRF-7 expression, which is determined among others by
E2-2 and was enhanced by TNF-α. The IRF7 gene promoter is reported to be
located in a GC-rich area of the chromosome, which could be condensed and
inaccessible. Thus, chromosome remodelling must take place in order to
access the IRF7 promoter [106]. Whether E2-2 expression and TNF-α pre-
stimulation improve IRF7 gene accessibility might be investigated further on.
Overall, mo-pDC generated by incubation of monocytes with Flt3-L were pDC-
like cells, which still retained some characteristics of monocytes such as
CD14 expression or a low basal ID2 expression. However, differentiation with
vitamins or priming with TNF-α improved their function. Our method now
provides an easily accessible system to study pDC differentiation and
maturation using human cells.
7.2 Under hypoxia mo-pDC development is halted to produce non-functional cells
Hypoxia has a strong influence on the phenotype and functions of mDC.
Immature DC undergo differentiation under hypoxia and further induce
proliferation of T cells [111, 112]. In contrast, mo-pDC differentiated under

Discusssion 100
hypoxia became non-functional, based on decreased BDCA2 expression,
attenuated IFN-α production, and a decreased CD86 as well as MHCI surface
exposure. During differentiation under hypoxia, followed by maturation with
CpG, mo-pDC also produced higher levels of TNF-α, IL-1β and IL-6, but
constant levels of IL-10 as compared to normoxia-differentiated mo-pDC.
Induction of IL-6 by hypoxia is reported to result from activation of MAP
kinase, HIF-1 and the NF-κB pathway [138], which also might account for
induction of TNF-α and IL-1β. Overall, judging from cytokine data, hypoxia
might strengthen NF-κB-dependent transcription downstream of TLR9 ligation
[139].
Decreased expression of BDCA2 and production of IFN-α might be a
consequence of the lower E2-2 and higher ID2 levels at later stages of
differentiation under hypoxia. Hypoxia might cause dedifferentiation of mo-
pDC by decreasing E2-2 especially later during differentiation, since E2-2
expression was observed during early stages of differentiation under hypoxia
as well as normoxia. The impact of hypoxia on E2-2 expression in later stages
of mo-pDC development might have physiological implications e.g. in
tumours, as it is reported that E2-2 predominantly regulates terminal
development of pDC functions [97]. Therefore, properties of pDC under
physiological hypoxia such as in tumours should be investigated. Interestingly,
HIF-1 was described to induce ID2 in neuroblastoma cells during hypoxia
[115]. Therefore, hypoxia and HIF-1-mediated ID2 induction may further
contribute to the non-functionality or dedifferentiation of mo-pDC by inhibiting
E2-2. To further evaluate this hypothesis, we went on to study the influence of
hypoxia on pDC generation and function in the mouse system by using bone
marrow progenitors that were deficient in expression of HIF-1α.
7.3 Mouse pDC differentiation in vitro is inhibited by hypoxia-induced HIF-1
Indeed, on culturing mouse bone marrow cells with Flt3-L, a CD19- CD11c+
SiglecH+ pDC population was expanded that also expressed the mouse pDC
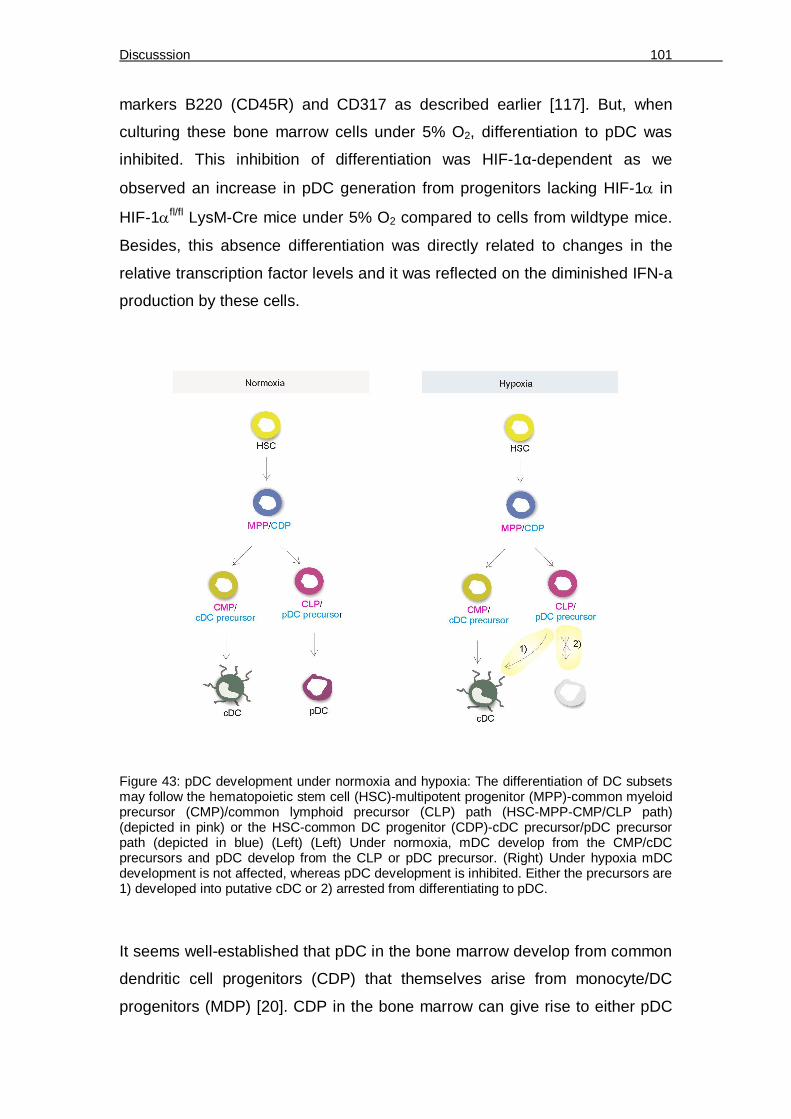
Discusssion 101
markers B220 (CD45R) and CD317 as described earlier [117]. But, when
culturing these bone marrow cells under 5% O2, differentiation to pDC was
inhibited. This inhibition of differentiation was HIF-1α-dependent as we
observed an increase in pDC generation from progenitors lacking HIF-1 in
HIF-1fl/fl LysM-Cre mice under 5% O2 compared to cells from wildtype mice.
Besides, this absence differentiation was directly related to changes in the
relative transcription factor levels and it was reflected on the diminished IFN-a
production by these cells.
Figure 43: pDC development under normoxia and hypoxia: The differentiation of DC subsets may follow the hematopoietic stem cell (HSC)-multipotent progenitor (MPP)-common myeloid precursor (CMP)/common lymphoid precursor (CLP) path (HSC-MPP-CMP/CLP path) (depicted in pink) or the HSC-common DC progenitor (CDP)-cDC precursor/pDC precursor path (depicted in blue) (Left) (Left) Under normoxia, mDC develop from the CMP/cDC precursors and pDC develop from the CLP or pDC precursor. (Right) Under hypoxia mDC development is not affected, whereas pDC development is inhibited. Either the precursors are 1) developed into putative cDC or 2) arrested from differentiating to pDC.
It seems well-established that pDC in the bone marrow develop from common
dendritic cell progenitors (CDP) that themselves arise from monocyte/DC
progenitors (MDP) [20]. CDP in the bone marrow can give rise to either pDC

Discusssion 102
or progenitors of conventional DC (cDC) that leave the bone marrow to further
differentiate along the DC lineage. Under hypoxia, pDC generation was
inhibited whereas, the progenitors were retained as undifferentiated CD11b-
CD115+ cells [140] or the development was forked to generate a CD11bhigh
CD115- cDC cell population. Thus, our data support the current view [21] that
pDC mainly develop along a common pathway with cDC, which in the bone
marrow might be the CDP (Figure 43).
Our data give first experimental evidence that one of the yet unidentified
signals that encourage CDP differentiation to cDC might be the low oxygen
level in the bone marrow, thereby limiting pDC generation [114, 140]. Indeed,
the hypoxic milieu in the bone marrow might be a reason why pDCs constitute
only a very small cell population in humans and mice. Since they are highly
potent producers of type I interferons and are major drivers of autoimmune
reactions [120], the identified mechanism might have evolved to limit their
numbers and thus limit the magnitude of autoimmunity. To further elucidate
the DC developmental program in vitro under the influence of hypoxia and
HIF-1, detailed analysis for detecting progenitor populations could be
performed
Recently, cancer immunotherapy using mDC along with pDC-activating CpG
mimetic has proven successful against cancer [11, 12]. This is due to the
capacity of pDC to produce type I interferon, which is crucial in preventing
tumour growth by directly acting on tumour cells and on host hematopoietic
cells [141]. We observed that there is a decrease in pDC differentiation under
hypoxia. Furthermore, pDC function depends on continuous E2-2 expression
[142], which might be decreased under hypoxia even in mature pDC, thereby
limiting their functional properties. Thus tumour microenvironmental factors
such as hypoxia may contribute to thwarting beneficial effects of such
combinational immunotherapy which aims at pDC activation to check tumour
growth.

Discusssion 103
7.4 Apoptotic cell priming in reducing cytotoxicity and inducing Tregs in DC dependent priming
A growing tumour or a tumour subjected to conventional therapy sheds
tumour-derived factors/exosomes [143]. These factors released from dying
tumour cells may be another crucial microenvironmental factor that may
contribute to suppressing anti-tumour immunity. Over the last years it became
apparent that the immune status of tumour-infiltrating lymphocytes is a crucial
determinant for patient prognosis. In human colorectal cancer the presence of
FoxP3+ Treg correlated positively with the presence of immunosuppressive
DC and the absence of antigen-specific effector T cells [144]. In addition,
accumulation of Treg can hinder beneficial effects of immunotherapy.
Depletion of Treg using anti-CD25 or anti-CTLA4 along with T cell or DC
immunotherapy was shown to successfully restore anti-tumour immunity
[145]. Thus targeting Treg is a promising strategy to reduce tumour-driven
immune suppression [146].We analyzed the impact of factors released from
dying tumour on the T cell-associated cytotoxicity mediated through DC. DC
have been shown to internalize membrane material from living cells to mount
CD8+ T cell immune responses [147]. Indeed we observed that factors shed
from apoptotic tumour cells (ACM) reduced cytotoxicity; whereas priming with
viable cell derived factors (VCM) increased cytotoxicity against living tumour
cells. We propose that antigens contained in VCM exosomes might be
responsible to induce cytotoxicity via CD8+ T cells, whereas Treg induced by
immunosuppressive factors contained in ACM prevent cytotoxicity. Despite
tumour cell-specific Tc might still be generated by ACM as indicated by the
Treg depletion experiments, which restored cytotoxicity. Interestingly, the
suppressive potential of ACM-induced Treg was transferable to VCM-primed
lymphocytes. Hence apoptotic debris resulting from cytotoxic cancer therapy,
which is known to induce immune paralysis [57], when shed, e.g., to the TDLN
might culminate in generation of Treg that block potent endogenous tumour-
killing CTL activity or CTL from an T cell adoptive-transfer immunotherapy.

Discusssion 104
Tumour-released factors modify functions of DC at the tumour site or in
draining lymph nodes thereby, exploiting their tolerogenic function [148].
Generation of suppressive Treg required activation of S1PR4 on DC, likely
due to S1P that is secreted by AC [149-151]. S1P is a potent lipid mediator
that signals via specific G protein coupled receptors to control aspects of
phagocyte biology [152]. We previously demonstrated that S1P is involved in
activating macrophages to a potentially tumour-supportive phenotype [153,
154]. Furthermore, during LPS-induced maturation of DC, S1P inhibits Th1
responses by suppressing IL-12 release and instead promotes Th2 responses
by increasing IL-4 and IL-10 production [152]. We observed that inhibition of
S1PR1/3 upon treatment with ACM indeed marginally increased secretion of
the pro-inflammatory cytokines IL-12, TNF- and IL-6, while moderately
increasing IL-10. This suggests that S1P acting on S1PR1/3 might be an
intrinsic attenuating signal in AC-induced inflammation. However, for
suppression of cytotoxicity these changes seemed irrelevant. Rather, S1P in
ACM induced expression of ebi3 and the release of IL-27 through S1PR4.
Whether IL-35, which was implicated in human Treg function [155], was
upregulated by ACM could not be confirmed due to lack of a suitable IL-35
detection method. Although we cannot exclude a role for IL-35 in our system,
IL-27 moderates suppressive Treg function, as demonstrated by antibody
neutralization.
Generally, the function of IL-27 in T cell biology is ambiguous between pro-
inflammatory (induction of Th1) and anti-inflammatory (immunosuppression)
[156]. IL-27 induces expression of the Th1 transcription factor T-bet [157] and
was recently shown to promote CD8+ T cell proliferation by activating STAT1
[158], which argues for IL-27 being pro-inflammatory. However, Treg also
have been shown to express T-bet together with CXCR3. These specialized
Treg migrate to areas of Th1 inflammation and contribute to
immunosuppression [159], which might be a mechanism to dampen over-
activation of immunity. This mechanism may be employed by ACM-primed DC
expressing IL-27 to induce Treg that can in turn cause immunosuppression
even in a milieu that is not strictly anti-inflammatory. Besides inducing T bet,

Discusssion 105
IL-27 potently reduces expression of the Th17 cell-determining transcription
factor (TF) RORC as well as the Th2-determining TF GATA3, but not Foxp3
[160]. In our hands, interfering with IL-27 also had no effect on FoxP3
expression. Instead, IL-27 inhibition in the ACM group decreased the CD39+
CD69+ Treg population. This might be facilitated by a yet unknown
mechanism similar to the one employed by IL-35, which shares the ebi3
subunit with IL-27, to induce CD39 expression on CD4+Foxp3+ Treg [161]. A
mechanism how IL-27 upregulates CD69 remains to be discovered.
7.5 The Adenosine pathway is utilized by Treg to cause immunosuppression
The exact mechanism employed by Treg to suppress of anti-tumour
responses in our system has yet to be defined. CD4+ Treg can be divided
among others into CD4+ CD25+ Foxp3+ Treg and T regulatory type 1 (Tr1)
FoxP3- cells. IL-27 was shown to enhance the generation of IL-10 expressing
Tr1 cells in mice [162] and to induce regulatory activity to NK cells which
inturn, suppresses T cells [163]. In our system, using human cells, IL-27 did
not upregulate IL-10 expression in the ACM group. The defining characteristic
of the suppressive Treg subpopulation expanded by ACM-primed DC was
expression of the ectonucleotidase CD39 and the activation marker CD69. It
is reported that CD39 was nearly exclusively expressed by FoxP3+ cells [121].
CD39 metabolizes ATP and ADP to AMP, the former being produced by
activated T cells that have undergone TCR engagement and calcium influx
[164]. Since DC treated with ACM do not show deficiencies in maturation or
activation, they might well engage the TCR of T effector cells to stimulate ATP
release, which can be metabolized to AMP by CD39 present on the surface of
Treg. Further on, AMP can be degraded to adenosine by CD73 present on
CD8+ T cells in the co-culture. Extracellular adenosine was shown to inhibit
many aspects of T cell functionality such as effector differentiation, activation
(by increasing cAMP levels), cytokine production, metabolic activity and
proliferation [129]. Interestingly ectonucleotidase expression and activity was
increased in Treg of head and neck cancer patients, presumably contributing

Discusssion 106
to their immunosuppressive function [86]. A similar mechanism of
immunosuppression is employed by ectonucleotidase-expressing ovarian
carcinoma cells, which generate adenosine to inhibit CD4+ T cell proliferation
as well as NK cell cytotoxicity through activation of ADORA2A on these cells
[165]. Hence adenosine generated through CD39 and CD73 expressed by
Treg and CD8+ T cells respectively might suppress the function of CTL in our
system acting via ADORA2A, whose inhibition indeed restored cytotoxicity in
the ACM group.
Figure 44: Pathway leading to suppression of anti-tumour immunity by apoptotic tumour cell priming of DC: Priming of DC with factors derived from apoptotic tumour cells (AC) induces expression of regulatory enzyme IDO and also expression of cytokine subunit ebi3. The ACM-polarized DC release cytokines such as IL-27 or IL-10, mediated through the S1PR4. IL-27 is responsible for up-regulation of CD69 on a Treg subpopulation that expresses FoxP3 and the ectonucleotidase CD39. The expression of CD39 on Treg along with an expression of ectonucleotidase CD73 on the surface CD8+ T cells generates adenosine to mediate immunosuppression. This is likely transmitted through adenosine acting on adenosine receptors expressed on CD8+ T cells. The CD69 molecule expressed by Treg might interact with a so far unidentified receptor on CD8+ T cells forming a scaffold that supports adenosine generation to suppress the cytotoxic activity of CD8+ T cells towards living tumour cells.

Discusssion 107
The most defining aspect of Treg from the ACM group was expression of
CD69. CD69 expression on T cells inhibits S1P1 expression [166], which may
act to maintain Treg in a suppressive state, since S1P has been shown to
overcome FoxP3+ Treg-mediated suppression [167]. Besides, we hypothesize
that CD69 on Treg might directly suppress the activity of effector T cells.
CD69 is a C-type lectin, which can trigger e.g. TGF-β production [168].
Although TGF-β was connected with suppression of cytotoxic CD8+ T cells
before [169], we did not observe significant up-regulation of TGF-β in Treg of
the ACM group and TGF-β neutralizing did not restore cytotoxicity in our set-
up. An alternative option might be binding of CD69 to a putative
‘ligand/receptor’ on the surface of CD8+ T cells, which is a common pattern for
C-type lectins. This is true e.g. for interactions between cytotoxic lymphocytes
and their targets [170]. However, a binding partner for CD69 is not known. If
this putative molecule is expressed on CD8+ T cells, CD69-expressing Treg
might bind to these cells to create a functional platform for adenosine
production by bringing CD39 and CD73 in close proximity. Our analysis of
CD4+CD8+ doublets is a first hint to support this hypothesis. Future
experiments addressing the function and the putative ligand for CD69 are
needed.
Ex-vivo priming of DC with tumour lysates and in vivo DC activation strategies
have been employed in cancer immunotherapy [171]. Therefore, our data
might add to the understanding how priming with viable or killed tumour cells
might impact final anti-tumour activity and thus might aid in improving
strategies for ex vivo DC activation. Conventional therapy will probably benefit
from inhibition of intrinsic immunosuppressive pathways. Our results suggest
that interfering with S1PR4 and/or IL-27 might prove beneficial. In the future,
new findings regarding the putative CD69L could help to understand the
significance of CD69 expression on Treg in modulating CTL responses.

Concluding remarks 108
8 Concluding remarks
Immune cells have evolved the capacity to act as a rheostat to control the
amplitude of an immune response. DC are no exception to this rule and have
a capacity to mount an inflammation or tolerance depending on the factors
that they were primed with. Interestingly, pDC are immunoregulators that
despite being present only in lesser numbers in the body participate in
mounting an anti-viral immunity or induce tolerance. A protocol to easily
differentiate pDC equivalents from human monocytes was attempted. The mo-
pDC thus generated expressed some typical pDC surface markers. Besides,
they also expressed pDC-determining transcription factor E2-2 whose
expression was downregulated upon differentiation under hypoxia. pDC are
principal IFN-α producers in the body. The capacity of mo-pDC to produce
IFN-α was upregulated with TNF-α pretreatment. When differentiated under
hypoxia, the IFN-α production by these mo-pDC was restricted, likely
mediated through the increased ID2 production by the mo-pDC. ID2 inhibits
E2-2 that controls the transcription of pDC differentiation genes. In addition, in
vitro differentiation of bone marrow precursors from mice lacking HIF-1α
enhances pDC generation compared to culturing the precursors from wildtype
mice under hypoxia, which limits pDC generation. The precursors are shunted
to generate along the myeloid pathway to generate cDC or get arrested in an
undifferentiated state. The lack of HIF-1 in progenitors of HIF-1fl/fl LysM-Cre
mice represses ID2 upregulation and encourages E2-2 function such as IFN-α
production.
Hypoxia is one of the stress factors that encourages tumour growth. Another
of such a stress factor is the presence of dying tumour cells, which maintains
immune cells and tumour stromal cells in a state of alternative activation that
ensures tumour cell survival. The influence of apoptotic or necrotic cell-
derived factors on DC functions and phenotype could further help to
understand their interactions with effector cells and tumour stroma in detail.
Cancer immunosuppression brought about by apoptotic cells has lately
become a topic of intense research [172]. Myeloid DC can be activated ex
Concluding remarks 109
vivo and used for tumour therapy. But the presence of tumour-derived factors
has been known to offset benefits of tumour therapy. Chemotherapy and
radiation therapy discharges large amounts of dying cell-released factors.
However the exact mechanism of how the dying cell-discharged factors
induce tolerance, in order to disrupt tumour cell killing, is not clear. We
discovered that upon priming with the apoptotic cell-generated lipid S1P, DC
undergo biochemical polarization via the S1P4 receptor. The resulting release
of the T cell-modulating cytokine IL-27 can direct a shift in T cell
differentiation/activation and functions towards tolerance. In this study, the IL-
27 released by DC upregulated a specific Treg subset. These CD39 and
CD69 co-expressing FoxP3+ Treg suppressed the cytotoxic capability of CD8+
T cells through the adenosine pathway. This message as we speculate could
be transmitted by the physical interaction of Treg with CD8+ T cells. Thus, the
message of anti-tumour defence is relayed from 1) antigen presenting DC to
2) the T cells. Apoptotic cell-released factors; especially lipid messages can
impact biochemical pathways at these two checkpoints. The role that IL-27, a
newly discovered cytokine plays in Treg expansion under apoptotic cell
priming is an interesting revelation. It will be of future interest to investigate
the pathways activated downstream of IL-27R ligation in Treg and their
contribution to Treg functions.
A fully functional immune system is essential for mounting an inflammatory
response in the presence of a tumour. This is exemplified by the prevention of
breast tumour destruction in individuals with a mutation in TLR4 [173].
Therefore, the efficacy of chemotherapeutics administered to cancer patients
may also depend on their impact on the immune system. Chemotherapeutics
may either kill tumour cells without immune involvement, which may or may
not be immunogenic, may cause tumour cell death by activating immune cells
or cause immunosuppression by also killing immune cells [174]. The
immunological outcome depends on surface alterations of dying cells or, as
seen in our system, on the apoptotic cell secretome, which depends on the
cell death-inducing agent. In our studies, the immunogenic cell death inducer
oxaliplatin did not induce immune suppression as opposed to staurosporine.
One might speculate that this was due to the absence of S1P production by

Concluding remarks 110
oxaliplatin-treated MCF-7 cells. Finally, understanding how tumour
microenvironmental factors cause altered phagocyte and effector function
may greatly contribute to designing better immunotherapeutic approaches
against tumours.

References 111
9 References 1. Schmid, M.C. and J.A. Varner, Myeloid cells in the tumor microenvironment:
modulation of tumor angiogenesis and tumor inflammation. J Oncol, 2010. 2010: p. 201026.
2. Curiel, T.J., et al., Dendritic cell subsets differentially regulate angiogenesis in human ovarian cancer. Cancer Res, 2004. 64(16): p. 5535-8.
3. Yoong, K.F., et al., Expression and function of CXC and CC chemokines in human malignant liver tumors: a role for human monokine induced by gamma-interferon in lymphocyte recruitment to hepatocellular carcinoma. Hepatology, 1999. 30(1): p. 100-11.
4. Palucka, K. and J. Banchereau, Dendritic cells: a link between innate and adaptive immunity. J Clin Immunol, 1999. 19(1): p. 12-25.
5. Banchereau, J. and R.M. Steinman, Dendritic cells and the control of immunity. Nature, 1998. 392(6673): p. 245-52.
6. Le Bon, A., et al., Type i interferons potently enhance humoral immunity and can promote isotype switching by stimulating dendritic cells in vivo. Immunity, 2001. 14(4): p. 461-70.
7. Teleshova, N., J. Kenney, and M. Robbiani, Dendritic cells and HIV infection: activating dendritic cells to boost immunity. Adv Dent Res, 2006. 19(1): p. 36-41.
8. Fonteneau, J.F., et al., Human immunodeficiency virus type 1 activates plasmacytoid dendritic cells and concomitantly induces the bystander maturation of myeloid dendritic cells. J Virol, 2004. 78(10): p. 5223-32.
9. Chen, W., et al., The indoleamine 2,3-dioxygenase pathway is essential for human plasmacytoid dendritic cell-induced adaptive T regulatory cell generation. J Immunol, 2008. 181(8): p. 5396-404.
10. Palucka, K., et al., Dendritic cells and immunity against cancer. J Intern Med, 2011. 269(1): p. 64-73.
11. Lonsdorf, A.S., et al., Intratumor CpG-oligodeoxynucleotide injection induces protective antitumor T cell immunity. J Immunol, 2003. 171(8): p. 3941-6.
12. Lou, Y., et al., Plasmacytoid dendritic cells synergize with myeloid dendritic cells in the induction of antigen-specific antitumor immune responses. J Immunol, 2007. 178(3): p. 1534-41.
13. Diamond, M.S., et al., Type I interferon is selectively required by dendritic cells for immune rejection of tumors. J Exp Med, 2011. 208(10): p. 1989-2003.
14. Hartmann, E., et al., Identification and functional analysis of tumor-infiltrating plasmacytoid dendritic cells in head and neck cancer. Cancer Res, 2003. 63(19): p. 6478-87.
15. Colvin, B.L., et al., Allostimulatory activity of bone marrow-derived plasmacytoid dendritic cells is independent of indoleamine dioxygenase but regulated by inducible costimulator ligand expression. Hum Immunol, 2009.
16. Lebre, M.C. and P.P. Tak, Dendritic cells in rheumatoid arthritis: Which subset should be used as a tool to induce tolerance? Hum Immunol, 2009.
17. Ueda, Y., et al., Frequencies of dendritic cells (myeloid DC and plasmacytoid DC) and their ratio reduced in pregnant women: comparison with umbilical cord blood and normal healthy adults. Hum Immunol, 2003. 64(12): p. 1144-51.
18. Colonna, M., G. Trinchieri, and Y.J. Liu, Plasmacytoid dendritic cells in immunity. Nat Immunol, 2004. 5(12): p. 1219-26.
19. Yang, G.X., et al., Plasmacytoid dendritic cells of different origins have distinct characteristics and function: studies of lymphoid progenitors versus myeloid progenitors. J Immunol, 2005. 175(11): p. 7281-7.
20. Geissmann, F., et al., Development of monocytes, macrophages, and dendritic cells. Science, 2010. 327(5966): p. 656-61.
21. Ishikawa, F., et al., The developmental program of human dendritic cells is operated independently of conventional myeloid and lymphoid pathways. Blood, 2007. 110(10): p. 3591-660.
22. Pulendran, B., et al., Flt3-ligand and granulocyte colony-stimulating factor mobilize distinct human dendritic cell subsets in vivo. J Immunol, 2000. 165(1): p. 566-72.

References 112
23. Gotze, K.S., et al., Flt3high and Flt3low CD34+ progenitor cells isolated from human bone marrow are functionally distinct. Blood, 1998. 91(6): p. 1947-58.
24. Kingston, D., et al., The concerted action of GM-CSF and Flt3-ligand on in vivo dendritic cell homeostasis. Blood, 2009.
25. Cisse, B., et al., Transcription factor E2-2 is an essential and specific regulator of plasmacytoid dendritic cell development. Cell, 2008. 135(1): p. 37-48.
26. Liu, Y.P., et al., Id2 is a primary partner for the E2-2 basic helix-loop-helix transcription factor in the human placenta. Mol Cell Endocrinol, 2004. 222(1-2): p. 83-91.
27. Hacker, C., et al., Transcriptional profiling identifies Id2 function in dendritic cell development. Nat Immunol, 2003. 4(4): p. 380-6.
28. Nagasawa, M., et al., Development of human plasmacytoid dendritic cells depends on the combined action of the basic helix-loop-helix factor E2-2 and the Ets factor Spi-B. Eur J Immunol, 2008. 38(9): p. 2389-400.
29. Ghosh, H.S., et al., Continuous expression of the transcription factor e2-2 maintains the cell fate of mature plasmacytoid dendritic cells. Immunity, 2010. 33(6): p. 905-16.
30. Ivanovic, Z., Hypoxia or in situ normoxia: The stem cell paradigm. J Cell Physiol, 2009. 219(2): p. 271-5.
31. Eliasson, P. and J.I. Jonsson, The hematopoietic stem cell niche: low in oxygen but a nice place to be. J Cell Physiol, 2010. 222(1): p. 17-22.
32. Winkler, I.G., et al., Positioning of bone marrow hematopoietic and stromal cells relative to blood flow in vivo: serially reconstituting hematopoietic stem cells reside in distinct nonperfused niches. Blood, 2010. 116(3): p. 375-85.
33. Parmar, K., et al., Distribution of hematopoietic stem cells in the bone marrow according to regional hypoxia. Proc Natl Acad Sci U S A, 2007. 104(13): p. 5431-6.
34. Majmundar, A.J., W.J. Wong, and M.C. Simon, Hypoxia-inducible factors and the response to hypoxic stress. Mol Cell, 2010. 40(2): p. 294-309.
35. Takubo, K., et al., Regulation of the HIF-1alpha level is essential for hematopoietic stem cells. Cell Stem Cell, 2010. 7(3): p. 391-402.
36. Fatrai, S., et al., Identification of HIF2alpha as an important STAT5 target gene in human hematopoietic stem cells. Blood, 2011. 117(12): p. 3320-30.
37. Yoon, D., P. Ponka, and J.T. Prchal, Hypoxia. 5. Hypoxia and hematopoiesis. Am J Physiol Cell Physiol, 2011. 300(6): p. C1215-22.
38. Kojima, H., et al., Abnormal B lymphocyte development and autoimmunity in hypoxia-inducible factor 1alpha -deficient chimeric mice. Proc Natl Acad Sci U S A, 2002. 99(4): p. 2170-4.
39. Biswas, S.K. and A. Mantovani, Macrophage plasticity and interaction with lymphocyte subsets: cancer as a paradigm. Nat Immunol, 2010. 11(10): p. 889-96.
40. Dhodapkar, M.V., K.M. Dhodapkar, and A.K. Palucka, Interactions of tumor cells with dendritic cells: balancing immunity and tolerance. Cell Death Differ, 2008. 15(1): p. 39-50.
41. Berzofsky, J.A. and M. Terabe, NKT cells in tumor immunity: opposing subsets define a new immunoregulatory axis. J Immunol, 2008. 180(6): p. 3627-35.
42. Olex, A.L., et al., Dynamics of dendritic cell maturation are identified through a novel filtering strategy applied to biological time-course microarray replicates. BMC Immunol, 2010. 11: p. 41.
43. Gelin, C., et al., Regulation of MHC II and CD1 antigen presentation: from ubiquity to security. J Leukoc Biol, 2009. 85(2): p. 215-24.
44. Raghavan, M., et al., MHC class I assembly: out and about. Trends Immunol, 2008. 29(9): p. 436-43.
45. Zhu, J. and W.E. Paul, Heterogeneity and plasticity of T helper cells. Cell Res, 2010. 20(1): p. 4-12.
46. Schroder, K., et al., Interferon-gamma: an overview of signals, mechanisms and functions. J Leukoc Biol, 2004. 75(2): p. 163-89.
47. Gutcher, I. and B. Becher, APC-derived cytokines and T cell polarization in autoimmune inflammation. J Clin Invest, 2007. 117(5): p. 1119-27.
48. Nakamura, T., et al., Roles of IL-4 and IFN-gamma in stabilizing the T helper cell type 1 and 2 phenotype. J Immunol, 1997. 158(6): p. 2648-53.
49. Dong, C., TH17 cells in development: an updated view of their molecular identity and genetic programming. Nat Rev Immunol, 2008. 8(5): p. 337-48.

References 113
50. Chatila, T.A., Regulatory T cells: key players in tolerance and autoimmunity. Endocrinol Metab Clin North Am, 2009. 38(2): p. 265-72, vii.
51. Jiang, H. and L. Chess, An integrated view of suppressor T cell subsets in immunoregulation. J Clin Invest, 2004. 114(9): p. 1198-208.
52. Piersma, S.J., M.J. Welters, and S.H. van der Burg, Tumor-specific regulatory T cells in cancer patients. Hum Immunol, 2008. 69(4-5): p. 241-9.
53. Munn, D.H. and A.L. Mellor, The tumor-draining lymph node as an immune-privileged site. Immunol Rev, 2006. 213: p. 146-58.
54. Thompson, E.D., et al., Tumor masses support naive T cell infiltration, activation, and differentiation into effectors. J Exp Med, 2010. 207(8): p. 1791-804.
55. Wang, H.Y., et al., Tumor-specific human CD4+ regulatory T cells and their ligands: implications for immunotherapy. Immunity, 2004. 20(1): p. 107-18.
56. Tan, W., et al., Tumour-infiltrating regulatory T cells stimulate mammary cancer metastasis through RANKL-RANK signalling. Nature, 2011. 470(7335): p. 548-53.
57. Zitvogel, L., et al., Immunological aspects of cancer chemotherapy. Nat Rev Immunol, 2008. 8(1): p. 59-73.
58. Zou, W., Immunosuppressive networks in the tumour environment and their therapeutic relevance. Nat Rev Cancer, 2005. 5(4): p. 263-74.
59. Lin, A., et al., Dendritic cells integrate signals from the tumor microenvironment to modulate immunity and tumor growth. Immunol Lett, 2010. 127(2): p. 77-84.
60. McDonnell, A.M., B.W. Robinson, and A.J. Currie, Tumor antigen cross-presentation and the dendritic cell: where it all begins? Clin Dev Immunol. 2010: p. 539519.
61. Bell, D., et al., In breast carcinoma tissue, immature dendritic cells reside within the tumor, whereas mature dendritic cells are located in peritumoral areas. J Exp Med, 1999. 190(10): p. 1417-26.
62. Iero, M., et al., Tumour-released exosomes and their implications in cancer immunity. Cell Death Differ, 2008. 15(1): p. 80-8.
63. Thery, C., M. Ostrowski, and E. Segura, Membrane vesicles as conveyors of immune responses. Nat Rev Immunol, 2009. 9(8): p. 581-93.
64. Gregory, C.D. and J.D. Pound, Cell death in the neighbourhood: direct microenvironmental effects of apoptosis in normal and neoplastic tissues. J Pathol, 2010. 223(2): p. 177-94.
65. Albert, M.L., Death-defying immunity: do apoptotic cells influence antigen processing and presentation? Nat Rev Immunol, 2004. 4(3): p. 223-31.
66. Burgdorf, S., et al., Spatial and mechanistic separation of cross-presentation and endogenous antigen presentation. Nat Immunol, 2008. 9(5): p. 558-66.
67. Zitvogel, L., O. Kepp, and G. Kroemer, Decoding cell death signals in inflammation and immunity. Cell, 2010. 140(6): p. 798-804.
68. Sims, G.P., et al., HMGB1 and RAGE in inflammation and cancer. Annu Rev Immunol, 2010. 28: p. 367-88.
69. Tesniere, A., et al., Immunogenic cancer cell death: a key-lock paradigm. Curr Opin Immunol, 2008. 20(5): p. 504-11.
70. Nowak, A.K., et al., Induction of tumor cell apoptosis in vivo increases tumor antigen cross-presentation, cross-priming rather than cross-tolerizing host tumor-specific CD8 T cells. J Immunol, 2003. 170(10): p. 4905-13.
71. Morelli, A.E. and A.W. Thomson, Tolerogenic dendritic cells and the quest for transplant tolerance. Nat Rev Immunol, 2007. 7(8): p. 610-21.
72. Panaretakis, T., et al., Mechanisms of pre-apoptotic calreticulin exposure in immunogenic cell death. Embo J, 2009. 28(5): p. 578-90.
73. van der Most, R.G., et al., Decoding dangerous death: how cytotoxic chemotherapy invokes inflammation, immunity or nothing at all. Cell Death Differ, 2008. 15(1): p. 13-20.
74. Feng, H., et al., Stressed apoptotic tumor cells stimulate dendritic cells and induce specific cytotoxic T cells. Blood, 2002. 100(12): p. 4108-15.
75. Soule, H.D., et al., A human cell line from a pleural effusion derived from a breast carcinoma. J Natl Cancer Inst, 1973. 51(5): p. 1409-16.
76. Exley, M.A., B. Wilson, and S.P. Balk, Isolation and functional use of human NKT cells. Curr Protoc Immunol, 2010. Chapter 14: p. Unit 14 11.

References 114
77. Deenick, E.K., A.V. Gett, and P.D. Hodgkin, Stochastic model of T cell proliferation: a calculus revealing IL-2 regulation of precursor frequencies, cell cycle time, and survival. J Immunol, 2003. 170(10): p. 4963-72.
78. Ryan, H.E., J. Lo, and R.S. Johnson, HIF-1 alpha is required for solid tumor formation and embryonic vascularization. EMBO J, 1998. 17(11): p. 3005-15.
79. Clausen, B.E., et al., Conditional gene targeting in macrophages and granulocytes using LysMcre mice. Transgenic Res, 1999. 8(4): p. 265-77.
80. Brawand, P., et al., Murine plasmacytoid pre-dendritic cells generated from Flt3 ligand-supplemented bone marrow cultures are immature APCs. J Immunol, 2002. 169(12): p. 6711-9.
81. Weigert, A., et al., Apoptotic cells promote macrophage survival by releasing the antiapoptotic mediator sphingosine-1-phosphate. Blood, 2006. 108(5): p. 1635-42.
82. Lauber, K., et al., Apoptotic cells induce migration of phagocytes via caspase-3-mediated release of a lipid attraction signal. Cell, 2003. 113(6): p. 717-30.
83. Segundo, C., et al., Surface molecule loss and bleb formation by human germinal center B cells undergoing apoptosis: role of apoptotic blebs in monocyte chemotaxis. Blood, 1999. 94(3): p. 1012-20.
84. Guerrero, M., et al., Discovery, design and synthesis of the first reported potent and selective sphingosine-1-phosphate 4 (S1P(4)) receptor antagonists. Bioorg Med Chem Lett, 2011. 21(12): p. 3632-6.
85. Qian, F., et al., Efficacy of levo-1-methyl tryptophan and dextro-1-methyl tryptophan in reversing indoleamine-2,3-dioxygenase-mediated arrest of T-cell proliferation in human epithelial ovarian cancer. Cancer Res, 2009. 69(13): p. 5498-504.
86. Mandapathil, M., et al., Increased ectonucleotidase expression and activity in regulatory T cells of patients with head and neck cancer. Clin Cancer Res, 2009. 15(20): p. 6348-57.
87. Eltzschig, H.K., et al., Endogenous adenosine produced during hypoxia attenuates neutrophil accumulation: coordination by extracellular nucleotide metabolism. Blood, 2004. 104(13): p. 3986-92.
88. Herr, B., et al., The supernatant of apoptotic cells causes transcriptional activation of hypoxia-inducible factor-1alpha in macrophages via sphingosine-1-phosphate and transforming growth factor-beta. Blood, 2009. 114(10): p. 2140-8.
89. Zimmermann, S.Y., et al., A novel four-colour flow cytometric assay to determine natural killer cell or T-cell-mediated cellular cytotoxicity against leukaemic cells in peripheral or bone marrow specimens containing greater than 20% of normal cells. J Immunol Methods, 2005. 296(1-2): p. 63-76.
90. Campanelli, R., et al., Human CD8 co-receptor is strictly involved in MHC-peptide tetramer-TCR binding and T cell activation. Int Immunol, 2002. 14(1): p. 39-44.
91. Albee, L., B. Shi, and H. Perlman, Aspartic protease and caspase 3/7 activation are central for macrophage apoptosis following infection with Escherichia coli. J Leukoc Biol, 2007. 81(1): p. 229-37.
92. Weis, N., et al., Heme oxygenase-1 contributes to an alternative macrophage activation profile induced by apoptotic cell supernatants. Mol Biol Cell, 2009. 20(5): p. 1280-8.
93. Hiasa, M., et al., GM-CSF and IL-4 induce dendritic cell differentiation and disrupt osteoclastogenesis through M-CSF receptor shedding by up-regulation of TNF-alpha converting enzyme (TACE). Blood, 2009. 114(20): p. 4517-26.
94. Briere, F., et al., Origin and filiation of human plasmacytoid dendritic cells. Hum Immunol, 2002. 63(12): p. 1081-93.
95. Dzionek, A., et al., Plasmacytoid dendritic cells: from specific surface markers to specific cellular functions. Hum Immunol, 2002. 63(12): p. 1133-48.
96. Jarrossay, D., et al., Specialization and complementarity in microbial molecule recognition by human myeloid and plasmacytoid dendritic cells. Eur J Immunol, 2001. 31(11): p. 3388-93.
97. Esashi, E. and S.S. Watowich, Dendritic cells: transcriptional control of plasmacytoid dendritic cell development by E2-2. Immunol Cell Biol, 2009. 87(1): p. 1-2.
98. Grouard, G., et al., The enigmatic plasmacytoid T cells develop into dendritic cells with interleukin (IL)-3 and CD40-ligand. J Exp Med, 1997. 185(6): p. 1101-11.
99. Smit, J.J., et al., The balance between plasmacytoid DC versus conventional DC determines pulmonary immunity to virus infections. PLoS One, 2008. 3(3): p. e1720.

References 115
100. Meier, A., et al., Sex differences in the Toll-like receptor-mediated response of plasmacytoid dendritic cells to HIV-1. Nat Med, 2009. 15(8): p. 955-9.
101. Su, A.I., et al., A gene atlas of the mouse and human protein-encoding transcriptomes. Proc Natl Acad Sci U S A, 2004. 101(16): p. 6062-7.
102. Takauji, R., et al., CpG-DNA-induced IFN-alpha production involves p38 MAPK-dependent STAT1 phosphorylation in human plasmacytoid dendritic cell precursors. J Leukoc Biol, 2002. 72(5): p. 1011-9.
103. Fernandez-Garcia, N.I., et al., 1alpha,25-Dihydroxyvitamin D3 regulates the expression of Id1 and Id2 genes and the angiogenic phenotype of human colon carcinoma cells. Oncogene, 2005. 24(43): p. 6533-44.
104. Nigten, J., et al., ID1 and ID2 are retinoic acid responsive genes and induce a G0/G1 accumulation in acute promyelocytic leukemia cells. Leukemia, 2005. 19(5): p. 799-805.
105. Barchet, W., et al., Virus-induced interferon alpha production by a dendritic cell subset in the absence of feedback signaling in vivo. J Exp Med, 2002. 195(4): p. 507-16.
106. Lu, R., P.A. Moore, and P.M. Pitha, Stimulation of IRF-7 gene expression by tumor necrosis factor alpha: requirement for NFkappa B transcription factor and gene accessibility. J Biol Chem, 2002. 277(19): p. 16592-8.
107. Greenway, A.L., et al., Selective production of interferon-alpha subtypes by cultured peripheral blood mononuclear cells and lymphoblastoid cell lines. Immunology, 1992. 75(1): p. 182-8.
108. Murdoch, C., M. Muthana, and C.E. Lewis, Hypoxia regulates macrophage functions in inflammation. J Immunol, 2005. 175(10): p. 6257-63.
109. Kunz, M. and S.M. Ibrahim, Molecular responses to hypoxia in tumor cells. Mol Cancer, 2003. 2: p. 23.
110. Jogi, A., et al., Human neuroblastoma cells exposed to hypoxia: induction of genes associated with growth, survival, and aggressive behavior. Exp Cell Res, 2004. 295(2): p. 469-87.
111. Rama, I., et al., Hypoxia stimulus: An adaptive immune response during dendritic cell maturation. Kidney Int, 2008. 73(7): p. 816-25.
112. Jantsch, J., et al., Hypoxia and hypoxia-inducible factor-1 alpha modulate lipopolysaccharide-induced dendritic cell activation and function. J Immunol, 2008. 180(7): p. 4697-705.
113. Rissoan, M.C., et al., Reciprocal control of T helper cell and dendritic cell differentiation. Science, 1999. 283(5405): p. 1183-6.
114. Reizis, B., Regulation of plasmacytoid dendritic cell development. Curr Opin Immunol, 2010. 22(2): p. 206-11.
115. Lofstedt, T., et al., Induction of ID2 expression by hypoxia-inducible factor-1: a role in dedifferentiation of hypoxic neuroblastoma cells. J Biol Chem, 2004. 279(38): p. 39223-31.
116. Jakubzick, C., et al., Lymph-migrating, tissue-derived dendritic cells are minor constituents within steady-state lymph nodes. J Exp Med, 2008. 205(12): p. 2839-50.
117. Lau-Kilby, A.W., et al., Interleukin-2 inhibits FMS-like tyrosine kinase 3 receptor ligand (flt3L)-dependent development and function of conventional and plasmacytoid dendritic cells. Proc Natl Acad Sci U S A, 2011. 108(6): p. 2408-13.
118. Zhang, J., et al., Characterization of Siglec-H as a novel endocytic receptor expressed on murine plasmacytoid dendritic cell precursors. Blood, 2006. 107(9): p. 3600-8.
119. Blasius, A.L., et al., Siglec-H is an IPC-specific receptor that modulates type I IFN secretion through DAP12. Blood, 2006. 107(6): p. 2474-6.
120. Swiecki, M. and M. Colonna, Unraveling the functions of plasmacytoid dendritic cells during viral infections, autoimmunity, and tolerance. Immunol Rev, 2010. 234(1): p. 142-62.
121. Borsellino, G., et al., Expression of ectonucleotidase CD39 by Foxp3+ Treg cells: hydrolysis of extracellular ATP and immune suppression. Blood, 2007. 110(4): p. 1225-32.
122. Battaglia, A., et al., Metastatic tumour cells favour the generation of a tolerogenic milieu in tumour draining lymph node in patients with early cervical cancer. Cancer Immunol Immunother, 2009. 58(9): p. 1363-73.
References 116
123. Weigert, A., et al., Cleavage of sphingosine kinase 2 by caspase-1 provokes its release from apoptotic cells. Blood, 2010. 115(17): p. 3531-40.
124. Wetter, J.A., C. Revankar, and B.J. Hanson, Utilization of the Tango beta-arrestin recruitment technology for cell-based EDG receptor assay development and interrogation. J Biomol Screen, 2009. 14(9): p. 1134-41.
125. Lob, S., et al., Inhibitors of indoleamine-2,3-dioxygenase for cancer therapy: can we see the wood for the trees? Nat Rev Cancer, 2009. 9(6): p. 445-52.
126. Williams, C.A., R.A. Harry, and J.D. McLeod, Apoptotic cells induce dendritic cell-mediated suppression via interferon-gamma-induced IDO. Immunology, 2008. 124(1): p. 89-101.
127. Gee, K., et al., The IL-12 family of cytokines in infection, inflammation and autoimmune disorders. Inflamm Allergy Drug Targets, 2009. 8(1): p. 40-52.
128. Shevach, E.M., Mechanisms of foxp3+ T regulatory cell-mediated suppression. Immunity, 2009. 30(5): p. 636-45.
129. Linnemann, C., et al., Adenosine regulates CD8 T-cell priming by inhibition of membrane-proximal T-cell receptor signalling. Immunology, 2009. 128(1 Suppl): p. e728-37.
130. Kisley, L.R., et al., Genetic ablation of inducible nitric oxide synthase decreases mouse lung tumorigenesis. Cancer Res, 2002. 62(23): p. 6850-6.
131. Marmey, B., et al., CD14 and CD169 expression in human lymph nodes and spleen: specific expansion of CD14+CD169- monocyte-derived cells in diffuse large B-cell lymphomas. Hum Pathol, 2006. 37(1): p. 68-77.
132. Yun, Z., Q. Lin, and A.J. Giaccia, Adaptive myogenesis under hypoxia. Mol Cell Biol, 2005. 25(8): p. 3040-55.
133. Spits, H., et al., Id2 and Id3 inhibit development of CD34(+) stem cells into predendritic cell (pre-DC)2 but not into pre-DC1. Evidence for a lymphoid origin of pre-DC2. J Exp Med, 2000. 192(12): p. 1775-84.
134. Leibowitz, S.B. and P.W. Kantoff, Differentiating agents and the treatment of prostate cancer: Vitamin D3 and peroxisome proliferator-activated receptor gamma ligands. Semin Oncol, 2003. 30(5): p. 698-708.
135. Shin, H.J., et al., A Pilot Study of Priming With Granulocyte Macrophage Colony-Stimulating Factor Plus All-trans Retinoic Acid Combined With Remission Induction Chemotherapy in Patients With Acute Myeloid Leukemia. Am J Clin Oncol, 2009.
136. Trottier, C., et al., Retinoids inhibit measles virus through a type I IFN-dependent bystander effect. Faseb J, 2009.
137. Ishiguro, A., et al., Id2 expression increases with differentiation of human myeloid cells. Blood, 1996. 87(12): p. 5225-31.
138. Jeong, H.J., et al., Hypoxia-induced IL-6 production is associated with activation of MAP kinase, HIF-1, and NF-kappaB on HEI-OC1 cells. Hear Res, 2005. 207(1-2): p. 59-67.
139. Baccala, R., et al., TLR-dependent and TLR-independent pathways of type I interferon induction in systemic autoimmunity. Nat Med, 2007. 13(5): p. 543-51.
140. Liu, K., et al., In vivo analysis of dendritic cell development and homeostasis. Science, 2009. 324(5925): p. 392-7.
141. Smyth, M.J., Type I interferon and cancer immunoediting. Nat Immunol, 2005. 6(7): p. 646-8.
142. Reizis, B., et al., Plasmacytoid dendritic cells: recent progress and open questions. Annu Rev Immunol, 2011. 29: p. 163-83.
143. Zeelenberg, I.S., et al., Antigen localization controls T cell-mediated tumor immunity. J Immunol, 2011. 187(3): p. 1281-8.
144. Nagorsen, D., et al., Tumor-infiltrating macrophages and dendritic cells in human colorectal cancer: relation to local regulatory T cells, systemic T-cell response against tumor-associated antigens and survival. J Transl Med, 2007. 5: p. 62.
145. von Bergwelt-Baildon, M.S., et al., CD25 and indoleamine 2,3-dioxygenase are up-regulated by prostaglandin E2 and expressed by tumor-associated dendritic cells in vivo: additional mechanisms of T-cell inhibition. Blood, 2006. 108(1): p. 228-37.
146. Curiel, T.J., Tregs and rethinking cancer immunotherapy. J Clin Invest, 2007. 117(5): p. 1167-74.
147. Matheoud, D., et al., Cross-presentation by dendritic cells from live cells induces protective immune responses in vivo. Blood, 2010. 115(22): p. 4412-20.

References 117
148. Schuler, G., Dendritic cells in cancer immunotherapy. Eur J Immunol, 2010. 40(8): p. 2123-30.
149. Weigert, A., et al., Cleavage of sphingosine kinase 2 by caspase-1 provokes its release from apoptotic cells. Blood, 2010. 115(17): p. 3531-40.
150. Gude, D.R., et al., Apoptosis induces expression of sphingosine kinase 1 to release sphingosine-1-phosphate as a "come-and-get-me" signal. Faseb J, 2008. 22(8): p. 2629-38.
151. Gu, Y., et al., Epithelial cell extrusion requires the sphingosine-1-phosphate receptor 2 pathway. J Cell Biol, 2011. 193(4): p. 667-76.
152. Rivera, J., R.L. Proia, and A. Olivera, The alliance of sphingosine-1-phosphate and its receptors in immunity. Nat Rev Immunol, 2008. 8(10): p. 753-63.
153. Weigert, A., et al., Sphingosine kinase 2 deficient tumor xenografts show impaired growth and fail to polarize macrophages towards an anti-inflammatory phenotype. Int J Cancer, 2009. 125(9): p. 2114-21.
154. Brecht, K., et al., Macrophages programmed by apoptotic cells promote angiogenesis via prostaglandin E2. Faseb J, 2011.
155. Collison, L.W., et al., IL-35-mediated induction of a potent regulatory T cell population. Nat Immunol, 2010. 11(12): p. 1093-101.
156. Yoshida, H., M. Nakaya, and Y. Miyazaki, Interleukin 27: a double-edged sword for offense and defense. J Leukoc Biol, 2009. 86(6): p. 1295-303.
157. Kamiya, S., et al., An indispensable role for STAT1 in IL-27-induced T-bet expression but not proliferation of naive CD4+ T cells. J Immunol, 2004. 173(6): p. 3871-7.
158. Schneider, R., et al., IL-27 increases the proliferation and effector functions of human naive CD8+ T lymphocytes and promotes their development into Tc1 cells. Eur J Immunol, 2011. 41(1): p. 47-59.
159. Sindrilaru, A., et al., Wound healing defect of Vav3-/- mice due to impaired {beta}2-integrin-dependent macrophage phagocytosis of apoptotic neutrophils. Blood, 2009. 113(21): p. 5266-76.
160. Murugaiyan, G., et al., IL-27 is a key regulator of IL-10 and IL-17 production by human CD4+ T cells. J Immunol, 2009. 183(4): p. 2435-43.
161. Kochetkova, I., et al., IL-35 stimulation of CD39+ regulatory T cells confers protection against collagen II-induced arthritis via the production of IL-10. J Immunol, 2010. 184(12): p. 7144-53.
162. Batten, M., et al., Cutting edge: IL-27 is a potent inducer of IL-10 but not FoxP3 in murine T cells. J Immunol, 2008. 180(5): p. 2752-6.
163. Laroni, A., et al., IL-27 imparts immunoregulatory function to human NK cell subsets. PLoS One, 2011. 6(10): p. e26173.
164. Schenk, U., et al., Purinergic control of T cell activation by ATP released through pannexin-1 hemichannels. Sci Signal, 2008. 1(39): p. ra6.
165. Hausler, S.F., et al., Ectonucleotidases CD39 and CD73 on OvCA cells are potent adenosine-generating enzymes responsible for adenosine receptor 2A-dependent suppression of T cell function and NK cell cytotoxicity. Cancer Immunol Immunother, 2011.
166. Shiow, L.R., et al., CD69 acts downstream of interferon-alpha/beta to inhibit S1P1 and lymphocyte egress from lymphoid organs. Nature, 2006. 440(7083): p. 540-4.
167. Liu, G., et al., The receptor S1P1 overrides regulatory T cell-mediated immune suppression through Akt-mTOR. Nat Immunol, 2009. 10(7): p. 769-77.
168. Sancho, D., M. Gomez, and F. Sanchez-Madrid, CD69 is an immunoregulatory molecule induced following activation. Trends Immunol, 2005. 26(3): p. 136-40.
169. Chen, M.L., et al., Regulatory T cells suppress tumor-specific CD8 T cell cytotoxicity through TGF-beta signals in vivo. Proc Natl Acad Sci U S A, 2005. 102(2): p. 419-24.
170. Vogler, I. and A. Steinle, Vis-a-vis in the NKC: genetically linked natural killer cell receptor/ligand pairs in the natural killer gene complex (NKC). J Innate Immun, 2011. 3(3): p. 227-35.
171. Le, D.T., D.M. Pardoll, and E.M. Jaffee, Cellular vaccine approaches. Cancer J, 2010. 16(4): p. 304-10.
172. Gregory, C.D. and J.D. Pound, Cell death in the neighbourhood: direct microenvironmental effects of apoptosis in normal and neoplastic tissues. J Pathol, 2011. 223(2): p. 177-94.

References 118
173. Apetoh, L., et al., Toll-like receptor 4-dependent contribution of the immune system to anticancer chemotherapy and radiotherapy. Nat Med, 2007. 13(9): p. 1050-9.
174. Zitvogel, L., O. Kepp, and G. Kroemer, Immune parameters affecting the efficacy of chemotherapeutic regimens. Nat Rev Clin Oncol, 2011. 8(3): p. 151-60.
Publications 119
10 Publications
Weigert A, Sekar D, Brüne B., Tumour-associated macrophages as targets
for tumour immunotherapy, Immunotherapy. 2009. Jan;1(1):83-95.
Weigert A, Schiffmann S, Sekar D, Ley S, Menrad H, Werno C, Grosch S,
Geisslinger G, Brüne B., Sphingosine kinase 2 deficient tumour xenografts
show impaired growth and fail to polarize macrophages towards an anti-
inflammatory phenotype. Int J Cancer 2009. Nov 1;125(9):2114-21.
Sekar D, Brüne B, Weigert A., Technical advance: Generation of human pDC
equivalents from primary monocytes using Flt3-L and their functional
validation under hypoxia. J Leukoc Biol. 2010 Aug;88(2):413-24.
Sekar D, Hahn C, Brüne B, Roberts E, Weigert A., Apoptotic tumour cells
induce IL-27 release from human DC to activate regulatory T cells that
express CD69 and attenuate cytotoxicity.Eur J Immunol. accepted, ahead of
print: DOI: 10.1002/eji.201142093.
Weigert A, Weichand B, Sekar D, Essler S, Dehne N, Brüne B, HIF-1 is a
negative regulator of plasmacytoid DC development in vitro and in vivo,
submitted.
Meeting abstract (selected for oral presentation)
Sekar D, Brüne B, Weigert A., Dendritic cell and subsequent effector T cell
polarization by dying tumour cells. 1st International Conference of
Immunotherapy, Institut Curie, Paris, France. 17-18 Oct 2008

Acknowledgements 120
11 Acknowledgements
I am greatly indebted to my PhD supervisor Prof. Brüne, for supporting me in
these 4 years of research study by providing the top notch lab equipments,
reagents, scientific advice and constructive criticism. Transparent modes of
working and professionalism under Prof. Brüne made it easier to devote all
the energy on the projects itself.
I am thankful to have worked under the guidance of Dr. Andreas Weigert who
is encouraging, creative and critical. His constantly driven scientific-radar and
the thirst to get the projects to completion helped immensely.
Getting an education in a foreign country is a challenging enterprise. I am
deeply thankful to my colleagues in Biochemie Eins for the support and
patience during the countless times I stuttered with understanding Deutsch or
the etiquettes. Not to forget the Kuchen/Torte that many colleagues brought to
the lab. Each Schicht, was a sugar-pump for moving the PhD days forward.
To my best friends.
To my family.
To my sister: For that thing which is my life’s constant.
To my love.
To sea shells.
Curriculum Vitae 121
12 Curriculum Vitae Name: Divya Sekar
Date of birth: 19.01.1985
Place of birth: Shimoga, India
Nationality: Indian
Marital status: Married
Address: Cranachstrasse 15
60596 Frankfurt/Main
Tel: 069-47890830
Mail: [email protected]
Academic profile: 1999 - 00 X, Senior secondary school, India
2001 - 02 XII, Higher secondary school, India
2002 – 05 BSc Biochemistry, University of Madras, 6th rank
2005 – 06 Project Saraswathi All India Scholarship
to Support Post Graduate studies
2005 – 07 MSc Microbial gene technology,
Madurai Kamaraj University, India
Oct 2007 – Sep 2009 Frankfurt International Research school
for translational medicine,
stipend for PhD studies
Oct 2007 – Sep 2011 PhD Research student, Institut für Biochemie I
(Prof. Bernhard Brüne), Klinikum der Johann
Wolfgang Goethe-Universität, Frankfurt am Main

Ehrenwörtliche Erklärung 122
13 Ehrenwörtliche Erklärung
Ich erkläre ehrenwörtlich, dass ich die dem Fachbereich Medizin der Johann
Wolfgang Goethe-Universität Frankfurt am Main zur Promotionsprüfung
eingereichte Arbeit mit dem Titel
“Impact of tumour microenvironmental factors on dendritic cell differentiation
and function”
Im Institut für Biochemie I – Pathobiochemie unter Betreuung und Anleitung
von Prof. Dr. Bernhard Brüne ohne sonstige Hilfe selbst durchgeführt und bei
der Abfassung der Arbeit keine anderen als die in der Dissertation
angeführten Hilfsmittel benutzt habe.
Ich habe bisher an keiner in- oder ausländischen Universität ein Gesuch um
Zulassung zur Promotion eingereicht. Die vorliegende Arbeit wurde bisher
nicht als Dissertation eingereicht.
Teile der vorliegenden Arbeit wurden in den folgenden Publikationsorganen
veröffentlicht:
J Leukoc Biol. 2010 Aug;88(2):413-24.
Eur J Immunol. ahead of print, DOI: 10.1002/eji.201142093.
Frankfurt am Main, den