impact of trade marketing activities and salesmen behavior on customer satisfaction: the mediating...
TRANSCRIPT

1
IMPACT OF TRADE MARKETING ACTIVITIES AND SALESMEN
BEHAVIOR ON CUSTOMER SATISFACTION: THE MEDIATING ROLE
OF SUPPLY UNCERTAINTY AND PRODUCT CONTAMINATION
Muhammad Khyzer Bin Dost
Superior University, Lahore, Pakistan (Corresponding Author, [email protected])
Prof. Dr. Ch. Abdual Rehman
Superior University, Lahore, Pakistan
Shahram Gilaninia Associate Professor , Department of Industrial Management
Islamic Azad University, Rasht Branch, Rasht, Iran
Muhammad Wasim Akram
PhD Scholar - Faculty of Management, Universiti Teknologi Malaysia
Najam ul Zia
Superior University, Lahore, Pakistan
Abstract With the monetary heightening of a nation and healthy life trends, the role of dairy product
manufacturing companies is too vital in this development. In a hyper-focused market of Pakistan,
organization involved in dairy business is confronted with difficulties of holding the current and
attracting the new customers. The purpose of the research is to take the opinions of distinctive
people groups in Lahore city of Pakistan about the salesman service and product quality in different
segments and classifications of the outlets. A sample of 500 retailers of the Lahore city is selected
on convenience basis. To accomplish the fundamental objective of the research, the researcher of
the paper created survey intended for dairy handler retailers. After a long analysis we have found
that four variables assuming critical part in order to make satisfied customer. In this manner,
customer satisfaction is the key for dairy companies to stay alive in competition. The purpose of
this study is to explain the relationship of trade marketing activities and salesmen behavior with
the customer satisfaction in packed milk industry of Pakistan. This is to find out about the trade
marketing activities which are more common and to explain the relationship of trade marketing
and salesmen behavior on customer satisfaction with the mediating role of supply uncertainty and
product contamination.
Key words: Salesman Behavior, Trade marketing, Product Contamination, Supply Uncertainty.
1. INTRODUCTION In today’s challenging environment, companies are totally based on customer retention because
customers are the key factors of companies’ success that is why customer satisfaction is playing
an important role to sustain competitive advantage in the market. It is extremely critical and vital
that organizations have the capacity to hold a devoted base of customers. Organizations perform
different activities in order to satisfy its customers. All the trade marketing activities including
POS promotions, sales promotions and category display are the budding segments where the
companies are investing now days. To accomplish and to enhance the business sector and benefit
2
positions, organizations need to plan their techniques and approaches towards expanding customer
satisfaction levels (Mistry, 2013). More than 58 years ago, Hovland et al. (1957) introduced the
theory about satisfaction where it is considered that satisfaction is the variance between expected
and perceived performance. Organizations over the globe have recognized the centrality of
customer satisfaction and of creating and keeping up enduring association with their customers as
two vital parameters prompting expanded business benefits. In the meantime, a few organizations
are encountering rising level of retail customer dismay. Exploration proposes that customer
dissatisfaction is still the real reason of association customers' change to different organizations
(Manrai and Manrai, 2007).
The objective of this study is to explore the relationship of trade marketing activities and salesman
behavior with customer satisfaction through the lens of market orientation theory under the
mediating role of supply uncertainty and product contamination. Given study looks for exactly
based upon hypothetical and useful bits of knowledge into the contact connecting trade marketing
activities and salesman behavior for customer satisfaction. This is proposed that the in-store
activities and ethical behavior of front line salesman can ensure to achieve the desired level of
customer satisfaction. According to Community Dairy Development Program (Mumtaz, 2011) by
Tetra Pak, Pakistan is the fourth biggest milk maker in the world with a yearly production of more
than 33 billion liters of milk. There are more than 56 million cows and buffaloes and 10 million
smallholder cultivating families supplying more than 60 million consumers. In spite of the fact
that Pakistani producers have tough competition with producers from all around the world, the
dairy segment confronts various issues. Manufacturers of milk products are facing challenges in
meeting customer satisfaction. The quality of fresh milk supply to consumers has become doubtful.
Due to quality and supply uncertainty, the dairy industry of Pakistan is trending towards packed
milk supply rather than open raw milk. Product placement on shelves of different outlet channels
is the major confront which are facing by companies. Organizations need to control over supply
uncertainty and product contamination and counter these market challenges by offering best
marketing activities with the supporting role of expert and ethical salesmen.
1.1 Rationale of Study
Customer satisfaction has been considered the heart of victory in today’s highly competitive world
of organizations. It has a major contribution in sustainable profit growth of any organization.
Customer satisfaction has become the top key performance indicator for evaluating performance
of the organizations. It is the key to stay alive in competition (Saha et al., 2015). One of the goes
up against the organizations and private organizations confront however is to gauge buyers'
satisfaction in a steady manner, to altogether anticipate customers' buy expectations and business
acknowledgment of the items (Luan and Sudhir, 2010). The marketing activities which are
performed inside the stores involved shelf display, sales promotions and point of sales material.
These all are trade marketing activities which are performed to satisfy and attract the customers.
Point of sales promotion is an important trade marketing tool which has a direct impact on
purchasing behavior of consumers (Jones and Smith, 2011). Homburg et al. (2011a) found that
trade promotions like on pack coupons over trade increase sales volumes of the manufacturers.
These couponing schemes stimulate the repeat purchase of the products. A repeat sale always
occurs when a customer gets satisfied. This research was conducted by keeping whole sales price
unchanged and preventing stock piling activity from retailer side. Some of these assumptions can
be relaxed for future research examinations in more realistic conditions. Customer satisfaction has
become the top key performance indicator for evaluating performance of the organizations.
Similarly customer satisfaction is an important key performance indicator in tetra pack milk

3
industry of Pakistan. Many researchers found the effects of trade marketing activities and sales
man behavior on customer satisfaction. But this area of study is still under research with mediating
of supply uncertainty and product contamination specifically in dairy industry of Pakistan. This
study fabricates a literature to formulate a theoretical system evaluating the customer satisfaction
as a potential source for new bits of knowledge. Although there is a huge amount of literature
exists on customer satisfaction but a limited literature has explained the customer satisfaction in
context of product contamination and supply uncertainty. The proposed research will help to
identify and fix the problems of retailers regarding supply uncertainty and product contamination.
1.2 Significance of Study
This study is conducted using theoretical lens of “Market Orientation Theory”. Although
many studies have been conducted with the help of this theoretical lens but still this is an
under research area.
This study will help the producers of dairy product to make policy which will help in
satisfying the customers.
The findings of this study will help the practitioners to gain the competitive advantage over
competition
The trade category managers will know the actual activities which are more effective in
changing customer behaviors. So they will choose those activities which are experienced
as more concentrated.
This study significantly gives direction in policy implications. Managers and directors at
all levels get benefits from findings of this study.
1.3 Research Aims & Objectives
1.3.1 Aim/Purpose
The main purpose of this study is to find the impact of trade marketing activities and
salesman behavior on customer satisfaction in milk industry by using lens of market
orientation theory under mediating effect of product contamination and supply uncertainty.
1.3.2 Objectives
To recognize the role of trade marketing activities and salesman behaviors in satisfying
customers of dairy industry.
To know the effect of supply uncertainty and product contamination on customer
satisfaction.
1.4 Research Question & Hypothesis
1.4.1 Research Main Question
Do the trade marketing activities and salesman behavior impact on customer satisfaction with
mediating effects of supply uncertainty and product contamination?
1.4.2 Sub Questions
Do trade marketing activities have a significant impact on customer satisfaction?
Do trade marketing activities have a significant impact on supply uncertainty?
Do trade marketing activities have a significant impact on product contamination?
Does salesman behavior have a significant impact on customer satisfaction?
Does salesman behavior have a significant impact on supply uncertainty?
Does salesman behavior have a significant impact on product contamination?
Does supply uncertainty have a significant impact on customer satisfaction?
Does product contamination have a significant impact on customer satisfaction?
4
Does supply uncertainty mediate the relationship of trade marketing and customer
satisfaction?
Does supply uncertainty mediate the relationship of salesman behavior and customer
satisfaction?
1.5 Hypothesis
H1: There is a relationship between trade marketing activities and customer satisfaction.
H2: There is a relationship between trade marketing activities and product contamination.
H3: There is a relationship between trade marketing activities and supply uncertainty.
H4: There is a relationship between salesman behavior and customer satisfaction.
H5: There is a relationship between salesman behavior and product contamination.
H6: There is a relationship between salesman behavior and supply uncertainty.
H7: There is a relationship between product contamination and customer satisfaction.
H8: There is a relationship between supply uncertainty and customer satisfaction.
H9: Supply uncertainty mediates the relationship of trade marketing activities and customer
satisfaction.
H10: Product contamination mediates the relationship of salesman behavior and customer
satisfaction.
2. LITERATURE REVIEW 2.1 Theoretical Perspective
This study will utilize the market orientation theory to analyze the factors that affect the customer
satisfaction.
2.1.1 Market Orientation Theory
"The significance of the market orientation develop that surfaced in the field is basically
a more exact and operational perspective of the initial two mainstays of the marketing idea
customer center and facilitated marketing" (Kohli and Jaworski, 1990 p. 3).
Market orientation thinks that it is establishes in the marketing concept. Initially created and
enunciated in the 1950s and 1960s, the marketing concept holds that (an) all regions of the firm
ought to keep up a customer center, (b) every marketing activity ought to be composed, and (c)
that long haul benefits, not simply deals, ought to be the hierarchical objective. At the very heart
of the marketing concept is the thought of customer center, of which customer detecting (i.e., the
ID of customer needs) and customer satisfaction (i.e., giving products and administrations which
will satisfy the needs and needs of customers) are key components. Market orientation's
association with the marketing concept is genuinely direct. In particular, throughout the decades,
and as the marketing concept turned into a focal fundamental of marketing thought, the term
market orientation came to allude to the execution of the marketing concept (Lafferty and Hult
2001). Subsequently, a market oriented firm is one which has embraced the marketing concept
(Shapiro 1988; Kohli and Jaworski 1990). Despite the fact that this basic stage for characterizing
market orientation is not without its commentators, the truth of the matter is that the lion's share
of meanings of market orientation are profoundly implanted in the marketing concept.
The second approach which has additionally held a prevailing position in the marketing writing is
that of Narver and Slater (1990) whose beginning examination showed up in the October 1990
issue of the Journal of Marketing. In particular, Narver and Slater (1990) initially characterized
market orientation as "the way of life that most adequately and proficiently makes the essential
practices for the production of unrivaled worth for purchasers and, accordingly, ceaseless
predominant execution for the business". They then explained on this conceptualization by
5
belligerence that market orientation comprises of five segments: customer orientation, competitor
orientation, between practical co appointment, a long haul center, and a benefit center. Narver and
Slater (1990) likewise gave a portrayal of their measuring instrument for market orientation. Over
the course of the years, various specialists, quick to test a wide mixed bag of hypothetical issues,
have embraced Narver and Slater's (1990) conceptualization and estimation methodology (Farrell
2000).
2.2 Customer satisfaction
In theory, more satisfaction should be joined with upgraded thing purchasing intentions or
steadfastness (Mittal & Kamakura, 2004), nonetheless, assessments found in normal business
segment test studies or audits are not by and large related with measures of procurement intention
or behavior. Examination recommends that fulfilled customer is a crucial essential for business
accomplishment (Crick and Spencer, 2011). Characteristics of product qualities that are presented
by affiliation focus the height of satisfying customer point (Khan & Afsheen, 2012). Customer
happiness can be segmented similarly as meeting the customers' longings to the degree parameters
connected with satisfaction (Malik & Ghaffor, 2012). Giese and Cote (2000) note that all
implications of customer satisfaction have three general parts: first part is a purchaser satisfaction
which is a reaction (vivacious or subjective), second part is the reaction relates to a specific center
(needs, thing, use experience, and so forward.), third part is the reaction happens at a specific time
(after utilization, after decision, in light of amassed experience, and so on.). Customer satisfaction
has been depicted as a positive excited state coming to fruition as an examination's consequence
of all parts of an association's working relationship with another firm (Anderson and Narus, 1984).
In the setting of relationship promoting, customer satisfaction is the way that prompts entire
arrangement customer support in light of the way that unsatisfied customers have high rate of
exchanging (Lin & Wu, 2011). As demonstrated by Zairi (2000) the finishes of accomplishing
inward needs is called satisfaction. If products or organization satisfies the needs and enthusiasm
of customer he will transform into a tried and true customer and thusly will incorporate customer
estimation of affiliation. Most of the scientists observed that administration quality is the ancestor
of customer satisfaction (Bedi, 2010). Mistry and Kumar (2013) in his examination paper found
that customers give most lifted centrality to reliability estimation. Inside of that quality estimation
they give more focus on how organizations fulfill their surety and how they indicate eagerness to
do work. From examination it was observed that a customer gives second centrality to
responsiveness of agents. It included distinctive criteria like, quickness in giving administration,
readiness to help customers and so on. Customer gives third inclination to certification variable, it
incorporate criteria like wellbeing of trade, consistency in administration and so forth.
2.3 Factors Influencing Trade Marketing Activities:
2.3.1 Sales Promotions:
Sales promotion is the key segment of marketing strategies for buyers' products and
services all around the world (Esfahani & Jafarzadeh, 2012).The study by Omotayo (2011)
expressed that customer have such a large number of decision like item size, shading, plan, quality
and cost and so forth., so producers ought to address the customers' issues and take choice to given
sales promotion on products and services. As indicated by Shahriar & Tahmores (2011), there is
no doubt that sales promotion has imperative part in this innovatively propelled world. The
supporter of brand advancing announces that sales promotions are a loathsome thing since they
don't add to the brand building required for future achievement and point of preference (Dawes
2004). The issue faced by most fast moving customer products (FMCG) supports, regardless, is
that they work in a space jumbled with sales promotions especially cost based promotions.

6
Customers are scarcely to return to unique expenses after a nonstop refund period in diners (Yao
et al., 2014).The fragment of bundled shopper merchandise spends around $176 billion on
exchange promotions yearly (Kantar Retail, 2010). This constitutes around 56 percent of the entire
total spent on an extensive variety of promotions (Kantar Retail, 2010). Prior composing (Poddar
and Donthu 2011) proposes, on the other hand, that the exchange promotion extent is really under
examination, especially contrasted and its offer in the general publicizing blend spending plan
arrangement
2.3.2 Point of Sale Promotions:
Point of sale (POS), or point of procurement (POP), alludes to publicizing special materials at the
point where a buy will be made. POS advertising is seen as a key method for item advertisers, with
exploration demonstrating that 66% of all buys result from choices made while in the store, and
90% of retail location supervisors reviewed in the USA concurred that POS materials sell products
(Dibb et al. 2001). It is understood that buyers react all the more positively to advancements where
the premium is given at the season of sale and when the estimation of the premium is highlighted
(d’Astous and Jacob 2002), and value reductions that are encircled as giving "free" product options
are seen more positively than routine rebates (Chandra & Grewal, 2001).
2.3.3 Category Display:
Some research utilized value strategy to consider products location (Murray et al., 2010)
and investigated the item category allocation problem (Chen 2012). The past studies (Cardinali
and Bellini, 2014) demonstrate that the spatial competition between store groups (inter-format) is
turning out to be more extreme than the inside store configurations (intra-format). Cil (2012)
utilized purchasing affiliation estimations to make a matrix and connected the multi-dimensional
scale system to show an arrangement of products in store spaces.
2.4 Salesperson Behavior:
2.4.1 Ethical & Listening Behavior:
Moral sales promotion for customers assumes a huge part in business (Yusuf, 2010). At
the point when a salesperson's conduct is seen as moral, the organization is additionally seen as
moral (Lin 2012) and a salesperson with great ethics could set up a good organization with the
customer, consequently getting the consumer loyalty and trust (Alrubaiee, 2012).If the salesperson
gives right data, then the customer will feel more fulfilled by the service and the trust and
fulfillment will be trailed by listening in on others' conversations suggestions. Unethical sales
conduct as saw by the customer is portrayed as a short run salespersons direct that enables him/her
to pick up at the customer's expense (Alrubaiee 2012). There is neither an inside and out recognized
importance of business morals, nor a standard measure that allows an individual or event to be
reliably judged as good or corrupt (Chen, 2008).
2.4.2 Customer Orientation:
In today's focused offering environment, organizations are deliberately activating to set up
manageable points of interest in the commercial center through viable relationship advertising and
customer orientation techniques (Ramani and Kumar 2008). It is all around bolstered that customer
arranged practices assume a basic part in affecting purchaser view of trust in B2B sales cooperation
(Newell et al., 2011). Customer orientation is a bunch of benefits in sales which points on customer
needs and fulfillment considering these as the need of a salesperson (Drucker, 1994). Homburg et
al., (2011) define useful customer orientation as an arrangement of errand related practices went
for helping customers settle on agreeable purchase choices. A salesperson's customer orientation
concentrates on customer needs, the thought of customer hobbies by giving helpful customer

7
arrangements, and the conclusion of sales through a communitarian treatment of any protests that
may be put by a customer (Homburg et al., 2011).
2.5 Supply Uncertainty:
The key impact of uncertainty on firm conduct is that uncertainty mists judgment and darkens
importance (Carson et al., 2006). In uncertain situations, firms dismiss their imminent future.
Consequently, given unpredictability and uncertainty in the nature and conduct of the
organization's outer surroundings (Carson et al., 2006), organizations are prone to settle on less
unconventional choices and take after more preservationist and wary practices (Bierly et al., 2014).
They may turn out to be less sure about the results of their conduct in the wake of problematic and
lamentable occasions in unverifiable situations. As an essential component of the uncertainty in
organization's surroundings, supply uncertainty alludes to the unconventionality and variability of
changes in and the general way of a company's supply chain (Elmaghraby 2000). It has noteworthy
ramifications on inputs, operations, and yields of supply chain operations. Case in point, supplier
business dangers, creation limit unpredictability in the supply market, quality, and conveyance
issues, and changes in innovation and item outline could be seen as significant wellsprings of
supply uncertainty (Zsidisin et al., 2000). They could tie up firm assets and debilitate the endeavors
of accomplishing strength through inventive conduct. Firms working in an uncertain environment
could pick conservative activities, for example, buffering and spanning (Bode et al. 2011) and take
after a sit back and watch strategy. Two or three studies investigate the estimation of supply
information. Some of these consider circumstances where information, for instance, era yield,
available supplier utmost, and lead time, is imparted forward in the supply chain to the objective
that customers can diminish supply uncertainty (Altug and Muharremoglu 2011). Another kind of
supply uncertainty develops in close circle supply chains, where there may be uncertainty
concerning the sum, quality, and timing of thing returns.
2.6 Product Contamination:
Surfaces of apparatus utilized for treatment of sustenance and refreshment are commonly ruined
by microorganisms, despite in the wake of cleaning and sterilization procedure (Marouani et al.,
2010). These polluting microorganisms show up as follower microorganisms or as more whimsical
structures called biofilms. A biofilm is portrayed as a sessile microbial social event delineated by
security to an in number surface and by generation of a framework that conceals the bacterial cells
and merges extracellular polysaccharides (EPSs), proteins and DNA (Bjarnsholt et al., 2008).
Adherent spores and creatures, and besides biofilms, can be seen on every surface of sustenance
industry plants, for example, stainless steel surfaces, floors, belts, or adaptable seals (Kumar and
Anand 1998). Understanding Biofilms is a basic supply of microbial sullying that has gotten to be
generally little thought in the dairy business is the microbial biofilm. In milk stockpiling and dairy
get prepared operations, and in like manner in diverse other present day frameworks, other than
being available in the harsh material, most microorganisms are joined with surfaces (Mittelman
1998). The relationship of "starting" microorganisms with following progress of biofilms in milk
taking care of circumstances is a potential wellspring of pollution of completed items that may
abbreviate the time of sensible usability or enable transmission of ailments (Palmer et al., 2010).
2.7 THEORETICAL FRAMEWORK

8
3. RESEARCH METHODOLOGY For this study, the deductive methodology is chosen in which we are going to confirm that trade
marketing activities and salesman behavior will fundamentally affect the customer satisfaction. So
the most suitable methodology for this study is deductive methodology in which analyst means to
Customer
Satisfaction
Supply
Uncertainty
Product
Contamination
Sales Promotion
POS Promotion
Category Display
Ethical
Behavior
Listening
Behavior
Customer
Orientatio
Salesman
Behavior
Trade
Marketing

9
test the pre-set suppositions. And, positivism is picked as philosophical approach to check
hypothesis by gathering the data from respondents.
3.1 Research Methods
This study will utilize the quantitative strategy on the grounds that researchers have expected that
trade marketing instruments and salesman behavior have critical effect on customer satisfaction
with mediating part of product contamination and supply uncertainty in dairy industry of Pakistan
and at whatever point analysts’ mean to test or confirm a study, quantitative technique is useful
and prompted system.
3.2 Sample
Consequently 500 people were come to (that were retailers of dairy handlers and were requested
to fill the reviews) out of which 391 respondents have completed their surveys and returned back
to the producer. For this study, respondents were picked by applying a testing method which is
known as 'convenience examining'. Surveys were hand passed on to those respondents and were
assembled after the productive satisfaction by the respondents.
3.3 Respondent rate Accomplishment rate of these structures were 78.2% as these structures were filled absolutely. 391
surveys were gotten pull out of 500 which is genuinely a not all that awful number and mirror a
reality of respondents to address the issue determined in the examination's objective.
3.4 Data collection
To accomplish the goal of this examination, a review structure was planned containing 45
statements to check the opinion of retailers of dairy handler outlets. With the assistance of that
questionnaire, researchers have gathered the perspective of representatives particularly concerning
the effect of trade marketing instruments and salesman behavior and mediating part of supply
uncertainty and product contamination on customer satisfaction.
3.5 Data Presentation
Study used Principal Component Analysis (PCA) on each variables (sales promotion, POS
material, category display, ethical behavior, listening behavior, empathic listening, customer
orientation, supply uncertainty, product contamination, customer satisfaction). Construct validity
(Convergent and discriminate validity), handling plant examination was used utilizing Principal
Component Analysis (PCA) with varimax turn procedure. The purpose behind KMO and Barlett's
test of sphericity is to look at that whether the data is suitable for component examination. KMO
Measure of test adequacy decides the nature of relationship however the Bartlett's Test of
Sphericity Chi-square implies the orthogonality of parts of a develop Assembling plant
examination is used to accumulate the tremendous number of things into minimal number of things
of uncorrelated variables to revise the comprehension of many-sided wonders. In the present study
incorporates nine intentional variables i.e. POS promotion, category display, Sales promotion,
ethical behavior, sympathetic listening, supply uncertainty, product contamination and customer
satisfaction. Measured variables are shown in squares and inactive in circles. The variables are in
like manner isolated in two exogenous and Endogenous variables. The beginning stage in directing
SEM is to set up a relationship between picked Endogenous and Exogenous variables by building
up the relationship with the help of single and twofold head jolts. The exogenous variables are
shown in Circles and Endogenous variables are exhibited in squares as indicated by the essential
of AMOS (Analysis of Moment Structures) programming.
4 .DATA ANALYSIS
10
Table 1 Demographic profile of respondents
Respondent Demographics Frequency %
Age (N = 391)
25-30
31-35
36-40
41-45
46-50
51 years and above
27
42
38
60
75
149
7
11
10
15
19
38
Gender (N = 391)
Male
Female
391
0
100
0
Income(N=391)
PKR. 30,000 – PKR. 50,000
PKR. 51,000 – PKR. 70,000
PKR. 71,000 – PKR. 100,000
PKR. 101,000 and Above
123
220
15
33
31
56
4
9
Qualification (N = 391)
Under Graduation
Graduation
Masters
Mphil
PHD
292
84
05
0
0
75
23
2
0
0
Shop Classification(N=391)
Departmental Store
General Store
Bakery
Pan shop
Patro Marts
124
236
14
9
8
32
60
4
2
2
Source: own calculation using IBM SPSS Statistics 20.0
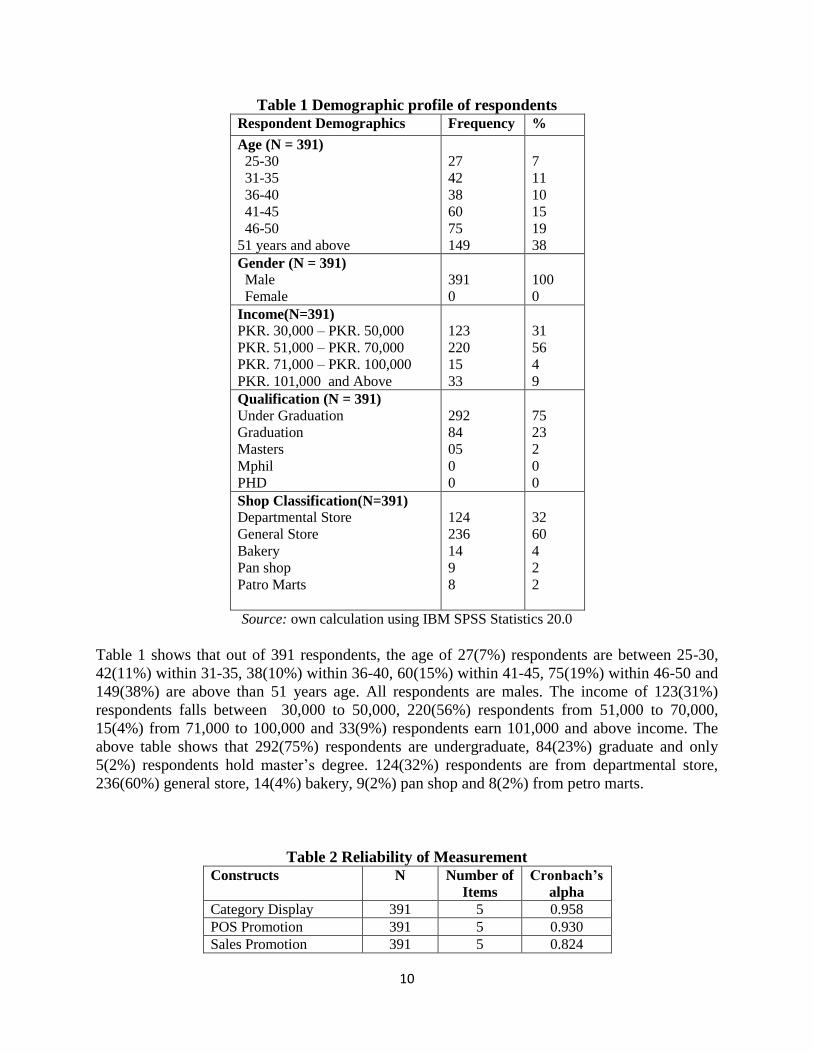
Table 1 shows that out of 391 respondents, the age of 27(7%) respondents are between 25-30,
42(11%) within 31-35, 38(10%) within 36-40, 60(15%) within 41-45, 75(19%) within 46-50 and
149(38%) are above than 51 years age. All respondents are males. The income of 123(31%)
respondents falls between 30,000 to 50,000, 220(56%) respondents from 51,000 to 70,000,
15(4%) from 71,000 to 100,000 and 33(9%) respondents earn 101,000 and above income. The
above table shows that 292(75%) respondents are undergraduate, 84(23%) graduate and only
5(2%) respondents hold master’s degree. 124(32%) respondents are from departmental store,
236(60%) general store, 14(4%) bakery, 9(2%) pan shop and 8(2%) from petro marts.
Table 2 Reliability of Measurement
Constructs N Number of
Items
Cronbach’s
alpha
Category Display 391 5 0.958
POS Promotion 391 5 0.930
Sales Promotion 391 5 0.824
11
Empathetic Listening 391 5 0.791
Ethical Behavior 391 5 0.870
Customer Orientation 391 5 0.810
Product Contamination 391 5 0.920
Supply Uncertainty 391 5 0.731
Customer Satisfaction 391 5 0.777
Over all 391 45 0.821
Source: own calculation using IBM SPSS Statistics 20.0
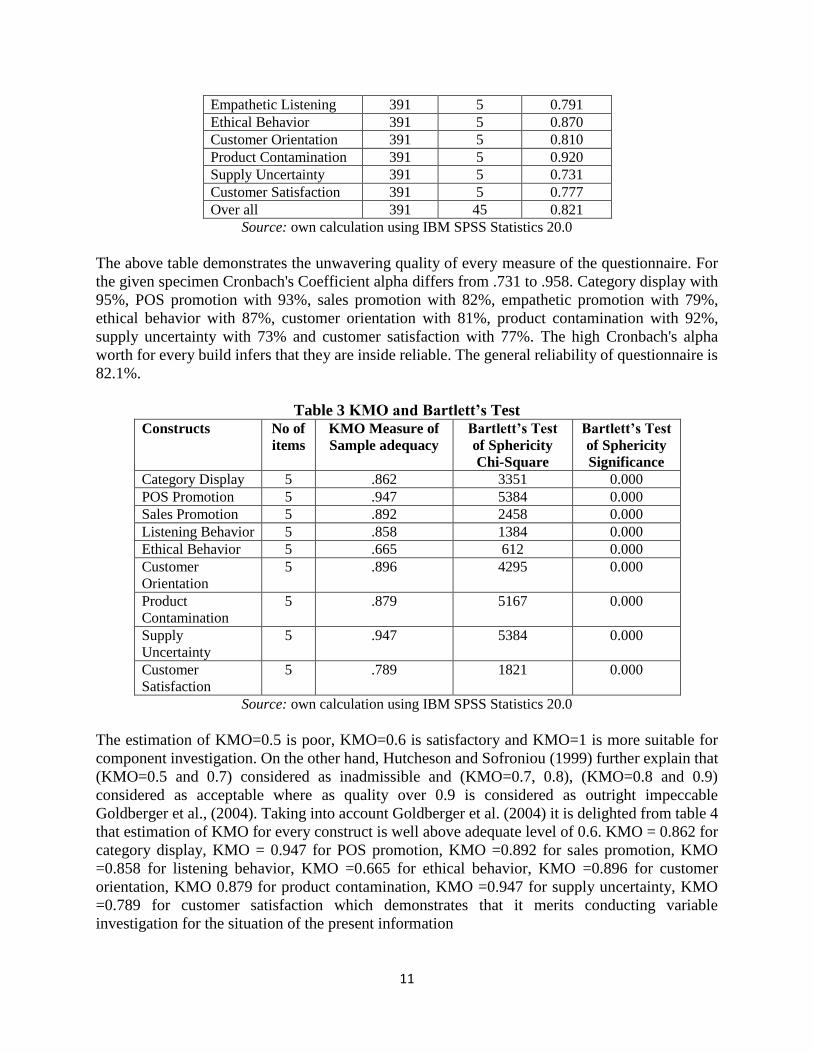
The above table demonstrates the unwavering quality of every measure of the questionnaire. For
the given specimen Cronbach's Coefficient alpha differs from .731 to .958. Category display with
95%, POS promotion with 93%, sales promotion with 82%, empathetic promotion with 79%,
ethical behavior with 87%, customer orientation with 81%, product contamination with 92%,
supply uncertainty with 73% and customer satisfaction with 77%. The high Cronbach's alpha
worth for every build infers that they are inside reliable. The general reliability of questionnaire is
82.1%.
Table 3 KMO and Bartlett’s Test
Constructs No of
items
KMO Measure of
Sample adequacy
Bartlett’s Test
of Sphericity
Chi-Square
Bartlett’s Test
of Sphericity
Significance
Category Display 5 .862 3351 0.000
POS Promotion 5 .947 5384 0.000
Sales Promotion 5 .892 2458 0.000
Listening Behavior 5 .858 1384 0.000
Ethical Behavior 5 .665 612 0.000
Customer
Orientation
5 .896 4295 0.000
Product
Contamination
5 .879 5167 0.000
Supply
Uncertainty
5 .947 5384 0.000
Customer
Satisfaction
5 .789 1821 0.000
Source: own calculation using IBM SPSS Statistics 20.0
The estimation of KMO=0.5 is poor, KMO=0.6 is satisfactory and KMO=1 is more suitable for
component investigation. On the other hand, Hutcheson and Sofroniou (1999) further explain that
(KMO=0.5 and 0.7) considered as inadmissible and (KMO=0.7, 0.8), (KMO=0.8 and 0.9)
considered as acceptable where as quality over 0.9 is considered as outright impeccable
Goldberger et al., (2004). Taking into account Goldberger et al. (2004) it is delighted from table 4
that estimation of KMO for every construct is well above adequate level of 0.6. KMO = 0.862 for
category display, KMO = 0.947 for POS promotion, KMO =0.892 for sales promotion, KMO
=0.858 for listening behavior, KMO =0.665 for ethical behavior, KMO =0.896 for customer
orientation, KMO 0.879 for product contamination, KMO =0.947 for supply uncertainty, KMO
=0.789 for customer satisfaction which demonstrates that it merits conducting variable
investigation for the situation of the present information
12
Table 4 Eigen values and total variance explained
Constructs
Components
Initial Eigenvalues
Total
% of
variance
explained
Cumulative
% of variance
explained
Category Display Comp 1 3.426 68.522 68.522
POS Promotion Comp 1 2.521 63.770 63.770
Sales Promotion Comp 1 2.432 71.335 71.335
Empathetic Listening Comp 1 8.341 73.641 73.641
Ethical Behavior Comp 1 3.931 77.432 77.432
Customer
Orientation
Comp 1 4.677 45.743 45.743
Product
Contamination
Comp 1 3.152 72.029 72.029
Supply Uncertainty Comp 1 2.764 86.164 86.164
Customer
Satisfaction
Comp 1 5.837 63.250 63.250
Source: own calculation using IBM SPSS Statistics 20.0
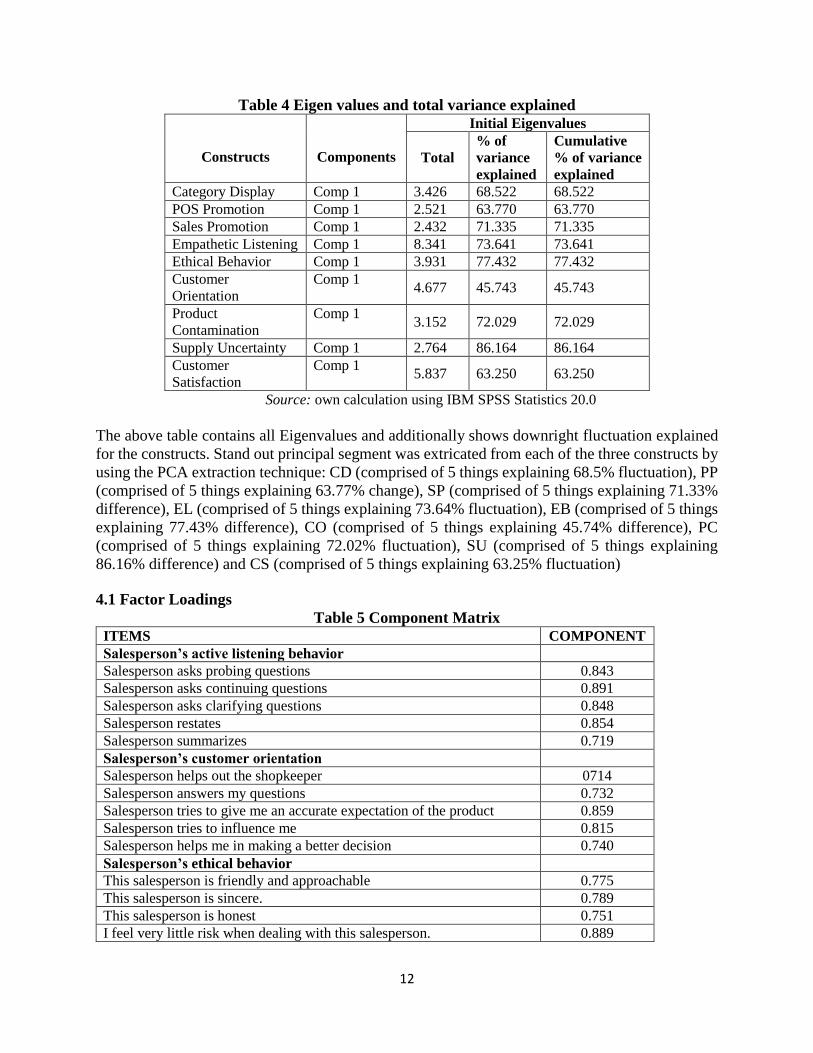
The above table contains all Eigenvalues and additionally shows downright fluctuation explained
for the constructs. Stand out principal segment was extricated from each of the three constructs by
using the PCA extraction technique: CD (comprised of 5 things explaining 68.5% fluctuation), PP
(comprised of 5 things explaining 63.77% change), SP (comprised of 5 things explaining 71.33%
difference), EL (comprised of 5 things explaining 73.64% fluctuation), EB (comprised of 5 things
explaining 77.43% difference), CO (comprised of 5 things explaining 45.74% difference), PC
(comprised of 5 things explaining 72.02% fluctuation), SU (comprised of 5 things explaining
86.16% difference) and CS (comprised of 5 things explaining 63.25% fluctuation)
4.1 Factor Loadings
Table 5 Component Matrix
ITEMS COMPONENT
Salesperson’s active listening behavior
Salesperson asks probing questions 0.843
Salesperson asks continuing questions 0.891
Salesperson asks clarifying questions 0.848
Salesperson restates 0.854
Salesperson summarizes 0.719
Salesperson’s customer orientation
Salesperson helps out the shopkeeper 0714
Salesperson answers my questions 0.732
Salesperson tries to give me an accurate expectation of the product 0.859
Salesperson tries to influence me 0.815
Salesperson helps me in making a better decision 0.740
Salesperson’s ethical behavior
This salesperson is friendly and approachable 0.775
This salesperson is sincere. 0.789
This salesperson is honest 0.751
I feel very little risk when dealing with this salesperson. 0.889
13
I would purchase the offering of this salesman again 0.869
Sales promotion in Trade Marketing Activities
Sales promotion attract consumers 0.812
Contents of the sales promotion attract consumers 0.721
Color scheme of Sales promotion attracts viewers 0.752
Sales promotion provoke consumer to purchase 0.814
Advertisement slogan at the sales promotion creates attraction 0.831
POS promotion in Trade Marketing Activities
Merchandise arrangement is attractive 0.842
The presentation of merchandising is creative and unique. 0.753
Color coordination of POS creates an appealing store atmosphere 0.729
The POS offers useful and accurate information. 0.783
Store front spurs clients to enter the store 0.751
Category display in Trade Marketing Activities
Windows showcase is attractive to the point that it drives clients to the
store
0.821
Things are displayed discernibly to draw the clients' consideration 0.853
Items setting arrangement is attractive 0.861
Shelf space for the category is appropriately occupied. 0.869
Shelf is neatly arranged 0.810
Product Contamination
Microbial contamination is a problem. 0.785
I often find the contamination problem in the product 0.826
I face product contamination problem in most cases. 0.899
I very often test the product for contamination. 0.867
I very often use anti-contaminated steps to stop contamination. 0.789
Supply Uncertainty
The suppliers reliably meet our requirements 0.710
The suppliers produce materials with reliable quality. 0.789
We have broad inspection of incoming discriminating materials from
suppliers.
0.891
We have a high dismissal rate of incoming discriminating materials from
suppliers.
0.832
The volume of demand is hard to anticipate 0.865
Customer Satisfaction
Overall I am satisfied with the company. 0.781
Company staff always understands our needs. 0.743
It is easy to contact to the company representatives. 0.881
The company always putts our interests first. 0.894
Staff of the company has the ability to do the best for me. 0.872
Source: own calculation using IBM SPSS Statistics 20.0
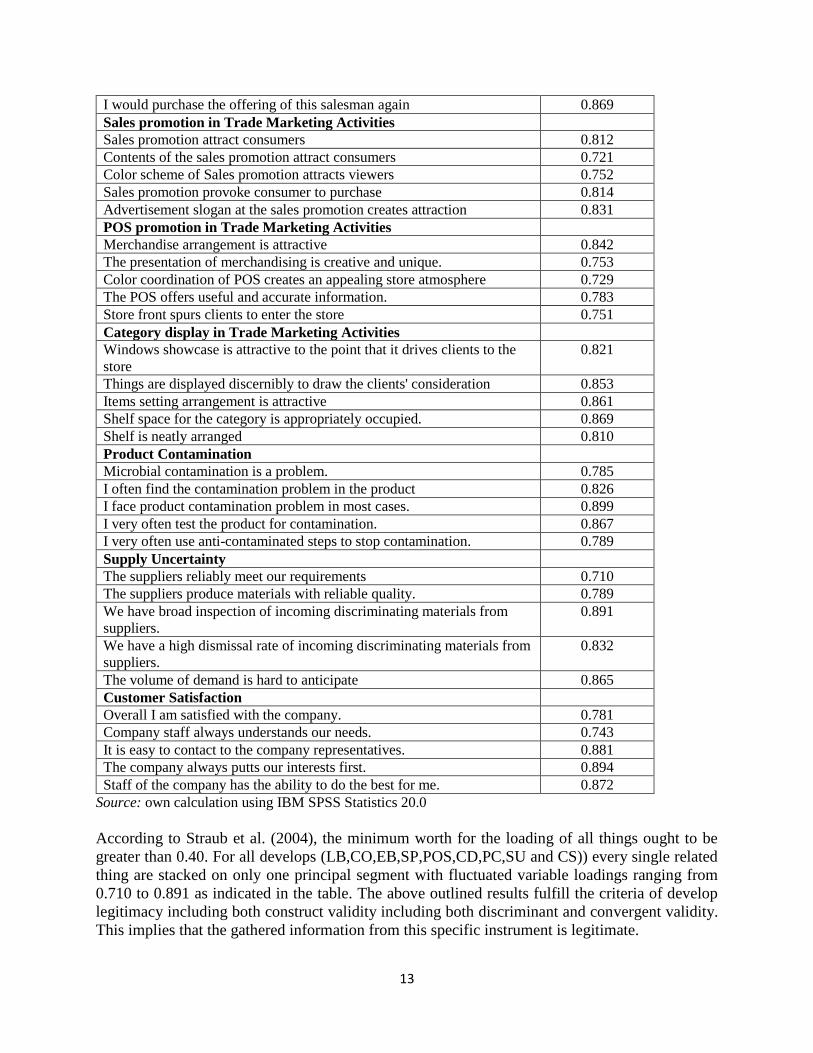
According to Straub et al. (2004), the minimum worth for the loading of all things ought to be
greater than 0.40. For all develops (LB,CO,EB,SP,POS,CD,PC,SU and CS)) every single related
thing are stacked on only one principal segment with fluctuated variable loadings ranging from
0.710 to 0.891 as indicated in the table. The above outlined results fulfill the criteria of develop
legitimacy including both construct validity including both discriminant and convergent validity.
This implies that the gathered information from this specific instrument is legitimate.

14
4.2 SEM Model
Computation of degrees of freedom (Default model) changab;e
Number of distinct sample moments: 455
Number of distinct parameters to be estimated: 61
Degrees of freedom (455 - 61): 334
Path Diagram
Figure 1 (Path Diagram)
Source: an output of using AMOS 16.0
Interpretation:
With a specific end goal to apply SEM. the principal step is to add to the way examination by
using AMOS programming. The variables are demonstrated in circles and squares according to
necessity of programming. The above way outline demonstrates the relationship between latent
and measured variables. The way graph additionally demonstrates that Recursive simultaneous
model is connected to affirm our examination model.
Applying SAM
Category_Display
Sales_Promotion
POS_Promotion
Ethical_Behavior
Supply_Uncertainty
Product_Contamination
Customer_Satisfaction
Trade Marketing
Activities
Salesman
Behavior
Customer_Orientation
Active_Listening_Behavior
1
1
E21
E3
1
E41
E1
1
E8
1
E5
1
E61
E71
E9
1
E10
1
E11
1

15
Figure 2 (Recursive simultaneous model)
Source: an output of using AMOS 16.0
Interpretation: In the above figure 2, the regressions coefficients are shown with one headed jolts which depict
the conformity in consumer loyalty (dependent variable) in light of a unit change in mediating
variables (supply uncertainty and product contamination) in the vicinity of independent variables
(exchange marketing exercises and sales representative conduct)
Table 6 Regression Weights
Category_Display
Sales_Promotion
POS_Promotion
Ethical_Behavior
Supply_Uncertainty
Product_Contamination
Customer_Satisfaction
Trade Marketing
Activities
Salesman
Behavior
Customer_Orientation
Active_Listening_Behavior
.50
.54
1.00
1.00
1.13
.98
.23
-.05
-.25
.46
.11
.73
.14
.12
.73
E21
.69
E3
1
-.07
E41
1.07
E1
1
.56
E8
1.44
E5
1
.29
E61
.45
E71
.95
E9
1
.78
E10
1
.59
E11
1
16
Estimate S.E. C.R. P
Supply Uncertainty Trade Marketing Activities .230 .049 4.729 ***
Product Contamination Trade Marketing Activities -.052 .046 -1.125 .261
Product Contamination Salesman Behavior -.253 .073 -3.448 ***
Supply Uncertainty Salesman Behavior .455 .070 6.538 ***
Customer’s Satisfaction Trade Marketing Activities .106 .041 2.599 .009
Customer’s Satisfaction Salesman Behavior .727 .074 9.805 ***
Customer’s Satisfaction
Supply Uncertainty (in the presence of
trade marketing activities and salesman
behavior)
.141 .047 3.003 .003
Customer’s Satisfaction
Product Contamination (in the presence of
trade marketing activities and salesman
behavior)
.122 .042 2.929 .003
Source: own calculation using IBM SPSS Statistics 20.0
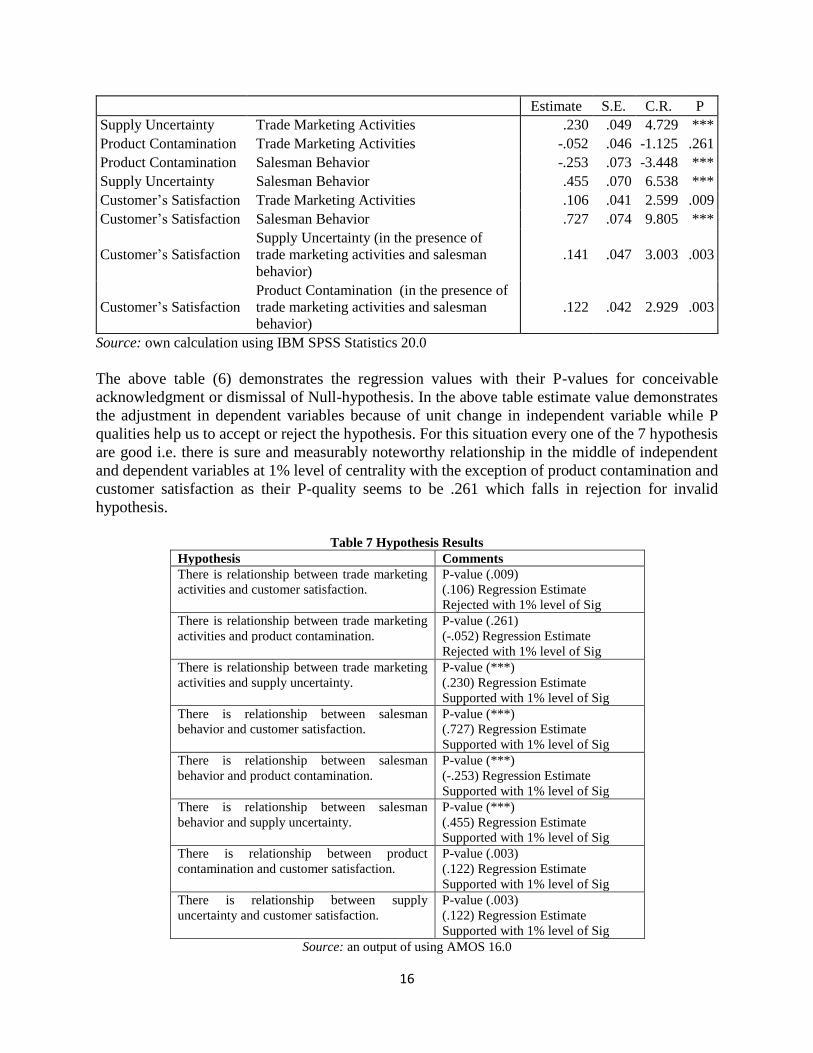
The above table (6) demonstrates the regression values with their P-values for conceivable
acknowledgment or dismissal of Null-hypothesis. In the above table estimate value demonstrates
the adjustment in dependent variables because of unit change in independent variable while P
qualities help us to accept or reject the hypothesis. For this situation every one of the 7 hypothesis
are good i.e. there is sure and measurably noteworthy relationship in the middle of independent
and dependent variables at 1% level of centrality with the exception of product contamination and
customer satisfaction as their P-quality seems to be .261 which falls in rejection for invalid
hypothesis.
Table 7 Hypothesis Results
Hypothesis Comments
There is relationship between trade marketing
activities and customer satisfaction.
P-value (.009)
(.106) Regression Estimate
Rejected with 1% level of Sig
There is relationship between trade marketing
activities and product contamination.
P-value (.261)
(-.052) Regression Estimate
Rejected with 1% level of Sig
There is relationship between trade marketing
activities and supply uncertainty.
P-value (***)
(.230) Regression Estimate
Supported with 1% level of Sig
There is relationship between salesman
behavior and customer satisfaction.
P-value (***)
(.727) Regression Estimate
Supported with 1% level of Sig
There is relationship between salesman
behavior and product contamination.
P-value (***)
(-.253) Regression Estimate
Supported with 1% level of Sig
There is relationship between salesman
behavior and supply uncertainty.
P-value (***)
(.455) Regression Estimate
Supported with 1% level of Sig
There is relationship between product
contamination and customer satisfaction.
P-value (.003)
(.122) Regression Estimate
Supported with 1% level of Sig
There is relationship between supply
uncertainty and customer satisfaction.
P-value (.003)
(.122) Regression Estimate
Supported with 1% level of Sig
Source: an output of using AMOS 16.0

17
4.3 Model Fit Summary
Table 8 CMIN (chi-square Min)
Model NPAR CMIN DF P CMIN/DF
Default model 23 139.602 22 .000 6.346
Source: an output of using AMOS 16.0
Rule: CMIN Minimum of discrepancy function; Smaller the batter
Interpretation: The above table demonstrates that default model have 23 perimeters with error
of 139.602with p value .000 which demonstrates that model is fit.
Table 9 Parsimony-Adjusted Measures
Model PRATIO PNFI PCFI
Default model .611 .535 .545
Source: an output of using AMOS 16.0
Rule:
PNFI (Parsimony-adjusted Normed Fit Index) 0=poor fit, close to 1= good
PCFI (Parsimony-adjusted Comparative Fit Index) 0=poor fit, close to 1= good
Interpretation: The above table demonstrates that default model have PNFI .535 and PCFI .545 which is more
noteworthy than .5 it shows model is normal good fit.
5. DISCUSSION After analyzing, the model shows the results that mediating variables i.e. supply uncertainty and
product contamination mediate the relationship of trade marketing activities and salesman
behavior with customer satisfaction. Supply uncertainty mediates customer satisfaction in the
presence of trade marketing activities (POS promotion, sales promotion and category display), if
supply uncertainty changes with one unit, customer satisfaction changes with 0.50 because of
supply uncertainty in the presence of trade marketing activities and salesman behavior.
Meanwhile, if product contamination changes with one unit, a change of -0.01 occurs in customer
satisfaction to trade marketing activities and salesman behavior. And there is statistically positive
relationship between supply uncertainty and product contamination and customer satisfaction.
This likewise underpins the thought that sales individual's service quality and customer satisfaction
is a social wonder and it must be grounded in a neighborhood social setting (Malhotra et al., 2005).
Results from this study demonstrate that customer orientation prompts more grounded
salesmanship abilities in salespeople, as they have higher level of learning around customer needs.
Findings demonstrate that a salesperson's customer orientation is predecessor to salesmanship
abilities and feeling regulation, and that these variables clarify some piece of the mediational
system through which customer salesman behavior impacts customer satisfaction. This proposal
is as opposed to a few contentions in writing. As said at the outset of this paper, the relationship
between a salesperson's customer orientation and execution has been recommended similar to a
direct straight one (Boles et al., 2001) to, all the more as of late, a curvilinear relationship
(Homburg, Muller and Klarmann, 2011). This study propels an option point of view on customer

18
orientation by proposing that the relationship between a salesperson's customer orientation and
customer satisfaction is best clarified through a mediational system. Late research has additionally
scrutinized the significance of customer orientation regarding its impact on results esteemed by
chiefs (Franke and Park, 2006). The finding that salespersons' behavior improves salesmanship
aptitudes and feeling regulation capacity bolsters the thought that behavior impacts sales execution
by upgrading a salesperson's fit with the requests and estimations of a sales work (Edwards, 1996).
With this line of thinking, this study proposes that behavior as a vital employment asset for the
salesperson is pertinent and has huge impact on execution results. Further examination concerning
word related and key drivers of behavior will reinforce this viewpoint (Dursun and Kilic, 2011).
The mediating variables (product contamination and supply uncertainty) effect the relationship of
trade marketing activities and sales man behavior with customer satisfaction. There is other thing
to be noted; when researchers took supply uncertainty and product contamination (mediating
variables) as independent and check the relationship between customer satisfaction (dependent
variable), the beta values (Estimate=0.50, -0.012 respectively) differ from main analysis which
support the analysis of mediation.
6. CONCLUSION & RECOMMENDATIONS 6.1 Conclusion
This Endeavor is directed to implore that what slants and parts have capacity to impact customer
satisfaction in the Tea-whitener and plain milk category handlers. Being a subjective investigation,
it was difficult to change the variables i.e. trade marketing exercises, salesman behavior, supply
uncertainty, product contamination and customer satisfaction. With the help of meticulously
sketched out self-administrated study, the investigator could get the obliged information and
concentrate the results with the help of latest quantifiable gadgets and procedures. Their eventual
outcomes of examination grew new substances before the specialist that variable like trade
marketing exercises and salesman behavior influence to be an essential settling to effect customer
satisfaction, besides, this variables exhibit the relationship mediating variables i.e. supply
uncertainty and product contamination. This needs thought of the concerned bodies that measures
are relied upon to take for the headway and begin among the retailers and customers. Examination
of the study directions to assume that trade marketing exercises and salesman behavior has a vital
impact on customer satisfaction, as examination of Saeed et al., (2011) showed there is a
discriminating impact of salesman behavior on customer satisfaction. The product contamination
seems, by all accounts, to be influencing the relationship of salesman behavior and customer
satisfaction. Pilkington and Chai (2008) upheld the significance of nature of products and
administrations on customer satisfaction and figured out that reliable customers for the most part
lie in category of customers who have utilized higher quality products. This suggests that better
nature of products tends to increment customers‟ steadfastness. Inquiries about by Chai and
partners (2009) demonstrate that nature of administrations to a customer is a standout amongst the
most vital elements in recognizing new customer needs and as we all know, the way to customer
satisfaction and faithfulness is furnishing the customers with their unfamiliar needs
6.2 Limitations and directions for further research
1. The examination is just led on retailer's perspective. The poll can be created for direct
customers to investigate the satisfaction level of direct shoppers too.
2. Further studies can likewise incorporate the variables like media promotion as autonomous
variable and merchant's business enthusiasm as interceding variables to definitely perceive
the customer buy expectations and satisfaction level.

19
3. Keeping in view the span of the populace the specimen size can be an inquiry for any
examines. The study is led in the center point of tea whitener purchaser and dairy
consumption point i.e. Lahore. While different urban communities particularly remote
territories are excluded in the exploration. Further specialists can incorporate the members
of differed urban communities to reach more precise discoveries and suggestions.
4. The study is directed in an invented set up with no impedance with the respondent with
close finished survey. Meeting routines can likewise use to further upgrade the legitimacy
and unwavering quality of the examination. The same number of shrouded estimations and
remarks can just be removed by testing into the issue through immediate and roundabout
inquiries of meetings.
5. Future scientists keeping in mind the end goal to build the more summed up results can
gather information from more urban areas and towns the nation over and contrast the
outcomes with get more profitable suggestions. The outcomes so accomplished will have
more substantial discoveries.
6. Another confinement of our examination is the survey method i.e. filling of the survey.
This strategy once in a while not able to give the genuine reaction the same number of
respondents just top off the poll without knowing the significance of the exploration and
understanding the significance of the inquiry. Along these lines meeting procedure has
ability to take care of this issue if not totally may be to some degree.
REFERENCES Anderson, J. C., and J. A. Narus. 1984. A model of the distributor’s perspective of distributor-manufacturer
working relationships. Journal of Marketing 48 (4): 62–74.
Alrubaiee, L. (2012). Exploring the relationship between ethical sales behavior, relationship quality, and
customer loyalty. International Journal of Marketing Studies, 4(1), p7.
Altug, M. S., & Muharremoglu, A. (2011). Inventory management with advance supply
information. International journal of production economics,129(2), 302-313.
Bedi, M. (2010), “An integrated framework for service quality, customer satisfaction and behavioural
responses in Indian banking industry: a comparison of public and private sector banks”, Journal of
Services Research, Vol. 10 No. 1, pp. 157-72.
Bierly, P., S. Gallagher, and J.-C.Spender. 2014. “Innovation Decision making in High-Risk Organizations:
A Comparison of the US and Soviet Attack Submarine Programs.” Industrial and Corporate Change
23 (3): 759–795.
Bjarnsholt T, Jensen PO, Fiandaca MJ, Pedersen J, Hansen CR, Andersen CB, Pressler T, Givskov M,
Hoiby N. 2008. Pseudomonas aeruginosa biofilms in the respiratory tract of cystic fibrosis patients.
Pediatr Pulmonol 44(6):547–58
Bode, C., S. M.Wagner, K. J. Petersen, and L. M. Ellram. 2011. “Understanding Responses to Supply Chain
Disruptions: Insights from Information Processing and Resource Dependence Perspectives.”
Academy of Management Journal4 (4): 833–856
Boles, J. S., Babin, B. J., Brashear, T. G., and Brooks, C. (2001), “ An examination of the relationships
between retail work environments, salesperson selling orientation customer orientation and job
performance”, Journal of Marketing Theory & Practice, 9(Summer), 1-13.
Cardinali MG and Bellini S 2014, “Interformat competition in the grocery retailing”, Journal of Retailing
and Consumer Services, No. 21, pp. 438-448.
20
Carson, S. J., A. Madhok, and T. Wu. 2006. “Uncertainty, Opportunism, and Governance: The Effects of
Volatility andAmbiguity on Formal and Relational Contracting.” The Academy of Management
Journal 49 (5): 1058–1077.
Chandra shekaran M, Rotte K, Grewal R. 2007. Satisfaction strength and customer loyalty. Journal of
Marketing Research 44(1): 153–163.
Chen, M. 2012. “Constructing a Model of Shelf Space Allocation in Product Categories.” In Proceedings
of 2012 IEEE Symposium on Robotics and Applications, 701–704, Kuala Lumpur.
Cil, I. 2012. “Consumption Universes Based Supermarket Layout through Association Rule Mining and
Multidimensional Scaling.” Expert Systems with Applications 39 (10): 8611–8625.
Crick, A. and Spencer, A. (2011), “Hospitality quality: new directions and new challenges”, International
Journal of Contemporary Hospitality Management, Vol. 23 No. 4, pp. 463-478.
d'Astous, A., & Jacob, I. (2002). Understanding consumer reactions to premium-based promotional
offers. European Journal of Marketing,36(11/12), 1270-1286.
Dawes, J. 2004. “Assessing the Impact of a Very Successful Price Promotion on Brand, Category and
Competitor Sales.” Journal of Product and Brand Management 13 (5): 303–314.
Dibb, S., & Simkin, L. (2001). Market segmentation: diagnosing and treating the barriers. Industrial
Marketing Management, 30(8), 609-625.
Drucker, P. F. (1994). The theory of the business. Harvard business review,72(5), 95-104.
Dursun, T. and Kilic, C. (2011), “Exploring occupational and strategic drivers of individual customer
orientation”, Journal of Business & Economics Research, 9 (5), 55-66.
Edwards, J. (1996), “An examination of competing versions of the person-environment
fit approach to stress”, Academy of Management Journal, 39(2), 292-339.
Elmaghraby, W. J. 2000. “Supply Contract Competition and Sourcing Policies.” Manufacturing & Service
OperationsManagement 2 (4): 350–373
Esfahani, A. N., & Jafarzadeh, M. (2012). Studying Impacts of Sales Promotion on Consumer’s
Psychographic Variables (Case study: Iranian Chain Stores at City of Kerman). International Jouranl
of Contemporary Research in Business, 3 (9), 1278- 1288.
Farrell, Mark A. (2000), “Developing a Market-Oriented Learning Organisation,” Australian Journal of
Management, 25 (2), 201-222.
Franke, G.R., & Park, J.-E. (2006). Salesperson adaptive selling behavior and customer orientation: A meta
analysis. Journal of Marketing Research, 43(4), 693–702.
Giese, J. L., and A. J. Cote. 2000. Defining consumer satisfaction. Academy of Marketing Science Review
Goldberger, J., Hinton, G. E., Roweis, S. T., & Salakhutdinov, R. (2004). Neighbourhood components
analysis. In Advances in neural information processing systems (pp. 513-520).
Homburg, C., Mu¨ller, M., & Klarmann, M. (2011). When does salespeople’s customer orientation lead to
customer loyalty? The differential effects of relational and functional customer orientation. Journal
of the Academy of Marketing Science, 39(6), 795–812.
Jones, S. C., & Smith, K. M. (2011). The effect of point of sale promotions on the alcohol purchasing
behaviour of young people in metropolitan, regional and rural Australia. Journal of Youth
Studies, 14(8), 885-900.
Khan, & Afsheen, (2012). Determinants of customer satisfaction in telecom industry, a study of telecom
industry Peshawar KPK Pakistan. Journal of Basic and Applied Scientific Research, 2(12), 12833-
12840.
Kumar CG, Anand SK. 1998. Significance of microbial biofilms in food industry: a review. Intl J Food
Microbiol 42(1–2):9–27.
Kantar Retail (2010), “2010 Trade Promotion Merchandising and Spending Industry Benchmarking
Study,” White Paper,Wilton, CT.
Kohli, Ajay K. and Bernard J. Jaworski (1990), “Market Orientation: The Construct, Research Propositions
and Managerial Implications,” Journal of Marketing, 54 (April), 1-18.
Lin, J. S. C., & Wu, C. Y. (2011). The role of expected future use in relationship-based service retention.
Managing Service Quality, 21(5), 535-551.
21
Luan, Y. J., & Sudhir, K. (2010). Forecasting marketing-mix responsiveness for new products. Journal of
Marketing Research, 47(3), 444-457.
Malhotra, N.K., Ulgado, F.M., Agarwal, J., Shainesh, G. and Wu, L. (2005), “Dimensions of
service quality in developed and developing economies: multi-country cross-cultural
comparisons”, International Marketing Review, Vol. 22 No. 3, pp. 256-78.
Malik, E., & Ghaffor, M. (2012). Impact of brand image, service quality and price on customer satisfaction
in Pakistan telecommunication sector. International Journal of Business and Social Science , 3(2),
123.
Mumtaz, M. K., Hemani, M. A., Hameed, N., Gulzar, S, “ (2011). A Community Dairy Development
Program” International Growth Center
Marouani-Gadri N, Firmesse O, Chassaing D, Sandris-Nielsen D, Arneborg N, Carpentier B. 2010.
Potential of Escherichia coli O157:H7 to persist and form viable but non-culturable cells on a food-
contact surface subjected to cycles of soiling and chemical treatment. Intl J Food Microbiol
144(1):96–103.
Mistry, S. and kumar, (2013) “Measuring Customer Satisfaction in Banking Sector: With Special Reference
to Banks of Surat City” Asia Pacific Journal of Marketing & Management vol.2 (7), July (2013),
p132. ISSN 2319-2836
Mittelman MW. 1998. Structure and functional characteristics of bacterial biofilms in fluid processing
operations. J Dairy Sci 81(10):2760–4.
Mittal, V., Kamakura, W. A., & Govind, R. (2004). Geographic patterns in customer service and
satisfaction: An empirical investigation. Journal of Marketing, 68(3), 48-62.
Murray, C. C., D. Talukdar, and A. Gosavi. 2010. “Joint Optimization of Product Price, Display Orientation
and helf-Space Allocation in Retail Category Management.” Journal of Retailing 86 (2): 125–136.
Homburg, C., Muller, M. and Klarmann, M. (2011) “When should the customer really be King? On the
optimum Level of salesperson customer orientation in sales encounters”, Journal of Marketing, 75(2),
55-74.
Narver, John C. and Stanley F. Slater (1990), “The Effect of Market Orientation on Business Profitability,”
Journal of Marketing, 54 (October), 20-35.
Newell, Stephen J., Joseph J. Belonax, Jr., Michael W. McCardle, and Richard W. Plank. 2011. “The Effect
of Personal Relationship and Consultative Task Behaviors on Buyer Perceptions of Salesperson
Trust, Expertise, and Loyalty.” Journal of Marketing Theory and Practice 19 (3): 307–316.
Omotayo, O. (2011). Sales Promotion and Consumer Loyalty: A Study of Nigerian Tecommunication
Industry. Journal of Competitiveness, 3 (4), 66-77.
Palmer JS, Flint SH, Schmid J, Brooks JD. 2010. The role of surface charge and hydrophobicity in the
attachment of Anoxybacillus flavithermus isolated from milk powder. J Ind Microbiol Biotechnol
37(11):1111–9.
Pilkington, A., & Chai, K. H. (2008). Research themes, concepts and relationships: A study of International
Journal of Service Industry Management (1990-2005). International Journal of Service Industry
Management, 19(1), 83-110.
Ramani, G., & Kumar, V. (2008). Interaction orientation and firm performance. Journal of
Marketing, 72(1), 27-45.
Saha, A., Hasan, K., & Uddin, M. (2015). A Conceptual Framework for Understanding Customer
Satisfaction in Banking Sector: The Mediating Influence of Service Quality and Organisational
Oath. American Journal Of Trade And Policy, 1(3), 39-48.
Shahriar, A., & Tahmores, H. (2011). Effect of Sales Promotion on Consumer Behavior Based on Culture.
African Journal of Business Management, 6 (1), 98-102.
Yusuf, J. B.(2010). Ethical Implications of Sales Promotion in Ghana: Islamic Perspective. Journal of
Islamic Marketing, 1 (3), 220-230.
22
Yao, C., Yiwen, C., & Xin, L. (2014, June). The factors affecting restaurant customers' return intention
after online group buying promotion. In 3rd International Conference on Computer Science and
Service System. Atlantis Press.
Zairi, M. (2000). Managing customer dissatisfaction through effective complaint management systems. The
TQM Magazine, 12(5), 331-335.
Zsidisin, G. A., A. Panelli, and R. Upton. 2000. “Purchasing Organization Involvement in Risk
Assessments, Contingency.