impact of tax reform on agricultural cooperatives entire ... · tax cuts and jobs act of 2017...
TRANSCRIPT

Impact of Tax Reform on Agricultural Impact of Tax Reform on Agricultural Cooperatives

Thanks to Our SponsorsThanks to Our Sponsors NCREA-210 Research Committee on Cooperatives
Cooperatives Community of Practice on eXtension
All of you who helped us get the word out!

HousekeepingHousekeeping We will send link to recording and any updates to materials
Please type your questions into the Chat Box and we will answer as many as time allows. We will email answers to any questions we do not get toquestions we do not get to
Let us know if you have information or additional resources to share with the group or if you would like to be added to g p your research group listserv to receive notice of future programs and information

Our PanelOur PanelBrian Briggeman, Director h A h C Cthe Arthur Capper Center,
Kansas State University
Phil Kenkel, Bill Fitzwater Cooperative ChairOklahoma State University
Keri Jacobs Iowa Institute of Keri Jacobs, Iowa Institute of Cooperatives Endowed ProfessorIowa State University

Tax Cuts and Jobs Act of 2017Tax Cuts and Jobs Act of 2017 Signed into law on December 22nd, 2017
Sweeping changes to the tax code Individuals
E Estates Foreign income And a lot moreAnd a lot more
The focus here is on the impact to agricultural cooperatives and their members In particular, four key changes are the focus in this presentation There are other items of interest for cooperatives such as limitation on
business interest and expensing depreciable assets business interest and expensing depreciable assets

Tax Cuts and Jobs Act of 2017Tax Cuts and Jobs Act of 2017 (1) Lower federal corporate tax rates Previously, federal corporate tax rates were up to 35% Now, they are 21% For cooperatives to receive this benefit they must generate For cooperatives to receive this benefit, they must generate
taxable income Patronage income distributed as non-qualified equity
Patronage income retained as unallocated equity
Non-patronage income

Tax Cuts and Jobs Act of 2017Tax Cuts and Jobs Act of 2017 (2) Elimination of the domestic production activities
deduction or DPAD DPAD was originally part of the American Jobs Creation Act of
2004 (Bush Tax Cuts)2004 (Bush Tax Cuts) Spur manufacturing job creation
Agricultural marketing cooperatives were able to use it Primarily grain marketing in the Midwest and Great Plains
Tax deduction that could be held at the cooperative level or passed through to patronsp g p The pass-through was used if the co-op could not use the entire deduction
or it benefitted the members due to differential tax rates

Tax Cuts and Jobs Act of 2017Tax Cuts and Jobs Act of 2017 (3) Creation of Section 199A Replacement for DPAD for cooperatives only Tax deduction for the cooperative and patron 20% deduction for qualified business income 20% deduction for qualified business income Grain, farm supply, equipment, and services to farmers…for all
agricultural cooperatives, not just grain marketing
Limited by the greater of 50% of W2 wages
25% of W2 wages plus 2.5% of qualified property of the cooperativeg p q p p y p

Tax Cuts and Jobs Act of 2017Tax Cuts and Jobs Act of 2017 (4) Lower member taxes Qualified patronage distributions 20% tax deduction on all qualified dividends (qualified patronage. i.e.
cash and qualified equity)q q y
Effectively lower member tax rate A Schedule F farmer in the 35% tax bracket would have an effective tax
rate on cash and qualified equity distributions of 28%rate on cash and qualified equity distributions of 28%
If per-unit retain payments are included as “qualified distributions from the cooperative” the impact on member taxes would be much greater. (We do not consider this potential effect in our simulation analysis)

Calculation of tax deductions for the Si l ti M d lSimulation ModelCooperative Deduction –Section 199A Patron DeductionSection 199A Patron Deduction
Qualified Business Income – Patronage Dividends
Cash Patronage Paid
+Qualified Retained PatronagegApplicable Deduction Amountx 20%Preliminary Deduction
+Qualified Retained Patronage
Applicable Deduction Amount
x 20%Preliminary Deduction
Limited by greater of:
Tax Deduction
50% all co-op W2 wagesor25% all co-op W2 wages PLUS p g2.5% qualified property

Hypothetical Grain and Farm Supply C tiCooperative $280M Total Sales – 55% grain
85% b b 85% member business Debt/asset = 24% 15 year equity revolving period15 year equity revolving period Allocated equity/total equity = 44% $4.7M wage expense (32% of gross margin, 1.6% of sales) Baseline tax rates: 41% corporate (35% federal + 6% state), 35%
member (federal, state and self employment) Calculate the member’s internal rate of return (IRR) which Ca cu ate t e e e s te a ate o etu ( ) w c
represents their rate of return from all cash patronage and redeemed equity over a 30 year life span of using the cooperative)

Base Line ResultsTable 1: Baseline 41% corporate tax 35% member tax rate
Cooperative's Year 1 C h fl
Cooperative's Year 1 T
Member Year 1 C h
Member Year 1 Af T C h
Member Allocated Equity to T l
ase e esu ts
1 Cash flow 1 Tax Cash Patronage After Tax Cash Flow
IRR Total Equity in Year 10
50% Cash 50% Qualified $ 4,523,660 $ 532,960 $ 3,683,057 $ 1,379,041 23.5% 68.9%
15% cash 85% nonqualified $ 4,523,660 $ 3,092,501 $ 1,123,333 $ 1,004,290 20.2% 78.4%
15% cash 85% unallocated $ 4,523,660 $ 3,092,501 $ 1,123,333 $ 1,004,290 16.3% 5.3%

Baseline: Member IRR23.5%
20.2%20 0%
25.0%
16.3%
15.0%
20.0%
10.0%
Baseline
5.0%
0.0%
50% Cash 50% Qualified 15% cash 85% nonqualified 15% cash 85% unallocated50% Cash 50% Qualified 15% cash 85% nonqualified 15% cash 85% unallocated

37 5% 37 2%40.0%
Baseline Compared with use of DPAD
37.5% 37.2%
35.0%
23.5%
23.5%
25.0%
30.0%
20.2%
16.3%
15.0%
20.0% Baseline
DPAD
5.0%
10.0%
0.0%
50% cash 50% Qualified 50% cash 50% nonqualfied 50% cash 50% unallocated
DPAD allowed the cooperative to maintain the qualified cash patronage rate,while issuing nonqualified or retaining unallocated equity and maintaining the samecash flow as in the baseline scenario.

35.0%
Tax Reform - No Section 199A at Cooperative Level
30.81% 31.34%30.39%
30.0%
20.0%
25.0%
15.0%
Baseline
Tax Reform
5.0%
10.0%
0.0%
54% cash 46% Qualified 35% cash 65% Nonqualified 35% unallocated 65% unallocated
• Lower tax on non-member business increases cash patronage with cooperativeLower tax on non member business increases cash patronage with cooperative• Cash flow is constant and allowed the cooperative to pay 35% cash with NQ or UE• Member receives 20% deduction on cash and qualified equity

Tax Reform with Section 199A
45.4% 44.6%45.0%
50.0%
34.8%
30.0%
35.0%
40.0%
20.0%
25.0% Baseline
Tax Reform with Section 199A
10.0%
15.0%
0.0%
5.0%
57.2% cash 42.8% Qualified 57.2% cash 42.8% Nonqualified 57.2% cash 42.8% unallocated
Section 199A eliminates taxation on non-member profits andallows same cash percentage with NQ and unallocated,with constant cash flow as in the baseline scenario
50.0%
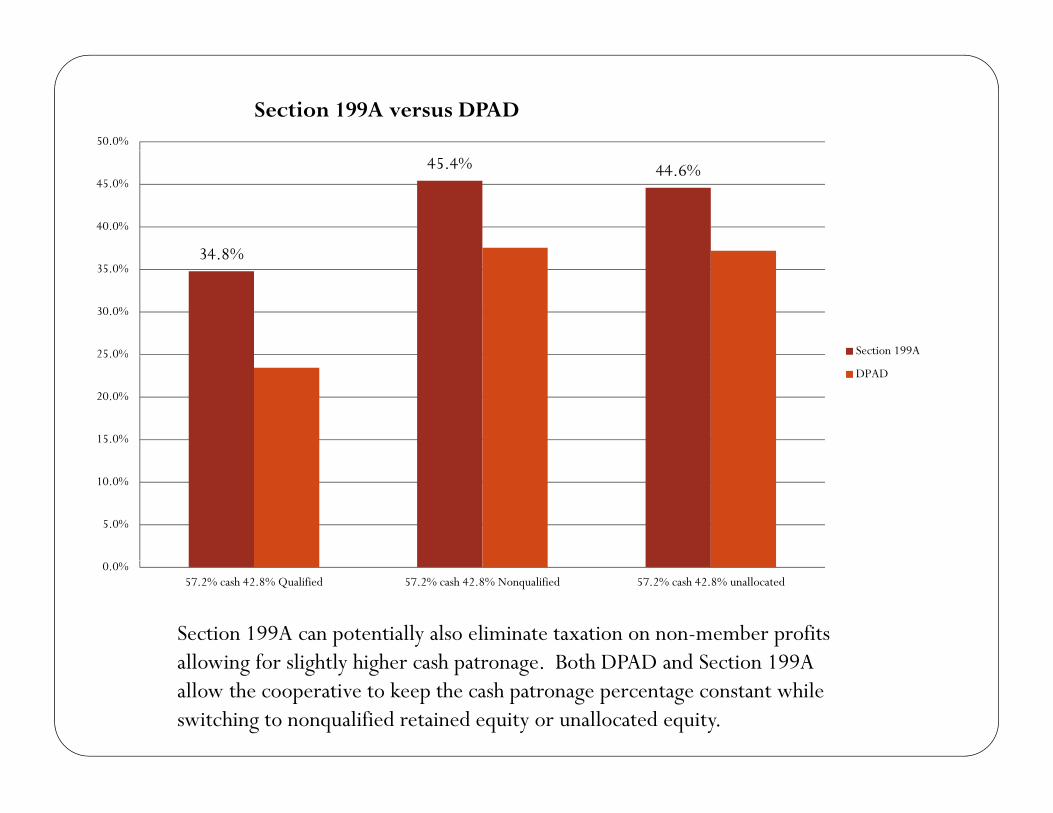
Section 199A versus DPAD
34 8%
45.4% 44.6%
40.0%
45.0%
34.8%
25 0%
30.0%
35.0%
Section 199A
15.0%
20.0%
25.0%
DPAD
5.0%
10.0%
Section 199A can potentially also eliminate taxation on non-member profitsallowing for slightly higher cash patronage Both DPAD and Section 199A
0.0%57.2% cash 42.8% Qualified 57.2% cash 42.8% Nonqualified 57.2% cash 42.8% unallocated
allowing for slightly higher cash patronage. Both DPAD and Section 199A allow the cooperative to keep the cash patronage percentage constant whileswitching to nonqualified retained equity or unallocated equity.

ConclusionsConclusions Prior to DPAD the logical choice was to distribute profits in
a combination of cash and qualified retained patronage
DPAD allowed the cooperative to retain the same cash patronage rate using non qualified (NQ) and/or unallocated patronage rate using non-qualified (NQ) and/or unallocated equity (UE)
Tax reform allows the cooperative to increase cash patronage p p gfrom 50% to 54% with qualified or from 15% to 35% with NQ or UE
Section 199A allows for further increase to 57.2% cash with either Q, NQ or UE.
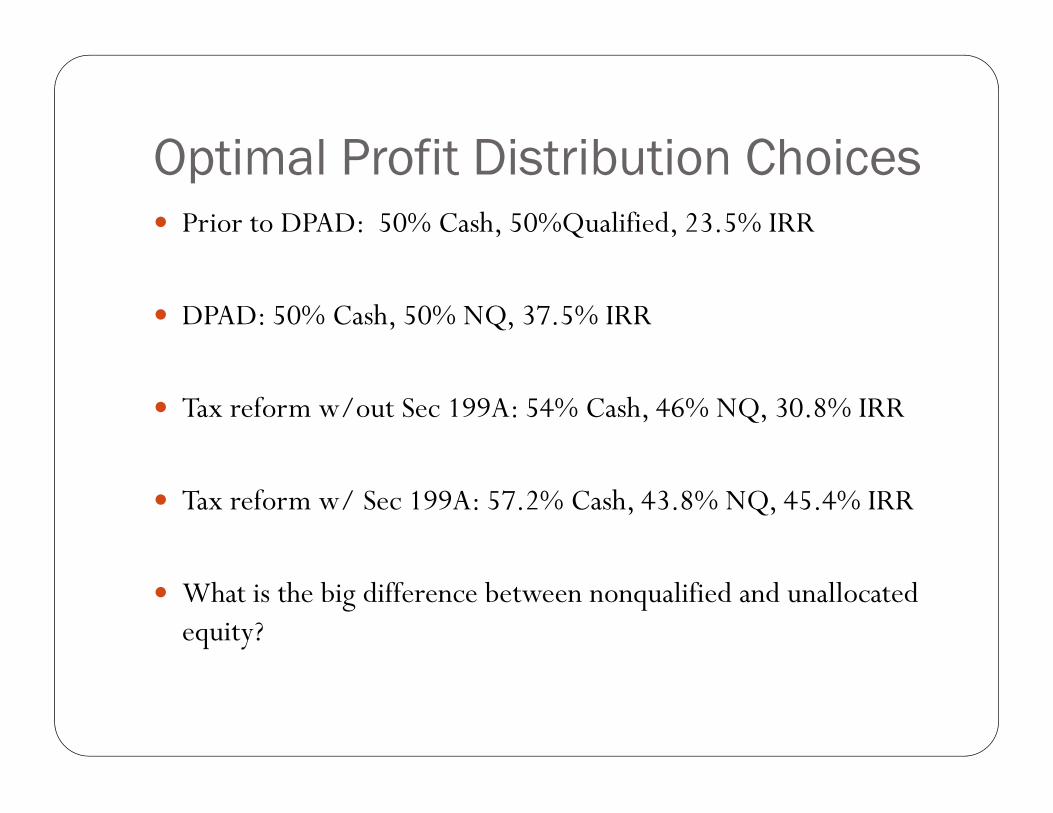
Optimal Profit Distribution ChoicesOptimal Profit Distribution Choices Prior to DPAD: 50% Cash, 50%Qualified, 23.5% IRR
DPAD: 50% Cash, 50% NQ, 37.5% IRR
Tax reform w/out Sec 199A: 54% Cash, 46% NQ, 30.8% IRR
Tax reform w/ Sec 199A: 57.2% Cash, 43.8% NQ, 45.4% IRR
What is the big difference between nonqualified and unallocated equity?

Impact on Balance SheetImpact on Balance Sheet
70 0%
Percent Allocated Equity in Year 10 with Section 199A Choices
59.7% 59.7%60.0%
70.0%
44.0%
40.0%
50.0%
20.0%
30.0%
5.3%
0.0%
10.0%
Year 0 43% Qualified 43 %Non-qualified 43% UnallocataedYear 0 43% Qualified 43 %Non qualified 43% Unallocataed

Producer-Member Impacts and UnknownsUnknowns

Producer Impacts Discussed So FarProducer Impacts Discussed So Far The 20% deduction on cash and qualified equity patronage
h ld i b d ’ ft t t f th should increase member-producers’ after tax return from the cooperative.
Co-op can use tax savings on non-member profits and its Sec p g p199A deduction to increase cash patronage.
Co-ops may capitalize by transitioning to non-qualified it (NQ) d b f i i it equity (NQ), and members may prefer receiving equity
allocations not taxed until redemption. These effects would be viewed as beneficial by co-ops and y p
their members since they may not significantly benefit from reduction in the corporate tax rate.

Section 199 A “Clarifications”Section 199 A Clarifications NGFA and NCFC working through potential “clarifications”
to Section 199A.
Clarification could impact the benefits we have discussed but are most likely to focus on the treatment of Per Unit Retain are most likely to focus on the treatment of Per Unit Retain payments by cooperatives.
We will need to wait for clarification before we can completely analyze producer impacts.
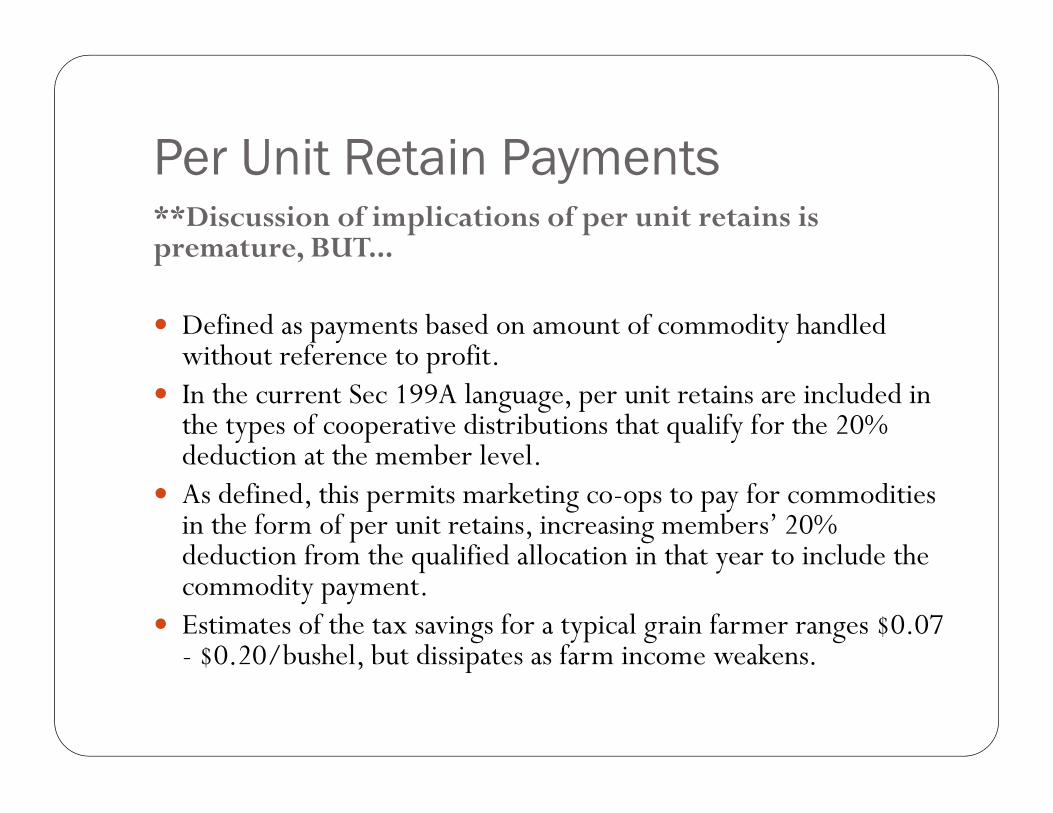
Per Unit Retain PaymentsPer Unit Retain Payments**Discussion of implications of per unit retains is premature, BUT...premature, BUT...
Defined as payments based on amount of commodity handled without reference to profitwithout reference to profit.
In the current Sec 199A language, per unit retains are included in the types of cooperative distributions that qualify for the 20% deduction at the member leveldeduction at the member level.
As defined, this permits marketing co-ops to pay for commodities in the form of per unit retains, increasing members’ 20% deduction from the qualified allocation in that year to include the deduction from the qualified allocation in that year to include the commodity payment.
Estimates of the tax savings for a typical grain farmer ranges $0.07 - $0.20/bushel, but dissipates as farm income weakens.$0.20/bushel, but dissipates as farm income weakens.

Other Possible Producer ImpactsOther Possible Producer Impacts Cooperatives could also choose to use tax savings to
accelerate equity redemption and investments, and improve infrastructure.
Accelerated equity redemption increases the member level Accelerated equity redemption increases the member-level returns from using the co-op but may reduce the proportion of equity allocated to members (balance sheet effect).q y
Infrastructure investments benefit members indirectly and improve the system’s efficiency.

Other Common QuestionsOther Common Questions**Discussion of implications of tax code is premature, BUTBUT...
How will the tax code change producers’ marketing?How will the tax code change producers marketing? Will there be capacity and grain flow issues, including on
local prices? How does this impact specialty forms of co-ops, like
pooling, and co-ops in other sectors? Will this encourage formation of closed cooperatives Will this encourage formation of closed cooperatives,
condominium and co-op commodity handling assets? Will producers restructure farm businesses?

Questions?Questions?