impact of pension schemes on the economy of ghana: a case study of ssnit
DESCRIPTION
A research project undertaken to determine the relevance of pension schemes to the economy of ghana.TRANSCRIPT

UNIVERSITY OF GHANA BUSINESS SCHOOL
THE ROLE OF PENSION SCHEMES IN THE ECONOMY OF GHANA
BY:
ATTA ASANTE ASAMOAH 10197389
SEFAKOR AGBESI 10211600
JULIANA E. POUNTNEY 10206024
HENRIETTA LARBI 10210298
A LONG ESSAY DELIVERED TO THE DEPARTMENT OF FINANCE (INSURANCE),
UGBS IN PARTIAL FULFILMENT OF THE REQUIREMENTS FOR THE AWARD OF
THE BACHELOR OF SCIENCE DEGREE IN INSURANCE.
JUNE, 2009.

Table of ContentsDeclaration
Acknowledgement
Abstract
Chapter One
1.1 Introduction..........................................................................................................................................7
1.2 Background ........................................................................................................................................11
1.3 Problem Statement............................................................................................................................12
1.4 Objectives of Study.............................................................................................................................13
1.5 Significance of Study...........................................................................................................................14
Chapter Two (Literature Review)
2.1 What are pension funds?...................................................................................................................15
2.2 Role of Pension Funds in the Economy..............................................................................................17
2.3 The development of pension schemes in Ghana……………………………………………………………………………19
2.4 The new direction in social security...................................................................................................22
Chapter Three (Methodology)
3.1 Data Collection and Sampling techniques..........................................................................................24
3.2 Sources of data...................................................................................................................................24
3.3 Target population...............................................................................................................................24
3.4 Research instrument and procedure..................................................................................................24
3.5 Data Presentation...............................................................................................................................25
Chapter Four (Data Analysis)
4.1 Analysis of secondary data.................................................................................................................26
4.2 Pension funds assets /GDP Analysis...................................................................................................26
4.3 Interpretation.....................................................................................................................................31
4.4 SSNIT listed equity returns/ GSE returns…………………………………………………………………………………33
4.5 Fund ratio Analysis …………………………………………………………………………………………………………………34
4.6 Analysis of Questionnaire……………………………………………………………………………………………………….34
2

Chapter Five (Limitations, Findings and Recommendations) 4
5.1Limitations…………………………………………………………………………………………………………………………………… 37
5.2Findings…………………………………………………………………………………………………………………………………………37
5.3 Recommendations………………………………………………………………………………………………………………..38
References...........................................................................................................................................40
Appendix 1………………………………………………………………………………………………………………………………42
Appendix 2……………………………………………………………………………………………………………………………….43
Appendix 3………………………………………………………………………………………………………………………..44
Appendix 4…...........................................................................................................................47
Questionnaire…………………………………….……………………………………………………………………48
3

LIST OF TABLES AND FIGURES
TABLES
Pension fund/GDP Analysis……………………………………………………………………………………..29
Correlation Analysis…………………………………………………………………………………………………30
Regression Analysis……………………………………………………………………………………………………………..31
Coefficient of Regression……………………………………………………………………………………………………..31
Regression 2(GDP=x, Fund size=y)………………………………………………………………………………………..33
Regression Coefficient…………………………………………………………………………………………………………..33
Contribution/Benefit Analysis……………………………………………………………………………………………….37
High Yield……………………………………………………………………………………………………………………………..37
Liquidity………………………………………………………………………………………………………………………………..38
Maintenance of Assets Value………………………………………………………………………………………………..39
Diversification……………………………………………………………………………………………………………………….40
Harmony with Public Interest………………………………………………………………………………………………..42
Safety…………………………………………………………………………………………………………………………………….43
Summary of Respondents………………………………………………………………………………………………………44
Number of Dependants………………………………………………………………………………………………………….45
FIGURES
Scatter plot of fund size/GDP………………………………………………………………………………………………….32
Scatter plot of GDP/Fund size………………………………………………………………………………………………….35
SSNIT Listed Equity returns vs. GSE Returns……………………………………………………………………………..36
4
Monthly earnings before retirement and pension benefit for males……………………………………….44
Monthly earnings before retirement and pension benefit for females……………………...................45
5

DECLARATION
We hereby declare that this long essay is the result of our own research work, with the
exception of specified quotations and ideas attributed to specified sources
ATTA ASAMOAH ASANTE …………………………………….
HENRIETTA LARBI …………………………………….
JULIANA POUNTNEY ……………………………………
SEFAKOR AGBESI ……………………………………...
This long essay was supervised by:
………………………………….
MR. OFUSU- HENE, ERIC
6

ACKNOWLEDGEMENTS
We would like to thank the Lord Almighty for His strength and grace that sustained us during
this period. We are extremely grateful to Mr. Eric Ofosu-Hene, insurance lecturer and our
supervisor for his immense contributions and guidance. Without him we would not have
come this far. Our sincere gratitude also goes to Dr. Albert Gemegah, Head of Insurance and
our Course Advisor for his tremendous help.
We also wish to acknowledge the contributions of Mr. Akrofi, Operations Department,
SSNIT (pension house) who helped us to obtain the necessary data from SSNIT, as well as
the Pensioners’ Association of SSNIT for answering our questionnaires.
We also thank all who in diverse ways helped to the successful end of this work.
7

ABSTRACT
The current demographic shift towards population ageing, stress an increasing demand for
pension schemes. All over the world there have been pension reforms to arrest this population
trend since it threatens the sustainability of the economy.
Governments in many countries pay particular attention to pension scheme because of
pension funds’ enormous role in the development of the economy.
This paper identifies the development of pension schemes both in the world and in Ghana. A
careful look at the effect of population ageing on pension schemes is also examined.
The various types of pension schemes in Ghana particularly the SSNIT pension scheme and
the CAP 30 are also examined in this paper.
This paper also examines what pension funds are and the role they play in the economy, and
the new direction in social security in Ghana (the new pension reform)
Finally, an analysis is done to find out whether there is a positive association between
pension fund growth and economic growth, performance of pension funds on the stock
exchange market and the adequacy o f pension benefits in extending social security.
For the purpose of analysis, the paper uses a combination of data for which the main sources
are from SSNIT, scholarly literature review on the subject and survey (questionnaire). The
analysis made in this paper is under the following headings: Fund size/ GDP Analysis,
Contribution/Benefit Analysis, SSNIT Equity Returns vs. Ghana Stock Exchange Returns,
Analysis of SSNIT policy objectives and Analysis of the Questionnaire.
Firstly, a correlation model was established for the relationship between pension fund growth
and economic growth. It was found out that pension fund growth was positively related to
GDP growth. A regression analysis was conducted using fund size as the independent
variable and GDP as the dependent variable. The results indicated that the fund size can be
used to predict the expected GDP of the economy with a degree of certainty.
8

Secondly, a Contribution/Benefit analysis was conducted and it was found out that SSNIT
had sufficient funds remaining after the payment of benefits in a year. SSNIT therefore can
invest more funds into the financial markets and the economy as a whole.
Thirdly, a study was conducted on the equity returns of SSNIT on the stock exchange market.
It was found out that SSNIT listed equities outperformed the Ghana Stock Exchange equity
returns with SSNIT holding shares in 20 out of 29 equities.
Fourthly, an analysis was conducted on the practicalities of the SSNIT policy objectives. It
was realised that the policy objectives of liquidity, harmony with public interest, high yield
and maintenance of asset value were being achieved. However, the policy objectives of safety
and diversification are yet to be fully realised.
The questionnaire was then analysed to determine whether the benefits paid out were
adequate for the retirees on the scheme. Out of 50 administered questionnaires, 40 were
answered and returned. From the answered questionnaires, summaries of monthly earnings
before and after retirement were conducted. It was observed that majority of pensioners
received monthly benefits less than GH¢ 100. This monthly figure when contrasted against
the number of dependents of the retirees came out to be inadequate. Most of the pensioners
had 4-6 dependents and this GH¢ 100 was inadequate in light of this. All in all 21 out of 40
had general knowledge about services provided by SSNIT aside from the pensions. More
awareness thus needs to be created in this area.
9

CHAPTER ONE
1.1 INTRODUCTION
Pension funds can be described as contributions made by employees towards their retirement.
The worker makes fixed payments into a fund which is set up to provide an income when he
goes on retirement. The most problematic issue, however, with pension funds is the length of
time between the first contribution and the payment of benefits. There is an inherent risk of
inflation due to this time period. In simple terms, the real value of contributions may fall over
the lengthy time period. To combat these problems, there must be prudent investment to
compensate for these risks.
There are fund managers who oversee the investment of the funds that the workers contribute
to. These fund managers must ensure that the benefits received by the workers are adequate.
These managers must also make certain that the investments bring in more than adequate
returns to make up for this longevity risk.
The economy is the realized social system of production, exchange, distribution and
consumption of goods and services of a country or other areas1. An economy can be said to
be activities related to the production and distribution of goods and services in a particular
geographic region. Every country in the world has its own individual economy. The
economic activities may include financial activities. The financial sector is responsible for the
performance of these financial activities. An example of such institutions is the banks.
Pension funds are invested in such activities in order to generate adequate revenue to fulfil
pension obligations.
1 See [9] pg. 50
10
Pension funds are mostly invested in the financial market. Globally, pension funds generate
lots of money for investments. Morgan Stanley, a financial institution in the United States of
America (USA) estimated in January 2008 that pension funds worldwide hold over US$20
trillion in assets2. As at the end of 2007, the fund size of pension fund in Ghana was GH
¢1639.84 million (source: SSNIT Annual Report) which is approximately US$
1093.227million. The very large amounts of pension funds when invested in various
instruments may influence the economy. There are various bodies set up to ensure the
management of pension fund assets all over the world.
In Ghana, the pension fund is managed by the Social Security and National Insurance Trust
(SSNIT).
This trust takes decisions concerning the areas to invest in. This includes public listed
companies, treasury bills and others such as residential facilities as well as other unlisted
equities. In Ghana, the trust is the single largest institutional investor in the Ghana Stock
Exchange (GSE). The investment decisions of the scheme will therefore have an impact on
the GSE. This paper will seek to determine the extent of this influence on the economy of
Ghana.
Another role the Trust plays in the economy is the role of an intermediary. It makes available
fund from long-term spending units to the deficit spending units, being the firms. The Ghana
government also borrows money from the fund to supplement the budget.
SSNIT’s primary role which is contained in its mission and vision statement is to promote the
economic security of a Ghanaian worker. This is to maintain the standard of living (achieving
a stable or increasing standard of living is a hallmark of an efficient economy. This could be
achieved by, among other means, a reduction in the dependency ratio) of the worker and his
2 See [11] Pg. 50
11

dependents in the case of old age pension, invalidity and survivor’s lump sum benefits. This
will reduce the dependency on the independent working members of the extended family as
well as maintain the security and standard of living.
There has been an increase in the number of aged in recent times. This has been a result of
the improvements in healthcare for the elderly. Longevity is a source of economic insecurity
in that individuals may outlive their financial capacities to maintain themselves and their
dependents.3 Life expectancy of retirees is increasing and this is a burden on pension funds
worldwide. In developing countries, populations are aging much faster than they did in
industrial countries and this is a cause for great concern. Life expectancy in the Ghana has
been pegged at 55.4 years for male and 59.6 years for female. This shows an increase in life
expectancy from 50.3 and 53.8 years for males and females respectively in 1984(Ghana
Statistical Service, 2003). Most often, aged people are not expected to engage in gainful
employment. On one hand, those aging are going on retirement and living longer, and on the
other hand the economy is losing their income to the National Income. It is estimated that one
out of every four persons over age 65 will someday enter a nursing home and nearly every
family will have some direct-experience with its financial planning problem4.
The private pension scheme in Ghana is a market that is yet to be explored. However, there
are numerous private life insurance products schemes operated by private insurance
companies. These private schemes do not go by the name pension schemes but are operated
as life insurance policies and provident funds.
3 See [2] Pg. 504 See [21] Pg. 51
4
12

Due to the low per capita income of the average Ghanaian, these private schemes are not very
well patronized in Ghana. There are only two public pension schemes in Ghana. These are
the SSNIT pension scheme and the CAP 30. Membership of the SSNIT pension scheme is
open to all but the CAP 30 is only for workers in the civil service. The SSNIT pension
scheme offers three benefits. These are the old age, invalidity and survivors’ lump sum. The
old age benefit caters for retirees in their old age by providing them with steady monthly
income. The invalidity benefit is for workers who get injured in the course of their work and
are unable to go back to work. This benefit is received by the worker until he attains the age
of 60. The survivors lump sum is for the dependants of a worker who dies before retirement
or during the guaranteed period (this is 12 years after retirement); PNDC Law 247. The
benefits that the deceased would have been entitled to is calculated and duly discounted and
the final amount is paid to the dependants.
The SSNIT pension scheme is self financed from employer and employee contribution of
12.5% and 5% of basic salaries and investment income. The membership is open to all
workers and it’s more so mandatory for every worker who has an employer-employee
relationship with an identifiable employer; however the police, military and other security
services are exempted from the SSNIT scheme. It is also optional for the self-employed
(Social Security Law, PNDC Law 247).
The CAP 30 also provides three benefits. These are old age, disability and dependents lump
sum. The old age benefit caters for workers who have come to the end of their working lives.
The disability benefit is for those members of the scheme who get injured during their
employment. Just like the SSNIT pension scheme, this benefit terminates when the employee
reaches the retirement age (60 years). The dependents lump sum benefit provides lump sum
13

to survivors upon the death of the worker either during his employment or before the expiry
of the guarantee period (this is 20 years after retirement).
1.2 BACKGROUND
Long before institutionalised pension begun, there was a form of assistance communities
provided for the ageing who could no longer work as they used to. In Europe there were
poor houses for the aged as well as charities and hospitals. Parishes and churches operated
funds that benefited the old folks in the community5.
In U.S. history, the earliest pensions emerged in both public and private sectors. In the public
sector, Union Army veterans’ pensions were paid to northern white males in particular before
1900 (Skocpol6). By 1900, thirty-five percent of white males age fifty-five to fifty-nine were
receiving Civil War pensions (Costa7). Meanwhile the influencing factors for determining the
retirement rates were ill health and unemployment (Graebner8). However, the availability of
these pensions probably motivated their recipients’ exits from the labour force. Other early
pension schemes can be traced to the private sector. Here they were developed by employers
to control the age composition of their workforces and to ensure labour stability. The
American Express Company initiated a pension plan in 1875 for incapacitated workers who
had been with the firm for twenty years or more. And in 1884 the Baltimore and Ohio
Railroad instituted a pension plan that, in many respects, anticipated the major structure of
twentieth century pensions. It called for mandatory retirement at age sixty-five after a
minimum of ten years’ service. The elements that went into the calculation of benefits were
age, years’ of service and salary levels9.
5 See [18] Pg 516 See [19] Pg. 517 See [4] Pg. 508 See [7] Pg. 50
7
8
9 See [20] Pg. 51
14

The first three decades of the twentieth century saw a slow development of retirement plans
although the number of workers covered by pensions, health insurance, profit-sharing and
other employee benefits grew steadily (Jacoby10). Industrialization consisted of more than
production lines; it included the development of personnel management and the growth of
unionization, both of which would shape the boundaries of the regular work career with
negotiated rule structures regulating hiring, promotion, wages, and income maintenance
(including health insurance and retirement). Over time, these workplace regimes created age-
structured work careers (Henretta11).
The US passed its first comprehensive social security legislation in 1935.The passage of the
Social Security Act in 1935 encouraged the more rapid growth of pension plans by
establishing minimum standards. Its setting of sixty-five as the age of eligibility eventually
made that age the most common age for retiring (Costa).
Soon other countries passed similar laws. South Africa in 1928, Japan in 1941, Malaysia in
1954, and Singapore in 1953, and Canada began its social security in 1940. In Ghana, the
social Security Scheme was a provident fund from 1965 to 1990. It became a Social
Insurance Scheme in January 1991 by PNDC Law 247.
1.3 PROBLEM STATEMENT
10
? See [13] Pg. 5011 See [8] Pg. 50
11
15

Socio-economic conditions in developing countries stress an increasing demand for social
security schemes. There has been a growing international consensus on the rationality of
using social protection mechanisms as complementary instruments for fighting poverty.
Pension fund liabilities are long term in nature. This is because people make claims on the
fund after retirement; which is at a future date. As a result of this, pension funds are invested
in various assets such as stocks, bonds and other securities on the financial market to generate
sufficient funds for companies to meet their pension obligations. In order to sustain the
scheme, the pension funds are also diversified in the other sectors of the economy. Examples
are the use of pension funds for the provision of real estate housing, hospitals and other
infrastructure for the development of the economy.
The recent trend in global demographic shift towards population ageing has led many
countries to reform their pensions from unfunded schemes (pay-as-you-go) to funded
schemes. With the current demographic trend and the structure of funded schemes, it is
virtually certain that pension funds will increase remarkably in the coming decades. Three
questions arise out of this.
1. Whether funding improves economic performance that is sufficient to generate the
resources needed to meet the needs of the ageing population.
2. Whether funding leads to an increase in household savings.
Whereas there is quite extensive work on the effect of funding on savings and financial
development, a direct role of pension funds in economic growth has been little examined. The
impact of pension funds on the financial market will be taken into consideration. The
question is whether pension fund growth is positively associated with economic growth. If it
is found out that pension funds is positively associated with growth, then we will determine
how strong this relationship is. The next issue will be the derivation of a mathematical
16

equation (regression equation) to link pension funds to economic growth. The answer to this
will determine the role of pension in the economy of Ghana.
1.4 OBJECTIVES OF STUDY
The objectives of the study are as follows:
1. To identify the total contribution received by SSNIT in a given year.
2. To find out the surplus funds left after the payment of claims in a year.
3. To find out the investment policies of the scheme.
4. To study the effect of these investments on the economy of Ghana.
5. To determine whether the fund is able to maintain the economic security of
pensioners.
6. The returns on the pension funds in relation to the overall performance of the
Ghana Stock Exchange (GSE).
7. Equity holdings of the SSNIT pension fund.
1.5 SIGNIFICANCE OF STUDY
The purpose of this study is to provide basic information about the role of pension schemes in
the economy. This will help the public at large to appreciate the essence of pension scheme
and to encourage self employed workers as well as workers in the informal sector to join the
scheme. The government is the guarantor of the scheme and this study can be used to advise
the prudent investment of the surplus funds of the scheme in order to ensure adequate returns
on investment.
Various employers in the economy would be made aware of the importance of registering
their members for the SSNIT scheme. This point would be made through the analysis of the
17

various companies that the trust invests in. Companies would therefore realise that they are
the long term beneficiaries of an increased membership in the scheme.
It is also believed that this study will be useful for academic purposes and serve as a spring
board for other research studies.
18

CHAPTER TWO
LITERATURE REVIEW
2.1 WHAT ARE PENSION FUNDS?
According to Davis (1995a), pension funds are bodies which receive contributions from members
and invest the funds received in order to provide an income for the members in the future. The
investments ensure that employees accumulate sufficient funds over their working life in order to
maintain a certain standard of living during their retirement. These investments ensure that the
various entitlements are adequately provided for. These entitlements or benefits are in the form of
old age, invalidity and survivors’ lump sum benefits. The benefits may be paid either in the form
of annuity or a lump sum. An annuity is a fixed periodic income received by an individual.
Pension funds are invested in companies, households as well as the government. Pension funds
are also used to grant loans to companies to allow for growth. Shares are also purchased in
various companies in order to earn dividends. Loans are also granted to households in order to
supplement their income for consumption. Governments also use pension funds to supplement
their budgets. The governments borrow the amounts they need from the pension funds with the
promise to repay at an agreed time.
There has been a remarkable growth of pension funds in many Organisation of Economic
Cooperation and Development (OECD) (APPENDIX 1) countries as well as many emerging
markets (APPENDIX 2). OECD countries include Canada and the United States (US). Emerging
markets include countries like Chile and Argentina. This growth has been in relation to that of the
GDP and the banks. Due to the long term nature of pension funds, the funds can be invested in
high yielding long term instruments. Early withdrawals are restricted. The funds can thus be
invested in corporate equities, government bonds and corporate debt (Davis, 2000)12. The
12 See [5] Pg. 50
19

corporate equities are in the form of shares, government bonds include treasury bonds and
corporate debts are loans granted to companies.
Contributions into the fund may be made by employers alone or by both the employer and the
employee. Where contributions are made by only the employer, we have a non-contributory
scheme. Where the contributions are made by both the employee and the employer, we have a
contributory scheme. The benefits received by eligible members can be either defined-benefit or
defined-contribution. Under the defined- contribution, benefits are not based upon a
predetermined formula; plan participants upon retirement get back their contributions plus their
accumulated return with the pension benefit taking the form of a lump-sum payment or a series of
lump-sum payment or an annuity13. Defined-contribution plan is usually fully funded. The
employee/retiree bears the risk of poor investment performance and inflation14. The real value of
benefits may fall during periods of inflation. Attention must therefore be paid to the selection of
investment options.
The defined-benefit plan defines plan participants’ benefits as a function of salary and work
history. A formula is used in the calculation of this benefit15. The risk of investment is borne by
the employer who serves as the guarantor of the scheme. These schemes are not very mobile from
one employer to another. There are also a lot more conditions attached to the benefits. Some of
these conditions may include length of employment and position.
In recent years defined contribution plans have grown faster than defined benefit plans. This is
because employers now seek to minimize their risk of obligation whiles employees also seek
funds readily transferable between employers.
13 See [15] Pg. 5114 See [14] Pg. 5115 See [15] Pg. 51
14
15
20

2.2 THE ROLE OF PENSIONS IN THE ECONOMY
In this section, we will explain some of the roles pension schemes play in the economy.
Provision of retirement income16. In the light of the ageing of the population, pensions serve as a
means of saving towards the future after the employee’s normal working life. It provides income
security to the retired worker or his beneficiaries in the event of death or invalidity.
Governments in many countries normally grant tax exemptions on the contributions made by
employees to the pension fund. This increases the level of savings for the employees or the
retired worker. Also, under a defined-benefit scheme, managers see defined-benefits (DB) fund
liabilities as a debt to the company which employees can claim like creditors. They therefore
invest some of the company’s assets to serve as collateral for the pension obligation when it is
due.
Pension Schemes (PS) help companies to reward and retain their best staff, attract high quality
labour and reduce labour turnover9. This is called the business expediency concept. As a reward,
managers use pensions as a way of honouring aged employees for their invaluable service in the
company. Managers also use pensions as a negative reward to lay off too-old–to-work
employees whose carelessness and mistakes might cause injuries to other employees and losses
to the company. Defined -benefit plans attract high quality labour because of the insurance
features attached to it. Employees feel that there is a guarantee for their income during
retirement. DB plans also retain employees. This is because under a DB system, employees’
rights to the accrued pension benefits increase with length of service. Managers can also reduce
labour turnover by increasing the vesting period (the length of time the employee must work to
acquire the right to the accrued pension benefits).
16 See [6] Pg. 50
21

PS help government to achieve its development objectives17. This can be done by way of
infrastructure development, poverty eradication, reduction of financial services costs, improving
the financial system. Such investments in turn create jobs and spill over to other sectors of the
economy.
Pension funds have also been seen to influence corporate governance in the economy. Clark and
Hebb, 200318 identified four factors which facilitate pension funds’ corporate governance.
a The use of indexation technique
b. The second is the increasing demand by owners for more accountability and
transparency.
c. Pension funds’ pressure to undertake socially responsible investing (SRI)
d. To humanise capital with social, moral and political objectives extend pension
funds simple concern’s for rate of return.
PS boost the performance of life insurance companies. Pension funds are used to purchase
annuity products for pensioners upon retirement.
PS improve the financial market. Pension funds accumulate large amounts of resources,
providing long term capital and stability to the stock market. For example in the US,
investors with over $10 trillion in pension fund assets now own up to 76% of the stock
market19. In Ghana, SSNIT is the largest institutional investor on the Ghana Stock
Exchange. Pension funds also protect investors and enhance public confidence in the capital
market. Pension funds’ role in the financial sector includes the following:
17 See [20] Pg. 5118 See [3] Pg. 5019 See [16] Pg. 51
19
22

a The collection of savings
b The investment in securities and other financial assets both locally and
foreign.
c The payment of annuities and
d Provision of forms of insurance
2.3 THE DEVELOPMENT OF PENSION SCHEMES IN GHANA
In 1946, a non-contributory pension scheme was introduced to cover senior civil servants.
This was the first pension program of its kind in the country. The scope of cover was thus
limited to those who worked in the offices of the Colonial Administration. The vast
majority of ordinary Ghanaians could not benefit from this scheme20 (ssnit.com).
1955 saw the extension of this cover to certified teachers and this was referred to as “CAP
30”. This was a major leap from the previous cover. Private superannuation schemes were
introduced to cater for retired members of the then University College of the Gold Coast;
now University of Ghana21 (Adjei, 1999).
In 1960, a compulsory savings scheme was introduced for all government workers. Social
Security Act No. 279 of 1965 was passed to cover workers in companies with five or
more employees if they were not covered by the “CAP 30” (Social Secuity and National
Insurance Trust, 2008).
20 See [12] Pg. 5021 See [1] Pg. 50
21
23

The Social Security and National Insurance Trust (SSNIT) was established in 1972 under
the NRCD 127 to administer the National Social Security scheme. The scheme had
previously been administered by the Department of Pensions and the State Insurance
Company (SIC). The trust is funded through contributions by workers and employers. The
SSNIT pension scheme offers benefits for retirees and their dependents. These benefits
consist of Old age benefits, Invalidity and Survivors Lump sum.
For a worker to qualify for Old Age benefits, he must have worked for a minimum of 240
months and attained the age of 60. For workers in hazardous occupations such as the
extractive industry i.e. mining, the mandatory retirement age is 55 years. Any retiree who
does not fulfil these requirements receives the sum total of his contributions plus half the
prevailing government treasury rate.
Invalidity benefits are paid to workers who have been injured ... the guaranteed payment
period of the benefits is 12 years. If a retiree dies before this age, the present value of his
total pension is calculated and paid to his dependants.
The SSNIT pension scheme operates on the defined-benefit principle. With this method,
the risk of investment is borne by the scheme since the contributions of members are only
minimally linked to the benefits received after retirement. The investment managers must
therefore exercise caution and level-headedness in selecting the investment options.
The SSNIT has four major functions. These are collection of contributions, keeping of
records of members, managing the funds of the scheme and processing and paying
benefits to eligible members and declared dependents.
24

THE SSNIT’S INVESTMENT POLICY
The Trust's Investment Policy provides guidelines for investment of the Pension Funds in
various sectors of the Ghanaian economy.
The Investment Policy of the Trust takes into consideration the under-mentioned major
requirements of investing Social Security Funds:
a. Safety - Investments should be in low risk ventures
b. High Yield - The returns on the investments should be appreciable
c. Liquidity - Ensuring that a certain level of investment is maintained in cash ratio to
enable the Trust meet its obligations when they are due.
d. Maintenance of Assets Value - Ensuring that the value of the investments is not
eroded by an inflationary economic environment.
e. Harmony with Public Interest - Ensuring that some of the investments are geared
towards the achievement of national economic development programmes as well as
providing physical benefits to the public.
f. Diversification - Ensuring that the portfolio mix is adjusted in the light of changing
environmental circumstance.
These policy objectives will be further discussed in the analysis to find out whether their
investments conform to these policies.
INVESTMENT OBJECTIVES
In the development of the policy guidelines, the major objective is:
- To maintain a long term optimum Fund ratio through realization of real returns
on investment.
- Maintain a portfolio mix which ensures low risk on investments
- Ensure adequate liquidity to enable the Trust meet its obligation when due.
25

2.4 THE NEW DIRECTION IN SOCIAL SECURITY
Pension reforms are happening all over the world and Ghana is no exception. A new
legislation has been passed to govern the administration of social insurance in Ghana. The
National Pensions Act 766 caters for the establishment of a new contributory three-tier
pension scheme with a National Pension Regulatory Authority to regulate and oversee the
efficient administration of the composite pension scheme.
The new scheme will comprise two mandatory schemes and a voluntary scheme as follows:
(a) First tier basic national social security scheme, which will incorporate an improved
system of SSNIT benefits and shall be mandatory for all employees in both the private
and public sectors; (payment of only monthly pensions and related benefits such as
survivors benefit)
(b) Second tier occupational (or work-based) pension scheme, mandatory for all
employees but privately managed, and designed primarily to give contributors higher
lump sum benefits than presently available under the SSNIT or Cap 30 pension schemes;
and
(c) Third tier voluntary provident fund and personal pension schemes, supported by tax
benefit incentives to provide additional funds for workers who want to make voluntary
contributions to enhance their pension benefits as well as workers in the informal sector.22
Improved second tier lump sum benefits higher than existing Cap 30 lump sum benefit and
much higher than that of SSNIT.
Among other impacts, the new scheme will ensure improved living standards of the elderly;
financial autonomy and independence of retirees; increased national savings and availability
22 See [19] Pg. 51
26

of long term funds for economic development; and the promotion of growth and development
of the capital, mortgage and insurance markets. Contributors can use their future lump sum
pension benefits to secure mortgages. This means that workers can obtain their own houses
before retirement by using their pension benefits as collateral. Though the new National
Pensions Act has been passed, its implementation is yet to start.
27

CHAPTER THREE
METHODOLOGY
3.1 DATA COLLECTION AND SAMPLING TECHNIQUE
This part explains the methods and procedures used in this research. One set of questionnaire was
prepared for pensioners and secondary data was collected from SSNIT. The questionnaire was
self administered. The method of sampling used was purposive or judgemental sampling23. This
sampling method was chosen due to the difficulty in reaching the pensioners under the SSNIT
scheme.
3.2 SOURCES OF DATA
Primary data was collected from SSNIT pensioners Association and secondary data was collected
from the SSNIT organisation.
3.3 TARGET POPULATION
There were two target populations; the SSNIT institution and the SSNIT pensioners association.
The questionnaire was issued at the time when all the pensions under the association in the
Greater Accra meeting had their monthly meeting. This therefore gave us a largely representative
sample of pensioners. Secondary data was collected from the SSNIT’s Public Affairs Directorate.
3.4 RESEARCH INSTRUMENTS AND PROCEDURE
Combined sets of procedures and research tools were used in the collection and analysis of
data. This was to prevent the tendency to develop a singular technique of data collection that
would perhaps result in narrowness and limited understanding. Questionnaires were the
primary instruments used. These were administered to gather information. Journals and
23 See [17] Pg. 51
28

annual reports of the SSNIT institution were used. The information concerning the GDP
growth of the economy from 2004-2007 was collected from Institute of Statistical Survey and
Economic Research (ISSER). The questionnaire was structured so as to enable the collection
of relevant data for analysis. There were built in controls in the questionnaire to check for
validity of answers. These controls served to provide us with an unbiased and credible data
for a accurate analysis. In addition to the questionnaires, journals obtained from SSNIT were
thoroughly examined and necessary facts were obtained. Data on the GDP figures of Ghana
was obtained from the International Monetary Fund (IMF) website.
3.5 DATA PRESENTATION
The data that was gathered from the SSNIT pensioners will be presented in the form of tables
and well structured graphs. This is to help make the research more comprehensive and
explanatory. The data obtained from the SSNIT Public Affairs Directorate will be
compressed into tables and graphs as well.
29

CHAPTER FOUR
DATA ANALYSIS
4.1 ANALYSIS OF SECONDARY DATA
Annual reports obtained from SSNIT were summarised with data relevant to the study being
given the maximum attention.
4.2 THE PENSION FUNDS ASSETS/GDP ANALYSIS
This is to determine the relationship pension fund assets growth and economic growth.
Variables needed are the Fund Size and the Gross Domestic Product (GDP).
Table 1 Pension funds as against GDP
Year Fund Size (Gh¢ million) GDP Value (Gh¢ million)
2003 630.00 6571.00
2004 877.56 7815.00
2005 932.75 8924.30
2006 1195.20 9934.10
2007 1639.84 11063.30
Fund size = net asset (which is total assets - current liabilities).
Fund size source is SSNIT Annual report, 2007
GDP source: www.imf.org24 (The GDP values are nominal values)
24 See [10] Pg. 50
30

In order to establish the relationship between GDP and Fund size, the hypothesis below was
used:
Hypothesis
H0=0: There’s no relationship between Pension Fund Growth and Economic Growth.
H1≠0: There’s a relationship between Pension Fund Growth and Economic Growth.
Table 2: (correlation analysis)
Correlations
fund size of GDP
fund size of Pearson Correlation 1.000 .945*
Sig. (2-tailed) .015
N 5.000 5
GDP Pearson Correlation .945*1.000
Sig. (2-tailed) .015
N 5 5.000
Correlation is significant at 5% significant level ( 2 tailed-test )
Table 2 is a correlation analysis using SPSS analysis.
Using Pearson momentum correlation co-efficient (r), the r value is 0.945. This value is
significant at the level of 5%. The positive value of the ‘r’ indicates a positive relationship
between fund size and GDP. This is also a strong relationship as r = 0.945 which is
approximately equal to 1. Since the ‘r’ value is significant at the 5% level, the null
hypothesis is rejected and the alternate hypothesis is upheld.
31

Table3: Regression 1(Fund size=x, GDP=y)
Model Summary
Model R R Square
Adjusted R
Square
Std. Error of the
Estimate
1 .945a .893 .858 662.14488
a. Predictors: (Constant), fund size
Table 3 is a summary of the regression model. The ‘r’ value indicates the correlation value from
table 2 which is equal to 0.945. The fund size is the independent variable and the GDP is the
dependent variable. The r2 value indicates the amount of the independent variable that can be used
to predict the dependent variable. It is expressed as a percentage. From the table, it could be
found out that 89.3% of the fund size can be used to predict the expected GDP.
Table 4: Coefficient of Regression
Coefficientsa
Model
Unstandardized Coefficients
Standardized
Coefficients
t Sig.B Std. Error Beta
1 (Constant) 4669.559 886.725 5.266 .013
fund size 3.921 .782 .945 5.015 .015
Table 4 represents the coefficient of the regression equation. The equation of the regression
line is given as:
y=a+bx,
Where y=GDP
x=fund size
a=constant= 4669.559
b=3.921
32

Substituting the values of a and b into the equation, the equation of the regression line
becomes
Y=3.921X+4669.559
This equation will help us to be able to predict with reasonable accuracy the size of the GDP
given the expected value of fund size.
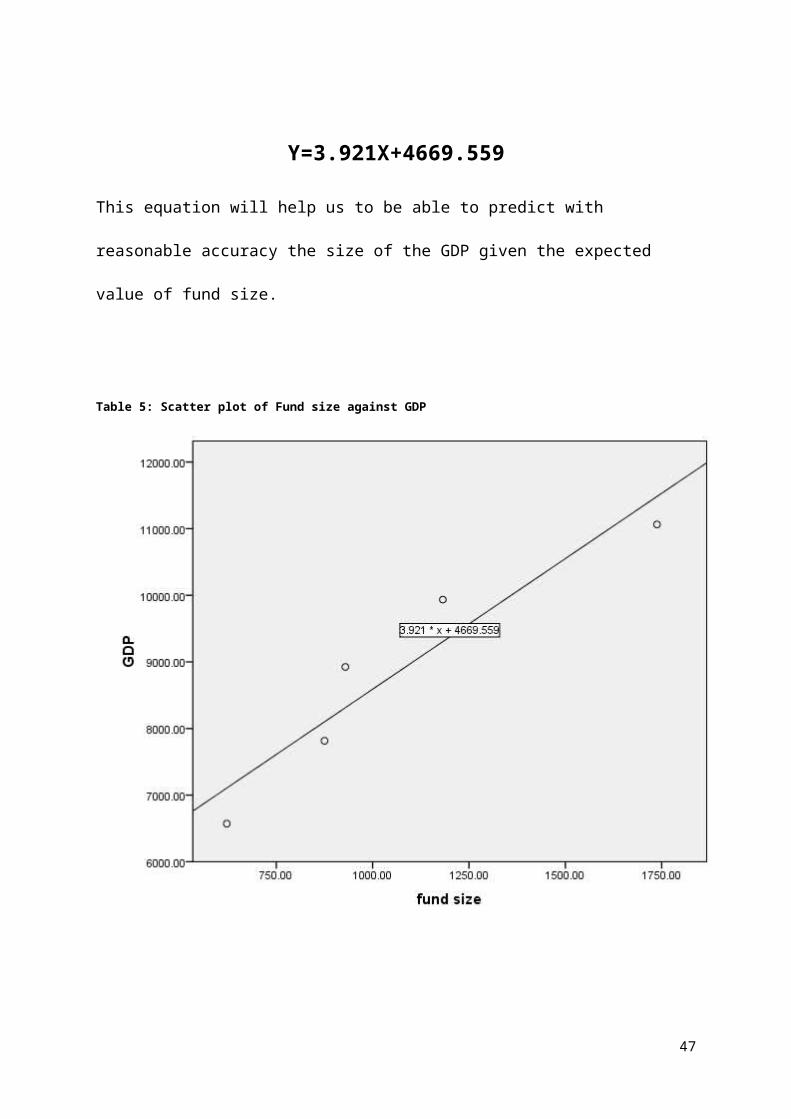
Table 5: Scatter plot of Fund size against GDP
33

Table 5 is a scatter plot diagram which gives a good visual picture of the relationship between the
dependent and independent variable. The resulting pattern of the scatter plot indicates the type
and strength of the relation between the two variables. An upward trend or positive slope of the
curve indicates a positive association between the two variables while a negative effect will be
indicated by the opposite effect. The closer the points are around the regression line, the stronger
the relationship between the dependent and the independent variable. From the graph, it is
observed that there is a positive slope of the line. This indicates a positive relationship between
the fund size and GDP. It could be observed that the points are close to the line. This shows a
strong positive relationship between fund size and GDP. The scatter plot confirms the explanation
of the correlation coefficient we had in table 2 above.
Table 6: Regression 2(GDP=x, Fund size=y)
Model Summary
Model R R Square
Adjusted R
Square
Std. Error of the
Estimate
1 .945a.893 .858 159.62095
a. Predictors: (Constant), GDP
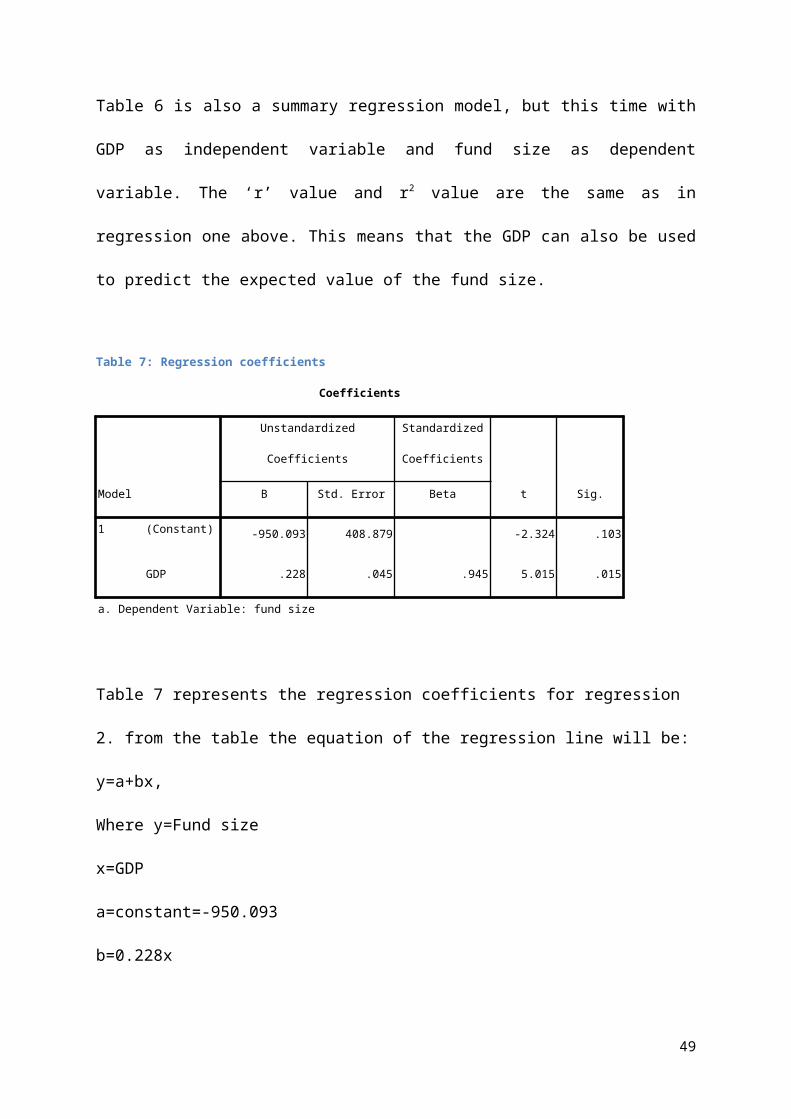
Table 6 is also a summary regression model, but this time with GDP as independent variable
and fund size as dependent variable. The ‘r’ value and r2 value are the same as in regression
one above. This means that the GDP can also be used to predict the expected value of the
fund size.
34

Table 7: Regression coefficients
Coefficients
Model
Unstandardized Coefficients
Standardized
Coefficients
t Sig.B Std. Error Beta
1 (Constant) -950.093 408.879 -2.324 .103
GDP .228 .045 .945 5.015 .015
a. Dependent Variable: fund size
Table 7 represents the regression coefficients for regression 2. from the table the equation of
the regression line will be:
y=a+bx,
Where y=Fund size
x=GDP
a=constant=-950.093
b=0.228x
Substituting the values of a and b into the equation, the equation of the regression line
becomes
Y=-950.093+0.228X
35

Table8: Scatter plot of GDP against Fund size
Table 8 is a scatter plot diagram which gives a good visual picture of the relationship between the
dependent and independent variable. From the graph, it is observed that there is a positive slope
of the line. This indicates a positive relationship between the fund size and GDP. It could be
observed that the points are close to the line. This shows a strong positive relationship between
fund size and GDP. The scatter plot confirms the explanation of the correlation coefficient we
had in table 2 above.
36

4.3 SSNIT LISTED EQUITY RETURNS VERSUS GHANA STOCK EXCHANGE
RETURNS
SSNIT LISTED EQUITY RETURNS VRS GSE RETURNS
21%47%
256%
92%
-24%
11%
46%
155%
91%
-30%-50%
0%
50%
100%
150%
200%
250%
300%
1 2 3 4 5
YEAR(2001-2005)
PE
RC
EN
TA
GE
S
SSNIT LISTED PORTFOLIO
GHANA STOCK EXCHANGE RETURNS
In the data above as at the end of 2005, SSNIT continued to be a major player on the Ghana
Stock Exchange (GSE). The trust held shares in 20 out of the 29 equities and on the GSE at
the close of 2005, the total market value of SSNIT-held listed equities stood at GH
¢206.7million constituting 2.3% of the GSE total market capitalization of GH¢ 9185.7
million(SSNIT Annual Report 2005).
37

4.4 CONTRIBUTION/ BENEFIT ANALYSIS
Year Total Contribution( GH¢millions)
Total Benefits(GH¢ million)
Benefits to Contribution Percentage (%)
2003 134.00 24.83 18.53
2004 163.30 44.73 27.39
2005 190.60 63.02 33.06
2006 286.80 79.87 27.85
2007 384.97 117.08 30.41
Source: SSNIT Annual Report, 2007
The benefits to contribution percentages indicate that there is more than sufficient funds
available to ensure the adequacy of pension benefits. From the table above, it can be observed
that annual benefits paid out to pensioners are very minimal and so this should in no way put
the fund in danger of insolvency. SSNIT should have enough funds to maintain the pension
scheme.
4.5 SSNIT’S INVESTMENT POLICY
1. HIGH YIELD
2007 2006
Weighted Average Return Weighted Average Return
INVESTMENT ACTUAL TARGET ACTUAL TARGET
Equity* 9.0% 9.30% 6.9% 2.6%
Fixed income 6.9% 5.7% 7.3% 6.3%
Real Estate 6.9% 2.1% 1.5% 2.6%
Total 22.8% 17.1% 15.7% 11.5%
38

(Nominal)
Source: SSNIT Annual Report, 2007
The management continued to actively manage the investment portfolio in a prudent manner.
The pension fund investments are generating adequate returns to ensure the growth of the
fund. The investment returns beat the targets set for the years 2006 and 2007.
This is evidenced in the table above, where in 2007; the accrual active management portfolio
yielded 22.8% in nominal terms, exceeding the target of 17.1%.The target for 2006 was also
exceeded by 4.2% points (15.7% against 11.5%)
2. LIQUIDITY
2004 2005 2006 2007
CURRENT ASSETS 310355.1 335815.4 500545 618806
CURRENT
LIABILITIES
26674.9 35559.7 48519 51893
LIQUIDITY
RATIO(CURRENT
ASSETS/CURRENT
LIABILITIES)
11.63 9.44 10.32 11.93
Source: SSNIT Annual Report, 2005 & 2007.
The trust must ensure that a certain level of investments is maintained in order to settle
pending obligations. From the income statements of the trust in years 2004-2007, the
liquidity ratio was calculated. It can be observed that there is sufficient to settle any pending
obligation.
39

Liquidity Ratio= Current Assets/ Current Liabilities.
In 2004, the liquidity ratio was 310355.1/26674.9=11.63. It decreased to 9.44 in 2005 and
then rose to 10.32 in 2006. 2007 saw the liquidity ratio increasing to 11.93, the highest in the
past four years. Any ratio greater than 1 means that the trust has adequate current assets(cash)
to pay off its current liabilities (Payables).
3. MAINTENANCE OF ASSETS VALUE
MEAN
(2003-
2007)
2007 2006 2005 2004 2003
Nominal
Return
23.9% 22.8% 15.7% 5.4% 34.4% 45.1%
Average
Inflation
15.1% 10.7% 11.0% 15.1% 12.7% 26.7%
Real
Return
7.7% 10.9% 4.3% (8.4)% 19.2% 14.5%
Source: SSNIT Annual Report, 2007
The returns on investment have on the average offset the inflation rates. This means that there
have been actual gains on investment and not just nominal gains.
At 2% positive real return on the investment, the Scheme would be sustainable over a 50-year
period (i.e. 2003-2053), if the number of contributors were to increase at a minimum 3% per
annum.
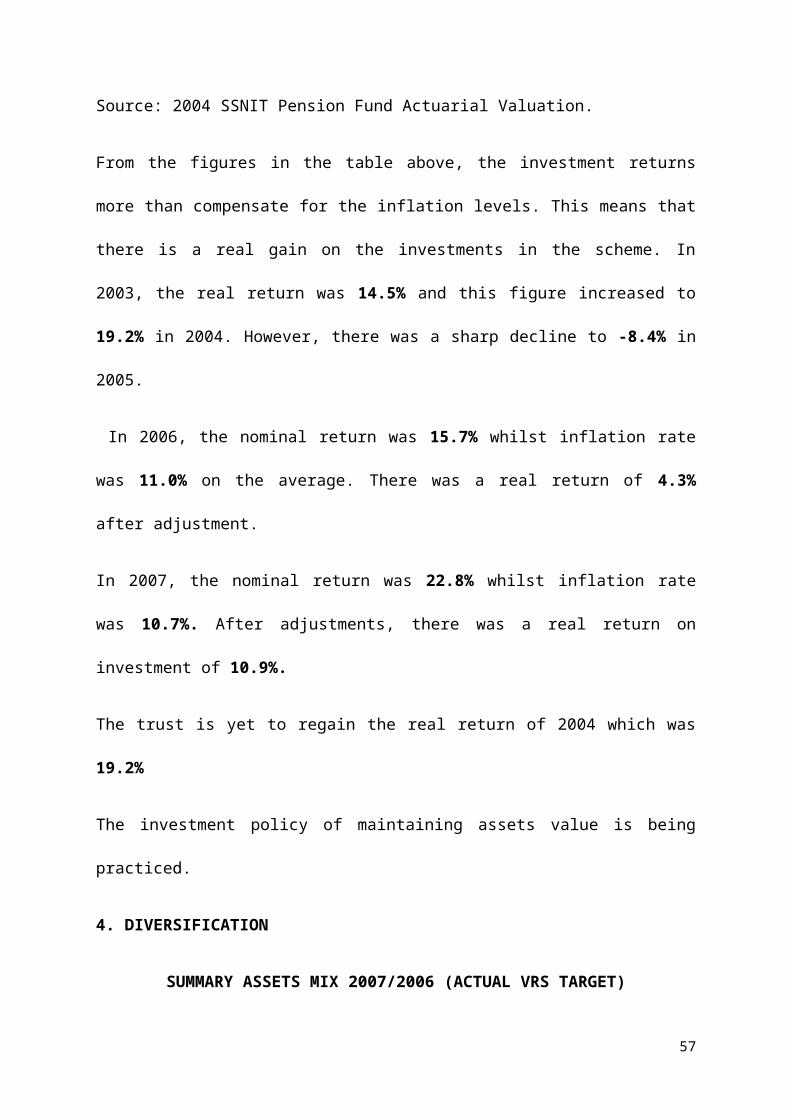
Source: 2004 SSNIT Pension Fund Actuarial Valuation.
40

From the figures in the table above, the investment returns more than compensate for the
inflation levels. This means that there is a real gain on the investments in the scheme. In
2003, the real return was 14.5% and this figure increased to 19.2% in 2004. However, there
was a sharp decline to -8.4% in 2005.
In 2006, the nominal return was 15.7% whilst inflation rate was 11.0% on the average.
There was a real return of 4.3% after adjustment.
In 2007, the nominal return was 22.8% whilst inflation rate was 10.7%. After adjustments,
there was a real return on investment of 10.9%.
The trust is yet to regain the real return of 2004 which was 19.2%
The investment policy of maintaining assets value is being practiced.
4. DIVERSIFICATION
SUMMARY ASSETS MIX 2007/2006 (ACTUAL VRS TARGET)
AS AT 31/12/2007 AS AT 31/12/2006
ASSET
CLASS
TARGET
POLICY
MIX
RE-BAL
RANGE
ACTUAL
ASSET
MIX
VARIANCE ACTUAL
ASSET
MIX
VARIANCE
Equity 29.0% +/-8% 31.49% -2.49% 29.85% -0.85%
Fixed
income
51.0% +/-4% 54.35% -3.35% 59.95% -8.9%
41

Real
Estate
15.0% +/-7% 14.11% +0.89% 10.13% +4.87%
ETI 5.0% +-/0% 0.05% +4.95% 0.07% +4.93%
Total 100% 100% 100%
Source: SSNIT Annual Report, 2007.
In light of changing economic trends, the asset mix has to be ever changing to reduce risks.
The targeted asset mix of the fund has not being achieved. At the end of 2006, there were
large variances between the targeted policy mixes of Fixed Income, Real Estate and the ETI
(Economically Targeted Investments). These variations fell outside the allowable ranges i.e.
the Re-Bal Range. Only Equity investment fell within the acceptable range.
As at the end of 2007, the desired target assets mix had still not been arrived at. There was a
slight variance in the equity asset class. The asset classes of fixed income investment, Real
Estate and ETI (Economically Targeted Investments) experienced large variations from the
targets.
5. HARMONY WITH PUBLIC INTEREST
The trust has various investments in certain sectors of the economy. In the year 2007 for
instance, there were various investments in companies such as Metro Mass Transit,
Ghana Hostels Limited as well as the Accra and Kumasi Abattoirs. The table below
highlights the economically targeted investments of the trust as at the end of 2007.
These investments were targeted at the sectors of economy that the government had
earmarked for further development.
EQUITY HOLDINGS CLASSIFIED AS ECONOMICALLY %
42

TARGETTED INVESTMENT HOLDING
1 EXPORT FINANCE COMPANY LIMITED 30
2 METRO MASS TRANSIT COMPANY 11.50
3 EXIMGUARANTEE COMPANY LIMITED 5
4 GHANA HEALTHCARE COMPANY LTD 100
5 GHANA HOTELS LIMITED 100
6 GHANA INDUSTRIAL &COMMERCIAL ESTATES LTD 100
7 CONSUMER CREDIT LIMITED 81
8 ACCRA ABBATOIRS COMPANY LIMITED 58.17
9 KUMASI ABBATTOIRS COMPANY LIMITED 53.40
Source: SSNIT Annual Report, 2007
43

6. SAFETY
2006 2007
Weighted Average Return Weighted Average Return
INVESTME
NT
ACTUAL TAR
GET
VARIANCE ACTUAL TARGET VARIANCE
Equity* 9.0% 9.30% -0.30% 6.9% 2.6% 4.3%
Fixed income 6.9% 5.7% +1.2% 7.3% 6.3% 1.0%
Real Estate 6.9% 2.1% +4.8% 1.5% 2.6% -1.1%
Total
(Nominal)
22.8% 17.1% +5.7% 15.7% 11.5% 4.2%
Source: SSNIT Annual Report, 2007
The variations in the return on investments are not so huge as to pose extraordinary risks to
the fund. This simply means that investments should not be made in high risk ventures. The
table below shows the variations in the investment returns of the fund in the years 2006 and
2007. There were mostly positive variations on the investment returns.
From the information above, the following can be deduced. In 2006, there were variances in
the targeted investment returns from a +4.3% to -1.1%. The investment returns on the whole
beat the targets by 4.2% points. In 2007, the equity investment experienced a negative
variation of 0.30% while Fixed income and Real estate experienced positive variations. The
returns signify that investments are being chosen with great care to ensure the long term
safety of the fund.
44

4.6 ANALYSIS OF THE QUESTIONNAIRE
The data collected from SSNIT pensioners were to determine whether the pension benefits
are able to maintain the economic security of the pensioners. Out of a total of 50
questionnaires issued, 40 were answered. The table below shows this information in more
detail.
Table 2 Summary of respondents
Frequency Percentage (%)
Male 25 50
Female 15 30
Destroyed 10 20
Total 50 100
Among other things, the questionnaire sought to find out whether or not pension received by the
pensioners was adequate for them. This data was presented in relation to their income before and
after retirement.
Figure 1Monthly Earning before retirement and Pension benefits for Males
45

Figure 2 Monthly Earning before retirement and Pension benefits for females
The main reason for operating a pension scheme or plan is to provide income replacement
after an employee’s normal working life. For the employee to maintain the same standard of
living, the monthly earning after retirement should be equivalent to the monthly earning
before retirement. Where there is disparity, it should not be too wide.
The adequacy of the pension can better be assessed through the information gathered
concerning the number of dependents. From the table below, it can e observed that most
pensioners have between 4- 6 dependents. When this is compared to the average monthly
pension received, the inadequacy of the benefit is more obvious.
Table 3 Number of dependents
None 1-3 4-6 Above 6
Male 4 5 11 3
Female 2 5 5 3
Total 6 10 16 9
46
Out of 40 respondents, 21 had knowledge of concerning one or more services provided by
SSNIT. Ten representing 25% of the respondents had some knowledge of other private retirement
products.
47

CHAPTER FIVE
LIMITATIONS, FINDINGS AND RECOMMENDATIONS
This chapter presents the limitations, findings derived from the data analysis stage and
recommendations are made as per the findings.
5.1 LIMITATIONS
Most of the respondents suffered from the effects of old age ranging from forgetfulness,
arthritic limbs and poor eye sight. We therefore had to spend an inordinate amount of time in
explaining the questions to them. There was also the language barrier and so there had to be a
translator at hand to help with the data gathering. The collection of secondary data from
SSNIT was hampered by complex bureaucratic procedures. Furthermore the information
gathered from SSNIT was not up to date as at the time it was needed.
5.2 FINDINGS
There is a strong positive correlation (r = 0.945) of pension fund assets and the economic
growth of Ghana. This implies a very strong relationship between the pension fund
investments and the general performance of the economy of Ghana’s Gross Domestic
Product. The prudent investment of pension funds will therefore yield very favourable rates
for economic growth in the country. In Regression 1, we found that the fund size is a good
predictor of the expected value of the GDP.
Regression 2 interchanged the variables making GDP the independent variable and fund size
the dependent variable. It was found out that though the correlation coefficient and the R-
square value were the same for both regressions, the regression equations were different. This
implies that though fund size can be used to predict the expected value of GDP and vice
versa, the regression equations used for the prediction are different. Looking at the two
48
equations, it can be observed that the fund size can better predict the value of the GDP than
using the GDP to predict fund size. From equation 1, even if the value of X (fund size) is
equal to zero, Y (GDP) will be equal to 4669.559. However this is not in the case of
regression equation 2; where X (GDP) is equal to zero, Y (fund size) will be equal to -
950.093. The fund size will yield a negative value.
On the financial market it was found out that pension funds play a very key role in its
development. Investigations show that SSNIT is the largest institutional investor on the
Ghana Stock Exchange Market. As at the end of 2007, SSNIT had holdings in 25 listed
equities and 49 in unlisted equities (Appendix 3 and 4) From Appendix 3 and 4, the trust have
equity holdings of 5% and above in 64 companies incorporated in Ghana. Currently, SSNIT
has holding in 18 out the 23 listed companies as well as 52 Manufacturing, Financial and
Service Sectors.
Through an analysis of the income statements to determine whether the policy objectives
were being achieved, it was observed that only 4 out of the 6 objectives were being
accomplished. Te policy objectives of safety and diversification still needed work. This is
because the desired asset mix has been consistently out of reach and this is crucial factor in
the safety of the entire investment portfolio.
Also, the retirees were found to be in approximately the same income bracket that they were
in during their working life. This presumes that the pension benefit relative to the income
replacement ratio (the ratio of income before and after retirement) is 1. From figure 1 and 2,
we observe that the earnings before and after retirement are within the same range.
However these amounts were still low in relation to the average dependency range (being 4-
6). Most of the monthly retirement benefit was below GH¢100. The benefit to contribution
49

percentage is minimal, from this SSNIT can afford to increase the benefit paid out. There is
enough funds for SSNIT to ensure that pensioners enjoy a certain basic standard of living.
The benefits to contribution percentage also revealed that there is a significant portion of
funds left to invest in the financial sector and other sectors of the economy.
There is a fair level of awareness about SSNIT’s investment project among the pensioners
who happen to be the chief stakeholders. Some effort must however be made to raise the
level of awareness.
5.3 RECOMMENDATIONS
The national pension’s scheme should provide a minimum level of pensions to ensure a basic
social safety net; at the same time, individuals should be encouraged to supplement their
social security pension through adequately regulated and supervised occupational and
personal pension scheme. There should be strengthening of the financial sector and
availability of appropriate investments to absorb the increasing pension funds.
Since it has been observed that the relationship between pension fund assets and economic
growth is very strong, attention must be paid to the investment of the funds so as to ensure
the sustainable growth of the economy.
There must be continuous monitoring of investment portfolio so as to generate more returns
to sustain the investment of the funds. There should be regular meetings with the
representatives of the various stakeholders of the SSNIT pension scheme to keep them
abreast with developments in relation to their investments. This will also improve
accountability and transparency, thereby influencing corporate governance.
50

There should be a fixed minimum return that must be gained from an investment before any
further investment is made in that particular venture. Those investments with below par
returns should be discontinued.
Reviews must be made semi annually to determine whether the policy objectives are being
achieved and appropriate action taken if they are not being achieved.
SSNIT can afford to increase the amount of benefits paid out due to the low benefits to
contribution percentage. This will in turn increase the general benefits paid out to pensioners,
thereby improving upon their economic situation.
The dependency load taken in to consideration in the computation of the pension benefit.
51

REFERENCES
1. Adjei E. N. A. (1999): Pension schemes in Africa: The National Experience of
Ghana, Social Security Documentation, African series No. 21, International Social
Security Association
2. Allen E. T., Melone J.J., Vanderhei J. L. (1992): Pension Planning. Irwin,7th Ed
3. Clark, G. L. and T. Hebb; 2003; Understanding Pension Fund Corporate
Engagement in a Global Arena; Working Paper in Geography No WPG 03-01;
Oxford University, England
4. Costa, D. The Evolution of Retirement: An American Economic History, 1880–
1990. Chicago: University of Chicago Press, 1998.
5. Davis E.P.(2000): Pension Funds, Financial Intermediation and the new Financial
Landscape.(Discussion Paper PI-0010)
6. Davis E.P.(2000): Pension Funds, Financial Intermediation and the new Financial
Landscape.(Discussion Paper PI-0010)
7. Graebner, W. A History of Retirement: The Meaning and Function of an American
Institution, 1885–1978. New Haven, Conn.: Yale University Press, 1980.
8. Henretta, J. C. ‘‘Uniformity and Diversity: Life Course Institutionalization and
Late Life Work Exit.’’ Sociological Quarterly 33 (1992): 265–279.
9. http:/en.wikipedia.org/wiki/Economy_May 24th 3:37pm
10. http://www.imf.org/org/external/pubs/ft/scr/2008/cr08332.pdf
11. http://www.ssnit.com/corp n.cfm? IDequal 24
12. http://www.ssnit.com/corp n.cfm? IDequal 24
13. Jacoby, S. Employing Bureaucracy: Managers, Unions and the Transformation of
Work, 1900–1945. New York: Columbia University Press, 1985.
52

14. Logue Dennis E., Rogalski,Richard J. (1884): Managing Corporate Pension Plans.
The Impacts Of Inflation, American Enterprise Institute for Public Policy
Research, Page 4.
15. Mackenzie, G. A., Gerson, P., Cuevas, A. (1997): Pension Regimes and Saving,
Occasional Paper, 153rd Ed., Pg 6. The basic features of Public Pension Plans
16. Network for Sustainable Financial Markets, Modernizing Pension Fund Legal
Standards for the 21st Century (11th February, 2009))
17. Neuman L. W. (2007); Basics of Social Research: Qualitative and
Quantitative Approaches, Pearsons Education Inc. 2nd Ed. Pg 143.
18. OTTAWAY, SUSANNAH. "Old Age." Europe, 1450 to 1789: Encyclopedia of the Early
Modern World. The Gale Group Inc. 2004. Encyclopedia.com. 26 May. 2009
<http://www.encyclopedia.com>.)
19. Skocpol, T. Protecting Soldiers and Mothers: The Political Origins of Social
Policy in the United States. Cambridge Mass.: Belknap, 1992.
20. The Gale Group Inc. 2002: "Retirement, Patterns." Encyclopedia of Aging..
Encyclopedia.com. 26 May. 2009 <http://www.encyclopedia.com>
21. The National Pensions Act, 2008, Act 766.
22. Wanetsha Mosinyi : Pension Funds have a massive development role (Mmegi
Online, Friday June 27, 2008 Vol. 25, No. 96)
23. Wilson J. E. (1990): “Health Care for the Elderly”, Business and Economic
Review 36, Page 42.
53

APPENDIX 1 Total Assets of Pension Funds in OECD countries
COUNTRY TOTAL ASSETS(US$)
AS % GDP
AS % OF TOTAL
AUS AUSTRALIA 188892.83 48.63 1.54
AUT AUSTRIA 7300 3.87 0.06
BEL BELGIUM 14400 5.74 0.12
CAN CANADA 310500 43.94 2.54
CHE* SWITZERLAND 268600 124.25 2.19
DEU GERMANY 62200 3.33 0.51
DNK DENMARK 40100 23.05 0.33
ESP*** SPAIN 32806 5.85 0.27.
GBR*** UK 1141830.72 79.87 9.33
ISL ICELAND 6700 78.91 0.05
ITA ITALY 48100 4.48 0.39
JPN JAPAN 2893319.29 60.72 23.63
NLD NETHERLANDS 550935.92 149.09 4.50
NOR** NORWAY 11300 7.36 0.09
NZL*** NEW ZEALAND 615 0.69 0.01
PRT PORTUGAL 12400 11.70 0.10
SWE SWEDEN 93922.37 41.01 0.77
USA US 6559771.48 6.87 53.58
TOTAL ASSETS WITHIN OECD COUNTRIES
12243693.61 42.19*** 100
SOURCE: various sources, including OECD Institutional Investors (2003), Davis and Steil (2001) and national sources. All data are converted into and measured at US Dollars, for the convenience of across-country comparison.
2000 data. **, 1997 data, *** average of pension assets of GDP within EMEs
54

APPENDIX 2. TOTAL ASSETS OF PENSION FUNDS WITHIN 29 EMES (AS OF 2002)
COUNTRY NAME TOTAL ASSETS(US $MN) AS % OF GDP AS % TOTAL
ARG ARGENTINA 11409 11.16 4.05
BGR BULGARIA 41.94 0.27 0.01
BOL BOLIVIA 1144 14.9 0.41
BRA BRAZIL 47656 10.53 16.92
CHL CHILE 35500 55.34 12.60
COL COLOMBIA 5482 6.67 1.95
CRI COSTA RICA 136 0.81 0.05
DOM DOMINICAN REPUBLIC 184.49 0.87 0.07
ECU ECUADOR 14.27 0.06 0.01
FJI FIJI 846.95 45.11 0.30
HND HONDURAS 3.28 0.05 0.00
HUN HUNGARY 1835 2.79 0.65
IDN INDONESIA 278.21 0.05 0.10
KAZ KAZAKHSTAN 1432 5.92 0.51
KOR* KOREA 11500 2.49 4.08
LKA* SRI LANKA 2697.99 16.55 0.96
MEX MEXICO 3174 84.98 11.27
MYS MALAYSIA 53605.11 56.33 19.03
PAK PAKISTAN 947.98 1.57 0.34
PAN PANAMA 464 3.77 0.16
PER PERU 4527 7.96 1.61
PHL PHILLIPPINES 3062.5 3.97 1.09
POL POLAND 6674 3.56 2.37
RUS RUSSIA 1612.7 0.47 0.57
SGP SINGAPORE 55526.98 63.85 19.71
SLV SLOVAKIA 1088 7.62 0.39
55

UKR UKRAINE 2.62 0.01 0.00
URG URUGUAY 893 7.25 0.32
ZAF** SOUTH AFRICA 1423.63 0.01 0.51
TOTAL ASSETS WITHIN EMEs 281736.65 11.55*** 100
SOURCE: various sources, including OECD Institutional Investors (2003), Davis and Steil (2001) and national sources. All data are converted into and measured at US Dollars, for the convenience of across-country comparison.
2000 data. **, 1997 data, *** average of pension assets of GDP within EMEs
APPENDIX 3
UNLISTED EQUITIES
NO COMPANY %
HOLDING
MANUFACTURING
1 SIAT 30.00
2 BESSBLOCK CONCRETE PRODUCTS COMPANY LIMITED 40.00
3 TEMA LUBE OIL COMPANY LIMITED 24.00
4 GAFCO (TEMA FOOD COMPLEX LTD) 40.00
5 DANNEX LTD 26.00
6 NINGO SALT 40.00
7 FOS COMPANY LTD 44.00
REAL ESTATE
1 GULF CONSOLIDATED CO LTD 42.00
2 BROLL GHANA LTD 32.00
HOSPITALITY SERVICES
1 ACCRA CITY HOTELS LTD 5.00
2 HOTEL INVESTMENTS (GH) LTD 100.00
3 GOLDEN BEACH HOTELS 70.00
4 INTERCITY HOLDINGS LTD 100.00
5 MAKOLA MARKET COMPANY LTD 90.00
6 SIMNET LTD 85.00
56
BANKING
1 GHANA INTENATIONAL BANK LTD 15.00
2 BPI BANK LTD 2.07
3 THE TRUST BANK LTD 61.14
4 MERCHANT BANK GHANA LTD 55.00
5 PRUDENTIAL BANK GHANA LTD 10.00
6 FIDELITY BANK LTD 10.00
7 FIRST ATLANTIC MERCHANT BANK LTD 19.93
FINANCE HOUSES
1 SECURITY DISCOUNT COMPANY LIMITED 28.15
2 CONSOLIDATED DISCOUNT HOUSE 5.40
3 NATIONAL TRIST HOLDING CO. LTD 34.00
OUT OF OPERATION (EITHER EXISTING OR ABOUT TO EXIT)
1 VIRTUAL PRIVATE NETWORK SYSTEMS 40
2 AMBASSADOR HOTEL 57
3 GHANA PIONEER FARMS LIMITED 46
4 ACCRA RECREATIONAL COMPLEX 30
UNDER RESTRUCTURING
1 BRIDAL TRUST INTERNATIONAL PAINTS LTD 60
2 WAHOME STEEL COMPANY LIMITED 92.81
3 GRANITE % MARBLES COMPANY LIMITED 88
4 BMK PARTICLE BOARD LIMITED 48.78
5 SUBRI PLANTATION 13.60
57

WORK IN PROGRESS
1 OGUAA HOTELS LIMITED 77.97
2 METROPOLITAN MALLS LIMITED 45
PRIVATE EQUITY FUND
NO FUND % OF FUND
1 CANADA INVESTMENT FUND FOR AFRICA (CIFA)(US$) 2.37
2 PAN AFRICAN INFRASTRUCTURE DEV. FUND(PAIDF)(US$) 1.60
3 FIDELITY EQUITY FUND (FEF) II (US$) 21
EQUITY HOLDINGS CLASSIFIED AS ECONOMICALLY TARGETTED
INVESTMENT
1 EXPORT FINANCE COMPANY LIMITED 30
2 METRO MASS TRANSIT COMPANY 11.50
3 EXIMGUARANTEE COMPANY LIMITED 5
4 GHANA HEALTHCARE COMPANY LTD 100
5 GHANA HOTELS LIMITED 100
6 GHANA INDUSTRIAL &COMMERCIAL ESTATES LTD 100
7 CONSUMER CREDIT LIMITED 81
8 ACCRA ABBATOIRS COMPANY LIMITED 58.17
9 KUMASI ABBATTOIRS COMPANY LIMITED 53.40
SSNIT Annual Report, 2007
58

APPENDIX 4
LISTED EQUITIES
LISTED EQIUTIES
NO COMPANY %HOLDING
1 ACCRA BREWERY LTD 11.13
2 FAN MILK LTD 1.25
3 GUINESS GHANA RBRWERIES LTD 11.03
4 TOTAL GHANA LTD 2.61
5 STANDARD CHARTERED BANK LTD 14.34
6 UNILEVER GHANA LTD 5.28
7 ANGLOGOLD ASHANTI LTD 0.02
8 ANGLOGOLD ASHANTI DEPOSITORIES 0.0004
9 MECHANICAL LLYOD CO LTD 17.63
10 HFC BANK LTD 21.18
11 SG-SSB BANK LTD 21.61
12 ENTERPRISE INSURANCE LTD 6.13
13 GHANA COMMERCIAL BANK LTD 29.81
14 ALUWORKS LTD 24.90
15 PRODUCE BUYING COMPANY LTD 1 26.95
16 PRODUCE BUYING COMPANY LTD (PBC) 2A 11.15
17 COCOA PROCESSING CO LTD 18.78
18 BENSO OIL PALM PLANTATION CO LTD 3.74
19 CAL BANK LTD 27.52
20 GOLDEN WEB LTD 24.27
21 ECOBANK GHANA LTD 0.90
22 ARTYN DRUGS LTD 26.00
23 ECOBANK TRANSNATIONAL INCORPORATED 5.43
24 GHANA OIL COMPANY LTD 18.51
25 STATE INSURANCE CO LTD 13.71
SSNIT Annual Report, 2007
59

QUESTIONNAIRE
TOPIC: THE ROLE OF PENSION SCHEMES IN THE ECONOMY OF GHANA – A CASE STUDY OF SSNIT.
This questionnaire is to help us attain a Bachelor of Science degree in Administration (Insurance
Option). Please answer the following questions as correctly as possible. Tick the box below where
necessary or fill in the information as may be required. All information given is for academic
purposes and shall be treated as highly confidential.
PART ONE
1.1 Age: 60 – 65 [ ] 65 -70 [ ] 70 and over [ ]
1.2 Gender: male [ ] female [ ]
1.3 Marital Status: single [ ] married[ ] divorced [ ]
1.4 Number of dependents: none[ ] 1-3 [ ] 4-6 [ ]
more than 6 [ ]
PART TWO
2.1Are you a member of the SSNIT pension scheme?
Yes [ ] No [ ]
2.2 For how long did you contribute?
……………………………………………………..
2.3 How long have you been receiving benefits from the
scheme? ........................................................................................................
2.4 Do you know of any other private provident funds in Ghana apart from the SSNIT pension
scheme? Yes [ ] No [ ]
60

PART THREE
2 What benefit(s) do you gain from the scheme?
Old Age Pension [ ] Invalidity Pension [ ] Survivors’ Lump Sum
Benefit [ ]
3.2 How much was your monthly income before retirement?
Less than GH¢100 / ¢1,000,000 [ ]
GH¢100 - GH¢500 / ¢1,000,000 – ¢5,000,000 [ ]
GH¢500 - GH¢1000 / ¢5,000,000 – ¢10,000,000 [ ]
GH¢1,000 / ¢10,000,000 and above [ ]
3.3 How much is your monthly pension benefit now?
Less than GH¢100 / ¢1,000,000 [ ]
GH¢100 - GH¢500 / ¢1,000,000 – ¢5,000,000 [ ]
GH¢500 - GH¢1000 / ¢5,000,000 – ¢10,000,000 [ ]
GH¢1,000 / ¢10,000,000 and above [ ]
3.4 Is the pension benefit adequate?
Yes [ ] No [ ]
3.5 After retirement, how long did you have to wait to receive your first benefit?
1 – 3 months [ ]
4 – 6 months [ ]
61

7 – 9 months [ ]
9 months and above [ ]
3.6 How often do you receive your pension benefits?
Every month [ ]
Every two months [ ]
More than three months [ ]
3.7 How do you access your retirement?
Banks and other financial institutions [ ]
Former work place [ ]
Other [ ]
3.8 How far is the access point from your residence?
Less than 15 minutes [ ]
15-30 minutes drive [ ]
30-60 minutes drive [ ]
More than 60 minutes [ ]
PART FOUR
4.1 Do you know of any other services provided by SSNIT apart from the pension plans?
Yes [ ] No [ ]
62

4.2 If yes, which one(s)?
Student loans [ ]
Real Estate [ ]
Lending to companies [ ]
Investing on the Ghana Stock Exchange [ ]
4.3 What other services do you think SSNIT should provide?
-----------------------------------------------------------
-----------------------------------------------------------
-----------------------------------------------------------
-----------------------------------------------------------
-----------------------------------------------------------
Thank you
63