impact of land certification in amhara
DESCRIPTION
Impact of land certification in Amhara. on tenure security, investment and rental markets. By Deininger, Daniel and Tekie. World Bank: March 9-10, 2009 Washington DC. Motivation. The demand for secure property rights to land - PowerPoint PPT PresentationTRANSCRIPT

Impact of land certification in Amhara
on tenure security, investment and rental markets
By Deininger, Daniel and
TekieWorld Bank:
March 9-10, 2009Washington DC

Motivation The demand for secure property rights to land
• Need for investment to increase agricultural productivity & sustainability • Increasing urbanization, escalating land prices, governance challenge• ‘Scramble’ for land in wake of bio-fuel boom (speculation)
Supply-side factors • New land legislation in much of Africa in 90s• Advances in IT and remote sensing reduces cost
But why has so little happened on the ground?• Technical or institutional obstacles? • Limited benefits compared to cost? • Political reasons?
Ethiopia as an interesting case • Huge program (25 mn plots) quite rapidly implemented; little outside ass.• Turns conventional wisdom on its head
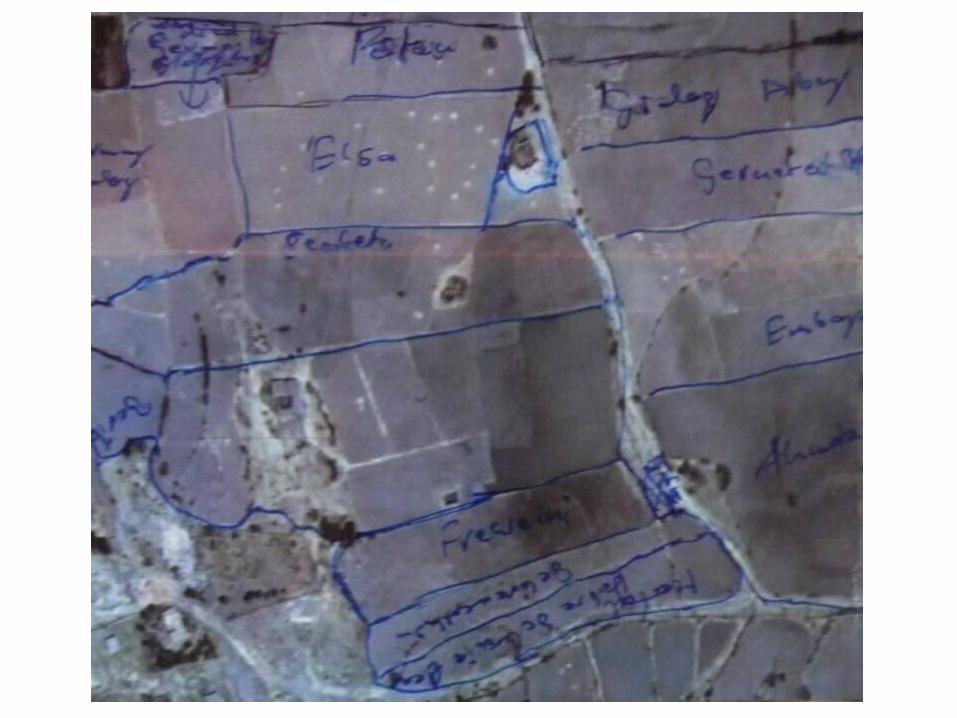
• Participatory local process - rather than expert driven• Confers non-alienable rights - and plenty of remaining policy restrictions • No spatial reference at all – contrary to surveyors

Tenure security effects
Evidence of tenure security effects • Investment effects (virtually everywhere) • Higher land values, housing investment in urban areas • Ability to transfer land to better uses• Less need to guard assets: Formal labor markets, child labor• Governance, conflict corruption, and institutional performance• Will be more pronounced if insecurity high
But their realization depends on a few preconditions• Recognition of local arrangements rather than imposition of new
models• Equity effects if there is no broad access to information • State presence and ability to enforce• Institutional and economic sustainability (cost-effectiveness)

Transferability & credit effects
Rationale: Reliable information on ownership • Assures against dispute if rented out• Reduces transaction cost associated with transfer • If formalized for sale can be used as collateral for credit
Evidence on rental evidence • Increases in relevance with emergence of off-farm sector (Vnm)• Allows to increase productivity through transfer to non-relatives • Magnitude between 60% and 20%
Credit market impacts • Credit-worthy projects a precondition• Many potential limitations (foreclosure, liquidity) • Institutional and economic sustainability (cost-effectiveness)

Policy environment Evolution of Ethiopia’s rural land policy environment
• Feudalist structure followed by nationalization (state/communist property) in 1975
• A number of redistributions b/n 1975 and 1997• 1991 reforms; 1995 constitution w. guaranteed access• 1997 decentralization of responsibility to regions
Reasons for high tenure insecurity• 1997 Amhara redistribution• Federal vs State power on land issues; 2005 federal proclamations
tries to reign in regional autonomy • Urban and agro-industrial expansion (flowers); possibility of
biofuels• Leasing still restricted everywhere except Amhara • Led to pressures on improving security

Program characteristics & hypotheses
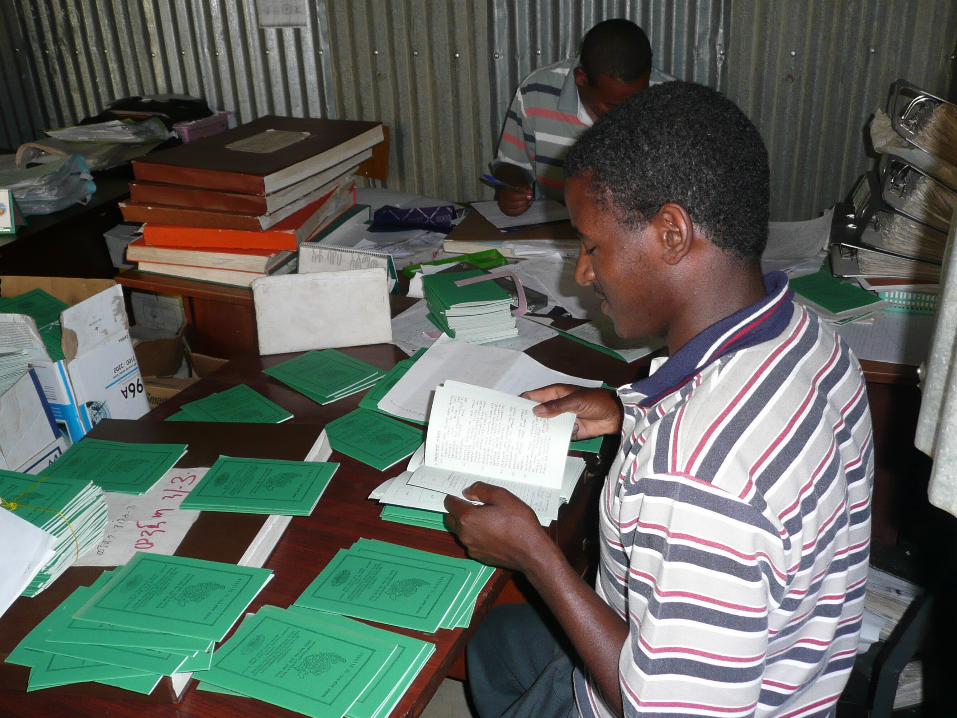
Main features • Democratically elected LAC has responsibility• Field-based adjudication process (elders to resolve conflict)• Certificates with holders’ pictures but no map (added in 2nd stage) • Very cost-effective ‘1st stage’ (< 1 US$/parcel) trad’l methods 2nd stage
Process characteristics (from nation-wide survey)• Public meetings held, LACs with members from most sub-kebeles• High share of field-based adjudication • Only 5% of unresolved conflicts (vs. 20%+ in Thailand)
Case study/survey evidence on possible impact • High willingness to pay to replace certificate• Reduction of conflict • Gender (women’s pictures, awareness where stored); polygamy


Data and general approach
Data sources • 4-round panel (1999, 2001, 2004, 2007) from 7 villages in East Gojam• Some 900 households with 4,000 plots in each round • 3 rounds before implementation, some certified in 4th round
Identification strategy • Define villages as treated if certified > 12 months ago • Control for household fixed effects • Verify that there is little difference in time-varying effects • Conservative estimate for two reasons
• Even in treated villages not all households have certificates• Many households in untreated ones had certificates
Expected short-term impacts • Perceived tenure security• Investment• Rental market participation

Table 1: Program characteristics by village Certificates issued 12 months before survey? No Yes
District (Woreda) name Gozamin Enemay Machakel Gozamin
Village (Kebele) name Kebi Wolkie Telma S.
Debir Amanu
el D. Elias A.
Gulit Kebele area in ha 630 2670 1964 2560 4373 1790 2172 No of households 1094 1050 1464 1275 1151 906 890 Program introduced May 05 Sep. 06 Oct. 03 Jun. 05 Feb. 04 Feb. 04 Feb. 03 Competed registration Dec. 05 NC Aug. 06 Dec. 06 Jun. 04 Jul. 04 May 05 Start cert. distribution Aug. 06 NS Sep. 06 NS Feb. 05 Feb. 05 Jun. 05 No. of LAC members 15 20 21 35 14 14 18 Training days to LAC 3 5 8 8 9 4 6 No of village meetings 4 4 6 2 5 3 3
Source: Own computation from AAU/Gothenburg/WB Survey NC=Not completed at the time of the survey. NS=Not started at the time of the survey.

Table 2: Program characteristics at household and plot levels Certificates issued? No Yes Household level data HH member attended public information meetings 0.78 0.85 Number of meetings attended 3.50 3.60 Well informed about the program 0.68 0.85 Has landholding certificate 35.55 87.47 Number of months since certified 8.07 17.15 Plot level data Plot has a certificate 0.30 0.75 Plot area was determined in the field 0.64 0.92 .. if yes, measured using tape and rope 0.65 0.95 More than half of the neighbors present 0.35 0.59 Number of months since certified 8.19 16.93 Plot is jointly certified with head and spouse 0.83 0.77 Number of households 481 359 Number of plots 2369 2143
Source: Own computation from AAU/Gothenburg/WB Survey

Table 3: Household characteristics by treatment category over time No certificate With certificate 1999 2002 2004 2007 1999 2002 2004 2007 Total owned land 1.34 1.35 1.61 1.47 1.57 1.59 1.89 2.06 Owned land per aeu in ha 0.36 0.34 0.36 0.32 0.37 0.34 0.36 0.38 Share of good quality land 0.36 0.32 0.31 0.44 0.36 0.33 0.28 0.39 Number of dependents 2.50 2.59 2.70 2.68 2.83 2.97 2.84 2.83 Number of adult male 1.24 1.41 1.65 1.79 1.41 1.54 1.71 1.95 Number of adult female 1.21 1.33 1.58 1.68 1.36 1.53 1.71 1.93 Number of oxen 1.20 1.20 1.17 1.29 2.22 1.98 1.99 2.06 Value of livestock (B) 1,628 1,670 1,771 1,962 2,883 2,839 2,888 3,081 Value of other anim. (B) 857 924 1,026 1,124 1,432 1,309 1,591 1,737 Iron roof 0.55 0.60 0.71 0.79 0.61 0.70 0.86 0.91 Age of head (years) 44.17 45.66 48.08 49.81 44.87 46.67 48.72 50.46 Female headed household 0.13 0.12 0.15 0.17 0.10 0.07 0.17 0.19 Head can read and write 0.39 0.38 0.35 0.27 0.48 0.48 0.42 0.43 Crop output/ha (B) 1,926 634 2,596 3,283 2,564 880 2,187 2,804 Number of households 462 463 475 477 229 233 347 356
Source: Own computation from AAU/Gothenburg/WB Survey

Table 4: Plot Level Characteristics by Treatment Category
No certificate With certificate 2004-2007 2004-2007
Plot size in hectares 0.31 0.34
Number of years possessed 20.84 21.44 Good soil quality 0.38 0.35 Medium soil quality 0.37 0.43 Flat land 0.57 0.72 Gently sloped land 0.34 0.23 Irrigated land 0.04 0.04
Number of observations (plots) 4699 3972 Source: Own computation from AAU/Gothenburg/WB Survey

Outcome variables considered
Perception of admin. land size change next 5 years• Recent land redistribution • Uncompensated expropriation for urban expansion• Both loss and increases relevant (political pressure) • Question included all 4 years
Investment in soil & water conservation structures • Should see a direct investment effect• Existence and new construction• No of hours spent in maintaining/constructing
Land rental market participation • Amhara the only region where no constraints in terms of length• Both participation and area transferred

Table 5: Outcome Variables by Treatment Category None With certificate 1999 2002 2004 2007 1999 2002 2004 2007 Expectations of land redistribution in the next five years and of conflict Expect change in holdings 0.75 0.62 0.38 0.39 0.78 0.64 0.38 0.24 Expect increase 0.55 0.45 0.19 0.11 0.55 0.36 0.18 0.04 Expect a decrease 0.20 0.17 0.19 0.28 0.23 0.27 0.19 0.19 Concern about conflict (%) 0.20 0.14 Land related investment over the last 12 months (plot level) Repaired/built structure 0.36 0.24 0.12 0.25
Number of hours spent 8.22 5.51 2.26 4.38 Constructed new structure 0.10 0.08 0.07 0.10 Plot has structure 0.44 0.34 0.22 0.32 Market participation
Rent-out land 0.24 0.21 0.29 0.34 0.17 0.15 0.26 0.33 Area rented out (ha) 0.20 0.21 0.28 0.34 0.14 0.16 0.32 0.45 Rent- in land 0.37 0.26 0.20 0.36 0.49 0.31 0.36 0.45 Area rented in (ha) 0.25 0.19 0.15 0.29 0.29 0.19 0.27 0.44
Number of households 462 463 475 477 229 233 347 356 Number of plots 2284 2415 1886 2086 Source: Own computation from AAU/Gothenburg/WB Survey.

,itiitittit ucwy γx (1)
Risk of land loss
use Chamberlain’s method
Equation to be estimated

Table 6: Impact of certification on perceived land tenure security: Marg. effects Expect an increase Expect a decrease Chamberlain Chamberlain LUC issued -0.135*** -0.135*** -0.093*** -0.095*** (-4.12) (-4.13) (-4.34) (-4.43) Relative land size -0.106*** -0.106*** 0.040*** 0.041*** (-7.33) (-7.31) (4.11) (4.26) Share of good qual. land 0.066** 0.070*** -0.055** -0.055** (2.52) (2.66) (-2.33) (-2.35) Iron roof -0.066*** -0.019 0.052*** 0.031 (-3.01) (-0.56) (2.90) (1.04) Head’s age -0.015*** -0.016*** 0.006* 0.010*** (-3.73) (-3.70) (1.77) (2.62) Year = 2002 -0.093*** -0.098*** -0.012 -0.021 Year = 2004 -0.243*** -0.253*** -0.049** -0.070*** Year = 2007 -0.320*** -0.333*** 0.052* 0.012 No. of obs. 3042 3042 3042 3042 No. of hh 882 882 882 882 Log lik. -1467.109 -1461.588 -1510.578 -1502.232 Chi-squared 518.218 517.908 111.531 126.756

Investment & rental market
,jitiijititittjit uawψy ξδ xpx γ
,001, itiiitiitittit uayywψy ξxx γ
Plot-level investment equation
Household-level rental market participation
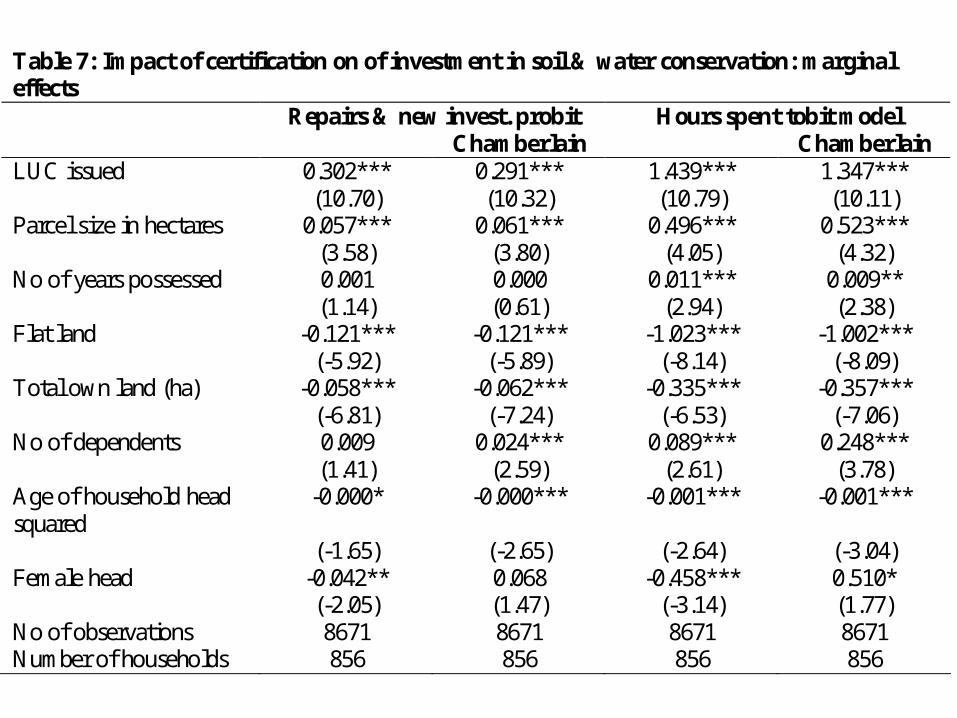
Table 7: Impact of certification on of investment in soil & water conservation: marginal effects Repairs & new invest. probit Hours spent tobit model Chamberlain Chamberlain LUC issued 0.302*** 0.291*** 1.439*** 1.347*** (10.70) (10.32) (10.79) (10.11) Parcel size in hectares 0.057*** 0.061*** 0.496*** 0.523*** (3.58) (3.80) (4.05) (4.32) No of years possessed 0.001 0.000 0.011*** 0.009** (1.14) (0.61) (2.94) (2.38) Flat land -0.121*** -0.121*** -1.023*** -1.002*** (-5.92) (-5.89) (-8.14) (-8.09) Total own land (ha) -0.058*** -0.062*** -0.335*** -0.357*** (-6.81) (-7.24) (-6.53) (-7.06) No of dependents 0.009 0.024*** 0.089*** 0.248*** (1.41) (2.59) (2.61) (3.78) Age of household head squared
-0.000* -0.000*** -0.001*** -0.001***
(-1.65) (-2.65) (-2.64) (-3.04) Female head -0.042** 0.068 -0.458*** 0.510* (-2.05) (1.47) (-3.14) (1.77) No of observations 8671 8671 8671 8671 Number of households 856 856 856 856
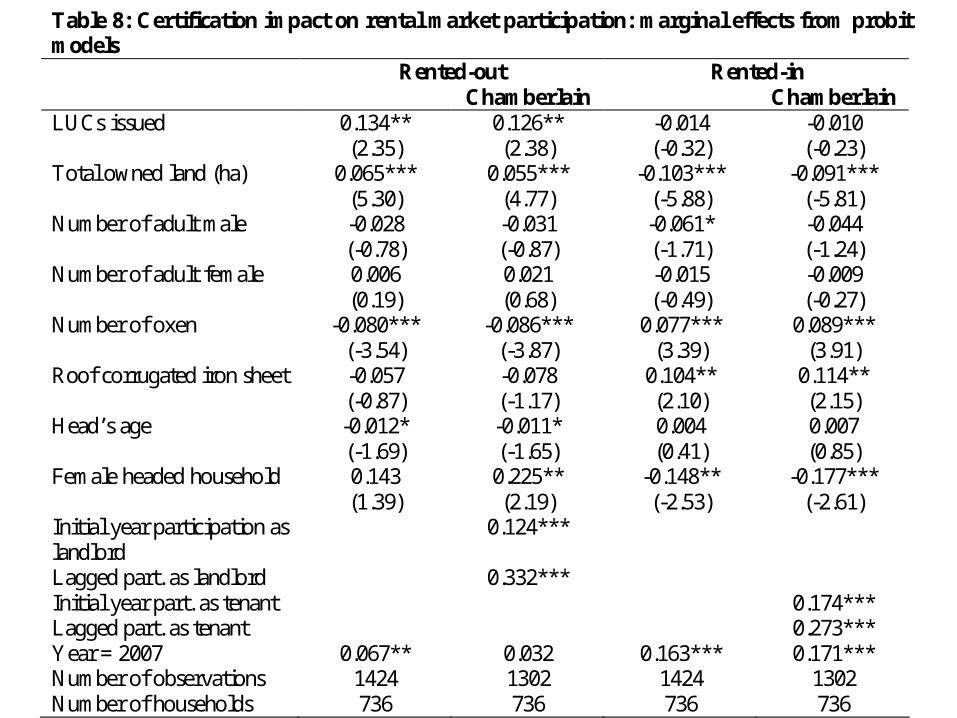
Table 8: Certification impact on rental market participation: marginal effects from probit models Rented-out Rented-in Chamberlain Chamberlain LUCs issued 0.134** 0.126** -0.014 -0.010 (2.35) (2.38) (-0.32) (-0.23) Total owned land (ha) 0.065*** 0.055*** -0.103*** -0.091*** (5.30) (4.77) (-5.88) (-5.81) Number of adult male -0.028 -0.031 -0.061* -0.044 (-0.78) (-0.87) (-1.71) (-1.24) Number of adult female 0.006 0.021 -0.015 -0.009 (0.19) (0.68) (-0.49) (-0.27) Number of oxen -0.080*** -0.086*** 0.077*** 0.089*** (-3.54) (-3.87) (3.39) (3.91) Roof corrugated iron sheet -0.057 -0.078 0.104** 0.114** (-0.87) (-1.17) (2.10) (2.15) Head’s age -0.012* -0.011* 0.004 0.007 (-1.69) (-1.65) (0.41) (0.85) Female headed household 0.143 0.225** -0.148** -0.177*** (1.39) (2.19) (-2.53) (-2.61) Initial year participation as landlord
0.124***
Lagged part. as landlord 0.332*** Initial year part. as tenant 0.174*** Lagged part. as tenant 0.273*** Year = 2007 0.067** 0.032 0.163*** 0.171*** Number of observations 1424 1302 1424 1302 Number of households 736 736 736 736

Certification impact on size of land rented: marginal effects from tobit models Land rented-out Land rented-in Land use certificates issued 0.088*** 0.092*** 0.007 0.020 (2.77) (2.83) (0.29) (0.78) Total own land (ha) 0.086*** 0.074*** -0.061*** -0.051*** (11.07) (9.54) (-6.48) (-5.45) Number of oxen -0.094*** -0.095*** 0.041*** 0.044*** (-6.24) (-6.30) (3.29) (3.34) Roof corrugated iron sheet -0.054 -0.061 0.063* 0.073** (-1.38) (-1.50) (1.83) (2.18) Age of head (years) -0.009** -0.008* 0.001 0.002 (-2.29) (-1.79) (0.24) (0.47) Female head 0.076 0.096* -0.119** -0.122** (1.42) (1.68) (-2.36) (-2.47) Head can read and write 0.063* 0.088** 0.002 0.016 (1.69) (2.25) (0.08) (0.51) Initial value of rented land 0.035 0.112*** Lag of rented land 0.082*** 0.137*** Year = 2007 0.047** 0.039* 0.082*** 0.077*** (2.34) (1.81) (4.13) (3.50) Number of observations 1424 1302 1424 1302 Number of households 736 736 736 736

Determinants of value of crop output: household fixed effect estimates Value of crop output (log) Plot has soil and water conservation structures 0.091*** Plot size (hectares) 0.276*** Male adult labor (days) 0.334*** Female adult labor (days) -0.001 Hired labor (days) 0.023 Oxen (days) 0.128*** Chemical fertilizer (kg) 0.155*** Manure (kg) 0.027** Number of year possessed -0.000 Good soil quality 0.185*** Medium soil quality 0.110*** Flat land 0.031 Gently sloped land 0.055* Irrigated land 0.138*** Year = 2002 -0.884*** Year = 2004 0.383*** Year = 2007 0.671*** Number of observations 11689 Number of households 844 R2 0.554

Policy implications for Ethiopia
Ensure sustainability of impacts • Political economy very interesting (accident)• Establish mechanisms for regular updating (computerization)• Add spatial element (satellite imagery)• Systematically include CPRs
• Demarcation & dealing with encroachment• Rules for internal management • Enforcement mechanisms
Enhance benefits through policy changes • Land leasing & off-farm employment • Threat of redistribution/enforcement of LT contracts• External threat from expropriation
Explore longer-term effects • Already benefit much beyond cost• But could be much larger (& very cost-effective)• Especially with policy changes

Broader implications
Local rights recognition can have significant impact • Can be implemented cost-effectively ($1.5 w. satellite image)• Benefit likely to exceed cost in most situations• Communal arrangements can be relied upon, unless high inequality
Replace titling with recognition of rights • Both individual and communal rights • Work on specific arrangements for the latter• Use as basis for institutional mechanisms (local democracy, updating)
Need for quick & comprehensive action• Rush for biofuels & commodity boom increases land values• Unless rights are recognized, this can lead to large-scale dispossession• Legal basis exists in most African countries • But implementation is sorely lacking & even some backsliding• This is not land reform - but may prevent the need for one in the
future