impact of hsp40 and hsp70 on in-cell htt aggregation kinetics 1 a
TRANSCRIPT

Impact of hsp40 and hsp70 on in-cell Htt aggregation kinetics
1
A platform to view huntingtin exon 1 aggregation flux in the cell reveals divergent influences from chaperones hsp40 and hsp70*
Angelique R. Ormsby1, Yasmin M. Ramdzan1, Yee-Foong Mok1, Kristijan D. Jovanoski1, and Danny M. Hatters1*
1From the Department of Biochemistry and Molecular Biology Bio21 Molecular Science and Biotechnology Institute
30 Flemington Road The University of Melbourne
Melbourne VIC 3010 Australia
*Running title: Impact of hsp40 and hsp70 on in-cell Htt aggregation kinetics
To whom correspondence should be addressed: Danny M. Hatters, Department of Biochemistry and Molecular Biology, Bio21 Molecular Science and Biotechnology Institute, 30 Flemington Road, The University of Melbourne, Melbourne, VIC, 3010, Australia, Tel.: +61 3 8344 2530; Fax: +61 3 9348 1421; E-mail: [email protected]
Keywords: Amyloid, polyglutamine (polyQ), huntingtin (htt), analytical ultracentrifugation, PulSA, oligomers
Background: How misfolded proteins such as mutant huntingtin aggregate in the cell remains enigmatic. Results: We built a platform to view how aggregation proceeds and assessed the impact of quality control chaperones hsp40 and hsp70. Conclusion: Hsp70 enhanced survival of cells with aggregates; hsp40 suppressed aggregation. Significance: We developed a new toolkit to illustrate the impact of protein aggregation on cell biology.
ABSTRACT
Our capacity for tracking how misfolded proteins aggregate inside a cell and how different aggregation states impact cell biology remains enigmatic. To address this we built a new toolkit that enabled the high-throughput tracking of individual cells enriched with polyglutamine-expanded Htt exon 1 (Httex1)2 monomers, oligomers and inclusions using biosensors of aggregation state and flow cytometry pulse shape analysis. Supplemented with gel filtration chromatography and fluorescence-adapted sedimentation velocity analysis of cell lysates, we collated a multi-dimensional view of Httex1 aggregation in cells with respect to time, polyglutamine length, expression levels, cell survival, and
overexpression of protein quality control chaperones hsp40 (DNAJB1) and hsp70 (HSPA1A). Cell death rates trended higher for Neuro2a cells containing Httex1 in inclusions than with Httex1 dispersed through the cytosol at time points of expression over 2 days. Hsp40 stabilized monomers and suppressed inclusion formation but did not otherwise change Httex1 toxicity. Hsp70 on the other hand had no major effect on aggregation of Httex1 but increased the survival rate of cells with inclusions. Hsp40 and hsp70 also increased levels of a second bicistronic reporter of Httex1 expression, mKate2, and increased total numbers of cells in culture, suggesting these chaperones partly rectify Httex1-induced deficiencies in quality control and growth rates. Collectively this data suggests that Httex1 overstretches the protein quality control resources, and that the defects can be partly rescued by overexpression of hsp40 and hsp70. Importantly these effects occurred in a pronounced manner for soluble Httex1, which points to Httex1 aggregation occurring subsequently to more acute impacts on the cell.
Protein misfolding and aggregation into β-sheet rich amyloid fibrils is a hallmark and possible cause of at least 36 human diseases (1). Our basic knowledge of protein misfolding and how the
http://www.jbc.org/cgi/doi/10.1074/jbc.M113.486944The latest version is at JBC Papers in Press. Published on November 6, 2013 as Manuscript M113.486944
Copyright 2013 by The American Society for Biochemistry and Molecular Biology, Inc.
by guest on January 4, 2019http://w
ww
.jbc.org/D
ownloaded from
Impact of hsp40 and hsp70 on in-cell Htt aggregation kinetics
2
inherent features of proteins and physicochemical environment influence aggregation has largely come from purified peptide and protein model systems (2-5). A common theme has emerged that aggregates, notably small oligomeric forms can incur toxicity to cells (6,7). When aggregates form in a cell however, they do so in an environment of omnifarious influence from protein quality control mechanisms (8). Protein quality control processes change the landscape by which proteins spontaneously aggregate by refolding misfolded conformations, disaggregating aggregates, degrading them, and sorting them into different cellular locations such as aggresomes, IPODs (Insoluble protein deposits) and JUNQs (Juxta nuclear quality control compartments) for deposition and sequestration (9-14).
The active movement of misfolded proteins into deposits such as aggresomes presents a paradox to the study of the effect of protein misfolding and aggregation in situ. On one hand organized aggregation by protein quality control machinery has net benefits to cell health, whereas on the other spontaneous inappropriate aggregation is capricious (15). It remains plausible that both phenomena occur at the same time especially when protein quality control capacity loses capacity to control aggregation in an organized fashion (16). The contradictory nature of these processes and their relevance to disease necessitates more sophisticated approaches to decipher the molecular process of aggregation inside the cell and how this may impact on cell health (15).
With this in mind, we developed new toolkits to more precisely probe the intracellular conformation and aggregation state of the exon 1 fragment of mutant huntingtin protein (Httex1) in cells, which has a number of attractive features for this problem (17-19). Mutant Httex1 accumulates as intracellular inclusion bodies in Huntington’s disease, which is caused by mutations that result in an expansion of a polyglutamine (polyQ) sequence within Httex1 to beyond a threshold of 36 glutamines (Q) (20,21). PolyQ expansions in the pathological range leads to Httex1 spontaneously assembling into amyloid-like fibrils in a manner that is faster for longer polyQ lengths (22,23). Expression of polyQ-expanded proteins in animals and cells recapitulates aggregation and pathology in a polyQ-length dependent manner,
demonstrating clear links between the intrinsic biophysical attributes of Httex1, aggregation and pathology (24-26).
Our first toolkit involved the development of tetracysteine-based biosensors for detecting the earliest oligomerization steps of the Httex1 in live cells (17). The TC9 sensor is a derivative of Httex1 with an engineered tetracysteine (TC) tag embedded with the Httex1 sequence that is masked from binding to biarsenical fluorescent dyes upon self-assembly in vitro (17). Httex1TC9 is also tagged C-terminally with a fluorescent protein (eg CFP derivative Cerulean) that independently reports of the presence of the protein. Hence, two-colour imaging enables readouts of the balance of monomers and aggregates inside live cells, independently to cellular localization (17). This technology was recently merged with a flow cytometry pulse shape analysis (PulSA) method, which utilizes fluorescent pulse width and height information from a flow cytometer to monitor changes in the intracellular distribution of protein (19). PulSA in combination with the TC9 sensor system enabled a distinction in detection of biochemical aggregates, which can be as small in theory as a dimer (ie nanometer scale), from the condensation into microscopically visible structures (ie micrometer scale) such as inclusions, providing a new high throughput capacity to track cells enriched with dispersed oligomers of Httex1 from cells with monomers or the inclusions.
A second toolkit was sedimentation velocity analysis (SVA) with analytical ultracentrifugation to quantitate the oligomeric size and heterogeneity of GFP tagged Httex1 aggregate forms in a cell lysate (18). For the aggregation prone 46Q form of Httex1, this approach yielded a heterogeneous mixture of oligomers, most abundantly about 30 nm in diameter. The non-aggregation 25Q isoform of Httex1 in contrast only yielded monomers. The combination of the single cell approaches with biochemical approaches (eg SVA) in principle provides an enabling platform to define the kinetic process of aggregation approaching a molecular scale of detail.
Here we describe an implementation of an integrated platform for defining Httex1 aggregation in the cell by merging our existing toolkits together and developing new capabilities to follow cell death and protein levels. We used this workflow to first monitor the impact of
by guest on January 4, 2019http://w
ww
.jbc.org/D
ownloaded from
Impact of hsp40 and hsp70 on in-cell Htt aggregation kinetics
3
aggregation state on cell death, and second examine how elevation of key inducible members of the heat shock protein family (hsp70 protein HSPA1A and its hsp40 cofactor DNAJB1) alter the Httex1 aggregation landscape and cell survival when levels are elevated. Hsp70 and its co-chaperone hsp40 are key elements that have canonical functions in assisting proteins to fold correctly — and they potently inhibit toxicity of Httex1 in model systems (27-30). How they do this remains enigmatic because protection does not always occur with reducing inclusions, which seems counterintuitive to their canonical role in assisting proteins to fold (30-36).
EXPERIMENTAL PROCEDURES Cloning of constructs – The TC9 variant of
Httex1 was generated as described (17). The Httex1-Emerald constructs were produced as described (18), to produce Httex1 with a C-terminal Emerald fusion in the pT-Rex vector backbone (Invitrogen).
The IRES vectors were made by inserting an IRES sequence C-terminally to the Httex1TC9-Cerulean moiety in the pT-Rex backbone. Specifically, we ligated the following synthetic gene (Geneart, Life Technologies) cut from the cloning vector with MfeI and EcoRI into a unique EcoRI site at the 3’ of the stop codon of Httex1TC9-Cerulean:
CAATTGGGTACCTCAAGCTTGCGGCCGCCTCGAGCCCCCCCCCCTAACGTTACTGGCCGAAGCCGCTTGGAATAAGGCCGGTGTGCGTTTGTCTATATGTTATTTTCCACCATATTGCCGTCTTTTGGCAATGTGAGGGCCCGGAAACCTGGCCCTGTCTTCTTGACGAGCATTCCTAGGGGTCTTTCCCCTCTCGCCAAAGGAATGCAAGGTCTGTTGAATGTCGTGAAGGAAGCAGTTCCTCTGGAAGCTTCTTGAAGACAAACAACGTCTGTAGCGACCCTTTGCAGGCAGCGGAACCCCCCACCTGGCGACAGGTGCCTCTGCGGCCAAAAGCCACGTGTATAAGATACACCTGCAAAGGCGGCACAACCCCAGTGCCACGTTGTGAGTTGGATAGTTGTGGAAAGAGTCAAATGGCTCTCCTCAAGCGTATTCAACAAGGGGCTGAAGGATGCCCAGAAGGTACCCCATTGTATGGGATCTGATCTGGGGCCTCGGTGCACATGCTTTACATGTGTTTAGTCGAGGTTAAAAAAACGTCTAGGCCCCCCGAACCACGGGGACGTGGTTTTCCTTTGAAAAACACGATGATAATATGGCCACAACCCCCGGGCAACCATGGTGAGC
GAGCTGATTAAGGAGAACATGCACATGAAGCTGTACATGGAGGGCACCGTGAACAACCACCACTTCAAGTGCACATCCGAGGGCGAAGGCAAGCCCTACGAGGGCACCCAGACCATGAGAATCAAGGCGGTCGAGGGCGGCCCTCTCCCCTTCGCCTTCGACATCCTGGCTACCAGCTTCATGTACGGCAGCAAAACCTTCATCAACCACACCCAGGGCATCCCCGACTTCTTTAAGCAGTCCTTCCCTGAGGGCTTCACATGGGAGAGAGTCACCACATACGAAGACGGGGGCGTGCTGACCGCTACCCAGGACACCAGCCTCCAGGACGGCTGCCTCATCTACAACGTCAAGATCAGAGGGGTGAACTTCCCATCCAACGGCCCTGTGATGCAGAAGAAAACACTCGGCTGGGAGGCCTCCACCGAGACCCTGTACCCCGCTGACGGCGGCCTGGAAGGCAGAGCCGACATGGCCCTGAAGCTCGTGGGCGGGGGCCACCTGATCTGCAACTTGAAGACCACATACAGATCCAAGAAACCCGCTAAGAACCTCAAGATGCCCGGCGTCTACTATGTGGACAGAAGACTGGAAAGAATCAAGGAGGCCGACAAAGAGACCTACGTCGAGCAGCACGAGGTGGCTGTGGCCAGATACTGCAACCTCCCTAGCAAACTGGGGCACAAACTTAATTCCGGACTCCGTACGAAGCTGAACCCTCCTGATGAGAGTGGCCCCGGCTGCATGAGCTGCAAGTGTGTGCTCTCCTGACGTACGACTAGTTGAGAATTC
Key features of this sequence are annotated as: CAATTG, MfeI restriction site; SEQUENCE, IRES sequence; SEQUENCE, mKate2; SEQUENCE (37), farnesylation tag; CGTACG, BsiW1 restriction site; GAATTC EcoR1 restriction site. The non-farnesylated mKate2 version of the IRES vector was created by excision of the farnesylation tag with BsiW1 digestion and vector religation.
Hsp40 and Hsp70 chaperones were provided from Paul Muchowski (Gladstone Institutes, California.) and verified by DNA sequencing.
General cell culture – Neuro-2a cells were maintained in OptiMEM (Life Technologies) supplemented with 10% fetal calf serum, 1 mM glutamine, 100 U/ml penicillin, and 100 µg/ml streptomycin in a humidified incubator with 5% atmospheric CO2.
Cell preparation for flow cytometry – 2×10⁵ cells were plated in individual wells of a 24-well tissue culture plate. The following day the cells in each well were transfected with 2 µl Lipofectamine 2000/0.8 µg vector DNA according
by guest on January 4, 2019http://w
ww
.jbc.org/D
ownloaded from

Impact of hsp40 and hsp70 on in-cell Htt aggregation kinetics
4
to the manufacturer’s instructions (Life Technologies). The next day, the media was refreshed (500 µl), and for the time course, refreshed daily thereafter. Cell suspensions were kept on ice until analysis by flow cytometry.
FlAsH staining was performed as previously described (19) with the exception of using a 12-well tissue culture plate set up and all volumes used during the transfection and FlAsH staining protocols were doubled.
For SYTOX staining, the media from the cultured cells was removed 24h after transfection, and kept aside in parallel format in 24-well plates and retained in the cell culture incubator. Fresh media was added to the cells and at further timepoints of analysis, the media was collected and added to the initial media collections (so as to collect any detached cells). Remaining adherent cells were detached by gentle agitation and pipetting in 500 μL phosphate buffered saline (PBS). The cell suspension was added to the set-aside media and then pelleted (1600 g; 3 minutes; room temperature). The supernatant was discarded and the pellet resuspended in 500μl PBS followed by 0.5 μl of 5µM SYTOX Red Dead stain (Life Technologies). Cell suspensions were kept on ice until analysis by flow cytometry (which was all completed within 1 hour after labeling).
Flow cytometry – Cells were analysed at high flow rate in an LSRFortessa flow cytometer, equipped with 405 nm and 488 nm lasers (BD Biosciences). 50-100,000 events were collected, using a forward scatter threshold of 5,000. Data were collected in pulse height, area and width parameters for each channel. For Cerulean fluorescence, data were collected with the 405 nm laser and Pacific blue filter. For FlAsH and GFP, data were collected with the 488 nm laser and FITC filter. mKate2 fluorescence was collected in the PE-Texas Red filter. SYTOX-Red Dead stain was collected using 640nm laser and the APC filter.
All flow cytometry data were analysed with FACSDiva software (BD Biosciences), FlowJo (Tree Star Inc) or manually in Excel (Microsoft).
Cell preparation for sorting and imaging – 1×10⁶ cells were plated in individual wells of a 6-well tissue culture plate. The following day the cells in each well were transfected with 10 µl Lipofectamine 2000 and 4 µg vector DNA according to the manufacturer’s instructions
(Invitrogen). After 24 h, the media was refreshed (2 ml). Cells were harvested at 48 h post transfection by first rinsing in PBS, followed by resuspension in PBS with a cell scraper and gentle pipetting. Cells were pelleted (1,600 g; 3 min) and resuspended in 2 ml 2% (v/v) paraformaldehyde for 30 min at room temperature. Cells were again pelleted (1,600 g; 3 min), resuspended in 2 ml PBS and filtered through 100 micron nylon mesh before analysis and recovery on a BD FacsAria cell sorter. Cells were imaged on a Leica SP2 confocal microscope using a HC PL APO lbd.BL 20.0x0.70 IMM objective (TCS SP2 Leica).
Gel filtration chromatography – 6×10⁶ cells were plated in 75 cm2 tissue culture flasks. The following day cells were transfected with 24 g DNA and 60 l Lipofectamine 2000. 24 hours after transfection media was either refreshed for 30 hour time point or cells were harvested by scraping. Cells were then pelleted (1600 g; 3 minutes; room temperature) and snap frozen in liquid nitrogen. Cells were then lysed as described previously (38).
Running buffer (20 mM Tris pH 7.4, 150 mM NaCl, 1% Triton X-100) was used to pack and equilibrate Sephacryl S-1000 superfine medium (GE Healthcare) into a 1.0 × 30 cm chromatography Econo-Column (Bio-Rad). 200 μl of cell lysate was run through the column at a flow rate of 1.1 ml/min. 4-drop fractions were collected into three U-shaped black-bottomed 96-well plates. Fluorescence of fractions was assessed with a Varioskan Flash spectral scanning multimode plate reader. Excitation/emission wavelength of 470/511 nm was used.
SVA – Cell preparation, lysis, and analysis were all performed as described previously (18).
Statistical analysis – Data were analysed for differences by either a one or three-way ANOVA with the Holm-Sidak Test comparing each chaperone treatment with the Htt alone control.
RESULTS We first developed strategies to examine how
the transition of mutant Httex1 from monomers to diffuse oligomers and large inclusions in individual mammalian cells correlate with cell death. Our TC9-based biosensor system of Htt aggregation state (17) was adapted into a bicistronic expression system (homemade pTIREX vectors) to independently mark cells that had
by guest on January 4, 2019http://w
ww
.jbc.org/D
ownloaded from

Impact of hsp40 and hsp70 on in-cell Htt aggregation kinetics
5
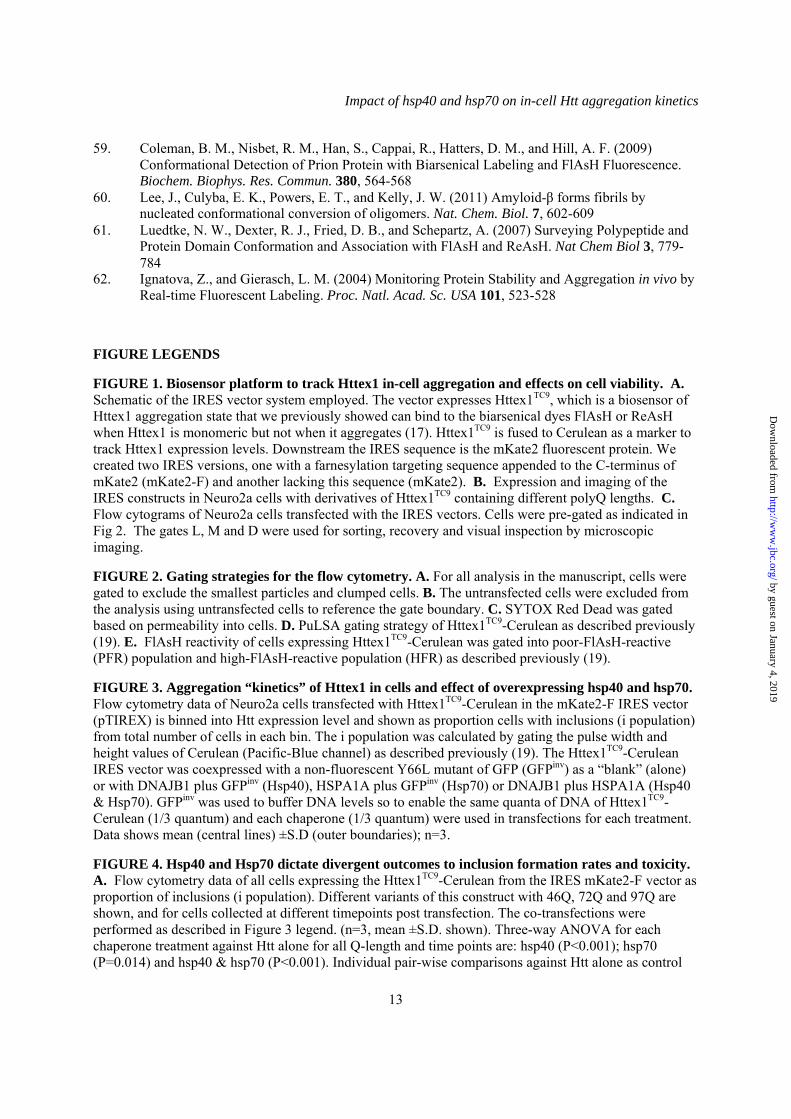
expressed Httex1 with a second membrane associated red fluorescent protein mKate2 (Fig 1A). The mKate2 was C-terminally tagged with a farnesylation targeting sequence (mKate2-F), which targets proteins to the plasma membrane (39,40). This was designed to fluorescently detect cells that may have leached their cytosolic contents upon cell death, such as when small diffusible oligomers form, which would render them undetected if we tracked Httex1-Cerulean only (11,41). mKate2 was anchored to the plasma membrane only when appended with a C-terminal farnesylation tag and was not colocalized with Httex1-Cerulean inclusions (Fig 1B). Cells, including all those detached from the plate, were collected and analysed by flow cytometry (gating strategy shown in Fig 2A&B). Expression of both pTIREX mKate2 and mKate2-F variants resulted in a “Major” population (M population) displaying a linear correlation between Cerulean and mKate2 fluorescence (Fig 1C), which was absent in an untransfected control (Fig 2B). Recovery and imaging of the M population revealed them to comprise intact cells with diffuse or inclusion-localized Httex1 (Fig 1C). Both pTIREX mKate2 and mKate2-F constructs that contained the aggregation prone 46Q variant of HttTC9-Cerulean also had a unique small population (D population) with greater Cerulean fluorescence than mKate with respect to the M population. Recovery and imaging confirmed the D population was largely free-floating inclusions attached with cellular debris (Fig 1C). The mKate2-F pTIREX construct had an additional population (L population) enriched with mKate2-F and deficient in Cerulean, which we anticipated for cells that had leached cytosol due to death or a compromised membrane integrity, and which was confirmed when these cells were recovered and imaged (Fig 1C). Simultaneous analysis with the dead cell marker SYTOX Red-dead (gating strategy shown in Fig 2C), which binds to nucleic acids in cells with compromised membranes, revealed many species in the D and L populations to be non-reactive to SYTOX, presumably due to a loss of nucleic acids through leaching (Fig 1C). To more fully estimate the number of dead cells we hence took a strategy of summing cells with SYTOX-reactivity (SYTOX+), additional leached cells (SYTOX-,L) and debris (SYTOX-,D) whereby we assumed
each D population member reflected the remnants from one cell.
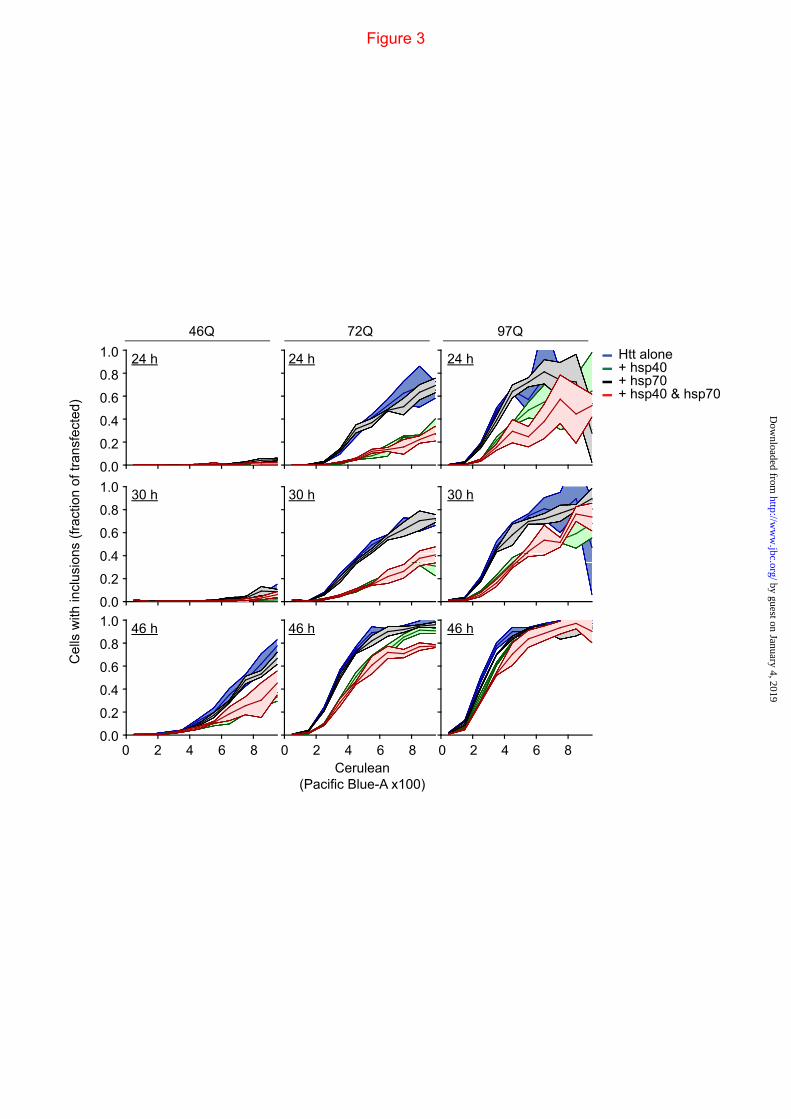
We next investigated the influence of upmodulating hsp40 and hsp70 on our aggregation platform, which have previously been shown to alter the Httex1 aggregation process and toxicity (29,31,33,36,42). With the mKate2-F pTIREX vectors and PulSA, we monitored the rate at which cells expressing Httex1TC9-Cerulean of different polyQ lengths formed inclusions when coexpressed with heat shock protein hsp40 family member DNAJB1 and hsp70 member HSPA1A. PulSA enabled cells with inclusions (i population) to be separated from cells with dispersed cytosolic Htt (ni population; gating strategy in Fig 2D) (19). Cells were analyzed by PulSA and divided into bins of expression level (based on Cerulean fluorescence intensity) to define the expression level dependence on inclusion formation and influence from the chaperone treatments (Fig 3). Essentially cells formed inclusions in a concentration and time dependent manner, which was enhanced with longer pathogenic polyQ-lengths. Coexpression of hsp70 had minor, if any, effects on inclusion formation for most time points and polyQ lengths at the different expression levels (Fig 3). Hsp40 by contrast, profoundly suppressed inclusion formation under most time points and polyQ lengths, and coexpression of both chaperones led to no major additional reduction in rates of inclusion formation (Fig 3).
We next investigated the role of chaperones in mediating the toxicity of Httex1 aggregation using the pTIREX vectors and SYTOX, D and L gating strategies. Assessment of the total population of transfected cells for extent of inclusion formation showed that, as per Fig 3, hsp40 reduced inclusion formation on average by about 20-30% and that hsp70 had little, if any effect (Fig 4A). Compared to 25Q control for baseline level of toxicity, each expanded polyQ length led to a higher level of toxicity that was most pronounced by 46 h expression (up to 15% of cells above 25Q). However, there was no noticeable benefit in viability of cells upon overexpression of hsp40 (perhaps even small detrimental effect for some conditions) (Fig 4B) whereas hsp70 had a minor, but significant benefit (Fig 4B). Assessment of the subpopulation enriched with inclusions (the i population) revealed a far greater level of cell death (up to 50-75% of cells at 46 h; Fig 4C) than
by guest on January 4, 2019http://w
ww
.jbc.org/D
ownloaded from
Impact of hsp40 and hsp70 on in-cell Htt aggregation kinetics
6
for the subpopulation lacking inclusions (15-30% at the same timepoint; Fig 4D), consistent with inclusion formation correlating closely with cell death. Chaperone overexpression produced two notable effects on these death rates. The first was that hsp70 conferred a large reduction in death rates (about 15% at 46 h) for cells with inclusions and no noticeable difference for cells lacking inclusions (Fig 4C&D). Hsp40 on the other hand conferred no benefit, and was possibly detrimental to cell survival with or without inclusions. The second notable effect was that co-expression of hsp40 and hsp70 increased the death rate of cells lacking inclusions by about 5-10% at 46 h (Fig 4D) and removed the benefit to survival of cells expressing hsp70 alone (Fig 4C). Collectively these data point to hsp40 having a large effect on suppressing aggregation in a manner without protecting the cells from toxicity and possibly introducing additional toxicity. Hsp70 in contrast had no effect on aggregation but improved the survival of cells that had formed inclusions. The hsp40•hsp70 combination more greatly reduced aggregation, but also augmented toxicity.
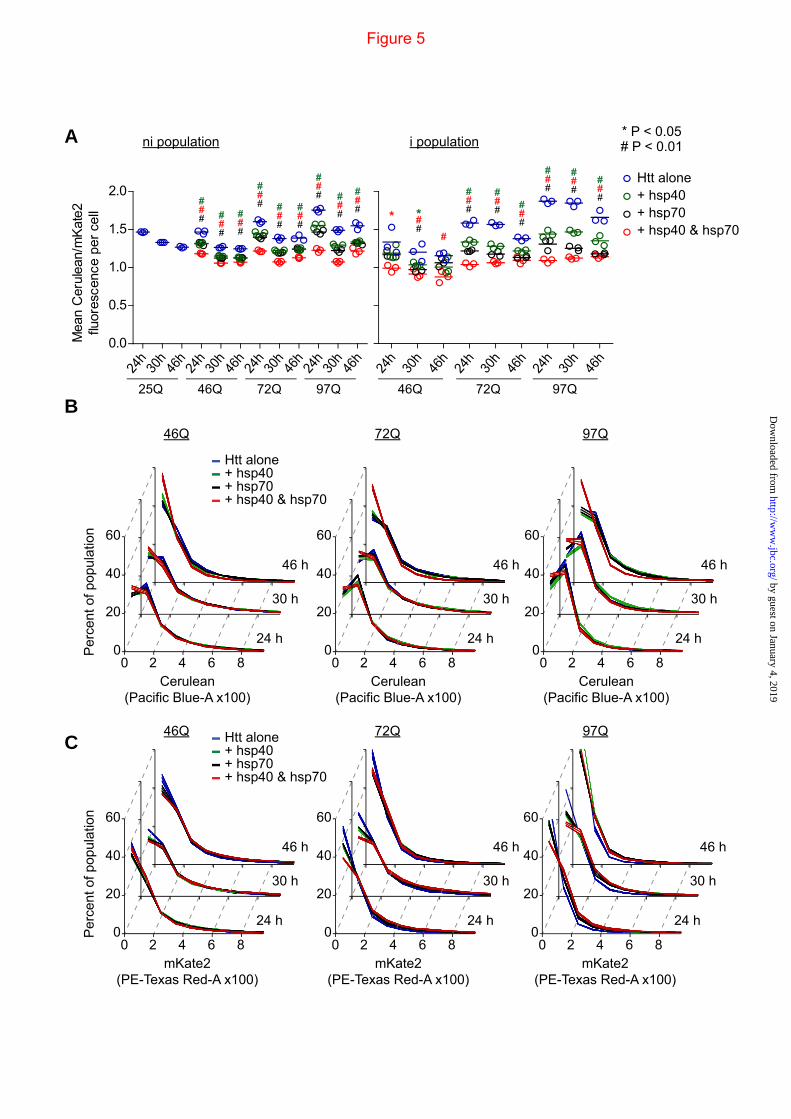
Because the hsp40•hsp70 combination reduced the overall number of cells with inclusions (compared to hsp40 alone treatment), but did not change extent of inclusions in cells when matched for expression level (Fig 3), this suggested that the hsp40•hsp70 treatment decreased the abundance of Httex1 in each cell (eg by promoting degradation) which would slow the aggregation process of Httex1 collectively within the population of cells. To investigate this possibility, we exploited the capacity of the IRES vector system for titrating expression levels of mKate2-F with Httex1-Cerulean to establish relative differences in Httex1-Cerulean in individual cells. By gating only live cells (SYTOX-,M cells as depicted in Fig 1C), the relative levels of Htt could be related to mKate2 in each cell. Each chaperone treatment, and to the greatest extent hsp40•hsp70, decreased the level of Httex1-Cerulean relative to mKate2 consistent with the hypothesis that the chaperones enhance clearance of Httex1-Cerulean (Fig 5A). This was true for cells lacking inclusions (ie the ni population) and cells with inclusions (the i population). To investigate the effect on Httex1 levels in more detail, we examined the absolute levels of Httex1 based on the Cerulean fluorescence levels histograms (Fig 5B) and that
of mKate2 (Fig 5C). The chaperone treatments shifted the population modestly to lower levels of Httex1-Cerulean expression. The effect was most pronounced with the hsp40•hsp70 and at 46h, which supports the conclusion that supplementing the cells with hsp40•hsp70 enhances the cellular capacity to degrade Httex1 in addition to a role for hsp40 suppressing aggregation. Unexpectedly however was the effect of the chaperone treatments on mKate2. Each treatment, and most pronouncedly hsp40•hsp70, increased the levels of mKate2 (Fig 5C). Furthermore, the relative increases correlated positively with increasing Q-length. These results suggest that the additional hsp40•hsp70 can increase the efficiency of mKate2 folding under conditions of stress conferred by pathogenic polyQ lengths of Httex1. Hence the data points to the chaperones changing the efficiency of folding and degradation processes in trans, with mKate2 folding favored and at the same time Httex1 more extensively degraded.
To quantitate the effect of the chaperones on Httex1 oligomeric state at the biochemical level, we devised a strategy to quantitate Httex1-Emerald aggregate forms into three basic classes: monomers, oligomers and inclusions (summarized scheme in Fig 6A). We previously showed by SVA that Httex1-Emerald fusions form only monomers in Neuro2a cells in context of the non-aggregating 25Q form, whereas the 46Q counterpart forms monomers (diameter of ~5 nm), a pool of oligomers with a predominant size of 140 S (diameter of ~30 nm), and inclusions (diameter of ~5-10 µm) (18). Based on these physical dimensions, we hypothesized that gel filtration chromatography on Sephacryl S1000 resin should resolve the oligomers from the monomers, which has a resolving range of ~20-300 nm for spherical particles (43). S1000 gel filtration occluded all inclusions from passing the column, whereas the oligomers came out in a broad peak separately from the monomers (Fig 6B and 6C). SVA at low speed (3,000 rpm angular velocity) confirmed that the oligomers eluting from the column were comparable in size to the pool we previously reported in whole unfractionated lysate (mode s=140 S in lysate (18) c.f. 196 S here) (Fig 6D). Because the inclusions were occluded from entering the gel filtration column, which hinders a capacity to quantitate total inclusion load directly by gel filtration, we
by guest on January 4, 2019http://w
ww
.jbc.org/D
ownloaded from

Impact of hsp40 and hsp70 on in-cell Htt aggregation kinetics
7
also performed SVA of crude lysate adjusted to have high viscosity (by the addition of sucrose to 2 M) at low angular speed (3,000 rpm), which we previously showed slowed the sedimentation of inclusions sufficiently to enable them to be detected by SVA (18). Under these conditions inclusions were the only molecular forms of Httex1-Emerald that sedimented, and formed a sedimenting boundary from which we could calculate the proportion of Htt molecules in an inclusion state (Fig 6E).
The combined gel filtration and SVA data enabled the determination of levels of monomers and oligomers (by gel filtration) and inclusions and total abundance of Httex1-Emerald molecules (by low speed, 2M sucrose SVA). We examined the 46Q and 72Q Httex1 variants at time points post transfection that that had pronounced divergent influences from hsp40 and hsp70 (30h and 46h) based on the data in Figures 3 & 4. The chaperone co-expressions collectively mildly increased the total yield of Httex1-Emerald molecules, with the hsp40•hsp70 treatment coferring the greatest extent (Fig 7). This result is seemingly inconsistent with the prior experiments showing the chaperones decrease the steady state levels of Httex1 with each cell (Fig 5). However, if the chaperone treatments are partially rescuing defects in quality control caused by pathogenic Htt, then these results could be consistent with an overall improvement in growth rates of the cells that compensates for the reduced Httex1-Cerulean levels within individual cells. To examine this possibility we estimated the number of cells in our culture system as a proxy of growth rate, by measuring the density of transfected cells in a fixed volume after harvesting at different time points using flow cytometry count rate data (Fig 8). Indeed the chaperone treatments generally increased the number of cells, and most notably for the 46Q and earlier timepoints, which is consistent them enabling a faster rate of growth under milder polyQ stress where the compensation effects may be more effective. Hence the chaperones, most notably the hsp40•hsp70 treatment, seems to foster both an increased turnover of Htt in addition to a greater number of cells in the population.
The proportion of Httex1 molecules in the lysate as monomer, oligomer and inclusion is shown in Fig 9. Hsp70 overexpression showed a
trend to mildly increase the total proportion of Httex1-Emerald molecules in inclusions, most evident at 46 h, and a concordant decrease in the monomer pool. In contrast, hsp40, and slightly more effectively, the hsp40•hsp70 combination decreased Httex1 in inclusions but elevated the proportion as monomers. This result is consistent with a role for hsp40 in repressing aggregation of Httex1 and hsp70 in protecting cells with inclusions from death and the combination reducing the abundance of Httex1 within each cell.
A noteworthy result was for the hsp40•hsp70 to increase the oligomer pool. A similar effect was observed transiently for hsp70 alone for the 46Q form of Httex1 (Fig 9). One explanation for this result is that these oligomers were hsp40•hsp70 complexes engaged with Httex1 as client, in effect as a triage for refolding or degradation (44). To probe how the oligomers form in individual cells in context of the chaperone treatment, we employed our TC9 biosensor form of Httex1 (Httex1TC9-Cerulean) to monitor cells enriched with oligomers but lacking an inclusion. Httex1TC9-Cerulean only binds FlAsH when it is in a monomeric state based on in vitro aggregation reactions (17). Hence cells containing Httex1TC9-Cerulean that are poor FlAsH reactive (PFR) are indicative of most Htt molecules adopting a biochemically self-aggregated state (19) (gating strategy shown in Fig 2E). Cells that are PFR and which lack an inclusion (PFR,ni) suggest an intermediate stage whereby the dispersed Htt monomers have spontaneously self-aggregated (19). The 46Q form of HttTC9-Cerulean revealed ~0.5% of the total transfected population to be enriched with oligomers (ie PFR,ni) (Fig 10). At 30 h, there was no significant difference between the chaperone treatments for this population. However by 46 h, hsp70 lead to a sustained, significant increase of this population, whereas the hsp40 and hsp40•hsp70 treatments lead to a mild decrease (but which was not significant). These data suggest oligomer-enriched cells do not seem to correlate with the increased abundance of oligomers at the molecular level (at least for the hsp40•hsp70 treatments) supporting the conclusion that the oligomers at the biochemical level in context of the hsp40•hsp70 treatments are of a different molecular nature to self-aggregated Httex1. Hence the hsp70 treatment showing a small number of additional cells enriched with
by guest on January 4, 2019http://w
ww
.jbc.org/D
ownloaded from
Impact of hsp40 and hsp70 on in-cell Htt aggregation kinetics
8
oligomers may reflect hsp70 overall providing a survival benefit to cells undergoing Httex1 aggregation.
DISCUSSION Our study brings together a number of new
approaches that enable the aggregation process of mutant Httex1 in a cell to be related to cell death. The findings can be summarized as follows. Overexpression of hsp40 suppressed aggregation of Httex1 into inclusions and stabilized Httex1 as monomers. This effect was not beneficial to cell viability. Hsp70 did not alter the aggregation of Httex1 in inclusions but protected the cells with inclusions from death. When added together hsp40 and hsp70 enhanced Httex1 turnover, and seemed to partially rescue Httex1-mediated defects in the folding efficiency of the reporter protein mKate2 and improved cellular proliferation. Collectively these data paint a picture of pathogenic Httex1 severely stressing the quality control network, which in turn negatively impacts on general housekeeping functions – a process that can be partially restored by the supplementation of additional hsp40 and hsp70.
One paradoxical conclusion was the correlation of greater toxicity to cells when treated with both hsp40 and hsp70. This result may reflect an incomplete supplementation of dysfunctional protein quality control caused by Httex1 in a manner that confers a dominant negative phenotype. This could arise by hsp40 and hsp70 forming canonical complexes with substrates in response to the stressed cell that become stalled in delivering substrates to downstream quality control processes due to a lack of additional cofactors that are redirected to managing the overwhelming Httex1 toxicity. Recent data suggest that polyQ aggregation can selectively sequester essential, elements of protein quality control machinery (including DNAJB proteins) that prevent proper operation of quality control networks, which consistent with this type of mechanism (45). In addition the overexpression of both hsp40 and hsp70 together increased the total pool of oligomers that have features consistent with canonical hsp40•hsp70•Htt client complexes that has been observed previously for Httex1 (44).
Hence a likely possibility for the beneficial effect of hsp70 is that it partly compensates for a loss of cellular quality control capacity that has
been redirected to managing Httex1 aggregation/dysfunction. An increasing body of evidence suggests protein aggregation correlates with a collapse of quality control systems (45-47). Yet it seems that aggregation itself may not be the driver of the collapsed quality control systems and rather soluble forms of Httex1 impart cell stress, perhaps by their intrinsic proneness to aggregation imparting a capacity to interfere with other cellular functions. Prior work has pointed to soluble forms of Httex1 correlating more closely to cell death and dysfunction than aggregated states that supports this mechanism (11,48-52). PolyQ has been previously suggested to adopt heterogeneous disordered monomer conformations of unusual mechanical rigidity and compaction as a result of intrachain glutamine sidechain hydrogen bonding (53-58). It is tempting to suggest that compact hairpin monomers are directly pernicious to the cell, or indirectly are toxic because of an extreme tendency to aggregate. Our results also confer more generally with findings that hsp70 (at least the isoform HSPA1A) does not reduce aggregation but still provides protection from polyQ-mediated toxicity upon aggregation (18,30-33,35,42). Other studies have also suggested that hsp70 can remodel Httex1 into benign aggregate structures, suggesting a possible role for hsp70 in altering the type of aggregates that are present (29,44).
In summary our methodological platform offers a new capacity to view the impact of aggregation kinetics in the cell. This platform enables expression level dependence to be tracked at a finer grain of resolution than previously possible and has potential for further adaptation in multi-colour fluorescence imaging for tracking how each cell type correlates with cellular functionality and health. A notable feature of our platform is its ability to estimate cell death in the entire culture over typical plate-based imaging platform that require cells to remain adherent. This offers benefits for investigation of phenomena relating to dysfunction and toxicity and tracking of all cells that may have detached through cytotoxicity. This strategy should be readily adaptable to other systems and especially for proteins that already have employed TC tag approaches to label different conformations of proteins at the molecular level (59-62).
by guest on January 4, 2019http://w
ww
.jbc.org/D
ownloaded from
Impact of hsp40 and hsp70 on in-cell Htt aggregation kinetics
9
Acknowledgements – We thank Ron Kopito (Stanford University) and Paul Muchowski (Gladstone Institutes) for useful discussions and feedback during the preparation of the manuscript. This work was funded by grants to DMH (NHMRC project grants 566640, APP1049458, APP1049459; ARC Discovery grant DP120102763; Hereditary Disease Foundation, New York). DMH was a Grimwade Fellow, supported by the Miegunyah Trust and is currently an ARC Future Fellow.
FOOTNOTES
*Author contributions: ARO, YMH, YFM and KDJ performed experiments, designed experiments and helped interpret the data; DMH oversaw implementation of the experiments, helped interpret the data and wrote the manuscript. 1 To whom correspondence should be addressed: Danny M. Hatters, Department of Biochemistry and Molecular Biology, Bio21 Molecular Science and Biotechnology Institute, 30 Flemington Road, The University of Melbourne, Melbourne, VIC, 3010, Australia, Tel.: +61 3 8344 2530; Fax: +61 3 9348 1421; E-mail: [email protected] 2 Abbreviations used are: Httex1, Htt exon 1; polyQ, polyglutamine; Q, glutamine; TC, tetracysteine
;PulSA, pulse shape analysis; SVA, sedimentation velocity analysis; PBS, phosphate buffered saline;
IPOD, Insoluble protein deposit; JUNQ, Juxta nuclear quality control compartment.
REFERENCES
1. Sipe, J. D., Benson, M. D., Buxbaum, J. N., Ikeda, S.-I., Merlini, G., Saraiva, M. J. M., and Westermark, P. (2010) Amyloid fibril protein nomenclature: 2010 recommendations from the nomenclature committee of the International Society of Amyloidosis. Amyloid 17, 101-104
2. Lee, C. C., Walters, R. H., and Murphy, R. M. (2007) Reconsidering the mechanism of polyglutamine peptide aggregation. Biochemistry (Mosc). 46, 12810-12820
3. Pappu, R. V., Wang, X., Vitalis, A., and Crick, S. L. (2008) A polymer physics perspective on driving forces and mechanisms for protein aggregation. Arch. Biochem. Biophys. 469, 132-141
4. Vitalis, A., Lyle, N., and Pappu, R. V. (2009) Thermodynamics of beta-sheet formation in polyglutamine. Biophys. J. 97, 303-311
5. Wetzel, R. Physical Chemistry of Polyglutamine: Intriguing Tales of a Monotonous Sequence. J. Mol. Biol.
6. Bucciantini, M., Giannoni, E., Chiti, F., Baroni, F., Formigli, L., Zurdo, J., Taddei, N., Ramponi, G., Dobson, C. M., and Stefani, M. (2002) Inherent Toxicity of Aggregates Implies a Common Mechanism for Protein Misfolding Diseases. Nature 416, 507–511
7. Campioni, S., Mannini, B., Zampagni, M., Pensalfini, A., Parrini, C., Evangelisti, E., Relini, A., Stefani, M., Dobson, C. M., Cecchi, C., and Chiti, F. (2010) A causative link between the structure of aberrant protein oligomers and their toxicity. Nat Chem Biol 6, 140-147
8. Hartl, F. U., Bracher, A., and Hayer-Hartl, M. (2011) Molecular chaperones in protein folding and proteostasis. Nature 475, 324-332
9. Johnston, J. A., Ward, C. L., and Kopito, R. R. (1998) Aggresomes: a cellular response to misfolded proteins. J. Cell Biol. 143, 1883-1898
10. Saudou, F., Finkbeiner, S., Devys, D., and Greenberg, M. E. (1998) Huntingtin Acts in the Nucleus to Induce Apoptosis but Death Does Not Correlate with the Formation of Intranuclear Inclusions. Cell 95, 55-66
11. Arrasate, M., Mitra, S., Schweitzer, E. S., Segal, M. R., and Finkbeiner, S. (2004) Inclusion Body Formation Reduces Levels of Mutant Huntingtin and the Risk of Neuronal Death. Nature 431, 805-810
12. Kaganovich, D., Kopito, R., and Frydman, J. (2008) Misfolded Proteins Partition Between Two Distinct Quality Control Compartments. Nature 454, 1088-1095
by guest on January 4, 2019http://w
ww
.jbc.org/D
ownloaded from
Impact of hsp40 and hsp70 on in-cell Htt aggregation kinetics
10
13. Cohen, E., Paulsson, J. F., Blinder, P., Burstyn-Cohen, T., Du, D., Estepa, G., Adame, A., Pham, H. M., Holzenberger, M., Kelly, J. W., Masliah, E., and Dillin, A. (2009) Reduced IGF-1 Signaling Delays Age-Associated Proteotoxicity in Mice. Cell 139, 1157-1169
14. Garcia-Mata, R., Bebok, Z., Sorscher, E. J., and Sztul, E. S. (1999) Characterization and dynamics of aggresome formation by a cytosolic GFP-chimera. J. Cell Biol. 146, 1239-1254
15. Hatters, D. M. (2012) Putting huntingtin "aggregation" in view with windows into the cellular milieu. Curr. Top. Med. Chem. 12, 2611-2622
16. Morimoto, R. I. (2011) The Heat Shock Response: Systems Biology of Proteotoxic Stress in Aging and Disease. Cold Spring Harb. Symp. Quant. Biol. 76, 91-99
17. Ramdzan, Y. M., Nisbet, R. M., Miller, J., Finkbeiner, S., Hill, A. F., and Hatters, D. M. (2010) Conformation sensors that distinguish monomeric proteins from oligomers in live cells. Chem. Biol. 17, 371-379
18. Olshina, M. A., Angley, L. M., Ramdzan, Y. M., Tang, J., Bailey, M. F., Hill, A. F., and Hatters, D. M. (2010) Tracking mutant huntingtin aggregation kinetics in cells reveals three major populations that include an invariant oligomer pool. J. Biol. Chem. 285, 21807-21816
19. Ramdzan, Y. M., Polling, S., Chia, C. P., Ng, I. H., Ormsby, A. R., Croft, N. P., Purcell, A. W., Bogoyevitch, M. A., Ng, D. C., Gleeson, P. A., and Hatters, D. M. (2012) Tracking protein aggregation and mislocalization in cells with flow cytometry. Nat. Methods 9, 467-470
20. MacDonald, M. E., Ambrose, C. M., Duyao, M. P., Myers, R. H., Lin, C., Srinidhi, L., Barnes, G., Taylor, S. A., James, M., Groot, N., MacFarlane, H., Jenkins, B., Anderson, M. A., Wexler, N. S., Gusella, J. F., Bates, G. P., Baxendale, S., Hummerich, H., Kirby, S., North, M., Youngman, S., Mott, R., Zehetner, G., Sedlacek, Z., Poustka, A., Frischauf, A.-M., Lehrach, H., Buckler, A. J., Church, D., Doucette-Stamm, L., O'Donovan, M. C., Riba-Ramirez, L., Shah, M., Stanton, V. P., Strobel, S. A., Draths, K. M., Wales, J. L., Dervan, P., Housman, D. E., Altherr, M., Shiang, R., Thompson, L., Fielder, T., Wasmuth, J. J., Tagle, D., Valdes, J., Elmer, L., Allard, M., Castilla, L., Swaroop, M., Blanchard, K., Collins, F. S., Snell, R., Holloway, T., Gillespie, K., Datson, N., Shaw, D., and Harper, P. S. (1993) A Novel Gene Containing a Trinucleotide Repeat that is Expanded and Unstable on Huntington's Disease Chromosomes. Cell 72, 971-983
21. Duyao, M., Ambrose, C., Myers, R., Novelletto, A., Persichetti, F., Frontali, M., Folstein, S., Ross, C., Franz, M., Abbott, M., Gray, J., Conneally, P., Young, A., Penney, J., Hollingsworth, Z., Shoulson, I., Lazzarini, A., Falek, A., Koroshetz, W., Sax, D., Bird, E., Vonsattel, J., Bonilla, E., Alvir, J., Bickham Conde, J., Cha, J. H., Dure, L., Gomez, F., Ramos, M., Sanchez-Ramos, J., Snodgrass, S., de Young, M., Wexler, N., Moscowitz, C., Penchaszadeh, G., MacFarlane, H., Anderson, M., Jenkins, B., Srinidhi, J., Barnes, G., Gusella, J., and MacDonald, M. (1993) Trinucleotide Repeat Length Instability and Age of Onset in Huntington's Disease. Nat. Genet. 4, 387
22. Perutz, M. F., Johnson, T., Suzuki, M., and Finch, J. T. (1994) Glutamine Repeats as Polar Zippers: Their Possible Role in Inherited Neurodegenerative Diseases. Proc. Natl. Acad. Sc. USA 91, 5355-5358
23. Scherzinger, E., Sittler, A., Schweiger, K., Heiser, V., Lurz, R., Hasenbank, R., Bates, G. P., Lehrach, H., and Wanker, E. E. (1999) Self-assembly of Polyglutamine-containing Huntingtin Fragments into Amyloid-like Fibrils: Implications for Huntington's Disease Pathology. Proc. Natl. Acad. Sc. USA 96, 4604-4609
24. Brignull, H. R., Morley, J. F., Garcia, S. M., and Morimoto, R. I. (2006) Modeling polyglutamine pathogenesis in C. elegans. Methods Enzymol. 412, 256-282
25. Davies, S. W., Turmaine, M., Cozens, B. A., DiFiglia, M., Sharp, A. H., Ross, C. A., Scherzinger, E., Wanker, E. E., Mangiarini, L., and Bates, G. P. (1997) Formation of Neuronal Intranuclear Inclusions Underlies the Neurological Dysfunction in Mice Transgenic for the HD Mutation. Cell 90, 537-548
by guest on January 4, 2019http://w
ww
.jbc.org/D
ownloaded from
Impact of hsp40 and hsp70 on in-cell Htt aggregation kinetics
11
26. Warrick, J. M., Paulson, H. L., Gray-Board, G. L., Bui, Q. T., Fischbeck, K. H., Pittman, R. N., and Bonini, N. M. (1998) Expanded Polyglutamine Protein Forms Nuclear Inclusions and Causes Neural Degeneration in Drosophila. Cell 93, 939
27. Young, J. C., Agashe, V. R., Siegers, K., and Hartl, F. U. (2004) Pathways of Chaperone-Mediated Protein Folding in the Cytosol. Nat Rev Mol Cell Biol 5, 781-791
28. Behrends, C., Langer, C. A., Boteva, R., Bottcher, U. M., Stemp, M. J., Schaffar, G., Rao, B. V., Giese, A., Kretzschmar, H., Siegers, K., and Hartl, F. U. (2006) Chaperonin TRiC Promotes the Assembly of PolyQ Expansion Proteins into Nontoxic Oligomers. Mol. Cell 23, 887-897
29. Wacker, J. L., Zareie, M. H., Fong, H., Sarikaya, M., and Muchowski, P. J. (2004) Hsp70 and Hsp40 Attenuate Formation of Spherical and Annular Polyglutamine Oligomers by Partitioning Monomer. Nature Structural and Molecular Biology 11, 1215-1222
30. Warrick, J. M., Chan, H. Y. E., Gray-Board, G. L., Chai, Y., Paulson, H. L., and Bonini, N. M. (1999) Suppression of Polyglutamine-mediated Neurodegeneration in Drosophila by the Molecular Chaperone HSP70. Nat. Genet. 23, 425
31. Jana, N. R., Tanaka, M., Wang, G.-h., and Nukina, N. (2000) Polyglutamine Length-dependent Interaction of Hsp40 and Hsp70 Family Chaperones with Truncated N-terminal Huntingtin: their Role in Suppression of Aggregation and Cellular Toxicity. Hum. Mol. Genet. 9, 2009-2018
32. Zhou, H., Li, S.-H., and Li, X.-J. (2001) Chaperone Suppression of Cellular Toxicity of Huntingtin Is Independent of Polyglutamine Aggregation. J. Biol. Chem. 276, 48417-48424
33. Rujano, M. A., Kampinga, H. H., and Salomons, F. A. (2007) Modulation of Polyglutamine Inclusion Formation by the Hsp70 Chaperone Machine. Exp. Cell Res. 313, 3568-3578
34. Wacker, J. L., Huang, S.-Y., Steele, A. D., Aron, R., Lotz, G. P., Nguyen, Q., Giorgini, F., Roberson, E. D., Lindquist, S., Masliah, E., and Muchowski, P. J. (2009) Loss of Hsp70 Exacerbates Pathogenesis But Not Levels of Fibrillar Aggregates in a Mouse Model of Huntington's Disease. J. Neurosci. 29, 9104-9114
35. Cummings, C. J., Sun, Y., Opal, P., Antalffy, B., Mestril, R., Orr, H. T., Dillmann, W. H., and Zoghbi, H. Y. (2001) Over-expression of Inducible HSP70 Chaperone Suppresses Neuropathology and Improves Motor Function in SCA1 Mice. Hum. Mol. Genet. 10, 1511-1518
36. Muchowski, P. J., Schaffar, G., Sittler, A., Wanker, E. E., Hayer-Hartl, M. K., and Hartl, F. U. (2000) Hsp70 and Hsp40 Chaperones Can Inhibit Self-assembly of Polyglutamine Proteins into Amyloid-like Fibrils. PNAS 97, 7841-7846
37. Shcherbo, D., Murphy, C. S., Ermakova, G. V., Solovieva, E. A., Chepurnykh, T. V., Shcheglov, A. S., Verkhusha, V. V., Pletnev, V. Z., Hazelwood, K. L., Roche, P. M., Lukyanov, S., Zaraisky, A. G., Davidson, M. W., and Chudakov, D. M. (2009) Far-red fluorescent tags for protein imaging in living tissues. The Biochemical Journal 418, 567-574
38. Olshina, M. A., Angley, L. M., Ramdzan, Y. M., Tang, J., Bailey, M. F., Hill, A. F., and Hatters, D. M. (2010) Tracking mutant huntingtin aggregation kinetics in cells reveals three major populations that include an invariant oligomer pool. J. Biol. Chem. 285, 21807-21816
39. Hancock, J. F., Cadwallader, K., Paterson, H., and Marshall, C. J. (1991) A CAAX or a CAAL motif and a second signal are sufficient for plasma membrane targeting of ras proteins. The EMBO journal 10, 4033-4039
40. Aronheim, A., Engelberg, D., Li, N., Al-Alawi, N., Schlessinger, J., and Karin, M. (1994) Membrane targeting of the nucleotide exchange factor Sos is sufficient for activating the Ras signaling pathway. Cell 78, 949-961
41. Harvey, K. J., Lukovic, D., and Ucker, D. S. (2001) Membrane-targeted green fluorescent protein reliably and uniquely marks cells through apoptotic death. Cytometry 43, 273-278
42. Hageman, J., van Waarde, M. A., Zylicz, A., Walerych, D., and Kampinga, H. H. (2011) The diverse members of the mammalian HSP70 machine show distinct chaperone-like activities. The Biochemical Journal 435, 127-142
43. Nozaki, Y., Lasic, D. D., and Tanford, J. A. (1982) Size analysis of phospholipid vesicle preparations. Science 217, 366-367
by guest on January 4, 2019http://w
ww
.jbc.org/D
ownloaded from
Impact of hsp40 and hsp70 on in-cell Htt aggregation kinetics
12
44. Lotz, G. P., Legleiter, J., Aron, R., Mitchell, E. J., Huang, S. Y., Ng, C., Glabe, C., Thompson, L. M., and Muchowski, P. J. (2010) Hsp70 and Hsp40 functionally interact with soluble mutant huntingtin oligomers in a classic ATP-dependent reaction cycle. J. Biol. Chem. 285, 38183-38193
45. Park, S.-H., Kukushkin, Y., Gupta, R., Chen, T., Konagai, A., Hipp, Mark S., Hayer-Hartl, M., and Hartl, F. U. (2013) PolyQ Proteins Interfere with Nuclear Degradation of Cytosolic Proteins by Sequestering the Sis1p Chaperone. Cell 154, 134-145
46. Gidalevitz, T., Ben-Zvi, A., Ho, K. H., Brignull, H. R., and Morimoto, R. I. (2006) Progressive Disruption of Cellular Protein Folding in Models of Polyglutamine Diseases. Science 311, 1471-1474
47. David, D. C., Ollikainen, N., Trinidad, J. C., Cary, M. P., Burlingame, A. L., and Kenyon, C. (2010) Widespread Protein Aggregation as an Inherent Part of Aging in <italic>C. elegans</italic>. PLoS Biol 8, e1000450
48. Gong, B., Lim, M. C. Y., Wanderer, J., Wyttenbach, A., and Morton, A. J. (2008) Time-lapse analysis of aggregate formation in an inducible PC12 cell model of Huntington's disease reveals time-dependent aggregate formation that transiently delays cell death. Brain Res. Bull. 75, 146-157
49. Miller, J., Arrasate, M., Brooks, E., Libeu, C. P., Legleiter, J., Hatters, D., Curtis, J., Cheung, K., Krishnan, P., Mitra, S., Widjaja, K., Shaby, B. A., Lotz, G. P., Newhouse, Y., Mitchell, E. J., Osmand, A., Gray, M., Thulasiramin, V., Saudou, F., Segal, M., Yang, X. W., Masliah, E., Thompson, L. M., Muchowski, P. J., Weisgraber, K. H., and Finkbeiner, S. (2011) Identifying polyglutamine protein species in situ that best predict neurodegeneration. Nat. Chem. Biol. 7, 925-934
50. Zhang, Q. C., Yeh, T.-l., Leyva, A., Frank, L. G., Miller, J., Kim, Y. E., Langen, R., Finkbeiner, S., Amzel, M. L., Ross, C. A., and Poirier, M. A. (2011) A Compact β Model of huntingtin Toxicity. J. Biol. Chem. 286, 8188-8196
51. Nucifora, F. C., Jr., Sasaki, M., Peters, M. F., Huang, H., Cooper, J. K., Yamada, M., Takahashi, H., Tsuji, S., Troncoso, J., Dawson, V. L., Dawson, T. M., and Ross, C. A. (2001) Interference by Huntingtin and Atrophin-1 with CBP-Mediated Transcription Leading to Cellular Toxicity. Science 291, 2423-2428
52. Peters-Libeu, C., Miller, J., Rutenber, E., Newhouse, Y., Krishnan, P., Cheung, K., Hatters, D., Brooks, E., Widjaja, K., Tran, T., Mitra, S., Arrasate, M., Mosquera, L. A., Taylor, D., Weisgraber, K. H., and Finkbeiner, S. (2012) Disease-Associated Polyglutamine Stretches in Monomeric Huntingtin Adopt a Compact Structure. J. Mol. Biol. 421, 587-600
53. Crick, S. L., Jayaraman, M., Frieden, C., Wetzel, R., and Pappu, R. V. (2006) Fluorescence Correlation Spectroscopy Shows That Monomeric Polyglutamine Molecules Form Collapsed Structures in Aqueous Solutions. Proc. Natl. Acad. Sc. USA 103, 16764-16769
54. Dougan, L., Li, J., Badilla, C. L., Berne, B. J., and Fernandez, J. M. (2009) Single Homopolypeptide Chains Collapse into Mechanically Rigid Conformations. Proc. Natl. Acad. Sc. USA 106, 12605-12610
55. Wang, X., Vitalis, A., Wyczalkowski, M. A., and Pappu, R. V. (2006) Characterizing the conformational ensemble of monomeric polyglutamine. Proteins: Structure, Function, and Bioinformatics 63, 297-311
56. Kim, M. W., Chelliah, Y., Kim, S. W., Otwinowski, Z., and Bezprozvanny, I. (2009) Secondary Structure of Huntingtin Amino-Terminal Region. Structure 17, 1205-1212
57. Singh, V. R., and Lapidus, L. J. (2008) The Intrinsic Stiffness of Polyglutamine Peptides. The Journal of Physical Chemistry B 112, 13172-13176
58. Walters, R. H., and Murphy, R. M. (2009) Examining Polyglutamine Peptide Length: A Connection between Collapsed Conformations and Increased Aggregation. J. Mol. Biol. 393, 978-992
by guest on January 4, 2019http://w
ww
.jbc.org/D
ownloaded from
Impact of hsp40 and hsp70 on in-cell Htt aggregation kinetics
13
59. Coleman, B. M., Nisbet, R. M., Han, S., Cappai, R., Hatters, D. M., and Hill, A. F. (2009) Conformational Detection of Prion Protein with Biarsenical Labeling and FlAsH Fluorescence. Biochem. Biophys. Res. Commun. 380, 564-568
60. Lee, J., Culyba, E. K., Powers, E. T., and Kelly, J. W. (2011) Amyloid-β forms fibrils by nucleated conformational conversion of oligomers. Nat. Chem. Biol. 7, 602-609
61. Luedtke, N. W., Dexter, R. J., Fried, D. B., and Schepartz, A. (2007) Surveying Polypeptide and Protein Domain Conformation and Association with FlAsH and ReAsH. Nat Chem Biol 3, 779-784
62. Ignatova, Z., and Gierasch, L. M. (2004) Monitoring Protein Stability and Aggregation in vivo by Real-time Fluorescent Labeling. Proc. Natl. Acad. Sc. USA 101, 523-528
FIGURE LEGENDS
FIGURE 1. Biosensor platform to track Httex1 in-cell aggregation and effects on cell viability. A. Schematic of the IRES vector system employed. The vector expresses Httex1TC9, which is a biosensor of Httex1 aggregation state that we previously showed can bind to the biarsenical dyes FlAsH or ReAsH when Httex1 is monomeric but not when it aggregates (17). Httex1TC9 is fused to Cerulean as a marker to track Httex1 expression levels. Downstream the IRES sequence is the mKate2 fluorescent protein. We created two IRES versions, one with a farnesylation targeting sequence appended to the C-terminus of mKate2 (mKate2-F) and another lacking this sequence (mKate2). B. Expression and imaging of the IRES constructs in Neuro2a cells with derivatives of Httex1TC9 containing different polyQ lengths. C. Flow cytograms of Neuro2a cells transfected with the IRES vectors. Cells were pre-gated as indicated in Fig 2. The gates L, M and D were used for sorting, recovery and visual inspection by microscopic imaging.
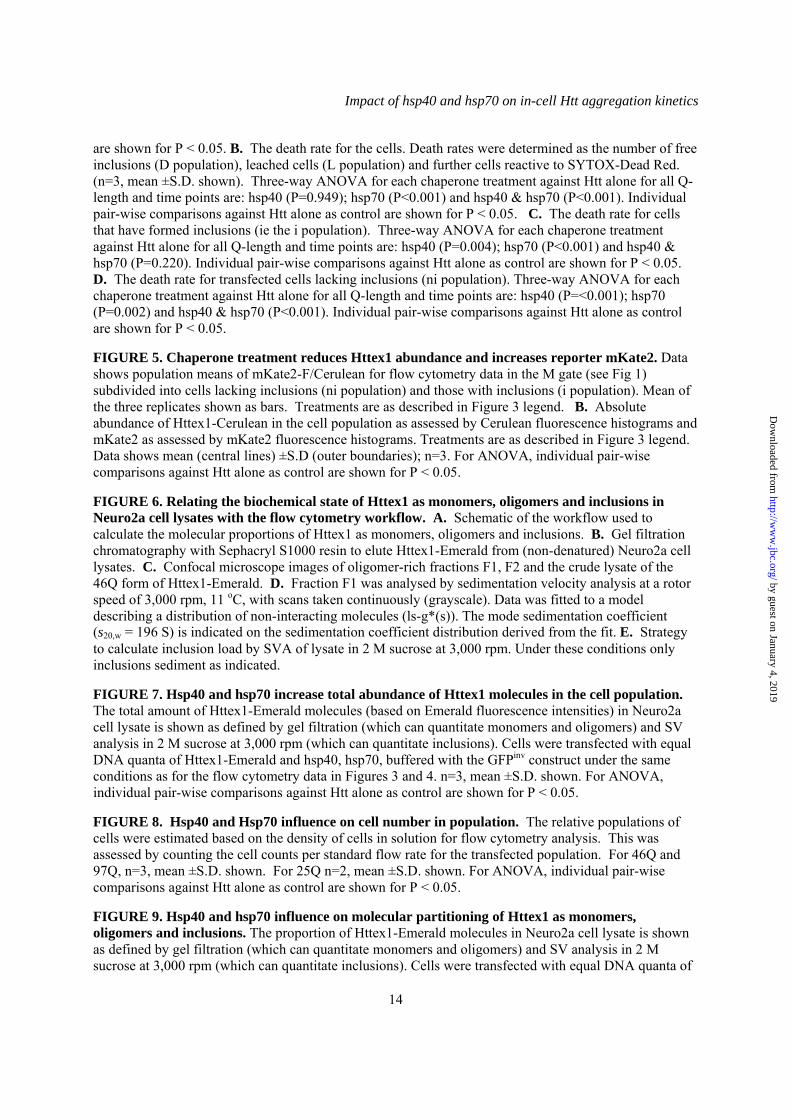
FIGURE 2. Gating strategies for the flow cytometry. A. For all analysis in the manuscript, cells were gated to exclude the smallest particles and clumped cells. B. The untransfected cells were excluded from the analysis using untransfected cells to reference the gate boundary. C. SYTOX Red Dead was gated based on permeability into cells. D. PuLSA gating strategy of Httex1TC9-Cerulean as described previously (19). E. FlAsH reactivity of cells expressing Httex1TC9-Cerulean was gated into poor-FlAsH-reactive (PFR) population and high-FlAsH-reactive population (HFR) as described previously (19).
FIGURE 3. Aggregation “kinetics” of Httex1 in cells and effect of overexpressing hsp40 and hsp70. Flow cytometry data of Neuro2a cells transfected with Httex1TC9-Cerulean in the mKate2-F IRES vector (pTIREX) is binned into Htt expression level and shown as proportion cells with inclusions (i population) from total number of cells in each bin. The i population was calculated by gating the pulse width and height values of Cerulean (Pacific-Blue channel) as described previously (19). The Httex1TC9-Cerulean IRES vector was coexpressed with a non-fluorescent Y66L mutant of GFP (GFPinv) as a “blank” (alone) or with DNAJB1 plus GFPinv (Hsp40), HSPA1A plus GFPinv (Hsp70) or DNAJB1 plus HSPA1A (Hsp40 & Hsp70). GFPinv was used to buffer DNA levels so to enable the same quanta of DNA of Httex1TC9-Cerulean (1/3 quantum) and each chaperone (1/3 quantum) were used in transfections for each treatment. Data shows mean (central lines) ±S.D (outer boundaries); n=3.
FIGURE 4. Hsp40 and Hsp70 dictate divergent outcomes to inclusion formation rates and toxicity. A. Flow cytometry data of all cells expressing the Httex1TC9-Cerulean from the IRES mKate2-F vector as proportion of inclusions (i population). Different variants of this construct with 46Q, 72Q and 97Q are shown, and for cells collected at different timepoints post transfection. The co-transfections were performed as described in Figure 3 legend. (n=3, mean ±S.D. shown). Three-way ANOVA for each chaperone treatment against Htt alone for all Q-length and time points are: hsp40 (P<0.001); hsp70 (P=0.014) and hsp40 & hsp70 (P<0.001). Individual pair-wise comparisons against Htt alone as control
by guest on January 4, 2019http://w
ww
.jbc.org/D
ownloaded from
Impact of hsp40 and hsp70 on in-cell Htt aggregation kinetics
14
are shown for P < 0.05. B. The death rate for the cells. Death rates were determined as the number of free inclusions (D population), leached cells (L population) and further cells reactive to SYTOX-Dead Red. (n=3, mean ±S.D. shown). Three-way ANOVA for each chaperone treatment against Htt alone for all Q-length and time points are: hsp40 (P=0.949); hsp70 (P<0.001) and hsp40 & hsp70 (P<0.001). Individual pair-wise comparisons against Htt alone as control are shown for P < 0.05. C. The death rate for cells that have formed inclusions (ie the i population). Three-way ANOVA for each chaperone treatment against Htt alone for all Q-length and time points are: hsp40 (P=0.004); hsp70 (P<0.001) and hsp40 & hsp70 (P=0.220). Individual pair-wise comparisons against Htt alone as control are shown for P < 0.05. D. The death rate for transfected cells lacking inclusions (ni population). Three-way ANOVA for each chaperone treatment against Htt alone for all Q-length and time points are: hsp40 (P=<0.001); hsp70 (P=0.002) and hsp40 & hsp70 (P<0.001). Individual pair-wise comparisons against Htt alone as control are shown for P < 0.05.
FIGURE 5. Chaperone treatment reduces Httex1 abundance and increases reporter mKate2. Data shows population means of mKate2-F/Cerulean for flow cytometry data in the M gate (see Fig 1) subdivided into cells lacking inclusions (ni population) and those with inclusions (i population). Mean of the three replicates shown as bars. Treatments are as described in Figure 3 legend. B. Absolute abundance of Httex1-Cerulean in the cell population as assessed by Cerulean fluorescence histograms and mKate2 as assessed by mKate2 fluorescence histograms. Treatments are as described in Figure 3 legend. Data shows mean (central lines) ±S.D (outer boundaries); n=3. For ANOVA, individual pair-wise comparisons against Htt alone as control are shown for P < 0.05.
FIGURE 6. Relating the biochemical state of Httex1 as monomers, oligomers and inclusions in Neuro2a cell lysates with the flow cytometry workflow. A. Schematic of the workflow used to calculate the molecular proportions of Httex1 as monomers, oligomers and inclusions. B. Gel filtration chromatography with Sephacryl S1000 resin to elute Httex1-Emerald from (non-denatured) Neuro2a cell lysates. C. Confocal microscope images of oligomer-rich fractions F1, F2 and the crude lysate of the 46Q form of Httex1-Emerald. D. Fraction F1 was analysed by sedimentation velocity analysis at a rotor speed of 3,000 rpm, 11 oC, with scans taken continuously (grayscale). Data was fitted to a model describing a distribution of non-interacting molecules (ls-g*(s)). The mode sedimentation coefficient (s20,w = 196 S) is indicated on the sedimentation coefficient distribution derived from the fit. E. Strategy to calculate inclusion load by SVA of lysate in 2 M sucrose at 3,000 rpm. Under these conditions only inclusions sediment as indicated.
FIGURE 7. Hsp40 and hsp70 increase total abundance of Httex1 molecules in the cell population. The total amount of Httex1-Emerald molecules (based on Emerald fluorescence intensities) in Neuro2a cell lysate is shown as defined by gel filtration (which can quantitate monomers and oligomers) and SV analysis in 2 M sucrose at 3,000 rpm (which can quantitate inclusions). Cells were transfected with equal DNA quanta of Httex1-Emerald and hsp40, hsp70, buffered with the GFPinv construct under the same conditions as for the flow cytometry data in Figures 3 and 4. n=3, mean ±S.D. shown. For ANOVA, individual pair-wise comparisons against Htt alone as control are shown for P < 0.05.
FIGURE 8. Hsp40 and Hsp70 influence on cell number in population. The relative populations of cells were estimated based on the density of cells in solution for flow cytometry analysis. This was assessed by counting the cell counts per standard flow rate for the transfected population. For 46Q and 97Q, n=3, mean ±S.D. shown. For 25Q n=2, mean ±S.D. shown. For ANOVA, individual pair-wise comparisons against Htt alone as control are shown for P < 0.05.
FIGURE 9. Hsp40 and hsp70 influence on molecular partitioning of Httex1 as monomers, oligomers and inclusions. The proportion of Httex1-Emerald molecules in Neuro2a cell lysate is shown as defined by gel filtration (which can quantitate monomers and oligomers) and SV analysis in 2 M sucrose at 3,000 rpm (which can quantitate inclusions). Cells were transfected with equal DNA quanta of
by guest on January 4, 2019http://w
ww
.jbc.org/D
ownloaded from

Impact of hsp40 and hsp70 on in-cell Htt aggregation kinetics
15
Httex1-Emerald and hsp40, hsp70, buffered with the GFPinv construct under the same conditions as for the flow cytometry data in Figures 3 and 4. A. Total abundance of Htt based on fluorescence yield in lysate. (n=3, mean ±S.D. shown). For ANOVA, individual pair-wise comparisons against Htt alone as control are shown for P < 0.05. B. Proportions of monomers, oligomers and inclusions (n=3, mean ±S.D. shown). For ANOVA, individual pair-wise comparisons against Htt alone as control are shown for P < 0.05.
FIGURE 10. Hsp70 leads to a sustained population of cells enriched with oligomers and lacking an inclusion. Abundance of Neuro2a cells enriched with Httex1TC9-Cerulean oligomers using FlAsH reactivity and gating for the poor-FlAsH-reactive (PFR) population and high-FlAsH-reactive population (HFR) as described in Fig 2. Treatments are as described in Figure 3 legend. Differences were assessed by one-way ANOVA using 46Q alone as the control (n=3, mean ±S.D. shown, with P values indicated and significant differences indicated in red).
by guest on January 4, 2019http://w
ww
.jbc.org/D
ownloaded from
HttTC9-Cerulean IRES mKate2
HttTC9-Cerulean IRES mKate2
One mRNA
Twoproteins
One plasmid
mKate2-FHttTC9 Cer
mKate2-FHttTC9-Cer
mKate2HttTC9-Cer
46Q
25Q
10 μm
D: Debris with inclusions
L: Leached cells
M: Main population of intact cells
25Q
25Q
46Q
46Q
A B
C
D M
L
102
103
104
105
102 103 104 1050mKate2
(PE-Texas Red (561)-A)
102
103
104
105
Cer
ulea
n(P
acifi
c B
lue-
A)
102 103 104 1050mKate2
(PE-Texas Red (561)-A)
102
103
104
105
Cer
ulea
n(P
acifi
c B
lue-
A)
102 103 104 1050mKate2-F
(PE-Texas Red (561)-A)
102
103
104
105
102 103 104 1050mKate2-F
(PE-Texas Red (561)-A)
SYTOX+SYTOX-
Figure 1 by guest on January 4, 2019
http://ww
w.jbc.org/
Dow
nloaded from
D
E
A B C
102
103
104
105
Cer
ulea
n(P
acifi
c B
lue-
A)
102
101
103
103
104
-103 0
0
102
104
105
Cerulean(Pacific Blue-Pulse width)
Cer
ulea
n(P
acifi
c B
lue-
Pul
se h
eigh
t)
Cer
ulea
n(P
acifi
c B
lue-
Pul
se h
eigh
t)
102
101
103
104
105
000
50
50
100
100
150
150
200
200
250
250
FSC-A (x1000)
25Q 46Q
25Q 46Q
SS
C-A
(x10
00)
103 104 105
mKate2(PE-Texas Red (561)-A)
102101100 103 104 105
SYTOX Red Dead(APC-A)
Cou
nt
SYTOX+
Gate
Transfected
HFR
1000
1500
500
0
i
PFR
ni
0 50 100 150 200 250 0 50 100 150 200 250Cerulean
(Pacific Blue-Pulse width)
Cer
ulea
n(P
acifi
c B
lue-
A)
FlAsH(FITC-A)
103
104
-103 0
0
102
Cer
ulea
n(P
acifi
c B
lue-
A)
FlAsH(FITC-A)
HFR
PFFR
Figure 2 by guest on January 4, 2019
http://ww
w.jbc.org/
Dow
nloaded from
Cel
ls w
ith in
clus
ions
(fra
ctio
n of
tran
sfec
ted)
Htt alone+ hsp40+ hsp70+ hsp40 & hsp70
0.0
0.2
0.4
0.6
0.8
1.00.0
0.2
0.4
0.6
0.8
1.00.0
0.2
0.4
0.6
0.8
1.0
0 2 4 6 8 8 80 2 4 6 0 2 4 6
97Q72Q46Q
24 h
30 h
46 h
24 h
30 h
46 h
24 h
30 h
46 h
Cerulean(Pacific Blue-A x100)
Figure 3 by guest on January 4, 2019
http://ww
w.jbc.org/
Dow
nloaded from

Cel
ls w
ith in
clus
ions
(per
cent
of t
rans
fect
ed)
46Q 72Q 97Q
46Q
72Q97Q
46Q 72Q 97Q 25Q
A B
C D
+Hsp70:+Hsp40:
+Hsp70:+Hsp40:
+Hsp70:+Hsp40:
Cel
ls d
ead
(per
cent
of t
rans
fect
ed)
Cel
ls d
ead
(per
cent
of t
hose
with
incl
usio
ns)
Cel
ls d
ead
(per
cent
of t
hose
with
out i
nclu
sion
s)
0
10
20
30
0
20
40
60
80
100
46Q 72Q 97Q 25Q
+Hsp70:+Hsp40:
0
20
40
60
80
100
0
20
40
60
80
100
24 h30 h46 h
24 h30 h46 h
24 h30 h46 h
24 h30 h46 h
* P < 0.05# P < 0.01
* P < 0.05# P < 0.01
* P < 0.05# P < 0.01
* P < 0.05# P < 0.01
#
#
#
#
#
#
#
##
#
##
##
#
#
#
#
## #
##
#
#
##
#
#
#
#
##
#
#
#
#
##
#
*
*
** *
**
*
*
Figure 4 by guest on January 4, 2019
http://ww
w.jbc.org/
Dow
nloaded from
A
B
C
46Q
i populationni population24
h30
h46
h24
h30
h46
h24
h30
h46
h24
h30
h46
h
24h
30h
46h
24h
30h
46h
24h
30h
46h
46Q25Q 46Q 72Q 97Q 72Q 97Q
0.0
0.5
1.0
1.5
2.0
Mea
n C
erul
ean/
mKa
te2
fluor
esce
nce
per c
ell
Htt alone+ hsp40+ hsp70+ hsp40 & hsp70
Htt alone+ hsp40+ hsp70+ hsp40 & hsp70
Htt alone+ hsp40+ hsp70+ hsp40 & hsp70
Cerulean(Pacific Blue-A x100)
24 h
30 h
46 h
0 2 4 6 80
20
40
60
Per
cent
of p
opul
atio
n
mKate2(PE-Texas Red-A x100)
24 h
30 h
46 h
0 2 4 6 80
20
40
60
Per
cent
of p
opul
atio
n
mKate2(PE-Texas Red-A x100)
24 h
30 h
46 h
0 2 4 6 80
20
40
60
97Q
Cerulean(Pacific Blue-A x100)
24 h
30 h
46 h
0 2 4 6 80
20
40
60
72Q
46Q 97Q72Q
Cerulean(Pacific Blue-A x100)
24 h
30 h
46 h
0 2 4 6 80
20
40
60
mKate2(PE-Texas Red-A x100)
24 h
30 h
46 h
0 2 4 6 80
20
40
60
* P < 0.05# P < 0.01
###
##
#
##
#
##
#
##
#
##
#
##
#
## #
##
#
##
#
##
#
###
##
#
###
##
#*##
## *
Figure 5 by guest on January 4, 2019
http://ww
w.jbc.org/
Dow
nloaded from

Radius (cm)6.0 6.4 6.8 7.2Fl
uore
scen
ce in
tens
ity
200400600800
1000
B
A
D
E
C
0
0
3
1
2
5 3025201510
A
5 0 200100μm
Lysate
F2
F2 oligomers
F1
F1 oligomers
F1 oligomers analysis
Radius (cm)6.05 6.15 6.25 6.35Fl
uore
scen
ce in
tens
ity
200
400
600
800
Sedimentationcoefficient (S)
0 400 800 1,200
ls g
*(s)
0.0
0.4
0.8
1.2
1.6
Raw data (incrementing grayscale)Fit 196 S
Fluo
resc
ence
(AU
)
Elution Volume (ml)
46Q25Q
72Q, 46h
Monomers
Oligomers
Crude lysate
Gel filtration(Sephacryl S1,000)
Sedimentation velocity analysis(3,000 rpm, 2M sucrose)
Inclusions
Monomers andOligomers
First scan
Last scan
Monomer and oligomers
Inclusions
Figure 6 by guest on January 4, 2019
http://ww
w.jbc.org/
Dow
nloaded from

0
50
100
150
200
+Hsp70:+Hsp40:
Tota
l Htt
mas
s(r
elat
ive
units
)
46Q 72Q
30 h46 h
* P < 0.05# P < 0.01
# # #
#
# # #
Figure 7 by guest on January 4, 2019
http://ww
w.jbc.org/
Dow
nloaded from

46Q72Q
97Q
+Hsp70:+Hsp40:
25Q
24 h30 h46 h
0
100
200
300
400
500
Tran
sfec
ted
cell
dens
ity(c
ells
/sec
ond)
* P < 0.05# P < 0.01
#
#
***
*
* ****
Figure 8 by guest on January 4, 2019
http://ww
w.jbc.org/
Dow
nloaded from

+Hsp70:+Hsp40:
+Hsp70:+Hsp40:
+Hsp70:+Hsp40:
% O
ligom
ers
5
10
15
46Q 72Q
0
% In
clus
ions
0
10
20
30
40
50
46Q 72Q
% M
onom
ers
0
20
40
60
80
100
46Q 72Q
30 h46 h
* P < 0.05# P < 0.01
# ##
### #
* ** * *
*
*
*
**
Figure 9 by guest on January 4, 2019
http://ww
w.jbc.org/
Dow
nloaded from

46Q
25QHtt aloneHtt alone
+ hsp40+ hsp70+ hsp40 & hsp70
30h 46h
PFR
,ni
(%to
tal p
opul
atio
n)
0.0
0.5
1.0
1.5
0.4240.008
0.635
0.539
0.0520.007
0.0110.231
Figure 10 by guest on January 4, 2019
http://ww
w.jbc.org/
Dow
nloaded from

Jovanoski and Danny M. HattersAngelique Royale Ormsby, Yasmin Mohamed Ramdzan, Yee-Foong Mok, Kristijan D.
influences from chaperones hsp40 and hsp70A platform to view huntingtin exon 1 aggregation flux in the cell reveals divergent
published online November 6, 2013J. Biol. Chem.
10.1074/jbc.M113.486944Access the most updated version of this article at doi:
Alerts:
When a correction for this article is posted•
When this article is cited•
to choose from all of JBC's e-mail alertsClick here
by guest on January 4, 2019http://w
ww
.jbc.org/D
ownloaded from