impact of family ownership on investment decision
TRANSCRIPT

33
POSLOVNA IZVRSNOST ZAGREB, GOD. VIII (2014) BR. 2 Tahir S. H., Sabir H. M.: Impact of family ownership on investment decision: comparative...
IMPACT OF FAMILY OWNERSHIP ON INVESTMENT DECISION: COMPARATIVE ANALYSIS OF FAMILY AND NON-FAMILY
COMPANIES LISTED AT KARACHI STOCK EXCHANGE (PAKISTAN)
Safdar Husain Tahir 1 & Hazoor Muhammad Sabir 2
UDC /UDK: 330.322(549.1)JEL classifi cation / JEL klasifi kacija: G11Original scientifi c paper / Izvorni znanstveni radReceived / Primljeno: November 18, 2014 / 18. studenoga 2014.Accepted for publishing / Prihvaćeno za tisak: December 03, 2014 / 03. prosinca 2014.
Summary
Th e current study attempts to investigate the impact of family ownership structure on investment decisions of fi rms listed at the Karachi Stock Exchange (KSE) of Pakistan. For distinguishing family owned business (FOB) from non-family (NFOB), two threshold points of ownership structure (25% & 50%) were used. Panel data forms ranging from the period 2002-2013 were collected from diff erent sources such as annual reports of fi rms, fi nancial statements, business recorder, stock exchanges, telephone calls, emails and balance sheet analyses of joint stocks. Generalized Method of Moments (GMM) was applied to estimate the coeffi cients of variables of interest. Empirical results revealed that there was stronger positive impact of cashfl ow on investment in NFOBs in comparison with FOBs. Conversely, family fi rms have lower investment-cashfl ow sensitivity even when blockholder’s eff ect was taken in consideration. Th e estimated coeffi cients confi rmed less investment-cash fl ow sen-sitivity in those fi rms comparatively where professional manager serves as a chief executive offi cer (CEO). It was also revealed that family fi rms alleviate fi nancial constraints as well as free cash fl ow problems. It was concluded that broader investment horizons, corporate governance mechanism and fl exibility to manage fi nancial constraints make family fi rms capable of reducing investment-cash fl ow sensitivity.
Key words: Family Business, Panel data, Generalized Method of Moments (GMM), Karachi Stock Exchange (KSE), and Investment Decision.
1 Safdar Husain Tahir, Assistant Professor, Government College University, Faisalabad, Pakistan, E-mail: [email protected]
2 Hazoor Muhammad Sabir, Ph.D., Professor, Government College University, Faisalabad, Pakistan, E-mail: [email protected]

34
POSLOVNA IZVRSNOST ZAGREB, GOD. VIII (2014) BR. 2 Tahir S. H., Sabir H. M.: Impact of family ownership on investment decision: comparative...
1. INTRODUCTIONModigliani & Miller (1958) argue that investment decision is totally independent
from capital structure of the companies in perfect capital market conditions. Howev-er, past research studies show that perfect capital markets are non-existent in the real world. Th erefore, fi nancial factors do have an impact on investment decisions of a fi rm. Existing literature on fi nance also shows that source of external fi nance is not a perfect substitute for internal source of fi nance. Corporations with good investment opportu-nities can thus take advantage of easier access to external sources to improve capital allocation. Contrary to the assumptions of Modigliani & Miller (1958), the impact of cash fl ow on investment decisions can be expounded mainly from the understanding of imperfect capital markets. Th is extent of imperfection of fi nancial markets is not only linked with investment decisions of companies but also with the ability to fi nance these investment opportunities by internal funds.
Th e relation between cash fl ow and optimal investment has been traced in the decade of 1950s (Meyer & Kuh, 1957). Yet, the debatable question of investment-cash-fl ow sensitivity remains unresolved (Hovakimian, 2009). Morgado, A., and Pindado, J. (2003) document the arguments that only optimal levels of investment create a maxi-mum value of fi rms. Overinvestment and underinvestment problems are the result of mishandling the capital structure by managers. In the current situation where there is prevalence of under and overinvestment problems in the fi eld of corporate investment, research scholars have provided many theoretical as well as empirical models that ex-plain this phenomena. Cleary, S., Povel, P., and Raith, M. (2007) show a relation between the level of investment spending and a set of diff erent fi nancial variables such as owner-ship structure - one of the most important of them to be considered as the main reason for overinvestment or underinvestment problems.
Market imperfections and the prevalence of family owned fi rms in the world can grossly infl uence investment decisions of a corporation. Th e main objective of this study is to quantify empirically the eff ect of family control on investment - cash fl ow sensitivities. Particularly, the current study analyzes the presence of dominant share-holder in the form of family ownership, asymmetry information and agency problems in connection with investment decisions of a company. First of all, we tend to probe whether the sensitivity of investment–cash fl ow is either intensifi ed or mitigated in the presence of family ownership and control in Pakistan. Secondly, we investigate whether other aspects in relation with family ownership and control can also aff ect investment cash fl ow sensitivity. Th irdly, we examine whether active involvement of family mem-bers in the management or decision making process of the company increase or reduce investment-cash fl ow sensitivity.
Fourthly, we explore the eff ect of blockholders in family owned business on the investment–cash fl ow sensitivity. Finally, we empirically investigate whether family ownership or control can aff ect the fi nancial constraints existing due to agency prob-lems of free cash fl ow as well as asymmetric information problems.
35
POSLOVNA IZVRSNOST ZAGREB, GOD. VIII (2014) BR. 2 Tahir S. H., Sabir H. M.: Impact of family ownership on investment decision: comparative...
2. REVIEW OF LITERATURE AND HYPOTHESES FORMULATION
Fazzari, S.M., Hubbard, R.G., and Petersen, B.C. (1988) conclude that there is a strong positive relation between investment-cashfl ow sensitivity. Th ey also fi nd the role of large institutional investors in the investment decision process inversely proportional to the sensitivity between investment and cash fl ow in United Kingdom. Kaplan, S., and Zingales, L. (1997) show a higher degree of sensitivity that cannot be interpreted in terms of fi nancial constraints, Contrary to Fazzari et al. (1988). In line with Fazzari et al. (1988), Marhfor et al. (2012) show a signifi cant relation between investment-cash fl ow sensitivities.
Family owned business (FOB) is linked with some potential benefi ts that con-tribute to reducing investment-cash fl ow sensitivity due to the following reasons. First, in line with arguments of diff erent authors such as Galeotti et al. (1994), the benefi ts associated with family ownership help to decrease imperfections of fi nancial markets. Second, Schulze, Lubatkin, and Dino (2003) opine that family owned corporations can better evaluate strategic investment projects due to deep knowledge and long-life in-volvement of family members in the operations of their businesses which enables them to reduce the deviation form optimal level of new investment. Th is optimal level controls the investment-cash fl ow sensitivity (Morgado and Pindado, 2003). Th ird, family owned business helps to reduce agency cost between shareholders and bondholders that leads to lower the wedge between cost of external and internal funds (Jensen and Meckling, 1976). Th ese lower fi nancial constraints lead to choosing an optimal investment which ultimately mitigates investment-cash fl ow sensitivity. Fourth, existing fi nance literature of family business indicates that family owners are more concerned with the reputation of business that leads to higher earnings, which contributes to reducing agency con-fl icts. Lower agency confl ict alleviates investment cash fl ow sensitivity in family owned business.
Keeping in view these arguments, it is expected that family fi rms show lower investment cash fl ow sensitivity than non-family ones. Th e following hypothesis-1 is proposed.
H1: Investment-internal fund sensitivity is lower in FOBs than NFOBs.
Th eory of voice and intervention argues that active monitoring of managers by large shareholders having substantial stakes called blockholders, can improve the value of a company. Th is kind of action from blockholders is termed shareholder’s activism, and it prevents managers from doing wasteful activities regarding business operations which can destroy the value of business. Th is type of shareholder activism can be used as a mechanism of corporate governance that disciplines the controlling shareholders. It is a potential disadvantage for the largest shareholders and helps to moderate the depend-ence of investment spending on internally generated funds. La Porta, Lopez-de-Silanes, & Shleifer (1999) fi nd that in fi rms with concentrated ownership, large shareowners may monitor each other and provide potential benefi ts that have an overall disciplining eff ect on the corporation.

36
POSLOVNA IZVRSNOST ZAGREB, GOD. VIII (2014) BR. 2 Tahir S. H., Sabir H. M.: Impact of family ownership on investment decision: comparative...
Considering the above arguments in favor of lower investment cashfl ow sensi-tivity in FOBs, it is worthwhile for us to investigate whether family fi rms in which ad-ditional blockholders, in spite of controlling shareholders, show lower investment–cash fl ow sensitivity. Again, the presence of blockholders creates strong monitoring and prevents managers from attaining personal benefi ts in the investment decision-making process. Th erefore, it can be concluded that FOBs obtain an optimal investment level as opposed to their counterparts. Th us, FOBs are less sensitive to cash fl ow in the presence of general blockholders.
H2: Investment-internal fund sensitivity is lower in FOBs than NFOBs aft er controlling the blockholder eff ect.
Existing literature on fi nance reveals that family owned businesses (FOBs) strongly follow the pecking order theory in fi nancing their projects. FOBs prefer inter-nal fi nancing with lower cost of capital and tempt to pass their business to descendants with capital effi ciency. Also, family involvement is generally linked with lower agency problems due to overlapping of management with ownership. Chrisman, J. J., Chua, J. H., & Litz, R. (2004) indicate that companies with a founding family CEO could have easy access to external fi nancing because of lower agency problems. Anderson, Mansi, & Reeb (2003a) empirically confi rm that fi rms with a family CEO, are generally less indebted than non-family fi rms.
Th e eff ect of family ownership on investment-cash fl ow sensitivity does depend on the degree of family involvement in the managerial operation of the company. If a family member or his/her descendant hold position of CEO, then family fi rms can take more effi cient investment decisions due to this controlling managerial position. Also, there is less classic owner-manager confl ict in those family fi rms where a family mem-ber serves as chief executive offi cer (James, H.S. (1999). Founder or his/her descendants have easy access to external debt due to reputation & long-term family relations with fi nancial institutions or bond holders, which comparatively leads to less dependency on internal funds.
Th us, considering the above argument, hypothesis-3 is posed as follows:
H3: Investment-internal fund sensitivity is lower in FOBs where founder or his descendant serve as chief executive offi cer (CEO).
Th e following reasons might explain the phenomena of alleviating fi nancial constraints & asymmetric information in FOBs. First, FOBs enjoy lower cost of debt due to less agency problems between bondholders & shareholders. Aderson, Man-si, and Reeb (2003c) indicate that long-term presence in the management of family owned companies provides strength to the relation based on commitment and trust with external fi nancing sources. Resultantly, in comparison with their counterparts, FOBs bear lower cost of debt for external fi nancing to undertake new investments. Second, long-term family managers in FOBs provide good knowledge and experience with industry that can be used to make effi cient investment decisions. Hypothesis- 4 is framed as follows:

37
POSLOVNA IZVRSNOST ZAGREB, GOD. VIII (2014) BR. 2 Tahir S. H., Sabir H. M.: Impact of family ownership on investment decision: comparative...
H4: Investment-internal fund sensitivity is lower in FOBs due to fi nancial constraints that exist in capital markets.
3. METHODOLOGY: DATA COLLECTION, DEFINITION OF VARIABLES AND METHOD OF ESTIMATION
Th is section describes sources used to collect the data sample and the procedure applied to identify diff erent independent variables and method of estimation.
3.1. Source and collection of data
To estimate the proposed hypotheses, three diff erent types of fi rm level data are required. First of all, for the dependent variables of the models, we need to cal-culate investment (Iit) and industry adjusted investment (IAIit). Th e fi rm investment is computed by adding depreciation expenses of the previous year to the increase in net fi xed assets. Investment is subtracted by Industry median to calculate industry adjusted investment. As the median is likely to be less aff ected by outliers and skewed data, we prefer median as a measure of central tendency over mean and mode. For fi -nal variables, we divided investment (Iit) as well as industry investment (IAIit) by total assets of fi rm. Secondly, we need the cash fl ow (CFit) data to compute independent var-iables. We add back depreciation expense to net income for the calculation cashfl ow proxy which is being used in entire set of models. Th irdly, the Tobin Q is calculated as a proxy variable for investment opportunities. Finally, we need the fi nancial state-ments and annual reports of the companies to calculate the set control variables that enter the right side of the models.
As a consequence, the main sources of our information are annual reports, fi -nancial statements like balance sheets, income statements, cashfl ow statements, which are extracted from particular web sites of the companies where available. Basic balance sheet analyses issued by State Bank of Pakistan (SBP) for the period spanning from 2002 to 2013 is also used, and they provide comprehensive data about companies. Market data has been collected from the business recorder and the sites of the Karachi Stock Exchange. Stock Exchanges have also been visited to collect some annual reports and other fi nancial statements, not available through sites of the companies. Firms have been contacted through telephone conversations or emails especially for the purposes of clarifi cation, for calculating voting rights in the case of kinship of board.
Th e study sample has taken all non-fi nancial companies listed on the Karachi Stock Exchange (KSE). Services companies, bonds, fi nancial companies, banks, insur-ance companies, mutual funds etc. have been excluded from the sample due to diff erent nature of their business. Th e types of information required to test hypotheses by the proposed models restrict the time span of the analyses. Consequently, the study covers the period ranging from 2002 to 2013. Th is period of twelve years is suffi cient for a com-prehensive analysis of companies from the non-fi nancial sector. In addition, the estima-

38
POSLOVNA IZVRSNOST ZAGREB, GOD. VIII (2014) BR. 2 Tahir S. H., Sabir H. M.: Impact of family ownership on investment decision: comparative...
tion method, panel data and Generalized Method of Moments (GMM) help to control the unobservable problems termed as heterogeneity and endogeneity.
For testing the absence of second order serial correlation, data for at least four consecutive years for each company are required (Arellano and Bond, 1991). We have to test the second order serial correlation as the estimation method (GMM) is based on this assumption. Th erefore, the fi nal sample of balance panel data comprises 280 companies from the non-fi nancial sector listed at the Karachi Stock Exchange (KSE). Panel data for a long period (twelve years) is the best way to eliminate the survivorship bias caused by the fact. Some fi rms might be delisted during the analysis period. Th e companies that delist in the said period are consequently, deleted form the data base.
3.2. Defi nition of dummy variables
Two threshold points 25% and 50% are used to classify FOBs and NFOBs. 25% cut off point is proposed in the offi cial defi nition of the Group of Owner Managed and Family Enterprises called GEEF by its French name (GEEF, March, 2008). It is also in line with the defi nition adopted by the Board of Family Business Network in April 7, 2008. 50% cut off point is used because ownership at this level confers unequivocal con-trol rights (Doidge et al., 2005). Also, particularly in Pakistan, most of the owners of family companies hold more than 50% of shares (Attiya and Robina, 2010). In this study, both cut off points are used to diff erentiate family and non-family enterprises and esti-mate all proposed models for empirical analyses of each classifi cation to obtain robust and reliable results.
3.3. Estimation method
Panel data methodology is applied to estimate the models of the study. Panel data methodology helps to handle two important problems that are termed as heterogenei-ty and endogeneity arising in the study of investment-cashfl ow sensitivity. Firstly, this methodology, unlike cross-sectional data analysis, controls the endogeneity. Secondly, potential misspecifi cation of the models is checked by two ways called Hansen J-statis-tic and m2 statistic. Hansen J-statistic is used to test the existing correlation between explanatory variables on the one hand and correlation in error terms on the other. Arel-lano and Bond (1991) developed m2 statistic which is used to test the second order serial correlation that might exist in residual value of fi rst diff erence. Finally wald tests (w1 and w2) are applied. w1 provides the joint signifi cance of coeffi cients and w2 checks the joint signifi cance of the time dummy variables.
Iit = α0 + β0 Iit-1 + (β + γ FOB) CFit+ Qit-1 + μ Xit-1 +€it (1)
Iit = α0 + β0 Iit-1 + (β+ γFOB +δ BH) CFit + Q it-1 + μ X it-1 +€it (2)
Iit = α0 + β0Iit-1 + (β+ Φ1 FCEO FOB + Φ2 NFCEOFOB) CFit + Qit-1 + μ Xit-1 +€it (3)
Iit = α0 + β0 Iit-1 + (β + Φ3FCFOB+ Φ4NFCFOB) CFit + Qit-1 +μ Xit-1 +€it (4)

39
POSLOVNA IZVRSNOST ZAGREB, GOD. VIII (2014) BR. 2 Tahir S. H., Sabir H. M.: Impact of family ownership on investment decision: comparative...
Where:
Iit = Investment
CFit = Cash fl ow
Qit-1 = Tobin Q proxy variable for investment opportunities.
Xit-1 = Firm’s set characteristics (SIZE it-1, DEBT RATIO it-1, DIVIDEND it-1, SALES it-1, and ROA it-1)
FOB = Dummy variable equal to 1 for FOB & 0 for NFOB
BH = Dummy variable equal to 1 for FOB with insider blockholder & 0 for otherwise
FCEOFOB = Dummy variable equal to 1 for family member serving as a CEO or 0 otherwise.
NFCEOFOB = Dummy variable equal to 1 for family member not serving as a CEO or 0 otherwise.
FCFOB = Dummy variable equal to 1 for fi nancial constraint FOB and 0 otherwise.
White and Wu (2006) indicated that fi nancial constraint fi rms are characterized by higher lever from their mean value.
NFCFOB = Dummy variable equal to 1 for non-fi nancial constraint FOB and 0 other-wise.
Еit= Error term
4. EMPIRICAL RESULTS4.1. Summary statistics
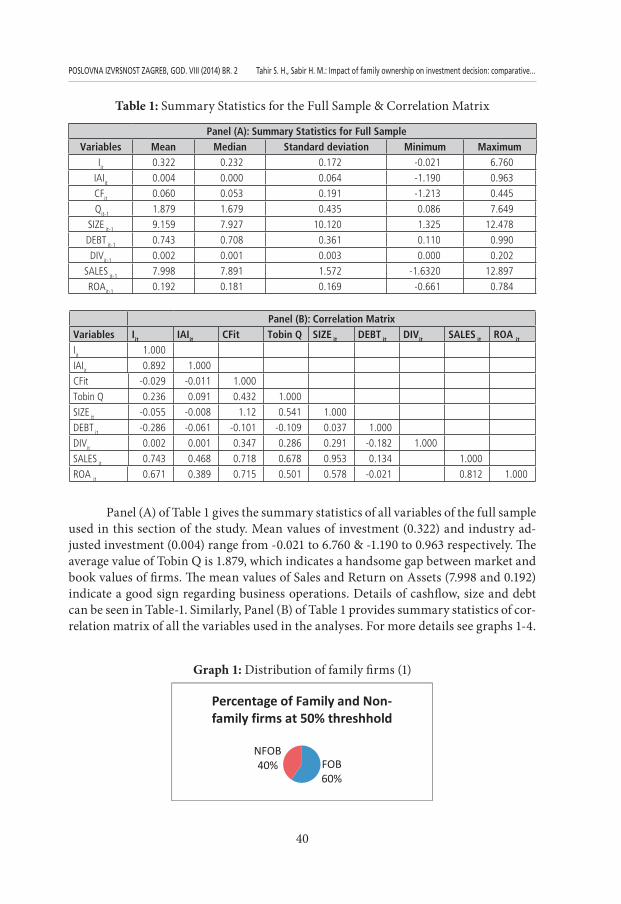
Table 1 provides details of maximum, minimum, standard deviations, medians and means of variables used in diff erent types of analysis. Panel B contributes to the correlation between variables used in the study. Th e sample consist of 280 companies (3360 observations) listed on the Karachi Stock Exchange in Pakistan. Th e data sample is collected from the period from 2002 to 2013. Th e Iit and IAIit stand for investment and industry adjusted investment. CFit stands for cashfl ow, Qit denotes Tobin Q, Size is the fi rm size, Debt is the debt ratio, Sales denotes the total net sales and ROA means return on assets. All variables are defi ned in Appendix 1.
40
POSLOVNA IZVRSNOST ZAGREB, GOD. VIII (2014) BR. 2 Tahir S. H., Sabir H. M.: Impact of family ownership on investment decision: comparative...
Table 1: Summary Statistics for the Full Sample & Correlation Matrix
Panel (A): Summary Statistics for Full SampleVariables Mean Median Standard deviation Minimum Maximum
Iit 0.322 0.232 0.172 -0.021 6.760
IAIit 0.004 0.000 0.064 -1.190 0.963
CFit 0.060 0.053 0.191 -1.213 0.445
Qit-1 1.879 1.679 0.435 0.086 7.649
SIZE it-1 9.159 7.927 10.120 1.325 12.478
DEBT it-1 0.743 0.708 0.361 0.110 0.990
DIVit-1 0.002 0.001 0.003 0.000 0.202
SALES it-1 7.998 7.891 1.572 -1.6320 12.897
ROAit-1 0.192 0.181 0.169 -0.661 0.784
Panel (B): Correlation MatrixVariables Iit IAIit CFit Tobin Q SIZE it DEBT it DIVit SALES it ROA it
Iit 1.000
IAIit 0.892 1.000
CFit -0.029 -0.011 1.000
Tobin Q 0.236 0.091 0.432 1.000
SIZE it -0.055 -0.008 1.12 0.541 1.000
DEBT it -0.286 -0.061 -0.101 -0.109 0.037 1.000
DIVit 0.002 0.001 0.347 0.286 0.291 -0.182 1.000
SALES it 0.743 0.468 0.718 0.678 0.953 0.134 1.000
ROA it 0.671 0.389 0.715 0.501 0.578 -0.021 0.812 1.000
Panel (A) of Table 1 gives the summary statistics of all variables of the full sample used in this section of the study. Mean values of investment (0.322) and industry ad-justed investment (0.004) range from -0.021 to 6.760 & -1.190 to 0.963 respectively. Th e average value of Tobin Q is 1.879, which indicates a handsome gap between market and book values of fi rms. Th e mean values of Sales and Return on Assets (7.998 and 0.192) indicate a good sign regarding business operations. Details of cashfl ow, size and debt can be seen in Table-1. Similarly, Panel (B) of Table 1 provides summary statistics of cor-relation matrix of all the variables used in the analyses. For more details see graphs 1-4.
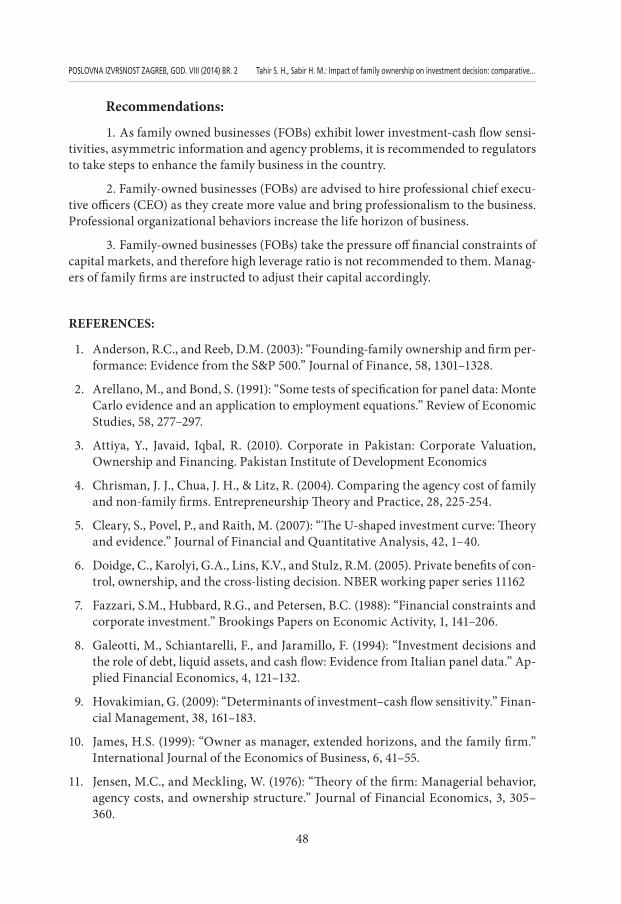
Graph 1: Distribution of family fi rms (1)
FOB60%
NFOB40%
Percentage of Family and Non-family firms at 50% threshhold

41
POSLOVNA IZVRSNOST ZAGREB, GOD. VIII (2014) BR. 2 Tahir S. H., Sabir H. M.: Impact of family ownership on investment decision: comparative...
Graph 2: Distribution of family fi rms (2)
Graph 3: Percentage of sectors in family owned fi rms at 50% threshold
Graph 4: Percentage of sectors in family owned fi rms at 25% threshold
FOB78%
NFOB22%
Percentage of family and non-family firms at 25% threshold
Construction & Material
9%
Chemical, Chemical
products and Pharmaceuticals
12%
Textile44%
Food Producer18%
Technology8% Others
9%
Construction & Material
11% Chemical, Chemical
products and Pharmaceuticals
18%
Textile31%
Food Producer
15%
Technology14%
Others11%

42
POSLOVNA IZVRSNOST ZAGREB, GOD. VIII (2014) BR. 2 Tahir S. H., Sabir H. M.: Impact of family ownership on investment decision: comparative...
4.2. Descriptive analysis
As indicated in Table 2, family owned businesses (FOBs) have a signifi cantly diff erent behavior in terms of investment. However, this diff erence is more prominent when Industry adjusted investment (IAIit) is used as a measure of investment behavior. Furthermore, these fi ndings support the arguments that the industry eff ect would be included in the estimation procedure of empirical models.
Table 2 presents a basic analysis of means tests between FOBs and NFOB with re-spect to their investment behaviors. Th e sample contains 3360 observations of 280 com-panies belonging to the non-fi nancial sector listed at the Karachi Stock Exchange (KSE) in Pakistan. Th e Iit and IAIit stand for investment and industry adjusted investment of fi rms respectively. Th ese variables are defi ned in Appendix-1. Th e FOBs and NFOBs are classifi ed according to the defi nition as explained in Appendix-1. Th e t-statistic tests are applied to measure the means diff erence under the null hypothesis. H0: Mean of Investment cashfl ow sensitivity of FOBs –Mean of Investment cashfl ow sensitivity of NFOB = 0. Th e stars ***, **, and * indicate the signifi cance at the level of 10%, 5% and 1% respectively.
Table 2: Descriptive analysis of Dependent variables (Iit & IAIit)
All Companies
FOB NFOB t-stastics
Difference of means testsusing the 25% cutoff point
No of Observations 3360 2628 732
Iit 0.56 0.45 0.95 0.05
IAIit 0.26 0.24 0.33 2.98**
Difference of means testsusing the 50% cutoff point
No of Observations 3360 2004 1356
Iit 0.52 0.51 0.55 2.12**
IAIit 0.19 0.18 0.23 3.77*
Table 3 consists of subsamples of fi nancial variables for FOBs. Th e samples con-tain 2628 observations of 219 companies of the non-fi nancial sector listed at the Karachi Stock Exchange (KSE) of Pakistan for which we use data available for consecutive twelve years from 2002 to 2013 when 25% threshold. Two threshold criteria (25% and 50%) for diff erentiation of FOB and NFOB are used in the classifi cation procedure. FOBs reduce the sample size up to observation 2004 of 167 companies when strict criterion (50%) is used. Furthermore, FOBs have been divided into two subsamples. First, FOBs with family member as CEO and no family member CEO. Second, fi nancial constraint FOBs and non-fi nancial constraint FOBs, Th e dummy variables that are applied to classify the subsample of FOBs as defi ned in Appendix 1. Iit and IAIit indicate the fi rm’s investment and industry adjusted investment respectively. Th e stars ***, **, and * indicate the signif-icance at the level of 10%, 5% and 1% respectively.

43
POSLOVNA IZVRSNOST ZAGREB, GOD. VIII (2014) BR. 2 Tahir S. H., Sabir H. M.: Impact of family ownership on investment decision: comparative...
Table 3: Firm-level characteristics by ownership structure
Family Firms
Family member CEO
No-Family member CEO
Financial Constraint
Family fi rms
Non-Financial Constraint Family
fi rms
25%cutoff point
No. of Obs. 2628 2220 408 1560 1068
Iit 0.560 0.566 0.527 0.589 0.518
IAIit 0.260 0.262 0.249 0.264 0.254
50%cutoff point
No. of Obs. 2004 1704 300 814 1190
Iit 0.520 0.528 0.475 0.550 0.499
IAIit 0.190 0.202 0.122 .292 0.120
Table 3 off ers descriptive analyses of subsamples of FOBs. FOBs are classifi ed into two subsamples. First, FOBs with family members fully involved in decision-mak-ing and one of them serving as chief executive offi cer (CEO); FOBs with family members not involved in decision-making and a professional serving as chief executive offi cer (CEO). Second, fi nancial constraint FOBs are separated from the FOBs having no fi nan-cial constraint. Whited, T.M., and Wu, G. (2006) indicate that fi nancial constraint fi rms are characterized by a higher lever from their mean value. Results seem to be inconsist-ent with our hypothesis-4 but this is not important as in this analysis other important factors are not accounted for.
4.3. Regression results
Results drawn by estimating the model (1-4) as shown in Table-4 provides an insight into the infl uence of family ownership on investment behavior of corporations. Th e current study tends to analyze whether ownership of corporations in terms of fam-ily owned businesses (FOBs) and non-family owned businesses (NFOBs) increase or decrease investment cash fl ow sensitivity. Results reveal that positive impact of cashfl ow on investment is stronger for NFOBs (β = 0.120) than FOBs (0.120- 0.080= 0.040). Th e result is statistically signifi cant as t1 is equal to 2.434. Th erefore, it can be concluded that cash fl ow has a positive impact on investment but this relationship is weaker in FOBs than NFOBs. Th ese fi ndings support the proposed hypothesis-1 and are in line with previous studies such as (Koo and Maeng, 2006; Pindado and de la Torre, 2009). Results in Table-4 indicate that there is no eff ect of blockholders on investment cashfl ow sensitivity as t3 is statistically non-signifi cant. Th erefore, it can be concluded that the presence of blockholders seems to be meaningless for investment cash fl ow relations in family forms.
Generalized method of moments (GMM) is used to test the hypotheses-1-4.

44
POSLOVNA IZVRSNOST ZAGREB, GOD. VIII (2014) BR. 2 Tahir S. H., Sabir H. M.: Impact of family ownership on investment decision: comparative...
Model equations are:
Iit = α0 + β0 Iit-1 + (β + γ FOB) CFit+£ Qit-1 + μ Xit-1 +€it ,
Iit = α0 + β0 Iit-1 + (β+ γFOB +δ BH) CFit + £Qit-1 + μ X it-1 +€I,
Iit = α0 + β0 Iit-1 + (β+ Φ1 FCEOFOB + Φ2 NFCEOFOB) CFit + £Qit-1 + μ Xit-1 +€it
Iit = α0 + β0Iit-1 + (β + Φ3FCFOB+ Φ4NCFFOB) CFit +£ Qit-1 +μ Xit-1 +€it
in which FOB equals 1 for FOBs and zero otherwise. Iit is the investment of the company and Qit is Tobin Q of the company .CFit denotes cashfl ow; SIZEit, DEBTit are the size and debt ratio of company. DIVIDENDit-1, SALES it-1 and ROA it-1 are the dividend, sales and return on assets. BH is the blockholder eff ect. FCEOFOB, NFCEOFOB are the fi rms having a family member as CEO or non-family member as CEO. FCFOB and NFCFOB represent fi nancial constraints and non-fi nancial constraints for family fi rms respec-tively. All the above mentioned variables are defi ned in Appendix-1. Results are based on the 25% cut off point for FOBs. Th e procedure followed to classify FOBs from NFOBs is explained in section 3.2. Th e sample consists of 3360 observations, 280 non-fi nancial companies listed on the Karachi Stock Exchange (KSE) of Pakistan for the period from 2002 to 2013. Th e stars ***, ** and * denote the signifi cance at the level of 10%, 5% and 1% respectively. t1 indicates the t-statistic for the linear restriction under the null hy-pothesis H0: β + γ =0 . t2 indicates the t-statistic for the linear restriction under the null hypothesis H0: β + γ =0 . t3 indicates the t-statistic for the linear restriction under the null hypothesis H0: β + γ + δ =0. t4 indicates the t-statistic for the linear restriction un-der the null hypothesis H0: β + Φ1 =0 . t5 indicates the t-statistic for the linear restriction under the null hypothesis H0: β + Φ2 =0. t6 indicates the t-statistic for the linear restric-tion under the null hypothesis H0: β + Φ3 =0 . t7 indicates the t-statistic for the linear restriction under the null hypothesis H0: β + Φ4 =0. w1 shows the Wald Test-1 for the joint signifi cance of the estimated coeffi cients under null hypothesis H0 (asymptotically distributed) and the value under parenthesis denotes the degree of freedom. w2 is the Wald Test-2 for the joint signifi cance of the times dummies under null hypothesis H0 (asymptotically distributed) and the value under parenthesis shows the degree of free-dom. c1 is the serial correlation Test-1 of order 1 using residual in fi rst diff erence under assumption of null hypothesis (no serial correlation) asymptotically distributed. c2 is the serial correlation Test-2 of order II using residual in second diff erence under assump-tion of null hypothesis (no serial correlation) asymptotically distributed. h indicates the Hansen test of over identifying restriction under assumption of null hypothesis as no correlation between instruments and error term and the value in parenthesis is the degree of freedom.

45
POSLOVNA IZVRSNOST ZAGREB, GOD. VIII (2014) BR. 2 Tahir S. H., Sabir H. M.: Impact of family ownership on investment decision: comparative...
Table 4: Investment-cash fl ow sensitivity (Iit Dependent variable at 25% cut off point)
Variables Co Model (1) Model (2) Model (3) Model (4)
Variables CV SE CV SE CV SE CV SE
constant a00.036* 0.007 0.037* 0.005 0.043* 0.006 0.041* 0.007
Iit-1 b00.509* 0.026 0.529* 0.025 0.537* 0.026 0.542* 0.023
CFit b 0.120* 0.210 1.126* 0.211 0.128* 0.112 0.097* 0.022
FOBCFit g -0.080* 0.028 -0.082* 0.029
BHCFit d 0.002 0.003
FCEOFOBCFit F1-0.057* 0.028
NFCEOFOBCFit F2-0.087* 0.029
FFOBCFit F3-0.077* 0.022
NFFOBCFit F4-0.021* 0.019
Qit-1 £ 0.004* 0.002 0.002* 0.001 0.005* 0.001 0.006* 0.001
SIZEit-1 μ1 0.05 0.03 0.051 0.003 0.054 0.001 0.024 0.001
DEBTit-1 μ2 -0.066* 0.007 -0.061* 0.006 -0.047* 0.007 -0.052* 0.007
DIVit-1 μ3 1.410* 0.13 1.371* 0.023 0.171* 0.025 0.141* 0.025
SALESit-1 μ4 0.006* 0.002 0.005** 0.002 0.003 0.003 0.009* 0.003
ROAit-1 μ5 0.002* 0.001 0.001* 0.001 0.002 0.001 0.004 0.003
T-statistics t1 2.434
T-statistics t2 3.534
T-statistics t3 1.334
T-statistics t4 3.123
T-statistics t5 3.401
T-statistics t6 1.323
T-statistics t7 8.459
Wald Test-1 w1 84.57 (8) 86.87 (9) 109.97 (9) 122.97 (9)
Wald Test-2 w2 17.01 (8) 27.11 (9) 27.28 (9) 23.18 (9)
Correlation Test-1 c1 -0.590 -6.495 -6.465 -6.425
Correlation Test-2 c2 -0.231 -0.201 -0.191 -0.241
Hansen h 278.78 (132) 312.42 (142) 315.44 (142) 335.42 (150)
Generalized method of moments (GMM) is used to test the hypotheses-1-4.
(All specifi cations are the same as in table-4 expect 50% cut off point is used as a base for distinguishing family and non-family fi rms)

46
POSLOVNA IZVRSNOST ZAGREB, GOD. VIII (2014) BR. 2 Tahir S. H., Sabir H. M.: Impact of family ownership on investment decision: comparative...
Table 5: Investment-cash fl ow sensitivity (Iit Dependent variable at 50% cut off point)
Variables Co Model (1) Model (2) Model (3) Model (4)
Variables CV SE CV SE CV SE CV SE
constant a00.037* 0.007 0.037* 0.007 0.041* 0.006 0.041* 0.007
Iit-1 b00.508* 0.026 0.508* 0.026 0.527* 0.026 0.541* 0.022
CFit b 0.121* 0.211 0.121* 0.211 0.131* 0.112 0.092* 0.022
FOBCFit g -0.081* 0.028 -0.081* 0.028
BHCFit d 0.003 0.002
FCEOFOBCFit F1-0.058* 0.028
NFCEOFOBCFit F2-0.086* 0.029
FFOBCFit F3-0.076* 0.023
NFFOBCFit F4-0.020* 0.019
Qit-1 £ 0.003* 0.001 0.003* 0.001 0.005* 0.001 -0.008* 0.028
SIZEit-1 μ1 0.051 0.03 0.051 0.03 0.055 0.001 -0.026* 0.029
DEBTit-1 μ2 -0.076* 0.007 -0.076* 0.007 -0.046* 0.006 -0.058* 0.028
DIVit-1 μ3 1.411* 0.13 1.411* 0.13 0.170* 0.027 -0.184* 0.029
SALESit-1 μ4 0.007* 0.002 0.007* 0.002 0.003 0.004 -0.008* 0.028
ROAit-1 μ5 0.012* 0.001 0.012* 0.001 0.002 0.001 -0.086* 0.029
T-statistics t1 2.435
T-statistics t2 3.524
T-statistics t3 1.333
T-statistics t4 3.122
T-statistics t5 3.408
T-statistics t6 1.328
T-statistics t7 8.458
Wald Test-1 w1 84.59 (8) 86.88 (9) 109.77 (9) 122.77 (9)
Wald Test-2 w2 17.51 (8) 27.10 (9) 27.88 (9) 23.88 (9)
Correlation Test-1 c1 -6.581 -6.496 -6.461 -6.426
Correlation Test-2 c2 -0.229 -0.221 -0.192 -0.242
Hansen h 271.71 (132) 312.43 (142) 315.54 (142) 335.41 (150)
In order to understand the impact of family involvement in management, we have designed model 3. A family member as a chief executive offi cer (CEO) is proxied as active involvement of family in the managerial decision-making process. Th e estimated coeffi cients of model 3 in Table 4 fi nd a weaker relation in investment and cashfl ow in those family fi rms where a family member works as chief executive offi cer. For FOBs where a family member works as CEO (β + Φ1 = 0.128-0.057= 0.071) and FOBs with no family member working as CEO (0.128-0.087 = 0.041) these coeffi cients are estimated

47
POSLOVNA IZVRSNOST ZAGREB, GOD. VIII (2014) BR. 2 Tahir S. H., Sabir H. M.: Impact of family ownership on investment decision: comparative...
as statistically signifi cant with t4 = 3.123 and t5 = 3.401. Th erefore, it is concluded that results from model 3 support hypothesis 3.
Aft er empirically presenting that FOBs eff ectively control the sensitivities of investment–cash fl ow, this study aims to dig out the sources of these fi ndings. Th e study estimates whether the lesser dependence of FOBs on cash fl ow when undertak-ing investment decisions is due to the owners of family fi rms who alleviate fi nancial constraints arising from information asymmetry problems. Table-4 gives the coef-fi cients which explore the conclusion of our last hypothesis of this chapter. Since the estimated coeffi cients are negative and statistically signifi cant, our hypothesis-4 is confi rmed. Th e estimated coeffi cients for fi nancial constraint fi rms (0.098-0.077 = 0.021) and for non-fi nancial constraint fi rms (0.098-0.027 = 0.071) respectively sup-port our hypothesis 4.
5. CONCLUSIONS AND DISCUSSIONSOur main fi nding in connection to the investment decision is that, overall, FOBs
exhibit lower sensitivities between investment and cashfl ow. Considering that such sen-sitivities are due to incentives problems or asymmetric information, we call this conclu-sion a supportive aspect of FOBs. In particular, the empirical results indicate that FOBs are motivated to reduce overinvestment and underinvestment problems, thus allowing FOBs to attain an optimal level of investment. Th is interpretation corroborates the ar-guments that FOBs are in a better position to create value through their investment decisions, which are documented in the second chapter of this study. Generally, it is worthwhile to highlight that there is a positive but weaker association between invest-ment and cash infl ow that sheds some light on a peculiar characteristic of FOBs - i.e. less frequent expropriation of minority shareholders which creates more value. Another feature of ownership structures in FOBs that we explain in this paper is the presence of blockholders in management structures when investigating how family control in-fl uences the sensitivity of investment spending-cash fl ow. Our result suggests that the presence of a blockholder in the decision making process is meaningless, since the result is non-signifi cant.
Th e results are not in line with the idea that active participation of a family member (family CEO) in the management improves the corporate performance and alleviates the sensitivities between investment spending and cashfl ow. Th e results con-fi rm that a professional CEO creates more value than a family CEO. As the last step in the investigation of the moderating role of family ownership is the sensitivity between investment spending and an internally generated fund. We use an innovative measure as proxy for fi nancial constraints on the base of asymmetric information. It is worth-while to note that there are two major explanations for a signifi cant positive association between investment and cash fl ow in existing fi nancial literature. Overall, our results propose that family ownership is an internal mechanism of corporate governance that helps alleviate both the agency cost and problems of fi nancial constraints linked with investment decision-making processes.
48
POSLOVNA IZVRSNOST ZAGREB, GOD. VIII (2014) BR. 2 Tahir S. H., Sabir H. M.: Impact of family ownership on investment decision: comparative...
Recommendations:
1. As family owned businesses (FOBs) exhibit lower investment-cash fl ow sensi-tivities, asymmetric information and agency problems, it is recommended to regulators to take steps to enhance the family business in the country.
2. Family-owned businesses (FOBs) are advised to hire professional chief execu-tive offi cers (CEO) as they create more value and bring professionalism to the business. Professional organizational behaviors increase the life horizon of business.
3. Family-owned businesses (FOBs) take the pressure off fi nancial constraints of capital markets, and therefore high leverage ratio is not recommended to them. Manag-ers of family fi rms are instructed to adjust their capital accordingly.
REFERENCES:
1. Anderson, R.C., and Reeb, D.M. (2003): “Founding-family ownership and fi rm per-formance: Evidence from the S&P 500.” Journal of Finance, 58, 1301–1328.
2. Arellano, M., and Bond, S. (1991): “Some tests of specifi cation for panel data: Monte Carlo evidence and an application to employment equations.” Review of Economic Studies, 58, 277–297.
3. Attiya, Y., Javaid, Iqbal, R. (2010). Corporate in Pakistan: Corporate Valuation, Ownership and Financing. Pakistan Institute of Development Economics
4. Chrisman, J. J., Chua, J. H., & Litz, R. (2004). Comparing the agency cost of family and non-family fi rms. Entrepreneurship Th eory and Practice, 28, 225-254.
5. Cleary, S., Povel, P., and Raith, M. (2007): “Th e U-shaped investment curve: Th eory and evidence.” Journal of Financial and Quantitative Analysis, 42, 1–40.
6. Doidge, C., Karolyi, G.A., Lins, K.V., and Stulz, R.M. (2005). Private benefi ts of con-trol, ownership, and the cross-listing decision. NBER working paper series 11162
7. Fazzari, S.M., Hubbard, R.G., and Petersen, B.C. (1988): “Financial constraints and corporate investment.” Brookings Papers on Economic Activity, 1, 141–206.
8. Galeotti, M., Schiantarelli, F., and Jaramillo, F. (1994): “Investment decisions and the role of debt, liquid assets, and cash fl ow: Evidence from Italian panel data.” Ap-plied Financial Economics, 4, 121–132.
9. Hovakimian, G. (2009): “Determinants of investment–cash fl ow sensitivity.” Finan-cial Management, 38, 161–183.
10. James, H.S. (1999): “Owner as manager, extended horizons, and the family fi rm.” International Journal of the Economics of Business, 6, 41–55.
11. Jensen, M.C., and Meckling, W. (1976): “Th eory of the fi rm: Managerial behavior, agency costs, and ownership structure.” Journal of Financial Economics, 3, 305–360.

49
POSLOVNA IZVRSNOST ZAGREB, GOD. VIII (2014) BR. 2 Tahir S. H., Sabir H. M.: Impact of family ownership on investment decision: comparative...
12. Kaplan, S., and Zingales, L. (1997): “Do fi nancing constraints explain why invest-ment is correlated with cash fl ow?” Quarterly Journal of Economics, 112, 169–215.
13. Koo, J., and Maeng, K. (2006): “Foreign ownership and investment: Evidence from Korea.” Applied Economics, 38, 2405–2414.
14. La Porta, R., F. Lopez-de-Silanes., and A. Shleifer., (1999) Corporate ownership around the world, Journal of Finance, 54, 471–517.
15. Marhfor, Ahmed, Bouchra M’Zali and Guy Charest, (2011) International Cross-Listing and Corporate Disclosure Policy, available http://www.efmaefm.org/0EFMAMEETINGS/EFMA%20 ANNUAL%20MEETIN GS/2011-Braga/pa-pers/0120.pdf,
16. Meyer, J.R., and Kuh, E. (1957): “Th e investment decision.” Harvard University Press, Cambridge, MA, USA
17. Modigliani, F., and Miller, M.H. (1958): “Th e cost of capital, corporation fi nance, and the theory of investment.” American Economic Review, 48, 262–297.
18. Morgado, A., and Pindado, J. (2003): “Th e underinvestment and overinvestment hypotheses: An analysis using panel data.” European Financial Management, 9, 163–177.
19. Pindado, J., and de la Torre, C. (2009): “Th e eff ect of ownership structure on under-investment and overinvestment: Empirical evidence from Spain.” Accounting and Finance, 49, 363–383.
20. Schulze, W.S., Lubatkin, M.H., and Dino, R.N. (2003): “Exploring the agency con-sequences of ownership dispersion among the directors of private family fi rms.” Academy of Management Journal, 46, 179–194.
21. Whited, T.M., and Wu, G. (2006): “Financial constraints risk.” Review of Financial Studies, 19, 531–559.

50
POSLOVNA IZVRSNOST ZAGREB, GOD. VIII (2014) BR. 2 Tahir S. H., Sabir H. M.: Impact of family ownership on investment decision: comparative...
APPENDIX:1. Investment (Iit):
Iit = (NFit - NFit-1 + DEit) / Total Assets it
NF it donates the net fi xed assets of fi rm correspondence year t. DEit is the depreci-ation expense for the year t.
2. Industry Adjusted Investment (IAIit):
IAIit = (Iit –Industry Median it) / Total Assets it
IAIit is calculated by subtracting the median of a particular industry from the fi rm value.
3. Cash Flow (CFit) :
CFit = (NIit + DEit)/ Total Assets it
4. Tobin Q
Tobin Qit = Market value of fi rm / Total Assets value of fi rm
5. Family Owned Business (FOB) Dummy:
Th e FOB is equal to 1 if family directors have ownership or voting rights of 25% and 50% in the fi rm. (We use two diff erent family owned/ controlled defi nitions depending on the threshold 25% and 50% used to defi ne family business).
6. Blockholder Eff ect (BH) Dummy :
Th e BH is equal to 1 if a stockholder has 10% or more than 10% voting rights, other than the fi rst three shareholders already considered in the defi nition of ownership concentration. Otherwise the variable takes the value of zero.
7. Family CEOFOB Dummy :
Th e FCEOFOB is a dummy variable equal to 1 where one of the family members in FOBs serves as chief executive offi cer (CEO) of the company and zero otherwise.
8. No family CEOFOB Dummy :
Th e NFCEOFOB is a dummy variable equal to 1 where one of the family members in FOBs does not serve as chief executive offi cer (CEO) of the company and zero otherwise.
9. Financial Constraint Family fi rms (FFOB) :
Dummy variable is equal to 1 for fi nancial constraint FOB and 0 otherwise. White and Wu (2006) indicated that fi nancial constraint fi rms are characterized by higher lever from their mean value.
10. No Financial Constraint Family fi rms (NFFOB) :
Dummy variable is equal to 1 for non-fi nancial constraint FOB and 0 otherwise.

51
POSLOVNA IZVRSNOST ZAGREB, GOD. VIII (2014) BR. 2 Tahir S. H., Sabir H. M.: Impact of family ownership on investment decision: comparative...
Table 6: Investment-cashfl ow sensitivity (IAIit dependent variable at 25% cut off point)
All specifi cations are the same as in table-4 expect industry adjusted investment (IAIit) in the place of investment (Iit)
Variables Co Model (1) Model (2) Model (3) Model (4)
Variables CV SE CV SE CV SE CV SE
constant a00.034* 0.005 0.036* 0.007 0.041* 0.006 0.049* 0.008
Iit-1 b00.533* 0.035 0.538* 0.026 0.527* 0.026 0.532* 0.023
CFit b 1.119* 0.212 0.132* 0.211 0.131* 0.112 0.086* 0.022
FOBCFit g -0.081* 0.028 -0.081* 0.028
BHCFit d 0.001 0.002
FCEOFOBCFit F1-0.058* 0.028
NFCEOFOBCFit F2-0.086* 0.029
FFOBCFit F3-0.076* 0.020
NFFOBCFit F4-0.022* 0.019
Qit-1 £ 0.002* 0.002 0.003* 0.001 0.005* 0.001 -0.053* 0.027
SIZEit-1 μ1 0.053 0.003 0.051 0.03 0.055 0.001 -0.084* 0.028
DEBTit-1 μ2 -0.076* 0.007 -0.076* 0.007 -0.046* 0.007 -0.058* 0.022
DIVit-1 μ3 1.411* 0.13 1.411* 0.13 0.170* 0.025 -0.087* 0.022
SALESit-1 μ4 0.007* 0.002 0.007* 0.002 0.003 0.003 -0.061* 0.024
ROAit-1 μ5 0.012* 0.001 0.012* 0.001 0.002 0.001 -0.076* 0.029
T-statistics t1 2.332
T-statistics t2 3.451
T-statistics t3 1.449
T-statistics t4 3.121
T-statistics t5 3.514
T-statistics t6 1.480
T-statistics t7 10.370
Wald Test-1 w1 84.59 (7) 86.88 (8) 109.77 (8) 122.78 (8)
Wald Test-2 w2 17.51 (7) 27.10 (8) 27.88 (8) 23.99(8)
Correlation Test-1 c1 -6.601 -6.656 -6.562 -6.558
Correlation Test-2 c2 -0.224 -0.223 -0.195 -0.241
Hansen h 304.11 (132) 322.21 (142) 305.54 (142) 315.44 (150)

52
POSLOVNA IZVRSNOST ZAGREB, GOD. VIII (2014) BR. 2 Tahir S. H., Sabir H. M.: Impact of family ownership on investment decision: comparative...
Table 7: Investment-cashfl ow sensitivity (IAIit dependent variable at 50% cut off point)
Variables Co Model (1) Model (2) Model (3) Model (4)
Variables CV SE CV SE CV SE CV SE
constant a00.031* 0.005 0.039* 0.007 0.047* 0.007 0.042* 0.008
IAIit-1 b00.638* 0.045 0.558* 0.026 0.516* 0.026 0.552* 0.023
CFit b 1.029* 0.212 0.123* 0.211 0.111* 0.112 0.087* 0.024
FOBCFit g -0.081* 0.028 -0.081* 0.028
BHCFit d 0.001 0.002
FCEOFOBCFit F1-0.048* 0.027
NFCEOFOBCFit F2-0.076* 0.028
FFOBCFit F3-0.078* 0.023
NFFOBCFit F4-0.022* 0.019
Qit-1 £ 0.005* 0.002 0.003* 0.001 0.005* 0.001 -0.058* 0.029
SIZEit-1 μ1 0.052 0.003 0.051 0.03 0.055 0.001 -0.085* 0.026
DEBTit-1 μ2 -0.077* 0.007 -0.076* 0.007 -0.046* 0.007 -0.048* 0.028
DIVit-1 μ3 1.412* 0.13 1.411* 0.13 0.170* 0.025 -0.087* 0.026
SALESit-1 μ4 0.007* 0.002 0.007* 0.002 0.003 0.003 -0.088* 0.028
ROAit-1 μ5 0.013* 0.001 0.012* 0.001 0.002 0.001 -0.089* 0.027
T-statistics t1 2.555
T-statistics t2 3.504
T-statistics t3 1.221
T-statistics t4 3.122
T-statistics t5 3.488
T-statistics t6 1.428
T-statistics t7 9.498
Wald Test-1 w1 84.59 (8) 86.88 (9) 109.77 (9) 127.77 (9)
Wald Test-2 w2 17.51 (8) 27.11 (9) 27.87 (9) 22.88 (9)
Correlation Test-1 c1 -6.60 -6.699 -6.661 -6.466
Correlation Test-2 c2 -0.229 -0.221 -0.192 -0.242
Hansen h 301.74 (132) 312.43 (142) 315.54 (142) 335.41 (150)
Note: All specifi cations are the same as in table-4 expect 50% cut off point used as a base for dis-tinguishing family and non-family fi rms and industry adjusted investment (IAIit) in the place of investment (Iit)

53
POSLOVNA IZVRSNOST ZAGREB, GOD. VIII (2014) BR. 2 Tahir S. H., Sabir H. M.: Impact of family ownership on investment decision: comparative...
UTJECAJ OBITELJSKOG VLASNIŠTVA NA INVESTICIJSKE ODLUKE: KOMPARATIVNA ANALIZA OBITELJSKIH
I NEOBITELJSKIH TVRTKI KOJE KOTIRAJU NA BURZI U KARACHIJU (PAKISTAN)
Safdar Husain Tahir 3 & Hazoor Muhammad Sabir 4
Sažetak
Cilj ovog rada je istražiti utjecaj obiteljske vlasničke strukture na investicijske odluke poduzeća koja kotiraju na burzi u Karachiju (Pakistan). Kako bi se razlikovala obiteljska od neobiteljske vlasničke strukture, u radu su korištena dva praga u vlasničkoj strukturi (25% i 50%). Panel podaci iz razdoblja 2002.-2013. prikupljeni su iz različitih izvora poput godišnjih izvješća poduzeća, fi nancijskih izvješća, business recordera, s bur-zi, putem telefonskih razgovora, elektroničkom poštom te analiziranjem bilanci dioničkih društava. Uopćena metoda momenata (Generalized Method of Moments - GMM) prim-ijenjena je na procjenu koefi cijenata varijabli od interesa. Empirijski rezultati otkrili su kako postoji jači pozitivan utjecaj novčanog tijeka na ulaganje u neobiteljskim tvrtkama od obiteljskih. Suprotno tome, obiteljske tvrtke imaju slabiju osjetljivost u odnosu između ulaganja i novčanog tijeka, čak i kad se uzme u obzir utjecaj velikih ulagača. Procijen-jeni koefi cijenti su potvrdili slabiju osjetljivost u odnosu između ulaganja i novčanog ti-jeka u tim poduzećima s obzirom na ona u kojima profesionalni menadžer djeluje kao glavni izvršni direktor (CEO). Također se pokazalo da obiteljske tvrtke ublažavaju fi -nancijska ograničenja i probleme slobodnog novčanog tijeka. Zaključak je da širi ulagački vidici, mehanizmi korporativnog upravljanja i fl eksibilnost u upravljanju fi nancijskim ograničenjima mogu omogućiti obiteljskim tvrtkama da umanje osjetljivost u odnosu između ulaganja i novčanog tijeka.
Ključne riječi: obiteljski posao, panel podaci, uopćena metoda momenata (Gener-alized Method of Moments - GMM), Burza u Karachiju (Karachi Stock Exchange - KSE), investicijska odluka.
JEL klasifi kacija: G11
3 Safdar Husain Tahir, docent, Government College University, Faisalabad, Pakistan, E-mail: [email protected]
4 Dr. sc. Hazoor Muhammad Sabir, profesor, Government College University, Faisalabad, Pakistan, E-mail: [email protected]