impact of economical cable conductor sizing · whitepaper impact of economical cable conductor...
TRANSCRIPT

WHITEPAPER IMPACT OF ECONOMICAL CABLE CONDUCTOR SIZING
Bruno De Wachter for the European Copper Institute
September 2014
ECI Publication No Cu0210
Available from www.leonardo-energy.org

Publication No Cu0210
Issue Date: September 2014
Page i
Document Issue Control Sheet
Document Title: White Paper—Impact of Economical Cable Conductor Sizing
Publication No: Cu0210
Issue: 01
Release: September 2014
Author(s): Bruno De Wachter for ECI
Reviewer(s): Fernando Nuno, Hans De Keulenaer
Document History
Issue Date Purpose
1 September 2014
2
3
Disclaimer
While this publication has been prepared with care, European Copper Institute and other contributors provide no warranty with regards to the content and shall not be liable for any direct, incidental or consequential damages that may result from the use of the information or the data contained.
Copyright© European Copper Institute.
Reproduction is authorised providing the material is unabridged and the source is acknowledged.

Publication No Cu0210
Issue Date: September 2014
Page ii
CONTENTS Summary ........................................................................................................................................................ 1
Introduction .................................................................................................................................................... 2
Cable sizing according to current technical standards ..................................................................................... 3
Cable sizing according to the economical/environmental optimum................................................................ 4
Calculating energy losses ........................................................................................................................................ 4 Four typical applications (Egemin Consultancy Note) ............................................................................................ 5 Consolidated results of the Egemin Consultancy Note .......................................................................................... 6
Cable size .................................................................................................................................................. 6
Energy loss reduction ............................................................................................................................... 7
Investment cost ........................................................................................................................................ 7
Total Cost of Ownership ........................................................................................................................... 8
Carbon Savings ......................................................................................................................................... 8
Comparing various strategies ................................................................................................................................. 9
Energy and GHG emission savings potential of economical cable sizing ........................................................ 10
Impact on economy and employment .......................................................................................................... 10
Impact on total investment .................................................................................................................... 10
Impact on labor requirement ................................................................................................................. 11
Impact on safety in normal operational conditions....................................................................................... 11
Impact on safety in fault conditions .............................................................................................................. 12
Overload conditions ............................................................................................................................... 12
Earth fault conditions ............................................................................................................................. 12
Short circuits [3] [4] ................................................................................................................................ 12
Impact on safety during construction and decommissioning [3] ................................................................... 13
Impact on power quality [4] ......................................................................................................................... 13
Conclusions ................................................................................................................................................... 14
References .................................................................................................................................................... 14
Appendix: main characteristics and results of four typical cases ................................................................... 15
Publication No Cu0210
Issue Date: September 2014
Page 1
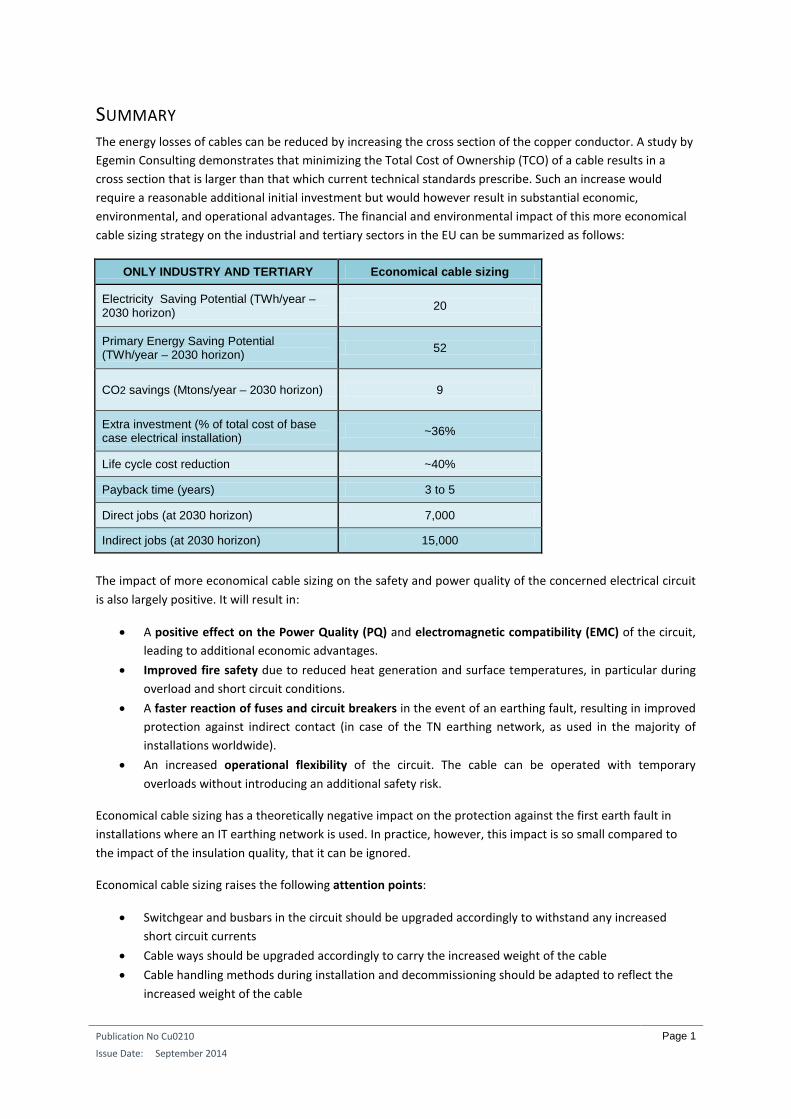
SUMMARY The energy losses of cables can be reduced by increasing the cross section of the copper conductor. A study by Egemin Consulting demonstrates that minimizing the Total Cost of Ownership (TCO) of a cable results in a cross section that is larger than that which current technical standards prescribe. Such an increase would require a reasonable additional initial investment but would however result in substantial economic, environmental, and operational advantages. The financial and environmental impact of this more economical cable sizing strategy on the industrial and tertiary sectors in the EU can be summarized as follows:
ONLY INDUSTRY AND TERTIARY Economical cable sizing
Electricity Saving Potential (TWh/year – 2030 horizon) 20
Primary Energy Saving Potential (TWh/year – 2030 horizon) 52
CO2 savings (Mtons/year – 2030 horizon) 9
Extra investment (% of total cost of base case electrical installation) ~36%
Life cycle cost reduction ~40%
Payback time (years) 3 to 5
Direct jobs (at 2030 horizon) 7,000
Indirect jobs (at 2030 horizon) 15,000
The impact of more economical cable sizing on the safety and power quality of the concerned electrical circuit is also largely positive. It will result in:
• A positive effect on the Power Quality (PQ) and electromagnetic compatibility (EMC) of the circuit, leading to additional economic advantages.
• Improved fire safety due to reduced heat generation and surface temperatures, in particular during overload and short circuit conditions.
• A faster reaction of fuses and circuit breakers in the event of an earthing fault, resulting in improved protection against indirect contact (in case of the TN earthing network, as used in the majority of installations worldwide).
• An increased operational flexibility of the circuit. The cable can be operated with temporary overloads without introducing an additional safety risk.
Economical cable sizing has a theoretically negative impact on the protection against the first earth fault in installations where an IT earthing network is used. In practice, however, this impact is so small compared to the impact of the insulation quality, that it can be ignored.
Economical cable sizing raises the following attention points:
• Switchgear and busbars in the circuit should be upgraded accordingly to withstand any increased short circuit currents
• Cable ways should be upgraded accordingly to carry the increased weight of the cable • Cable handling methods during installation and decommissioning should be adapted to reflect the
increased weight of the cable

Publication No Cu0210
Issue Date: September 2014
Page 2
INTRODUCTION In the accelerating evolution towards a low carbon economy, electrical energy must be used at maximum efficiency. On the one hand, fossil fuel power stations will continue to represent a substantial share of the electricity generation mix in the upcoming decades. On the other hand however, regulators are committing themselves to drastically reducing greenhouse gas (GHG) emissions. As a result, energy management must become a priority. To get the most out of each kilowatt-hour, machinery and appliances must be carefully evaluated for their energy efficiency.
It is an often overlooked fact that electrical energy is lost not only in generation and end-use, but also in the supply system (cables, busbars, transformers, etcetera). Every cable has electrical resistance, so some portion of the electrical energy that it carries is dissipated as heat and is lost.
Such energy losses can be reduced by increasing the cross section of the copper conductor in a cable or busbar. Obviously, the conductor size cannot be increased endlessly. The objective should be achieving the economical optimum. A study by Egemin Consulting demonstrates clearly that in the majority of the cases, the optimal method of minimizing the Total Cost of Ownership (TCO) of a cable results from a cross section that is larger than what current technical standards prescribe.
Publication No Cu0210
Issue Date: September 2014
Page 3
CABLE SIZING ACCORDING TO CURRENT TECHNICAL STANDARDS The current international technical standards for cable sizing take safety and certain power quality aspects into account, but NOT energy efficiency. According to these technical standards, the minimum acceptable cross section of a cable is defined by the most stringent of three restrictions:
1) The thermal impact of the maximum rated current
2) The voltage drop created by the maximum rated current
3) The electro-dynamic impact of the strongest short circuit current
The first restriction is defined in the technical standard IEC 60364-4-43 (Electrical Installations for buildings):
The heat production in the cable should be restricted to avoid the creation of hot spots that could affect the insulation quality or which could be dangerously hot to touch. By choosing a sufficient cross section for the cable, its electrical resistance will remain low, as will the production of heat.
The second restriction is stipulated in the standard IEC 60364-5-52 and DIN 18015-1:2007-09:
The maximum rated current will create a voltage drop in the cable. This should not be higher than 3% of the nominal voltage to ensure the proper functioning of all appliances. By choosing a sufficient cross section for the cable, its electrical resistance will remain low, as will the voltage drop.
The third restriction is defined in the technical standard IEC 60909 (Short-circuit currents in three phase AC systems):
The short-circuit currentIsc, multiplied by the time-current curve of the circuit breaker, should not cross the time-current characteristic expressing the electro-dynamic strength of the cable. The latter is proportional to the cable cross-section.
For shorter cables and/or higher voltages, the first restriction (heat production) is the most stringent in the majority of the cases. For longer cables and/or lower voltages, it is the second restriction (voltage drop) that is the most stringent in the majority of the cases.
Note that the sizing of the cable conductor cross sections is not continuous, but according to the standard caliber given in conductor cross section tables and sales catalogues.
Publication No Cu0210
Issue Date: September 2014
Page 4
CABLE SIZING ACCORDING TO THE ECONOMICAL/ENVIRONMENTAL OPTIMUM
CALCULATING ENERGY LOSSES The voltage drop in a cable can be calculated as follows:
∆𝑉𝑉 = 2. 𝐿𝐿.𝐶𝐶𝛾𝛾. 𝑆𝑆
With
ΔV = voltage drop L = length of the conductor C = rated current γ = conductivity of the copper conductor S = cross section of the copper conductor
With this formula, the minimum conductor cross section can be derived from the maximum voltage drop stipulated by the current technical standards.
This voltage drop however, is related to the energy losses in the cable. Reducing the voltage drop further than strictly required will therefore further reduce the energy losses and the related operational cost of the cable. Such a higher cross section, however, leads to a higher initial investment cost to purchase the cable. To minimize the total life cycle cost (TCO) of the cable, the investment cost (which goes up with increasing cross section) and the operational cost (which conversely goes down with increasing cross section)must be balanced.
The power losses in a cable at a given moment in time can be calculated using the following formula:
𝑃𝑃𝑙𝑙𝑙𝑙𝑙𝑙𝑙𝑙 = ∆𝑉𝑉.𝐶𝐶
2
Or:
𝑃𝑃𝑙𝑙𝑙𝑙𝑙𝑙𝑙𝑙 = 𝐿𝐿.𝐶𝐶2
𝛾𝛾. 𝑆𝑆
With:
• C = current in the conductor • γ = conductivity of the copper conductor • S = the cross section of the copper conductor • L = the length of the cable
The current flowing through the conductor, depends upon the loading: C = Crated .Floading(%)
Out of this follow the energy losses over a given time t:
𝐸𝐸𝑙𝑙𝑙𝑙𝑙𝑙𝑙𝑙𝑙𝑙𝑙𝑙 = 𝐿𝐿.𝐶𝐶𝑟𝑟𝑟𝑟𝑟𝑟𝑙𝑙𝑟𝑟2 .𝐹𝐹𝑙𝑙𝑙𝑙𝑟𝑟𝑟𝑟𝑙𝑙𝑙𝑙𝑙𝑙2 . 𝑟𝑟
𝛾𝛾. 𝑆𝑆
This factor, in turn, has to be multiplied by the electricity tariff and by a depreciation factor to calculate the total cost of the energy losses over the lifetime of the cable:

Publication No Cu0210
Issue Date: September 2014
Page 5
𝐸𝐸𝑙𝑙𝑙𝑙𝑙𝑙𝑙𝑙𝑙𝑙𝑙𝑙 = 𝐿𝐿.𝐶𝐶𝑟𝑟𝑟𝑟𝑟𝑟𝑙𝑙𝑟𝑟2 .𝐹𝐹𝑙𝑙𝑙𝑙𝑟𝑟𝑟𝑟𝑙𝑙𝑙𝑙𝑙𝑙2 . 𝑟𝑟𝑙𝑙𝑙𝑙𝑙𝑙𝑙𝑙 𝑇𝑇𝑟𝑟𝑟𝑟𝑙𝑙𝑙𝑙𝑙𝑙 𝑙𝑙𝑙𝑙𝑙𝑙𝑒𝑒𝑟𝑟𝑟𝑟 .𝑁𝑁(𝑙𝑙 ,𝑙𝑙)
𝛾𝛾. 𝑆𝑆
With
L = length of the conductor Crated = rated current γ = conductivity of the copper conductor S = cross section of the copper conductor Floading = the average loading factor of the cable tlife = the total number of hours the cable is used over its lifetime Tafiffelectr = the average electricity tariff over the lifetime of the cable N(i,n) = the depreciation factor = ((1 + i)n – 1) / (i – (1 + i)n) i = the interest rate n = the economic lifetime of the cable
The total cost of the energy losses over the lifetime of the cable is inversely proportional to the cross section of the conductor. The relation between the investment cost of the cable and its cross section, in contrast, is nearly linear. The most economical cable cross section is the point where the sum of the investment cost and the total cost of the energy losses passes through a minimum. For the most economical cable cross section, the investment cost and the total cost of the energy losses over the lifetime of the cable will be equal.
Figure 1—The total life cycle cost of the cable—a typical case.
FOUR TYPICAL APPLICATIONS (EGEMIN CONSULTANCY NOTE) The yearly energy losses in a cable not only depend upon its length, cross section, and rated current, but also upon the actual loading of the cable (see formulas above). The prevailing electricity tariff also plays a role in the calculation of the total life cycle cost of the cable. These are all figures that vary according to the prevailing circumstances.
For this reason, Egemin Consulting simulated four typical applications [1]:
• A small office building (low voltage connection) • A large office building (high voltage connection) • A small logistics handling plant (low voltage connection)

Publication No Cu0210
Issue Date: September 2014
Page 6
• A large industrial plant (high voltage connection)
For each application, a limited number of electrical loads were worked out in detail. All others were represented as dummy loads.
Five different cable sizing strategies were simulated for each of these four cases, namely:
• The base case: all cables are sized according to the current safety standards • One size up (S + 1): cable cross sections are increased by one caliber compared to the base case • Two sizes up (S + 2): cable cross sections are increased by two caliber compared to the base case • Economical optimum: for each individual cable, the cross section is calculated that has the lowest TCO
(calculating with a non-linear optimization algorithm). The investment horizon is set at 10 years. • Ecological optimum: for each individual cable, the cross section is calculated that has the lowest
carbon emissions over a 20 year life span, for CO2 emissions of electricity of 395 kg CO2/MWh, and CO2 emissions for copper production of 2.95 kg CO2/kg Cu.
Calculations were made with a specific resistance of copper of 22.212 mΩ.mm²/m. This is the Rho_1 value as defined in Cenelec R064-003 for an operational temperature of 70°C (maximum operational temperature of a PVC insulated cable).
To simplify the calculations, Egemin Consulting assumed that the depreciation of future costs and the future evolution of the electricity tariff would cancel each other out. Therefore, depreciation is not taken into account and the electricity tariff is assumed to be stable.
Pricing tables for cable delivery, installation, and connection under reference circumstances were used for calculating the investment cost of the cable.
See appendix for the main characteristics of each of the four simulated applications, as well as for the individual results. We will now discuss the consolidated results.
CONSOLIDATED RESULTS OF THE EGEMIN CONSULTANCY NOTE Even though the Egemin Consultancy Note [1] is based on a limited number of roughly characterized models, the conclusions firmly demonstrate a significant opportunity for energy savings, TCO reductions, and carbon emission reductions. Due to the limitations of the models, due care must be taken tousle the exact figures. However the resulting trends and global conclusions hold for a wide range of building types and therefore also hold for the electricity market in general.
The following conclusions can be drawn:
CABLE SIZE • The One size up strategy leads to a global average increase in cable cross section of approximately
40%. • The Two sizes up strategy leads to a global average increase in cable cross section of approximately
90%. • The Economical optimum strategy leads to a global average increase in cable cross section of
approximately 150%. • The Ecological optimum strategy leads to a global average increase in cable cross section of
approximately 700% to 1,000%. Such a large increase of the cable cross sections would lead to practical implementation problems such as undersized equipment terminals, cable way congestion, and increased project lead times due to handling difficulties. These issues probably make this scenario unrealistic.

Publication No Cu0210
Issue Date: September 2014
Page 7
ENERGY LOSS REDUCTION
Figure 2—Yearly energy losses, in percentage of useful energy consumption.
With a cable design in accordance with current minimum safety standards, the conductive energy losses in the cable are on average approximately 2% of the useful electricity consumption.
If the cables were to be sized according to the Economical optimum strategy, those energy losses would be reduced to approximately 0.7% of the average total energy consumption.
INVESTMENT COST
Figure 3—Initial investment cost, in percentage relative to the base line.
The initial cable investment cost of the Economical optimum strategy is about twice as large as the investment cost of the base line solution. We should bear in mind, however, that the cost of electrical cables is only a
0
0,5
1
1,5
2
2,5
Small office
Large office
Small logistics
Large industrial
0
100
200
300
400
500
600
700
800
Small office
Large office
Small logistics
Large industrial
Publication No Cu0210
Issue Date: September 2014
Page 8
small portion of the total investment of a building project. The cost of the electrical installation is typically between 5% and 10% of the total investment cost of a building or industrial processing plant, and the wiring cost represents only a portion of the total cost of the electrical installation along with switchboards, transformers, electrical protection, etcetera. A doubling of the wiring cost can therefore be regarded as a reasonable additional effort for the entire project, especially since the pay-back times are limited to 5 years or less.
The investment cost of the Ecological optimum strategy is 4 to 6 times higher than the base line investment—a difference that becomes hard to justify and argues against this design strategy.
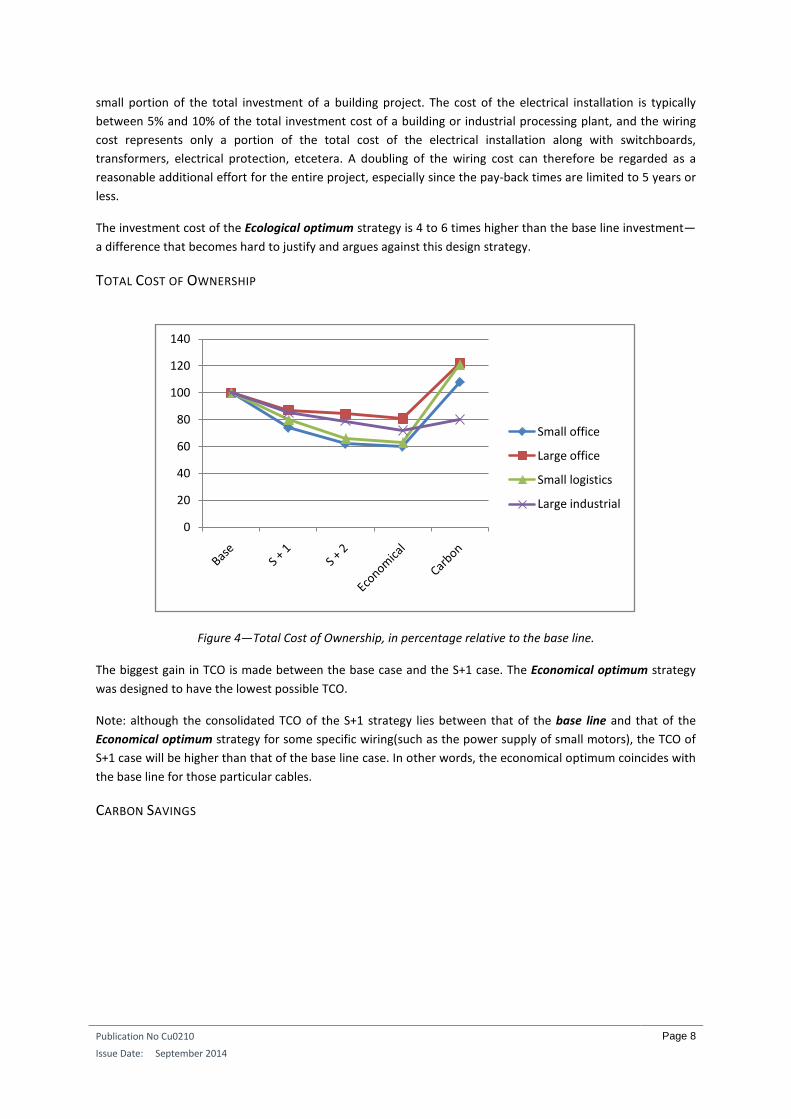
TOTAL COST OF OWNERSHIP
Figure 4—Total Cost of Ownership, in percentage relative to the base line.
The biggest gain in TCO is made between the base case and the S+1 case. The Economical optimum strategy was designed to have the lowest possible TCO.
Note: although the consolidated TCO of the S+1 strategy lies between that of the base line and that of the Economical optimum strategy for some specific wiring(such as the power supply of small motors), the TCO of S+1 case will be higher than that of the base line case. In other words, the economical optimum coincides with the base line for those particular cables.
CARBON SAVINGS
0
20
40
60
80
100
120
140
Small office
Large office
Small logistics
Large industrial
Publication No Cu0210
Issue Date: September 2014
Page 9
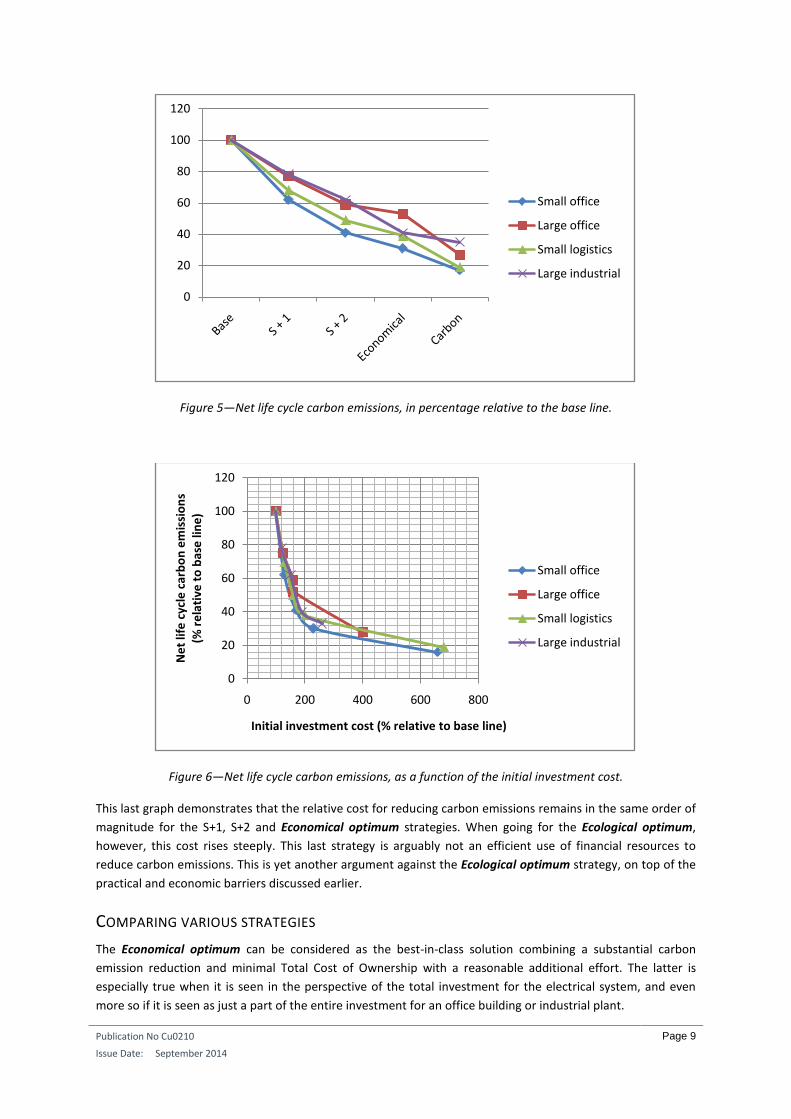
Figure 5—Net life cycle carbon emissions, in percentage relative to the base line.
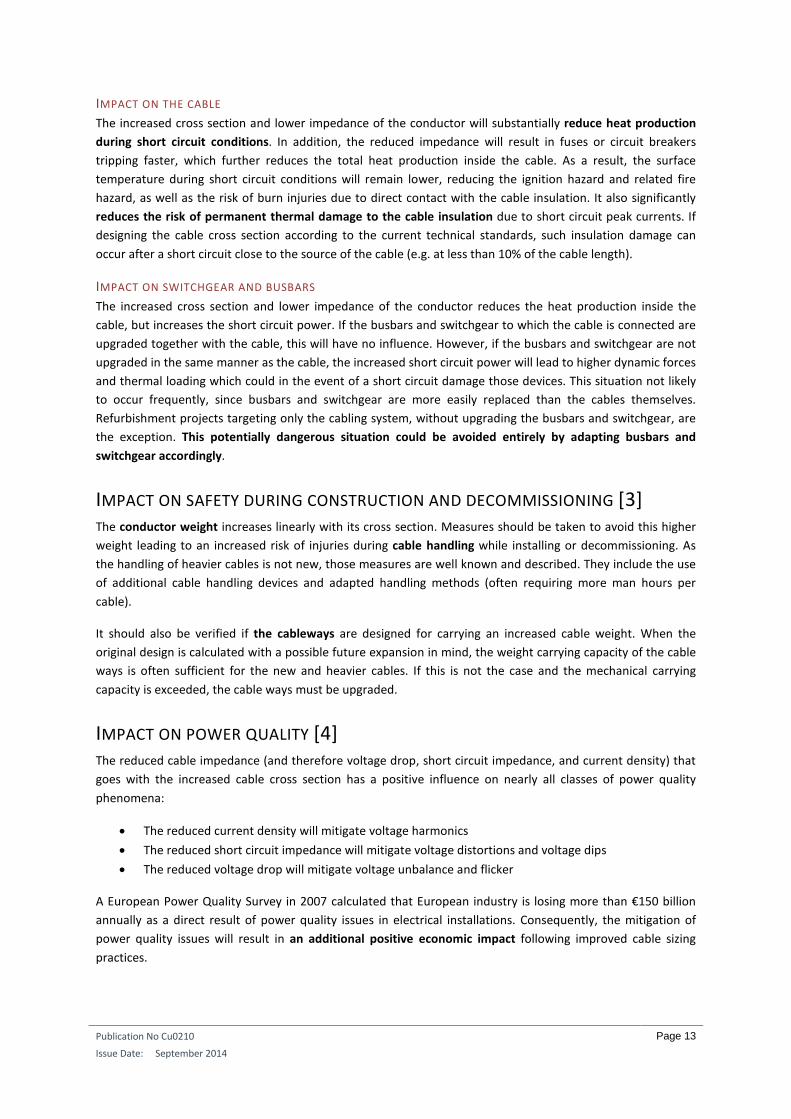
Figure 6—Net life cycle carbon emissions, as a function of the initial investment cost.
This last graph demonstrates that the relative cost for reducing carbon emissions remains in the same order of magnitude for the S+1, S+2 and Economical optimum strategies. When going for the Ecological optimum, however, this cost rises steeply. This last strategy is arguably not an efficient use of financial resources to reduce carbon emissions. This is yet another argument against the Ecological optimum strategy, on top of the practical and economic barriers discussed earlier.
COMPARING VARIOUS STRATEGIES The Economical optimum can be considered as the best-in-class solution combining a substantial carbon emission reduction and minimal Total Cost of Ownership with a reasonable additional effort. The latter is especially true when it is seen in the perspective of the total investment for the electrical system, and even more so if it is seen as just a part of the entire investment for an office building or industrial plant.
0
20
40
60
80
100
120
Small office
Large office
Small logistics
Large industrial
0
20
40
60
80
100
120
0 200 400 600 800
Net
life
cyc
le c
arbo
n em
issi
ons
(%
rela
tive
to b
ase
line)
Initial investment cost (% relative to base line)
Small office
Large office
Small logistics
Large industrial

Publication No Cu0210
Issue Date: September 2014
Page 10
The S+1 strategy results in financial and ecological advantages that are lower compared to the economical optimum, but still significant, and that for an even more modest increase of the total initial investment cost. However, it does not guarantee a minimum TCO for all particular types of wire. In some specific cases, cables will be over-dimensioned and the investment will not pay itself back.
The Ecologic optimum would generally reduce the carbon emissions drastically, but the additional initial investment would be off-scale, the TCO negative, and the technical implementation difficult. It is therefore very unlikely that this strategy will find broad public or industry support.
ENERGY AND GHG EMISSION SAVINGS POTENTIAL OF ECONOMICAL CABLE
SIZING What would the projected energy savings potential of a mandatory standard for cable sizing be when applied to all new electrical installations?
In such new installations, the energy losses in cable and wiring would be reduced by1.3% of the useful energy consumption (reduction from 2% to 0.7%, see graph above).
At the predicted annual renewal rate for the electrical installations (3.5 to 4.5%), the new standard for cable sizing would reach a significant penetration by 2020 (65 up to 85%).
When calculating the predicted EU total electricity consumption figures for industry (1,151 TWh/y in 2013 up to 1,318 TWh/y in 2020) and services (831 TWh/y in 2013 up to 950 TWh/y in 2020), the energy savings potential can be calculated to be on average20 TWh/y between 2014 and 2020.
IMPACT ON ECONOMY AND EMPLOYMENT In a study [2] subsequent to the original consultancy note, Egemin Consulting calculated the impact of economical cable sizing on the total investment cost in greater detail and estimated its impact on the labor market.
IMPACT ON TOTAL INVESTMENT The relative importance of the electrical distribution system in the entire building project can be estimated as follows:
• For a small office: 5% of the total investment • For a large office: 10% of the total investment • For a small logistics center: 12.5% of the total investment
25% of the equipment investment Which is in turn 50% of the total logistics center investment
• For a large industrial facility: 12% of the total investment in the production unit 20% of the equipment investment Which is in turn 60% of the total production unit investment
This leads to the following figures for the relative investment cost of modified cable sizing strategies:

Publication No Cu0210
Issue Date: September 2014
Page 11
Cost evolution of total investment
Base S + 1 S + 2 Economical Carbon Small office 100% 100.70% 101.50% 101.70% 106.90% Large office 100% 101.30% 102.80% 102.60% 113.00% Small logistics 100% 100.80% 102.10% 102.80% 113.80% Large industrial 100% 101.90% 104.20% 107.30% 113.20% Average 100% 101.20% 102.60% 103.60% 111.70%
Based on these assumptions, economical cable sizing leads to an average increase of +3.6% in the total investment cost. This will result in investment pay-back times of 3 to 5 years.
IMPACT ON LABOR REQUIREMENT The additional investment cost of economical cable sizing can be apportioned into material costs and labor costs, thus enabling the direct estimation of job creation.
The additional labor that will be required for economical cable sizing is as follows:
• Cable system Engineering time for performing cable sizing calculations Labor required for placement and connection
• Electrical distribution panel Engineering time for panel design Labor for panel construction and wiring
• Cable ways and ducts Engineering time for routing and material specification Labor for cable way and duct installations
The additional investment cost for economical cable sizing (as calculated above) consists partly of this additional labor cost and partly of additional material costs. By knowing the division between those two parts, the following effect on employment can be calculated [2]:
• An increase of 2% in engineering jobs • An increase of 28% in manual labor jobs within the electrical contracting sector
Taken together this results in an estimated 7,000 additional jobs in the EU.
An indirect effect on job creation will likewise occur in the cable manufacturing industry, and to a lesser extend in the production of cable way systems, resulting in an estimated 15,000 additional jobs.
IMPACT ON SAFETY IN NORMAL OPERATIONAL CONDITIONS Modifying cable sizing methods will modify the properties of the electrical installation. It is important to investigate whether these changes have any influence on the safety of the electrical installation.
During normal operating conditions, an increased cable cross section will have the following effects [3] [4]:
• With cable cross sections calculated according to the current standards, surface temperatures of certain cable types can reach from 80°C up to 90°C. Increasing the cable cross section will reduce the impedance of the cable and consequently the conductive heat losses as well. Moreover, the heat capacity of the conductor will increase with increasing cross section. Both influences combined results

Publication No Cu0210
Issue Date: September 2014
Page 12
in a quadratic reduction of the cable sheet surface temperatures. A reduction of this surface temperature reduces the risk of fire ignition, having a positive effect on fire safety in a building. It also reduces the hazard of burn injuries due to human contact with cable sheets.
• What will be the impact on the protection against direct contact with live parts of the electrical system through a Residual Current Device (RCD)? In principle, a larger cross section of the active conductor reduces the impedance of this conductor, and thus the general impedance of a circuit towards earth via the human body. This would increase the possible fault current when live parts are touched by humans. However, since the impedance of such an earth circuit is largely dominated by the impedance of the earth and the human body, the impedance of the active conductor can be ignored (as it is indeed ignored in the impedance calculation standards for RCDs sizing). As a result, we can conclude that the higher conductor cross section has no impact on protection against direct contact.
• The higher cable cross section reduces the current density and voltage drop in the cable. This will reduce the electric and magnetic fields emitted by high frequency harmonic components, which reduces the risk of electro-magnetic interference with nearby data cables and improves the electro-magnetic compatibility (EMC).
IMPACT ON SAFETY IN FAULT CONDITIONS OVERLOAD CONDITIONS Due to the increased conductor cross section, the cable will be able to stand long periods of power overload without introducing the risk of a dangerous thermal overload. This will improve the fire safety of the cable [3] [4].
This ability to withstand overloads also increases the operational flexibility of the circuit [4]. The cable can be operated with temporary overloads without introducing an additional safety risk.
EARTH FAULT CONDITIONS
IN A TN EARTHING NETWORK WITH FUSES OR CIRCUIT BREAKERS [3] [4] Due to the increased cross section, the phase conductor has lower impedance. This will in turn reduce the impedance and increase the fault current in a phase to earth fault condition, which will lead to a faster response of the fuse or circuit breaker. This reduces the time during which a potentially dangerous contact can exist. Moreover, despite the larger fault current, the reduced impedance and increased heat capacity that goes with the larger cross section will mitigate the cable temperature rise during the earth fault.
IN A TT NETWORK WITH A RESIDUAL CURRENT DEVICE (RCD) [3] [4] As discussed above under Normal operational conditions, the increased cross section and reduced impedance of the phase conductor has no influence on the functioning of the RCD protection.
IN AN IT NETWORK WITH AN INSULATION MONITORING DEVICE [3] [4] During the first fault to the ground, the fault current depends on the insulation resistance and the capacity between the conductor and the ground. Increasing the cross section of the phase conductor will slightly increase the latter capacity, having a theoretical negative impact on the protection. In practice, however, this influence will be of minor importance compared to the influence of cable insulation quality, and can be ignored. It should be noted that the current technical prescriptions already ignore the cable cross section in the definition of the protection level, taking only the resistance of the insulation into account.
During the second earth fault, the protection against indirect contact will be similar to that of a TN system.
SHORT CIRCUITS [3] [4]
Publication No Cu0210
Issue Date: September 2014
Page 13
IMPACT ON THE CABLE The increased cross section and lower impedance of the conductor will substantially reduce heat production during short circuit conditions. In addition, the reduced impedance will result in fuses or circuit breakers tripping faster, which further reduces the total heat production inside the cable. As a result, the surface temperature during short circuit conditions will remain lower, reducing the ignition hazard and related fire hazard, as well as the risk of burn injuries due to direct contact with the cable insulation. It also significantly reduces the risk of permanent thermal damage to the cable insulation due to short circuit peak currents. If designing the cable cross section according to the current technical standards, such insulation damage can occur after a short circuit close to the source of the cable (e.g. at less than 10% of the cable length).
IMPACT ON SWITCHGEAR AND BUSBARS The increased cross section and lower impedance of the conductor reduces the heat production inside the cable, but increases the short circuit power. If the busbars and switchgear to which the cable is connected are upgraded together with the cable, this will have no influence. However, if the busbars and switchgear are not upgraded in the same manner as the cable, the increased short circuit power will lead to higher dynamic forces and thermal loading which could in the event of a short circuit damage those devices. This situation not likely to occur frequently, since busbars and switchgear are more easily replaced than the cables themselves. Refurbishment projects targeting only the cabling system, without upgrading the busbars and switchgear, are the exception. This potentially dangerous situation could be avoided entirely by adapting busbars and switchgear accordingly.
IMPACT ON SAFETY DURING CONSTRUCTION AND DECOMMISSIONING [3] The conductor weight increases linearly with its cross section. Measures should be taken to avoid this higher weight leading to an increased risk of injuries during cable handling while installing or decommissioning. As the handling of heavier cables is not new, those measures are well known and described. They include the use of additional cable handling devices and adapted handling methods (often requiring more man hours per cable).
It should also be verified if the cableways are designed for carrying an increased cable weight. When the original design is calculated with a possible future expansion in mind, the weight carrying capacity of the cable ways is often sufficient for the new and heavier cables. If this is not the case and the mechanical carrying capacity is exceeded, the cable ways must be upgraded.
IMPACT ON POWER QUALITY [4] The reduced cable impedance (and therefore voltage drop, short circuit impedance, and current density) that goes with the increased cable cross section has a positive influence on nearly all classes of power quality phenomena:
• The reduced current density will mitigate voltage harmonics • The reduced short circuit impedance will mitigate voltage distortions and voltage dips • The reduced voltage drop will mitigate voltage unbalance and flicker
A European Power Quality Survey in 2007 calculated that European industry is losing more than €150 billion annually as a direct result of power quality issues in electrical installations. Consequently, the mitigation of power quality issues will result in an additional positive economic impact following improved cable sizing practices.

Publication No Cu0210
Issue Date: September 2014
Page 14
CONCLUSIONS The Economical optimum can be considered as the best practice cable sizing strategy, combining a substantial carbon emission reduction and minimal TCO with a reasonable additional initial investment. The S+1 and S+2 strategies do not guarantee a minimum TCO for each individual wire. The Ecologic optimum would reduce the carbon emissions drastically, but the additional initial investment would be off-scale, the TCO negative, and the technical implementation difficult.
This new best practice of cable sizing leads to a reduction of 40% in the TCO of the cable. The reduction of the environmental impact is also substantial, namely 52 TWh of primary energy and 9 Mtons of CO2 emissions saved per year.
The impact on the quality and safety in operating the cable are also largely positive. Increased cable sizing leads to an improved power quality and EMC of the circuit, improved fire safety in overload and short circuit conditions, a faster reaction of fuses and circuit breakers in the event of an earth fault (TN earthing network), and increased operational flexibility (temporary overloads are safe).
A few attention points must also be taken into account. The increased cable weight means that cable ways and cable handling methods during installation and decommissioning need to be upgraded accordingly. The increased short circuit current requires that the switchgear and busbars within the circuit be upgraded to withstand the resulting mechanical forces and thermal loads.
REFERENCES [1] Egemin Consulting, Bert Brouwers, Consultancy Note “Modified Cable Sizing Strategies/Potential Savings versus Copper Use”, 16 May 2011 http://www.leonardo-energy.org/white-paper/economic-cable-sizing-and-potential-savings
[2] Egemin Consulting, Bert Brouwers, Consultancy Note “Modified Cable Sizing Strategies/Supplemental Report”, 13 February 2012
[3] Egemin Consulting, Bert Brouwers, Consultancy Note “Modified Cable Sizing Strategies/Potential Safety Issues”, 15 October 2013
[4] Angelo Baggini Engineering Consulting and Design, “Ecodesign Preparatory Study on Power Cables/Addressing Potential Safety Issues”, February 2014
Publication No Cu0210
Issue Date: September 2014
Page 15
APPENDIX: MAIN CHARACTERISTICS AND RESULTS OF FOUR TYPICAL CASES
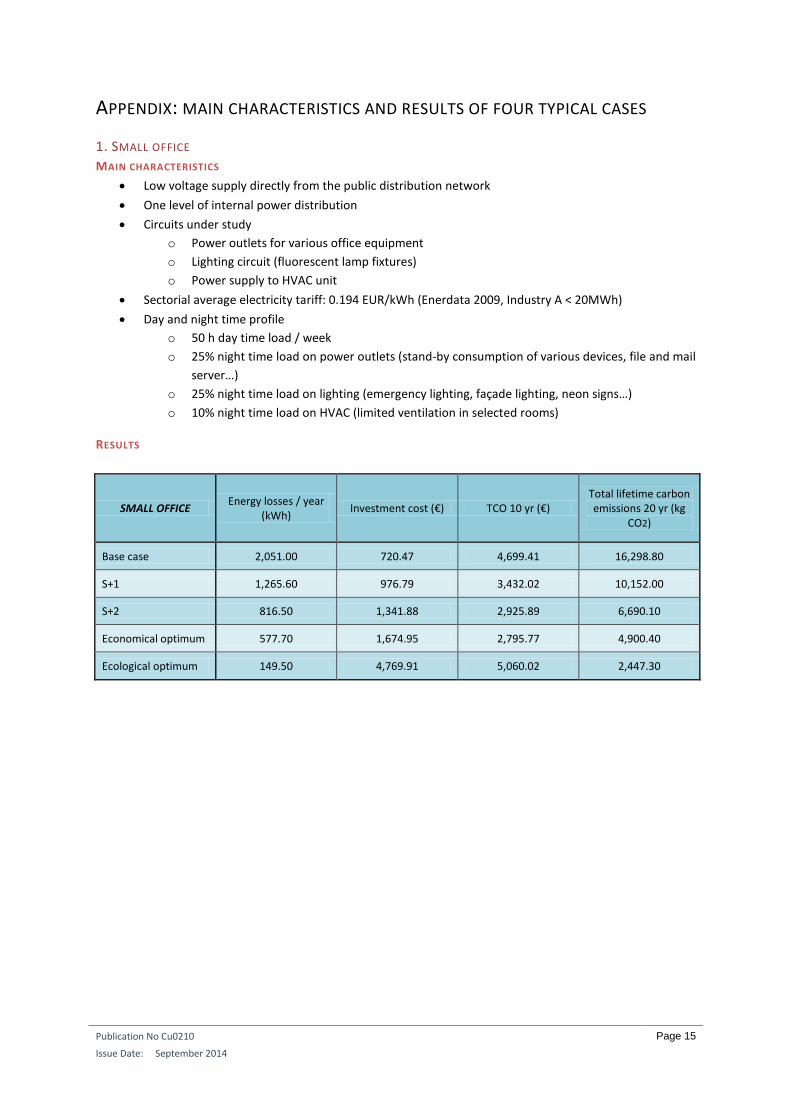
1. SMALL OFFICE MAIN CHARACTERISTICS
• Low voltage supply directly from the public distribution network • One level of internal power distribution • Circuits under study
o Power outlets for various office equipment o Lighting circuit (fluorescent lamp fixtures) o Power supply to HVAC unit
• Sectorial average electricity tariff: 0.194 EUR/kWh (Enerdata 2009, Industry A < 20MWh) • Day and night time profile
o 50 h day time load / week o 25% night time load on power outlets (stand-by consumption of various devices, file and mail
server…) o 25% night time load on lighting (emergency lighting, façade lighting, neon signs…) o 10% night time load on HVAC (limited ventilation in selected rooms)
RESULTS
SMALL OFFICE Energy losses / year (kWh) Investment cost (€) TCO 10 yr (€)
Total lifetime carbon emissions 20 yr (kg
CO2)
Base case 2,051.00 720.47 4,699.41 16,298.80
S+1 1,265.60 976.79 3,432.02 10,152.00
S+2 816.50 1,341.88 2,925.89 6,690.10
Economical optimum 577.70 1,674.95 2,795.77 4,900.40
Ecological optimum 149.50 4,769.91 5,060.02 2,447.30

Publication No Cu0210
Issue Date: September 2014
Page 16
2. LARGE OFFICE MAIN CHARACTERISTICS
• High voltage supply from the public distribution network, privately operated power transformer • Two levels of internal power distribution
o Main distribution towards building floors o Secondary distribution panel for each floor (each floor = a small office)
• Circuits under study o Power feeder to one building floor o Power outlets for various office equipment o Power outlets for ICT infrastructure and similar devices o Power supply to HVAC unit
• Sectorial average electricity tariff: 0.148 EUR/kWh (Enerdata 2009, Industry B, 20-500 MWh) • Day and night time profile
o 60 h day time load/week o 25% night time load on power outlets ICT infrastructure (switches, routers, fiber to desk
convertors, file and mail servers, et cetera) o 10% night time load on power outlets of various office equipment (stand-by consumption,
DECT phone chargers, et cetera) o 10% night time load on HVAC (limited ventilation in selected rooms)
RESULTS
LARGE OFFICE Energy losses / year (kWh) Investment cost (€) TCO 10 yr (€)
Total lifetime carbon emissions 20 yr (kg
CO2)
Base case 6,854.60 4,165.93 14,310.69 55,141.70
S+1 5,106.70 5,290.12 12,848.00 41,645.20
S+2 3,897.20 6,597.65 12,365.49 32,479.90
Economical optimum 3,424.00 6,596.78 11,664.27 29,140.50
Ecological optimum 1,018.10 16,688.90 18,195.73 14,956.20

Publication No Cu0210
Issue Date: September 2014
Page 17
3. SMALL LOGISTICS CENTER MAIN CHARACTERISTICS
• Low voltage supply directly from the public distribution network • Two levels of internal power distribution (general services, and the production area) • Circuits under study
o Power outlets for various office equipment o Lighting circuit (fluorescent lamp fixtures) o Power feeder to the production area o Small motor inverter fed o Small motor direct o Medium motor via inverter o Medium motor direct
• Sector average electricity tariff: 0.148 EUR/kWh (Enerdata 2009, Industry B, 20-500 MWh) • Day and night time profile
o 60 h day time load/week o 25% night time load on power outlets (stand-by consumption of various devices, file, and
mail server) o 10% night time load on lighting (mainly emergency lighting) o 10% night time load on the production area (stand-by consumption of equipment, control
systems, inverters, et cetera)
RESULTS
SMALL LOGISTICS CENTER
Energy losses / year (kWh) Investment cost (€) TCO 10 yr (€)
Total lifetime carbon emissions 20 yr (kg
CO2)
Base case 6,899.70 2,145.83 12,357.44 54,946.40
S+1 4,756.60 2,800.83 9,840.66 38,214.50
S+2 3,362.80 3,624.07 8,600.94 27,462.90
Economical optimum 2,467.60 4,354.51 8,006.54 20,809.70
Ecological optimum 581.10 14,333.87 15,193.90 10,160.90

Publication No Cu0210
Issue Date: September 2014
Page 18
4. LARGE INDUSTRIAL PLANT MAIN CHARACTERISTICS
• High voltage supply from the public distribution network, privately operated power transformer • Three to four levels of internal power distribution • Circuits under study
o Power feeder to the production area distribution panels o Power outlets for various office equipment in the process area o Lighting circuit (fluorescent lamp fixtures) o Medium/large motor via inverter (e.g. pump system) o Electrical heat tracing circuit
• Sectorial average electricity tariff: 0.103 EUR/kWh (Enerdata 2009, Industry B, 20,000-70,000 MWh) • Day and night time profile
o 60 h day time load/week o 50% night time load on power outlets of various office equipment (stand-by consumption,
part of equipment running 24/7, et cetera) o 50% night time load on lighting (process areas remain fully lit, offices and other rooms are
dimmed) o 80 to 100% night time load on process related devices (most actions run 24/7)
RESULTS
LARGE INDUSTRIAL PLANT
Energy losses / year (kWh) Investment cost (€) TCO 10 yr (€)
Total lifetime carbon emissions 20 yr (kg
CO2)
Base case 250,491.20 72,939.22 330,945.17 2,000,363.30
S+1 193,183.80 89,774.15 288,753.50 1,553,939.30
S+2 153,298.50 108,707.52 266,604.99 1,246,563.00
Economical optimum 96,763.60 137,154.44 236,820.92 814,950.60
Ecological optimum 75,786.60 185,602.41 263,662.63 672,049.20