impact evaluation of gef support to protected areas · pdf fileimpact evaluation of gef...
TRANSCRIPT
Impact Evaluation of GEF Support to
PROTECTED AREAS
and
PROTECTED AREA SYSTEMS
HIGHLIGHTS


GLOBAL ENVIRONMENT FACILITY INDEPENDENT EVALUATION OFFICE
Impact Evaluation of GEF Support toProtected Areas and Protected Area Systems
HIGHLIGHTS

© 2015 Global Environment Facility Independent Evaluation Office1818 H Street, NWWashington, DC 20433Internet: www.gefeo.orgEmail: [email protected]
All rights reserved.
The findings, interpretations, and conclusions expressed herein are those of the authors and do not necessarily reflect the views of the GEF Council or the governments they represent.
The GEF Independent Evaluation Office does not guarantee the accuracy of the data included in this work. The boundaries, colors, denominations, and other information shown on any map in this work do not imply any judgment on the part of the GEF concerning the legal status of any territory or the endorsement or acceptance of such boundaries.
The material in this work is copyrighted. Copying and/or transmitting portions or all of this work without permission may be a violation of applicable law. The GEF encourages dissemination of its work and will normally grant permission promptly.
ISBN-10: 1-933992-86-7ISBN-13: 8-1-933992-86-0
Evaluation Report No. 103
The contents of this publication are derived from the findings, conclusions, and recommendations of the “Impact Evaluation of GEF Support to Protected Areas and Protected Area Systems,” presented at the 49th GEF Council Meeting in October 2015.
A FREE PUBLICATION
i
The Global Environment Facility (GEF)
has been the major source of financial
and technical support for countries
seeking to conserve their biodiversity and
use their biological resources in a sustain-
able manner. Since 1991, the GEF has, in
collaboration with its Implementing Agen-
cies—notably the United Nations Develop-
ment Programme (UNDP) and the World
Bank—provided $4.8 billion in grants
and mobilized an additional $17.9 billion
in cofinancing from public, multilateral,
and private sources to 1,167 projects sup-
porting countries in biodiversity conser-
vation initiatives.1 These investments have
largely supported interventions in nonma-
rine protected areas (PAs), PA systems,
and adjacent landscapes.
This evaluation assesses the impact of
GEF investments in nonmarine PAs and
PA systems. It defines impact, in accor-
dance with the Development Assistance
Committee of the Organisation for Eco-
nomic Co-operation and Development, as
the “positive and negative, primary and
secondary long-term effects produced
by a development intervention, directly
or indirectly, intended or unintended.”
The evaluation analyzes the extent to
which the management and governance
approaches supported by the GEF have
led to the achievement of GEF objectives
on biodiversity conservation and sustain-
able use. It probes into how future support
can best contribute to the conservation
and sustainable use of biodiversity by
assessing the factors and conditions that
affect the interaction between human live-
lihood objectives and biodiversity objec-
tives. It also looks at the extent to which
GEF support has promoted human well-
being as a key contribution to the effective
management of PAs and their immediately
adjacent landscapes.
When information was available, the
analysis included evidence comparing
supported areas with those lacking such
support or receiving other types of inter-
vention. The evaluation explored new
methods and approaches to assess the
impact of GEF support, several of which
have been incorporated into other GEF
Independent Evaluation Office evalua-
tions. It is so far the most comprehen-
sive global evaluation undertaken on the
impact of PAs on biodiversity, in terms
of the diversity of methods used and the
scope of inquiry.
While the evaluation covers all relevant
operations supported by the GEF through
all its Agencies, the independent evalu-
ation offices of the GEF and UNDP have
undertaken this evaluation jointly.
PREFACE
This is the MOST COMPREHENSIVE
global evaluation undertaken on the impact of PAs
on biodiversity in terms of the diversity of methods
used and the scope of inquiry.

ii
This is the fourth impact evaluation
addressing a specific focal area under-
taken by the GEF Independent Evaluation
Office. For the UNDP Independent Evalua-
tion Office, this constitutes the first impact
evaluation of UNDP programming, and
builds on the findings and conclusions of a
thematic evaluation focused on the nexus
of issues linking UNDP poverty and envi-
ronmental protection support to countries.
The approach paper was approved by the
directors of both offices in June 2013. Field
visits were conducted from April to early
June 2014, but the evaluation considered
secondary information collected until the
end of September 2015.
The independence of the two evaluation
offices precludes any general conflict of
interest. Both offices adhere to evaluation
policies and codes of conduct that deal
with conflict of interest issues. Other spe-
cific measures taken to prevent conflict of
interest include: (1) consultants responded
to the joint team managing the evaluation;
(2) a Technical Advisory Group was estab-
lished comprised of a representative of
the World Bank’s Independent Evaluation
Group and three biodiversity and social
science experts; and (3) UNDP evaluators
refrained from evaluating GEF projects in
which UNDP was not involved, and GEF
evaluators did not evaluate UNDP projects
outside of the GEF partnership.
iii
The evaluation was co-managed by
Aaron Zazueta, Chief Evaluation
Officer of the Global Environment
Facility (GEF) Independent Evaluation
Office (IEO), and Alan Fox, Evaluation
Advisor at the United Nations Develop-
ment Programme (UNDP) IEO. Core eval-
uation team members were Jeneen R.
Garcia, Anupam Anand, and Inela Weeks.
The evaluation Steering Committee was
composed of Rob van den Berg, then
Director of the GEF IEO; Indran Naidoo,
Director of the UNDP IEO; and Juha Uitto,
then Deputy Director of the UNDP IEO (and
now Director of the GEF IEO).
In addition to the analyses performed by
the core team, phases of specific analyses
were performed in collaboration with the
Global Land Cover Facility (GLCF) at the
University of Maryland, the U.S. National
Aeronautics and Space Administration
(NASA), the International Union for Con-
servation of Nature World Commission on
Protected Areas–Species Survival Com-
mission (IUCN WCPA-SSC) Joint Task
Force on Biodiversity and Protected Areas,
the Institute of Development Studies (IDS),
and the National Commission for Knowl-
edge and Use of Biodiversity of Mexico
(CONABIO).
The Technical Advisory Group included
Marie Gaarder, Manager, World Bank Inde-
pendent Evaluation Group; Kent Redford,
independent consultant; Marc Hockings,
Professor, University of Queensland; and
Dan Weiner, Professor, University of Con-
necticut. A Reference Group consisting of
members from the GEF Secretariat, GEF
Agencies, and the GEF Scientific and Tech-
nical Advisory Panel working in the bio-
diversity focal area was convened at key
stages of the evaluation to provide expert
opinion and information, as well as tech-
nical feedback and verification.
The following persons contributed to the
evaluation in roles such as carrying out
some of the analyses, case studies, and
research; and facilitating access to global
data sets: Megan Barnes, Barbara Befani,
Sumalika Biswas, Gill Bunting, Saurabh
Channan, Gloria Cheche, Ian Craigie, Min
Feng, Jonas Geldmann, Brian Jones, Malac
Kabir, Muhammad Najeeb Khan, Do-Hyung
Kim, Tim Lamrock, Jeff McNeely, Kath-
erine A. Melocik, Agrippinah Namara,
Susana Rojas, Joseph Owen Sexton, Dan
Slayback, Martin Sneary, Duc Tam, John R.
Townshend, Dania Trespalacios, Compton
J. Tucker, Rosa Maria Vidal, Benjamin
Vivas, John Waithaka, Molly Fahey Watts,
Stephen Woodley, Sarah Amy Wyatt, and
Peixuan Zhou. Nita Congress edited and
designed this publication.
The GEF IEO and the UNDP IEO are grateful
to these institutions and individuals for
their contributions to the evaluation, but
take full responsibility for its contents.
ACKNOWLEDGMENTS

Worldwide, the GEF supports 1,292 nonmarine protected areas,
with a combined area of 2,785,350 square kilometers.
KEY BIODIVERSITY AREA, highest scientific designation of global biodiversity significance
58%31%
11%Some level of LOCAL OR NATIONAL DESIGNATION
of high biodiversity value to respective country
INTERNATIONAL DESIGNATION of high biodiversity or cultural value (WWF priority area,
CI biodiversity hotspot, Important Bird Area, Ramsar site, Alliance for Zero Extinction site,
UNESCO World Heritage Site)

1
Over the past 24 years, the Global Envi-
ronment Facility (GEF) has provided
$3.4 billion in grants to 618 projects,
matched by $12.0 billion in cofinancing,
to help protect almost 2.8 million square
kilometers of the world’s nonmarine eco-
systems.2 This evaluation found that the
GEF has supported 1,292 nonmarine pro-
tected areas (PAs) in 137 countries and
has provided support at the PA system/
subsystem level in 57 countries.3 Of the
supported PAs, 58 percent are classified
as key biodiversity areas—the highest
scientific standard for designating global
biodiversity significance; the remainder
have other international designations for
ecological and cultural value (31 percent),
or designations of local or national impor-
tance (11 percent).
WHY FUND PAs?For over a century, PAs have formed a core
component of the global conservation
efforts. The past two decades have seen
an extraordinary increase in the number
of PAs worldwide. However, funding for
PA management is often lacking or is
inadequate to meet the needs—a major
challenge to effective management. A
global assessment of relative levels of
underfunding for conservation spending
suggests that 40 of the most severely
underfunded countries contain 32 percent
of all threatened mammalian diversity and
are located near some of the world’s most
biologically diverse areas (Waldron et al.
2013). And, while the cost of establishing
and maintaining a global PA system has
been estimated at $30 billion a year, cur-
rent expenditures amount to only $6.5 bil-
lion per year (CBD 2010). Moreover, PAs
remain woefully underresourced, and the
recent expansion in PAs globally risks wid-
ening current financial shortfalls.
Mainstreaming biodiversity and its
funding into development planning
through national policy and deci-
sion-making frameworks is crucial. But
just as important is to strengthen PAs
through strategic expansion, effective
management, and sustainable financing
Evaluand
618 projects in 137 countries
GEF FUNDING BY REPLENISHMENT PHASE
COFINANCING
GEF-5
GEF-4
GEF-3
GEF-2
GEF-1
Pilot phase
PROJECT SIZE
Medium
Large
GEF AGENCY
WorldBank
OtherAgencies
UNEP
UNDP
GEF FUNDING
$3.4 billion
$12 billion

2
to support biodiversity conservation. If
strengthened to a level where they can
adequately address the variety of chal-
lenges facing them, PAs can continue to
serve as pillars of conservation efforts in
the 21st century.
PURPOSE AND SCOPE OF THIS EVALUATIONThis evaluation assesses the impact of
GEF investments in nonmarine PAs and
PA systems. Nonmarine systems include
terrestrial, freshwater, and coastal eco-
systems; these were selected because
more information was available for them
for assessing changes in biodiversity over
the long term.
The evaluation sought to answer three
broad questions:
9 What have been the impacts and con-
tributions of GEF support (positive or
negative, intended or unintended) in
biodiversity conservation in PAs and
their immediately adjacent landscapes?
9 What have been the contributions of
GEF support to the broader adoption of
biodiversity management measures at
the country level through PAs and PA
systems, and what are the key factors
at play?
9 Which GEF-supported approaches
and contextual conditions, especially
those affecting human well-being, are
most significant in enabling and hin-
dering the achievement of biodiversity
management objectives in PAs and their
immediately adjacent landscapes?
THEORY OF CHANGEThe evaluation adopted a theory of change to trace the extent to which GEF
support contributes to conditions that lead
to improved biodiversity conservation by
restoring or stopping or reducing the loss of
biodiversity. This theory of change draws on
recent approaches to biodiversity conser-
vation; it assumes that good governance,
effective PA management, and com-munity engagement will together lead to
improvements in biodiversity conservation.
9 Governance. A robust PA gover-
nance system is in place that ensures
compliance across scales, and which
can influence drivers stemming from
larger scales, as well as the pressures
operating at the local level. Evaluating
governance includes an assessment of
the extent to which GEF support has
helped build effective PA systems, and
also considers the policies and institu-
tional arrangements that must be put in
place to address the large-scale drivers
affecting biodiversity outcomes in PAs
and their adjacent landscapes.
9 Management. Adequate and appro-
priate capacities for PA management
are in place and operational. Evalu-
ating management looks at the extent
to which GEF support has targeted PAs
in zones of high biodiversity value,
and has strengthened management
Good GOVERNANCE +
effective PA MANAGEMENT +
community ENGAGEMENT =
IMPROVED BIODIVERSITY

3
capacities that have ultimately resulted
in improved management effective-
ness.
9 Community engagement. Local com-
munities in or around PAs are engaged
in decision making and natural resource
management activities that meet con-
servation and livelihood goals. The
effects of GEF support in this category
are examined through the nature of
interactions taking place between local
communities and the PA.
TOOLS AND METHODSThe evaluation used a mix of quantitative,
qualitative, and spatial methods in data
collection and analyses. Evidence was
also collected from a mix of sources, com-
bining global data sets, field data, literature
reviews, and statistical models. Broader
conclusions were drawn only after com-
paring results from different types of evi-
dence and methods of analysis. Through
the use of mixed methods and triangulation
of findings, it was possible to identify direc-
tions and patterns regarding the extent of
the GEF’s contribution towards biodiversity
conservation, and its interaction with the
larger social-ecological system.
The evaluation had three major analytical
components: portfolio analysis, global
analysis, and case study analysis.
9 Portfolio analysis. A total of 618 proj-
ects in 137 countries were identified.
A database of 1,292 PAs supported
by the GEF was then created, which
served as the reference for analyses
in the other components. An analysis
was conducted to assess how the GEF’s
approach to biodiversity conservation
and sustainable use has evolved over
time through support to PAs and their
adjacent landscapes. Finally, terminal
evaluations of 191 projects involving
nonmarine PAs and PA systems were
analyzed for progress toward impact at
project completion.
9 Global analysis. Three indicators
were used to measure outcomes at a
global scale: forest cover, wildlife popu-
lations, and Management Effectiveness
Tracking Tool (METT) scores.
• Forest cover loss in GEF-supported
PAs was compared to (1) countrywide
aggregate loss which included both
protected and nonprotected forest
areas, (2) loss within their 10-kilo-
meter buffer area, and (3) loss in the
non-GEF PAs and their 10-km buffers
within the same country and biome.
Forest cover gain in GEF-supported
PAs was compared to that in non-GEF
supported PAs. Differences in forest
loss rates before, during and after
GEF support were also compared.
• The WWF’s Living Planet Index (2014)
data set was used to match GEF-sup-
ported PAs with wildlife monitoring
time-series data covering the period
from 1970 to 2010. Links between GEF
interventions and biodiversity out-
comes were made using information
collected from project documents.
A total of 88 cases of species pop-
ulation time-series from the Living
Planet Index were matched with the
objectives of 29 GEF projects imple-
mented in 39 PAs.
• The METT instrument monitors
progress toward more effective

4
METHODOLOGICAL CHALLENGESAssessing the impact of GEF interventions
on biodiversity presents evaluative chal-
lenges stemming from multiple causal
chains interacting across—often mis-
matched—geographic and administrative
scales. Also, time lags between project
implementation and responses in human
behavior and natural systems make attri-
bution of outcomes difficult. But the three
main challenges in assessing impact were
substantial information gaps on GEF sup-
port, limited global time-series data, and
difficulties in estimating the counterfactuals.
9 Information gaps. Information was
uneven on which PAs the GEF had
Evaluation tools and methods
PA management over time. It con-
sists of 32 indicators addressing
aspects of PA management. A total
of 2,440 METTs from 1,924 PAs in
104 countries were used to assess
management ef fectiveness in
GEF-supported PAs. To measure
change in METT scores over time,
275 PAs in 75 countries with at least
two METT assessments over time
were analyzed.
9 Case study analysis. Interviews and
field visits were carried out in seven
countries—Colombia, Indonesia,
Kenya, Mexico, Namibia, Uganda, and
Vietnam—across three regions, cov-
ering 17 GEF-supported PAs and 11
non-GEF PAs.
PORTFOLIO ANALYSISGLOBAL ANALYSIS
CASE STUDIES
Terminal evaluation review
Linear regression
Database filtering
Remote sensing and GIS analysis
Propensity score matching
Mixed effects modeling
Qualitative comparative analysis
Principal components analysis
General additive modelingQualitative data analysis
and synthesis
Remote sensing analysisLiterature review

5
supported, for how long and when
GEF support took place, and what type
and extent of support was provided.
In many cases, project documents did
not provide the names of the supported
PAs. Addressing this challenge entailed
creating usable databases out of differ-
ently formatted, incomplete, and some-
times inconsistent data from various
sources that needed to be standardized,
validated, and matched.
9 Time-series data. Many sites receiving
GEF support are not registered in the
World Database on Protected Areas.
Further, even though GEF support to
some PAs has been provided since
1991, forest loss and gain data are only
available for the period 2001–12. The set
of PAs analyzed therefore do not repre-
sent the global extent of GEF support,
but rather that fitting the constraints
imposed by global data sets.
9 Counterfactuals. A counterfactual—
or what would have happened without
GEF support—is difficult to estimate
given the complexity of GEF-sup-
ported interventions and the absence
of a predefined control. The difficulty
in estimating counterfactuals was
compounded by the lack of certainty
resulting from information gaps on
which PAs had received GEF support
and which had not. Furthermore, spill-
over effects from GEF intervention sites
into nonsupported areas were common,
as was the lack of clear-cut “successful”
and “unsuccessful” PAs. In reality, all
PAs often had both more and less suc-
cessful management outcomes.
The multidisciplinary mix of quantitative,
qualitative, and spatial methods used
by the evaluation in data collection and
analysis helped mitigate these challenges.
Various analyses were performed in col-
laboration with a wide range of national
and international research institutions. A
Technical Advisory Group was established
to perform peer reviews, comprised of
evaluation, biodiversity, and social science
Countries and sites visited for case studies
MEXICO
COLOMBIA NAMIBIA KENYAUGANDA
INDONESIA
VIETNAM
GEF PANon-GEF PA

6
BIODIVERSITY OUTCOMES
Less forest cover loss in GEF PAs
0.9%
3.4% loss in buffer zone
GEF PA
2.3%
NON-GEF PA
4.5% loss in buffer zone
Data are for 2001–12, and within the same country and biome type.
Majority of projects have positive environmental outcomes at completion
23%32%
45% 68%positive environmentaloutcomes
12%Reduction in environmental threats
Improvement in environmental conditions
No reported positive environmental outcomes
Based on terminal evaluation reviews of 191 projects.
Projects at risk due to
external pressures
and drivers
Stronger links between project objectives and species conservation = better population trends
Positive
Neutral
SPECIES OUTCOME
Negative
Link with project objectives: ▲ Strong ▲ Medium ▲ Weak. n = 88.
In MEXICO,
23% less forest loss in GEF PAs versus non-GEF PAs
up to 28% avoided forest loss in tropical and subtropical coniferous forest biome

7
MANAGEMENT AND GOVERNANCE OUTCOMES
Sustainable financing mechanisms
at PA system level continue to fund individual PAs
Increased compliance with regulations
PROTECTED AREAS
Stronger management capacities 9 Expanded staff skills 9 Upgraded PA infrastructure 9 Functional monitoring and reporting system 9 Stable PA funding 9 Increase in area under management
Positive community engagement 9 Joint law enforcement 9 Ecosystem rehabilitation 9 Human-wildlife conflict prevention 9 Fire control
In large part due to socioeconomic benefits
Improved law enforcement and compliance
BROADER ADOPTION
Piloted innovative management
approaches adopted systemwide
PROTECTED AREA SYSTEMS
Policy development 9 Science-based 9 Broad stakeholder consultation 9 Benefits of PAs to communities institutionalized
Financial and human resource systems
9 Transparency 9 Sustainability
New management approaches 9 Increased connectivity between PAs 9 Ecosystem representativeness
8
experts. A Reference Group made up of
GEF stakeholders working in the biodiver-
sity focal area was convened at key stages
to provide expert input along with tech-
nical feedback and verification.
CONCLUSIONS1. Loss of global biodiversity continues
at an alarming rate, driven largely by
habitat loss due to multiple develop-
ment pressures. Since the pilot phase,
GEF strategies have increasingly tar-geted these development pres-sures beyond the PAs.
2. GEF support is contributing to biodi-
versity conservation by helping lower habitat loss in PAs as indicated by
less forest cover loss in GEF-supported
PAs compared to PAs not supported by
the GEF. GEF-supported PAs also gen-
erally show positive trends in species
populations, and reduced pressures to
biodiversity at the site level.
3. GEF support has helped build capacities that address key factors
affecting biodiversity conservation in
PAs, mainly in the areas of PA manage-
ment, support from local populations,
and sustainable financing. Sustainable
financing of PAs remains a concern.
4. GEF support is contributing to large-scale change in biodiversity gover-nance in countries by investing in PA
systems, including legal frameworks
that increase community engagement.
Through interventions at the PA level,
GEF support is also helping catalyze
gradual changes in governance and
management approaches that help
reduce biodiversity degradation.
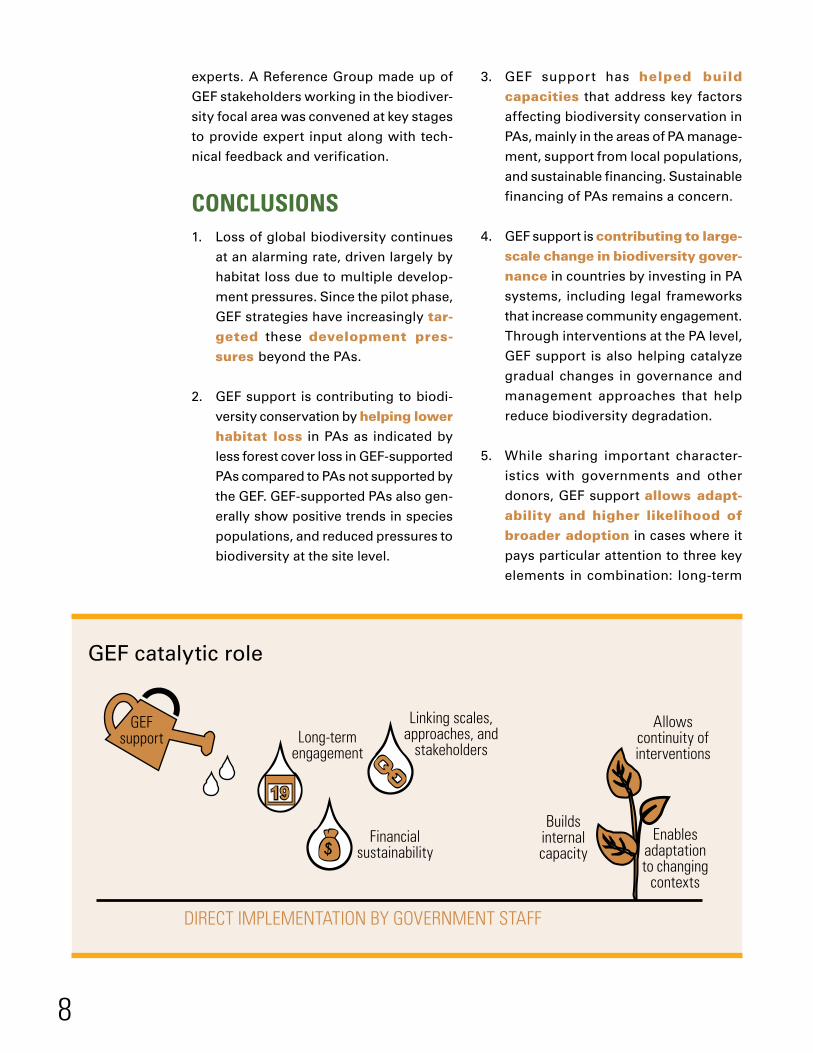
5. While sharing important character-
istics with governments and other
donors, GEF support allows adapt-ability and higher likelihood of broader adoption in cases where it
pays particular attention to three key
elements in combination: long-term
GEF catalytic role
DIRECT IMPLEMENTATION BY GOVERNMENT STAFF
Long-term engagement
Financial sustainability
Linking scales, approaches, and
stakeholders Enables
adaptation to changing
contexts
Builds internal capacity
Allows continuity of interventions
GEF support

9
engagement; financial sustainability;
and creation of links across multiple
approaches, stakeholders, and scales.
RECOMMENDATIONS1. Ensure best targeting of GEF sup-
port by using geospatial tech-nology combined with the latest scientific criteria for site selection. The GEF must continue to pursue best
methods to ensure that its support is
targeted toward globally significant
sites with high biodiversity values, and
that support extends to more of these
sites. As it has consistently demon-
strated, the GEF must also continue to
adopt the most rigorous scientific cri-
teria in selecting areas for investment,
integrating new and more appropriate
criteria such as climate change vulner-
ability as they are developed.
2. Mitigate unequal distribution of costs and benefits to local com-munities. At the project level, during
design and implementation, the GEF
needs mechanisms to ensure that
future projects reach full compli-
ance with its social safeguards. The
GEF needs to expand benefit sharing
across a wider cross-section of
affected local populations and better
mitigate the unequal distribution of
costs and benefits of PA management
interventions, such as those arising
from geographical and socioeconomic
differences among and within commu-
nities adjacent to PAs. The aim should
be to reduce local pressures on biodi-
versity stemming from adverse local
socioeconomic conditions.
3. Coordinate with mandates beyond environmental sectors to address large-scale drivers. The GEF should
invest more in interventions that
enable dialogue and joint decision
making not only among multiple stake-
holders in and around PAs, but also
stakeholders representing different
sectors and operating at different
scales, which tend to have conflicting
development priorities and manage-
ment objectives with regard to biodi-
versity conservation. At a minimum,
these would be stakeholders involved
in environmental protection, natural
resource use, economic development,
and infrastructure development; this
would be especially important for
those involved in mining, agriculture,
energy, tourism, and security, among
others.
4. Streamline project reporting requirements. The GEF should
ensure that basic information on its
support to PAs (where, what, and
when) is available historically and into
the future. At the same time, it needs
to reduce the reporting burden on
projects, countries, and Agencies by
adopting a mixed methods approach
to results monitoring that draws on
geospatial technology, global data-
bases, and locally gathered informa-
tion. Among the specific actions that
could be taken in the short term are
the following:
• Ensure that basic data on project
sites and activities are included in
project documents upon submission.
• Institutionalize use of geospatial
technologies for project and portfolio
monitoring when applicable.

10
• Measure indicators that are mean-
ingful for global analyses and useful
for local management capacities and
needs.
• Establish long-term partnerships
with country institutions that already
have biodiversity and socioeconomic
monitoring as their mandate.
• Establish partnerships with research
institutes or agencies that already
collect and analyze global data rele-
vant to biodiversity.
5. Create a program for learning what works for whom, and under what conditions. The GEF partners
should jointly develop and imple-
ment a program that will generate
an evidence base drawn from mixed
methods on what works, for whom,
and under what conditions. In partic-
ular, the GEF should generate better
knowledge on three critical areas that
will enhance its support:
• Ensuring more comprehensive and
equitable response to local livelihood
needs that contribute to or at least do
not undermine biodiversity conser-
vation and sustainable use
• Catalyzing changes needed for large-
scale biodiversity conservation and
sustainable use
• Delivering support for biodiversity
conservation and sustainable use in
ways that produce multiple environ-
mental and socioeconomic benefits
NOTES1. These data are as of May 28, 2013. All
dollar values reported throughout are
U.S. dollars.
2. Dollar values have been adjusted for
inflation at 2015 rates.
3. The PAs were identified from Man-
agement Effectiveness Tracking Tool
(METT) assessments submitted as of
January 2013, and from project doc-
uments that were either endorsed or
approved by the GEF Chief Executive
Officer (CEO) as of April 2015. They do
not include PAs supported by the GEF
but not registered in the World Database
on Protected Areas, or not explicitly
identified in project documents or METT
assessments. Number of PA systems/
subsystems supported is based on proj-
ects CEO-endorsed in 2008 and earlier.
REFERENCESCBD (Convention on Biological Diver-sity). 2010. “LifeWeb: Partnerships for Financing Protected Areas.” UNEP/CBD/RW-BF/1/11. https://www.cbd.int/doc/meetings/fin/rwbf-01/official/rwbf-01-11-en.pdf.
Organisation for Economic Co-operation and Development Development Assis-tance Committee. 2002. “Glossary of Key Terms in Evaluation and Results Based Management.” http://www.oecd.org/dac/evaluation/2754804.pdf.
Waldron, Anthony, Arne O. Mooers, Daniel C. Miller, Nate Nibbelink, David Redding, Tyler S. Kuhn, J. Timmons Rob-erts, and John L. Gittleman. 2013. “Tar-geting Global Conservation Funding to Limit Immediate Biodiversity Declines.” Proceedings of the National Academy of Sciences 110 (29): 12144–48. doi:10.1073/pnas.1221370110.


Independent Evaluation Office Global Environment Facility1818 H Street, NW Washington, DC 20433, USAwww.gefeo.org
/gefieo_tweets
/gefieo