impact education mcrb symposium education mcrb symposium.pdf · pathophysiologic progression of...
TRANSCRIPT

Educational Objectives
• Recognize the rationale for cardiovascular outcome trials (CVOTs) in T2DM and review data from recent CVOTs of anti‐hyperglycemic agents
• Examine alignment of managed care T2DM treatment algorithms with recent CVOT data
• Implement patient‐centered strategies to minimize cardiovascular risk in patients treated in a managed care setting
• Discuss the potential impact of CVOT results on benefit design strategies


Type 2 Diabetes and Cardiovascular Outcomes Trials (CVOTs)
Jennifer Green, MDAssociate Professor of MedicineDuke University Medical Center
Chief, Endocrine SectionDurham VA Medical Center
Learning Objective
• Recognize the rationale for cardiovascular outcomes trials (CVOT) in T2D and review data from recent CVOT of anti‐hyperglycemic agents
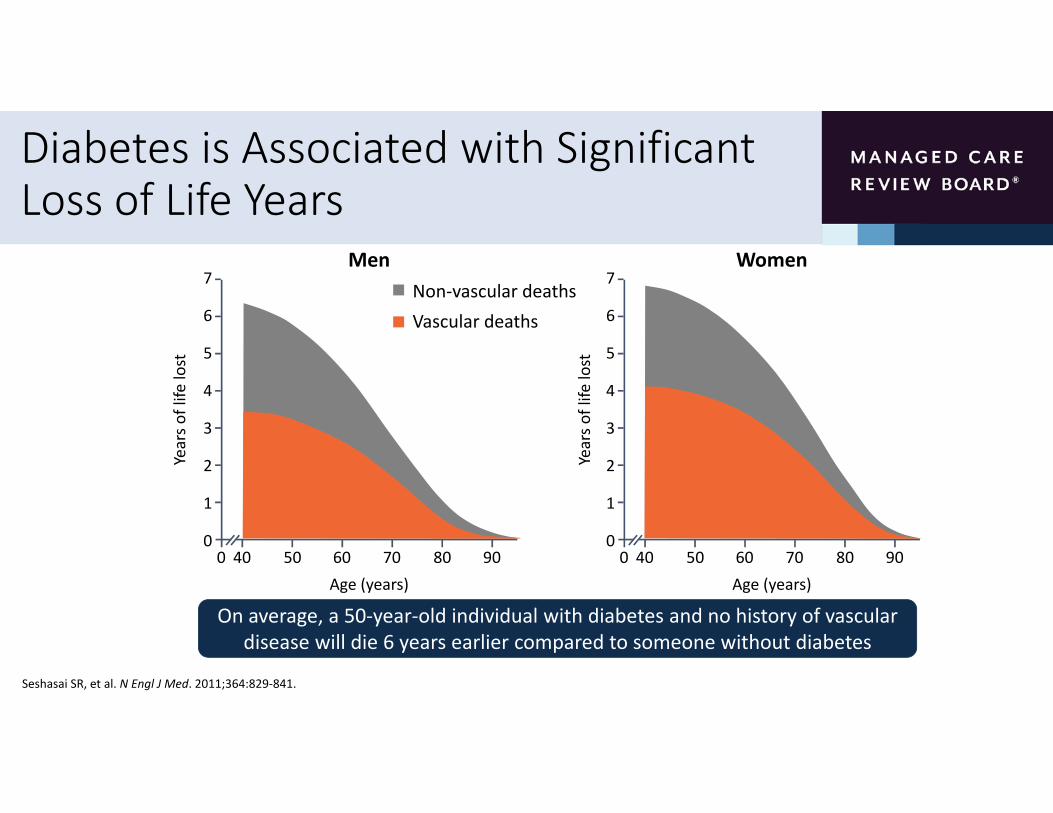
Diabetes is Associated with Significant Loss of Life Years
0
7
6
5
4
3
2
1
040 50 60 70 80 90
Age (years)
Years o
f life
lost
Men7
6
5
4
3
2
1
040 50 60 70 80 900
Age (years)
WomenNon‐vascular deathsVascular deaths
Years o
f life
lost
Seshasai SR, et al. N Engl J Med. 2011;364:829‐841.
On average, a 50‐year‐old individual with diabetes and no history of vascular disease will die 6 years earlier compared to someone without diabetes
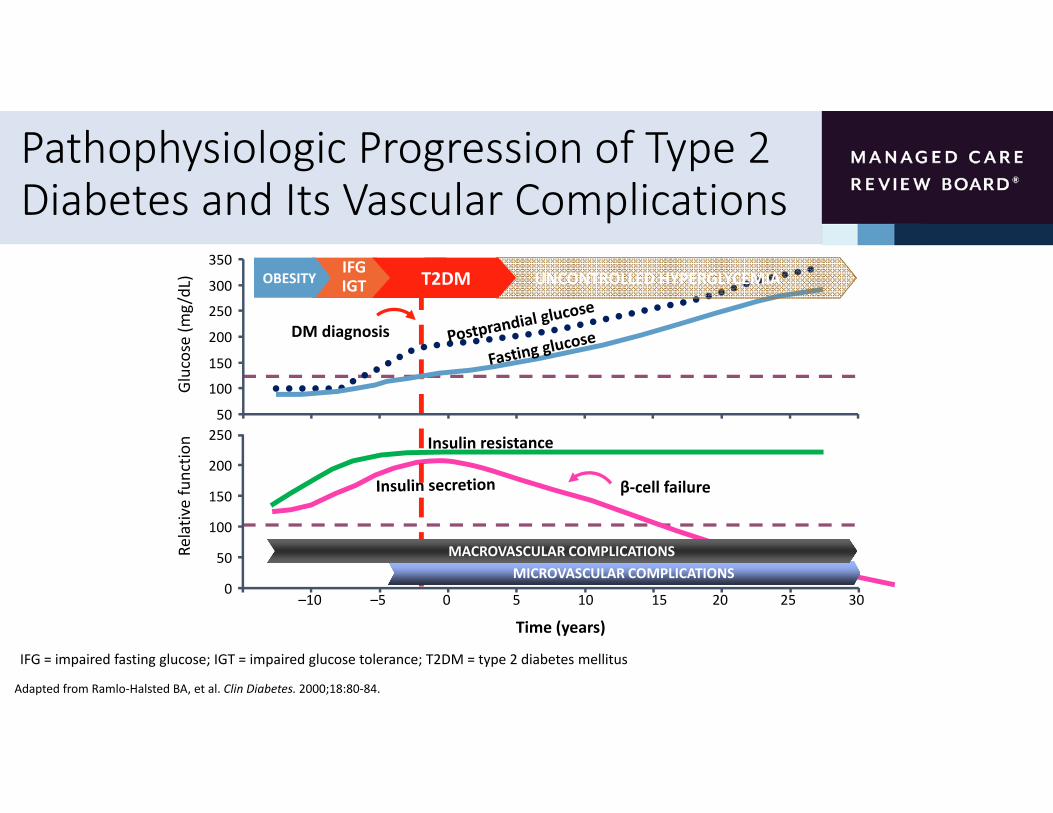
Pathophysiologic Progression of Type 2 Diabetes and Its Vascular Complications
Adapted from Ramlo‐Halsted BA, et al. Clin Diabetes. 2000;18:80‐84.
Relative functio
n
Time (years)
β‐cell failure
0
50
100
150
200
250
–10 –5 0 5 10 15 20 25 30
IFGIGTOBESITY
Glucose (m
g/dL)
DM diagnosis
50
100
150
200
250
300
350
MICROVASCULAR COMPLICATIONSMACROVASCULAR COMPLICATIONS
UNCONTROLLED HYPERGLYCEMIAT2DM
IFG = impaired fasting glucose; IGT = impaired glucose tolerance; T2DM = type 2 diabetes mellitus

Cardiovascular Outcomes: Recent Trials

FDA Guidelines for CV Safety Trials for Antihyperglycemic Medications (2008)
• As part of the approval process for antidiabetic medications…
“…a postmarketing trial generally will be necessary to definitively show that the upper bound of the two‐sided 95 percent confidence interval for the estimated risk ratio is less than 1.3.
This can be achieved by conducting a single trial that is adequately powered or by combining the results from a premarketing safety trial with a similarly designed postmarketing safety trial. This clinical trial will be a required postmarketing safety trial.

FDA Guidance on Conduct of CVOTs
• Patient selection
• Focus on high‐risk populations including those with advanced disease, elderly and those with renal impairment
• Duration
• At least 2 years of CV safety data
• Endpoints
• A prospective independent adjudication of CV events in phase 2 and 3 studies must also be performed including CV mortality, myocardial infarction (MI) and stroke, and possibly hospitalization for ACS, and urgent revascularization
US Food and Drug Administration. Guidance for industry. 2008. https://www.fda.gov/downloads/Drugs/.../Guidances/ucm071627.pdf. Accessed March 2017.

Possible Statistical Scenarios for Drug Approval Based on CVOT Results
• Possible scenarios for approval of new glucose lowering drugs depending on the hazard ratio (HR) for CV risk
• An upper bound of the two‐sided 95% confidence interval (CI) for the estimated increased risk above the non‐inferiority (NI) boundary of 1.3 as well as underpowered studies prevents FDA approval
Schnell O, et al. Cardiovasc Diabetol. 2016; 15:139.US Food and Drug Administration. Guidance for industry. 2008. https://www.fda.gov/downloads/Drugs/.../Guidances/ucm071627.pdf. Accessed March 2017.
S=superiority; NI=non‐inferiority; I=inferiority; UP=underpowered; HR=hazard ratio

Large CVOTs Are Underway or Recently Completed Since 2008
Drug Class Trial Drug Primary Endpoint NDPP‐4 inhibitors TECOS
SAVOR‐TIMI 53EXAMINECAROLINACARMELINA
SitagliptinSaxagliptinAlogliptinLinagliptinLinagliptin
MACE + UAMACEMACE
MACE + UACV risk
14,67116,4925,3806,0008,300
GLP‐1 RA LEADERSUSTAIN‐6ELIXAEXSCELITCA 650REWINDHARMONY
LiraglutideSemaglutideLixisenatideExenatideExenatideDulaglutideAlbiglutide
MACEMACEMACEMACEMACEMACEMACE
9,3403,2976,06814,0004,0009,6229,400
SGLT2 inhibitors EMPA‐REG CANVAS
DECLARE‐TIMI 58VERTIS CV
EmpagliflozinCanagliflozinDapagliflozinErtugliflozin
MACEMACEMACEMACE
7,0204,40717,1508,000
Insulin DEVOTE Degludec MACE 7,500
12Smith RJ, et al. Diabetes Care. 2016; 39:738‐742; Jayawardene D, et al. Heart Lung Circ. 2014;23:997‐1008.
MACE = major adverse cardiac events (cardiovascular death, nonfatal myocardial infarction, and nonfatal stroke UA= hospitalization for unstable angina
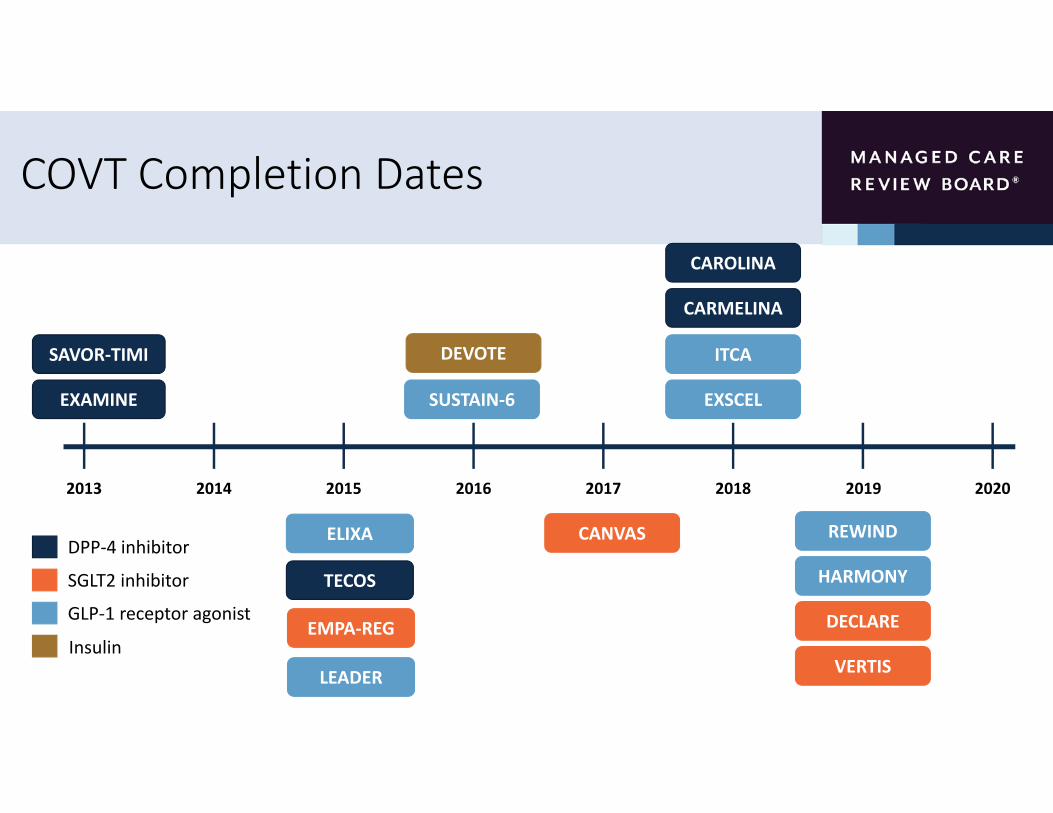
COVT Completion Dates
2013 20202014 2015 2016 2017 2018 2019
SAVOR‐TIMI
EXAMINE
TECOS
LEADER
ELIXA
EMPA‐REG
CARMELINA
CAROLINA
CANVAS REWIND
DECLARE
SUSTAIN‐6 EXSCEL
ITCA
HARMONY
DEVOTE
DPP‐4 inhibitor
SGLT2 inhibitor
GLP‐1 receptor agonist
InsulinVERTIS
Results

Interpretation, Comparison and Application of the Results: Caveats and Limitations
• Results may only be valid for the particular patient groups enrolled in the studies• Thus far, focus has been on high CV risk patients with T2DM
• It is unclear how translatable the results are to the general patient population
• Comparison among results is difficult and is limited by significant variation in
• Study design
• Patient selection criteria including patient age, disease duration, baseline blood glucose levels
• Definition of cardiovascular risk and manifestations of CV disease at baseline
• Baseline and achieved A1C levels
• Study endpoints
• Statistical analysis
Schnell O, et al. Cardiovasc Diabetol. 2016; 15:139.

CVOTs:DPP‐4 Inhibitors
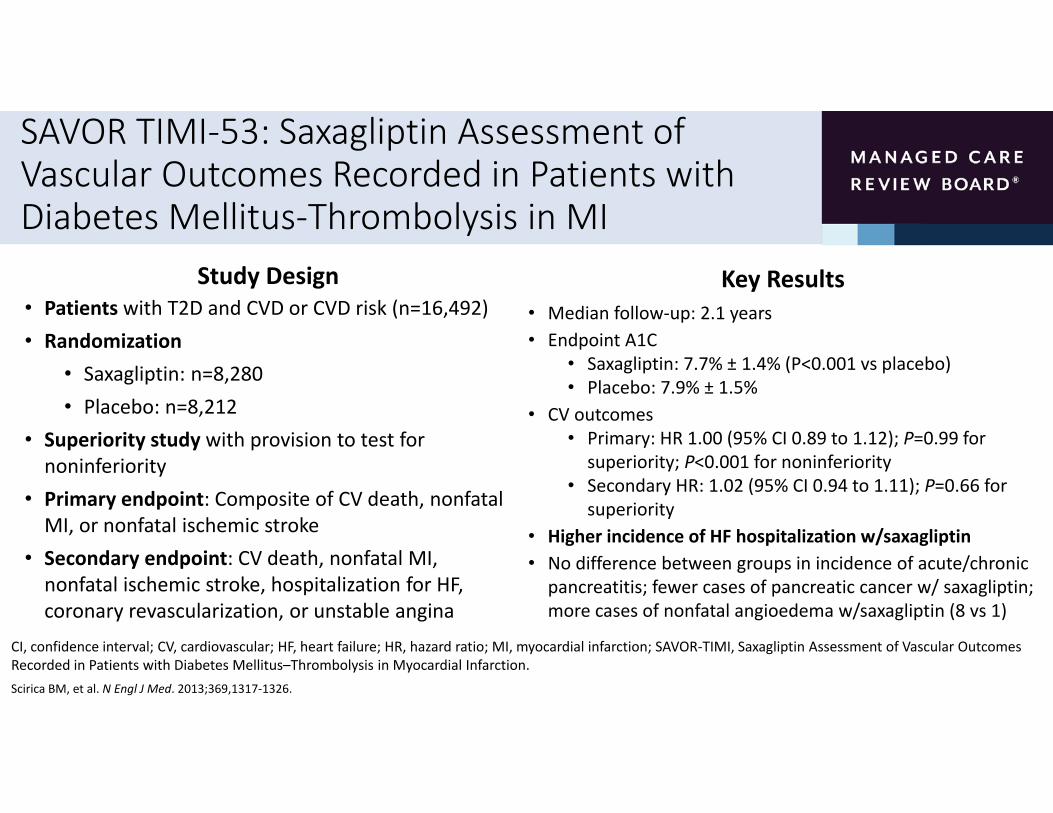
SAVOR TIMI‐53: Saxagliptin Assessment of Vascular Outcomes Recorded in Patients with Diabetes Mellitus‐Thrombolysis in MI
Study Design• Patients with T2D and CVD or CVD risk (n=16,492)• Randomization
• Saxagliptin: n=8,280• Placebo: n=8,212
• Superiority study with provision to test for noninferiority
• Primary endpoint: Composite of CV death, nonfatal MI, or nonfatal ischemic stroke
• Secondary endpoint: CV death, nonfatal MI, nonfatal ischemic stroke, hospitalization for HF, coronary revascularization, or unstable angina
Key Results• Median follow‐up: 2.1 years• Endpoint A1C
• Saxagliptin: 7.7% ± 1.4% (P<0.001 vs placebo)• Placebo: 7.9% ± 1.5%
• CV outcomes• Primary: HR 1.00 (95% CI 0.89 to 1.12); P=0.99 for superiority; P<0.001 for noninferiority
• Secondary HR: 1.02 (95% CI 0.94 to 1.11); P=0.66 for superiority
• Higher incidence of HF hospitalization w/saxagliptin• No difference between groups in incidence of acute/chronic pancreatitis; fewer cases of pancreatic cancer w/ saxagliptin; more cases of nonfatal angioedema w/saxagliptin (8 vs 1)
CI, confidence interval; CV, cardiovascular; HF, heart failure; HR, hazard ratio; MI, myocardial infarction; SAVOR‐TIMI, Saxagliptin Assessment of Vascular Outcomes Recorded in Patients with Diabetes Mellitus–Thrombolysis in Myocardial Infarction.Scirica BM, et al. N Engl J Med. 2013;369,1317‐1326.

SAVOR TIMI‐53: Clinical Outcomes
Hazard ratio (95% CI) P value
Primary composite endpoint* 1.00 (0.89‐1.12) 0.99
Secondary composite endpoint† 1.02 (0.94‐1.11) 0.66
Death from any cause 1.11 (0.96‐1.27) 0.15
CV death 1.03 (0.87‐1.22) 0.72
Favors saxagliptin
0.50 1.00 1.50
*CV death, nonfatal MI, or nonfatal ischemic stroke; †CV death, nonfatal MI, nonfatal ischemic stroke, hospitalization for HF, coronary revascularization, or unstable angina.
CI, confidence interval; CV, cardiovascular; HF, heart failure; MI, myocardial infarction; SAVOR‐TIMI, Saxagliptin Assessment of Vascular Outcomes Recorded in Patients with Diabetes Mellitus–Thrombolysis in Myocardial Infarction.Scirica BM, et al. N Engl J Med. 2013;369,1317‐1326.

SAVOR TIMI‐53: Individual Secondary Outcomes
*Doubling of creatinine, initiation of dialysis, renal transplantation, or creatinine >6.0 mg/dL
CI, confidence interval; CV, cardiovascular; SAVOR‐TIMI, Saxagliptin Assessment of Vascular Outcomes Recorded in Patients with Diabetes Mellitus–Thrombolysis in Myocardial Infarction.Scirica BM, et al. N Engl J Med. 2013;369,1317‐1326.
Favors saxagliptin
Hazard ratio (95% CI) P value
Myocardial infarction 0.95 (0.80‐1.12) 0.52
Ischemic stroke 1.11 (0.88‐1.39) 0.38
Hospitalization for unstable angina 1.19 (0.89‐1.60) 0.24
Hospitalization for heart failure 1.27 (1.07‐1.51) 0.007
Hospitalization for coronary revascularization 0.91 (0.80‐1.04) 0.18
Renal endpoint* 1.08 (0.88‐1.32) 0.46
Hospitalization for hypoglycemia 1.22 (0.82‐1.83) 0.33
0.00 1.00 2.00

SAVOR TIMI‐53: Characteristics and Risk of HF Hospitalization
Hazard ratio (95% CI) P value
eGFR ≤60 mL/min 1.36 (1.07‐1.71) 0.01
eGFR >60 mL/min 1.16 (0.89‐1.51) 0.27
No prior heart failure 1.30 (1.03‐1.65) 0.03
Prior heart failure 1.23 (0.94‐1.59) 0.13
No risk factors* 1.15 (0.81‐1.63) 0.45
1 risk factor 1.35 (1.06‐1.72) 0.02
2 risk factors 1.22 (0.86‐1.73) 0.27
Highest quartile NT‐proBNP (333‐46,627 pg/mL) 1.31 (1.04‐1.66) 0.02
0.00 1.00 2.00 3.00
*eGFR ≤60 mL/min or history of previous HF.
HF, heart failure; NT‐proBNP, N‐terminal pro B‐type natriuretic peptide; Q, quartile; SAVOR‐TIMI, Saxagliptin Assessment of Vascular Outcomes Recorded in Patients with Diabetes Mellitus–Thrombolysis in Myocardial Infarction.Scirica BM, et al. Circulation. 2014;130:1579‐1588.
Favors saxagliptin

SAVOR TIMI‐53: Risk of Hospitalization for Heart Failure
eGFR (mL/min) HF history No. HF risk factors† NT‐proBNP quartiles(pg/mL)
No. excess HHF events in patients
treated with saxagliptin vs
placeboper 1000 pt‐y
(5‐64) (65‐141) (142‐333) (334‐46,627)
n = 11,637 4,855 14,387 2,105 10,418 5,188 866 3,076 3,076 3,076 3,073
2 8 3 8 1 7 8 0 4 1 10
0.3%
1.5%
0.6%
1.5%
0.3%
1.4%1.7%
0.0%
0.7%
0.2%
2.1%
0
0.5
1
1.5
2
2.5
>60 ≤60 No Yes 0 1 2 Q1 Q2 Q3 Q4
Absolute risk
diffe
rence (%
)*
*Saxagliptin vs placebo.†eGFR ≤60 mL/min or history of previous HF.HF, heart failure; HHF, hospitalizations for heart failure.Scirica BM, et al. Circulation. 2014;130:1579‐1588.

EXAMINE: Examination of Cardiovascular Outcomes with Alogliptin versus Standard of Care
White W, et al. N Engl J Med. 2013;369:1327‐1335.
Study Design• Patients with T2D and ACS (n=5,380)• Randomization
• Alogliptin: n=2,701• Placebo: n=2,679
• Noninferiority study: prespecified HR margin = 1.3 for primary endpoint
• Primary endpoint: Composite of CV death, nonfatal MI, or nonfatal stroke
• Secondary endpoint: CV death, nonfatal MI, nonfatal stroke, urgent revascularization for unstable angina
Key Results• Median follow‐up: 18 months• Least squares mean difference in A1C: ‐0.36% (95% CI ‐0.43 to ‐0.28; P<0.001) for alogliptin vs placebo
• CV outcomes• Primary: HR 0.96 (upper boundary of the one‐sided repeated CI, ≤1.16); P=0.32 for superiority; P<0.001 for noninferiority
• Secondary: HR 0.95 (upper boundary of the one‐sided repeated CI, ≤1.14*); P=0.26 for superiority
• No difference between alogliptin and placebo in incidence of acute and chronic pancreatitis, cancer, renal impairment, angioedema, or severe hypoglycemia
• NS increased risk HHF*Upper boundary of 1‐sided repeated CI, alpha level 0.01. CI, confidence interval; CV, cardiovascular
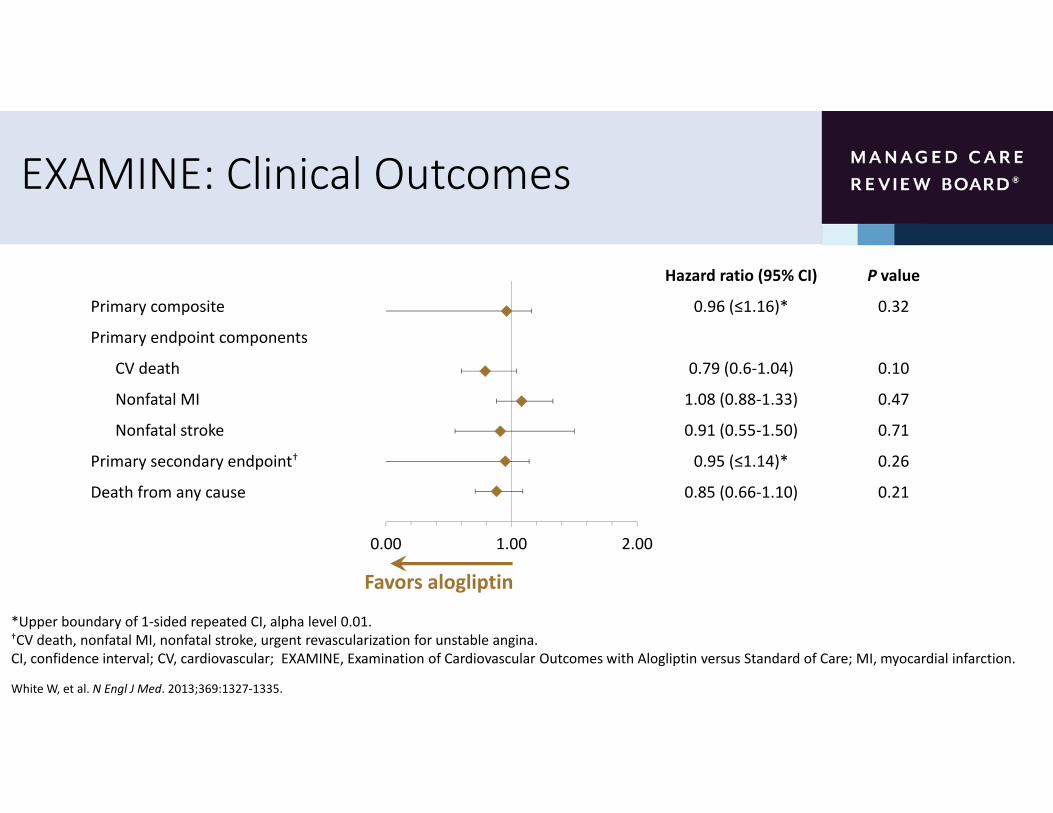
EXAMINE: Clinical Outcomes
Hazard ratio (95% CI) P value
Primary composite 0.96 (≤1.16)* 0.32
Primary endpoint components
CV death 0.79 (0.6‐1.04) 0.10
Nonfatal MI 1.08 (0.88‐1.33) 0.47
Nonfatal stroke 0.91 (0.55‐1.50) 0.71
Primary secondary endpoint† 0.95 (≤1.14)* 0.26
Death from any cause 0.85 (0.66‐1.10) 0.21
0.00 1.00 2.00
Favors alogliptin
*Upper boundary of 1‐sided repeated CI, alpha level 0.01.†CV death, nonfatal MI, nonfatal stroke, urgent revascularization for unstable angina.CI, confidence interval; CV, cardiovascular; EXAMINE, Examination of Cardiovascular Outcomes with Alogliptin versus Standard of Care; MI, myocardial infarction.
White W, et al. N Engl J Med. 2013;369:1327‐1335.

TECOS: Trial Evaluating Cardiovascular Outcomes with Sitagliptin
Green JB, et al. N Engl J Med. 2015;373:232‐242.
Study Design• Patients with T2D and CVD (n=14,671)• Randomization
• Sitagliptin: n=7,332 • Placebo: n=7,339
• Noninferiority study: 1.3 marginal upper boundary of 2‐sided 95% CI. Testing for superiority also performed
• Primary endpoint: Composite of CV death, nonfatal MI, nonfatal stroke, or hospitalization for unstable angina
• Secondary endpoint: Composite of CV death, nonfatal MI, or nonfatal stroke
Key Results• Median follow‐up: 3.0 years
• Least squares mean difference in A1C: ‐0.29% (95% CI ‐0.32 to ‐0.27) for sitagliptin vs placebo
• Noninferior to placebo for cardiovascular outcomes
• Primary: HR 0.98 (95% CI 0.88 to 1.09); P<0.001 for noninferiority
• Secondary: HR 0.99 (95% CI 0.89 to 1.11); P<0.001 for noninferiority
• Superiority not demonstrated
• No difference between sitagliptin and placebo in incidence of infections, cancer, renal failure, hypoglycemia, or noncardiovascular death
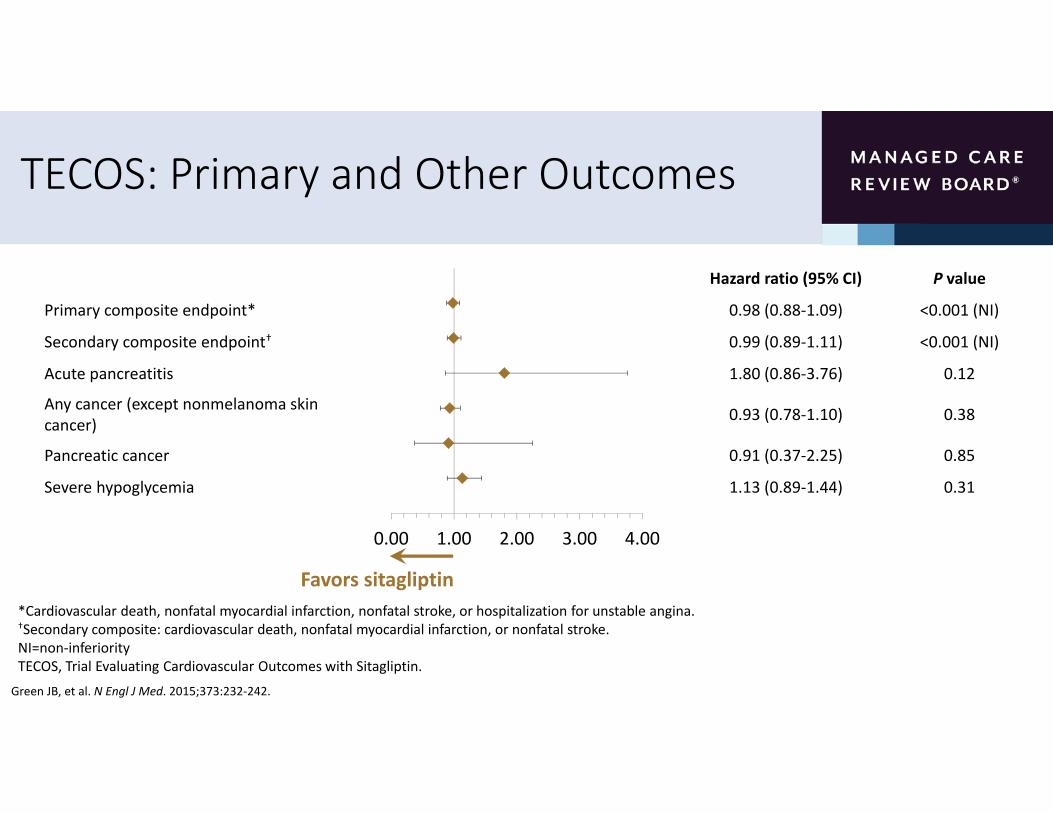
TECOS: Primary and Other Outcomes
Green JB, et al. N Engl J Med. 2015;373:232‐242.
Hazard ratio (95% CI) P value
Primary composite endpoint* 0.98 (0.88‐1.09) <0.001 (NI)
Secondary composite endpoint† 0.99 (0.89‐1.11) <0.001 (NI)
Acute pancreatitis 1.80 (0.86‐3.76) 0.12
Any cancer (except nonmelanoma skin cancer) 0.93 (0.78‐1.10) 0.38
Pancreatic cancer 0.91 (0.37‐2.25) 0.85
Severe hypoglycemia 1.13 (0.89‐1.44) 0.31
Favors sitagliptin
0.00 1.00 2.00 3.00 4.00
*Cardiovascular death, nonfatal myocardial infarction, nonfatal stroke, or hospitalization for unstable angina.†Secondary composite: cardiovascular death, nonfatal myocardial infarction, or nonfatal stroke.NI=non‐inferiorityTECOS, Trial Evaluating Cardiovascular Outcomes with Sitagliptin.

TECOS: Individual Secondary Outcomes
Green JB, et al. N Engl J Med. 2015;373:232‐242.
TECOS, Trial Evaluating Cardiovascular Outcomes with Sitagliptin.
Hazard ratio (95% CI) P value
CV death 1.03 (0.89‐1.19) 0.71
Hospitalization for unstable angina 0.90 (0.70‐1.16) 0.42
Fatal or nonfatal MI 0.95 (0.81‐1.11) 0.49
Fatal or nonfatal stroke 0.97 (0.79‐1.19) 0.76
Death from any cause 1.01 (0.90‐1.14) 0.88
Hospitalization for heart failure 1.00 (0.83‐1.20) 0.98
Hospitalization for heart failure or CV death 1.02 (0.90‐1.15) 0.74
0.50 1.00 1.50
Favors sitagliptin

CVOTs:SGLT2 Inhibitors
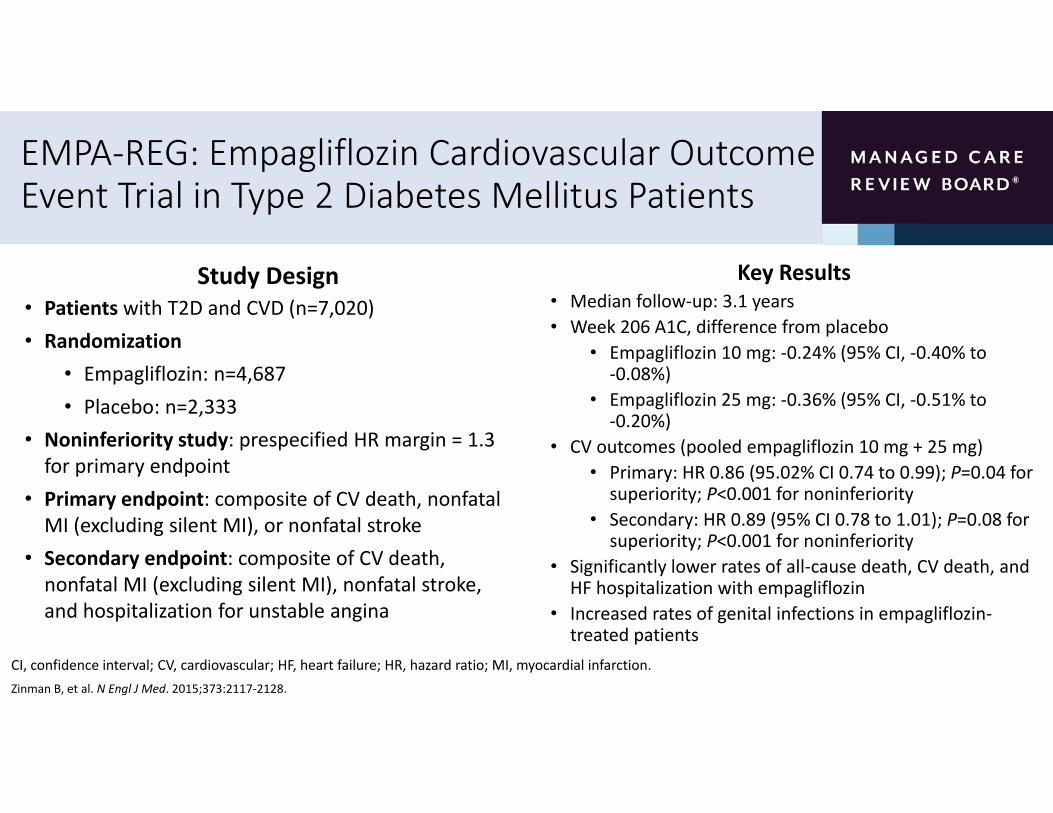
EMPA‐REG: Empagliflozin Cardiovascular Outcome Event Trial in Type 2 Diabetes Mellitus Patients
Study Design• Patients with T2D and CVD (n=7,020)• Randomization
• Empagliflozin: n=4,687• Placebo: n=2,333
• Noninferiority study: prespecified HR margin = 1.3 for primary endpoint
• Primary endpoint: composite of CV death, nonfatal MI (excluding silent MI), or nonfatal stroke
• Secondary endpoint: composite of CV death, nonfatal MI (excluding silent MI), nonfatal stroke, and hospitalization for unstable angina
Key Results• Median follow‐up: 3.1 years• Week 206 A1C, difference from placebo
• Empagliflozin 10 mg: ‐0.24% (95% CI, ‐0.40% to ‐0.08%)
• Empagliflozin 25 mg: ‐0.36% (95% CI, ‐0.51% to ‐0.20%)
• CV outcomes (pooled empagliflozin 10 mg + 25 mg)• Primary: HR 0.86 (95.02% CI 0.74 to 0.99); P=0.04 for superiority; P<0.001 for noninferiority
• Secondary: HR 0.89 (95% CI 0.78 to 1.01); P=0.08 for superiority; P<0.001 for noninferiority
• Significantly lower rates of all‐cause death, CV death, and HF hospitalization with empagliflozin
• Increased rates of genital infections in empagliflozin‐treated patients
CI, confidence interval; CV, cardiovascular; HF, heart failure; HR, hazard ratio; MI, myocardial infarction.Zinman B, et al. N Engl J Med. 2015;373:2117‐2128.
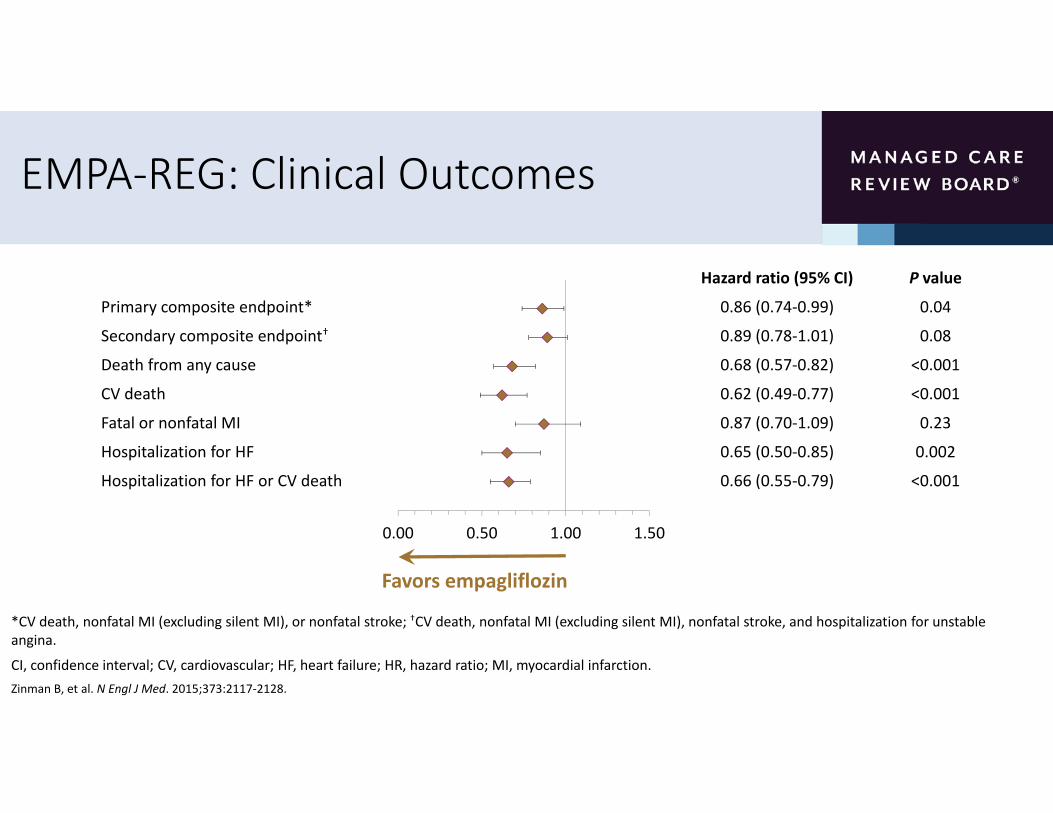
EMPA‐REG: Clinical Outcomes
Hazard ratio (95% CI) P value
Primary composite endpoint* 0.86 (0.74‐0.99) 0.04
Secondary composite endpoint† 0.89 (0.78‐1.01) 0.08
Death from any cause 0.68 (0.57‐0.82) <0.001
CV death 0.62 (0.49‐0.77) <0.001
Fatal or nonfatal MI 0.87 (0.70‐1.09) 0.23
Hospitalization for HF 0.65 (0.50‐0.85) 0.002
Hospitalization for HF or CV death 0.66 (0.55‐0.79) <0.001
*CV death, nonfatal MI (excluding silent MI), or nonfatal stroke; †CV death, nonfatal MI (excluding silent MI), nonfatal stroke, and hospitalization for unstable angina.
CI, confidence interval; CV, cardiovascular; HF, heart failure; HR, hazard ratio; MI, myocardial infarction.Zinman B, et al. N Engl J Med. 2015;373:2117‐2128.
0.00 0.50 1.00 1.50
Favors empagliflozin

EMPA‐REG: Cardiovascular Outcomes and Death From Any Cause
Zinman B, et al. N Engl J Med. 2015;373:2117‐2128.
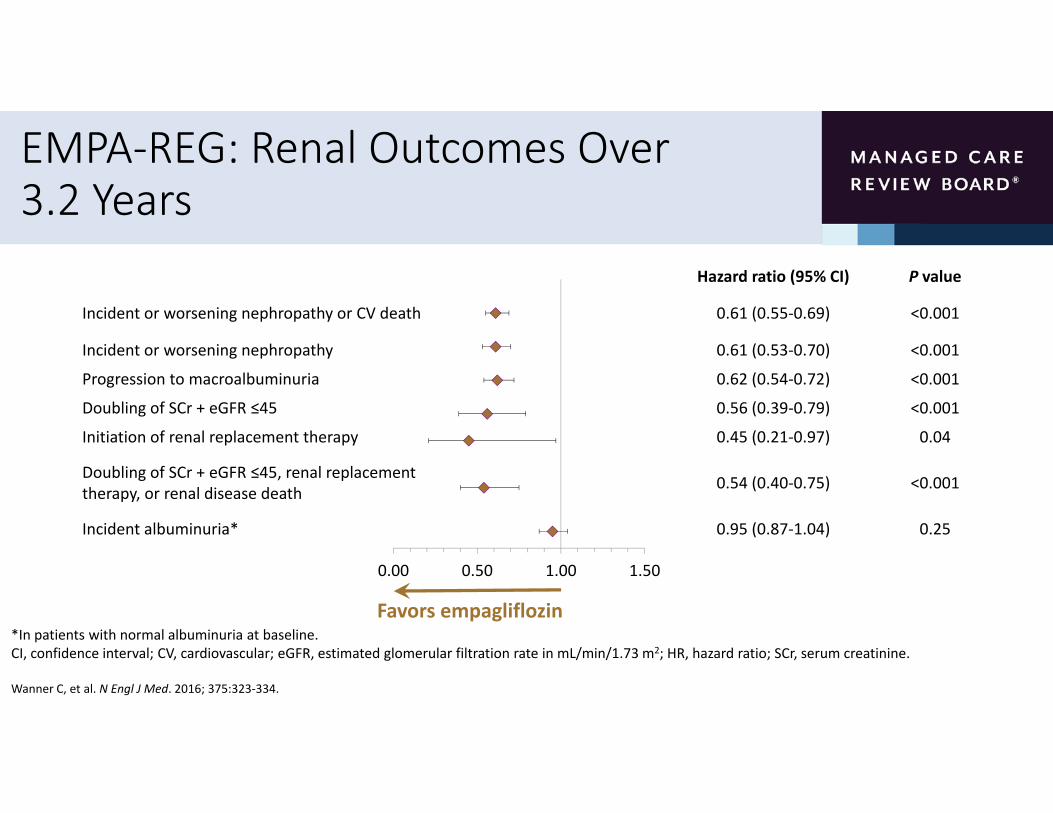
EMPA‐REG: Renal Outcomes Over 3.2 Years
Hazard ratio (95% CI) P value
Incident or worsening nephropathy or CV death 0.61 (0.55‐0.69) <0.001
Incident or worsening nephropathy 0.61 (0.53‐0.70) <0.001
Progression to macroalbuminuria 0.62 (0.54‐0.72) <0.001
Doubling of SCr + eGFR ≤45 0.56 (0.39‐0.79) <0.001
Initiation of renal replacement therapy 0.45 (0.21‐0.97) 0.04
Doubling of SCr + eGFR ≤45, renal replacement therapy, or renal disease death 0.54 (0.40‐0.75) <0.001
Incident albuminuria* 0.95 (0.87‐1.04) 0.25
*In patients with normal albuminuria at baseline.CI, confidence interval; CV, cardiovascular; eGFR, estimated glomerular filtration rate in mL/min/1.73 m2; HR, hazard ratio; SCr, serum creatinine.
Wanner C, et al. N Engl J Med. 2016; 375:323‐334.
0.00 0.50 1.00 1.50
Favors empagliflozin
CVOTs:GLP‐1 Receptor Agonists

ELIXA: Evaluation of Lixisenatide in Acute Coronary Syndrome
Study Design• Patients with T2D and recent ACS event (n=6,068)• Randomization
• Lixisenatide: n=3,034• Placebo: n=3,034
• Noninferiority study: prespecified margin = 1.3 for upper bound of 95% CI of the HR for the primary endpoint
• Primary endpoint: composite of death from cardiovascular causes, nonfatal myocardial infarction, nonfatal stroke, or hospitalization for unstable angina
• Secondary endpoint: composite of the primary end point and hospitalization for heart failure, or coronary revascularization procedures
Key Results• Duration of follow up: 2 years
• CV Outcomes
• Primary: HR 1.02 (95% CI 0.89 to 1.17); P<0.001 for noninferiority; P=0.81 for superiority
• Secondary: There were no significant differences in the rate of hospitalization for HF (HR 0.96; 95% CI, 0.75 to 1.23) or the rate of death (HR 0.94; 95% CI, 0.78 to 1.13)
• Findings were similar in those with a history of heart failure
• Modest weight gain benefit favoring lixisenatide: ‐0.6 kg with lixisenatide vs. ‐0.0 kg for placebo (p < 0.001)
• Hospitalization for heart failure: 4.2% vs. 4.0%
Pfeffer MA, et al. N Engl J Med. 2015; 373:2247‐2257.

LEADER: Liraglutide Effect and Action in Diabetes: Evaluation of Cardiovascular Outcome Results
Study Design• Patients with T2D and high CVD risk (n=9,340)• Randomization
• Liraglutide: n=4,672• Placebo: n=4,668
• Noninferiority study: prespecified margin = 1.3 for upper bound of 95% CI of the HR for primary endpoint
• Primary endpoint: composite of CV death, nonfatal MI (including silent MI), or nonfatal stroke
• Secondary endpoint: composite of CV death, nonfatal MI (including silent MI), nonfatal stroke, coronary revascularization, and hospitalization for unstable angina or HF
Key Results• Median follow‐up: 3.5 years• Difference from placebo at 36 months
• A1C: −0.40% (95% CI, −0.45% to −0.34%)• Weight: 2.3 kg (95% CI, 2.5 to 2.0 kg)• SBP: 1.2 mm Hg (95% CI, 1.9 to 0.5 mm Hg)
• CV outcomes• Primary: HR 0.87 (95% CI 0.78 to 0.97); P=0.01 for superiority
• Secondary HR: 0.88 (95% CI 0.81 to 0.96); P=0.005 for superiority
• Significantly lower rates of all‐cause death and CV death with liraglutide
• Increased rates of GI events in liraglutide‐treated patients• Lower numerical incidence of pancreatitis in liraglutide group (not statistically significant)
CI, confidence interval; CV, cardiovascular; HF, heart failure; HR, hazard ratio; MI, myocardial infarction.Marso SP, et al. N Engl J Med. 2016; 375:311‐322.

LEADER: Clinical Outcomes
Hazard ratio (95% CI) P value
Primary composite endpoint* 0.87 (0.78‐0.97) 0.01
Expanded composite endpoint† 0.88 (0.81‐0.96) 0.005
Death from any cause 0.85 (0.74‐0.97) 0.02
CV death 0.78 (0.66‐0.93) 0.007
Fatal or nonfatal MI 0.86 (0.73‐1.00) 0.046
Hospitalization for HF 0.87 (0.73‐1.05) 0.14
Nephropathy‡ 0.78 (0.67‐0.92) 0.003
*CV death, nonfatal MI (including silent MI), or nonfatal stroke; †CV death, nonfatal MI (including silent MI), nonfatal stroke, coronary revascularization, and hospitalization for unstable angina or HF; ‡Defined as new onset of macroalbuminuria or a doubling of the serum creatinine level and an eGFR of ≤45 mL/min/1.73 m2, the need for continuous renal‐replacement therapy, or death from renal disease
CI, confidence interval; CV, cardiovascular; MI, myocardial infarction
Marso SP, et al. N Engl J Med. 2016; 375:311‐322.
0.00 0.50 1.00 1.50
Favors liraglutide
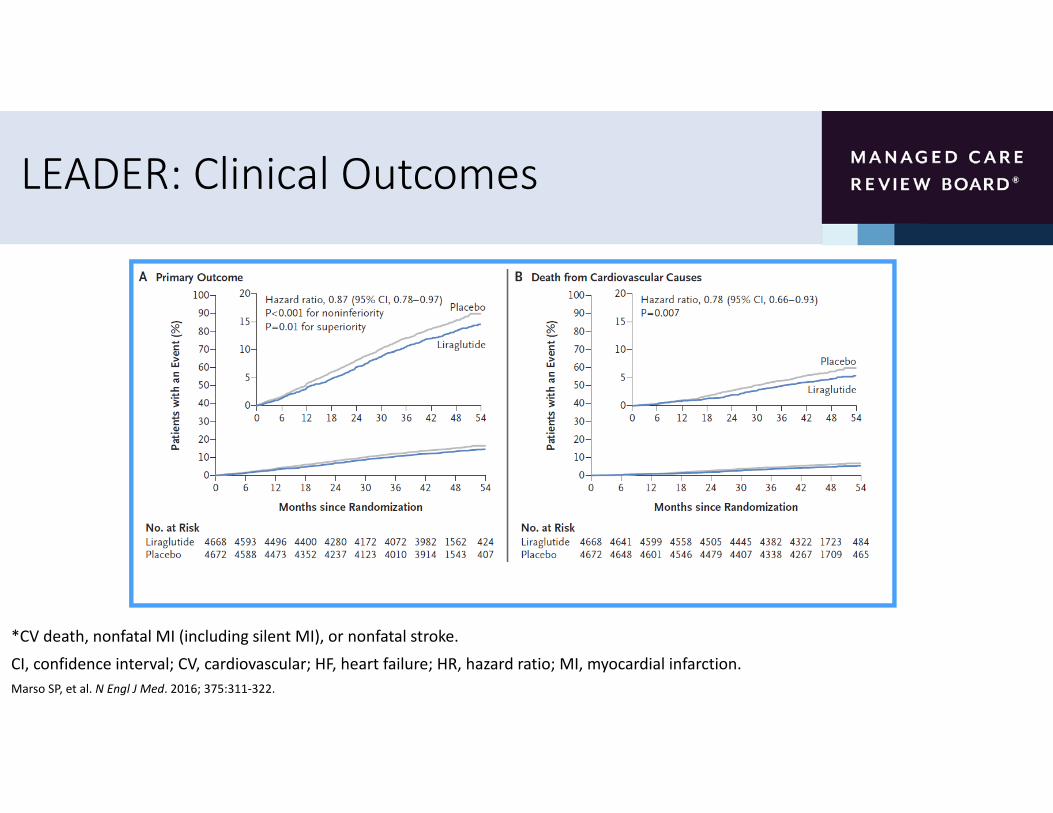
LEADER: Clinical Outcomes
*CV death, nonfatal MI (including silent MI), or nonfatal stroke.
CI, confidence interval; CV, cardiovascular; HF, heart failure; HR, hazard ratio; MI, myocardial infarction.Marso SP, et al. N Engl J Med. 2016; 375:311‐322.

SUSTAIN 6: Trial to Evaluate Cardiovascular and Other Long‐term Outcomes with Semaglutide in Subjects with Type 2 Diabetes
Study Design• Patientswith T2D (n=3,297) age ≥50 years with established CVD
or stage ≥3 CKD or age ≥60 years with at least one CV risk factor• Randomization
• Semaglutide: n=3,034• Placebo: n=3,034
• Noninferiority study: prespecified margin = 1.3 for upper bound of 95% CI of the HR for the primary endpoint
• Primary endpoint: first occurrence of cardiovascular death, nonfatal myocardial infarction, or nonfatal stroke
• Secondary endpoints: first occurrence of an expanded composite CV outcome (death from CV causes, nonfatal MI, nonfatal stroke, revascularization [coronary or peripheral], and hospitalization for UA or HF), an additional composite outcome (death from all causes, nonfatal MI, or nonfatal stroke), the individual components of the composite outcomes, retinopathy complications, and new or worsening nephropathy
Key Results• Duration of follow up: 2 years
• CV Outcomes
• Primary: HR 0.74 (95% CI 0.58 to 0.95); P<0.001 for noninferiority; P=0.02 for superiority
• Secondary: • Nonfatal MI: HR 0.74 (95% CI, 0.51 to 1.08; P=0.12• Nonfatal stroke: HR 0.61 (95% CI, 0.38 to 0.99; P=0.04)
• Rates of CV‐related death were similar• Rates of new/worsening nephropathy were lower in the semaglutide group
• Rates of retinopathy complications were significantly higher in the semaglutide group; HR 1.76 (95% CI, 1.11 to 2.78); P=0.02
Marso SP, et al. N Engl J Med. 2016;375:1834‐1844.
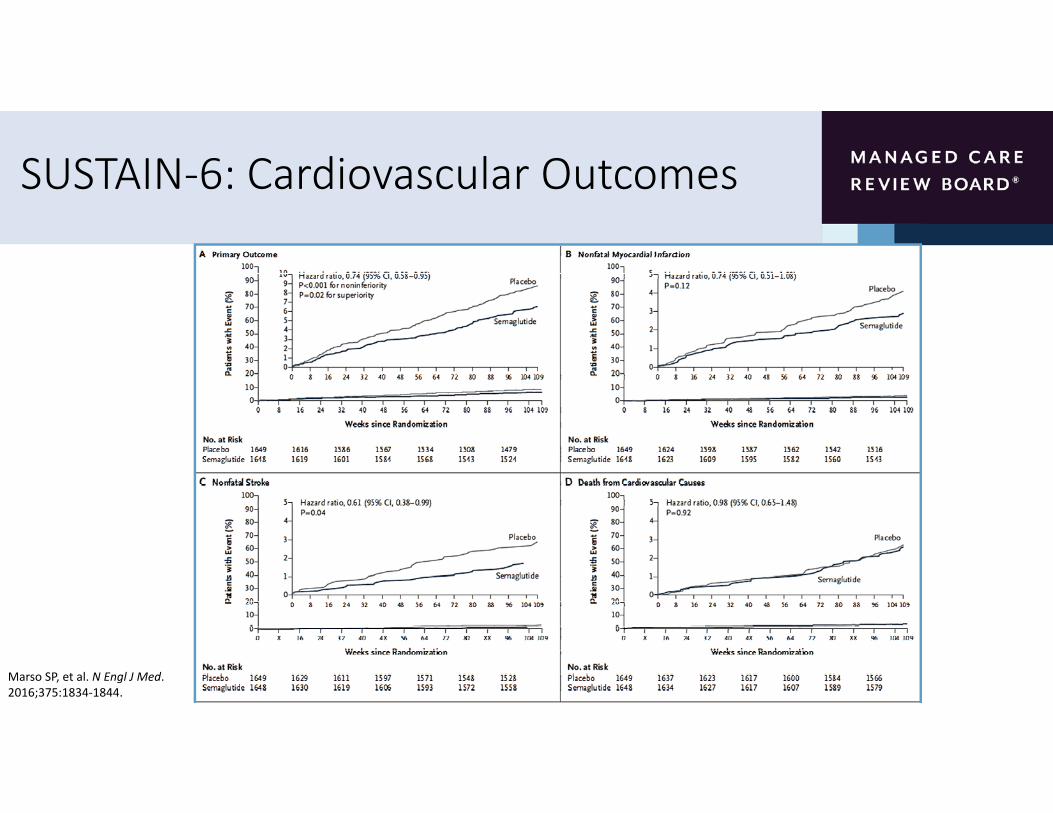
SUSTAIN‐6: Cardiovascular Outcomes
Marso SP, et al. N Engl J Med. 2016;375:1834‐1844.

Summary of Completed CVOT Trials
Drug Class SAVOR TIMI‐53 EXAMINE TECOS
DPP‐4 inhibitor
LEADER ELIXA SUSTAIN‐6
GLP‐1 agonist
EMPA‐REG
SLGT2‐Inhibitor
Neutral* Neutral* Neutral*
Beneficial Neutral
Beneficial
Beneficial
*Although the DPP‐4 inhibitor trials were neutral, there was no increase in the number of patients hospitalized for heart failure with sitagliptin (TECOS trial). Saxagliptin (SAVOR TIMI‐53 trial), showed an increase in heart‐failure events. Alogliptin (EXAMINE trial) showed a trend toward an increased risk of heart‐failure events in T2DM patients.

Summary
• Diabetes is a significant contributor to cardiovascular disease risk
• In 2008, the FDA mandated that all new therapies for diabetes must be rigorously assessed for CV safety
• Majority of CVOTs have been designed to compare effects of antihyperglycemic agent to placebo, thus lack head‐to‐head comparisons
• Methodological differences between trials and a focus on high risk populations, limits generalization of the results
• Seven CVOTs of have been completed; 3 show a reduction in CV risk (LEADER, SUSTAIN‐6 and EMPA‐REG) and 4 were neutral (eg, demonstrated noninferiority to placebo)

Aligning Managed Care Type 2 Diabetes Treatment Algorithms with Recent Cardiovascular Outcomes Trial Data
John Fox, MD, MHAVice President, Associate Chief Medical Officer
Medical AffairsPriority Health

Learning Objective
• Examine alignment of managed care type 2 diabetes treatment algorithms with recent cardiovascular outcomes trial data

Standards of Medical Care in Diabetes―2017
• Annual update from the American Diabetes Association (ADA)
• Includes new guidance multiple topics including
• Glycemic targets
• Pharmacologic approaches to achieving glycemic targets
• Cardiovascular disease risk management
• Lifestyle management
• Patient‐centered care
American Diabetes Association. Diabetes Care. 2017;40(suppl 1):S1‐S135.
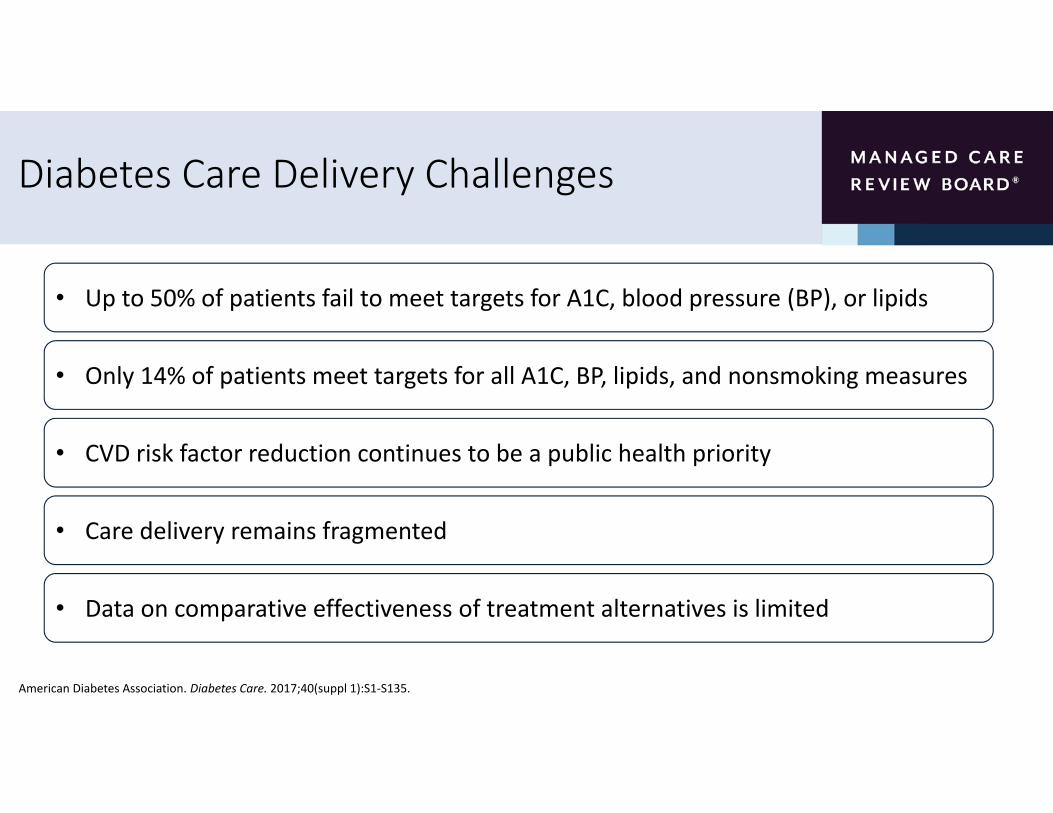
Diabetes Care Delivery Challenges
• Up to 50% of patients fail to meet targets for A1C, blood pressure (BP), or lipids
• Only 14% of patients meet targets for all A1C, BP, lipids, and nonsmoking measures
• CVD risk factor reduction continues to be a public health priority
• Care delivery remains fragmented
• Data on comparative effectiveness of treatment alternatives is limited
American Diabetes Association. Diabetes Care. 2017;40(suppl 1):S1‐S135.

Achieving A1C Treatment Goals: 2010‐2015
87.6% 88.5% 88.7% 88.6% 88.4% 89.5%
0
20
40
60
80
100
2010 2011 2012 2013 2014 2015
% of P
atients
Screening for A1C in Commercial Plans 2010‐2015
35%39% 40%
36% 37% 35%
56% 58% 58% 56% 55%51%
37%31% 32% 34% 34%
39%
0
20
40
60
80
100
2010 2011 2012 2013 2014 2015
% of P
atients
<7% <8% >9%
Achievement of ADA A1C Targets in Commercial Plans 2010‐2015
National Committee for Quality Assurance. http://www.ncqa.org/report‐cards/health‐plans/state‐of‐health‐care‐quality/2016‐table‐of‐contents/diabetes‐care. Accessed February 2017.

Management Strategies to Improve Diabetes Outcomes
• Early screening/prompt diagnosis
• Early intervention with agents supported by evidence‐based treatment guidelines
• Intensify treatment to achieve and maintain glycemic goals
• Manage relevant comorbidities
• Tailor treatment decisions to patient preferences, prognosis, and goals
• Foster strong therapeutic relationships between the patient and physician
American Diabetes Association. Diabetes Care. 2017;40(suppl 1):S1‐S135.Inzucchi SE, et al. Diabetes Care. 2012;35:1364‐1379.

Achieving Glycemic Goals
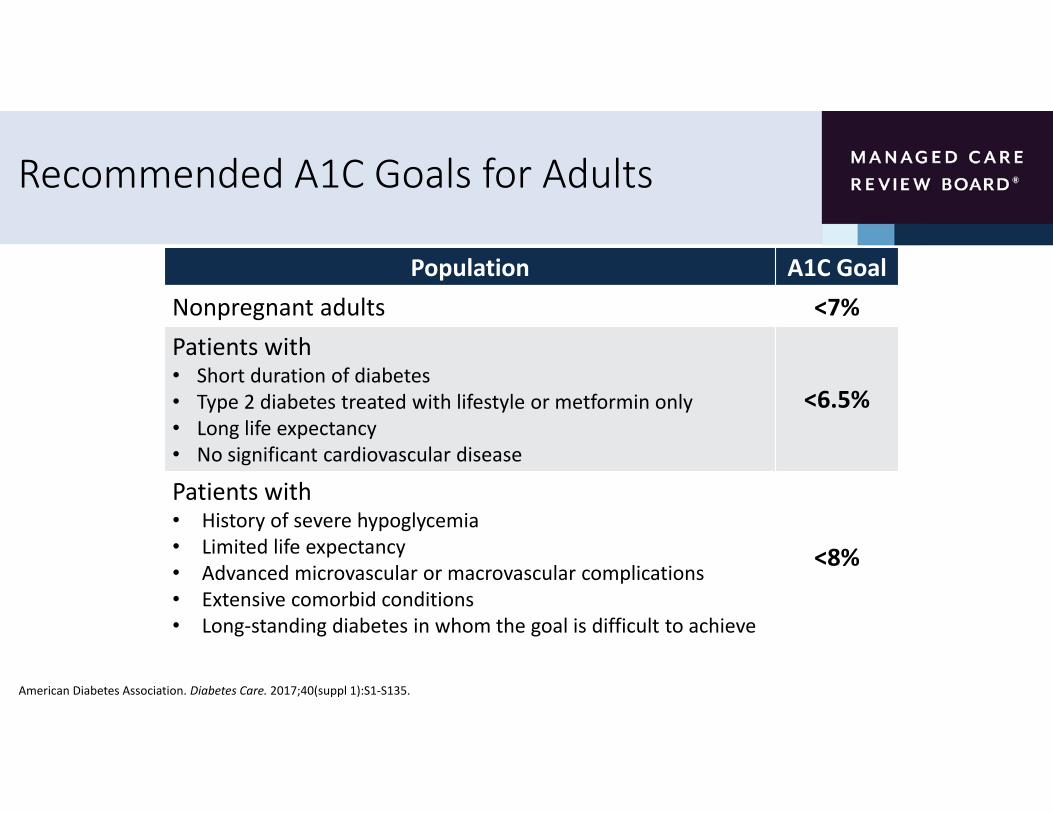
Recommended A1C Goals for Adults
American Diabetes Association. Diabetes Care. 2017;40(suppl 1):S1‐S135.
Population A1C GoalNonpregnant adults <7%Patients with• Short duration of diabetes• Type 2 diabetes treated with lifestyle or metformin only• Long life expectancy• No significant cardiovascular disease
<6.5%
Patients with• History of severe hypoglycemia• Limited life expectancy• Advanced microvascular or macrovascular complications• Extensive comorbid conditions• Long‐standing diabetes in whom the goal is difficult to achieve
<8%

Treatment Intensification to Achieve and Maintain Appropriate Glycemic Levels
American Diabetes Association. Diabetes Care. 2017;40(suppl 1):S1‐S135.
• Intensification approach should be individualized to match the needs of each patient and characteristics of the disease
Approach to the Management of HyperglycemiaPatient / Disease FeaturesRisks potentially associated with hypoglycemia and other drug adverse effects
Disease duration
Life expectancy
Relevant comorbidities
Established vascular complications
Patient attitude and expected treatment efforts
Resources and support system
More stringent Less stringentA1C 7%
low high
newly diagnosed long‐standing
long short
absent severefew / mild
absent severefew / mild
readily available limited
highly motivated, adherent, excellent self‐care capabilities
less motivated, nonadherent, poor
self‐care capabilities
Potentially modifiable
Usually not m
odifiable

Improving Glycemic Levels With Lifestyle Interventions
• Lifestyle modifications form the foundation of anti‐glycemic care• Activities include
• Diabetes self‐management• Weight optimization• Following a healthy diet• Increased physical activity levels• Smoking cessation• Routine immunization• Diagnosis and management of psycho‐social conditions
American Diabetes Association. Diabetes Care. 2017;40(suppl 1):S1‐S135.

Pharmacologic Therapy for Type 2 Diabetes: General Principles
• Goal: Reduce blood glucose levels and minimize side effects (especially hypoglycemia)
• Develop a treatment plan and set therapeutic goals• Drug choice is based on patient, disease, drug characteristics, and patient preference
• Start aggressively and taper (if necessary)• Assume each medication will improve HgA1c by 1%
• Always add new agent first, titrate to get control, then stop first agent
• Cost‐effectiveness models have suggested that some newer agents may be of relatively lower clinical utility based on high cost and moderate glycemic effect
American Diabetes Association. Diabetes Care. 2017;40(suppl 1):S1‐S135.

Pharmacologic Options
American Diabetes Association. Diabetes Care. 2017;40(suppl 1):S1‐S135.
Metformin
Sulfonylureas
Insulin
Amylin analogs
GLP‐1 agonists (incretin)
Oral Agents Injectable Agents
‐glucosidase inhibitors
Meglitinides
Thiazolidinediones Sodium–Glucose Cotransporter 2 Inhibitors
DPP‐4 inhibitors (incretin)

T2DM Treatment Algorithm
53American Diabetes Association.Diabetes Care. 2017;40(suppl 1):S1‐S135.
• General ADA recommendations for antihyperglycemic therapy in type 2 diabetes
54American Diabetes Association. Diabetes Care. 2017;40(suppl 1):S1‐S135.
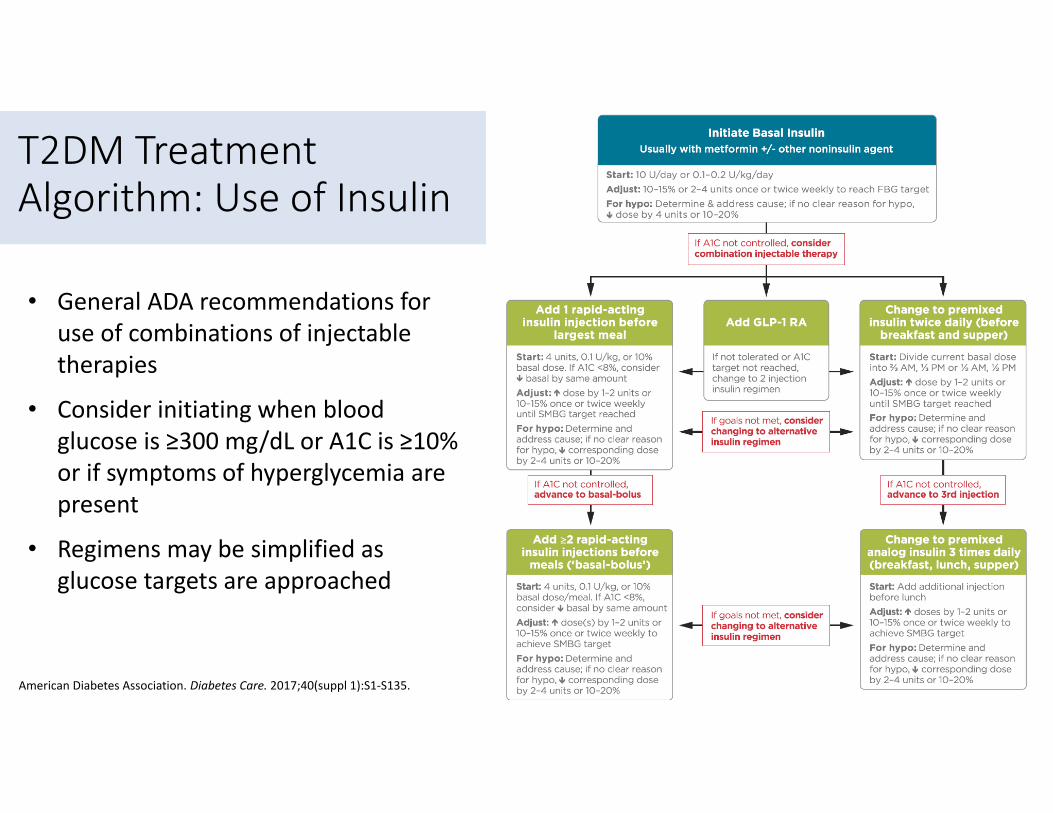
T2DM Treatment Algorithm: Use of Insulin
• General ADA recommendations for use of combinations of injectable therapies
• Consider initiating when blood glucose is ≥300 mg/dL or A1C is ≥10% or if symptoms of hyperglycemia are present
• Regimens may be simplified as glucose targets are approached

CVOT Results and Diabetes Treatment Guidelines

A1C and Cardiovascular Outcomes
American Diabetes Association. Diabetes Care. 2017;40(suppl 1):S1‐S135.
The relationship between glycemic control and CVD has been examined in several trials completed prior to the FDA‐mandated initiation of CVOTs
DCCT• Trend toward lower risk of CVD events with intensive control (type 1)
EDIC
• 57% reduction in risk of nonfatal MI, stroke, or CVD death (type 1)
UKPDS
• Nonsignificant reduction in CVD events (type 2)
ACCORD, ADVANCE, VADT
• Suggested no significant reduction in CVD outcomes with intensive glycemic control (type 2)

Overview of CVOTs with Antihyperglycemic Agents
Drug Class Trial Drug Primary Endpoint N Status
DPP‐4 inhibitors
TECOSSAVOR‐TIMI 53
EXAMINECAROLINACARMELINA
SitagliptanSaxagliptinAlogliptinLinagliptanLinagliptan
MACE + UAMACEMACE
MACE + UACV risk
14,67116,492538060008300
CompletedCompletedCompleted
20182018
GLP‐1 RA
LEADERSUSTAIN‐6ELIXAEXSCELITCA
REWINDHARMONY
LiraglutideSemaglutideLixisenatideExenatideExenatideDulaglutideAlbiglutide
MACEMACEMACEMACEMACEMACEMACE
93403297606814,000400096229400
CompletedCompletedCompleted
2018201820192019
SGLT2 inhibitorsEMPA‐REG CANVAS
DECLARE‐TIMI‐58
EmpagliflozinCanaglifozinDapagliflozin
MACEMACEMACE
7020440717,150
Completed20172019
Insulin DEVOTE Degludec MACE 7500 2018
Smith RJ, et al. Diabetes Care. 2016; 39:738‐742; Jayawardene D, et al. Heart Lung Circ. 2014;23:997‐1008.
MACE = major adverse cardiac events (cardiovascular death, nonfatal myocardial infarction, and nonfatal stroke); UA= hospitalization for unstable angina

Inclusion of CVOT Data in the 2017 Update of the Treatment Guidelines
ADA guidelines include a brief review of 2 CVOTs that demonstrated benefits in high‐risk patients with type 2 diabetes
Cardiovascular Outcome Event Trial in Type 2 Diabetes Mellitus Patients (EMPA‐REG OUTCOME)
Liraglutide Effect and Action in Diabetes: Evaluation of Cardiovascular Outcome
Results—A Long‐Term Evaluation (LEADER) trial
Empagliflozin Liraglutide

0
1
2
3
4
5
6
7
8
9
0 6 12 18 24 30 36 42 48
Patie
nts w
ith event (%
)
Months
EMPA‐REG Results: Primary Endpoint
Zinman B, et al. N Engl J Med. 2015;373:2117‐2128.
HR: 0.62 (95% CI 0.49, 0.77)
P=0.0001
N=7020
38%
• Primary composite outcome• Death from cardiovascular causes• Nonfatal myocardial infarction• Nonfatal stroke
• Key secondary composite outcome• Hospitalization for unstable angina
• Conclusion• Type 2 diabetes patients at high risk
for CV events treated with standard care empagliflozin had a lower rate of CV outcomes and death from any cause
Placebo
Empagliflozin
Number of patientsEmpagliflozin 4687 4651 4608 4556 4128 3079 2617 1722 414
Placebo 2333 2303 2280 2243 2012 1503 1281 825 177
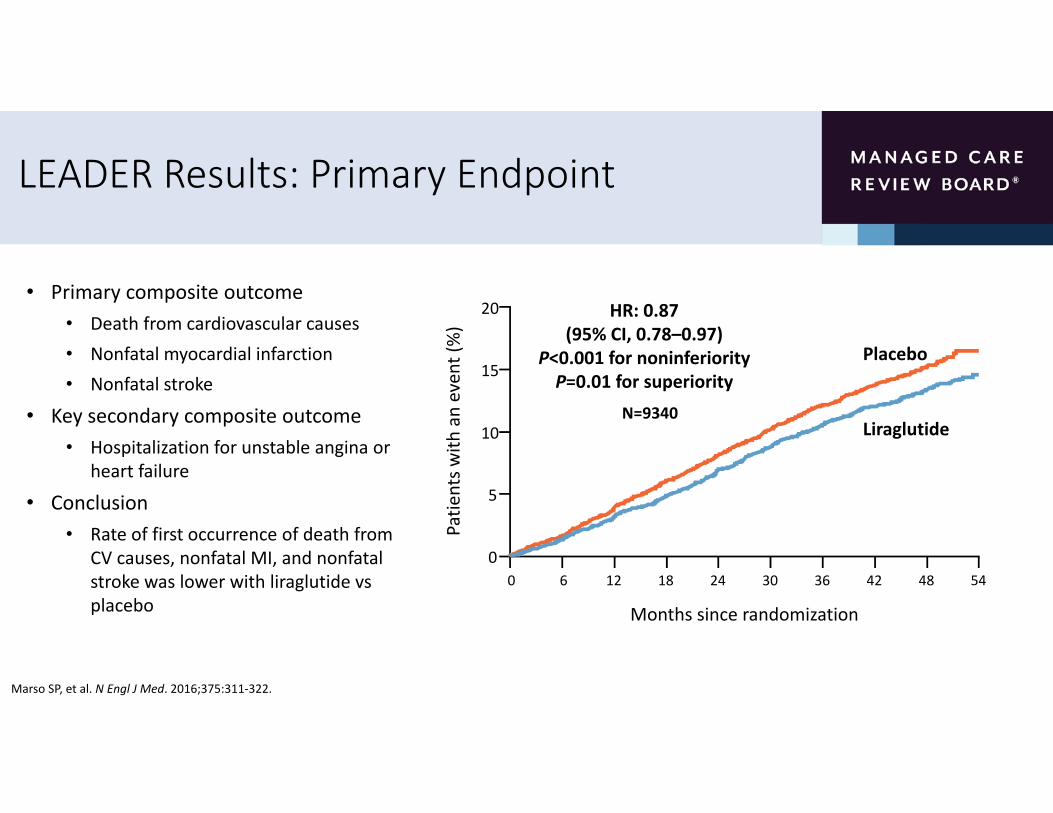
LEADER Results: Primary Endpoint
Marso SP, et al. N Engl J Med. 2016;375:311‐322.
Patie
nts w
ith an event (%)
Months since randomization
Placebo
Liraglutide
HR: 0.87 (95% CI, 0.78–0.97)
P<0.001 for noninferiorityP=0.01 for superiority15
10
20
5
00 6 12 18 24 30 36 42 48 54
• Primary composite outcome• Death from cardiovascular causes• Nonfatal myocardial infarction• Nonfatal stroke
• Key secondary composite outcome• Hospitalization for unstable angina or
heart failure
• Conclusion• Rate of first occurrence of death from
CV causes, nonfatal MI, and nonfatal stroke was lower with liraglutide vs placebo
N=9340

What Effect will CVOT Results Have on Clinical Practice Guidelines?
• There are now 7 completed CVOTs involving 3 classes of drugs
• DDP‐IV inhibitors (3 trials)
• GLP‐1 receptor antagonists (3 trials)
• SGLT2 inhibitors (1 trial)
• Results from these trials provide evidence of the overall cardiovascular safety of incretins and SGLT2 inhibitors
• Results from specific agents may not be applicable to other members of the same class
Abdul‐Ghani M, et al. Diabetes Care. 2016;39:717‐725; American Diabetes Association. Diabetes Care. 2017;40(suppl 1):S1‐S135.

Summary
• The goal of antihyperglycemic treatment is to reduce blood glucose levels and minimize side effects (especially hypoglycemia)
• The 2017 ADA treatment guidelines provide recommendations on diabetes care delivery including updated glycemic targets and antihyperglycemic pharmacotherapy
• Results from 2 of 7 large CVOT trials are included in the revised guidelines• Results from these trials provide evidence of the overall cardiovascular safety of the incretins and SGLT2 inhibitors
• Specific treatment recommendations based on the results of these and future CVOTs trials is anticipated in future editions of the guidelines

CVOT Results and Plan Benefit Designs: Maximizing Value for Emerging Type 2
Diabetes TherapiesVanita Pindolia, PharmD, BCPS
Vice President, Ambulatory Clinical Pharmacy ProgramsHenry Ford Health System/Health
Alliance Plan of Michigan

Learning Objective
• Discuss the potential impact of CVOT results on benefit design strategies

CVOT in Diabetes: Perspective
• Seventeen CVOT clinical trials involving >140,000 subjects have been completed or are ongoing in accordance with the FDA guidance issued in 20081
• The 7 completed trials involve three different drug classes (SGLT2 inhibitors, GLP‐1 agonists, DPP‐4 inhibitors)1‐5
• Each has met their primary objective to exclude an unacceptable level of ischemic CV risk (as defined in the FDA guidance)1‐5
• One trial found an increased risk of hospitalization for heart failure (SAVOR‐TIMI 532) while 3 others demonstrated a reduction in cardiovascular death (EMPA‐REG3, LEADER4, SUSTAIN‐65)
• To date, a heightened risk of CV ischemic events has not been demonstrated across several classes of new diabetes drugs
1. Smith RJ, Goldfine AB, Hiatt WR. Diabetes Care. 2016;39:738‐742; 2. Scirica BM, et al. N Engl J Med. 2013;369,1317‐1326; 3. Zinman B, et al. N Engl J Med. 2015;373:2117‐2128; 4. Marso SP, et al. N Engl J Med. 2016; 375:311‐322; 5. Marso SP, et al. N Engl J Med. 2016;375:1834‐1844.
How will these data impact the diabetes pharmacy benefit?
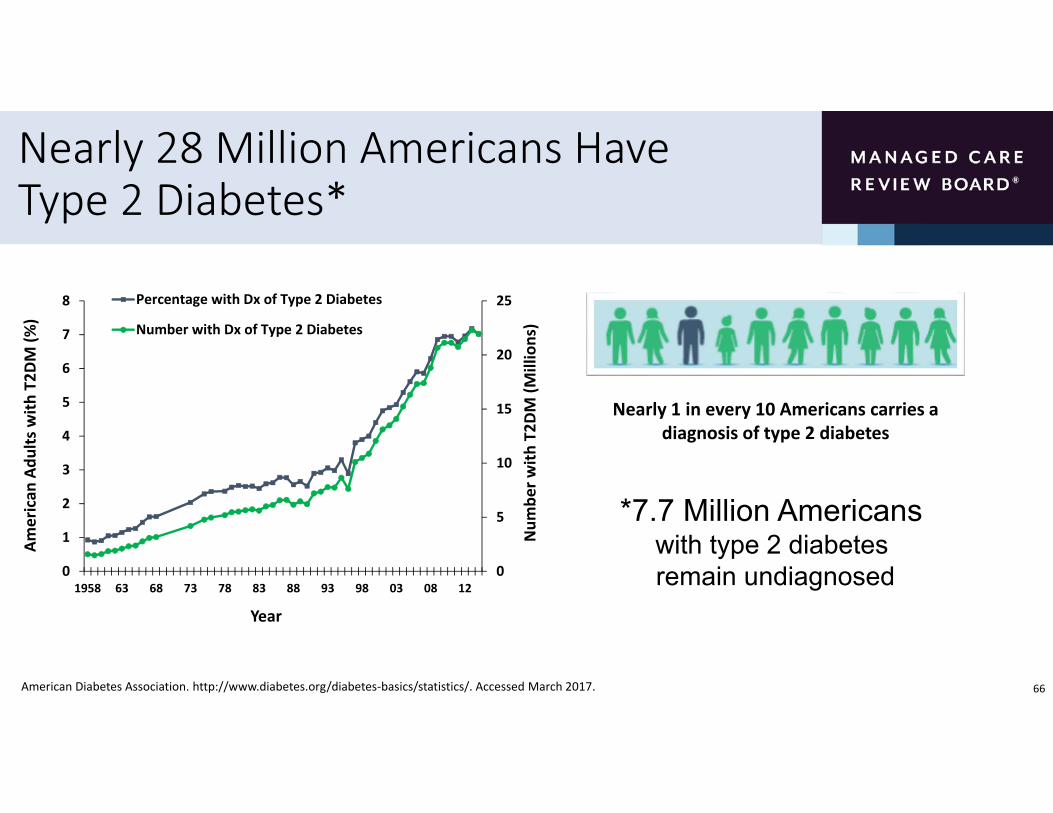
Nearly 28 Million Americans Have Type 2 Diabetes*
66American Diabetes Association. http://www.diabetes.org/diabetes‐basics/statistics/. Accessed March 2017.
0
5
10
15
20
25
0
1
2
3
4
5
6
7
8
1958 63 68 73 78 83 88 93 98 03 08 12
Num
ber w
ith T2D
M (M
illions)
American
Adu
lts with
T2D
M (%
)
Year
Percentage with Dx of Type 2 Diabetes
Number with Dx of Type 2 Diabetes
Nearly 1 in every 10 Americans carries a diagnosis of type 2 diabetes
*7.7 Million Americans with type 2 diabetes remain undiagnosed

Diabetes Increases Risk of CV Morbidity and Mortality
Emerging Risk Factors Collaboration. Lancet 2010;375:2215‐2222.
Meta‐analysis of 102 clinical trials evaluating the risk of CV events due to T2DM
Diabetes mellitus significantly increases the risk of adverse CV events
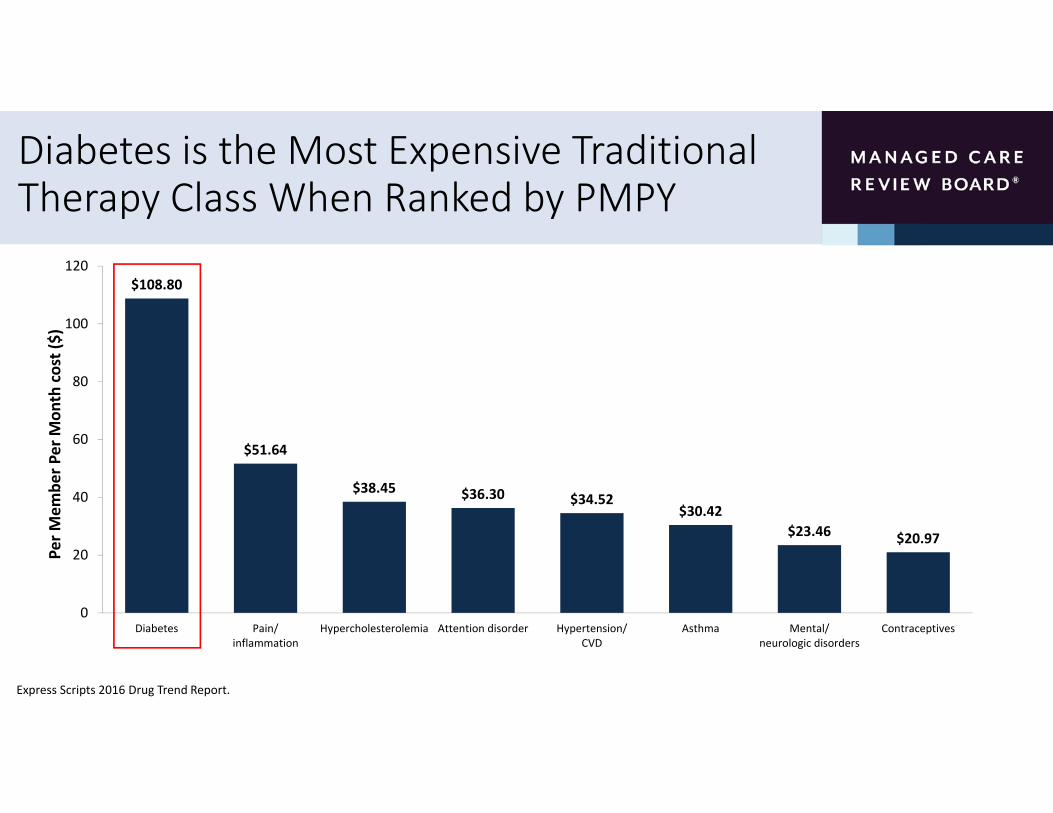
Diabetes is the Most Expensive Traditional Therapy Class When Ranked by PMPY
$108.80
$51.64
$38.45 $36.30 $34.52$30.42
$23.46 $20.97
0
20
40
60
80
100
120
Diabetes Pain/inflammation
Hypercholesterolemia Attention disorder Hypertension/CVD
Asthma Mental/neurologic disorders
Contraceptives
Per M
embe
r Per M
onth cost ($)
Express Scripts 2016 Drug Trend Report.
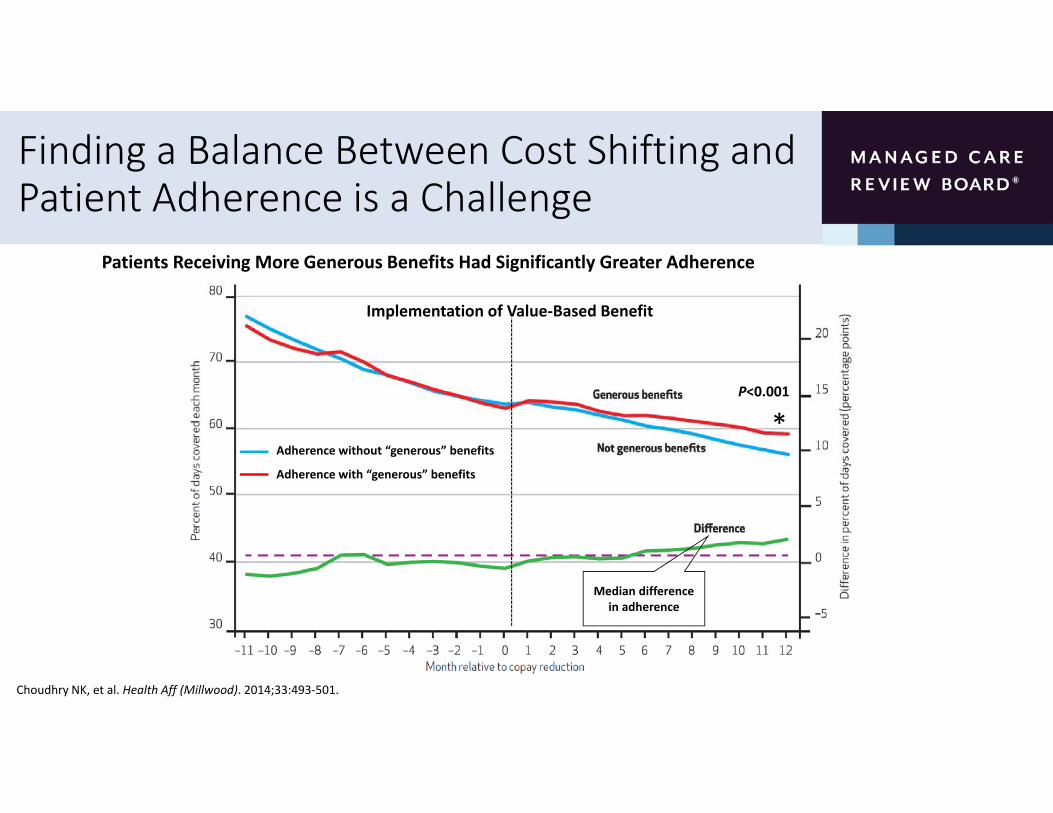
Finding a Balance Between Cost Shifting and Patient Adherence is a Challenge
Patients Receiving More Generous Benefits Had Significantly Greater Adherence
Choudhry NK, et al. Health Aff (Millwood). 2014;33:493‐501.
Implementation of Value‐Based Benefit
Median difference in adherence
P<0.001
*Adherence without “generous” benefits
Adherence with “generous” benefits

Tenets of a Diabetes Benefit Plan Design
Manage costs by restricting utilization of resources
Cost‐sharing frequently used to influence utilization patterns
Patient cost‐share related to acquisition cost of service or
product
Assumes inelastic demand or willingness to pay
Willey VJ, et al. Am J Manag Care. 2008;14:S252‐S263.
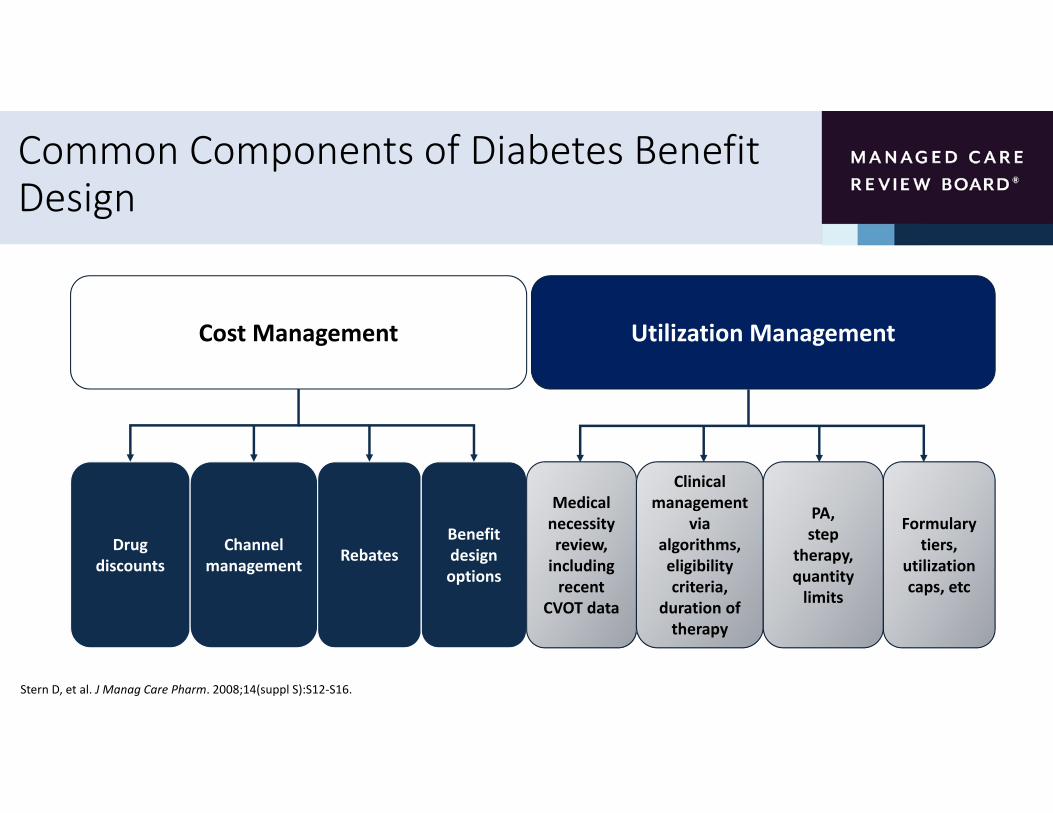
Common Components of Diabetes Benefit Design
Cost Management Utilization Management
Drug discounts
Channel management Rebates
Benefit design options
Medical necessity review, including recent
CVOT data
Clinical management
via algorithms, eligibility criteria,
duration of therapy
PA,step
therapy, quantity limits
Formulary tiers,
utilization caps, etc
Stern D, et al. J Manag Care Pharm. 2008;14(suppl S):S12‐S16.
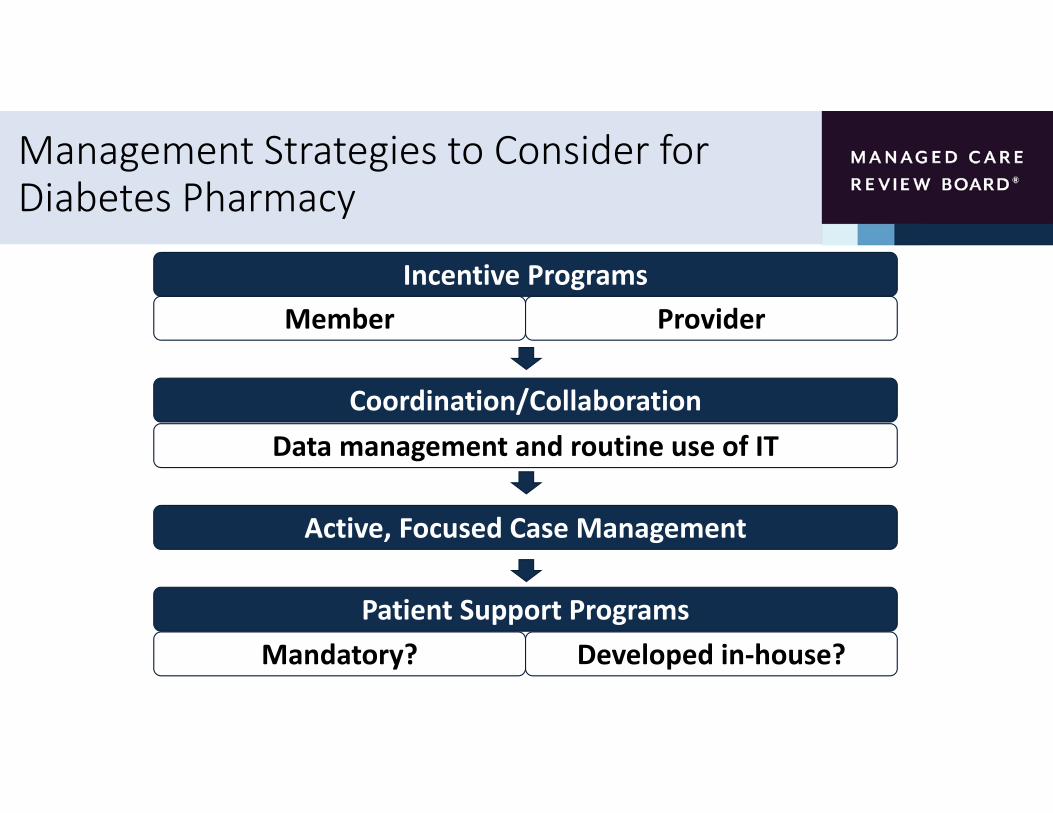
Management Strategies to Consider for Diabetes Pharmacy
Incentive ProgramsMember Provider
Coordination/CollaborationData management and routine use of IT
Active, Focused Case Management
Patient Support ProgramsMandatory? Developed in‐house?

Benefit Design Strategies to Consider for Diabetes Pharmacy
Benefit Design
Tiers• Evaluating out‐of‐pocket expenses
Biosimilars• First biosimilar insulin (insulin glargine) approved in January 2016
Application of Guidelines, Algorithms, and Disease Management

Patient Behavior Considerations for Diabetes Pharmacy
Disease and Treatment Variables Health Care Delivery Variables
• Complex therapy
• Treatment tolerability
• Multiple comorbidities• CV disease
• Kidney disease
• Obesity
• Patient awareness/education
• Strengthening patient‐provider relationships
• Patient empowerment
• Integrated communication channels
• Medication therapy management
• Medication reminders
• Telephone/email counseling

Formulary Management Considerations for Diabetes Pharmacy
More Formulary Control
Assessment of recent data (eg, CVOT results)
Prior authorization Quantity limits Start/stop rules
Contracting
Outcomes‐basedshared risk Net effective pricing
Identification of data gaps (eg, comparative
trials

Moving Away From Volume and Toward Value
• Payment/delivery paradigm emphasis is on rewarding value instead of volume • Value‐based benefit design: shared savings, gain‐sharing, bundled payments, capitation, etc
• Incentives driven by CMS are being implemented to coordinate care among/across providers
• CMS Quality Strategy
• CMS EHR incentive program
• Establishment of organizational infrastructure that promotes actual and virtual integration• Accountable care organizations (ACOs), medical homes, home‐based chronic care management, community health teams, health care innovation zones

Key Elements of an Value‐Based Design
Benefit Design Clinical Evidence & Performance Metrics
Consumer and Provider Engagement Transparency
VBID
VBID=value‐based insurance design

Patient‐centered Benefit Plan Designs
Improve patient
experience of care
Improve health of
populations
Reduce costsof health care
• Development guided by principles of value‐based insurance design• Set cost shares that consider cost and value while prioritizing primary care and frequently
needed care for management of chronic comorbidities including cardiovascular disease
• Set fixed copays as much as possible; limit coinsurance to less frequently used benefits or services with high variability in cost as necessary to meet required actuarial values
• Apply a stair‐step approach for setting member cost shares for a service across each tier
• Reassess benefits each year based on emergence of new clinical trial data (eg, CVOT results) and patient experience related to access and cost

Summary
• Managed care will be required to develop novel solutions to meet the continued growth of the diabetes population
• Limited resources challenge patients, providers, and payers
• Diabetes pharmacy is a current and future concern for plan sponsors and patients
• Current plan designs often do not consider recent clinical trial data and thus, may not apply to the ongoing and future needs of diabetes pharmacy
• Benefit design should be reassessed annually and consider new clinical trial data (eg, CVOT results) as well as patient experience related to access and cost
• Newer approaches should be implemented that consider the needs of all stakeholders including patients, physicians, managed care organizations, industry, and payers
Patient‐Centered Strategies to Minimize Cardiovascular Risk in Patients in a
Managed Care SettingCurtis Triplitt, PharmD, CDE
Texas Diabetes Institute, University Health SystemAssociate Professor of Medicine, Clinical/Division of Diabetes University of Texas Health Science Center at San Antonio

Learning Objective
• Implement patient‐centered strategies to minimize cardiovascular risk in patients treated in a managed care setting

CVD Risk in T2DM: More Risks = Higher Mortality
Emerging Risk Factors Collaboration. JAMA. 2015;314:52‐60.
6.8%15.6% 16.8% 16.1%
32.0% 32.5% 32.8%
59.5%
0
20
40
60
80
100
None Diabetes History ofMI
History ofCVA
Diabetes +MI
Diabetes +CVA
MI + CVA All 3
Mortality Rate/100
0 Person
Years
Mortality from Cardiovascular Disease*
*Morality per 1000 person years adjusted to age 60; N=689,300; Baseline surveys conducted 1960‐2007; mortality follow up to 2013; 128,843 deathsMI=myocardial infarction; CVA=cerebrovascular accident

More Than Two‐Thirds of Adults With T2DM Die From CV DiseaseMore than two‐thirds of patients with T2DM die from cardiovascular disease
American Heart Association. Cardiovascular disease and diabetes. http://www.heart.org/HEARTORG/Conditions/More/Diabetes/WhyDiabetesMatters/Cardiovascular‐Disease‐Diabetes_UCM_313865_Article.jsp/#.WLm63YWcGbg. Accessed March 2017.

Glycemic Control Reduces Long‐Term Risk of Myocardial Infarction
United Kingdom Prospective Diabetes Study (UKPDS) 10‐Year Follow‐Up
Sulphonylurea vs Conventional Therapy Insulin vs Conventional Therapy
Holman, RR et al. N Engl J Med. 2008;359:1577‐1589.
Glycemic control takes a long time for CVD risk reduction; We are often too glucocentric in diabetes

Diabetes Becomes More Difficult to Treat Over Time
More Chronic Conditions & Comorbidities
More medications indicated
Over‐ and under‐
prescribing
Worse adherence
More adverse events
Increased hospitalization
Increased readmissions
Increased mortality
Mansur N, et al. Am J Geriatr Pharmacother. 2012;10;223‐229.Wilson MN, et al. Ann Pharmacother. 2014;48;26‐32.
Disease Progression

ADA Recommendations for When Goals Are Not Met: Treatment Intensification• Patient and disease features dictate the intensity of therapy
• Patients with high baseline A1C or at high risk for complications often require intensive treatment
• Monotherapy is often insufficient
• Consider initiating combination therapy
American Diabetes Association. Diabetes Care. 2017;40(suppl 1):S1‐S135.
Approach to the Management of HyperglycemiaPatient / Disease FeaturesRisks potentially associated with hypoglycemia and other drug adverse effects
Disease duration
Life expectancy
Relevant comorbidities
Established vascular complications
Patient attitude and expected treatment efforts
Resources and support system
More stringent Less stringentA1C 7%
low high
newly diagnosed long‐standing
long short
absent severefew / mild
absent severefew / mild
readily available limited
highly motivated, adherent, excellent self‐care capabilities
less motivated, nonadherent, poor
self‐care capabilities
Potentially modifiable
Usually not m
odifiable
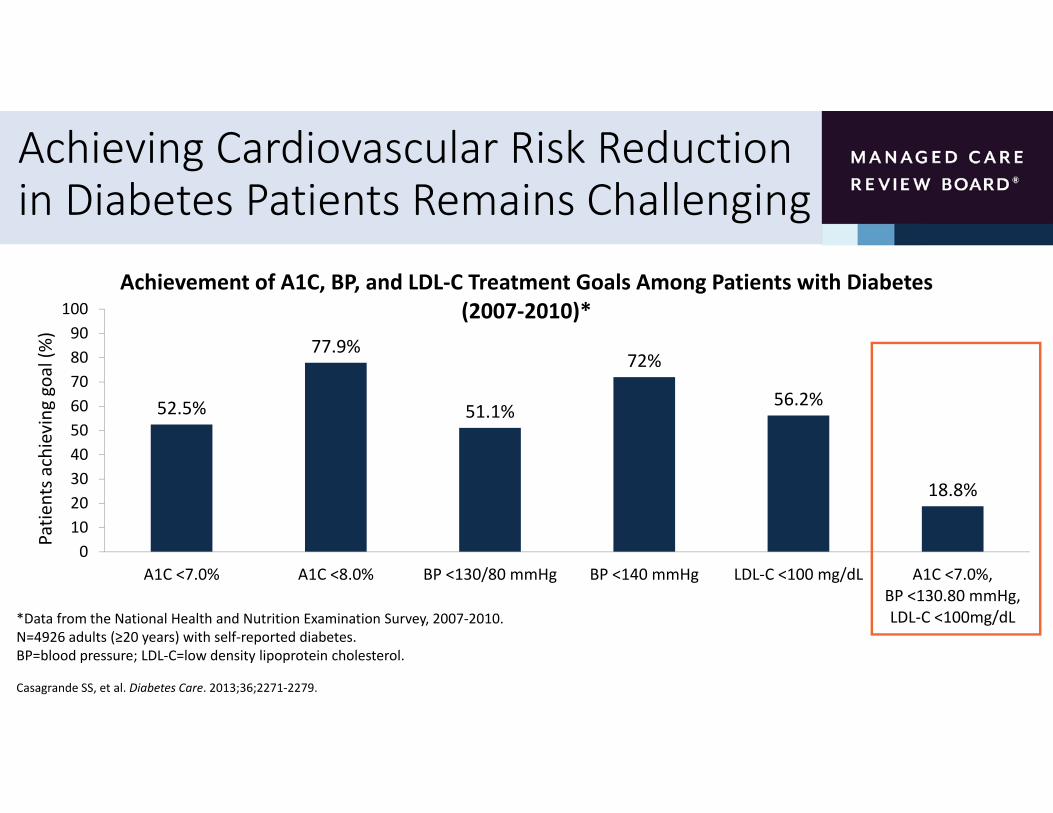
Achieving Cardiovascular Risk Reduction in Diabetes Patients Remains Challenging
52.5%
77.9%
51.1%
72%
56.2%
18.8%
0102030405060708090
100
A1C <7.0% A1C <8.0% BP <130/80 mmHg BP <140 mmHg LDL‐C <100 mg/dL A1C <7.0%,BP <130.80 mmHg,LDL‐C <100mg/dL
Patie
nts a
chieving
goal (%)
Achievement of A1C, BP, and LDL‐C Treatment Goals Among Patients with Diabetes(2007‐2010)*
Casagrande SS, et al. Diabetes Care. 2013;36;2271‐2279.
*Data from the National Health and Nutrition Examination Survey, 2007‐2010.N=4926 adults (≥20 years) with self‐reported diabetes.BP=blood pressure; LDL‐C=low density lipoprotein cholesterol.

Organizing Care to Achieve Treatment Goals • The ADA recommends prioritizing timely and appropriate treatment intensification of lifestyle and/or drug therapy for patients who have not achieved BP, lipid, or glucose goals
• Strategies include
• Explicit goal setting with patients
• Identifying and addressing barriers to care
• Integrating evidence‐based guidelines
• Incorporating care management teams
American Diabetes Association. Diabetes Care. 2017;40(suppl 1):S1‐S135.

ADA Recommendations for When Goals Are Not Met: Adherence• Address issues related to patient adherence
• Barriers to adherence may include• Patient factors (eg, remembering to obtain or take medications, fears, depression, and health beliefs)
• Medication factors (eg, regimen complexity, multiple daily dosing, cost, side effects)
• Simplifying a complex treatment regimen may improve adherence
• System factors (eg, inadequate follow‐up and support)
American Diabetes Association. Diabetes Care. 2016;39 (Suppl. 1): S1‐S2.

Considering the Patient’s Perspective
?
?
? ?
??
?
Don’t those drugs have bad side effects?
What if my therapy fails?
Why is lowering blood glucose so
important?
What happens if I forget to take my medicine?
Do I need to use a needle to get my insulin?
I don’t feel bad…why do I
have to take any medicine?
How long do I have to take these drugs?
Patient‐Centered Care
• You as provider or managed care expert:• You are the expert on diabetes information, treatments, algorithms, etc• Large amount of information you know on chronic diseases
• This will not help if the patient doesn’t know or won’t do it• Patient
• I follow the advice of my HCP, but I may trust my neighbor more than my HCP• I have a disease that is called “chronic”—I live with it everyday• No one knows me better than me• I already have most of the answers, but I may not have made the connection• Am I being non‐adherent? Or is it a choice—something I am missing
• Finding common language, common ground, and partnering with your patients to succeed to “make the connections”

Strategies for Improving Diabetes Care:A Patient‐Centered Approach• “...providing care that is respectful of and responsive to individual patient preferences, needs, and values, ensuring that patient values guide clinical decisions”
• Underlying principles• Evidence‐based care individualized based on disease characteristics and patient needs, goals and values
• Encourages shared decision‐making
• Provides coordinated, multidisciplinary care
• Continuity of care across the life span
Inzucchi SE, et al. Diabetes Care. 2015;38:140–149.
Convenient access
Focus on wellness and
disease prevention
Support and resources for self‐care
Performance improvement
Coordinated care
Personalized care plans
PATIENT

Patient‐Provider Interactions are Key to Individualizing Care
Ideal Provider Behaviors
• Active listening
• Negotiation‐motivational interviewing
• Provides information when needed or in response to a question
Ideal Patient Behaviors
• Actively engaged
• Provides his/her perspective
• Willing to contribute to the decision‐making process
Patient‐Provider Interactions are Key to Individualizing Care
Joint decisions:• Drug therapy• Glycemic targets
Patient Physician
Ultimate control over:•Lifestyle changes
•Treatment adherence
Consider:How phenotype and patient/ disease characteristics should drive drug choices

Delivering Patient‐Centered Care Through the Medical Home
Ackroyd SA, Wexler DJ. Curr Diab Rep. 2014;14:471.
• Features of the patient‐centered medical home (PCMH) that support better diabetes outcomes
• Diabetes self‐management education
• Team‐based care
• Care coordination/case management
• Specialty providers as members of the care team
• Electronic record capabilities for tracking outcomes and performance improvement

Evidence for the Effectiveness of the PCMH in Diabetes Care is Encouraging
Ackroyd SA, Wexler DJ. Curr Diab Rep. 2014;14:471; Tricco AC, et al. Lancet. 2012;379:2252‐2261.
Ranking of Quality Improvement Strategies for Lowering A1C
Rank Intervention Number of Trials Mean Difference in A1C (95% CI)1 Promotion of self‐management 60 ‐0.57 (‐0.83 to ‐0.31)
2 Team changes 47 ‐0.57 (‐0.71 to ‐0.42)
3 Case management 57 ‐0.50 (‐0.65 to ‐0.36)
4 Patient education 52 ‐0.48 (‐0.61 to ‐0.34)
5 Facilitated relay of clinical data 32 ‐0.46 (‐0.60 to ‐0.33)
6 Electronic patient registry 27 ‐0.42 (‐0.61 to ‐0.24)
7 Patient reminders 21 ‐0.39 (‐0.65 to ‐0.12)
8 Audit and feedback 8 ‐0.26 (‐0.44 to ‐0.08)
9 Clinician education 15 ‐0.19 (‐0.35 to ‐0.03)
10 Clinician reminders 18 ‐0.16 (‐0.31 to ‐0.02)
ALL 120 ‐0.37 (‐0.45 to ‐0.28)

Summary
• Diabetes patients are at increased risk for CV morbidity and mortality
• We are often glucocentric in diabetes, yet 2/3 will die from CVD
• Achieving cardiovascular risk reduction in diabetes patients remains challenging
• Patient‐centered care may help to address barriers to CV risk reduction by increasing patient involvement in the care decision‐making process
• The PCMH provides a venue for increased patient engagement and improved diabetes care delivery