impact cratering - uchicago geoscigeosci.uchicago.edu/~kite/doc/melosh_ch_6.pdf222 6 impact...
TRANSCRIPT

222
6
Impact cratering
the dominant surface features of the Moon are approximately circular
depressions which may be designated by the general term craters hellip
Solution of the origin of the lunar craters is fundamental to the unravel-
ing of the history of the Moon and may shed much light on the history of
the terrestrial planets as well
e M Shoemaker (1962)
Impact craters are the dominant landform on the surface of the Moon Mercury and
many satellites of the giant planets in the outer Solar System the southern hemisphere
of Mars is heavily affected by impact cratering from a planetary perspective the rarity
or absence of impact craters on a planetrsquos surface is the exceptional state one that needs
further explanation such as on the earth Io or europa the process of impact cratering
has touched every aspect of planetary evolution from planetary accretion out of dust or
planetesimals to the course of biological evolution
the importance of impact cratering has been recognized only recently e M Shoemaker
(1928ndash1997) a geologist was one of the irst to recognize the importance of this process
and a major contributor to its elucidation a few older geologists still resist the notion that
important changes in the earthrsquos structure and history are the consequences of extraterres-
trial impact events the decades of lunar and planetary exploration since 1970 have how-
ever brought a new perspective into view one in which it is clear that high-velocity impacts
have at one time or another affected nearly every atom that is part of our planetary system
Impact cratering is crucially important for the accumulation of the planets in the irst place
and has played major roles from the formation of the most ancient planetary landscapes
to the creation and maintenance of the modern regolith of airless bodies In an important
sense impact cratering is the most fundamental geologic process in the Solar System
61 History of impact crater studies
craters were discovered in 1610 when Galileo pointed his irst crude telescope at the Moon
Galileo recognized the raised rims and central peaks of these features but described them
only as circular ldquospotsrdquo on the Moon although Galileo himself did not record an opinion
on how they formed astronomers argued about their origin for the next three centuries
httpswwwcambridgeorgcoreterms httpsdoiorg101017CBO9780511977848007Downloaded from httpswwwcambridgeorgcore University of Chicago on 25 Jan 2017 at 024451 subject to the Cambridge Core terms of use available at
62 Impact crater morphology 223
astronomer J H Schroumlter irst used the word ldquocraterrdquo in a non-genetic sense in 1791 until
the 1930s most astronomers believed the Moonrsquos craters were giant extinct volcanoes the
impact hypothesis proposed sporadically over the centuries did not gain a foothold until
improving knowledge of impact physics showed that even a moderately oblique high-speed
impact produces a circular crater consistent with the observed circularity of nearly all of
the Moonrsquos craters even so many astronomers clung to the volcanic theory until high-
resolution imagery and in situ investigation of the apollo program in the early 1970s irmly
settled the issue in favor of an impact origin for nearly every lunar crater In the current
era spacecraft have initiated the remote study of impact craters on other planets beginning
with Mariner 4rsquos unexpected discovery of craters on Mars on July 15 1965 Since then
craters have been found on almost every other solid body in the Solar System
Meteor crater arizona was the irst terrestrial structure shown unambiguously to be of
impact origin D M Barringer (1860ndash1929) investigated this 1 km diameter crater and its
associated meteoritic iron in detail from 1906 until his death in 1929 after Barringerrsquos work
a large number of small impact structures resembling Meteor crater have been found Impact
structures larger than about 5 km in diameter were irst described as ldquocryptovolcanicrdquo because
they showed signs of violent upheaval but were not associated with the eruption of volcanic
materials J D Boon and c c albritton in 1937 proposed that these structures were really
caused by impacts although inal proof had to wait until the 1960s when the shock-metamor-
phic minerals coesite and stishovite proved that the ries Kessel in Germany and subsequently
many other cryptovolcanic structures are the result of large meteor impacts
finally theoretical and experimental work on the mechanics of cratering began during
World War II and was extensively developed in later years this work was spurred partly
by the need to understand the craters produced by nuclear weapons and partly by the fear
that the ldquometeoroid hazardrdquo to space vehicles would be a major barrier to space explor-
ation computer studies of impact craters were begun in the early 1960s a vigorous and
highly successful experimental program to study the physics of impact was initiated by D
e Gault (1923ndash1999) at naSarsquos ames facility in 1965
these three traditional areas of astronomical crater studies geological investigation of
terrestrial craters and the physics of cratering have blended together in the post-apollo era
traditional boundaries have become blurred as extraterrestrial craters are subjected to direct
geologic investigation the earthrsquos surface is scanned for craters using satellite images and
increasingly powerful computers are used to simulate the formation of both terrestrial and
planetary craters on all size scales the recent proposals that the Moon was created by the
impact of a Mars-sized protoplanet with the proto-earth 45 Gyr ago and that the cretaceous
era was ended by the impact of a 15 km diameter asteroid or comet indicate that the study of
impact craters is far from exhausted and that new results may be expected in the future
62 Impact crater morphology
fresh impact craters can be grossly characterized as ldquocircular rimmed depressionsrdquo
although this description can be applied to all craters independent of size the detailed
httpswwwcambridgeorgcoreterms httpsdoiorg101017CBO9780511977848007Downloaded from httpswwwcambridgeorgcore University of Chicago on 25 Jan 2017 at 024451 subject to the Cambridge Core terms of use available at
Impact cratering224
form of craters varies with size substrate material planet and age craters have been
observed over a range of sizes varying from 01 μm (microcraters irst observed on lunar
rocks brought back by the apollo astronauts) to the more than 2000 km diameter Hellas
Basin on Mars Within this range a common progression of morphologic features with
increasing size has been established although exceptions and special cases are common
621 Simple craters
the classic type of crater is the elegant bowl-shaped form known as a ldquosimple craterrdquo
(figure 61a) this type of crater is common at sizes less than about 15 km diameter on the
Moon and 3 to about 6 km on the earth depending on the substrate rock type the inter-
ior of a simple crater has a smoothly sloping parabolic proile and its rim-to-loor depth is
about 15 of its rim-to-rim diameter the sharp-crested rim stands about 4 of the crater
diameter above the surrounding plain which is blanketed with a mixture of ejecta and deb-
ris scoured from the pre-existing surface for a distance of about one crater diameter from
the rim the thickness of the ejecta falls off as roughly the inverse cube of distance from
the rim the surface of the ejecta blanket is characteristically hummocky with mounds and
hollows alternating in no discernible pattern fields of small secondary craters and bright
rays of highly pulverized ejecta that extend many crater diameters away from the pri-
mary may surround particularly fresh simple craters Meteor crater arizona is a slightly
eroded representative of this class of relatively small craters the loor of simple craters is
underlain by a lens of broken rock ldquobrecciardquo which slid down the inner walls of the crater
shortly following excavation this breccia typically includes representatives from all the
formations intersected by the crater and may contain horizons of melted or highly shocked
rock the thickness of this breccia lens is typically 12 to 13 of the rim-to-loor depth
622 Complex craters
lunar craters larger than about 20 km diameter and terrestrial craters larger than about 3
km have terraced walls central peaks and at larger sizes may have lat interior loors or
internal rings instead of central peaks these craters are believed to have formed by the
collapse of an initially bowl-shaped ldquotransient craterrdquo and because of this these more com-
plicated structures are known as ldquocomplex cratersrdquo (figure 61b) the transition between
simple and complex craters has now been observed on the Moon Mars Mercury and the
earth as well as on some of the icy satellites in the outer Solar System In general the tran-
sition diameter scales as gndash1 where g is the acceleration of gravity at the planetrsquos surface
although the constant in the scaling rule is not the same for icy and rocky bodies this is
consistent with the idea that complex craters form by collapse with icy bodies having
only about 13 the strength of rocky ones the loors of complex craters are covered by
melted and highly shocked debris and melt pools are sometimes seen in depressions in the
surrounding ejecta blanket the surfaces of the terrace blocks tilt outward into the crater
walls and melt pools are also common in the depressions thus formed the most notable
httpswwwcambridgeorgcoreterms httpsdoiorg101017CBO9780511977848007Downloaded from httpswwwcambridgeorgcore University of Chicago on 25 Jan 2017 at 024451 subject to the Cambridge Core terms of use available at
62 Impact crater morphology 225
structural feature of complex craters is the uplift beneath their centers the central peaks
contain material that is pushed upward from the deepest levels excavated by the crater
Study of terrestrial craters has shown that the amount of structural uplift hsu is related to the
inal crater diameter D by
(b)(a)
(d)(c)
figure 61 Impact crater morphology as a function of increasing size (a) Simple crater 25 km
diameter crater linneacute on the Moon (apollo 15 Panometric Photo strip 9353) (b) complex crater with
central peak 102 km diameter crater theophilus on the Moon (apollo 16 Hasselblad photo 0692)
(c) complex crater with internal ring Mercurian craters Strindberg (165 km diameter) to the lower
right and ahmad Baba (115 km) to the upper left (Mariner 10 fDS 150 rectiied) (d) Multiring
basin 620 km diameter (of most prominent ring) orientale basin on the Moon (lroc Wac mosaic
full width of image PIa13225 is 1350 km naSaGSfcaSu)
httpswwwcambridgeorgcoreterms httpsdoiorg101017CBO9780511977848007Downloaded from httpswwwcambridgeorgcore University of Chicago on 25 Jan 2017 at 024451 subject to the Cambridge Core terms of use available at
Impact cratering226
hsu = 006 D11 (61)
where all distances are in kilometers the diameter of the central peak complex is roughly
22 of the inal rim-to-rim crater diameter in craters on all the terrestrial planets
complex craters are shallower than simple craters of equal size and their depth increases
slowly with increasing crater diameter on the Moon the depth of complex craters increases
from about 3 km to only 6 km while crater diameters range from 20 to 400 km rim height
also increases rather slowly with increasing diameter because much of the original rim slides
into the crater bowl as the wall collapses complex craters are thus considerably larger than
the transient crater from which they form estimates suggest that the crater diameter may
increase as much as 60 during collapse a useful scaling relation suggests that the rim-to-
rim diameter of a complex crater is related to the transient crater Dt diameter by
DD
D
t
s c
=minus
1 171 13
0 13
(62)
where Ds-c is the diameter at the simple to complex transition about 32 km on the earth
and 15 km on the Moon
as crater size increases the central peaks characteristic of smaller complex craters give
way to a ring of mountains (figure 61c) this transition takes place at about 140 km diam-
eter on the Moon and about 20 km diameter on the earth again following a gndash1 rule Known
as ldquopeak-ring cratersrdquo the central ring is generally about 05 of the rim-to-rim diameter of
the crater on all the terrestrial planets
the ejecta blankets of complex craters are generally similar to those of simple craters
although radial troughs and ridges replace the ldquohummockyrdquo texture characteristic of simple
craters as size increases fresh complex craters also have well-developed ields of sec-
ondary craters including frequent clusters and ldquoherringbonerdquo chains of closely associated
irregular secondary craters Very fresh craters such as copernicus and tycho on the Moon
have far-lung bright ray systems
623 Multiring basins
the very largest impact structures are characterized by multiple concentric circular scarps
and are hence known as ldquomultiring basinsrdquo the most famous such structure is the 930 km
diameter orientale basin on the Moon (figure 61d) which has at least four nearly com-
plete rings of inward-facing scarps although opinion on the origin of the rings still varies
most investigators feel that the scarps represent circular faults that slipped shortly after
the crater was excavated there is little doubt that multiring basins are caused by impacts
most of them have recognizable ejecta blankets characterized by a radial ridge-and-trough
pattern the ring diameter ratios are often tantalizingly close to multiples of 2 although
no one has yet suggested a convincing reason for this relationship
In contrast to the simplecomplex and central peakinternal ring transitions discussed
above the transition from complex craters to multiring basins is not a simple function of
httpswwwcambridgeorgcoreterms httpsdoiorg101017CBO9780511977848007Downloaded from httpswwwcambridgeorgcore University of Chicago on 25 Jan 2017 at 024451 subject to the Cambridge Core terms of use available at
62 Impact crater morphology 227
gndash1 although multiring basins are common on the Moon where the smallest has a diameter
of 410 km none at all has been recognized on Mercury with its two times larger gravity
even though the largest crater caloris Basin is 1540 km in diameter the situation on Mars
has been confused by erosion but it is dificult to make a case that even the 1200 km diam-
eter argyre Basin is a multiring structure a very different type of multiring basin is found
on Jupiterrsquos satellite callisto where the 4000 km diameter Valhalla basin (figure 62) has
dozens of closely spaced rings that appear to face outward from the basin center another
satellite of Jupiter Ganymede has both Valhalla-type and orientale-type multiring struc-
tures Since gravity evidently does not play a simple role in the complex cratermultiring
basin transition some other factor such as the internal structure of the planet may have to
be invoked to explain the occurrence of multiring basins the formation of such basins is
currently a topic of active research
figure 62 the Valhalla basin on callisto the original impact was within the central bright patch
which is 300 km in diameter and may represent ejecta from a still smaller (now unrecognizable)
crater this central zone is surrounded by an annulus of sinuous ridges which in turn is surrounded
by an annulus of trough-like grabens which can be recognized up to 2000 km from the basin center
Voyager 1 mosaic PIa02277 naSaJPl
httpswwwcambridgeorgcoreterms httpsdoiorg101017CBO9780511977848007Downloaded from httpswwwcambridgeorgcore University of Chicago on 25 Jan 2017 at 024451 subject to the Cambridge Core terms of use available at
Impact cratering228
624 Aberrant crater types
on any planetary surface a few craters can always be found that do not it the simple
sizendashmorphology relation described above these are generally believed to be the result of
unusual conditions of formation in either the impacting body or the planet struck circular
craters with asymmetric ejecta blankets (figure 63) or elliptical craters with ldquobutterly-
wingrdquo ejecta patterns are the result of very low impact angles although moderately oblique
impacts yield circular craters at impact angles less than about 6deg from the horizontal the
inal crater becomes elongated in the direction of light Small apparently concentric cra-
ters or craters with central dimples or mounds on their loors are the result of impacts into
a weak layer underlain by a stronger one the ejecta blankets of some Martian craters
show petal-like low lobes that are believed to indicate the presence of liquid water in the
figure 63 Distinctive asymmetrical ejecta surrounds a 370 m diameter crater on the lunar mare near
the linneacute crater 25deg n 17deg W this pattern is typical of ejecta surrounding a crater formed by an
impact at an angle between 20deg and 45deg from the horizontal the crater itself is still circular but there
is an uprange wedge in which very little ejecta is present Portion of apollo 15 Panometric image
aS15-P-9337
httpswwwcambridgeorgcoreterms httpsdoiorg101017CBO9780511977848007Downloaded from httpswwwcambridgeorgcore University of Chicago on 25 Jan 2017 at 024451 subject to the Cambridge Core terms of use available at
63 Cratering mechanics 229
excavated material craters on Ganymede and callisto have central pits at a diameter where
internal rings would be expected on other bodies the explanation for these pits is still
unknown In spite of these complications however the simple sizendashmorphology relation
described above provides a simple organizing principle into which most impact craters can
be grouped
625 Degraded crater morphology
all crater morphologies are observed in either ldquofreshrdquo pristine landforms or as erosionally
degraded forms the dominant degradational process determines the detailed changes in
crater morphology other impact craters are often the exclusive agent of degradation on
airless bodies like the Moon (although burial by loods of lava can be locally important
there as well) this form of erosion fuels a variety of surface creep (see Section 81 for
more detail) Sharp terrain features such as crater rims are rounded and battered out of
line by smaller impacts crater bowls are gradually illed and slopes become gentler at the
extreme limit craters may fade into invisibility as their place is occupied by large numbers
of overlapping craters Moon mappers have established ldquodegradation classesrdquo for lunar cra-
ters that range from fresh to nearly invisible and depend upon the initial crater size used in
conjunction with crater density data the numbers of craters in different degradation classes
can be used to infer the age and cratering history of a given site for different populations
of impactors
on ancient Mars luvial processes dissected impact craters by gullying and channel for-
mation old craters there were illed with sediment and lava Wind-blown sand and dust ill
small craters on Mars today and erode their rims into crenulated yardang ridges
erosion on earth is so active that craters are among the most rare landforms fluvial
deposition ills in closed depressions such as crater bowls and luvial erosion gullies rims
and quarries away ejecta blankets Many of the craters that are fortunately preserved were
once completely buried preserving them and are only now being exhumed the ries cra-
ter in Germany is an example of this fortunate circumstance Differential erosion of the
various rock units etches out the present morphology of the crater to create its modern
landscape
the varieties of degraded crater morphologies are as diverse as the different agencies of
erosion or deposition recognition of degraded crater forms must thus take the behavior
of each process into account as observers attempt to reconstruct the original structure of
an impact crater
63 Cratering mechanics
the impact of an object moving at many kilometers per second with the surface of a planet
initiates an orderly sequence of events that eventually produces an impact crater although
this is really a continuous process it is convenient to break it up into distinct stages that
are each dominated by different physical processes this division clariies the description
httpswwwcambridgeorgcoreterms httpsdoiorg101017CBO9780511977848007Downloaded from httpswwwcambridgeorgcore University of Chicago on 25 Jan 2017 at 024451 subject to the Cambridge Core terms of use available at
Impact cratering230
of the overall cratering process but it should not be forgotten that the different stages
really grade into one another and that a perfectly clean separation is not possible the most
commonly used division of the impact cratering process is into contact and compression
excavation and modiication
631 Contact and compression
contact and compression is the briefest of the three stages lasting only a few times longer
than the time required for the impacting object (referred to hereafter as the ldquoprojectilerdquo) to
traverse its own diameter tcc asymp L vi where tcc is the duration of contact and compression L
is the projectile diameter and vi is the impact velocity During this stage the projectile irst
contacts the planetrsquos surface (hereafter ldquotargetrdquo) and transfers its energy and momentum
to the underlying rocks the speciic kinetic energy (energy per unit mass frac12 vi2) possessed
by a projectile traveling at even a few kilometers per second is surprisingly large a c
Gifford in 1924 irst realized that the energy per unit mass of a body traveling at 3 kms
is comparable to that of tnt Gifford proposed the ldquoimpact-explosion analogyrdquo which
draws a close parallel between a high-speed impact and an explosion During contact and
compression the projectile plunges into the target generating strong shock waves as the
material of both objects is compressed the strength of these shock waves can be computed
from the Hugoniot equations irst derived by P H Hugoniot in his 1887 thesis that relate
quantities in front of the shock (subscript 0) to quantities behind the shock (no subscript)
ρ ρρ
ρ ρ
( )
( )
U u U
P P u U
E EP P
p
p
minus =minus =
minus =+
minus
0
0 0
00
02
1 1
(63)
In these equations P is pressure ρ is density up is particle velocity behind the shock (the
unshocked material is assumed to be at rest) U is the shock velocity and E is energy per
unit mass these three equations are equivalent to the conservation of mass momentum
and energy respectively across the shock front they hold for all materials but do not pro-
vide enough information to specify the outcome of an impact by themselves the Hugoniot
equations must be supplemented by a fourth equation the equation of state that relates
the pressure to the density and internal energy in each material P = P(ρ E) alternatively
a relation between shock velocity and particle velocity may be speciied U= U(up) Since
this relation is frequently linear it often provides the most convenient equation of state in
impact processes thus
U = c + Sup (64)
where c and S are empirical constants (c is the bulk sound speed and S is a dimension-
less slope) table 61 lists the measured values of c and S for a variety of materials these
httpswwwcambridgeorgcoreterms httpsdoiorg101017CBO9780511977848007Downloaded from httpswwwcambridgeorgcore University of Chicago on 25 Jan 2017 at 024451 subject to the Cambridge Core terms of use available at
63 Cratering mechanics 231
equations can be used to compute the maximum pressure particle velocity shock velocity
etc in an impact
Planar impact approximation a rough estimate of the parameters describing the highest
pressure portion of the contact and compression stage is obtained from the planar impact
approximation (sometimes called the impedance matching solution) which is valid so long
as the lateral dimensions of the projectile are small compared with the distance the shock
has propagated this approximation is thus valid through most of the contact and com-
pression stage a simultaneous solution to the Hugoniot jump equations is obtained in both
the target and projectile by noting that at the interface between the two both the particle
velocity and pressure must be the same in both bodies unfortunately there is no simple
formula for this approximation the simplest expression is for the particle velocity in the
target ut (the particle velocity in the projectile is vi-ut by the velocity matching condition)
which is the solution of a simple quadratic equation
u
B B AC
At = minus + minus2 4
2 (65)
where A B and C are deined as
A S S
B c c S v
C v c S v
t t p p
t t p p p p i
p i p p i
= minus= + += minus +
ρ ρρ ρ ρ
ρ
0 0
0 0 0
0
2
( )
(66)
the subscripts p and t refer to the projectile and target respectively the above equation
can be used in conjunction with the Hugoniot equations and equation of state to obtain
table 61 Linear shock-particle velocity equation of state parameters
Material ρ0 (kgm3) c (kms) S
aluminum 2750 530 137
Basalt 2860 26 162
calcite (carbonate) 2670 380 142
coconino sandstone 2000 15 143
Diabase 3000 448 119
Dry sand 1600 17 131
Granite 2630 368 124
Iron 7680 380 158
Permafrost (water saturated) 1960 251 129
Serpentinite 2800 273 176
Water (25degc) 998 2393 1333
Water Ice (ndash15degc) 915 1317 1526
Data from Melosh (1989)
httpswwwcambridgeorgcoreterms httpsdoiorg101017CBO9780511977848007Downloaded from httpswwwcambridgeorgcore University of Chicago on 25 Jan 2017 at 024451 subject to the Cambridge Core terms of use available at
Impact cratering232
any other quantities of interest thus the pressure behind the shock is given by P = ρot ut
(ct+St ut) the pressures in both the target and projectile are the same by construction of
the solution
as the projectile plunges into the target shock waves propagate both into the projectile
compressing and slowing it and into the target compressing and accelerating it downward
and outward (figure 64) at the interface between target and projectile the material of each
body moves at the same velocity this equals 12 the impact velocity if they are composed
of the same materials (note that in the above equation A = 0 in this case but the numer-
ator also vanishes and the right-hand side of the equation approaches ndashCB which equals
vi 2) the shock wave in the projectile eventually reaches its back (or top) surface When
this happens the pressure is released as the surface of the compressed projectile expands
(a)
540 540
180
180
60
0
0
7 7
20
3333
5060
20
20
50 km
50 km 0
0
170
170
170
170 100100
100
50 km
50 km
33
33
33
100170
300230
230
60
420300300
420
(b)
(c) (d)
t = 033 T t = 099 T
t = 303 T t = 611 T
8
1710
10
27
figure 64 the irst three frames (a to c) illustrate the evolution of shock waves in the contact
and compression stages of the vertical impact of a 464 km diameter iron projectile on a gabbroic
anorthosite target at 15 kms the last frame (d) is a very early phase of the excavation stage Pressure
contours are labeled in GPa and the times given are in multiples of the time that the projectile takes
to pass through its own diameter about 3 s in this case note the change in length scale from frame
to frame
httpswwwcambridgeorgcoreterms httpsdoiorg101017CBO9780511977848007Downloaded from httpswwwcambridgeorgcore University of Chicago on 25 Jan 2017 at 024451 subject to the Cambridge Core terms of use available at
63 Cratering mechanics 233
upward and a wave of pressure relief propagates back downward toward the projectilendash
target interface the contact and compression stage is considered to end when this relief
wave reaches the projectilendashtarget interface at this time the projectile has been compressed
to high pressure often reaching hundreds of gigapascals and upon decompression it may
be in the liquid or gaseous state due to heat deposited in it during the irreversible com-
pression process the projectile generally carries off 50 or less of the total initial energy
if the density and compressibility of the projectile and target material do not differ too
much while the balance of the energy moves into the target this energy will eventually be
expended in opening the crater as well as heating the target the projectilendashtarget interface
at the end of contact and compression is generally less than one projectile diameter L below
the original surface
contact and compression are accompanied by the formation of very high-velocity ldquojetsrdquo
of highly shocked material these jets form where strongly compressed material is close to
a free surface for example near the circle where a spherical projectile contacts a planar tar-
get the jet velocity depends on the angle between the converging surface of the projectile
and target but may exceed the impact velocity by factors as great as 5 Jetting was initially
regarded as a spectacular but not quantitatively important phenomenon in early impact
experiments where the incandescent streaks of jetted material only amounted to about
10 of the projectilersquos mass in vertical impacts However recent work on oblique impacts
indicates that in this case jetting is much more important and that the entire projectile may
participate in a downrange stream of debris that carries much of the original energy and
momentum oblique impacts are still not well understood and more work needs to be done
to clarify the role of jetting early in this process
632 Excavation
During the excavation stage the shock wave created during contact and compression
expands and eventually weakens into an elastic wave while the crater itself is opened by
the much slower ldquoexcavation lowrdquo the duration of this stage is roughly given by the period
of a gravity wave with wavelength equal to the crater diameter D equal to tEX ~ (Dg)12 for
craters whose excavation is dominated by gravity g (this includes craters larger than a few
kilometers in diameter even when excavated in hard rock) thus Meteor crater arizona
was excavated in about 10 s while the 1000 km diameter Imbrium Basin on the Moon took
about 13 minutes to open Shock wave expansion and crater excavation while intimately
linked occur at very different rates and may be usefully considered separately
the high pressure attained during contact and compression is almost uniform over a
volume roughly comparable to the initial dimensions of the projectile a region called the
ldquoisobaric corerdquo However as the shock wave expands away from the impact site the shock
pressure declines as the initial impact energy spreads over an increasingly large volume of
rock and loses energy to heating the target the pressure P in the shock wave as a function
of distance r from the impact site is given roughly by
httpswwwcambridgeorgcoreterms httpsdoiorg101017CBO9780511977848007Downloaded from httpswwwcambridgeorgcore University of Chicago on 25 Jan 2017 at 024451 subject to the Cambridge Core terms of use available at
Impact cratering234
P Pa
r
n
=
0
(67)
where a ( = L2) is the radius of the projectile P0 is the pressure established during con-
tact and compression and the power n is between 2 and 4 depending on the strength
of the shock wave (n is larger at higher pressures ndash a value n = 3 is a good general
average)
Shock metamorphism the shock wave with a release wave immediately following
quickly attains the shape of a hemisphere expanding through the target rocks the high-
shock pressures are conined to the surface of the hemisphere the interior has already
decompressed the shock wave moves very quickly as fast or faster than the speed of
sound between about 6 and 10 kms in most rocks as rocks in the target are overrun by
the shock waves then released to low pressures mineralogical changes take place in the
component minerals at the highest pressures the rocks may melt or even vaporize upon
release as the shock wave weakens high-pressure minerals such as coesite or stishovite
arise from quartz in the target rocks diamonds may be produced from graphite or maske-
lynite from plagioclase Somewhat lower pressures cause pervasive fracturing and ldquoplanar
elementsrdquo in individual crystals Still lower pressures create a characteristic cone-in-cone
fracture called ldquoshatter conesrdquo (figure 65)which are readily recognized in the vicinity of
impact structures Indeed many terrestrial impact structures were irst recognized from
the occurrence of shatter cones table 62 lists a number of well-established shock meta-
morphic changes and the pressures at which they occur
figure 65 Shatter cones from the Spider Structure Western australia formed in mid-Proterozoic
orthoquartzite this cone-in-cone fracture is characteristic of shattering by impact-generated shock
waves the scale bar is 15 cm long (courtesy of George Williams)
httpswwwcambridgeorgcoreterms httpsdoiorg101017CBO9780511977848007Downloaded from httpswwwcambridgeorgcore University of Chicago on 25 Jan 2017 at 024451 subject to the Cambridge Core terms of use available at
63 Cratering mechanics 235
Spallation the expanding shock wave encounters a special condition near the free sur-
face the pressure at the surface must be zero at all times nevertheless a short distance
below the surface the pressure is essentially equal to P deined above this situation results
in a thin layer of surface rocks being thrown upward at very high velocity (the theoret-
ical maximum velocity approaches the impact speed vi) Since the surface rocks are not
compressed to high pressure this results in the ejection of a small quantity of unshocked
or lightly shocked rocks at speeds that may exceed the target planetrsquos escape velocity
although the total quantity of material ejected by this ldquospallrdquo mechanism is probably only
1ndash3 of the total mass excavated from the crater it is particularly important scientiically
as this is probably the origin of the recently discovered meteorites from the Moon and of
the Snc (shergottite nakhlite and chassignite) meteorites which are widely believed to
have been ejected from Mars
Seismic shaking the weakening shock wave eventually degrades into elastic waves
these elastic waves are similar in many respects to the seismic waves produced by an
earthquake although impact-generated waves contain less of the destructive shear-wave
energy than earthquake waves the seismic waves produced by a large impact may have
signiicant effects on the target planet creating jumbled terrains at the antipode of the
impact site if they are focused by internal planetary structures such as a low-velocity core
table 62 Petrographic shock indicators
Material Indicator Pressure (GPa)
tonalite (igneous rock) Shatter cones 2ndash6
Quartz Planar elements and fractures 5ndash35
Stishovite 15ndash40
coesite 30ndash50
Melting 50ndash65()
Plagioclase Planar elements 13ndash30
Maskelynite 30ndash45
Melting 45ndash65()
olivine Planar elements and fractures 5ndash45
ringwoodite 45
recrystallization 45()ndash65()
Melting gt70
clinopyroxene Mechanical twinning 5ndash40()
Majorite 135
Planar elements 30()ndash45
Melting 45()ndash65()
Graphite cubic diamond 13
Hexagonal diamond 70ndash140
Data from Melosh (1989)
httpswwwcambridgeorgcoreterms httpsdoiorg101017CBO9780511977848007Downloaded from httpswwwcambridgeorgcore University of Chicago on 25 Jan 2017 at 024451 subject to the Cambridge Core terms of use available at
Impact cratering236
this effect has been observed opposite caloris Basinon Mercury and opposite Imbrium
and orientale on the Moon the equivalent richter magnitude M caused by an impact of
energy E (= 12 mpvi2) is given approximately by
M = 067 log10 E ndash 587 (68)
Excavation mechanics target material engulfed by the shock wave is released a short
time later upon release the material has a velocity that is only about 15 of the particle vel-
ocity in the shock wave this ldquoresidual velocityrdquo is due to thermodynamic irreversibility in
the shock compression It is this velocity ield that eventually excavates the crater (figure
66) the excavation velocity ield has a characteristic downward-outward-then upward
pattern that moves target material out of the crater ejecting it at angles close to 45deg at the
rim the streamlines of this low cut across the contours of maximum shock pressure so
that material ejected at any time may contain material with a wide range of shock levels
(figure 67) nevertheless the early fast ejecta generally contain a higher proportion of
highly shocked material than the later slower ejecta throughout its growth the crater is
lined with highly shocked often melted target material
Meteoroidimpact
Interferencezone
Shock
Shock Shock
Part
icle
velo
city
Pre
ssure
Excavationflow
Excavationflow
A prime
A prime A prime
A
A A
Ir2 Ir2
figure 66 Illustration of the expanding shock wave and excavation low following a meteorite impact
the contours in the upper part of the igure represent the pressure at some particular time after the
impact the region of high-shock pressure is isolated or ldquodetachedrdquo on an expanding hemispherical
shell the lower graphs show proiles of particle velocity and pressure along the section aaprime the
dashed lines on these graphs show the particle velocity and pressure some time later than those shown
by the solid lines and the solid curves connecting the peaks are portions of the ldquoenvelopesrdquo of peak
particle velocity and peak pressure
httpswwwcambridgeorgcoreterms httpsdoiorg101017CBO9780511977848007Downloaded from httpswwwcambridgeorgcore University of Chicago on 25 Jan 2017 at 024451 subject to the Cambridge Core terms of use available at
63 Cratering mechanics 237
Inside the growing crater vaporized projectile and target may expand rapidly out of the
crater forming a vapor plume that if massive enough may blow aside any surrounding
atmosphere and accelerate to high speed In the impacts of suficiently large and fast pro-
jectiles some of this vapor plume material may even reach escape velocity and leave the
planet incidentally also removing some of the planetrsquos atmosphere Such ldquoimpact erosionrdquo
may have played a role in the early history of the Martian atmosphere even in smaller
impacts the vapor plume may temporarily blow aside the atmosphere opening the way for
widespread ballistic dispersal of melt droplets (tektites) above the atmosphere and perhaps
permitting the formation of lunar-like ejection blankets even on planets with dense atmos-
pheres as has been observed on the Soviet Venera 1516 images of Venus
Crater growth rate the growing crater is at irst hemispherical in shape Its depth
H(t) and diameter D(t) both grow approximately as t04 where t is time after the impact
Hemispherical growth ceases after a time of about (2Ht g)12 where Ht is the inal depth
of the transient crater at this time the crater depth stops increasing (it may even begin
to decrease as collapse begins) but its diameter continues to increase the crater shape
thus becomes a shallow bowl inally attaining a diameter roughly three to four times its
depth at this stage before collapse modiies it the crater is known as a ldquotransientrdquo cra-
ter even simple craters experience some collapse (which produces the breccia lens) so
Fast ejectaVapor
CL
Melt
Maximum pressure contours
Slowerejecta
Ejecta curtain
figure 67 Geometry of the excavation low ield that develops behind the rapidly expanding shock
front which has moved beyond the boundaries of this illustration the lines with arrows indicate
streamtubes along which material lows downward and outward from the crater the streamtubes cut
across the contours of maximum shock pressure showing that material ejected at any given range
from the impact is shocked to a variety of different maximum pressures When material lowing
through a streamtube crosses the initial surface it forms part of the ejecta curtain ejecta emerging
near the impact site travel at high speed whereas ejecta emerging at larger distances travel at slower
velocities
httpswwwcambridgeorgcoreterms httpsdoiorg101017CBO9780511977848007Downloaded from httpswwwcambridgeorgcore University of Chicago on 25 Jan 2017 at 024451 subject to the Cambridge Core terms of use available at
Impact cratering238
that the transient crater is always a brief intermediate stage in geological crater formation
However since most laboratory craters are ldquofrozenrdquo transient craters much of our know-
ledge about crater dimensions refers to the transient stage only and must be modiied for
application to geological craters
Maximum depth of excavation laboratory ield and computer studies of impact craters
have all conirmed that only material lying above about 13 of the transient crater depth (or
about 110 of the diameter) is thrown out of the crater Material deeper than this is simply
pushed downward into the target where its volume is accommodated by deformation of
the surrounding rocks (figure 6 8) thus in sharp contrast to ejecta from volcanic craters
material in the ejecta blankets of impact craters does not sample the full depth of rock inter-
sected by the crater a surprising fact that has led many geologists astray in their estimation
of the nature of the ejected debris
the form of the transient crater produced during the excavation stage may be affected by
such factors as obliquity of the impact (although the impact angle must be less than about
6deg for a noticeably elliptical crater to form at impact velocities in excess of about 4 kms)
the presence of a water table or layers of different strength rock structure joints or initial
topography in the target each of these factors produces its own characteristic changes in
the simple bowl-shaped transient crater form
633 Modiication
Shortly after the excavation low has opened the transient crater and the ejecta has been
launched onto ballistic trajectories a major change takes place in the motion of debris
within and beneath the crater Instead of lowing upward and away from the crater center
the debris comes to a momentary halt then begins to move downward and back toward
the center whence it came this collapse is generally attributed to gravity although elastic
rebound of the underlying compressed rock layers may also play a role the effects of
Impactsite
Melt
Displaced
Transientcrater
VaporizedSpalled
EjectedEjected Hexc
Hat
figure 68 Provenance of material expelled from an impact crater Vaporized material expands
outward in a vapor plume of the remaining material some is ejected and some is displaced out of
the crater and deforms the adjacent rocks uplifting the surface near the rim and downwarping rocks
beneath the crater loor the ejected material is excavated from a maximum depth Hexc that is only
about one-third of the transient crater depth or one-tenth of the transient crater diameter the dashed
lines show the proile of the transient crater
httpswwwcambridgeorgcoreterms httpsdoiorg101017CBO9780511977848007Downloaded from httpswwwcambridgeorgcore University of Chicago on 25 Jan 2017 at 024451 subject to the Cambridge Core terms of use available at
63 Cratering mechanics 239
collapse range from mere debris sliding and drainback in small craters to wholesale alter-
ation of the form of larger craters in which the loors rise central peaks appear and the rims
sink down into wide zones of stepped terraces Great mountain rings or wide central pits
may appear in still larger craters (figure 69)
these different forms of crater collapse begin almost immediately after formation of
the transient crater the timescale of collapse is similar to that of excavation occupying
an interval of a few times (Dg)12 crater collapse and modiication thus take place on
timescales very much shorter than most geologic processes the crater resulting from this
collapse is then subject to the normal geologic processes of gradation isostatic adjustment
inilling by lavas etc on geologic timescales Such processes may eventually result in the
obscuration or even total obliteration of the crater
the effects of collapse depend on the size of the crater for transient craters smaller than
about 15 km diameter on the Moon or about 3 km on the earth modiication entails only
collapse of the relatively steep rim of the crater onto its loor the resulting ldquosimple craterrdquo
(see figure 61a) is a shallow bowl-shaped depression with a rim-to-rim diameter D about
ive times its depth below the rim H In fresh craters the inner rim stands near the angle
of repose about 30deg Drilling in terrestrial craters (figure 610) shows that the crater loor
is underlain by a lens of broken rock (mixed breccia) derived from all of the rock units
intersected by the crater the thickness of this breccia lens is typically 12 the depth of the
crater H Volume conservation suggests that this collapse increases the original diameter
of the crater by about 15 the breccia lens often includes layers and lenses of highly
shocked material mixed with much less-shocked country rock a small volume of shocked
or melted rock is often found at the bottom of the breccia lens
complex craters (figure 61bc) collapse more spectacularly Walls slump the loor is
stratigraphically uplifted central peaks or peak rings rise in the center and the loor is
overlain by a thick layer of highly shocked impact melt (figure 611) the detailed mech-
anism of collapse is still not fully understood because straightforward use of standard rock
mechanics models does not predict the type of collapse observed (see Box 81) the current
best description of complex crater collapse utilizes a phenomenological strength model in
which the material around the crater is approximated as a Bingham luid a material that
responds elastically up to differential stresses of about 3 MPa independent of overburden
pressure and then lows as a viscous luid with viscosity of the order of 1 GPa-s at larger
stresses In a large collapsing crater the walls slump along discrete faults forming terraces
whose widths are controlled by the Bingham strength and the loor rises controlled by the
viscosity until the differential stresses fall below the 3 MPa strength limit a central peak
may rise and then collapse again in large craters forming the observed internal ring (or
rings) figure 69 illustrates this process schematically the rock in the vicinity of a large
impact may display such an unusual low law because of the locally strong shaking driven
by the large amount of seismic energy deposited by the impact
the mechanics of the collapse that produces multiring basins (figure 61d) is even
less well understood figure 612 illustrates the structure of the orientale basin on the
Moon with a highly vertically exaggerated cross section derived from both geological and
httpswwwcambridgeorgcoreterms httpsdoiorg101017CBO9780511977848007Downloaded from httpswwwcambridgeorgcore University of Chicago on 25 Jan 2017 at 024451 subject to the Cambridge Core terms of use available at
Excavation andbeginning of uplift
Central uplift andrim collapse
Final crater
Excavation andbeginning of uplift
Central upliftovershoots stability
Peak ring crater
(a) (b)
figure 69 Illustration of the formation of complex craters of either (a) central peak morphology or (b) peak ring morphology uplift of the crater loor
begins even before the rim is fully formed as the loor rises further rim collapse creates a wreath of terraces surrounding the crater In smaller craters
the central uplift ldquofreezesrdquo to form a central peak In larger craters the central peak collapses and creates a peak ring before motion ceases
httpsdoiorg101017CBO9780511977848007Downloaded from httpswwwcambridgeorgcore University of Chicago on 25 Jan 2017 at 024451 subject to the Cambridge Core terms of use available at httpswwwcambridgeorgcoreterms
63 Cratering mechanics 241
geophysical data note the ring scarps are interpreted as inward-dipping faults above a pro-
nounced mantle uplift beneath the basinrsquos center one idea that is currently gaining ground
is that the ring scarps are normal faults that develop as the crust surrounding a large crater
is pulled inward by the low of underlying viscous mantle material toward the crater cavity
(figure 613) an important aspect of this low is that it must be conined in a low-viscosity
channel by more viscous material below otherwise the low simply uplifts the crater loor
and radial faults instead of ring scarps are the result Special structural conditions are thus
needed in the planet for multiring basins to form on its surface so that a gndash1 dependence for
the transition from complex craters to multiring basins is not expected (or observed) this
Original plane
Sediments
Brecciated ampfractured gneiss
Shocked gneiss
Presentsurface
Breccias
Highly mixed partly melt
Mixed with glassy melt fragments
Slightly mixed weakly shocked
Slightly mixed generally unshocked
Basal breccia
Melt
0 05 km
figure 610 Geologic cross section of the 34 km diameter Brent crater in ontario canada although
the rim has been eroded away Brent is a typical simple crater that forms in crystalline rocks a small
melt pool occurs at the bottom of the breccia lens and more highly shocked rocks occur near its top
Terrace zone Terrace zone
Inner ring Inner ringCrater rim Crater rim
km
km
3
3
2
2
1
100
Incipientcentraluplift
Suevite
figure 611 Geologic cross section of the 22 km diameter ries crater in Germany Drilling and
geophysical data suggest that this is a peak ring crater Its central basin is illed with suevite a
mixture of highly shocked and melted rocks and cold clasts
httpswwwcambridgeorgcoreterms httpsdoiorg101017CBO9780511977848007Downloaded from httpswwwcambridgeorgcore University of Chicago on 25 Jan 2017 at 024451 subject to the Cambridge Core terms of use available at
Impact cratering242
Box 61 Maxwellrsquos Z model of crater excavation
the details of the excavation low can be determined only by experiment or by elaborate
numerical computations even such numerical work may have dificulty in correctly computing
the inal dimensions of the transient crater However in 1973 D Maxwell and K Seifert
proposed a simple analytical model of excavation low (Maxwell 1977) this model gives
a useful kinematic although not dynamic description of the cratering low ield like all
approximate models it should not be used to determine ine details
Maxwell and Seifert noted that in explosion cratering computations the radial component
of the excavation low velocity ur usually falls as a simple inverse power of distance r from the
explosive charge
u
t
rr Z
= α ( )
(B611)
where α(t) is a function of time and describes the strength of the low while Z is a
dimensionless power
the incompressibility of the excavation low nabla bull u = 0 requires that the angular component
of the low velocity uθ in polar coordinates (r θ) is
u Z urθ
θθ
= minus+
( )sin
cos2
1 (B612)
the geometry of the velocity ield deined by this model seen in figure 6B1 is remarkably
similar to that computed in both explosion and impact cratering events Z 3 the equation of
streamlines in polar coordinates is
r r Z= minus minus
0
1
21( cos )θ
(B613)
where r0 is a constant that is different for each streamline It is equal to the radius at which the
streamline emerges from the surface (θ = 90deg) taking r0 = Dat2 the radius of the transient
crater the maximum depth of excavation Hexc is
H
DZ Zat
Z
Zexc = minus minus
minusminus
22 1
1
2( )( )
(B614)
for Z = 3 the maximum depth of excavation Hexc = Dat8 or about one-third of the inal
transient crater depth
the total mass ejected from a crater described by the Z model Mej is a fraction of the total
mass displaced from the transient crater Me
M
Z
ZMej e= minus
minus2
1
(B615)
the Z model also predicts that the vertical and horizontal velocity components uV and uH of
the ejecta launched at a distance s along the surface from the impact point are
u s
u Z u
VZ
H V
== minus
α
( )2
(B616)
httpswwwcambridgeorgcoreterms httpsdoiorg101017CBO9780511977848007Downloaded from httpswwwcambridgeorgcore University of Chicago on 25 Jan 2017 at 024451 subject to the Cambridge Core terms of use available at
63 Cratering mechanics 243
or that the angle of ejection is φ = tanminus1 (Z minus 2) equal to 45deg for Z = 3
the Z-model presented thus far is a kinematical model useful for describing the form of
the excavation low Maxwell and Seifert attempted to give it more dynamical content by
computing the function α(t) in equation (B611) this function gives the strength of the low
at any particular time Its value is different for each streamtube in the low It is estimated by
using energy conservation in each of these streamtubes neglecting interactions with adjacent
tubes thus the sum of the kinetic gravitational and distortional energies is found in each
streamtube at some initial time the total energy in each streamtube is conserved as the low
progresses However the kinetic energy declines at the expense of the gravitational and
distortional energies so that the net low velocity declines unfortunately this aspect of the
Z model has not worked out well in practice the actual course of the excavation low is best
determined through detailed dynamical models
the Z-model described here can be (and has been) improved and extended in several ways
one of the most straightforward is to move the source of the low r = 0 from the surface to
some depth below the surface taking into account the depth of the effective center of the shock
wave (croft 1980) other workers have attempted to reine Maxwell and Siefertrsquos methods of
estimating energies in the streamtubes the Z-model however is fundamentally limited by its
neglect of interactions between the streamtubes for this reason it can never become an exact
description of the cratering low however accurately the dynamics within a single streamtube
is represented
In spite of all its faults the Z-model gives a reasonably accurate representation of the gross
geometric features of the cratering low and can even be used to predict some irst-order
dynamical properties It has the unfortunate feature of not being a truly dynamical model
so that further reinements are not necessarily closer approximations to the full dynamical
equations of motion nevertheless the excellent properties of this model are probably still far
from being fully exploited
Box 61 (cont)
z = 2 z = 3 z = 4
634deg45deg
θr
figure B61
httpswwwcambridgeorgcoreterms httpsdoiorg101017CBO9780511977848007Downloaded from httpswwwcambridgeorgcore University of Chicago on 25 Jan 2017 at 024451 subject to the Cambridge Core terms of use available at
Impact cratering244
theory is capable of explaining both the lunar-type and Valhalla-type multiring basins as
expressions of different lithosphere thicknesses
64 Ejecta deposits
a deposit of debris ejected from the crater interior surrounds essentially all impact craters
the only exceptions are craters on steeply sloping surfaces or on satellites with too little grav-
ity to retain the ejecta or too much porosity to produce it this ejecta deposit is thickest at the
crater rim and thins with increasing distance outwards Where this deposit is recognizably
continuous near the crater it is called an ldquoejecta blanketrdquo ejecta beyond the edge of the con-
tinuous deposit are thin and patchy Secondary craters occur in this zone and beyond it figure
614 shows the ejecta blanket of the 30-km diameter lunar crater timocharis the pre-existing
1 - Inner basin ring
2 - Inner rock
3 - Rook
4 - Cordillera
5 - Questionable ring
0
1 2 3 4 5 N
200 400 600 800 km
Crustdensity = 2900 kgm3
Mantle
Density = 3400 kgm3
S10
0
ndash10
ndash30
ndash20
ndash40
Depth
km
ndash50
ndash60
ndash70
ndash80
Prebasin rocks(highly brecciated
toward basincenter)
Heveliusformation(ejecta)
Rockmaterial
(slumps)
Crackledfloor material(impact melt)
Marebasalt
figure 612 Geologic and geophysical structure of the orientale basin on the Moon one of the
freshest and best-studied multiring basins a dense mantle uplift underlies the center of the basin
the crustal thinning above the uplift is due to the ejection of about 40 km of crustal material from the
crater that formed the basin the great ring scarps shown in cross-section formed during collapse of
the crater note the 10X vertical exaggeration necessary to show the ring scarps
httpswwwcambridgeorgcoreterms httpsdoiorg101017CBO9780511977848007Downloaded from httpswwwcambridgeorgcore University of Chicago on 25 Jan 2017 at 024451 subject to the Cambridge Core terms of use available at
64 Ejecta deposits 245
terrain within about one crater radius of the rim is buried and mostly obliterated by the con-
tinuous ejecta blanket light patches show where thinner deposits overlie the mare surface
the thickness of the ejecta deposit varies greatly with direction away from the rim
azimuthal thickness variations at the same radius can be as large as ten to one the ejecta
is concentrated into rays that often are observed to form at angles of about 30deg to one
another However it is also true that at a given azimuth the thickness falls rapidly and sys-
tematically with distance away from the crater center compilation of many data sets from
both impact and explosion craters shows that the thickness δ(r) as a function of radius r
away from the crater center is given by an approximate inverse cube relation
δ ( ) ( )
r f Rr
R=
minus plusmn3 0 5
(69)
where R is the radius of the crater rim Integration of this relation indicates that most
of the mass of the ejecta is located near the crater rim according to the approximate
ldquoSchroumlterrsquos rulerdquo the volume of the ejecta is approximately equal to the volume of the crater
bowl although this rule seems to make a great deal of sense (however it does ignore the
increase in volume of the ejected material due to fragmentation) it is unveriiable in practice
because the original ground surface can seldom be located with adequate precision
(a)
(b)
(c)
Fluid
Fluid
Elastic
Elastic
Elastic-plastichalf-space
figure 613 the ring tectonic theory of multiring basin formation (a) shows the formation of a normal
complex crater on a planet with uniform rheology (b) shows the inward-directed low in a more luid
asthenosphere underlying a lithosphere of thickness comparable to the crater depth and the resulting
scarps (c) shows a Valhalla-type basin developing around a crater formed in a very thin lithosphere
httpswwwcambridgeorgcoreterms httpsdoiorg101017CBO9780511977848007Downloaded from httpswwwcambridgeorgcore University of Chicago on 25 Jan 2017 at 024451 subject to the Cambridge Core terms of use available at
Impact cratering246
the rims of many fresh craters are littered with blocks of rock ejected from beneath
the crater compilations of data show that block size generally decreases as a function
of distance from the rim the maximum size of block observed on the rim of a crater
is related to the size of the crater itself and an empirical relation that holds over a wide
range of crater sizes relates the mass of the largest ejected fragment mf to the total mass
ejected from the crater Me If both masses are expressed in kilograms this relation is
m Mf e= 0 8 0 8
(610)
641 Ballistic sedimentation
the ejecta deposited around an impact crater on an airless planet are emplaced ballistically
that is ejecta are thrown from the crater with some initial velocity follow a nearly para-
bolic trajectory above the planetrsquos surface then fall back to the surface striking with the
figure 614 near-vertical view of the 30 km diameter lunar crater timocharis the ejecta deposits
are dunelike near the crater rim but grade into a subradial facies beyond about 2 R from the craterrsquos
center Secondary craters occur at greater distances a pattern of bright material surrounding the
crater indicates the presence of ejecta too thin to greatly modify the pre-existing terrain at this scale
apollo 15 photo aS15ndash1005
httpswwwcambridgeorgcoreterms httpsdoiorg101017CBO9780511977848007Downloaded from httpswwwcambridgeorgcore University of Chicago on 25 Jan 2017 at 024451 subject to the Cambridge Core terms of use available at
64 Ejecta deposits 247
same velocity as on ejection Some interaction may occur between ejecta fragments in the
denser parts of the ejecta curtain but the general motion is dominated by ballistics alone
the ground surface around the crater is profoundly affected by the ejecta as it lands and its
interaction with this falling debris determines the character of the ejecta deposits of large
craters
the debris ejected from an impact crater travels together in the form of an ldquoejecta
curtainrdquo although each fragment follows a parabolic trajectory the times and velocities
of ejection from the crater are organized so that most of the debris lies on the surface of
an expanding inverted cone figure 615 illustrates the parabolic trajectories of a number
6
5
4
3
Altitude units o
f cra
ter
radiu
s
2
1
1 3
Range units of crater radiusCE
4 5 6 7 8 9 10
0
7
T
15T
2T
25T
figure 615 the debris ejected from an impact crater follows ballistic trajectories from its launch
position within the inal crater (the rim of the inal crater is located at a range equal to one crater
radius) the innermost ejecta are launched irst and travel fastest following the steepest trajectories
shown in the igure ejecta originating farther from the center are launched later and move more
slowly falling nearer the crater rim Because of the relationship between position time and velocity
of ejection the debris forms an inverted cone that sweeps outward across the target this debris
curtain is shown at four separate times during its light at 1 15 2 and 25 Tf where Tf is the crater
formation time (Dg)12 coarser less-shocked debris travels near the base of the curtain whereas
the fast highly shocked ejecta fraction tends to travel near the top the three lower igures show
details of the pre-existing ground surface when the ejecta curtain arrives as the range increases the
ejecta strike with progressively larger velocities incorporating larger amounts of surface material and
imparting a larger net horizontal velocity
httpswwwcambridgeorgcoreterms httpsdoiorg101017CBO9780511977848007Downloaded from httpswwwcambridgeorgcore University of Chicago on 25 Jan 2017 at 024451 subject to the Cambridge Core terms of use available at
Impact cratering248
of fragments from an impact crater the positions of these fragments at several times are
indicated at any one time the debris lies on the surface of a cone that makes an angle
of about 45deg with the ground surface this cone sweeps rapidly outward from the crater
rim Debris from the curtain strikes the ground at its base impacting irst near the crater
rim then at greater distances as time progresses the size of the ejecta fragments near the
base of the ejecta curtain is expected to be larger than the fragments higher in the curtain
and the proportion of highly shocked fragments and glass increases with height in the
curtain
Ballistically emplaced debris falling near the crater rim strikes with a low velocity
because it travels only a short distance at the rim itself this velocity is so low that rock
units may retain some coherence and produce an overturned lap with inverted stratigraphy
eugene Shoemaker irst recognized such overturned beds at Meteor crater arizona at
greater distances from the crater rim the debris strikes with a higher velocity When this
velocity is large enough surface material is eroded and mixes with the debris the falling
ejecta also possess a radially outward velocity component although the vertical velocity
is cancelled when the debris strikes the surface the mixture of debris and surface material
retains its outward momentum (see the lower inserts in figure 615) this mixture moves
rapidly outward as a ground-hugging low of rock debris similar in many ways to the
low of a large dry-rock avalanche Depositional features such as dunes ridges and radial
troughs indicative of high-speed low may result from this motion the deposit itself con-
sists of an intimate mixture of primary crater ejecta and of secondary material scoured
from the pre-existing ground surface
642 Fluidized ejecta blankets
the ejecta blankets of impact craters on Mars are dramatically different from those on the
Moon or Mercury Martian craters smaller than about 5 km in diameter closely resemble
their counterparts on the Moon However craters between 5 and 15 km in diameter have
a single ejecta sheet that extends about one crater radius from the rim and ends in a low
concentric ridge or outward-facing escarpment these are called ldquorampart cratersrdquo from
the continuous ridge surrounding the ejecta deposit the ejecta of most craters larger than
15 km in diameter are divided into petal-like lobes that extend two or more radii from the
rim (figure 616) approximately twice as far as the continuous ejecta deposits of lunar or
Mercurian craters a few large craters with lunar-type ejecta blankets are known but they
are rare Many Martian craters have abnormally large central peaks and other internal col-
lapse structures compared with lunar or Mercurian craters also suggesting the presence
of some luidizing agent peculiar to Mars
the luidized ejecta blankets of Martian craters appear to have been emplaced as
thin ground-hugging lows When impeded by topographic obstacles that could not
be overridden the lows are delected and either spread out elsewhere or pond against
the obstacle ejecta lobes fail to overtop low hills and mesas that are only a few times
httpswwwcambridgeorgcoreterms httpsdoiorg101017CBO9780511977848007Downloaded from httpswwwcambridgeorgcore University of Chicago on 25 Jan 2017 at 024451 subject to the Cambridge Core terms of use available at
64 Ejecta deposits 249
higher than the low thickness itself suggesting that the lobe could not have traveled as
dispersed clouds of the base-surge type nor were they emplaced by ballistic sedimen-
tation because the ejecta curtain should have fallen on the topographic obstacle from
above
the peculiar form of Martian ejecta blankets is generally attributed to the presence of
liquid water in the substrate ejected along with subsurface material liquid water mixed
into the ejecta would greatly enhance the mobility of the debris converting the dry frag-
mental ejecta lows characteristic of lunar craters to luid debris lows similar to terres-
trial mudlows nevertheless not all Mars researchers agree with this interpretation and
an alternative viewpoint attributes at least part of the mobility of these lows to interaction
with the thin atmosphere of Mars
figure 616 the 19 km diameter crater yuty on Mars is surrounded by thin petaloid low lobes
that extend approximately twice as far from the crater as the continuous ejecta deposits of lunar or
Mercurian craters Viking orbiter frame 3a07
httpswwwcambridgeorgcoreterms httpsdoiorg101017CBO9780511977848007Downloaded from httpswwwcambridgeorgcore University of Chicago on 25 Jan 2017 at 024451 subject to the Cambridge Core terms of use available at
Impact cratering250
643 Secondary craters
numerous secondary impact craters variously occurring either singly or in loops clusters
and lines surround large impact craters figure 617 shows the secondary crater ield around
the crater Gratteri on Mars as revealed by the tHeMIS thermal mapper recognizable sec-
ondary craters extend from just beyond the continuous ejecta blanket out to distances of up
to thousands of kilometers from their source crater close to the primary crater secondary
craters are produced by relatively low-velocity impacts and are thus irregular in shape
shallow and obviously clustered and are often separated by V-shaped dunes known as the
ldquoherringbone patternrdquo farther from the primary impact velocities are larger and secondary
craters are more dispersed which makes them dificult to discriminate from small primary
craters
an important controversy is presently raging about the importance of secondary craters
in masking the primary lux If a majority of the small craters (less than a few 100 m diam-
eter) on a planetrsquos surface are secondary then ages assigned to cratered surfaces based on the
figure 617 night-time Ir thermal image of the 69 km diameter Martian crater Gratteri located
at 178deg S 202deg e the dark streaks are created by secondary impact craters that extend up to 500
km from the crater center In images of this type dark regions are cold and emit little Ir radiation
because they have low thermal inertia indicating that the streaks are composed of ine-grained
material compared to their surroundings the overall image measures 545 x 533 km across tHeMIS
image courtesy of Phil christensen naSaJPlaSu See also color plate section
httpswwwcambridgeorgcoreterms httpsdoiorg101017CBO9780511977848007Downloaded from httpswwwcambridgeorgcore University of Chicago on 25 Jan 2017 at 024451 subject to the Cambridge Core terms of use available at
65 Scaling of crater dimensions 251
assumption that the craters are primary will be too great on the other hand many experienced
crater counters claim that they can exclude secondary craters because they are clustered a
claim that is disputed by other experts at the moment there is no consensus on this problem
the maximum size of secondary craters is approximately 4 of the primary diameter
on the Moon Mars and elsewhere However on Mercury obvious secondary craters are
apparently several times larger this observation is at odds with the larger impact velocity
on Mercury which is expected to result in smaller ejected fragments not larger ones Is
the crust of Mercury somehow stronger than that of the Moon or Mars at the moment the
solution to this conundrum is unknown
644 Oblique impact
although high-velocity impact craters are circular down to very low angles of approach
the pattern of the ejecta may betray impact obliquity at angles as large as 45deg the irst sign
of an oblique impact is an asymmetric but still bilaterally symmetrical ejecta blanket the
ejecta in the uprange direction are thinner and less extensive than those in the downrange
direction at impact angles near 45deg at impact angles near 30deg an uprange wedge free
of ejecta develops an example of which is shown in figure 63 as the angle decreases
still farther to 10deg ejecta-free regions appear in both downrange and uprange directions
although bright streaks may extend downrange in very fresh craters at such low angles
the crater itself becomes elliptical with its long axis parallel to the light direction of the
projectile at these highly oblique angles the projectile essentially plows a furrow into the
target surface throwing ejecta out to both sides to form a ldquobutterly-wingrdquo pattern
65 Scaling of crater dimensions
one of the most frequently asked questions about an impact crater is ldquoHow big was the
meteorite that made the craterrdquo like many simple questions this has no simple answer It
should be obvious that the crater size depends upon the meteoritersquos speed size and angle
of entry It also depends on such factors as the meteoritersquos composition the material and
composition of the target surface gravity presence or absence of an atmosphere etc the
question of the original size of the meteorite is usually unanswerable because the speed
and angle of impact are seldom known the inverse question of how large a crater will be
produced by a given-sized meteorite with known speed and incidence angle is in principle
much simpler to answer However even this prediction is uncertain because there is no
observational or experimental data on the formative conditions of impact craters larger than
a few tens of meters in diameter while the impact structures of geologic interest range up
to 1000 km in diameter the traditional escape from this dificulty is to extrapolate beyond
experimental knowledge by means of scaling laws
c W lampson who studied the craters produced by tnt explosions of different sizes
introduced the irst scaling law in 1950 lampson found that the craters were similar to
httpswwwcambridgeorgcoreterms httpsdoiorg101017CBO9780511977848007Downloaded from httpswwwcambridgeorgcore University of Chicago on 25 Jan 2017 at 024451 subject to the Cambridge Core terms of use available at
Impact cratering252
one another if all dimensions (depth diameter depth of charge placement) were divided
by the cube root of the explosive energy W thus if the diameter D of a crater produced
by an explosive energy W is wanted it can be computed from the diameter D0 of a crater
produced by a smaller explosive energy W0 using the proportion
D
D
W
W0 0
1 3
=
(611)
an exactly similar proportion may be written for the crater depth H this means that
the ratio of depth to diameter HD is independent of yield a prediction that agrees rea-
sonably well with observation In more recent work on large explosions the exponent 13
in this equation has been modiied to 134 to account for the effects of gravity on crater
formation
although impacts and explosions have many similarities a number of factors make them
dificult to compare in detail thus explosion craters are very sensitive to the chargersquos
depth of burial although this quantity is well deined for explosions there is no simple
analog for impact craters Similarly the angle of impact has no analog for explosions
nevertheless energy-based scaling laws were very popular in the older impact literature
perhaps partly because nothing better existed and many empirical schemes were devised
to adapt the well-established explosion scaling laws to impacts
651 Crater diameter scaling
this situation has changed rapidly in the last few decades however thanks to more impact
cratering experiments speciically designed to test scaling laws It has been shown that
the great expansion of the crater during excavation tends to decouple the parameters
describing the inal crater from the parameters describing the projectile If these sets of
parameters are related by a single dimensional ldquocoupling parameterrdquo (as seems to be the
case) then it can be shown that crater parameters and projectile parameters are related by
power-law scaling expressions with constant coeficients and exponents although this is
a somewhat complex and rapidly changing subject the best current scaling relation for
impact craters forming in competent rock (low-porosity) targets whose growth is limited
by gravity rather than target strength (ie all craters larger than a few kilometers in diam-
eter) is given by
D L v gtc
p
t
i=
minus1 161
1 3
0 78 0 44 0 22 1 3 sin
ρρ
θ
(612)
where Dtc is the diameter of the transient crater at the level of the original ground surface
ρp and ρt are densities of the projectile and target respectively g is surface gravity L is
projectile diameter vi is impact velocity and θ is the angle of impact from the horizontal
all quantities are in SI units
httpswwwcambridgeorgcoreterms httpsdoiorg101017CBO9780511977848007Downloaded from httpswwwcambridgeorgcore University of Chicago on 25 Jan 2017 at 024451 subject to the Cambridge Core terms of use available at
65 Scaling of crater dimensions 253
the transient crater depth Htc appears to be a constant times the diameter Dtc although
a few investigations have reported a weak velocity dependence for this ratio the experi-
mental situation is not yet clear
652 Impact melt mass
the amount of material melted or vaporized by an impact is a strong function of the impact
velocity itself the melt mass depends principally upon the velocity and mass of the pro-
jectile but does not depend upon the gravitational acceleration of the target body Very little
melt is produced until a threshold velocity of about 12 kms is reached once this threshold
is exceeded the mass of melt Mm is given in terms of the mass of the projectile Mp as
M
M
vvm
p
i
m
i= ge0 25 122
sin ε
θ kms
(613)
where εm is the speciic internal energy of the rankinendashHugoniot state from which isen-
tropic decompression ends at the 1 bar point on the liquidus It is equal to 52 MJkg for
granite which can be taken to be representative of crustal rocks
although the mass of melt does not depend on the gravitational acceleration of the planet
the crater size does through equation (612) the volume of the melt relative to the volume
Melted
Melted
Melted
Vaporized
Vaporized
Vaporized
Dat = 10 km
Dat = 100 km
Dat = 1000 km
figure 618 the different scaling laws for crater diameter and melt or vapor volume imply that as the
crater diameter increases the volume of melted or vaporized material may approach the volume of
the crater itself this igure is constructed for impacts at 35 kms on the earth
httpswwwcambridgeorgcoreterms httpsdoiorg101017CBO9780511977848007Downloaded from httpswwwcambridgeorgcore University of Chicago on 25 Jan 2017 at 024451 subject to the Cambridge Core terms of use available at
Impact cratering254
of the crater is relatively small for small craters but as the crater size increases it becomes
a progressively larger fraction of the total crater volume as shown in figure 618 at some
suficiently large diameter (about 1000 km on the earth) the volume of the melt equals the
volume of the crater itself and substantial changes in the morphology of the crater can be
expected although these changes are not well understood at the present time
66 Atmospheric interactions
as fast-moving meteoroids enter the atmosphere of a planet they are slowed by friction
with the atmospheric gases and compressed by the deceleration Small meteoroids are
often vaporized by frictional heating and never reach the surface of the planet larger
meteoroids are decelerated to terminal velocity and fall relatively gently to the surface of
the planet the diameter of a meteorite that loses 90 of its initial velocity in the atmos-
phere is typically about 1 m for earth and 60 m for Venus However this assumes that the
projectile reaches the surface intact whereas in fact aerodynamic stresses may crush all
but the strongest meteorites once fractured the fragments of an incoming meteorite travel
slightly separate paths and strike the surface some distance apart from one another this
phenomenon gives rise to the widely observed strewn ields of meteorites or craters on the
earth which average roughly a kilometer or two in diameter on Venus clusters of small
craters attributed to atmospheric breakup are spread over areas roughly 20 km in diameter
rather surprisingly clusters of small craters are also observed on Mars where the spread of
small craters in a cluster averages only a few tens of meters to hundreds of meters across
the aerodynamic crushing stress experienced by an incoming meteoroid is of the order
of the stagnation pressure given by
Pstagnation asymp ρ av2 (614)
where ρa is the density of the atmosphere through which the meteoroid is traveling and v
is the relative velocity of the meteoroid and atmosphere evidently even the thin Martian
atmosphere is enough to fracture and partially disperse weak incoming meteoroids
It can be shown that the dispersion of a cluster of fragments is a maximum when breakup
occurs at twice the atmospheric scale height Hs In this case the expected dispersion ΔY is
given by
ΔYHs a
p
asymp2
sinθρρ
(615)
where θ is the angle of entry of the meteoroid with respect to the horizontal and ρp is its
density Because the scale heights of the atmospheres of the earth Venus and Mars are all
similar the dispersion of clusters of fragments is expected to be roughly a factor of ten dif-
ferent among these bodies increasing from Mars to earth to Venus as observed
the atmospheric blast wave and thermal radiation produced by an entering meteorite
may also affect the surface the 1908 explosion at tunguska river Siberia was probably
httpswwwcambridgeorgcoreterms httpsdoiorg101017CBO9780511977848007Downloaded from httpswwwcambridgeorgcore University of Chicago on 25 Jan 2017 at 024451 subject to the Cambridge Core terms of use available at
67 Cratered landscapes 255
produced by the entry and dispersion of a 30 to 50 m diameter stony meteorite that leveled
and scorched about 2000 km2 of meter-diameter trees radar-dark ldquosplotchesrdquo up to 50 km
in diameter on the surface of Venus are attributed to pulverization of surface rocks by strong
blast waves from meteorites that were fragmented and dispersed in the dense atmosphere
67 Cratered landscapes
Impact craters have been treated as individual entities in the preceding sections However
as spacecraft images abundantly illustrate the surfaces of most planets and satellites are
figure 619 oblique view of a heavily cratered landscape on the Moon this area is to the northeast
of crater tsiolkovskiy on the Moonrsquos farside the large crater near the center is about 75 km in
diameter but craters as small as a few tens of meters in diameter can be discerned in the foreground
apollo 17 photo 155ndash23702 (H)
httpswwwcambridgeorgcoreterms httpsdoiorg101017CBO9780511977848007Downloaded from httpswwwcambridgeorgcore University of Chicago on 25 Jan 2017 at 024451 subject to the Cambridge Core terms of use available at
Impact cratering256
scarred by vast numbers of impact craters that range in size from the limit of resolution to a
substantial fraction of the planetrsquos or satellitersquos radius In some places impact craters are the
dominant landform little of the observed topography can be ascribed to any other process
(see figure 619) craters on such a surface exhibit degrees of preservation ranging from
fresh craters with crisp rims and bright rays to heavily battered or buried craters that may
only betray their presence by a broken rim segment or a ragged ring of peaks
the present crater population on surfaces such as the lunar highlands or the more lightly
cratered lunar mare is the outcome of a long history of impact cratering events analysis
of the existing crater population in conjunction with some assumptions about the rate of
crater formation may reveal a great deal about the geologic history of a surface a typical
population is composed of craters with a wide range of sizes some of which are relatively
fresh with sharp rims extensive rays and crisp ields of small secondary craters whereas
others are progressively more degraded on parts of such airless bodies as the Moon the
principal agent of degradation is other impacts producing a surface that appears to be
crowded with craters In other regions volcanism has created plains that are more or less
sparsely cratered elsewhere in the Solar System the activities of wind water or tectonic
processes such as subduction erase craters within a short time of their formation leading to
landscapes like the earthrsquos where impact craters are among the rarest of landforms or like
that of Venus where the low abundance of craters may be due to an ancient era of resur-
facing that obliterated most pre-existing craters
Study of crater populations is thus a powerful tool for geologic investigation of the sur-
faces of other planets and satellites If the lux and size distribution of the impacting bodies
were known studies of crater populations could yield absolute ages of the surface and
some of its features although the original lux is often unknown relative ages can usually
be obtained Before geologic inferences can be drawn from crater populations however
we must have an effective means of describing and comparing them unfortunately a large
number of descriptions have evolved over the years as each group of scientists studying
a particular problem created their own specialized means of presenting population data
making it dificult to compare the results of different groups In this section I adopt the
major recommendations of a naSa panel convened in 1978 (naSa 1978) to standardize
the presentation of crater population data
671 Description of crater populations
the irst step in an investigation of the crater population on a given surface is to select
an area that is believed to have had a homogeneous geologic history It would make little
sense for example to combine the crater population of a sparsely cratered lava plain with
that of a densely cratered upland once such an area is selected the craters that lie within
it are counted Most crater population studies include all recognizable craters regardless
of their state of degradation Where a large enough population exists more specialized
studies may be performed in which the numbers of fresh craters slightly degraded craters
degraded craters etc are counted separately although these studies leave some room for
httpswwwcambridgeorgcoreterms httpsdoiorg101017CBO9780511977848007Downloaded from httpswwwcambridgeorgcore University of Chicago on 25 Jan 2017 at 024451 subject to the Cambridge Core terms of use available at
67 Cratered landscapes 257
interpretation as to what a ldquorecognizablerdquo or ldquofreshrdquo crater is intercomparison of results
between different groups of crater counters has generally shown good agreement
craters occur in a wide variety of sizes so that the principal information about a cra-
ter population is the number of craters per unit area as a function of crater diameter It is
presumed that impact cratering is a random process and that there is no signiicance to the
particular location of craters within the selected area so that only data on the number and
diameter of craters is kept
Incremental distribution numerous ways of representing the number of craters as a
function of diameter have been developed one very simple method is to list the number
N of craters per unit area with diameters between two limits say between Da and Db the
problem with this method is that the resulting number of craters depends upon the interval
ΔD = Db ndash Da and different crater counters may choose different intervals furthermore if
the interval ΔD is ixed at say 1 km this might be convenient for craters with diameters
between 5 and 20 km but would be too large for craters with diameters less than 1 km and
too small for craters larger than 100 km a simple way to overcome this problem is to let
the interval depend on crater size thus the number of craters may be tabulated between
D and 2D where the intervals increase in octaves actually this binning has been found
to be too coarse in practice so that most such incremental size-frequency distributions
use an interval of D to 2D the incremental distribution still suffers however from the
arbitrary choice of a starting diameter D It is now recommended that the bins be chosen so
that one bin boundary is at D = 1 km
Cumulative distribution although the incremental size-frequency distribution could be
successful if the same bin sizes and boundaries are universally adopted it lacks funda-
mental simplicity another distribution has long been used that is independent of bin size
this is the cumulative size-frequency distribution In this distribution the number Ncum of
craters per unit area with diameters greater than or equal to a given diameter D is tabulated
not only is the resulting distribution Ncum(D) independent of bin size but any desired incre-
mental distribution can be easily generated from it since the number of craters N per unit
area in the interval between Da and Db is simply
N(Da Db) = Ncum(Da) minus Ncum(Db) (616)
where Dbgt Da N(DaDb) is necessarily positive or zero by the deinition of the cumula-
tive number distribution the only disadvantage of the cumulative distribution is that the
cumulative number of craters at some given diameter depends upon the number of craters
at all larger diameters although this is rarely a major problem cumulative distributions in
limited-diameter intervals (often controlled by the size of the region being analyzed) have
to be adjusted in overall value to join with the distributions from other diameter ranges the
slope of the cumulative plot is not of course affected by such adjustments
It has been found in practice that the cumulative number distribution closely approxi-
mates a power function of diameter
Ncum = c Dminusb (617)
httpswwwcambridgeorgcoreterms httpsdoiorg101017CBO9780511977848007Downloaded from httpswwwcambridgeorgcore University of Chicago on 25 Jan 2017 at 024451 subject to the Cambridge Core terms of use available at
Impact cratering258
where b = 18 for post-mare craters on the Moon between 4 and several hundred kilometers in
diameter (and within the limited data also seems to hold for impact craters on the earth)
It is intriguing that the power b is close to 2 a power 2 in equation (617) is a kind of
ldquomagicrdquo number because when b = 2 the coeficient c is dimensionless (remember Ncum
is number per unit area) there is no fundamental length or size scale in a crater popula-
tion with this power law so that such a population looks the same at all resolutions (see
figure 620 for an illustration of such a distribution) It is impossible to tell from a photo-
graph of such a cratered landscape whether the scale of the photograph is 100 km or 1 m
(of course other clues than crater population alone may give a hint about the actual scale)
a population of craters described by a power near 2 might arise either from a simple for-
mation process in which there is truly no fundamental length scale or from a series of inde-
pendent processes that are so complex and chaotic that no one scale dominates
Because the cumulative number distribution of equation (617) falls as a power of D it is
conventional to graph such distributions on a log-log plot on which a power law is a straight
line with slope equal to ndashb (figure 621) unfortunately cumulative number distributions plot-
ted in this way have a tendency to look all the same apparently differing only in the absolute
number density of craters although this may be adequate or even desirable for some purposes
figure 620 a population of craters with a slope of b = 2 is structured such that for each crater of
diameter D there are four times as many craters of diameter D2 and 16 times as many as for diameter
D4 When mixed together the population looks very much like that seen on the heavily cratered
areas of the Moon and other planets note that the total area in each size class of this distribution is
the same a characteristic that may explain why such distributions are so common when formed by
either coagulation or impact fragmentation ndash processes that both depend on surface area
httpswwwcambridgeorgcoreterms httpsdoiorg101017CBO9780511977848007Downloaded from httpswwwcambridgeorgcore University of Chicago on 25 Jan 2017 at 024451 subject to the Cambridge Core terms of use available at
10ndash4(a)
Geom
etric saturation
Small crater equilibrium
= 7 N
S
10ndash6
10ndash8
10ndash10
Cum
ula
tive
num
ber
ge D
m
2
10ndash12
10ndash14
10ndash16
101 102
300 m
4 k
m
103 104
Crater diameter D m
105 106
101
100
312
10ndash1R
(b)
10ndash2
10ndash3
101 102 103
Crater diameter m
300 m
4 k
m
Geometric saturation
Small crater equilibrium R = 022
104 105 106
figure 621 the post-mare crater population on the Moon in both a cumulative plot (a) and r-plot (b)
format the population shows three distinct segments at small diameters (D lt 300 m) the population
is in equilibrium and the cumulative number is proportional to Dndash2 r is constant for this population
at intermediate diameters (300 m lt D lt 4 km) the cumulative number is proportional to Dndash34
whereas at larger diameters (D gt 4 km) it falls as Dndash18 the curves are dashed at the largest diameters
(D gt 200 km) because no craters of this size have yet formed on the mare the changes in slope of
the crater population are especially evident in the r-plot format the dashed line labeled ldquogeometric
saturationrdquo is an upper limit to the crater density on any surface after Melosh (1989 figure 102)
httpswwwcambridgeorgcoreterms httpsdoiorg101017CBO9780511977848007Downloaded from httpswwwcambridgeorgcore University of Chicago on 25 Jan 2017 at 024451 subject to the Cambridge Core terms of use available at
Impact cratering260
such a mode of presentation obscures slight but signiicant differences in crater populations
Since these differences can be useful in deciphering the source of the crater population or other
geologic processes that acted on it another type of plot is in common use
The R plot this type of plot exploits the close approach of b to 2 in equation (617) by
graphing essentially the ratio between the actual crater distribution and a distribution with
slope ndash2 a crater population in which the actual slope is minus2 would thus plot as a hori-
zontal line the conventional plot of this type is called an r plot (r stands for ldquorelativerdquo)
It is based on an incremental distribution with 2 intervals between diameter bins note
that the slope of this type of incremental plot is the same as the cumulative distribution of
equation (617) although the coeficient is different It is easy to show that if b is constant
over the interval D to 2D then the incremental number density is
N D D c Db b( ) ( ) 2 1 2 2= minus minus minus
(618)
the deinition of the r plot includes several numerical factors In terms of the cumula-
tive number distribution it is given by
r D D N D N D( ) ( ) ( )
equivminus
minus
2
2 12
3 42
cum cum
(619)
figure 621 compares the cumulative and r plots for pose-mare craters on the Moon
a useful interpretation of r is to note that up to a factor of 365 r is equal to the fraction
fc(D) of the total area covered by craters in the diameter interval D to 2D
r(D) = 365 fc(D) (620)
where both r and fc are dimensionless numbers With this interpretation it is easy to see
that in a crater population with b = 2 for which r and fc are constant craters in every size
interval occupy the same fraction of the total area If b lt 2 as it is for post-mare craters on
the moon r(D) increases as D increases so that large craters occupy a larger fraction of
the surface than small craters If b gt 2 small craters occupy a larger fraction of the surface
than do large ones
The production population the impact of the primary meteoroid lux on a planetary
surface results in some deinite rate of crater production as a function of diameter as
the surface initially taken to be craterless ages more and more craters accumulate on it
the integral of the crater-production rate over the age of the surface is a special theoret-
ical crater population called the production population the production population is the
size-frequency distribution of all the craters excluding secondary craters that have ever
formed since craters began to accumulate on the surface the population is theoretical in
the sense that it neglects all crater-obliteration processes and is hence formally unobserv-
able although the crater population on lightly cratered surfaces may approach the produc-
tion population closely enough for practical applications
the production population is a useful concept for the study of the evolution of crater pop-
ulations Such studies usually begin with an assumed or inferred production population and
httpswwwcambridgeorgcoreterms httpsdoiorg101017CBO9780511977848007Downloaded from httpswwwcambridgeorgcore University of Chicago on 25 Jan 2017 at 024451 subject to the Cambridge Core terms of use available at
67 Cratered landscapes 261
then postulate a model of crater obliteration that will it is hoped result in a predicted crater
population that matches the observed population the crater-obliteration model is a function
of the process being modeled In the next section we shall consider only the process of crater
obliteration by other craters as we shall see this can be a surprisingly complex process
672 Evolution of crater populations
Given the fact that craters accumulate randomly on the surface of a planet at a rate that is
on average constant it should be possible to begin with a knowledge of the rate at which
craters form as a function of their size and then predict the crater population at any future
time furthermore it should be possible within certain limits to invert an evolved crater
population and deduce both how long it has been accumulating (that is the age of the sur-
face) and the rate of crater formation as a function of size
Simple as these propositions may seem there has been great dificulty in actually imple-
menting them the main problem is the interaction between craters of different sizes the
formation of a single large crater on a surface may obliterate many smaller craters while it
takes many small craters to batter a large crater beyond recognition It has taken many years
to fully understand the effects of this interaction on crater populations and some aspects of
it are not completely understood today
the conceptually simplest population is one in which all craters are the same diameter
although no natural examples of such a population are known the study of its evolution
introduces several important concepts Moreover there are crater populations such as that
on Mimas in which many of the craters fall within a relatively narrow size range and that
may therefore be approximated by a population of craters all of the same size
Time
Observed
Producti
on
teq
EquilibriumC
rate
rsu
nit a
rea
Ns
Neq
Geometric saturation
figure 622 evolution of a crater population in which all craters are the same size the graph shows
how the crater density increases as a function of time although the production population rises
linearly with time the number of craters that can be counted on the surface eventually reaches a
limit well below the geometric saturation limit once the population has reached equilibrium each
additional crater obliterates on average one old crater
httpswwwcambridgeorgcoreterms httpsdoiorg101017CBO9780511977848007Downloaded from httpswwwcambridgeorgcore University of Chicago on 25 Jan 2017 at 024451 subject to the Cambridge Core terms of use available at
Impact cratering262
The equilibrium population the evolution of this crater population is illustrated in
figure 622 as a function of time the plot shows that the observed crater population and
the production population initially increase at the same rate However as the density of
craters on the surface increases a few older craters are either overlapped by new ones or are
buried by their ejecta as this process continues some older craters are completely oblit-
erated by younger craters and the observed crater density falls below the production line
eventually the crater density becomes so high that each new crater that forms obliterates
on average one older crater at this stage the crater population has reached equilibrium no
further increase in crater density is possible although new craters continue to form and the
production population increases steadily in number
the attainment of equilibrium places severe constraints on attempts to date planetary
surfaces by crater counting up until equilibrium is attained at time teq in figure 622 the
crater density increases with the age of the surface so that knowledge of the crater produc-
tion rate permits computation of an absolute age from the crater density even if the pro-
duction rate is not known the relative ages of two surfaces may be obtained by comparing
their crater densities However once equilibrium is attained the crater density becomes
constant and only a lower limit on the age can be obtained the relative ages of two sur-
faces in equilibrium are also completely unconstrained since their crater densities are iden-
tical even though the surfaces may be widely different in age
Geometric saturation a useful concept introduced by Don Gault in 1981 (Project 1981)
is that of geometric saturation the idea is to deine a crater density that serves as an upper
limit to the number of craters that can possibly be recognized on a heavily cratered surface
for a population of craters all of the same size this limit is simply the number of craters
per unit area in a hexagonally closest packed coniguration neglecting any possibility of
obliteration by overlapping ejecta blankets In this case Ns = 115 Dminus2 the deinition of a
limiting crater density when craters are of different sizes is less objective Gault proposed
the limit
Ncs = 154 Dminus2 (621)
this crater density corresponds to r = 312 or a fractional area coverage fc = 085
these limits are shown in figure 621 It is clear that lunar crater populations fall well
short of this limiting density although the mare surface is apparently in equilibrium for
crater diameters less than about 300 m the crater density on even the most heavily cra-
tered surfaces seldom reaches more than about 3ndash5 of the geometric saturation limit
equation (621)
68 Dating planetary surfaces with impact craters
It has long been recognized that the number of impact craters per unit area could date
planetary surfaces Shoemaker et al (1963) who wrote the classic paper on this subject
realized that relative dates on the same planet could always be attained but absolute dates
require knowledge of the lux of impacting bodies
httpswwwcambridgeorgcoreterms httpsdoiorg101017CBO9780511977848007Downloaded from httpswwwcambridgeorgcore University of Chicago on 25 Jan 2017 at 024451 subject to the Cambridge Core terms of use available at
68 Dating planetary surfaces with impact craters 263
a full understanding of how to interpret crater populations as a function of size has been
long in coming the attainment of equilibrium by crater populations divides into two dis-
tinct cases (and a trivial intermediate) the irst and simplest case occurs when the pro-
duction population has a slope b steeper than 2 this case was studied by Gault (1970) and
offers the fewest conceptual dificulties unfortunately this distribution is only appropriate
for small (le300 m) craters on the lunar mare (see figure 621) although at the time Gault
performed his analysis it was believed to be valid for all crater sizes the size-frequency
distribution of larger lunar craters follows a power law with a slope b = l8 this distribu-
tion its the second case of an evolving population with slope b smaller than 2 and will be
treated shortly
681 b gt 2 population evolution
figure 623 illustrates the evolution of a production population with slope b steeper than
2 the left frame depicts the population at an early time t1 and the right frame is at a later
time t2 Because the production population is steeper than the geometric saturation line
mutual obliteration must occur for suficiently small craters (craters smaller than Deq(t1)
in figure 623) no matter how early the time unless of course the population has had
so little time to evolve that the statistics of small numbers of craters begins to play a role
Because the actual crater density cannot reach the geometric saturation limit the observ-
able crater density reaches equilibrium somewhere below this line the difference in the
Time t1
Log diameter
Time t2
Deq (t1) Deq (t2)
Log c
um
ula
tive
fre
quency
Observed
Observed
Equilibrium Equilibrium
Geom
etric saturation
Geometric saturation
Pro
ductio
n
Pro
ductio
n
figure 623 evolution of a crater population with slope b gt 2 the production population exceeds
the equilibrium line at small crater diameters Small craters are thus in equilibrium up to some
diameter Deq above which the observed population follows the production population the left panel
illustrates the population at a relatively early time tl and the right panel shows how the population has
changed at a later time t2 the equilibrium diameter Deq increases as a function of time although this
increase is generally not linear
httpswwwcambridgeorgcoreterms httpsdoiorg101017CBO9780511977848007Downloaded from httpswwwcambridgeorgcore University of Chicago on 25 Jan 2017 at 024451 subject to the Cambridge Core terms of use available at
Impact cratering264
number of craters between the projected production population and the observed popu-
lation is equal to the number of craters obliterated by later impacts It seems intuitively
reasonable that the equilibrium population should follow a line parallel to but below the
geometric saturation distribution Gault showed empirically in small-scale impact experi-
ments (figure 624) that this is the case and subsequent work has conirmed this result
both analytically (Soderblom 1970) and by Monte carlo computer simulations (Woronow
1977) In Gaultrsquos experiments the crater equilibrium density depends on the slope b of
the production population with steeper slopes giving a lower equilibrium crater density
Similar results were also obtained from the theoretical studies
the observed population at any one time in figure 623 is thus composed of two
branches Small craters follow an equilibrium line with slope b = 2 larger craters follow
the steeper production population curve the inlection point between these two curves is
at diameter Deq(t1) where the production curve crosses the equilibrium line the right-hand
figure 624 a laboratory-scale demonstration of the concept of crater equilibrium the photographs
are of a box 25 m square illed 30 cm deep with quartz sand the sand is topped with 2 cm of
carborundum powder to provide a color contrast Six sizes of projectile were ired into the box at
random locations simulating a production population with a slope index b = 33 similar to that of
small craters on the Moon time increases from the upper left horizontally to lower right equilibrium
is attained about halfway through the simulation although individual surface details vary from
frame to frame the crater population in the later frames remains the same from Gault (1970) photo
courtesy of r Greeley
httpswwwcambridgeorgcoreterms httpsdoiorg101017CBO9780511977848007Downloaded from httpswwwcambridgeorgcore University of Chicago on 25 Jan 2017 at 024451 subject to the Cambridge Core terms of use available at
68 Dating planetary surfaces with impact craters 265
frame in figure 623 shows the crater density at a later time the crater population is quali-
tatively similar to that at the earlier time except that the transition diameter Deq(t2) is larger
If the rate at which craters accumulate is constant (that is c in equation (617) is a linear
function of time) it is easy to show that the transition diameter Deq(t) grows as (time)1(bndash2)
conversely if the crater production rate slope b and the present Deq are known the age of
the surface can be computed
682 b lt 2 population evolution
figure 625 illustrates the evolution of a crater population with slope b less than 2 note that
in the unlikely event that b exactly equals 2 the observed crater density simply maintains
the slope of 2 until the density reaches equilibrium (which occurs simultaneously at all
diameters) after which the observed crater density remains constant and the slope remains
2 When b is less than 2 the situation is more complex In this case the production curve
exceeds the geometric saturation line at the large-diameter end of the scale Gaultrsquos (1970)
model could not deal with this situation and it took nearly 15 years before the implications
of this large-diameter crossing were understood in spite of the developing knowledge that
b ~ 18 for craters more than about 4 km in diameter on the lunar mare the situation was
Log diameter
1
Study area
Log c
um
ula
tive
fre
quencyu
nit a
rea
Observed
Geom
etric saturation
Production
figure 625 evolution of a crater population with slope b lt 2 the production population exceeds the
geometric saturation line at large diameters under these circumstances the evolution of the population
is dominated by large impacts that allow a number of small craters to accumulate before wiping the
surface clean the observed population line is always parallel to the production population but may
lie considerably below it the production population line is dashed at the large-crater end because
there must be at least one crater within the study area for the line to be meaningful the observed
population may approach geometric saturation if the entire study area is the site of one large impact
but the population will be dominated by luctuations because of the statistics of small numbers
httpswwwcambridgeorgcoreterms httpsdoiorg101017CBO9780511977848007Downloaded from httpswwwcambridgeorgcore University of Chicago on 25 Jan 2017 at 024451 subject to the Cambridge Core terms of use available at
Impact cratering266
resolved by c r chapman (chapman and McKinnon 1986) who performed a Monte
carlo simulation of crater population evolution that included a wider range of diameters
than had previously been possible
chapman realized that irst of all the large-diameter end of the cratering curve is domi-
nated by the statistics of small numbers even though the production curve apparently
crosses the geometric saturation line at all times enough time must pass after the formation
of the initial uncratered surface that at least one large crater has formed on it the crossing
of the two curves makes little sense unless the cumulative number of craters larger than Ds
is at least 1 in the inite area under study Since the probability of a small impact is larger
than the probability of a large impact for any b gt 0 a population of small craters initially
develops that follows the production curve closely eventually however a large impact
occurs With b lt 2 there is a high probability that this large crater obliterates all or a signii-
cant fraction of the study area wiping out nearly all previous smaller craters the number
of observed craters thus suddenly drops below the production curve as time passes small
craters again accumulate on the surface the slope of this new population is equal to that of
the production curve but as shown in figure 625 the cumulative number of such craters
is smaller than the production population the number of small craters continues to grow
until the next large impact wipes the slate clean once more
under these circumstances there is no ldquoequilibriumrdquo population although the observed
crater density is always well below the geometric saturation limit the observed crater
density luctuates widely and irregularly controlled by the large rare catastrophic-impact
events In spite of these wide variations in density the slope of the observed population at
any given time is roughly equal to that of the production population the crater densities
on a surface of this type are spatially patchy being low at the sites of recent large impacts
and high in areas that have not been struck for a long time by one of the large impacts
Dating such a surface is nearly impossible after the irst large impact unless some area can
be found that has escaped all large impacts In practice all that can be determined from
the crater density on such a surface is the date since the last large impact that affected the
particular study region
683 Leadingtrailing asymmetry
an important assumption in the relative dating of planetary surfaces is that the cratering
rate is uniform over the entire body although this is true to a high degree of approximation
for most bodies in the Solar System it may be badly violated for synchronously locked
planets and moons our Moon and the Galilean satellites of Jupiter circulate about their
primary with the same face always leading Just as a car driving into a rainstorm encounters
more raindrops on its front windscreen then on the back window the impact lux on syn-
chronous satellites is higher on the leading side than the trailing side leading to an asym-
metry in cratering rate that may be as large as a factor of 20 or more depending on the
cratering population (Zahnle et al 2001) the degree of asymmetry depends on the orbits
of the impactors the asymmetry is largest for impactors in orbit about the same primary
httpswwwcambridgeorgcoreterms httpsdoiorg101017CBO9780511977848007Downloaded from httpswwwcambridgeorgcore University of Chicago on 25 Jan 2017 at 024451 subject to the Cambridge Core terms of use available at
69 Impact cratering and planetary evolution 267
or moving at a low relative velocity In this case the impact velocity on the leading hemi-
sphere is the sum of the orbital velocities of the satellite and impactor while the velocity on
the trailing hemisphere is the difference so that not only is the lux of impactors different
between the leading and trailing hemispheres but the different impact velocities mean that
the same size of impactor yields a different size of inal crater the leadingtrailing asym-
metry is smaller for heliocentric populations of impactors comets for example produce
much more uniform crater populations than co-orbiting objects on synchronous satellites
neptunersquos moon triton has a large leadingtrailing crater asymmetry but the Galilean
satellites of Jupiter show much less crater asymmetry than expected on theoretical grounds
Some process must therefore occasionally reorient their surfaces relative to Jupiter either
an exchange of their primary-facing and opposite hemispheres due to exchange of their A
and B moments of inertia by internal or external (cratering) mass transfers or perhaps the
momentum impulse of a large cratering event
69 Impact cratering and planetary evolution
over the last few decades it has become increasingly clear that impact cratering has played
a major role in the formation and subsequent history of the planets and their satellites
aside from their scientiic interest impact craters have also achieved a modest economic
importance as it has become recognized that the fabulously rich Sudbury nickel deposit
in ontario canada is a tectonically distorted 140-km diameter impact crater Similarly
the Vredefort structure in South africa is a large old impact crater oil production has
been achieved from a number of buried impact craters such as the 10-km diameter red
Wing creek crater in the Williston Basin and the 32-km diameter newporte structure in
north Dakota on a more homely level the 60-km diameter ring-shaped depression in the
Manicouagan crater in eastern Quebec is currently used as a reservoir supplying water to
new york city
691 Planetary accretion
Modern theories of planetary origin suggest that the planets and the Sun formed simul-
taneously 46 times 109 yr ago from a dusty hydrogen-rich nebula nebular condensation and
hydrodynamic interactions were probably only capable of producing ca 10-km diameter
ldquoplanetesimalsrdquo that accreted into planetary-scale objects by means of collisions the time-
scale for accretion of the inner planets by mutual collisions is currently believed to be
between a few tens and one hundred million years Initially rather gentle these collisions
became more violent as the random velocities of the smaller planetesimals were increased
during close approaches to the larger bodies the mean random velocity of a swarm of
planetesimals is comparable to the escape velocity of the largest object so as the growing
planetary embryos reached lunar size collisions began to occur at several kilometers per
second at such speeds impacts among the smaller objects were disruptive whereas the
larger objects had suficient gravitational binding energy to accrete most of the material
httpswwwcambridgeorgcoreterms httpsdoiorg101017CBO9780511977848007Downloaded from httpswwwcambridgeorgcore University of Chicago on 25 Jan 2017 at 024451 subject to the Cambridge Core terms of use available at
Impact cratering268
log D
log M
log A
log N
cum
log D
log D
M = Crdquo D
slope = 1
slope = 0
A = Crsquo
slope = ndash2
Ncum = C Dndash2
(a) (b)
(c)
figure 626 the numerical foundation of impact catastrophism the size-frequency distribution of
a typical crater population with slope b = 2 is shown in panel (a) In any such distribution there are
many more small craters than large ones Panel (b) shows the area of craters as a function of diameter
this distribution is lat the total area of small craters and large craters is equal (refer back to figure
620) Panel (c) shows however that the mass is concentrated at the large-size scale so that despite
the overwhelming numerical superiority of small craters the few large ones are the most important
in terms of either mass or energy delivered
that struck them Infalling planetesimals bring not only mass but also heat to the growing
planets In the past it was believed that the temperature inside a growing planet increased
in a regular way from near zero at the center to large values at the outside relecting the
increase in collision velocity as the planet became more massive However it now seems
probable that the size distribution of the planetesimal population was more evenly graded
between large and small objects and that each growing planetary embryo was subjected
to many collisions with bodies comparable in size to the embryo itself Such catastrophic
collisions would deposit heat deep within the core of the impacted body wiping out any
regular law for temperature increase with increasing radius and making the thermal evolu-
tion of growing planets rather stochastic
692 Impact catastrophism
although small craters (and the impactors that created them) are overwhelmingly more
abundant than large ones in terms of numbers the characteristic b asymp 2 slope of most such
httpswwwcambridgeorgcoreterms httpsdoiorg101017CBO9780511977848007Downloaded from httpswwwcambridgeorgcore University of Chicago on 25 Jan 2017 at 024451 subject to the Cambridge Core terms of use available at
69 Impact cratering and planetary evolution 269
distributions in the Solar System implies that most of the mass actually resides at the large
end of the size spectrum (see figure 626) this circumstance gives rise to the idea of
impact catastrophism although small impacts are relatively common all of the small
impacts combined do less geologic work than a few large impacts this is the formal def-
inition of a catastrophic process and it is a good description of the way that impacts affect
the geological evolution of the planets It also implies that stochastic processes cannot be
neglected where impacts play a role except in situations where b is substantially larger
than 2 such as for the ShoemakerndashGault theory of regolith evolution on the Moon
note that the usual statistical mechanical idea of energy equipartition does not play a
role in the Solar System the dynamics of the Solar System are such that the time to relax
to a state of thermal equilibrium is far far longer than the age of the Solar System so that
the biggest most massive objects also carry the most energy
693 Origin of the Moon
the origin of the Moon is now attributed to a collision between the proto-earth and a Mars-
size protoplanet near the end of accretion 45 times 109 yr ago this theory has supplanted the
three classic theories of lunar origin (capture ission and co-accretion) because only the
giant impact theory provides a simple explanation for the Moonrsquos chemistry as revealed
in the lunar rocks returned by apollo one view of this process is that a grazing collision
vaporized a large quantity of the proto-earthrsquos mantle along with a comparable quantity of
the projectile While most of the mass of the projectile merged with the earth (incidentally
strongly heating the earth If the earth was not molten before this impact it almost certainly
was afterward) one or two lunar masses of vapor condensed into dust in stable Keplerian
orbits about the earth and then later accumulated together to form the Moon
694 Late Heavy Bombardment
Sometime after the Moon formed and before about 38 times 109 yr ago the inner planets and
their satellites were subjected to the ldquolate Heavy Bombardmentrdquo an era during which the
impact luxes were orders of magnitude larger than at present the crater scars of this period
are preserved in the lunar highlands and the most ancient terrains of Mars and Mercury a
it to the lunar crater densities using age data from apollo samples gives a cumulative crater
density through geologic time of
Ncum (D gt 4 km) = 268 times 10minus5 [T + 457 times 10minus7 (eλT minus 1)] (622)
where Ncum(D gt 4 km) is the cumulative crater density (craterskm2) of craters larger than
4 km diameter T is the age of the surface in Gyr (T=0 is the present) and λ = 453 Gyrndash1
the current cratering rate on the moon is about 27 times 10ndash14 craters with D gt 4 kmkm2yr
on the earth the cratering rate has been estimated to be about 18 times 10ndash15 craters with
D gt 226 kmkm2yr which is comparable to the lunar lux taking into account the dif-
ferent minimum sizes since the cumulative number of craters Ncum(D) ~ Dndash18 there is
httpswwwcambridgeorgcoreterms httpsdoiorg101017CBO9780511977848007Downloaded from httpswwwcambridgeorgcore University of Chicago on 25 Jan 2017 at 024451 subject to the Cambridge Core terms of use available at
Impact cratering270
currently much debate about these cratering rates which might be uncertain by as much
as a factor of 2
although equation (622) describes an impact lux that decreases monotonically with
time there is currently much debate about the possible reality of an era of ldquoheavy bombard-
mentrdquo between about 42 and 39 Gyr ago in which the cratering rate reached a local peak
(Strom et al 2005) It is now supposed that eccentric asteroids from the main asteroid belt
caused this peak in lux these asteroids were mobilized as destabilizing orbital resonances
swept through the asteroid belt when Jupiter and Saturn underwent an episode of planetary
migration the heavily cratered surfaces of the Moon and terrestrial planets are supposed
to have formed at this time the intense lux obliterated any evidence of an earlier surface
on these bodies
the cratering rates on Mars and Venus are believed to be comparable to that on the earth
and Moon however the exact fraction of the earthMoon rate is presently uncertain and
a subject of controversial discussion the exact rates will probably remain unknown until
radiometric dates on cratered surfaces are determined by means of sample returns from
these bodies cratering rates in the outer Solar System are even more uncertain and con-
troversial Most of the craters on the satellites of Jupiter and Saturn are probably formed
by comets whose lux is very uncertain at the small sizes represented by most observed
craters (Dones et al 2009)
the high cratering rates in the past indicate that the ancient earth must have been heavily
scarred by large impacts Based on the lunar record it is estimated that more than 100 impact
craters with diameters greater than 1000 km should have formed on the earth although
little evidence of these early craters has yet been found it is gratifying to note the recent
discovery of thick impact ejecta deposits in 32 to 35 Gyr archean greenstone belts in both
South africa and Western australia Since rocks have recently been found dating back to
42 Gyr well into the era of heavy bombardment it is to be hoped that more evidence for
early large craters will be eventually discovered Heavy bombardment also seems to have
overlapped the origin of life on earth It is possible that impacts may have had an inluence
on the origin of life although whether they suppressed it by creating global climatic catas-
trophes (up to evaporation of part or all of the seas by large impacts) or facilitated it by
bringing in needed organic precursor molecules is unclear at present the relation between
impacts and the origin of life is currently an area of vigorous speculation
695 Impact-induced volcanism
the idea that large impacts can induce major volcanic eruptions is one of the recurring
themes in the older geologic literature this idea probably derives from the observation
that all of the large impact basins on the Moonrsquos nearside are looded with basalt However
radiometric dates on apollo samples made it clear that the lava inillings of the lunar basins
are nearly 1 Gyr younger than the basins themselves furthermore the farside lunar basins
generally lack any lava inilling at all the nearside basins are apparently looded merely
because they were topographic lows in a region of thin crust at the time that mare basalts
httpswwwcambridgeorgcoreterms httpsdoiorg101017CBO9780511977848007Downloaded from httpswwwcambridgeorgcore University of Chicago on 25 Jan 2017 at 024451 subject to the Cambridge Core terms of use available at
Further reading 271
were produced in the Moonrsquos upper mantle Simple estimates of the pressure release caused
by stratigraphic uplift beneath large impact craters make it clear that pressure release melt-
ing cannot be important in impacts unless the underlying mantle is near the melting point
before the impact (Ivanov and Melosh 2003) thus it is probably safe to say that to date
there is no irm evidence that impacts can induce volcanic activity Impact craters may
create fractures along which pre-existing magma may escape but themselves are probably
not capable of producing much melt nevertheless there were massive igneous intrusions
associated with both the Sudbury and Vredefort structures whose genesis is sometimes
attributed to the impact although in this case they may have been triggered by the uplift of
hot lower crust further study of these issues is needed
696 Biological extinctions
the most recent major impact event on earth was the collision between the earth and a 10
to 15 km diameter asteroid 65 Myr ago that ended the cretaceous era and caused the most
massive biological extinction in recent geologic history evidence for this impact has been
gathered from many sites over the last decade and is now incontrovertible (Schulte et al
2010) first detected as an enrichment of the siderophile element iridium in the ca 3 mm
thick KPg (cretaceousPaleogene) boundary layer in Gubbio Italy the iridium signature
has now been found in more than 100 locations worldwide in both marine and terrestrial
deposits accompanying this iridium are other siderophile elements in chondritic ratios
shocked quartz grains coesite stishovite and small (100ndash500 μm) spherules resembling
microtektites all these point to the occurrence of a major impact at the KPg boundary
the impact crater is located beneath about 1 km of sedimentary cover on the yucatan
Peninsula of Mexico Known as the chicxulub crater it is about 170 km in diameter and is
presently the subject of intensive study
Further reading
a general survey of all aspects of impact cratering from which several sections of this
chapter were abstracted was published by Melosh (1989) this book is presently out of
print and often dificult to obtain but many university libraries possess a copy a more
popular but generally clear and accurate description of terrestrial impact craters can be
found in Mark (1987) a good description of the three largest craters on earth can be found
in Grieve and therriault (2000) although deeply eroded or otherwise obscured these cra-
ters provide the ldquoground truthrdquo about impacts that images of extraterrestrial craters cannot
give the surface of our Moon is dominated by impact craters and so the account of its
geology by Wilhelms (1987) is necessarily an account of the process of impact cratering
Don Wilhelms also wrote an insightful and very readable historical account of lunar explor-
ation that emphasizes the growing appreciation of impact cratering though the course of the
apollo missions (Wilhelms 1989) the importance and mechanics of impact crater col-
lapse and the simple-to-complex transition is treated by Melosh and Ivanov (1999) while
httpswwwcambridgeorgcoreterms httpsdoiorg101017CBO9780511977848007Downloaded from httpswwwcambridgeorgcore University of Chicago on 25 Jan 2017 at 024451 subject to the Cambridge Core terms of use available at
Impact cratering272
the special features of oblique impacts are the subject of a review by Pierazzo and Melosh
(2000) the best current summary of the scaling of impact crater ejecta was stimulated by
analysis of the ejecta from the Deep Impact Mission cratering event (richardson et al
2007) a ine review of the details of crater counting and the application of crater counts
to the dating of surfaces appears in a rather unlikely-sounding book which was the subject
of a collaborative project called the Basaltic Volcanism Study Project (Project 1981) the
near-ield effects of an impact on the earth are reported by an on-line computer program
whose basic algorithms are described in detail by collins et al (2005)
Exercises
61 Crater dimensions
a) Suppose that the transient crater that collapsed to form the Imbrium Basin on the Moon
was Dtc = 800 km in diameter assuming that it struck vertically at vi = 22 kms what
was the diameter of the asteroid that produced Imbrium
use the revised SchmidtndashHolsapple scaling law (this form implicitly assumes that the
target and projectile have the same density)
d Dg
vi
=
0 6711 28
2
0 277
tc
(MKS units)
b) If this object struck at 45deg to the vertical what is the period of the Moonrsquos rotation
thus imparted assuming the Moon was free in space (unlikely but easy to analyze)
compare this to the Moonrsquos current rotation rate What can you conclude about the abil-
ity of large impacts to unlock the Moonrsquos present synchronous rotation state
62 Crater collapse
a) the empirical relation for the thickness T of an impact craterrsquos ejecta blanket indi-
cates that the average thickness declines as (Rc r)3 where Rc is the crater radius and
Dc
Tc
T(r)
h
rr3
1
figure 627
httpswwwcambridgeorgcoreterms httpsdoiorg101017CBO9780511977848007Downloaded from httpswwwcambridgeorgcore University of Chicago on 25 Jan 2017 at 024451 subject to the Cambridge Core terms of use available at
Exercises 273
r is distance from the craterrsquos center assuming that the interior shape of a simple
(or transient) crater is described by a paraboloid of revolution with diameterdepth
ratio Dc h asymp 5 (use the rim-to-rim diameter Dc and depth h below the original ground
surface) and assuming that the volume of the ejecta blanket and crater bowl are
equal derive an equation for the ejecta blanket thickness Tc at the rim (Hint It is
permissible at this level of accuracy to treat the inner edge of the ejecta blanket as if
it were a vertical cliff an exact result however can be obtained with a bit of effort
and anyone who can legitimately get the result Tc=h5 should get extra credit for this
assignment)
b) now suppose the crater collapses to a uniform constant depth hf (3 km for the Moon)
over its entire interior again using volume conservation how much does the rim-to-rim
diameter increase for a 100 km (inal diameter) crater
63 Swedish rock rain
In addition to the 5 proven and 33 possible impact crater scars that adorn the country of
Sweden lilljequist and Henkel (1996) proposed the existence of a truly world-class cra-
ter the uppland structure which is supposed to be 320 km in diameter It encompasses
the area around Stockholm up to uppsala using Shoemakerrsquos estimated cratering rate on
earth Ncum (D gt 226 km) = 18 x 10ndash15 craterskm2yr and the post-mare size exponent
b = 18 (Ncum ~ Dndash18) compute the largest crater likely to have formed in Sweden (area ~
450 000 km2) since the formation of its surface rocks (1600 to 2300 Myr use 2000 Myr as
a reasonable average)
How does this compare to the size of the putative uppland structure Put another way
what is the probability of the formation of a crater as large as uppland in the past 2000
More exact
Simple geometry
- OK for this problem
hf
Df
Df
figure 628
httpswwwcambridgeorgcoreterms httpsdoiorg101017CBO9780511977848007Downloaded from httpswwwcambridgeorgcore University of Chicago on 25 Jan 2017 at 024451 subject to the Cambridge Core terms of use available at
Impact cratering274
Myr in Sweden What does this tell you about the uppland ldquocraterrdquo note that the largest
conirmed crater in Sweden is the 55 km-diameter Siljan structure
using the same cratering lux compute the maximum size of crater likely to be found
in the uK (now it is the studentrsquos task to look up the area and mean geologic age of that
fair but damp archipelago) note that a single probably 4 km diameter impact crater was
discovered in the north Sea by Stewart and allen (2002) ndash the Silverpit crater
64 Those blasted Martian rocks
f Houmlrz et al (1999) argued that dish-shaped depressions on large rocks at the Pathinder
landing site on Mars along with split boulders might be due to the impact of millimeter to
centimeter diameter meteorites at speeds of 300 ms or more (corresponding to the muzzle
velocity of a high-speed rile)
evaluate the ability of the Martian atmosphere (surface pressure PS = 600 Pa) to stop
small meteoroids (average pre-atmospheric speed 7 kms) by comparing the mass of the
projectile to the mass of atmospheric gases swept out of the cylindrical volume deined by
the meteoroidrsquos path (assume a straight trajectory for the purposes of this estimate)
the total mass of atmospheric gas above a unit area on the surface of a planet is PS g
where g is the acceleration of gravity at the surface Perhaps surprisingly you do not need
to know the density of the atmosphere as a function of height to do this problem (convince
yourselves of this)
using momentum conservation estimate how much the meteoroid is slowed upon arriv-
ing at the surface as a function of its mass and density finally describe how reasonable the
Horzndashcintala proposal really is for both stony and iron meteoroids could this process be
effective on high mountaintops on earth Why or why not
Extra credit
as the meteoroid traverses the atmosphere it encounters a ram pressure of ρav2 on its lead-
ing face ( ρa is the density of the atmosphere 00104 kgm3 at the surface of Mars) while its
rear is nearly a vacuum for supersonic light estimate the maximum stresses thus acting to
crush the meteoroid and compare them to the typical strength of rock or iron for the mete-
oroids in the problem above (nB you do have to know the height distribution of density
for this problem ndash you may want to know that the scale height of the Martian atmosphere
is about 10 km)
65 Titan gets its kicks
one of the mysteries about Saturnrsquos large moon titan is its (slightly) eccentric orbit
e = 0028 If titan could dissipate tidal energy as Io or europa does its orbit would have
circularized long ago It has been proposed that titanrsquos Xanadu region is a gigantic impact
httpswwwcambridgeorgcoreterms httpsdoiorg101017CBO9780511977848007Downloaded from httpswwwcambridgeorgcore University of Chicago on 25 Jan 2017 at 024451 subject to the Cambridge Core terms of use available at
Exercises 275
structure 700 km in diameter (with an ejecta blanket bringing the diameter of the entire
feature to 1800 km) using the impact crater scaling relation in Problem 61 estimate the
size of the object that could have made this crater assuming a cometary impact velocity of
30 kms (do not forget the difference between the transient and inal crater) If this object
struck the equator of titan at the optimum place and angle to transform its linear momen-
tum to orbital angular momentum could this impact have imparted enough momentum
to account for titanrsquos present eccentricity you may need to know that the orbital angular
momentum H of a planet of mass m circling a body of mass M with a semimajor axis of R
and eccentricity e is
H m GMR e= minus( )1 2
I will leave you with the task of looking up the values of the necessary parameters Donrsquot
forget that you are looking for a change of orbit from circular (e = 0) to elliptical note that
this problem is akin to the oft-asked question of whether the KPg impact that killed the
dinosaurs could also have knocked the earth ldquoout of its orbitrdquo What do you think about
this possibility
httpswwwcambridgeorgcoreterms httpsdoiorg101017CBO9780511977848007Downloaded from httpswwwcambridgeorgcore University of Chicago on 25 Jan 2017 at 024451 subject to the Cambridge Core terms of use available at
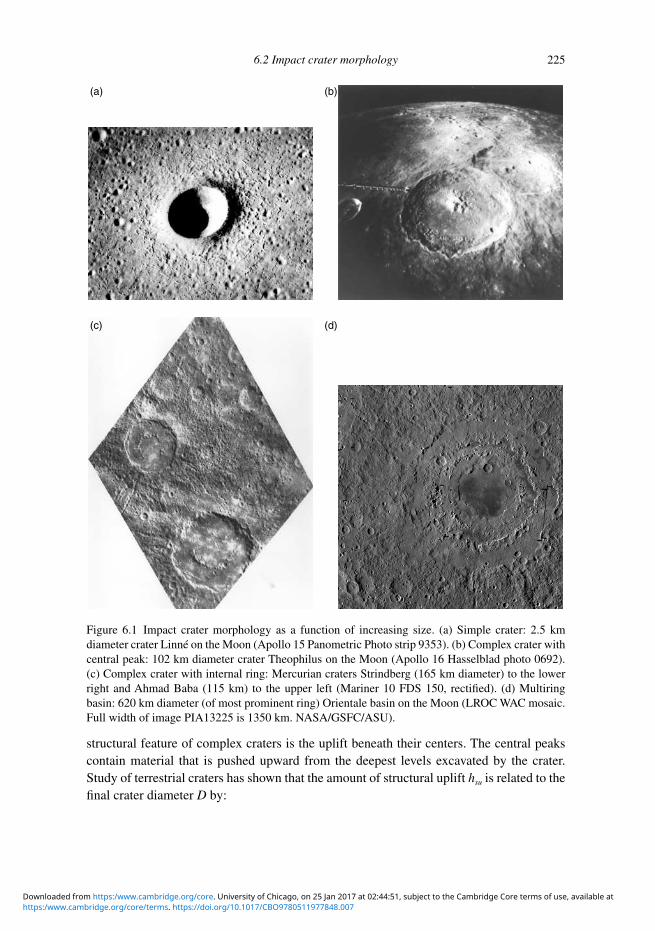
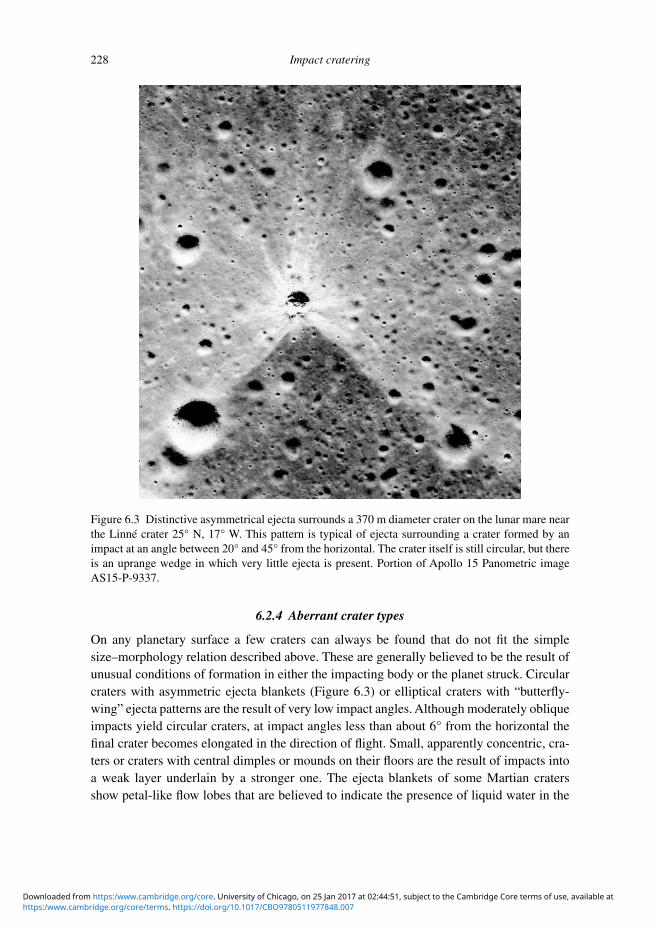
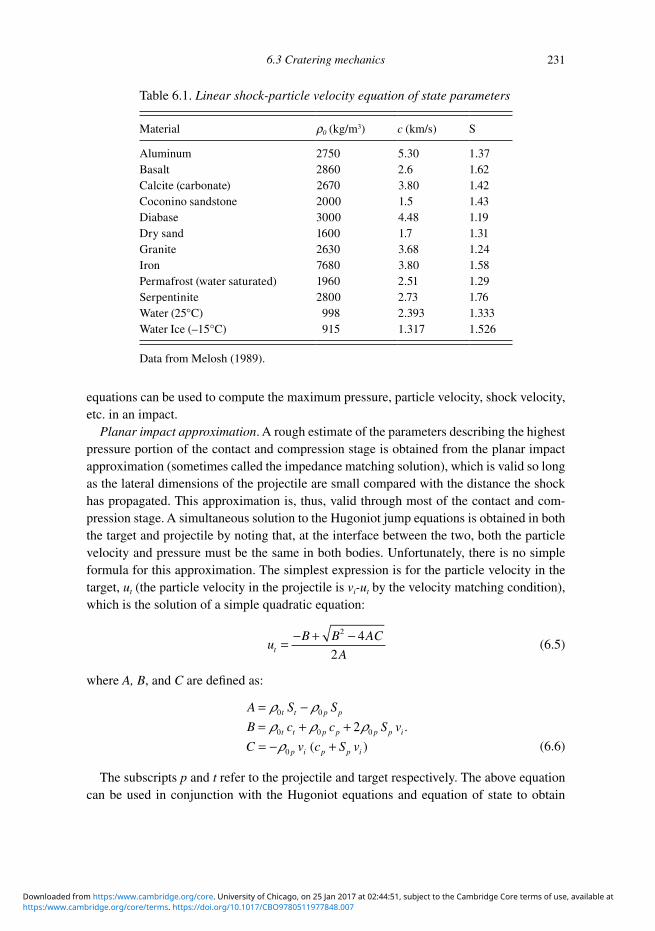
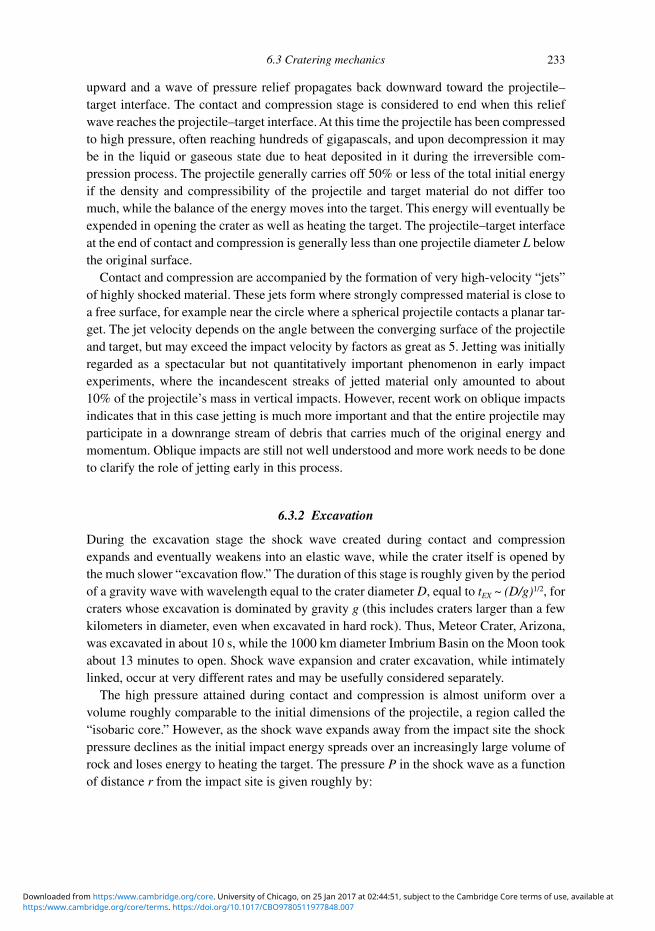
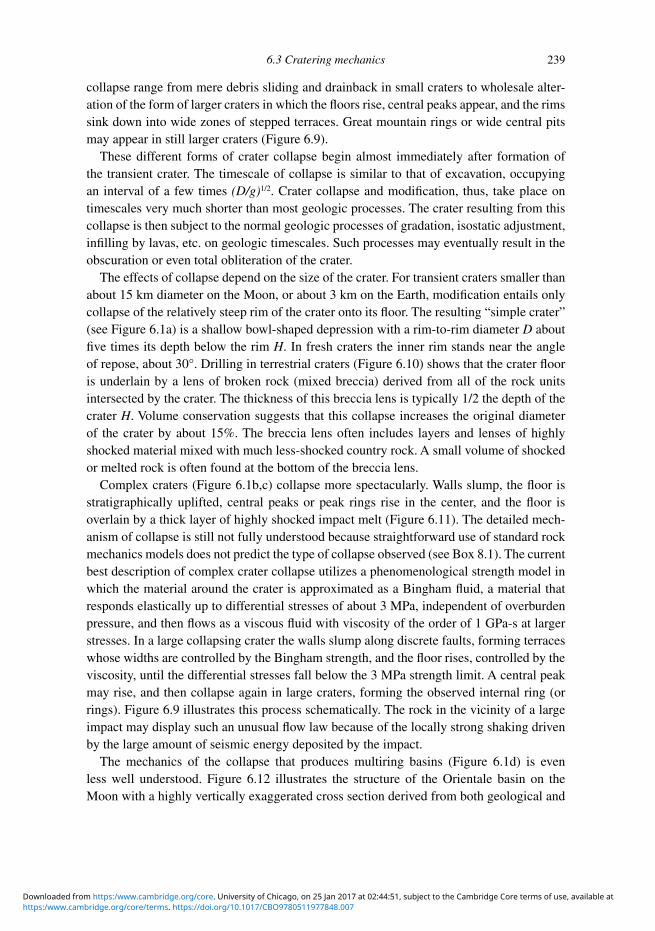
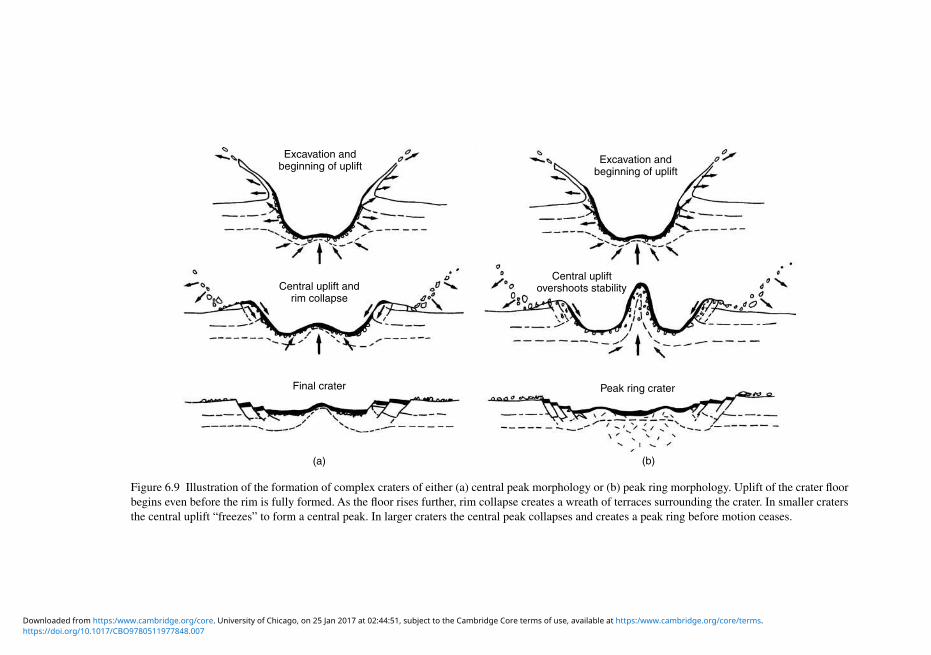
Excavation andbeginning of uplift
Central uplift andrim collapse
Final crater
Excavation andbeginning of uplift
Central upliftovershoots stability
Peak ring crater
(a) (b)
figure 69 Illustration of the formation of complex craters of either (a) central peak morphology or (b) peak ring morphology uplift of the crater loor
begins even before the rim is fully formed as the loor rises further rim collapse creates a wreath of terraces surrounding the crater In smaller craters
the central uplift ldquofreezesrdquo to form a central peak In larger craters the central peak collapses and creates a peak ring before motion ceases
httpsdoiorg101017CBO9780511977848007Downloaded from httpswwwcambridgeorgcore University of Chicago on 25 Jan 2017 at 024451 subject to the Cambridge Core terms of use available at httpswwwcambridgeorgcoreterms
63 Cratering mechanics 241
geophysical data note the ring scarps are interpreted as inward-dipping faults above a pro-
nounced mantle uplift beneath the basinrsquos center one idea that is currently gaining ground
is that the ring scarps are normal faults that develop as the crust surrounding a large crater
is pulled inward by the low of underlying viscous mantle material toward the crater cavity
(figure 613) an important aspect of this low is that it must be conined in a low-viscosity
channel by more viscous material below otherwise the low simply uplifts the crater loor
and radial faults instead of ring scarps are the result Special structural conditions are thus
needed in the planet for multiring basins to form on its surface so that a gndash1 dependence for
the transition from complex craters to multiring basins is not expected (or observed) this
Original plane
Sediments
Brecciated ampfractured gneiss
Shocked gneiss
Presentsurface
Breccias
Highly mixed partly melt
Mixed with glassy melt fragments
Slightly mixed weakly shocked
Slightly mixed generally unshocked
Basal breccia
Melt
0 05 km
figure 610 Geologic cross section of the 34 km diameter Brent crater in ontario canada although
the rim has been eroded away Brent is a typical simple crater that forms in crystalline rocks a small
melt pool occurs at the bottom of the breccia lens and more highly shocked rocks occur near its top
Terrace zone Terrace zone
Inner ring Inner ringCrater rim Crater rim
km
km
3
3
2
2
1
100
Incipientcentraluplift
Suevite
figure 611 Geologic cross section of the 22 km diameter ries crater in Germany Drilling and
geophysical data suggest that this is a peak ring crater Its central basin is illed with suevite a
mixture of highly shocked and melted rocks and cold clasts
httpswwwcambridgeorgcoreterms httpsdoiorg101017CBO9780511977848007Downloaded from httpswwwcambridgeorgcore University of Chicago on 25 Jan 2017 at 024451 subject to the Cambridge Core terms of use available at
Impact cratering242
Box 61 Maxwellrsquos Z model of crater excavation
the details of the excavation low can be determined only by experiment or by elaborate
numerical computations even such numerical work may have dificulty in correctly computing
the inal dimensions of the transient crater However in 1973 D Maxwell and K Seifert
proposed a simple analytical model of excavation low (Maxwell 1977) this model gives
a useful kinematic although not dynamic description of the cratering low ield like all
approximate models it should not be used to determine ine details
Maxwell and Seifert noted that in explosion cratering computations the radial component
of the excavation low velocity ur usually falls as a simple inverse power of distance r from the
explosive charge
u
t
rr Z
= α ( )
(B611)
where α(t) is a function of time and describes the strength of the low while Z is a
dimensionless power
the incompressibility of the excavation low nabla bull u = 0 requires that the angular component
of the low velocity uθ in polar coordinates (r θ) is
u Z urθ
θθ
= minus+
( )sin
cos2
1 (B612)
the geometry of the velocity ield deined by this model seen in figure 6B1 is remarkably
similar to that computed in both explosion and impact cratering events Z 3 the equation of
streamlines in polar coordinates is
r r Z= minus minus
0
1
21( cos )θ
(B613)
where r0 is a constant that is different for each streamline It is equal to the radius at which the
streamline emerges from the surface (θ = 90deg) taking r0 = Dat2 the radius of the transient
crater the maximum depth of excavation Hexc is
H
DZ Zat
Z
Zexc = minus minus
minusminus
22 1
1
2( )( )
(B614)
for Z = 3 the maximum depth of excavation Hexc = Dat8 or about one-third of the inal
transient crater depth
the total mass ejected from a crater described by the Z model Mej is a fraction of the total
mass displaced from the transient crater Me
M
Z
ZMej e= minus
minus2
1
(B615)
the Z model also predicts that the vertical and horizontal velocity components uV and uH of
the ejecta launched at a distance s along the surface from the impact point are
u s
u Z u
VZ
H V
== minus
α
( )2
(B616)
httpswwwcambridgeorgcoreterms httpsdoiorg101017CBO9780511977848007Downloaded from httpswwwcambridgeorgcore University of Chicago on 25 Jan 2017 at 024451 subject to the Cambridge Core terms of use available at
63 Cratering mechanics 243
or that the angle of ejection is φ = tanminus1 (Z minus 2) equal to 45deg for Z = 3
the Z-model presented thus far is a kinematical model useful for describing the form of
the excavation low Maxwell and Seifert attempted to give it more dynamical content by
computing the function α(t) in equation (B611) this function gives the strength of the low
at any particular time Its value is different for each streamtube in the low It is estimated by
using energy conservation in each of these streamtubes neglecting interactions with adjacent
tubes thus the sum of the kinetic gravitational and distortional energies is found in each
streamtube at some initial time the total energy in each streamtube is conserved as the low
progresses However the kinetic energy declines at the expense of the gravitational and
distortional energies so that the net low velocity declines unfortunately this aspect of the
Z model has not worked out well in practice the actual course of the excavation low is best
determined through detailed dynamical models
the Z-model described here can be (and has been) improved and extended in several ways
one of the most straightforward is to move the source of the low r = 0 from the surface to
some depth below the surface taking into account the depth of the effective center of the shock
wave (croft 1980) other workers have attempted to reine Maxwell and Siefertrsquos methods of
estimating energies in the streamtubes the Z-model however is fundamentally limited by its
neglect of interactions between the streamtubes for this reason it can never become an exact
description of the cratering low however accurately the dynamics within a single streamtube
is represented
In spite of all its faults the Z-model gives a reasonably accurate representation of the gross
geometric features of the cratering low and can even be used to predict some irst-order
dynamical properties It has the unfortunate feature of not being a truly dynamical model
so that further reinements are not necessarily closer approximations to the full dynamical
equations of motion nevertheless the excellent properties of this model are probably still far
from being fully exploited
Box 61 (cont)
z = 2 z = 3 z = 4
634deg45deg
θr
figure B61
httpswwwcambridgeorgcoreterms httpsdoiorg101017CBO9780511977848007Downloaded from httpswwwcambridgeorgcore University of Chicago on 25 Jan 2017 at 024451 subject to the Cambridge Core terms of use available at
Impact cratering244
theory is capable of explaining both the lunar-type and Valhalla-type multiring basins as
expressions of different lithosphere thicknesses
64 Ejecta deposits
a deposit of debris ejected from the crater interior surrounds essentially all impact craters
the only exceptions are craters on steeply sloping surfaces or on satellites with too little grav-
ity to retain the ejecta or too much porosity to produce it this ejecta deposit is thickest at the
crater rim and thins with increasing distance outwards Where this deposit is recognizably
continuous near the crater it is called an ldquoejecta blanketrdquo ejecta beyond the edge of the con-
tinuous deposit are thin and patchy Secondary craters occur in this zone and beyond it figure
614 shows the ejecta blanket of the 30-km diameter lunar crater timocharis the pre-existing
1 - Inner basin ring
2 - Inner rock
3 - Rook
4 - Cordillera
5 - Questionable ring
0
1 2 3 4 5 N
200 400 600 800 km
Crustdensity = 2900 kgm3
Mantle
Density = 3400 kgm3
S10
0
ndash10
ndash30
ndash20
ndash40
Depth
km
ndash50
ndash60
ndash70
ndash80
Prebasin rocks(highly brecciated
toward basincenter)
Heveliusformation(ejecta)
Rockmaterial
(slumps)
Crackledfloor material(impact melt)
Marebasalt
figure 612 Geologic and geophysical structure of the orientale basin on the Moon one of the
freshest and best-studied multiring basins a dense mantle uplift underlies the center of the basin
the crustal thinning above the uplift is due to the ejection of about 40 km of crustal material from the
crater that formed the basin the great ring scarps shown in cross-section formed during collapse of
the crater note the 10X vertical exaggeration necessary to show the ring scarps
httpswwwcambridgeorgcoreterms httpsdoiorg101017CBO9780511977848007Downloaded from httpswwwcambridgeorgcore University of Chicago on 25 Jan 2017 at 024451 subject to the Cambridge Core terms of use available at
64 Ejecta deposits 245
terrain within about one crater radius of the rim is buried and mostly obliterated by the con-
tinuous ejecta blanket light patches show where thinner deposits overlie the mare surface
the thickness of the ejecta deposit varies greatly with direction away from the rim
azimuthal thickness variations at the same radius can be as large as ten to one the ejecta
is concentrated into rays that often are observed to form at angles of about 30deg to one
another However it is also true that at a given azimuth the thickness falls rapidly and sys-
tematically with distance away from the crater center compilation of many data sets from
both impact and explosion craters shows that the thickness δ(r) as a function of radius r
away from the crater center is given by an approximate inverse cube relation
δ ( ) ( )
r f Rr
R=
minus plusmn3 0 5
(69)
where R is the radius of the crater rim Integration of this relation indicates that most
of the mass of the ejecta is located near the crater rim according to the approximate
ldquoSchroumlterrsquos rulerdquo the volume of the ejecta is approximately equal to the volume of the crater
bowl although this rule seems to make a great deal of sense (however it does ignore the
increase in volume of the ejected material due to fragmentation) it is unveriiable in practice
because the original ground surface can seldom be located with adequate precision
(a)
(b)
(c)
Fluid
Fluid
Elastic
Elastic
Elastic-plastichalf-space
figure 613 the ring tectonic theory of multiring basin formation (a) shows the formation of a normal
complex crater on a planet with uniform rheology (b) shows the inward-directed low in a more luid
asthenosphere underlying a lithosphere of thickness comparable to the crater depth and the resulting
scarps (c) shows a Valhalla-type basin developing around a crater formed in a very thin lithosphere
httpswwwcambridgeorgcoreterms httpsdoiorg101017CBO9780511977848007Downloaded from httpswwwcambridgeorgcore University of Chicago on 25 Jan 2017 at 024451 subject to the Cambridge Core terms of use available at
Impact cratering246
the rims of many fresh craters are littered with blocks of rock ejected from beneath
the crater compilations of data show that block size generally decreases as a function
of distance from the rim the maximum size of block observed on the rim of a crater
is related to the size of the crater itself and an empirical relation that holds over a wide
range of crater sizes relates the mass of the largest ejected fragment mf to the total mass
ejected from the crater Me If both masses are expressed in kilograms this relation is
m Mf e= 0 8 0 8
(610)
641 Ballistic sedimentation
the ejecta deposited around an impact crater on an airless planet are emplaced ballistically
that is ejecta are thrown from the crater with some initial velocity follow a nearly para-
bolic trajectory above the planetrsquos surface then fall back to the surface striking with the
figure 614 near-vertical view of the 30 km diameter lunar crater timocharis the ejecta deposits
are dunelike near the crater rim but grade into a subradial facies beyond about 2 R from the craterrsquos
center Secondary craters occur at greater distances a pattern of bright material surrounding the
crater indicates the presence of ejecta too thin to greatly modify the pre-existing terrain at this scale
apollo 15 photo aS15ndash1005
httpswwwcambridgeorgcoreterms httpsdoiorg101017CBO9780511977848007Downloaded from httpswwwcambridgeorgcore University of Chicago on 25 Jan 2017 at 024451 subject to the Cambridge Core terms of use available at
64 Ejecta deposits 247
same velocity as on ejection Some interaction may occur between ejecta fragments in the
denser parts of the ejecta curtain but the general motion is dominated by ballistics alone
the ground surface around the crater is profoundly affected by the ejecta as it lands and its
interaction with this falling debris determines the character of the ejecta deposits of large
craters
the debris ejected from an impact crater travels together in the form of an ldquoejecta
curtainrdquo although each fragment follows a parabolic trajectory the times and velocities
of ejection from the crater are organized so that most of the debris lies on the surface of
an expanding inverted cone figure 615 illustrates the parabolic trajectories of a number
6
5
4
3
Altitude units o
f cra
ter
radiu
s
2
1
1 3
Range units of crater radiusCE
4 5 6 7 8 9 10
0
7
T
15T
2T
25T
figure 615 the debris ejected from an impact crater follows ballistic trajectories from its launch
position within the inal crater (the rim of the inal crater is located at a range equal to one crater
radius) the innermost ejecta are launched irst and travel fastest following the steepest trajectories
shown in the igure ejecta originating farther from the center are launched later and move more
slowly falling nearer the crater rim Because of the relationship between position time and velocity
of ejection the debris forms an inverted cone that sweeps outward across the target this debris
curtain is shown at four separate times during its light at 1 15 2 and 25 Tf where Tf is the crater
formation time (Dg)12 coarser less-shocked debris travels near the base of the curtain whereas
the fast highly shocked ejecta fraction tends to travel near the top the three lower igures show
details of the pre-existing ground surface when the ejecta curtain arrives as the range increases the
ejecta strike with progressively larger velocities incorporating larger amounts of surface material and
imparting a larger net horizontal velocity
httpswwwcambridgeorgcoreterms httpsdoiorg101017CBO9780511977848007Downloaded from httpswwwcambridgeorgcore University of Chicago on 25 Jan 2017 at 024451 subject to the Cambridge Core terms of use available at
Impact cratering248
of fragments from an impact crater the positions of these fragments at several times are
indicated at any one time the debris lies on the surface of a cone that makes an angle
of about 45deg with the ground surface this cone sweeps rapidly outward from the crater
rim Debris from the curtain strikes the ground at its base impacting irst near the crater
rim then at greater distances as time progresses the size of the ejecta fragments near the
base of the ejecta curtain is expected to be larger than the fragments higher in the curtain
and the proportion of highly shocked fragments and glass increases with height in the
curtain
Ballistically emplaced debris falling near the crater rim strikes with a low velocity
because it travels only a short distance at the rim itself this velocity is so low that rock
units may retain some coherence and produce an overturned lap with inverted stratigraphy
eugene Shoemaker irst recognized such overturned beds at Meteor crater arizona at
greater distances from the crater rim the debris strikes with a higher velocity When this
velocity is large enough surface material is eroded and mixes with the debris the falling
ejecta also possess a radially outward velocity component although the vertical velocity
is cancelled when the debris strikes the surface the mixture of debris and surface material
retains its outward momentum (see the lower inserts in figure 615) this mixture moves
rapidly outward as a ground-hugging low of rock debris similar in many ways to the
low of a large dry-rock avalanche Depositional features such as dunes ridges and radial
troughs indicative of high-speed low may result from this motion the deposit itself con-
sists of an intimate mixture of primary crater ejecta and of secondary material scoured
from the pre-existing ground surface
642 Fluidized ejecta blankets
the ejecta blankets of impact craters on Mars are dramatically different from those on the
Moon or Mercury Martian craters smaller than about 5 km in diameter closely resemble
their counterparts on the Moon However craters between 5 and 15 km in diameter have
a single ejecta sheet that extends about one crater radius from the rim and ends in a low
concentric ridge or outward-facing escarpment these are called ldquorampart cratersrdquo from
the continuous ridge surrounding the ejecta deposit the ejecta of most craters larger than
15 km in diameter are divided into petal-like lobes that extend two or more radii from the
rim (figure 616) approximately twice as far as the continuous ejecta deposits of lunar or
Mercurian craters a few large craters with lunar-type ejecta blankets are known but they
are rare Many Martian craters have abnormally large central peaks and other internal col-
lapse structures compared with lunar or Mercurian craters also suggesting the presence
of some luidizing agent peculiar to Mars
the luidized ejecta blankets of Martian craters appear to have been emplaced as
thin ground-hugging lows When impeded by topographic obstacles that could not
be overridden the lows are delected and either spread out elsewhere or pond against
the obstacle ejecta lobes fail to overtop low hills and mesas that are only a few times
httpswwwcambridgeorgcoreterms httpsdoiorg101017CBO9780511977848007Downloaded from httpswwwcambridgeorgcore University of Chicago on 25 Jan 2017 at 024451 subject to the Cambridge Core terms of use available at
64 Ejecta deposits 249
higher than the low thickness itself suggesting that the lobe could not have traveled as
dispersed clouds of the base-surge type nor were they emplaced by ballistic sedimen-
tation because the ejecta curtain should have fallen on the topographic obstacle from
above
the peculiar form of Martian ejecta blankets is generally attributed to the presence of
liquid water in the substrate ejected along with subsurface material liquid water mixed
into the ejecta would greatly enhance the mobility of the debris converting the dry frag-
mental ejecta lows characteristic of lunar craters to luid debris lows similar to terres-
trial mudlows nevertheless not all Mars researchers agree with this interpretation and
an alternative viewpoint attributes at least part of the mobility of these lows to interaction
with the thin atmosphere of Mars
figure 616 the 19 km diameter crater yuty on Mars is surrounded by thin petaloid low lobes
that extend approximately twice as far from the crater as the continuous ejecta deposits of lunar or
Mercurian craters Viking orbiter frame 3a07
httpswwwcambridgeorgcoreterms httpsdoiorg101017CBO9780511977848007Downloaded from httpswwwcambridgeorgcore University of Chicago on 25 Jan 2017 at 024451 subject to the Cambridge Core terms of use available at
Impact cratering250
643 Secondary craters
numerous secondary impact craters variously occurring either singly or in loops clusters
and lines surround large impact craters figure 617 shows the secondary crater ield around
the crater Gratteri on Mars as revealed by the tHeMIS thermal mapper recognizable sec-
ondary craters extend from just beyond the continuous ejecta blanket out to distances of up
to thousands of kilometers from their source crater close to the primary crater secondary
craters are produced by relatively low-velocity impacts and are thus irregular in shape
shallow and obviously clustered and are often separated by V-shaped dunes known as the
ldquoherringbone patternrdquo farther from the primary impact velocities are larger and secondary
craters are more dispersed which makes them dificult to discriminate from small primary
craters
an important controversy is presently raging about the importance of secondary craters
in masking the primary lux If a majority of the small craters (less than a few 100 m diam-
eter) on a planetrsquos surface are secondary then ages assigned to cratered surfaces based on the
figure 617 night-time Ir thermal image of the 69 km diameter Martian crater Gratteri located
at 178deg S 202deg e the dark streaks are created by secondary impact craters that extend up to 500
km from the crater center In images of this type dark regions are cold and emit little Ir radiation
because they have low thermal inertia indicating that the streaks are composed of ine-grained
material compared to their surroundings the overall image measures 545 x 533 km across tHeMIS
image courtesy of Phil christensen naSaJPlaSu See also color plate section
httpswwwcambridgeorgcoreterms httpsdoiorg101017CBO9780511977848007Downloaded from httpswwwcambridgeorgcore University of Chicago on 25 Jan 2017 at 024451 subject to the Cambridge Core terms of use available at
65 Scaling of crater dimensions 251
assumption that the craters are primary will be too great on the other hand many experienced
crater counters claim that they can exclude secondary craters because they are clustered a
claim that is disputed by other experts at the moment there is no consensus on this problem
the maximum size of secondary craters is approximately 4 of the primary diameter
on the Moon Mars and elsewhere However on Mercury obvious secondary craters are
apparently several times larger this observation is at odds with the larger impact velocity
on Mercury which is expected to result in smaller ejected fragments not larger ones Is
the crust of Mercury somehow stronger than that of the Moon or Mars at the moment the
solution to this conundrum is unknown
644 Oblique impact
although high-velocity impact craters are circular down to very low angles of approach
the pattern of the ejecta may betray impact obliquity at angles as large as 45deg the irst sign
of an oblique impact is an asymmetric but still bilaterally symmetrical ejecta blanket the
ejecta in the uprange direction are thinner and less extensive than those in the downrange
direction at impact angles near 45deg at impact angles near 30deg an uprange wedge free
of ejecta develops an example of which is shown in figure 63 as the angle decreases
still farther to 10deg ejecta-free regions appear in both downrange and uprange directions
although bright streaks may extend downrange in very fresh craters at such low angles
the crater itself becomes elliptical with its long axis parallel to the light direction of the
projectile at these highly oblique angles the projectile essentially plows a furrow into the
target surface throwing ejecta out to both sides to form a ldquobutterly-wingrdquo pattern
65 Scaling of crater dimensions
one of the most frequently asked questions about an impact crater is ldquoHow big was the
meteorite that made the craterrdquo like many simple questions this has no simple answer It
should be obvious that the crater size depends upon the meteoritersquos speed size and angle
of entry It also depends on such factors as the meteoritersquos composition the material and
composition of the target surface gravity presence or absence of an atmosphere etc the
question of the original size of the meteorite is usually unanswerable because the speed
and angle of impact are seldom known the inverse question of how large a crater will be
produced by a given-sized meteorite with known speed and incidence angle is in principle
much simpler to answer However even this prediction is uncertain because there is no
observational or experimental data on the formative conditions of impact craters larger than
a few tens of meters in diameter while the impact structures of geologic interest range up
to 1000 km in diameter the traditional escape from this dificulty is to extrapolate beyond
experimental knowledge by means of scaling laws
c W lampson who studied the craters produced by tnt explosions of different sizes
introduced the irst scaling law in 1950 lampson found that the craters were similar to
httpswwwcambridgeorgcoreterms httpsdoiorg101017CBO9780511977848007Downloaded from httpswwwcambridgeorgcore University of Chicago on 25 Jan 2017 at 024451 subject to the Cambridge Core terms of use available at
Impact cratering252
one another if all dimensions (depth diameter depth of charge placement) were divided
by the cube root of the explosive energy W thus if the diameter D of a crater produced
by an explosive energy W is wanted it can be computed from the diameter D0 of a crater
produced by a smaller explosive energy W0 using the proportion
D
D
W
W0 0
1 3
=
(611)
an exactly similar proportion may be written for the crater depth H this means that
the ratio of depth to diameter HD is independent of yield a prediction that agrees rea-
sonably well with observation In more recent work on large explosions the exponent 13
in this equation has been modiied to 134 to account for the effects of gravity on crater
formation
although impacts and explosions have many similarities a number of factors make them
dificult to compare in detail thus explosion craters are very sensitive to the chargersquos
depth of burial although this quantity is well deined for explosions there is no simple
analog for impact craters Similarly the angle of impact has no analog for explosions
nevertheless energy-based scaling laws were very popular in the older impact literature
perhaps partly because nothing better existed and many empirical schemes were devised
to adapt the well-established explosion scaling laws to impacts
651 Crater diameter scaling
this situation has changed rapidly in the last few decades however thanks to more impact
cratering experiments speciically designed to test scaling laws It has been shown that
the great expansion of the crater during excavation tends to decouple the parameters
describing the inal crater from the parameters describing the projectile If these sets of
parameters are related by a single dimensional ldquocoupling parameterrdquo (as seems to be the
case) then it can be shown that crater parameters and projectile parameters are related by
power-law scaling expressions with constant coeficients and exponents although this is
a somewhat complex and rapidly changing subject the best current scaling relation for
impact craters forming in competent rock (low-porosity) targets whose growth is limited
by gravity rather than target strength (ie all craters larger than a few kilometers in diam-
eter) is given by
D L v gtc
p
t
i=
minus1 161
1 3
0 78 0 44 0 22 1 3 sin
ρρ
θ
(612)
where Dtc is the diameter of the transient crater at the level of the original ground surface
ρp and ρt are densities of the projectile and target respectively g is surface gravity L is
projectile diameter vi is impact velocity and θ is the angle of impact from the horizontal
all quantities are in SI units
httpswwwcambridgeorgcoreterms httpsdoiorg101017CBO9780511977848007Downloaded from httpswwwcambridgeorgcore University of Chicago on 25 Jan 2017 at 024451 subject to the Cambridge Core terms of use available at
65 Scaling of crater dimensions 253
the transient crater depth Htc appears to be a constant times the diameter Dtc although
a few investigations have reported a weak velocity dependence for this ratio the experi-
mental situation is not yet clear
652 Impact melt mass
the amount of material melted or vaporized by an impact is a strong function of the impact
velocity itself the melt mass depends principally upon the velocity and mass of the pro-
jectile but does not depend upon the gravitational acceleration of the target body Very little
melt is produced until a threshold velocity of about 12 kms is reached once this threshold
is exceeded the mass of melt Mm is given in terms of the mass of the projectile Mp as
M
M
vvm
p
i
m
i= ge0 25 122
sin ε
θ kms
(613)
where εm is the speciic internal energy of the rankinendashHugoniot state from which isen-
tropic decompression ends at the 1 bar point on the liquidus It is equal to 52 MJkg for
granite which can be taken to be representative of crustal rocks
although the mass of melt does not depend on the gravitational acceleration of the planet
the crater size does through equation (612) the volume of the melt relative to the volume
Melted
Melted
Melted
Vaporized
Vaporized
Vaporized
Dat = 10 km
Dat = 100 km
Dat = 1000 km
figure 618 the different scaling laws for crater diameter and melt or vapor volume imply that as the
crater diameter increases the volume of melted or vaporized material may approach the volume of
the crater itself this igure is constructed for impacts at 35 kms on the earth
httpswwwcambridgeorgcoreterms httpsdoiorg101017CBO9780511977848007Downloaded from httpswwwcambridgeorgcore University of Chicago on 25 Jan 2017 at 024451 subject to the Cambridge Core terms of use available at
Impact cratering254
of the crater is relatively small for small craters but as the crater size increases it becomes
a progressively larger fraction of the total crater volume as shown in figure 618 at some
suficiently large diameter (about 1000 km on the earth) the volume of the melt equals the
volume of the crater itself and substantial changes in the morphology of the crater can be
expected although these changes are not well understood at the present time
66 Atmospheric interactions
as fast-moving meteoroids enter the atmosphere of a planet they are slowed by friction
with the atmospheric gases and compressed by the deceleration Small meteoroids are
often vaporized by frictional heating and never reach the surface of the planet larger
meteoroids are decelerated to terminal velocity and fall relatively gently to the surface of
the planet the diameter of a meteorite that loses 90 of its initial velocity in the atmos-
phere is typically about 1 m for earth and 60 m for Venus However this assumes that the
projectile reaches the surface intact whereas in fact aerodynamic stresses may crush all
but the strongest meteorites once fractured the fragments of an incoming meteorite travel
slightly separate paths and strike the surface some distance apart from one another this
phenomenon gives rise to the widely observed strewn ields of meteorites or craters on the
earth which average roughly a kilometer or two in diameter on Venus clusters of small
craters attributed to atmospheric breakup are spread over areas roughly 20 km in diameter
rather surprisingly clusters of small craters are also observed on Mars where the spread of
small craters in a cluster averages only a few tens of meters to hundreds of meters across
the aerodynamic crushing stress experienced by an incoming meteoroid is of the order
of the stagnation pressure given by
Pstagnation asymp ρ av2 (614)
where ρa is the density of the atmosphere through which the meteoroid is traveling and v
is the relative velocity of the meteoroid and atmosphere evidently even the thin Martian
atmosphere is enough to fracture and partially disperse weak incoming meteoroids
It can be shown that the dispersion of a cluster of fragments is a maximum when breakup
occurs at twice the atmospheric scale height Hs In this case the expected dispersion ΔY is
given by
ΔYHs a
p
asymp2
sinθρρ
(615)
where θ is the angle of entry of the meteoroid with respect to the horizontal and ρp is its
density Because the scale heights of the atmospheres of the earth Venus and Mars are all
similar the dispersion of clusters of fragments is expected to be roughly a factor of ten dif-
ferent among these bodies increasing from Mars to earth to Venus as observed
the atmospheric blast wave and thermal radiation produced by an entering meteorite
may also affect the surface the 1908 explosion at tunguska river Siberia was probably
httpswwwcambridgeorgcoreterms httpsdoiorg101017CBO9780511977848007Downloaded from httpswwwcambridgeorgcore University of Chicago on 25 Jan 2017 at 024451 subject to the Cambridge Core terms of use available at
67 Cratered landscapes 255
produced by the entry and dispersion of a 30 to 50 m diameter stony meteorite that leveled
and scorched about 2000 km2 of meter-diameter trees radar-dark ldquosplotchesrdquo up to 50 km
in diameter on the surface of Venus are attributed to pulverization of surface rocks by strong
blast waves from meteorites that were fragmented and dispersed in the dense atmosphere
67 Cratered landscapes
Impact craters have been treated as individual entities in the preceding sections However
as spacecraft images abundantly illustrate the surfaces of most planets and satellites are
figure 619 oblique view of a heavily cratered landscape on the Moon this area is to the northeast
of crater tsiolkovskiy on the Moonrsquos farside the large crater near the center is about 75 km in
diameter but craters as small as a few tens of meters in diameter can be discerned in the foreground
apollo 17 photo 155ndash23702 (H)
httpswwwcambridgeorgcoreterms httpsdoiorg101017CBO9780511977848007Downloaded from httpswwwcambridgeorgcore University of Chicago on 25 Jan 2017 at 024451 subject to the Cambridge Core terms of use available at
Impact cratering256
scarred by vast numbers of impact craters that range in size from the limit of resolution to a
substantial fraction of the planetrsquos or satellitersquos radius In some places impact craters are the
dominant landform little of the observed topography can be ascribed to any other process
(see figure 619) craters on such a surface exhibit degrees of preservation ranging from
fresh craters with crisp rims and bright rays to heavily battered or buried craters that may
only betray their presence by a broken rim segment or a ragged ring of peaks
the present crater population on surfaces such as the lunar highlands or the more lightly
cratered lunar mare is the outcome of a long history of impact cratering events analysis
of the existing crater population in conjunction with some assumptions about the rate of
crater formation may reveal a great deal about the geologic history of a surface a typical
population is composed of craters with a wide range of sizes some of which are relatively
fresh with sharp rims extensive rays and crisp ields of small secondary craters whereas
others are progressively more degraded on parts of such airless bodies as the Moon the
principal agent of degradation is other impacts producing a surface that appears to be
crowded with craters In other regions volcanism has created plains that are more or less
sparsely cratered elsewhere in the Solar System the activities of wind water or tectonic
processes such as subduction erase craters within a short time of their formation leading to
landscapes like the earthrsquos where impact craters are among the rarest of landforms or like
that of Venus where the low abundance of craters may be due to an ancient era of resur-
facing that obliterated most pre-existing craters
Study of crater populations is thus a powerful tool for geologic investigation of the sur-
faces of other planets and satellites If the lux and size distribution of the impacting bodies
were known studies of crater populations could yield absolute ages of the surface and
some of its features although the original lux is often unknown relative ages can usually
be obtained Before geologic inferences can be drawn from crater populations however
we must have an effective means of describing and comparing them unfortunately a large
number of descriptions have evolved over the years as each group of scientists studying
a particular problem created their own specialized means of presenting population data
making it dificult to compare the results of different groups In this section I adopt the
major recommendations of a naSa panel convened in 1978 (naSa 1978) to standardize
the presentation of crater population data
671 Description of crater populations
the irst step in an investigation of the crater population on a given surface is to select
an area that is believed to have had a homogeneous geologic history It would make little
sense for example to combine the crater population of a sparsely cratered lava plain with
that of a densely cratered upland once such an area is selected the craters that lie within
it are counted Most crater population studies include all recognizable craters regardless
of their state of degradation Where a large enough population exists more specialized
studies may be performed in which the numbers of fresh craters slightly degraded craters
degraded craters etc are counted separately although these studies leave some room for
httpswwwcambridgeorgcoreterms httpsdoiorg101017CBO9780511977848007Downloaded from httpswwwcambridgeorgcore University of Chicago on 25 Jan 2017 at 024451 subject to the Cambridge Core terms of use available at
67 Cratered landscapes 257
interpretation as to what a ldquorecognizablerdquo or ldquofreshrdquo crater is intercomparison of results
between different groups of crater counters has generally shown good agreement
craters occur in a wide variety of sizes so that the principal information about a cra-
ter population is the number of craters per unit area as a function of crater diameter It is
presumed that impact cratering is a random process and that there is no signiicance to the
particular location of craters within the selected area so that only data on the number and
diameter of craters is kept
Incremental distribution numerous ways of representing the number of craters as a
function of diameter have been developed one very simple method is to list the number
N of craters per unit area with diameters between two limits say between Da and Db the
problem with this method is that the resulting number of craters depends upon the interval
ΔD = Db ndash Da and different crater counters may choose different intervals furthermore if
the interval ΔD is ixed at say 1 km this might be convenient for craters with diameters
between 5 and 20 km but would be too large for craters with diameters less than 1 km and
too small for craters larger than 100 km a simple way to overcome this problem is to let
the interval depend on crater size thus the number of craters may be tabulated between
D and 2D where the intervals increase in octaves actually this binning has been found
to be too coarse in practice so that most such incremental size-frequency distributions
use an interval of D to 2D the incremental distribution still suffers however from the
arbitrary choice of a starting diameter D It is now recommended that the bins be chosen so
that one bin boundary is at D = 1 km
Cumulative distribution although the incremental size-frequency distribution could be
successful if the same bin sizes and boundaries are universally adopted it lacks funda-
mental simplicity another distribution has long been used that is independent of bin size
this is the cumulative size-frequency distribution In this distribution the number Ncum of
craters per unit area with diameters greater than or equal to a given diameter D is tabulated
not only is the resulting distribution Ncum(D) independent of bin size but any desired incre-
mental distribution can be easily generated from it since the number of craters N per unit
area in the interval between Da and Db is simply
N(Da Db) = Ncum(Da) minus Ncum(Db) (616)
where Dbgt Da N(DaDb) is necessarily positive or zero by the deinition of the cumula-
tive number distribution the only disadvantage of the cumulative distribution is that the
cumulative number of craters at some given diameter depends upon the number of craters
at all larger diameters although this is rarely a major problem cumulative distributions in
limited-diameter intervals (often controlled by the size of the region being analyzed) have
to be adjusted in overall value to join with the distributions from other diameter ranges the
slope of the cumulative plot is not of course affected by such adjustments
It has been found in practice that the cumulative number distribution closely approxi-
mates a power function of diameter
Ncum = c Dminusb (617)
httpswwwcambridgeorgcoreterms httpsdoiorg101017CBO9780511977848007Downloaded from httpswwwcambridgeorgcore University of Chicago on 25 Jan 2017 at 024451 subject to the Cambridge Core terms of use available at
Impact cratering258
where b = 18 for post-mare craters on the Moon between 4 and several hundred kilometers in
diameter (and within the limited data also seems to hold for impact craters on the earth)
It is intriguing that the power b is close to 2 a power 2 in equation (617) is a kind of
ldquomagicrdquo number because when b = 2 the coeficient c is dimensionless (remember Ncum
is number per unit area) there is no fundamental length or size scale in a crater popula-
tion with this power law so that such a population looks the same at all resolutions (see
figure 620 for an illustration of such a distribution) It is impossible to tell from a photo-
graph of such a cratered landscape whether the scale of the photograph is 100 km or 1 m
(of course other clues than crater population alone may give a hint about the actual scale)
a population of craters described by a power near 2 might arise either from a simple for-
mation process in which there is truly no fundamental length scale or from a series of inde-
pendent processes that are so complex and chaotic that no one scale dominates
Because the cumulative number distribution of equation (617) falls as a power of D it is
conventional to graph such distributions on a log-log plot on which a power law is a straight
line with slope equal to ndashb (figure 621) unfortunately cumulative number distributions plot-
ted in this way have a tendency to look all the same apparently differing only in the absolute
number density of craters although this may be adequate or even desirable for some purposes
figure 620 a population of craters with a slope of b = 2 is structured such that for each crater of
diameter D there are four times as many craters of diameter D2 and 16 times as many as for diameter
D4 When mixed together the population looks very much like that seen on the heavily cratered
areas of the Moon and other planets note that the total area in each size class of this distribution is
the same a characteristic that may explain why such distributions are so common when formed by
either coagulation or impact fragmentation ndash processes that both depend on surface area
httpswwwcambridgeorgcoreterms httpsdoiorg101017CBO9780511977848007Downloaded from httpswwwcambridgeorgcore University of Chicago on 25 Jan 2017 at 024451 subject to the Cambridge Core terms of use available at
10ndash4(a)
Geom
etric saturation
Small crater equilibrium
= 7 N
S
10ndash6
10ndash8
10ndash10
Cum
ula
tive
num
ber
ge D
m
2
10ndash12
10ndash14
10ndash16
101 102
300 m
4 k
m
103 104
Crater diameter D m
105 106
101
100
312
10ndash1R
(b)
10ndash2
10ndash3
101 102 103
Crater diameter m
300 m
4 k
m
Geometric saturation
Small crater equilibrium R = 022
104 105 106
figure 621 the post-mare crater population on the Moon in both a cumulative plot (a) and r-plot (b)
format the population shows three distinct segments at small diameters (D lt 300 m) the population
is in equilibrium and the cumulative number is proportional to Dndash2 r is constant for this population
at intermediate diameters (300 m lt D lt 4 km) the cumulative number is proportional to Dndash34
whereas at larger diameters (D gt 4 km) it falls as Dndash18 the curves are dashed at the largest diameters
(D gt 200 km) because no craters of this size have yet formed on the mare the changes in slope of
the crater population are especially evident in the r-plot format the dashed line labeled ldquogeometric
saturationrdquo is an upper limit to the crater density on any surface after Melosh (1989 figure 102)
httpswwwcambridgeorgcoreterms httpsdoiorg101017CBO9780511977848007Downloaded from httpswwwcambridgeorgcore University of Chicago on 25 Jan 2017 at 024451 subject to the Cambridge Core terms of use available at
Impact cratering260
such a mode of presentation obscures slight but signiicant differences in crater populations
Since these differences can be useful in deciphering the source of the crater population or other
geologic processes that acted on it another type of plot is in common use
The R plot this type of plot exploits the close approach of b to 2 in equation (617) by
graphing essentially the ratio between the actual crater distribution and a distribution with
slope ndash2 a crater population in which the actual slope is minus2 would thus plot as a hori-
zontal line the conventional plot of this type is called an r plot (r stands for ldquorelativerdquo)
It is based on an incremental distribution with 2 intervals between diameter bins note
that the slope of this type of incremental plot is the same as the cumulative distribution of
equation (617) although the coeficient is different It is easy to show that if b is constant
over the interval D to 2D then the incremental number density is
N D D c Db b( ) ( ) 2 1 2 2= minus minus minus
(618)
the deinition of the r plot includes several numerical factors In terms of the cumula-
tive number distribution it is given by
r D D N D N D( ) ( ) ( )
equivminus
minus
2
2 12
3 42
cum cum
(619)
figure 621 compares the cumulative and r plots for pose-mare craters on the Moon
a useful interpretation of r is to note that up to a factor of 365 r is equal to the fraction
fc(D) of the total area covered by craters in the diameter interval D to 2D
r(D) = 365 fc(D) (620)
where both r and fc are dimensionless numbers With this interpretation it is easy to see
that in a crater population with b = 2 for which r and fc are constant craters in every size
interval occupy the same fraction of the total area If b lt 2 as it is for post-mare craters on
the moon r(D) increases as D increases so that large craters occupy a larger fraction of
the surface than small craters If b gt 2 small craters occupy a larger fraction of the surface
than do large ones
The production population the impact of the primary meteoroid lux on a planetary
surface results in some deinite rate of crater production as a function of diameter as
the surface initially taken to be craterless ages more and more craters accumulate on it
the integral of the crater-production rate over the age of the surface is a special theoret-
ical crater population called the production population the production population is the
size-frequency distribution of all the craters excluding secondary craters that have ever
formed since craters began to accumulate on the surface the population is theoretical in
the sense that it neglects all crater-obliteration processes and is hence formally unobserv-
able although the crater population on lightly cratered surfaces may approach the produc-
tion population closely enough for practical applications
the production population is a useful concept for the study of the evolution of crater pop-
ulations Such studies usually begin with an assumed or inferred production population and
httpswwwcambridgeorgcoreterms httpsdoiorg101017CBO9780511977848007Downloaded from httpswwwcambridgeorgcore University of Chicago on 25 Jan 2017 at 024451 subject to the Cambridge Core terms of use available at
67 Cratered landscapes 261
then postulate a model of crater obliteration that will it is hoped result in a predicted crater
population that matches the observed population the crater-obliteration model is a function
of the process being modeled In the next section we shall consider only the process of crater
obliteration by other craters as we shall see this can be a surprisingly complex process
672 Evolution of crater populations
Given the fact that craters accumulate randomly on the surface of a planet at a rate that is
on average constant it should be possible to begin with a knowledge of the rate at which
craters form as a function of their size and then predict the crater population at any future
time furthermore it should be possible within certain limits to invert an evolved crater
population and deduce both how long it has been accumulating (that is the age of the sur-
face) and the rate of crater formation as a function of size
Simple as these propositions may seem there has been great dificulty in actually imple-
menting them the main problem is the interaction between craters of different sizes the
formation of a single large crater on a surface may obliterate many smaller craters while it
takes many small craters to batter a large crater beyond recognition It has taken many years
to fully understand the effects of this interaction on crater populations and some aspects of
it are not completely understood today
the conceptually simplest population is one in which all craters are the same diameter
although no natural examples of such a population are known the study of its evolution
introduces several important concepts Moreover there are crater populations such as that
on Mimas in which many of the craters fall within a relatively narrow size range and that
may therefore be approximated by a population of craters all of the same size
Time
Observed
Producti
on
teq
EquilibriumC
rate
rsu
nit a
rea
Ns
Neq
Geometric saturation
figure 622 evolution of a crater population in which all craters are the same size the graph shows
how the crater density increases as a function of time although the production population rises
linearly with time the number of craters that can be counted on the surface eventually reaches a
limit well below the geometric saturation limit once the population has reached equilibrium each
additional crater obliterates on average one old crater
httpswwwcambridgeorgcoreterms httpsdoiorg101017CBO9780511977848007Downloaded from httpswwwcambridgeorgcore University of Chicago on 25 Jan 2017 at 024451 subject to the Cambridge Core terms of use available at
Impact cratering262
The equilibrium population the evolution of this crater population is illustrated in
figure 622 as a function of time the plot shows that the observed crater population and
the production population initially increase at the same rate However as the density of
craters on the surface increases a few older craters are either overlapped by new ones or are
buried by their ejecta as this process continues some older craters are completely oblit-
erated by younger craters and the observed crater density falls below the production line
eventually the crater density becomes so high that each new crater that forms obliterates
on average one older crater at this stage the crater population has reached equilibrium no
further increase in crater density is possible although new craters continue to form and the
production population increases steadily in number
the attainment of equilibrium places severe constraints on attempts to date planetary
surfaces by crater counting up until equilibrium is attained at time teq in figure 622 the
crater density increases with the age of the surface so that knowledge of the crater produc-
tion rate permits computation of an absolute age from the crater density even if the pro-
duction rate is not known the relative ages of two surfaces may be obtained by comparing
their crater densities However once equilibrium is attained the crater density becomes
constant and only a lower limit on the age can be obtained the relative ages of two sur-
faces in equilibrium are also completely unconstrained since their crater densities are iden-
tical even though the surfaces may be widely different in age
Geometric saturation a useful concept introduced by Don Gault in 1981 (Project 1981)
is that of geometric saturation the idea is to deine a crater density that serves as an upper
limit to the number of craters that can possibly be recognized on a heavily cratered surface
for a population of craters all of the same size this limit is simply the number of craters
per unit area in a hexagonally closest packed coniguration neglecting any possibility of
obliteration by overlapping ejecta blankets In this case Ns = 115 Dminus2 the deinition of a
limiting crater density when craters are of different sizes is less objective Gault proposed
the limit
Ncs = 154 Dminus2 (621)
this crater density corresponds to r = 312 or a fractional area coverage fc = 085
these limits are shown in figure 621 It is clear that lunar crater populations fall well
short of this limiting density although the mare surface is apparently in equilibrium for
crater diameters less than about 300 m the crater density on even the most heavily cra-
tered surfaces seldom reaches more than about 3ndash5 of the geometric saturation limit
equation (621)
68 Dating planetary surfaces with impact craters
It has long been recognized that the number of impact craters per unit area could date
planetary surfaces Shoemaker et al (1963) who wrote the classic paper on this subject
realized that relative dates on the same planet could always be attained but absolute dates
require knowledge of the lux of impacting bodies
httpswwwcambridgeorgcoreterms httpsdoiorg101017CBO9780511977848007Downloaded from httpswwwcambridgeorgcore University of Chicago on 25 Jan 2017 at 024451 subject to the Cambridge Core terms of use available at
68 Dating planetary surfaces with impact craters 263
a full understanding of how to interpret crater populations as a function of size has been
long in coming the attainment of equilibrium by crater populations divides into two dis-
tinct cases (and a trivial intermediate) the irst and simplest case occurs when the pro-
duction population has a slope b steeper than 2 this case was studied by Gault (1970) and
offers the fewest conceptual dificulties unfortunately this distribution is only appropriate
for small (le300 m) craters on the lunar mare (see figure 621) although at the time Gault
performed his analysis it was believed to be valid for all crater sizes the size-frequency
distribution of larger lunar craters follows a power law with a slope b = l8 this distribu-
tion its the second case of an evolving population with slope b smaller than 2 and will be
treated shortly
681 b gt 2 population evolution
figure 623 illustrates the evolution of a production population with slope b steeper than
2 the left frame depicts the population at an early time t1 and the right frame is at a later
time t2 Because the production population is steeper than the geometric saturation line
mutual obliteration must occur for suficiently small craters (craters smaller than Deq(t1)
in figure 623) no matter how early the time unless of course the population has had
so little time to evolve that the statistics of small numbers of craters begins to play a role
Because the actual crater density cannot reach the geometric saturation limit the observ-
able crater density reaches equilibrium somewhere below this line the difference in the
Time t1
Log diameter
Time t2
Deq (t1) Deq (t2)
Log c
um
ula
tive
fre
quency
Observed
Observed
Equilibrium Equilibrium
Geom
etric saturation
Geometric saturation
Pro
ductio
n
Pro
ductio
n
figure 623 evolution of a crater population with slope b gt 2 the production population exceeds
the equilibrium line at small crater diameters Small craters are thus in equilibrium up to some
diameter Deq above which the observed population follows the production population the left panel
illustrates the population at a relatively early time tl and the right panel shows how the population has
changed at a later time t2 the equilibrium diameter Deq increases as a function of time although this
increase is generally not linear
httpswwwcambridgeorgcoreterms httpsdoiorg101017CBO9780511977848007Downloaded from httpswwwcambridgeorgcore University of Chicago on 25 Jan 2017 at 024451 subject to the Cambridge Core terms of use available at
Impact cratering264
number of craters between the projected production population and the observed popu-
lation is equal to the number of craters obliterated by later impacts It seems intuitively
reasonable that the equilibrium population should follow a line parallel to but below the
geometric saturation distribution Gault showed empirically in small-scale impact experi-
ments (figure 624) that this is the case and subsequent work has conirmed this result
both analytically (Soderblom 1970) and by Monte carlo computer simulations (Woronow
1977) In Gaultrsquos experiments the crater equilibrium density depends on the slope b of
the production population with steeper slopes giving a lower equilibrium crater density
Similar results were also obtained from the theoretical studies
the observed population at any one time in figure 623 is thus composed of two
branches Small craters follow an equilibrium line with slope b = 2 larger craters follow
the steeper production population curve the inlection point between these two curves is
at diameter Deq(t1) where the production curve crosses the equilibrium line the right-hand
figure 624 a laboratory-scale demonstration of the concept of crater equilibrium the photographs
are of a box 25 m square illed 30 cm deep with quartz sand the sand is topped with 2 cm of
carborundum powder to provide a color contrast Six sizes of projectile were ired into the box at
random locations simulating a production population with a slope index b = 33 similar to that of
small craters on the Moon time increases from the upper left horizontally to lower right equilibrium
is attained about halfway through the simulation although individual surface details vary from
frame to frame the crater population in the later frames remains the same from Gault (1970) photo
courtesy of r Greeley
httpswwwcambridgeorgcoreterms httpsdoiorg101017CBO9780511977848007Downloaded from httpswwwcambridgeorgcore University of Chicago on 25 Jan 2017 at 024451 subject to the Cambridge Core terms of use available at
68 Dating planetary surfaces with impact craters 265
frame in figure 623 shows the crater density at a later time the crater population is quali-
tatively similar to that at the earlier time except that the transition diameter Deq(t2) is larger
If the rate at which craters accumulate is constant (that is c in equation (617) is a linear
function of time) it is easy to show that the transition diameter Deq(t) grows as (time)1(bndash2)
conversely if the crater production rate slope b and the present Deq are known the age of
the surface can be computed
682 b lt 2 population evolution
figure 625 illustrates the evolution of a crater population with slope b less than 2 note that
in the unlikely event that b exactly equals 2 the observed crater density simply maintains
the slope of 2 until the density reaches equilibrium (which occurs simultaneously at all
diameters) after which the observed crater density remains constant and the slope remains
2 When b is less than 2 the situation is more complex In this case the production curve
exceeds the geometric saturation line at the large-diameter end of the scale Gaultrsquos (1970)
model could not deal with this situation and it took nearly 15 years before the implications
of this large-diameter crossing were understood in spite of the developing knowledge that
b ~ 18 for craters more than about 4 km in diameter on the lunar mare the situation was
Log diameter
1
Study area
Log c
um
ula
tive
fre
quencyu
nit a
rea
Observed
Geom
etric saturation
Production
figure 625 evolution of a crater population with slope b lt 2 the production population exceeds the
geometric saturation line at large diameters under these circumstances the evolution of the population
is dominated by large impacts that allow a number of small craters to accumulate before wiping the
surface clean the observed population line is always parallel to the production population but may
lie considerably below it the production population line is dashed at the large-crater end because
there must be at least one crater within the study area for the line to be meaningful the observed
population may approach geometric saturation if the entire study area is the site of one large impact
but the population will be dominated by luctuations because of the statistics of small numbers
httpswwwcambridgeorgcoreterms httpsdoiorg101017CBO9780511977848007Downloaded from httpswwwcambridgeorgcore University of Chicago on 25 Jan 2017 at 024451 subject to the Cambridge Core terms of use available at
Impact cratering266
resolved by c r chapman (chapman and McKinnon 1986) who performed a Monte
carlo simulation of crater population evolution that included a wider range of diameters
than had previously been possible
chapman realized that irst of all the large-diameter end of the cratering curve is domi-
nated by the statistics of small numbers even though the production curve apparently
crosses the geometric saturation line at all times enough time must pass after the formation
of the initial uncratered surface that at least one large crater has formed on it the crossing
of the two curves makes little sense unless the cumulative number of craters larger than Ds
is at least 1 in the inite area under study Since the probability of a small impact is larger
than the probability of a large impact for any b gt 0 a population of small craters initially
develops that follows the production curve closely eventually however a large impact
occurs With b lt 2 there is a high probability that this large crater obliterates all or a signii-
cant fraction of the study area wiping out nearly all previous smaller craters the number
of observed craters thus suddenly drops below the production curve as time passes small
craters again accumulate on the surface the slope of this new population is equal to that of
the production curve but as shown in figure 625 the cumulative number of such craters
is smaller than the production population the number of small craters continues to grow
until the next large impact wipes the slate clean once more
under these circumstances there is no ldquoequilibriumrdquo population although the observed
crater density is always well below the geometric saturation limit the observed crater
density luctuates widely and irregularly controlled by the large rare catastrophic-impact
events In spite of these wide variations in density the slope of the observed population at
any given time is roughly equal to that of the production population the crater densities
on a surface of this type are spatially patchy being low at the sites of recent large impacts
and high in areas that have not been struck for a long time by one of the large impacts
Dating such a surface is nearly impossible after the irst large impact unless some area can
be found that has escaped all large impacts In practice all that can be determined from
the crater density on such a surface is the date since the last large impact that affected the
particular study region
683 Leadingtrailing asymmetry
an important assumption in the relative dating of planetary surfaces is that the cratering
rate is uniform over the entire body although this is true to a high degree of approximation
for most bodies in the Solar System it may be badly violated for synchronously locked
planets and moons our Moon and the Galilean satellites of Jupiter circulate about their
primary with the same face always leading Just as a car driving into a rainstorm encounters
more raindrops on its front windscreen then on the back window the impact lux on syn-
chronous satellites is higher on the leading side than the trailing side leading to an asym-
metry in cratering rate that may be as large as a factor of 20 or more depending on the
cratering population (Zahnle et al 2001) the degree of asymmetry depends on the orbits
of the impactors the asymmetry is largest for impactors in orbit about the same primary
httpswwwcambridgeorgcoreterms httpsdoiorg101017CBO9780511977848007Downloaded from httpswwwcambridgeorgcore University of Chicago on 25 Jan 2017 at 024451 subject to the Cambridge Core terms of use available at
69 Impact cratering and planetary evolution 267
or moving at a low relative velocity In this case the impact velocity on the leading hemi-
sphere is the sum of the orbital velocities of the satellite and impactor while the velocity on
the trailing hemisphere is the difference so that not only is the lux of impactors different
between the leading and trailing hemispheres but the different impact velocities mean that
the same size of impactor yields a different size of inal crater the leadingtrailing asym-
metry is smaller for heliocentric populations of impactors comets for example produce
much more uniform crater populations than co-orbiting objects on synchronous satellites
neptunersquos moon triton has a large leadingtrailing crater asymmetry but the Galilean
satellites of Jupiter show much less crater asymmetry than expected on theoretical grounds
Some process must therefore occasionally reorient their surfaces relative to Jupiter either
an exchange of their primary-facing and opposite hemispheres due to exchange of their A
and B moments of inertia by internal or external (cratering) mass transfers or perhaps the
momentum impulse of a large cratering event
69 Impact cratering and planetary evolution
over the last few decades it has become increasingly clear that impact cratering has played
a major role in the formation and subsequent history of the planets and their satellites
aside from their scientiic interest impact craters have also achieved a modest economic
importance as it has become recognized that the fabulously rich Sudbury nickel deposit
in ontario canada is a tectonically distorted 140-km diameter impact crater Similarly
the Vredefort structure in South africa is a large old impact crater oil production has
been achieved from a number of buried impact craters such as the 10-km diameter red
Wing creek crater in the Williston Basin and the 32-km diameter newporte structure in
north Dakota on a more homely level the 60-km diameter ring-shaped depression in the
Manicouagan crater in eastern Quebec is currently used as a reservoir supplying water to
new york city
691 Planetary accretion
Modern theories of planetary origin suggest that the planets and the Sun formed simul-
taneously 46 times 109 yr ago from a dusty hydrogen-rich nebula nebular condensation and
hydrodynamic interactions were probably only capable of producing ca 10-km diameter
ldquoplanetesimalsrdquo that accreted into planetary-scale objects by means of collisions the time-
scale for accretion of the inner planets by mutual collisions is currently believed to be
between a few tens and one hundred million years Initially rather gentle these collisions
became more violent as the random velocities of the smaller planetesimals were increased
during close approaches to the larger bodies the mean random velocity of a swarm of
planetesimals is comparable to the escape velocity of the largest object so as the growing
planetary embryos reached lunar size collisions began to occur at several kilometers per
second at such speeds impacts among the smaller objects were disruptive whereas the
larger objects had suficient gravitational binding energy to accrete most of the material
httpswwwcambridgeorgcoreterms httpsdoiorg101017CBO9780511977848007Downloaded from httpswwwcambridgeorgcore University of Chicago on 25 Jan 2017 at 024451 subject to the Cambridge Core terms of use available at
Impact cratering268
log D
log M
log A
log N
cum
log D
log D
M = Crdquo D
slope = 1
slope = 0
A = Crsquo
slope = ndash2
Ncum = C Dndash2
(a) (b)
(c)
figure 626 the numerical foundation of impact catastrophism the size-frequency distribution of
a typical crater population with slope b = 2 is shown in panel (a) In any such distribution there are
many more small craters than large ones Panel (b) shows the area of craters as a function of diameter
this distribution is lat the total area of small craters and large craters is equal (refer back to figure
620) Panel (c) shows however that the mass is concentrated at the large-size scale so that despite
the overwhelming numerical superiority of small craters the few large ones are the most important
in terms of either mass or energy delivered
that struck them Infalling planetesimals bring not only mass but also heat to the growing
planets In the past it was believed that the temperature inside a growing planet increased
in a regular way from near zero at the center to large values at the outside relecting the
increase in collision velocity as the planet became more massive However it now seems
probable that the size distribution of the planetesimal population was more evenly graded
between large and small objects and that each growing planetary embryo was subjected
to many collisions with bodies comparable in size to the embryo itself Such catastrophic
collisions would deposit heat deep within the core of the impacted body wiping out any
regular law for temperature increase with increasing radius and making the thermal evolu-
tion of growing planets rather stochastic
692 Impact catastrophism
although small craters (and the impactors that created them) are overwhelmingly more
abundant than large ones in terms of numbers the characteristic b asymp 2 slope of most such
httpswwwcambridgeorgcoreterms httpsdoiorg101017CBO9780511977848007Downloaded from httpswwwcambridgeorgcore University of Chicago on 25 Jan 2017 at 024451 subject to the Cambridge Core terms of use available at
69 Impact cratering and planetary evolution 269
distributions in the Solar System implies that most of the mass actually resides at the large
end of the size spectrum (see figure 626) this circumstance gives rise to the idea of
impact catastrophism although small impacts are relatively common all of the small
impacts combined do less geologic work than a few large impacts this is the formal def-
inition of a catastrophic process and it is a good description of the way that impacts affect
the geological evolution of the planets It also implies that stochastic processes cannot be
neglected where impacts play a role except in situations where b is substantially larger
than 2 such as for the ShoemakerndashGault theory of regolith evolution on the Moon
note that the usual statistical mechanical idea of energy equipartition does not play a
role in the Solar System the dynamics of the Solar System are such that the time to relax
to a state of thermal equilibrium is far far longer than the age of the Solar System so that
the biggest most massive objects also carry the most energy
693 Origin of the Moon
the origin of the Moon is now attributed to a collision between the proto-earth and a Mars-
size protoplanet near the end of accretion 45 times 109 yr ago this theory has supplanted the
three classic theories of lunar origin (capture ission and co-accretion) because only the
giant impact theory provides a simple explanation for the Moonrsquos chemistry as revealed
in the lunar rocks returned by apollo one view of this process is that a grazing collision
vaporized a large quantity of the proto-earthrsquos mantle along with a comparable quantity of
the projectile While most of the mass of the projectile merged with the earth (incidentally
strongly heating the earth If the earth was not molten before this impact it almost certainly
was afterward) one or two lunar masses of vapor condensed into dust in stable Keplerian
orbits about the earth and then later accumulated together to form the Moon
694 Late Heavy Bombardment
Sometime after the Moon formed and before about 38 times 109 yr ago the inner planets and
their satellites were subjected to the ldquolate Heavy Bombardmentrdquo an era during which the
impact luxes were orders of magnitude larger than at present the crater scars of this period
are preserved in the lunar highlands and the most ancient terrains of Mars and Mercury a
it to the lunar crater densities using age data from apollo samples gives a cumulative crater
density through geologic time of
Ncum (D gt 4 km) = 268 times 10minus5 [T + 457 times 10minus7 (eλT minus 1)] (622)
where Ncum(D gt 4 km) is the cumulative crater density (craterskm2) of craters larger than
4 km diameter T is the age of the surface in Gyr (T=0 is the present) and λ = 453 Gyrndash1
the current cratering rate on the moon is about 27 times 10ndash14 craters with D gt 4 kmkm2yr
on the earth the cratering rate has been estimated to be about 18 times 10ndash15 craters with
D gt 226 kmkm2yr which is comparable to the lunar lux taking into account the dif-
ferent minimum sizes since the cumulative number of craters Ncum(D) ~ Dndash18 there is
httpswwwcambridgeorgcoreterms httpsdoiorg101017CBO9780511977848007Downloaded from httpswwwcambridgeorgcore University of Chicago on 25 Jan 2017 at 024451 subject to the Cambridge Core terms of use available at
Impact cratering270
currently much debate about these cratering rates which might be uncertain by as much
as a factor of 2
although equation (622) describes an impact lux that decreases monotonically with
time there is currently much debate about the possible reality of an era of ldquoheavy bombard-
mentrdquo between about 42 and 39 Gyr ago in which the cratering rate reached a local peak
(Strom et al 2005) It is now supposed that eccentric asteroids from the main asteroid belt
caused this peak in lux these asteroids were mobilized as destabilizing orbital resonances
swept through the asteroid belt when Jupiter and Saturn underwent an episode of planetary
migration the heavily cratered surfaces of the Moon and terrestrial planets are supposed
to have formed at this time the intense lux obliterated any evidence of an earlier surface
on these bodies
the cratering rates on Mars and Venus are believed to be comparable to that on the earth
and Moon however the exact fraction of the earthMoon rate is presently uncertain and
a subject of controversial discussion the exact rates will probably remain unknown until
radiometric dates on cratered surfaces are determined by means of sample returns from
these bodies cratering rates in the outer Solar System are even more uncertain and con-
troversial Most of the craters on the satellites of Jupiter and Saturn are probably formed
by comets whose lux is very uncertain at the small sizes represented by most observed
craters (Dones et al 2009)
the high cratering rates in the past indicate that the ancient earth must have been heavily
scarred by large impacts Based on the lunar record it is estimated that more than 100 impact
craters with diameters greater than 1000 km should have formed on the earth although
little evidence of these early craters has yet been found it is gratifying to note the recent
discovery of thick impact ejecta deposits in 32 to 35 Gyr archean greenstone belts in both
South africa and Western australia Since rocks have recently been found dating back to
42 Gyr well into the era of heavy bombardment it is to be hoped that more evidence for
early large craters will be eventually discovered Heavy bombardment also seems to have
overlapped the origin of life on earth It is possible that impacts may have had an inluence
on the origin of life although whether they suppressed it by creating global climatic catas-
trophes (up to evaporation of part or all of the seas by large impacts) or facilitated it by
bringing in needed organic precursor molecules is unclear at present the relation between
impacts and the origin of life is currently an area of vigorous speculation
695 Impact-induced volcanism
the idea that large impacts can induce major volcanic eruptions is one of the recurring
themes in the older geologic literature this idea probably derives from the observation
that all of the large impact basins on the Moonrsquos nearside are looded with basalt However
radiometric dates on apollo samples made it clear that the lava inillings of the lunar basins
are nearly 1 Gyr younger than the basins themselves furthermore the farside lunar basins
generally lack any lava inilling at all the nearside basins are apparently looded merely
because they were topographic lows in a region of thin crust at the time that mare basalts
httpswwwcambridgeorgcoreterms httpsdoiorg101017CBO9780511977848007Downloaded from httpswwwcambridgeorgcore University of Chicago on 25 Jan 2017 at 024451 subject to the Cambridge Core terms of use available at
Further reading 271
were produced in the Moonrsquos upper mantle Simple estimates of the pressure release caused
by stratigraphic uplift beneath large impact craters make it clear that pressure release melt-
ing cannot be important in impacts unless the underlying mantle is near the melting point
before the impact (Ivanov and Melosh 2003) thus it is probably safe to say that to date
there is no irm evidence that impacts can induce volcanic activity Impact craters may
create fractures along which pre-existing magma may escape but themselves are probably
not capable of producing much melt nevertheless there were massive igneous intrusions
associated with both the Sudbury and Vredefort structures whose genesis is sometimes
attributed to the impact although in this case they may have been triggered by the uplift of
hot lower crust further study of these issues is needed
696 Biological extinctions
the most recent major impact event on earth was the collision between the earth and a 10
to 15 km diameter asteroid 65 Myr ago that ended the cretaceous era and caused the most
massive biological extinction in recent geologic history evidence for this impact has been
gathered from many sites over the last decade and is now incontrovertible (Schulte et al
2010) first detected as an enrichment of the siderophile element iridium in the ca 3 mm
thick KPg (cretaceousPaleogene) boundary layer in Gubbio Italy the iridium signature
has now been found in more than 100 locations worldwide in both marine and terrestrial
deposits accompanying this iridium are other siderophile elements in chondritic ratios
shocked quartz grains coesite stishovite and small (100ndash500 μm) spherules resembling
microtektites all these point to the occurrence of a major impact at the KPg boundary
the impact crater is located beneath about 1 km of sedimentary cover on the yucatan
Peninsula of Mexico Known as the chicxulub crater it is about 170 km in diameter and is
presently the subject of intensive study
Further reading
a general survey of all aspects of impact cratering from which several sections of this
chapter were abstracted was published by Melosh (1989) this book is presently out of
print and often dificult to obtain but many university libraries possess a copy a more
popular but generally clear and accurate description of terrestrial impact craters can be
found in Mark (1987) a good description of the three largest craters on earth can be found
in Grieve and therriault (2000) although deeply eroded or otherwise obscured these cra-
ters provide the ldquoground truthrdquo about impacts that images of extraterrestrial craters cannot
give the surface of our Moon is dominated by impact craters and so the account of its
geology by Wilhelms (1987) is necessarily an account of the process of impact cratering
Don Wilhelms also wrote an insightful and very readable historical account of lunar explor-
ation that emphasizes the growing appreciation of impact cratering though the course of the
apollo missions (Wilhelms 1989) the importance and mechanics of impact crater col-
lapse and the simple-to-complex transition is treated by Melosh and Ivanov (1999) while
httpswwwcambridgeorgcoreterms httpsdoiorg101017CBO9780511977848007Downloaded from httpswwwcambridgeorgcore University of Chicago on 25 Jan 2017 at 024451 subject to the Cambridge Core terms of use available at
Impact cratering272
the special features of oblique impacts are the subject of a review by Pierazzo and Melosh
(2000) the best current summary of the scaling of impact crater ejecta was stimulated by
analysis of the ejecta from the Deep Impact Mission cratering event (richardson et al
2007) a ine review of the details of crater counting and the application of crater counts
to the dating of surfaces appears in a rather unlikely-sounding book which was the subject
of a collaborative project called the Basaltic Volcanism Study Project (Project 1981) the
near-ield effects of an impact on the earth are reported by an on-line computer program
whose basic algorithms are described in detail by collins et al (2005)
Exercises
61 Crater dimensions
a) Suppose that the transient crater that collapsed to form the Imbrium Basin on the Moon
was Dtc = 800 km in diameter assuming that it struck vertically at vi = 22 kms what
was the diameter of the asteroid that produced Imbrium
use the revised SchmidtndashHolsapple scaling law (this form implicitly assumes that the
target and projectile have the same density)
d Dg
vi
=
0 6711 28
2
0 277
tc
(MKS units)
b) If this object struck at 45deg to the vertical what is the period of the Moonrsquos rotation
thus imparted assuming the Moon was free in space (unlikely but easy to analyze)
compare this to the Moonrsquos current rotation rate What can you conclude about the abil-
ity of large impacts to unlock the Moonrsquos present synchronous rotation state
62 Crater collapse
a) the empirical relation for the thickness T of an impact craterrsquos ejecta blanket indi-
cates that the average thickness declines as (Rc r)3 where Rc is the crater radius and
Dc
Tc
T(r)
h
rr3
1
figure 627
httpswwwcambridgeorgcoreterms httpsdoiorg101017CBO9780511977848007Downloaded from httpswwwcambridgeorgcore University of Chicago on 25 Jan 2017 at 024451 subject to the Cambridge Core terms of use available at
Exercises 273
r is distance from the craterrsquos center assuming that the interior shape of a simple
(or transient) crater is described by a paraboloid of revolution with diameterdepth
ratio Dc h asymp 5 (use the rim-to-rim diameter Dc and depth h below the original ground
surface) and assuming that the volume of the ejecta blanket and crater bowl are
equal derive an equation for the ejecta blanket thickness Tc at the rim (Hint It is
permissible at this level of accuracy to treat the inner edge of the ejecta blanket as if
it were a vertical cliff an exact result however can be obtained with a bit of effort
and anyone who can legitimately get the result Tc=h5 should get extra credit for this
assignment)
b) now suppose the crater collapses to a uniform constant depth hf (3 km for the Moon)
over its entire interior again using volume conservation how much does the rim-to-rim
diameter increase for a 100 km (inal diameter) crater
63 Swedish rock rain
In addition to the 5 proven and 33 possible impact crater scars that adorn the country of
Sweden lilljequist and Henkel (1996) proposed the existence of a truly world-class cra-
ter the uppland structure which is supposed to be 320 km in diameter It encompasses
the area around Stockholm up to uppsala using Shoemakerrsquos estimated cratering rate on
earth Ncum (D gt 226 km) = 18 x 10ndash15 craterskm2yr and the post-mare size exponent
b = 18 (Ncum ~ Dndash18) compute the largest crater likely to have formed in Sweden (area ~
450 000 km2) since the formation of its surface rocks (1600 to 2300 Myr use 2000 Myr as
a reasonable average)
How does this compare to the size of the putative uppland structure Put another way
what is the probability of the formation of a crater as large as uppland in the past 2000
More exact
Simple geometry
- OK for this problem
hf
Df
Df
figure 628
httpswwwcambridgeorgcoreterms httpsdoiorg101017CBO9780511977848007Downloaded from httpswwwcambridgeorgcore University of Chicago on 25 Jan 2017 at 024451 subject to the Cambridge Core terms of use available at
Impact cratering274
Myr in Sweden What does this tell you about the uppland ldquocraterrdquo note that the largest
conirmed crater in Sweden is the 55 km-diameter Siljan structure
using the same cratering lux compute the maximum size of crater likely to be found
in the uK (now it is the studentrsquos task to look up the area and mean geologic age of that
fair but damp archipelago) note that a single probably 4 km diameter impact crater was
discovered in the north Sea by Stewart and allen (2002) ndash the Silverpit crater
64 Those blasted Martian rocks
f Houmlrz et al (1999) argued that dish-shaped depressions on large rocks at the Pathinder
landing site on Mars along with split boulders might be due to the impact of millimeter to
centimeter diameter meteorites at speeds of 300 ms or more (corresponding to the muzzle
velocity of a high-speed rile)
evaluate the ability of the Martian atmosphere (surface pressure PS = 600 Pa) to stop
small meteoroids (average pre-atmospheric speed 7 kms) by comparing the mass of the
projectile to the mass of atmospheric gases swept out of the cylindrical volume deined by
the meteoroidrsquos path (assume a straight trajectory for the purposes of this estimate)
the total mass of atmospheric gas above a unit area on the surface of a planet is PS g
where g is the acceleration of gravity at the surface Perhaps surprisingly you do not need
to know the density of the atmosphere as a function of height to do this problem (convince
yourselves of this)
using momentum conservation estimate how much the meteoroid is slowed upon arriv-
ing at the surface as a function of its mass and density finally describe how reasonable the
Horzndashcintala proposal really is for both stony and iron meteoroids could this process be
effective on high mountaintops on earth Why or why not
Extra credit
as the meteoroid traverses the atmosphere it encounters a ram pressure of ρav2 on its lead-
ing face ( ρa is the density of the atmosphere 00104 kgm3 at the surface of Mars) while its
rear is nearly a vacuum for supersonic light estimate the maximum stresses thus acting to
crush the meteoroid and compare them to the typical strength of rock or iron for the mete-
oroids in the problem above (nB you do have to know the height distribution of density
for this problem ndash you may want to know that the scale height of the Martian atmosphere
is about 10 km)
65 Titan gets its kicks
one of the mysteries about Saturnrsquos large moon titan is its (slightly) eccentric orbit
e = 0028 If titan could dissipate tidal energy as Io or europa does its orbit would have
circularized long ago It has been proposed that titanrsquos Xanadu region is a gigantic impact
httpswwwcambridgeorgcoreterms httpsdoiorg101017CBO9780511977848007Downloaded from httpswwwcambridgeorgcore University of Chicago on 25 Jan 2017 at 024451 subject to the Cambridge Core terms of use available at
Exercises 275
structure 700 km in diameter (with an ejecta blanket bringing the diameter of the entire
feature to 1800 km) using the impact crater scaling relation in Problem 61 estimate the
size of the object that could have made this crater assuming a cometary impact velocity of
30 kms (do not forget the difference between the transient and inal crater) If this object
struck the equator of titan at the optimum place and angle to transform its linear momen-
tum to orbital angular momentum could this impact have imparted enough momentum
to account for titanrsquos present eccentricity you may need to know that the orbital angular
momentum H of a planet of mass m circling a body of mass M with a semimajor axis of R
and eccentricity e is
H m GMR e= minus( )1 2
I will leave you with the task of looking up the values of the necessary parameters Donrsquot
forget that you are looking for a change of orbit from circular (e = 0) to elliptical note that
this problem is akin to the oft-asked question of whether the KPg impact that killed the
dinosaurs could also have knocked the earth ldquoout of its orbitrdquo What do you think about
this possibility
httpswwwcambridgeorgcoreterms httpsdoiorg101017CBO9780511977848007Downloaded from httpswwwcambridgeorgcore University of Chicago on 25 Jan 2017 at 024451 subject to the Cambridge Core terms of use available at
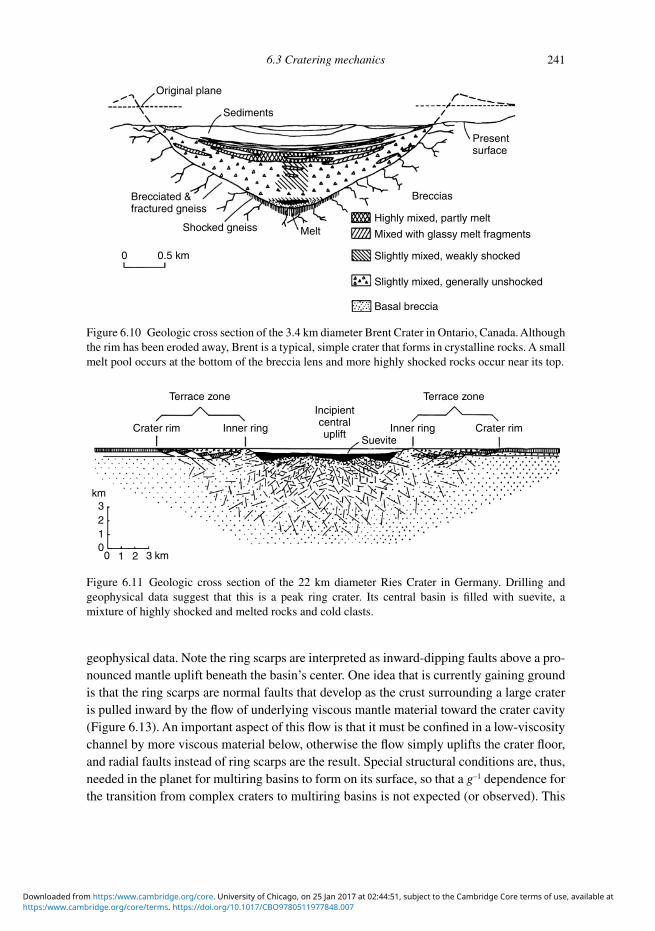
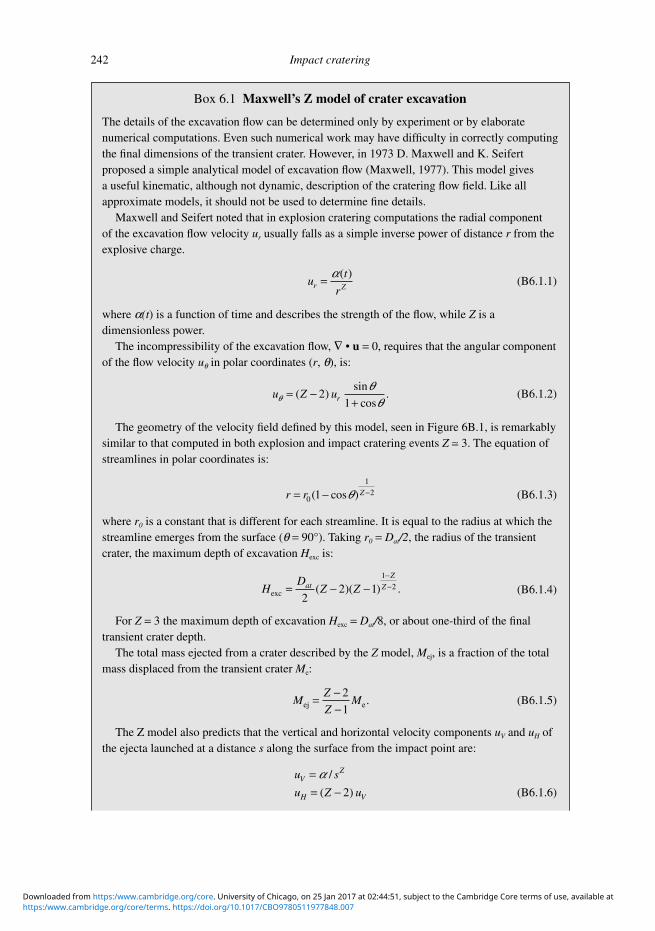
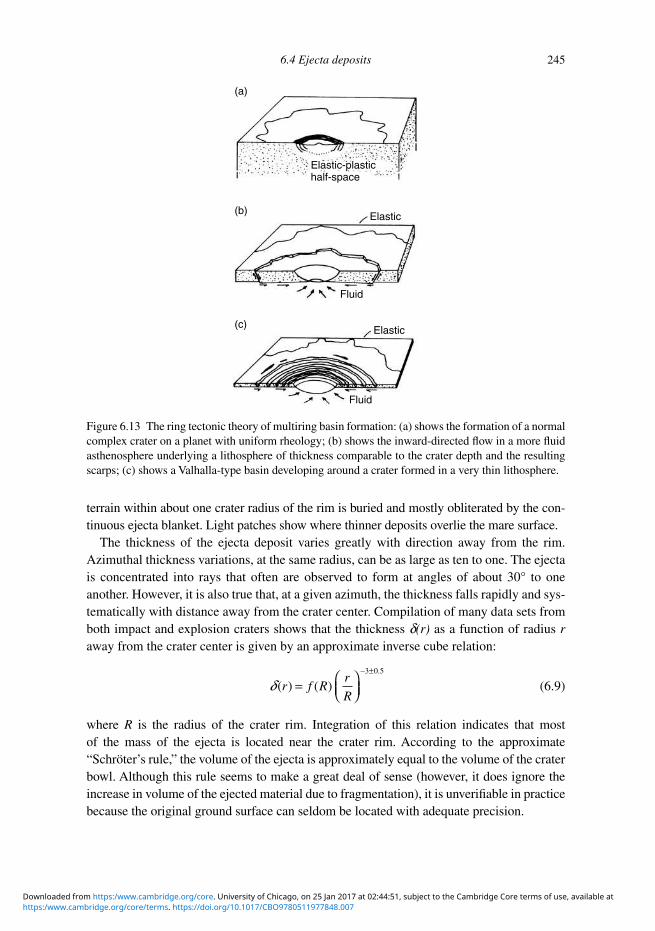
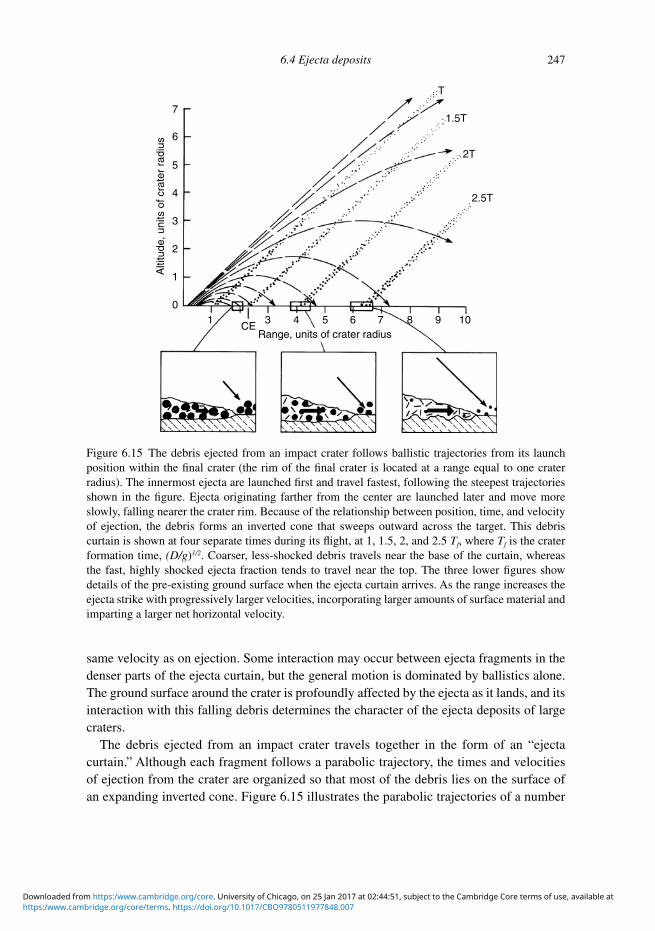
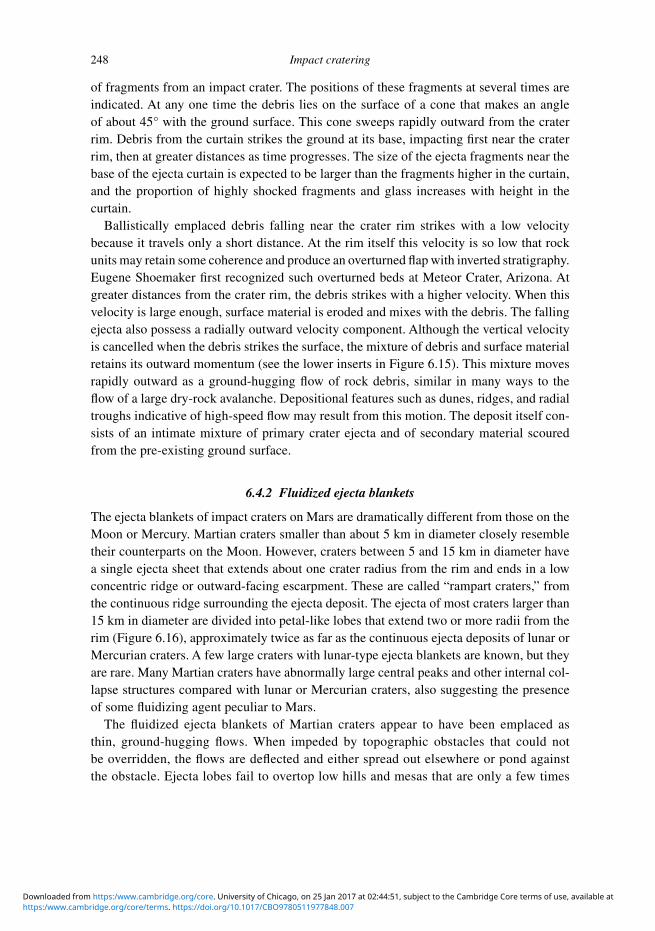
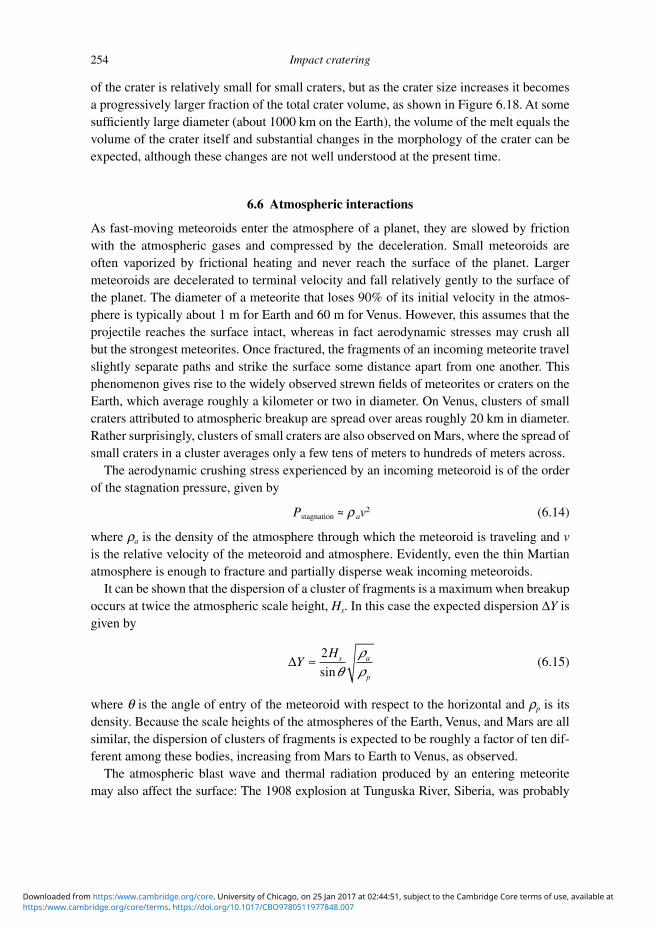
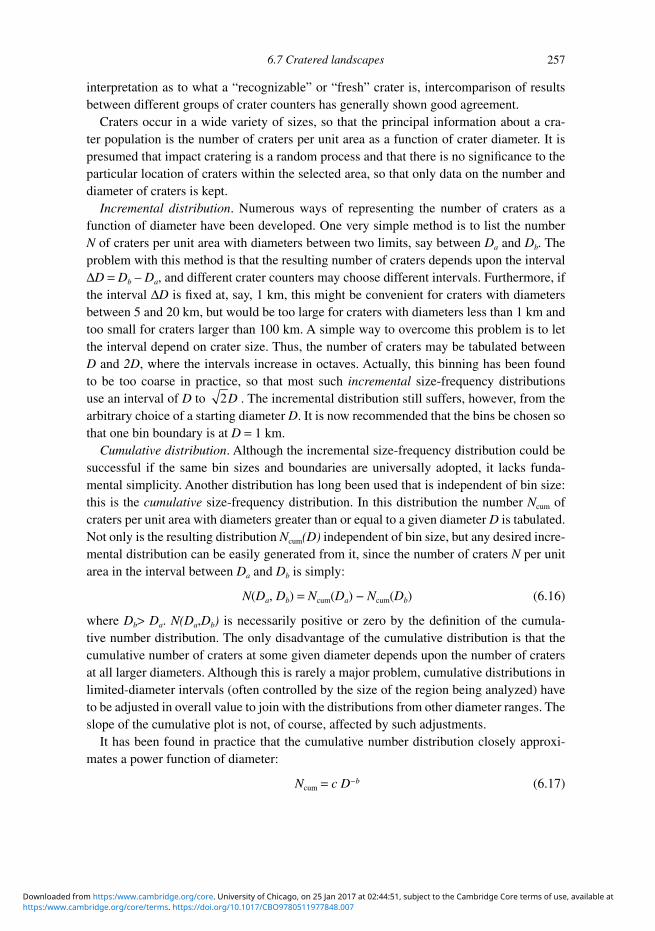
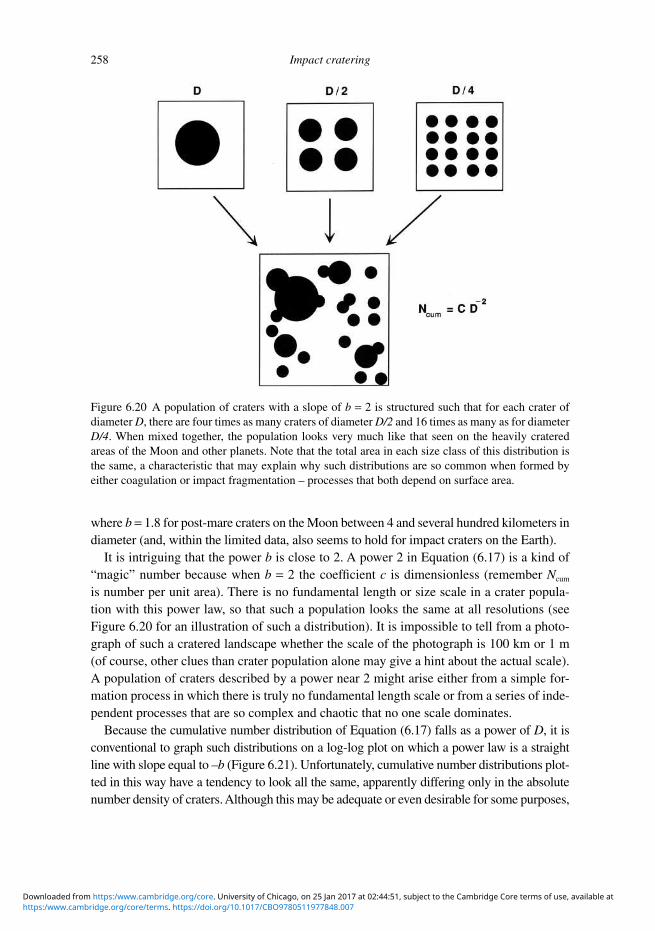
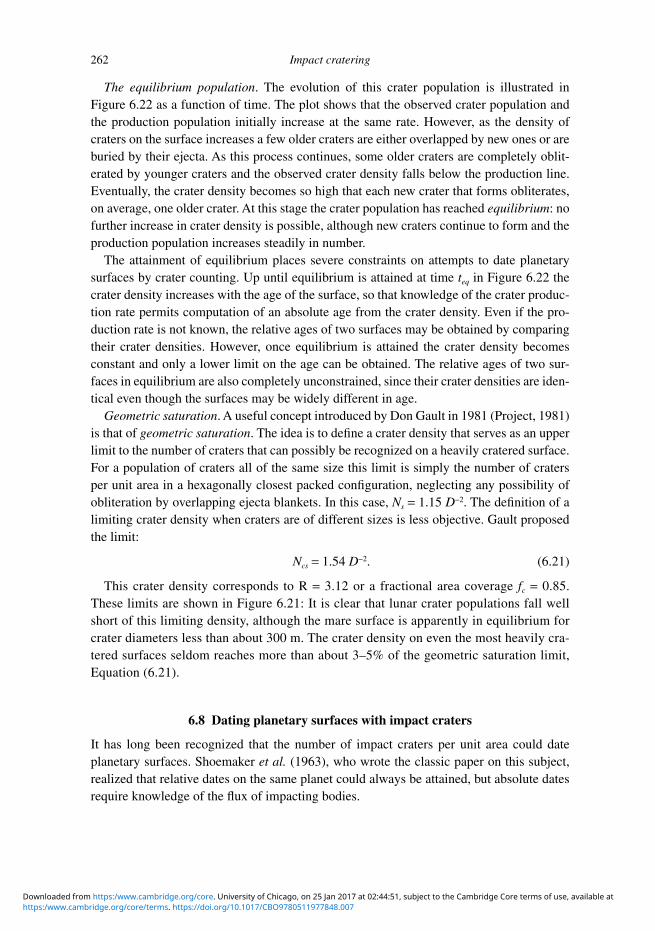
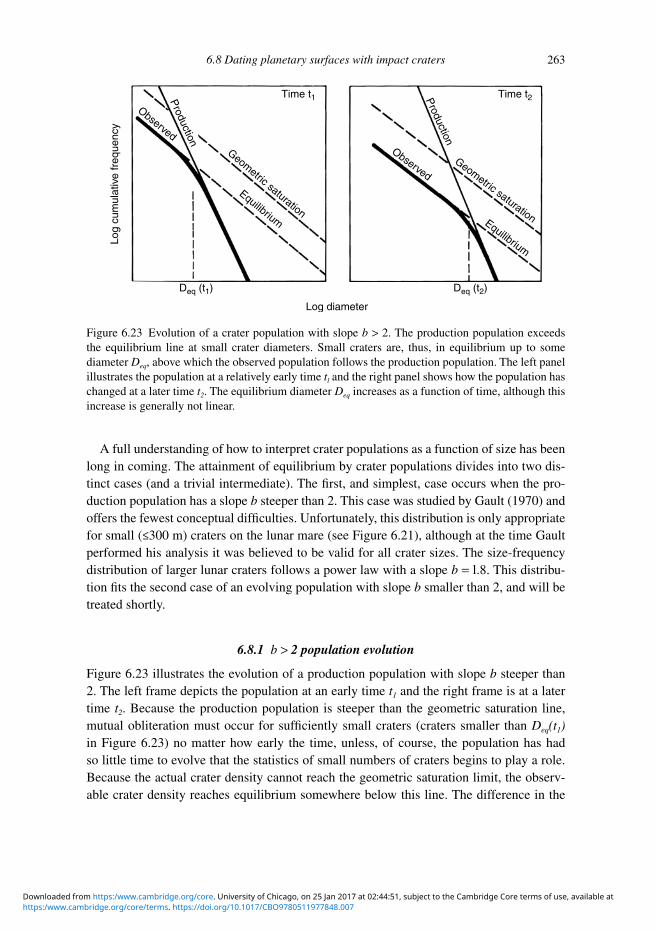
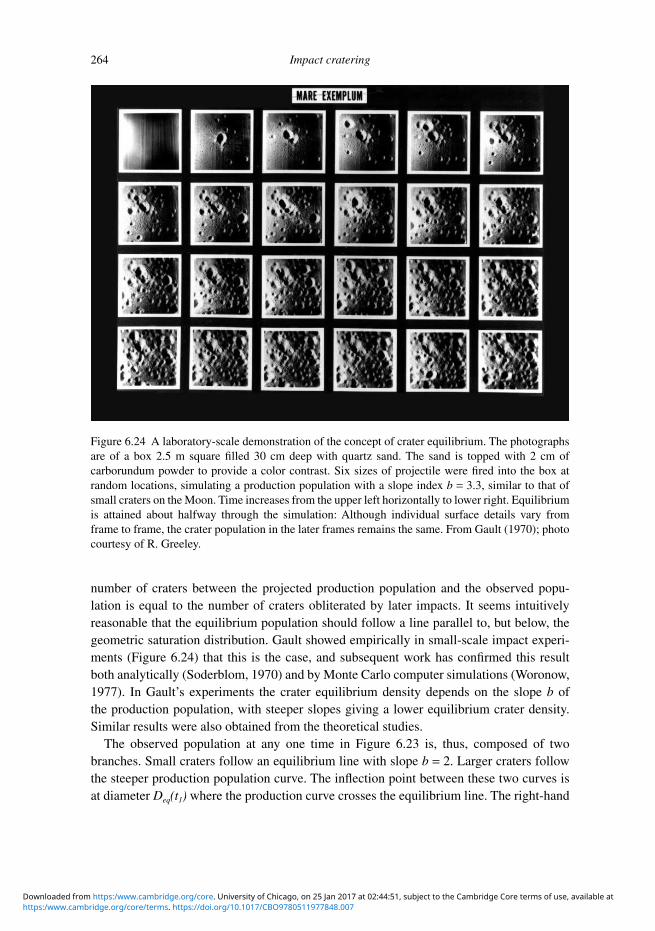