impact and value during and after construction - tiago de barros correia, brazil
TRANSCRIPT

Tiago de Barros Correia
Director
February 29, 2016
Paris, France
Impact and Value During and
After Construction

2 2
Topics Brazilian tidbits and Brazilian Power Sector
overview
About us
Brazilian strategy to develop key infrastructure projects
Impact and value

3 3
Total area 8,515 million km2 (83% of Europe)
Total Population – 2015 205 million inhabitants (27% of Europe)
Overall GDP – 2014 U$1,715 billion
Installed capacity 141,631 MW
Peak load 84,958 MW (Feb 2014)
Electricity Consumption per Capita 2,664.15 kWh
Average Energy Consumption Growth Annual Rate 4%
BRASIL SUMMARY

Electricity Supply Mix
80% of the electricity supply mix is renewable
4,441 plants in operation with a total 141 GW of
installed capacity
834 new projects granted, increasing the capacity by
27% (39 GW) by 2021
Fossil Fuel 19%
Nuclear 1%
Biomass 9%
Hydro 65%
Wind 6%
Solar 0%

Transmission Grid
230kV ac 345kV ac 440kV ac 500kV ac 700kV ac 600kV cc 800kV cc
125,644 km of transmission lines
Expansion of 10,400 km until 2019 (8%)
Auctioning of R$ 30 billion of new Investments only in
2016

If our Transmission Grid Were in Europe...
6
7 7
Topics Brazilian tidbits and Brazilian Power Sector
overview
About us
Brazilian strategy to develop key infrastructure projects
Impact and value

ANEEL Board of Directors Open Sessions
› Decisions are made by the Board of Directors (5) › Board sessions are open to the public participation and is
transmitted live over the web › Cases are distributed to each Director by lottery › Case settling relies on technical and legal analyses

9 9
Topics Brazilian tidbits and Brazilian Power Sector
overview
About us
Brazilian strategy to develop key infrastructure projects
Impact and value

10 10
Infrastructure governance cycle 1. Evaluation of infrastructure
needs
2. Decision and prioritization
3. Project preparation
4. Auctioning
5. Executive project and licensing
6. Construction operation and maintenance

11 11
Topics Brazilian tidbits and Brazilian Power Sector
overview
About us
Brazilian strategy to develop key infrastructure projects
Impact and value
12 12
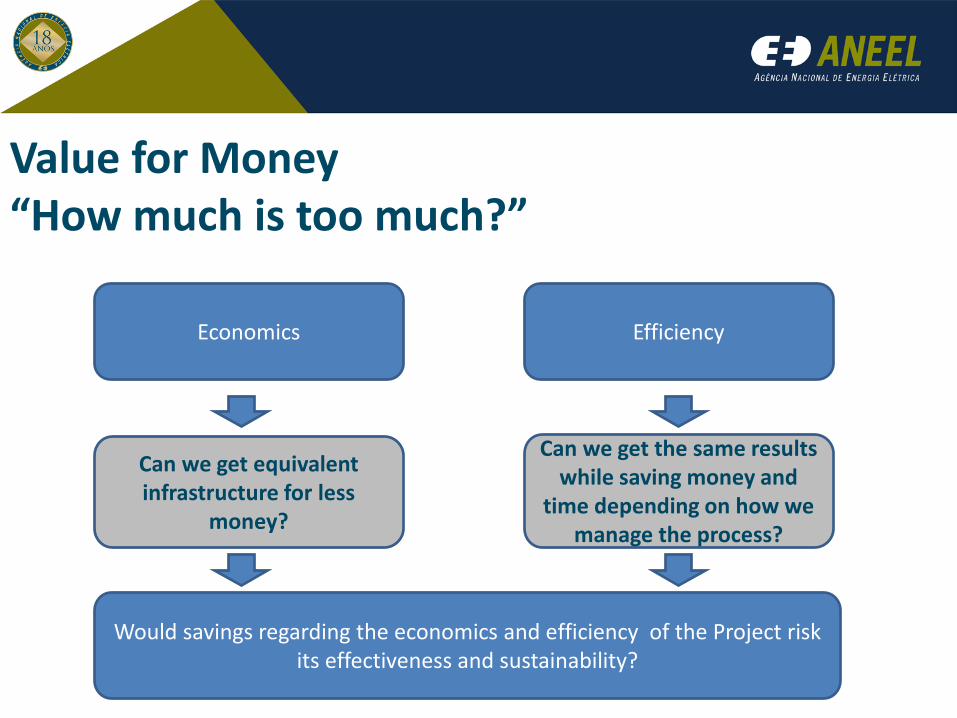
Value for Money “How much is too much?”
Economics Efficiency
Can we get equivalent infrastructure for less
money?
Can we get the same results while saving money and
time depending on how we manage the process?
Would savings regarding the economics and efficiency of the Project risk its effectiveness and sustainability?

13 13
Sustainability trail
Goal
GHG emissions
Renewable sources
Distributed generation
Power losses
Pathway (Long Term Plan)
Resources and technology availability
Budget constraints
Regulation
Subsidies
Strategic Projects
Externalities (Global and Local)
Life Time Analysis
Environmental
Economic
Social
Jobs
Health
Mitigation and Compensation
Execution
Assurance of project commitments
Accountability
Secure stakeholders acceptance and approval

14 14
Learning by Doing
But we deal with uncertainty and sometimes we need to get back on trail and try harder
To do that we need stakeholders support
Again, accountability appears as a key concept

15 15
Impact and value – Transmission Good Economics
Since 1999 the Brazilian Government has been conducting auctions to contract transmission services from greenfield projects. The auctions procure long term contracts (30 years) and define the transmission services to be delivered and the construction time line.
Applicants need to meet certain criteria in order to be accepted for participation in the auctions. This design intends to ensure that the project offered will meet environmental, technical and economic requirements of quality .
Bidders with the lowest proposed prices are the winners.

16 16
1.0
7.7
0.8 2.2
3.5
6.1 5.0
3.0 1.7
13.9
4.5 2.5
7.0
10.5 10.2
13.3 13.3
30.6
0
5
10
15
20
25
30
35
Investment in Billions of (R$) Concessions Granted and Expected till the end of 2016* - present
value (*assumes all contracts signed)

17 17
Impact and value – Transmission Low Efficiency
% of projects with delays for each required
phase.
With delay Early start In time Unknown

18 18
8/28/2013 - Last Major Disturbance taken place in the Interconnected Grid.
Load Loss: ~11GW Cut off Consummers : 17.5 million Fault Clearance Time: 4 hours Cause: Fire
Impact and value – Transmission Good Effectiveness
Availability of transmission lines in the last 5 years (%)
Load Restoration in the Northeast

19 19
Scope General goals Governance arrangement Budget (funding and
finance)
Public Policy
Major Risks Unrealistic goals Bad governance Insufficient resources
Risk-Bearing Government Society
Scope Strategic Projects Pricing and Timing Previous License Stakeholders support
Planning
Major Risks Social and Environmental
feasibility Stakeholders support
(not in my backyard!)
Risk-Bearing Government Society
20 20
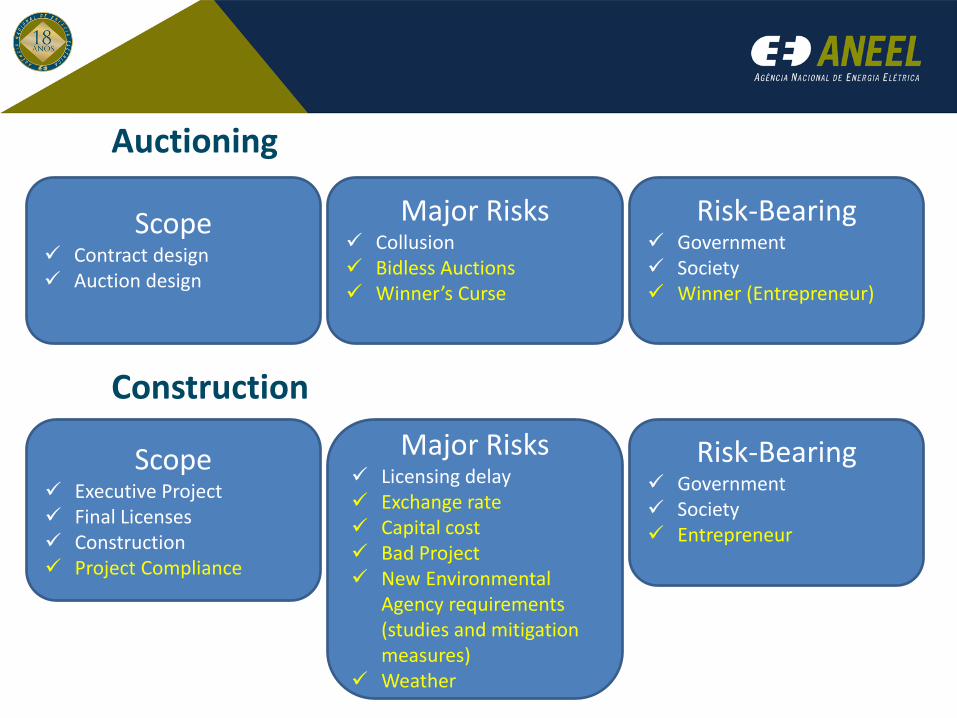
Scope Contract design Auction design
Auctioning
Major Risks Collusion Bidless Auctions Winner’s Curse
Risk-Bearing Government Society Winner (Entrepreneur)
Scope Executive Project Final Licenses Construction Project Compliance
Construction
Major Risks Licensing delay Exchange rate Capital cost Bad Project New Environmental
Agency requirements (studies and mitigation measures)
Weather
Risk-Bearing Government Society Entrepreneur

21 21
Scope Power Capacity Energy Generation Transmissions Services
Operation
Major Risks Inflation Non concatenation
(generation and transmission)
Blackout (bad planning) Bad performance Market exposure
Risk-Bearing Consumer Entrepreneur

22 22
SGAN – Quadra 603 Módulos “I” e “J” CEP: 70.830-110 /Brasília – DF Tel.: 55 (61) 2192-8604
Thank you!