immigrant entrepreneurship - harvard business school
TRANSCRIPT

Immigrant Entrepreneurship
Sari Pekkala Kerr William R. Kerr
Working Paper 17-011

Working Paper 17-011
Copyright © 2016 by Sari Pekkala Kerr and William R. Kerr
Working papers are in draft form. This working paper is distributed for purposes of comment and discussion only. It may not be reproduced without permission of the copyright holder. Copies of working papers are available from the author.
Immigrant Entrepreneurship Sari Pekkala Kerr Wellesley College
William R. Kerr Harvard Business School
Immigrant Entrepreneurship
Sari Pekkala KerrWellesley College
William R. KerrHarvard Business School
June 2016∗
Abstract
We examine immigrant entrepreneurship and the survival and growth of immigrant-founded businesses over time relative to native-founded companies. Our work quantifiesimmigrant contributions to new firm creation in a wide variety of fields and using multipledefinitions. While significant research effort has gone into understanding the economic im-pact of immigration into the United States, comprehensive data for quantifying immigrantentrepreneurship are diffi cult to assemble. We combine several restricted-access U.S. Cen-sus Bureau data sets to create a unique longitudinal data platform that covers 1992-2008and many states. We describe differences in the types of businesses initially formed byimmigrants and their medium-term growth patterns. We also consider the relationship ofthese outcomes to the immigrants’age at arrival to the United States.
JEL Classification: F22, J15, J44, J61, L26, M13, O31, O32, O33.
Keywords: immigration, entrepreneurship, entry, firm survival and growth, venturecapital, high-tech.
∗Author contact information: [email protected], [email protected]. Sari Pekkala Kerr is a senior researchscientist at the Wellesley Centers for Women (Wellesley College). William Kerr is a professor at Harvard BusinessSchool and a Research Associate at the National Bureau of Economic Research (NBER) and Bank of Finland.This is a revised version of a paper prepared for the Conference on Research in Income and Wealth (CRIW)NBER meeting on December 16-17, 2014, in Washington DC and a draft chapter for the CRIW-NBER volumeMeasuring Entrepreneurial Business: Current Knowledge and Challenges, edited by John Haltiwanger, ErikHurst, Javier Miranda and Antoinette Schoar. We thank our discussant Ethan Lewis, the editors, and CRIW-NBER participants for very helpful comments. We thank the Alfred P. Sloan Foundation, National ScienceFoundation, Harvard Business School, and the Ewing Marion Kauffman Foundation for financial support thatmade this research possible. The research in this paper was conducted while the authors were Special SwornStatus researchers of the U.S. Census Bureau at the Boston Census Research Data Center. Research results andconclusions expressed are the authors’own and do not necessarily reflect the views of the Census Bureau or theNSF. This paper has been screened to ensure that no confidential data are revealed.
1

1 Introduction
Immigrant entrepreneurship is of central policy interest and a frequent hot point in the popularpress. Many policy makers believe that immigrant founders are an important and under-utilizedlever for the revival of U.S. job growth and continued recovery from the Great Recession. Severallocal and national policy initiatives have been launched to attract immigrant entrepreneurs (e.g.,the Thrive competition in New York City, the Offi ce of New Americans in Chicago, and theWhiteHouse Startup America initiative). Some of the policy initiatives focus on specific issues thathave been found to limit immigrant entrepreneurs from starting or growing their businesses (e.g.,language barriers, diffi culty navigating the legal steps to start a company, or lack of capital topilot projects), while others are generally focused on attracting more new businesses into thecountry. Policies vary in the immigrant group that they target, ranging from a specific focuson high-skilled immigrant entrepreneurship with venture capital (VC) backing to broad-basedmeasures that potentially touch many diverse immigrant communities.Academic research, unfortunately, possesses only a small voice in this debate or policy de-
sign. For example, advocates of greater immigrant entrepreneurship mainly cite a few extremeexamples of success such as Sergey Brin, one of the founders of Google, and extrapolate informa-tion from some exceptionally influential case studies regarding Silicon Valley and large high-techcompanies (e.g., Saxenian, 1999; Wadhwa et al., 2007). While each of these supporting pieces hasits merits and liabilities discussed below, it is important for rigorous trends and statistics to alsoinform this debate. For example, even with respect to Silicon Valley and high-tech companies,it is not immediately clear what the oft-cited statistics mean– it is likely true that more thanhalf of the entrepreneurs in Silicon Valley are of immigrant origin, as the surveys suggest, butthe exact same could be said of the undergraduate student populations at most schools in theSan Francisco area. Second, given the substantial heterogeneity in immigrant entrepreneurship,which comes in just as many flavours as native entrepreneurship, it is unsatisfying to focus onsuch a narrow population of high-tech entrepreneurs for contemplating possible initiatives.For economists to be able to aid the policy process, and ultimately improve economic perfor-
mance in this arena, we need better-grounded estimates on the importance of immigrant groupsfor the creation of new firms, the business activities and growth profiles of created firms, and soon. This study constructs a data platform using Census Bureau administrative data to assistin this process. The purpose of this chapter is to detail the platform’s components and providesome early views of the trends for immigrant entrepreneurs and the patterns in their behavior.We have several audiences in mind. First, we are able to offer some new facts to the discussionof immigrant entrepreneurship that can be useful for policy discussions, although we do notexamine any specific policy actions or recommendations about encouraging immigrant entrepre-neurship in this study. Second, we hope that others find this discussion encouraging for makingprogress on this front and that they too seek access to these data through the Census Bureau.
1

Ideally, our paper can provide them a one-stop-shop for what is feasible in the data and how tobuild the platform, and this chapter goes into greater depth than is normal for academic paperson how the platform is built and its traits. Finally, we speak to future efforts to enhance thesedata. In terms of representative statistics, this platform is likely as good as it gets with today’sdata collection. We describe below a wish list for future data development efforts.Section 2 provides a brief review of the previous empirical literature on immigrant entrepre-
neurs and their traits. Fairlie and Lofstrom (2014) provide a comprehensive recent review ofthis literature strand and statistics from the 2007 Survey of Business Owners (SBO). In thischapter, relative to prior academic work, we make three contributions. First, our data platformprovides consistent estimates of immigrant entrepreneurship over a long time period (1995-2008)and across skill levels (e.g., all entrepreneurs, VC-backed firms). Existing work, even when usingrepresentative national samples, tends to be cross-sectional at a given point in time and focusedon a specific skill population, whereas for most purposes the comparisons across time and groupswould be very important. Second, we study the different dynamics of employment and growthamong immigrant-led businesses compared to those founded by natives. Fairlie and Lofstrom(2014) conclude that a central research goal for immigrant entrepreneurship is to identify the dy-namics of employment growth among these firms, and our constructed platform makes progressin this domain. Third and related, we provide a first breakdown of these growth dynamics by theage of immigration to the United States. This last analysis is preliminary and mostly undertakento show the potential of the data for observing differences along traits identifiable from the 2000Census match, but striking nonetheless.Section 3 details the construction of our data platform. The strength of our study lies in
the ability to use and combine several restricted-access U.S. Census Bureau data sets to createa unique longitudinal data platform with millions of observations. Indeed, a key purpose of thischapter is to report on the potential of these data and describe their traits for research pur-poses. The backbone for our work is the employer-employee data in the Longitudinal Employer-Household Dynamics (LEHD) database. The LEHD provides firm-worker information collectedfrom unemployment insurance records. From this information, one can observe the birth of newfirms and their employee composition, including immigration status. We also utilize other data:[1] the Longitudinal Business Database (LBD) to assess the employment growth dynamics ofnew firms, [2] the long-form records of the 2000 Decennial Census to collect additional person-and household-level traits (e.g., year of arrival to the United States), and [3] external data setsto identify companies that have VC backing or achieve an initial public offering (IPO). Theresulting data platform can describe many forms of entrepreneurship, ranging from general pat-terns to "growth entrepreneurs" described in the VC literature. These detailed new data allowus to study person- and firm-level patterns in a way that has not been possible to date, andthis section also depicts the variations and limits on the definitions of entrepreneurship in the
2

LEHD.1
Section 4 provides our trend estimates. Most of our work focuses on 11 states present inthe LEHD since 1992, which include California and Florida. We estimate 24% of entrepreneursin these states from 1995-2008 are immigrants, which broadly corresponds with other studies.As important, this immigrant entrepreneurship share rises from 17% in 1995 to 27% in 2008.Our sample, by coincidence, draws from heavy immigration states. Looking at a sample of 28states present in the LEHD by 2000, we estimate these numbers may be 3% higher than thetotal population, with the growth trend being similar. Returning to our focal set of states,the immigrant share among entrepreneurs receiving VC financing is modestly higher, reaching30% in 2005 compared to 27% for all firms. In terms of entrepreneurship rates, roughly 2% ofimmigrants start a business over a three-year period; 0.1% start a firm backed by VC financing.These rates are higher than those we estimate for natives, which is reflected in the fact thatimmigrants constitute 19% of the LEHD workforce in our sample, less than the entrepreneurshipshares reported above.Section 5 documents basic patterns related to entry, survival, and growth of immigrant
versus native businesses. On the whole, the businesses started by immigrant entrepreneursperform better than native businesses with respect to employment growth over three- and six-yearhorizons. This is evident in the raw data and mostly persists when comparing immigrant- andnative-founded businesses started in the same city, industry, and year. By contrast, immigrant-founded businesses show no advantages with respect to payroll growth, and may in fact generatelower-wage job growth. Combining business survival with growth dynamics, immigrants tend tobe engaged in more volatile, up-or-out type dynamics, along the lines described by Haltiwangeret al. (2013) for young businesses and job creation. Most of this effect is captured by the city-industry-year choices made for businesses, versus variation in growth patterns within these cells.Breaking down these aggregate results, the strongest employment growth impacts for immigrantsare found in high-wage businesses and high-tech sectors. Conditional on receiving VC investment,however, we do not observe greater business survival, better employment outcomes, or higherlikelihood of going public for firms founded by immigrant entrepreneurs. Businesses founded byimmigrants who came the United States by age 18 have stronger growth patterns than thosefounded by immigrants migrating as adults.Section 6 concludes with a discussion of these findings in the larger context of immigration and
entrepreneurship policy. This section also describes enhancements to the platform that wouldenable better research efforts going forward. Immigration policy is designed and administered atthe national level, with few restrictions on the location choices of immigrants within the UnitedStates. A methodological conclusion from this study is that the LEHD-based platform canconsistently describe immigrant entrepreneurship across many industries, geographies, and skill
1In a broad review of the immigration literature, Lewis (2013a) raises immigrant entrepreneurship as one ofthe key areas requiring further study and notes the key ingredient of employer-employee data for this purpose.The LEHD is the source of this type of administrative information for the United States.
3

levels. This is an important ingredient for delivering systematic advice about how immigrantentrepreneurs impact the U.S. economy and where the effects of expansion in admission levelsmight be felt. We also find that the detail of the LEHD can aid more effective policy advicefor sub-groups of immigrants. The surveys most cited in the public discourse are actually quitecrude in this regard. For example, although Sergey Brin is often used as the showcase example forimmigration reform on high-skilled H-1B policies, he came to the United States as a child, whilethe H-1B program is focused on temporary admissions of adults with college-level education.Our disaggregation by the age at arrival for immigrants indicates this assembled platform canhelp begin to disentangle these important details. To be clear, our study stops well short ofmaking a direct input to immigration policy design on this or other dimensions, but we do findthat these data elements are of suffi cient strength and depth that they can serve as an effectivefoundation for future research efforts to inform the economic consequences of selection strategiesbased upon certain immigrant traits.On the other hand, we note that there are many places where the LEHD has limits, some
of which may be addressable. For example, here we define entrepreneurship status through ini-tial wage profiles of firm employees, which is certainly incomplete. Over short-term horizons,it would be useful to consider linking LEHD workers to SBO-type data to evaluate the accu-racy and bias of derived entrepreneurship definitions with greater detail. Similarly, we describehow links of LEHD workers to external data sources at the individual-level would be powerful(e.g., entrepreneurs/CEOs contained in the Venture Xpert data, inventors contained in UnitedStates patent data). More challenging, while we are able to make progress towards some of theimportant traits of immigrants, we miss completely with the LEHD the essential questions ofimmigration visa type (e.g., H-1B, green card), which is strongly emphasized by Hunt (2011) asa key predictor for choices by immigrants with respect to entrepreneurship. For the evaluationand design of effective policy, the inclusion of visa status and transitions over time must be atthe top of any wish list.
2 Previous Literature on Immigrant Entrepreneurs
This section provides some background for our study from the academic literature, with Fairlieand Lofstrom (2014) reviewing the immigrant entrepreneurship literature in a more compre-hensive manner. There is a large body of literature showing that general rates of businessownership are higher among the foreign-born than natives in many developed countries, includ-ing the United States, United Kingdom, Canada, and Australia.2 Fairlie (2012) and Fairlie andLofstrom (2014) also observe that trends in self-employment rates and new business formationare increasing among immigrants but decreasing among natives in the United States. In closely-related work to the current analysis, Hunt (2011, 2015) focuses on skilled immigrants and finds
2Studies include Borjas (1986); Lofstrom (2002); Clark and Drinkwater (2000, 2006); Schuetze and Antecol(2007); and Fairlie et al. (2010).
4

that they are more likely to start firms with more than 10 employees than comparable natives.Hunt uses the National Survey of College Graduates (NSCG), which provides a nationally rep-resentative sample of persons with a college degree and interesting information about the initialvisa status of immigrants. She finds that the probability of starting a firm was highest for thoseinitially arriving on a study visa or a work visa, versus family reunification. While the level ofdetail on the specific degrees and entry visas in the NSCG is impressive, the major issues forresearchers trying to describe national trends in immigrant-founded firms are the small samplesizes, the lack of longitudinal dimension, and the absence of firms as a data element.In parallel to these general patterns, a second research stream focuses specifically on immi-
grant entrepreneurship in the high-tech sector. Saxenian (1999, 2002) documents that up to aquarter of the high-tech firms in Silicon Valley in the 1980s and 1990s were founded or beingrun by immigrants. Wadhwa et al. (2007) extends this survey analysis to the rest of the countryand other industries to study firms founded in 1995-2005. They document similar shares ofimmigrant-founded companies across the country, although elements of their study are diffi cultto generalize.3 Table 1 provides a summary of several related studies on immigrant entrepre-neurs. These efforts connect into a broader line of work showing the over-representation of skilledimmigrants among certain extreme outcomes in U.S. science and engineering: for example, U.S.-based Nobel Prize winners (Peri, 2007), high-impact companies (Hart and Acs, 2011), patentapplications (Wadhwa et al., 2007), members of the National Academy of Sciences and the Na-tional Academy of Engineering (Stephan and Levin, 2001), and biotech companies undergoinginitial public offerings (Stephan and Levin, 2001). It is these kinds of factors that likely drive thecurrent policy enthusiasm towards immigrant entrepreneurs. On the other hand, with respect toimmigrant high-tech contributions, Hart and Acs (2011) suggest that although immigrants playan important role, "most previous studies have overstated the role of immigrants in high-techentrepreneurship."Statistics with respect to immigrant entrepreneurship among VC-backed firms are harder to
assemble. Fairlie (2012) calculates from the 2007 SBO that equally few native and immigrantbusiness owners rely on any VC funding; more generally, the study finds that immigrants areless likely to start a business with no capital and just as likely as natives to start a business withmore than $1 million of capital. Hegde and Tumlinson (2014) and Bengtsson and Hsu (2015)are recent examples of studies of immigrant entrepreneurship among VC-backed firms usingethnic names to distinguish the likelihood of a founder being an immigrant. In an advocacy
3The sample with responses covers 7% of the approximately 30,000 firms in the Dunn & Bradstreet data thatwere founded in 1995-2005, had sales greater than $1 million, and employed at least 50 persons. Despite theextensive efforts of their research team to reach a subset of companies listed in the Dunn & Bradstreet data,the study faces a lower response rate, selectivity in terms of which firms choose to respond, and perhaps limitsregarding the ability of the surveys to reach the right person to answer the questions related to the founders’origin (as an HR or a PR person might not know whether one of the founders moved to the United States as achild). Therefore, the researchers extrapolate from their sample to produce nationally representative numbers forrevenue and employment generation. Monti et al. (2007) provide related evidence from Massachusetts high-techfirms.
5

piece, Anderson and Platzer (2006) identify the higher immigrant entrepreneur share amongpublicly-listed VC-backed U.S. companies.Related to our focus on entrepreneurs and how immigration influences the supply of these in-
dividuals, prior studies show that more-educated business owners run more-successful businesses,generate more innovations, and grow their firms faster over time (e.g., Unger et al., 2011). Thereis an overall positive relationship between education and business ownership, although the ev-idence is somewhat mixed as highlighted in the meta-analysis of van der Sluis et al. (2008).Lofstrom et al. (2014) postulate that this may be due to sorting into industries based on entrybarriers. They find that educational credentials of highly educated potential entrepreneurs areassociated with lower probability of small-firm ownership in less-financially-rewarding industries,while they increase entry into higher-barrier industries offering higher returns.Immigrants can take a variety of paths into firm ownership in the United States. Many
skilled immigrants enter the United States for study or paid work and found their company afterseveral years in the country, while a smaller number enter for the specific purpose of openinga business. Kerr et al. (2015a,b) describe in greater detail how U.S. immigration law andcorporate sponsorship of visas contribute to this career trajectory. Akee et al. (2007) find thatpre-migration self-employment in home countries increases the probability of self-employmentby immigrants in the United States and boosts self-employment earnings. Lofstrom (2002)finds that self-employment probabilities and earnings for immigrants increase with time spent inthe United States, perhaps even reaching earnings parity with observationally similar U.S.-bornentrepreneurs after about 25 years in the country. The use of repeated cross-sections of Censuses,however, limits the degree to which the role of assimilation can be separated from selective out-migration. Blau and Kahn (2016) describe cultural factors influencing gender-based rates ofassimilation for work by immigrants.The spillover effects to native opportunities for opening a business have been examined by
several research teams. Fairlie and Meyer (2003) find some evidence that immigration maynegatively affect native self-employment probabilities using the 1980 and 1990 Census records.Other researchers suggest skilled immigrants generate positive spillover effects in local areas. Forexample, recent work points toward positive spillover effects for cities or states when measuredin terms of innovation, publications, and productivity (e.g., Kerr and Lincoln, 2010; Hunt andGauthier-Loiselle, 2010; Peri et al., 2015). Lewis and Peri (2015) provide a theoretical frameworkand review of literature on the effects of immigration on local areas. Evidence from morehistorical contexts are mixed (e.g., Borjas and Doran, 2012; Moser et al., 2014). Kerr (2013)provides an extended review of literature on skilled immigration and notes the particular gaparound the empirics of immigrant entrepreneurship specifically.Another line of work documents how immigrant entrepreneurs appear to specialize in a
narrower range of industries or occupations compared to native entrepreneurs. Very commonexamples from the United States include Korean entrepreneurs for dry cleaners, Vietnamese
6

entrepreneurs for nail care salons, Gujarati Indian entrepreneurs for the motel industry, andPunjabi Indian entrepreneurs for convenience stores. Chung and Kalnins (2006) provide a firstanalysis of this specialization for U.S. Indian entrepreneurs, and Patel and Vella (2013) documentpatterns more broadly and show earning consequences. Fairlie et al. (2010) provide cross-country comparisons for some groups. Kerr and Mandorff (2015) provide a theoretical modeland empirical evidence of how small group sizes and social isolation can provide comparativeadvantages for ethnicities in self-employed sectors where the entrepreneurs benefit from the tightnetworking of their social group.Compared to this earlier literature, the LEHD-based platform has the capacity to provide
critical and novel information for the enhanced understanding of immigrant entrepreneurshipand the effective calibration of immigration policy. Indeed, even though earlier work has tackledmany important issues, there remain unfortunate gaps in both the big-picture study of immigrantentrepreneurship and in the depth of insights feasible.Starting with the big picture, immigrant entrepreneurship is often greatly hyped in both
policy and media circles, and a number of newspaper and business press articles (e.g., Forbes,New York Times) tout immigrant founders as the solution to the sluggish recovery from theGreat Recession. Similarly, current local and national policy efforts seek to attract and supportnew firm formation by immigrants, as noted in the Introduction. Many of the studies in Table1 are limited by sample designs that are not broadly representative of the economy, or they arecross-sectional in nature if representative. This creates a credibility challenge for the work, evenwhen undertaken with the utmost objectivity; the gap gets extremely large with advocacy piecesor those concentrating only on the most prominent high-tech clusters. Building directly uponadministrative data, an LEHD-based platform can provide a substantially stronger foundationfor its covered states and the credibility necessary for grounding debates around common facts.The depth is also essential. Some studies, such as Fairlie (2008, 2012) and Fairlie et al.
(2015), provide attractive estimates from the Current Population Survey (CPS) that are thecurrent best practice for longitudinal series. The CPS is in many respects a solid platform,given its stable data collection and long series, and we compare some of our work to the CPSlater. The diffi culty with the CPS is the ultimate depth that it can provide. Its sample sizes ofabout 500 thousand adults are large enough to provide annual estimates for states or industries,but the cell counts become too small when attempting to jointly view these traits. Moreover,the CPS records cannot be linked to future growth trajectories of the firms, the use of venturecapital funding, and so on. The CPS relies on founders declaring themselves to be self-employedand yet also does not measure if other employment is being generated. Thus, while the CPS isan important and publicly-available resource, the development of an LEHD-based platform thatincludes every business in covered states will provide much deeper capacity for statistical andanalytical work. As we describe below, there is no question that the LEHD is far from perfectin terms of what it can do; on the other hand, if these limitations are acceptable, then the scope
7

of follow-on work becomes extraordinary. This depth is true in terms of potentially publishablestatistics of entry rates, and also in terms of more complex academic questions (e.g., how manyprior employers do immigrants typically have before starting a firm and how does this prior jobhistory impact entrant performance).Reading the anecdotal accounts and collected statistics regarding immigrants being very
involved in high-growth entrepreneurship, it seems natural from a policy perspective to wantto encourage this development. Encouraging immigrant entrepreneurs seems like an essentialprong of science policy, and its mandate reaches the highest levels of government. Yet, the earlierresearch has developed only partial data needed to effectively evaluate these policies or enhancetheir design. Research based upon case studies or small surveys may identify the trend, butthey fail to build the empirical foundation necessary for confidence in the design of proposedlegislation and the likely impact of reforms. The data platform introduced here makes significantheadway in that respect as it will utilize and combine universal and unique micro-data sets onindividuals and firms (LEHD, LBD, and the Decennial Censuses). In short, this provides aunique platform for the study of immigration and entrepreneurship.
3 Census Bureau Data and Measurement
3.1 Data Platform
The LEHD is the centerpiece of our platform, in combination with the LBD and a person-levelmatch to the 2000 Decennial Census of Population (Census). These datasets are confidential,housed by the U.S. Census Bureau, and accessible via Research Data Centers. Built from quar-terly worker-level filings by employers for the administration of state unemployment insurance(UI) benefit programs, the LEHD identifies the employees of each private-sector firm in theUnited States and their quarterly compensation. It is longitudinally linked at both the firm andemployee levels, allowing one to model how firm employment structures adjust over time, hownew entrepreneurial firms form, and how individuals transition from wage work into entrepre-neurship. This rich data source is currently available for 31 states for research purposes, and itwill eventually cover the whole country.The initial LEHD dates vary by state, and we focus on two samples in this paper. The first is
the 11 states that have LEHD records that begin by 1992 or earlier: California, Colorado, Florida,Idaho, Illinois, Louisiana, Maryland, North Carolina, Oregon, Washington, and Wisconsin. Ourdata extend through 2008, and the newest vintage of the LEHD continues coverage until 2011.Certain analyses are also conducted on a larger set of 28 states present in the LEHD by 2000as shown in Appendix Table 1 and Figure 1. The larger sample can only be followed over ashort time span, but it helps us understand the impact of state-level variation in immigrationand entrepreneurship rates for the trends presented in this paper, particularly the inclusion ofimmigrant-heavy California and Florida among our primary sample.
8

The LEHD Individual Characteristics File (ICF) contains basic information about individu-als, such as age, gender, race, place of birth, and citizenship status. Through the EmploymentHistory Files (EHF), one can also discern earnings and employment histories of each personjob-by-job and in aggregate. In addition, unique person identifiers (PIKs) afford matches of theLEHD to the individual-level records contained in the 2000 Census of Populations. PIKs areanonymous identifiers that match one-for-one with Social Security Numbers. The Census long-form responses cover 1/6 of the U.S. population, allowing us to link Census responses for roughly16% of our LEHD workers. From the 2000 Census, we extract individual-level characteristicsfrom the Person File and household and housing-unit characteristics from the Household File.Long-form responses contain very detailed person and household characteristics (e.g., year ofentry into the United States, level of education, occupation, marital status, family composition,household income by source, etc.). It is important to recognize that while the LEHD coversemployees from the early 1990s through 2008– including new immigrants at the end of the endof the sample period– the 2000 Census match requires individuals to be living in the UnitedStates by 2000.We build a tailored dataset for the analysis of immigrant status and entry into entrepreneur-
ship, first focusing on the dynamics over time. We take several steps to reduce the set of massivedata records into a manageable platform that properly represents the phenomenon of interest,and it is important to describe these steps as they have some bearing on our measurements. Webegin by retaining for each individual their main job during the year (i.e., the job from which theperson obtains the majority of their LEHD earnings). We also only retain persons for whom theaverage quarterly earnings from the main job are at least $2,000 per quarter. We further restrictour sample in each year to individuals aged 25 to 50. This age restriction is such that we stayreasonably far away from retirement decisions– and in particular, the formation of small-scalebusinesses as a form of semi-retirement– and concentrate on entrepreneurial activity in the peakemployment years of each person’s working life. Moreover, we require individuals be present inthe LEHD at least three quarters that span two calendar years.Immigrants are simply identified as those persons born outside of the United States. This
information is available for all LEHD individuals and is based on the Social Security Adminis-tration (SSA) Statistical Administrative Records System (i.e., StARS database). Some of theseimmigrants may have later been naturalized and become citizens, but that information is notutilized in this study. This is partly due to our focus and also due to uncertainty about theupdating procedures for this information. By defining immigration status through the ICF files,we can depict immigrant entrepreneurship consistently over the sample period, including new ar-rivals. We separately consider information from the match with the 2000 Census, which recordsthe year when the immigrant arrived into the United States.
9

3.2 Defining Firm Entry and Entrepreneurs
Our evaluation of entry into entrepreneurship also utilizes the LBD, a business registry that con-tains annual employment and payroll for all private-sector establishments in the United Statessince 1976. The LBD and the LEHD use several levels of establishment and firm identifiers:[1] State Employer Identification Numbers (SEIN), [2] federal Employer Identification Numbers(EIN), and [3] the overall company identifier (ALPHA) that the Census Bureau uses to link theestablishments of multi-unit companies together. Following Haltiwanger et al. (2013), we iden-tify for each establishment the first year during which the firm that the establishment belongs towas observed to be in operation within the LBD. We also create for each firm the number of em-ployees that the LBD reports were working for this firm in the initial year.4 Approaching entrantdefinition in this way accomplishes several things– it builds off of the national LBD databaseto avoid issues related to the partial LEHD state coverage, connects SEINs as appropriate intoparent firms, and ensures a consistent definition of entry with prior academic work using theCensus Bureau data. As two examples, this approach ensures our entrepreneurship definitiondoes not include the formation of a new SEIN by an existing multi-unit firm expanding into anLEHD state, or the development of new SEINs for tax purposes by existing businesses. Withrespect to the broader literature, our approach focuses on the formation of employer establish-ments, whereas the commencement of Schedule C self-employment activity is unmeasured andnot considered to be entrepreneurship in this sample.5
A very important issue, and the weakest link of these data for the study of entrepreneurship,is that the LEHD does not designate the founders or owners of firms. Similarly, compensationdata includes bonus pay but not equity ownership of individuals. We use the term "entrepreneur"to describe anyone present in the data who satisfies three criteria: [1] in an entering single-unitfirm per the Haltiwanger et al. (2013) definition, [2] present in the LEHD in the first year thatthe new firm entered, and [3] among the top three initial earners in the firm. With respectto the first condition, we require the new firm be a single-unit firm in its start year to ensurethat we have complete employment records from the LEHD. By itself, the second conditionfocuses on the initial employees of the firm and will in many cases include early hires. Thethird condition then associates entrepreneurship with the top initial earners in the firm. Thiswill clearly be inaccurate in some cases, and some entrepreneurs deliberately take low salariesor no compensation from their firms early on to conserve funds. On the other hand, as wedescribe below, most firms in our sample are small and are likely reasonably well modelled bythis approach. We also show results that drop the third condition and thereby provide statisticsrelated to all initial employees in the firm.Terms like "entrepreneurship" are also vague with respect to the time dimension. For exam-
4The data structure of the LEHD and LBD allow for establishments within each firm to have different industriesand locations. In rare cases where required in this study, we define the main industry and main location of amulti-unit firm through the facility with the largest number of employees.
5There is scope for further work on this regard using the Integrated LBD that contains non-employer firms.
10
ple, a strict application of our three-part definition would declare the founder of a new firm to bea wage worker starting in the second year of a firm’s life, yet many still consider Mark Zuckerbergto be an entrepreneur a decade after the founding of Facebook. For most of our trend statistics,we accordingly use a three-year window that declares an individual to be an entrepreneur iftheir firm was founded in the prior three years. We still require that the individual had beenpresent in the year of founding and a top initial earner, the second and third conditions. In fact,we do not require the individual remain necessarily associated with the firm, simply that thefirm and individual persist. We present results that alternatively use a strict one-year definition.Overall, an unfortunate trade-off exists in that longer windows for keeping track of entrepreneursresult in shorter sample durations, due to the greater number of pre-period years that must bedevoted to determining the initial values. Said differently, if we wanted to declare individualsto be entrepreneurs if they have founded a business over the prior ten years, the earliest startdate for the LEHD-based sample series is 2001, after the 1990s high-tech boom period that is sointeresting to study.
3.3 Benchmarks for Definitions
We can use the public-use Survey of Business Owners (SBO) data from 2007 to help benchmarkthese choices with respect to the top three earners and their limits. The file contains overtwo million observations on employer and non-employer firms, and the data contain detailedinformation about the firm and its owners. We focus on employer firms that mirror the LEHD-based sample built upon UI data, and we drop a small number of firms where the firm does notreport whether the first-listed owner is a native or immigrant or no ownership data are presentat all. Throughout, we use sample weights to provide population-level statistics.6
We first analyze the likelihood that the business represents the owner’s primary source ofpersonal income. For the full cross-section of single-owner businesses in 2007, this is true for81.8% of businesses with an immigrant owner and 81.4% of businesses with a native owner.Similarly, when incorporating businesses with multiple owners, at least one owner reports thebusiness as the primary income source in 81.9% of firms where an immigrant owner is present,very similar to the 81.3% rate in firms where no immigrant owner is present. When looking atthe most recent entrants (i.e., business founded in 2007), the overall fraction of businesses beingthe primary income source unsurprisingly declines due to transition issues, but remains at two-thirds. It also tilts modestly towards immigrants– across all 2007 entrants, 70.3% and 64.7%of immigrant- and native-owned entering businesses constitute the primary ownership source,respectively, and this difference is statistically significant (t-stat=4.03). Nonetheless, these gen-
6Data and descriptions are available at: https://www.census.gov/econ/sbo/pums.html. This is the first-ever SBO Public Use Microdata Sample and it allows researchers to create their own tabulations and analyseson entrepreneurial activity, including the relationships between firm characteristics such as sources of capital,number of owners, firm size, and firm age. Going forward, a main data objective is to unite our LEHD platformwith the confidential version of the SBO.
11

eral patterns are supportive of the use of LEHD records for identifying entrepreneurs, comparedto an environment where most owners only derived very modest sums from businesses (e.g.,businesses set up for tax purposes, hobby entrepreneurship, or to employ household workers).We next consider calculations that help evaluate our focus on up to three owners. The news
is again mostly supportive. Across all SBO firms in 2007, the average number of owners is 1.8,while for the newest 2007 entrants it is 1.7 owners. With our approach in the LEHD data, theaverage owner number is 2.16. This difference comes mostly from underestimating the shareof firms with a single founder, and in some cases we are including an extra person in some ofour assignments. On the other hand, a non-trivial share of SBO businesses report four or moreowners compared to our cap at three entrepreneurs. Without more information, we must drawthe line at some founder count, and we believe three founders provides the best balance.This trade-offsuggests that we need to examine closely how immigrant owners are distributed
over the owner count distribution to see if scope for bias exists. Focusing on the 2007 entrants,we find relatively uniform rates of an immigrant owner being present: 23.4%, 22.4%, 27.0%,and 27.3% for firms with 1, 2, 3, and 4+ owners, respectively. A rising share on this dimensionis to be expected, given our focus on any owner being an immigrant, and the differences arevery modest. This suggests a rather small scope for issues emerging with counting too few ormany owners with our three-person definition. This does not resolve the possibility of confusingemployees with owners, to which we return shortly. Among the largest ownership teams forentering firms, we do not find immigrants being substantially different in terms of order listed.For 4+ person teams, the immigrant shares are 20.3%, 14.4%, 13.8%, and 14.2% for the firstthrough fourth positions (max reported) of listed owners. These structures again do not suggestvery substantial issues likely to emerge with a three-person focus compared to using two- orfour-person cut-offs.7
As a final step, the SBO contains some employment information that we can compare againstthe owner counts. As advanced warning, however, two significant issues exist in the analysis tofollow. First, how each firm chooses to count owners towards employment is unclear. Second,the public-use SBO files intentionally introduce noise into the employment data to protect theidentify of firms. Thus, while we believe the following analysis is quite informative for whetherour definition creates a bias for immigrant vs. native businesses, we need to be cautious aboutthe exact figures reported. Our approach is simply to define an indicator variable for caseswhere we know we would have added an extra employee to our owner/entrepreneur definitionbecause the employment count exceeds the owner count and the owner count was less than threeowners; this is not comprehensive for all possible errors in our definition, but it is the mostworrisome. Among the 2007 SBO entrants, this condition is met in 39.4% cases. This numberseems high to us, but we also don’t know really how to evaluate it in light of the noisy data,
7In our regression sample, our mean immigrant entrepreneur share is 22.6%, with a 2005/1995 growth ratioof 1.31 (Column 2 of Table 3 that is discussed below). We find comparable means and very similar growth ratioswhen examining firms that start with one entrepreneur (23.6%, 1.32) or two entrepreneurs (21.4%, 1.29).
12

etc. What we do take great comfort in, however, is that this fraction is 40.3% for immigrant-owned businesses and 39.1% for native-owned businesses, with the differences not statisticallysignificant (t-stat=0.74). This suggests that we while we may modestly mismeasure levels (e.g.,identifying too many entrepreneurs), we are unlikely to have a bias by immigration status inthis regard.Overall, we take comfort in the SBO comparison. Any single rule like our three-person
definition will face liabilities, and these tabulations appear to say our calibration is reasonablybalanced. We also note one feature that helps isolate our technique from potential biases wherewe may identify an employee as an entrepreneur. Empirical studies of the hiring patterns byimmigrant owners emphasize the strong degree to which they hire from their own ethnic group(e.g., García-Pérez, 2012; Andersson et al., 2012, 2014; Åslund et al., 2014). Thus, our "falsepositive" for an immigrant-owned business is most likely to be an immigrant, and vice versafor a native-owned business. As an extreme example, our definition would be fully robust tounpaid owners or the inclusion of too many wage earners if the immigrant status of the employeesexactly mirrored that of the true owners. This extreme condition does not hold, of course, butthe quite high rates of concentration among small employers documented in Andersson et al.(2014) and similar studies are comforting for our design.A second point of comparison comes from individuals to whom we can link LEHD records to
their responses to the 2000 Census. The long-form collects whether or not an individual declaresthemselves to be primarily self-employed in an incorporated firm, primarily self-employed inan unincorporated firm, an employee in a private-for-profit firm, or other categories. Lookingat 2000 for individuals working in an SEIN created since 1995, we find that we label as anentrepreneur 66% of those declaring themselves to be self-employed in an incorporated firm. Bycontrast, we only label as an entrepreneur 29% of those declaring themselves to be self-employedin an unincorporated firm. Thus, our definition clearly tilts towards incorporated firms and thoseoriented towards employment and possibly growth, capturing a large portion of this group. Thelarger deviation, which is not surprising, is that about two-thirds of the overall set of peoplewe declare to be entrepreneurs are listing themselves as an employee in a private-for-profit firm.Specifically, the composition of our entrepreneurial pool breaks down as 68% saying they areemployed in private-for-profit firms, 28% self employed, and a small residual in other categories.In many of these new firms, no one is declaring themselves to be self-employed, which is alimitation of this approach to defining entrepreneurship. We thus find it diffi cult to benchmarkthis form of the metric compared to the self-employment breakdown.
3.4 Measuring Firm Dynamics
Our analyses consider the survival and growth of new businesses, which we measure exclusivelythrough the LBD. This choice, which was not obvious to us at the start of this project, isimportant. By measuring outcomes through the LBD, we capture the full employment and
13

payroll growth that the firm experiences (domestically in the United States). Alternative metricsbased upon SEINs alone can miss substantial firm adjustments that occur within LEHD stateswhen they open up new SEIN codes. Moreover, by definition, LEHD-based definitions of growthare subject to the state coverage limitations of the database. Thus, in combination with thediscussion above, our strategy can be summarized as follows– [1] find single-unit firm entrantsduring 1992-2008 in the LBD that are in a covered LEHD state, [2] collect the initial employmentrecords that are contained in the LEHD to describe the immigrant-native composition of initialemployees and founders, and [3] return to the LBD for subsequent growth outcomes. Thisstrategy allows us to retain all entrants and consistently measure growth; fortuitously, it alsolets us use the LBD outcome data to 2011 for growth dynamics even though our version of theLEHD ends in 2008. The only potential biases will relate to the specific set of states that weobserve and how they compare nationally. On the other hand, this strategy would not necessarilybe optimal in cases where one wanted to observe the employment composition of firm growth(e.g., the year-on-year subsequent hiring of immigrant or natives).Our platform describes immigrant entrepreneurship in general and across sub-populations.
We split the sample by low- and high-wage firms using the median quarterly earnings duringthe year of entry. We also define firms as high-tech if the majority of their employment is in athree-digit SIC code listed as a high-tech industry in Hecker (1999). Separate characterizationsare also provided by one-digit SIC codes. Given the specific academic interest and policy focuson VC-backed firms, we identify entrants that receive VC funding by 2005, as recorded in theVenture Xpert database, using name and geographical-location matching algorithms (Kerr et al.,2014). As we do not have matches beyond this point, we only study VC-backed entrepreneurshiprates through 2005. Finally, we provide some tentative notes about whether firms go public by2005. This information is collected by observing whether the new firm is later present in theCensus Bureau’s Compustat Bridge File, which was last updated for the 2005 public firm cohort.
3.5 Additional Discussion
A central goal of this project is the compilation of information and best practices necessaryfor using the LEHD for studies of immigrant entrepreneurship. To this end, a detailed dataappendix provides specific instructions and commentary for researchers regarding the LEHD,with a special focus on the firm-level dimensions and the longitudinal aspect of the LEHD data.This appendix information extends beyond the present study to also document issues noted inthe Kerr et al. (2015b) study of large firms. Additional restricted-access materials are availableupon request. The appendix also provides thoughts about other datasets that could improveupon the entrepreneurship definitions developed here.
14

4 Entrepreneurship Trends
4.1 LEHD Statistics
Table 2a presents our core trends using all LEHD workers and a three-year definition for en-trepreneurship. For these initial tabulations that regard all workers, we do not impose thesingle-unit firm restrictions or similar, keeping a very broad set of data. Column 2 considers im-migrant participation rates in new firms relative to the total immigrant workforce in the LEHD.Approximately 6.0% of immigrants in the LEHD are working in new firms born over the priorthree years, with some evidence for a decline in the rate over time. Appendix Table 2a providesthe observation counts that underlie these estimates, which cover 3.2 and 4.6 million immigrantsin 1995 and 2008, respectively. Throughout this paper, observation counts are approximate androunded per Census Bureau disclosure requirements. This appendix table also shows that immi-grants constitute 19.3% of the LEHD sample during 1995-2008, growing from 16.4% to 21.2%,and the native rate of employment in new firms averages 4.6% (versus 6.0% for immigrants).The native rate is similarly declining after 2005.8
Column 3 documents that 2.2% of immigrants are among the top earners in a new businessand thus declared to be an entrepreneur by our definition. Parallel to Fairlie and Lofstrom (2014)and in contrast to Column 2, this share grows substantially to 2005, before declining some.Features of the data initialization process for identifying entrepreneurship are more diffi cultfor 1995 and 1996 for some states, and we are required to use some minor extrapolation forthese initial years for Column 3 in Tables 2a and 2b. These initialization challenges impactentrepreneurial rate calculations mostly, with upcoming share-based calculations in Columns4-10 being substantially less sensitive and unadjusted. Similarly, we report the trend statisticsthrough 2008, but we hesitate to make too much of the declines observed after 2005. Through2005, the entry rates are overall stable, and we believe some, if not all, of the decline after 2005can be traced to declines in match rates of new firms in the Business Registry Bridge betweenthe LEHD and LBD. That said, to the extent that the trends are real, they would match thebroad secular decline in employment in young U.S. firms documented by Decker et al. (2014).Most of our focus is on the share of entrepreneurs who are immigrants, which is not materiallyinfluenced by these issues.Columns 4-10 consider immigrant shares of activities relative to natives. Columns 4 and 5
repeat the previous two analyses on a relative basis. We estimate immigrants account for about24% of entrepreneurs and the new employees of firms in our sample. The immigrant share of newentrepreneurs rises dramatically in our sample from 16.7% in 1995 to 27.1% in 2008, while thetrend for immigrant shares of initial employees is more modest. Figure 2 graphs these trends. In
8While the 11 states are present in the LEHD by 1992, the statistics begin in 1995 to allow full initiation ofall of our data and definitions. For example, while we can identify from the LBD the full set of young firms in1992 (i.e., those born in 1989-1992), we do not know the immigration status of all of their top earners in the firstyear of the firm’s life.
15

Column 6, we isolate the top quartile of the initial earnings distribution of start-ups (measuredas quarterly averages). Immigrants tend to create firms with lower initial earnings, and theupward trend in immigrant shares for this top quartile is a bit weaker. Some of this patternresurfaces below when looking at payroll growth regressions.A number of studies report the share of firms with at least one immigrant founder. This often
appears motivated by a desire to have the highest share possible for advocacy pieces, but it mayalso stem from a genuine desire to capture the number of businesses touched in some way byimmigrant entrepreneurship. By contrast, our baseline estimates are implicitly allowing fractionimmigrant entrepreneurship in firms with several starting employees and weighting larger initialteams more (up to three employees). Columns 7 and 8 show that about 35% of entering SEINsor LBD firms have an initial immigrant employee, with Column 7 also implicitly showing thatour LEHD-LBD match is not introducing a bias. Columns 9 and 10 show patterns defined overlarger LBD samples. While the results vary somewhat depending on these definitions used, themain message from Table 2a is that the overall time-series pattern of our findings remains largelyunchanged– immigrants are accounting for roughly a quarter of entrepreneurs and their shareis increasing with time.Appendix Table 2a provides complementary statistics for the 28 states present in the LEHD
by 2000. The wider state panel allows us to assess the potential impact of focusing on just 11states, including two of the nation’s most immigrant-heavy states, California and Florida. Con-sidering the overlapping 2002-2008 period, our longer panel has an average immigrant workershare of 20.6% compared to 17.3% in the wider sample; likewise the immigrant share of entrepre-neurship is 25.4% versus 21.6%. Thus, our "levels" statistics are on the order of 3% higher. Onthe other hand, rates of immigrant and native entry are extremely close (5.9% vs. 5.8%, 4.5%vs. 4.4%), and all of the 2002-2008 trends are very close to each or even stronger in the widersample. We thus conclude that our longer state sample may overstate national levels slightlybut are otherwise quite representative. This is due in part to the larger average state sizes in thelonger panel (despite the addition of Texas in the larger set of 28 states), with the 11 baselinestates constituting 57% of the employment in the 28 states during 2002-2008.Appendix Table 2b shows that the results are robust to defining new firm employment through
the first year of business entry only. This narrower definition essentially cuts the rate of firm entryby two-thirds. The one-year employment rate in new firms for immigrants is now 2.0%, comparedto 1.5% for natives, a sizeable differential remaining. The immigrant share of employment innew firms grows from 17.6% in 1992 to 24.9% in 2008, parallel to our baseline results in Table2a.Appendix Tables 3a and 3b report results for one-digit industries. Rates of immigrant entry
are highest in mining & construction (SIC1), wholesale & retail trade (SIC5), and services (SIC7).Splitting industries at the three-digit level, entry rates tend to be higher for low-tech sectors, butthis pattern is inverted around 2000 during the high-tech boom. A similar pattern is evident for
16

VC-backed entry. Some of these patterns reflect inherent differences in entry rates across sectorsand over time, common to immigrants and natives. In terms of share of initial employment,immigrants have higher relative representation in manufacturing (SIC2-3), wholesale & retailtrade (SIC5), and services (SIC7).Table 2b repeats Table 2a for the part of our sample of firms that are backed by VC investors.
About 0.11% of immigrants are starting top earners in VC-backed firms during 1995-2005. Thisshare is naturally substantially less than the 2.2% in Table 2a due to the relatively small numberof ventures receiving VC investment. Reflecting the VC bubble that peaked in 2000, this rateis hump-shaped over time with a peak in 2000. Immigrants constitute about 28% of VC-backedfounders, with this fraction increasing over time. The substantial majority of entering VC-backedfirms have at least one initial immigrant employee, with the more-similar results regarding overallfractions of founders coming from the fact that VC-backed firms tend to have larger countsof initial employees and larger founding teams. On the whole, immigrant entrepreneurship issomewhat stronger for VC-backed firms than generally, with 30% of the former being immigrantscompared to 27% overall in 2005.Our data platform allows us to compare initial immigrant and native employees by [1] their
LEHD characteristics for the full sample and [2] the Census long-form responses for the matchedsample. Appendix Tables 4 and 5 provide these results that we quickly summarize here. Onaverage, immigrant employees in new firms tend to be slightly older and more likely to be male,with lower average LEHD quarterly earnings before, during, and after the founding of the firm.By contrast, the average quarterly earnings for immigrants before, during, and after the foundingof VC-backed firms tends to be higher than their native peers. Looking at respondents matchedto the 2000 Census, immigrants employed in young firms are more likely to be older, male,married, and have more children. While less likely to own a home, immigrants are more likelyto own a higher-priced home and rent more-expensive properties. This is partially connected toimmigrants being more likely to live in high-priced gateway cities. The average year of arrivalfor our 2000 cross-section is 1984, so that the average tenure in the United States in 2000 is 16years. These statistics are reasonable and comforting for our match, although we focus mostof our analytical attention elsewhere. We return later to the year of arrival when consideringdifferences between adult arrivals and those migrating as children.Fairlie (2013) documents from the 2007 SBO that immigrant-owned businesses represent
13.2% of all businesses in the United States, with $434,000 in average annual sales (compared tonon-immigrant-owned firm sales of $609,000). Only 28% of immigrant-owned businesses in theSBO hire outside employees, while the share is even smaller (26%) among the non-immigrant-owned businesses. For those that do hire employees, the average number of employees is 8 inthe immigrant-owned businesses and 12 in the native-owned businesses. Among our sample, theaverage initial employment for firms founded by immigrants exclusively is 4.4 workers, comparedto 7.0 workers for firms launched exclusively by natives. When both types of founders are present,
17

the average is 16.9 workers. Thus, in general, our data appears to match the broad levels andpatterns of the employer firms in the SBO sample, as well as differences in the typical sizesbetween immigrants and natives. Our overall numbers are naturally lower given the focus onthe initial year of the firm (versus a cross-section of employment patterns in existing firms).
4.2 CPS Comparison
To check our LEHD-based approach against publicly available survey data, we derive entrepre-neurship trends using the Current Population Survey (CPS) Merged Outgoing Rotation Group(MORG) data from the NBER.9 The data include details about the respondent’s place of birthstarting in 1994, and also reports the class of worker where one of the categories is "self-employedin an incorporated business". We prepare a CPS sample that matches the traits of our LEHDwork, starting with individuals aged 25 to 50 who live in one of our core 11 states and work inthe private sector. We further limit the data to those persons who are in the labor force andhave a known level of education and potential labor market experience of at least one year. Tostay consistent with the LEHD, we include as immigrants all those who are born outside of theUnited States.Figure 3a first compares the immigrant workforce shares evident in the two data sources. The
levels are very comparable, and the trends quite similar, with the CPS trend being modestlysharper. Figure 3b next compares the immigrant share of the entrepreneurial groups. TheCPS trend includes as new entrepreneurs those who are newly self-employed in an incorporatedbusiness. The levels are more different here, with the LEHD being consistently at least 3%-4%higher. Perhaps more important, while both are upwardly sloping, the timings are different. TheLEHD shows stronger growth during the 1990s, while the CPS picks up more in mid to late 2000s.We do not have a strong hypothesis regarding the source of these differences, although some of itmay connect to the CPS redesign in 2002-2003. Unreported tabulations include unincorporatedself-employed workers into the CPS entrepreneurial definitions, finding that the resulting trendsits in-between the two series shown in Figure 3b, with the augmented CPS series retaining itstrend differences from the LEHD.Figure 3c finally compares various metrics regarding rates of entrepreneurship for immigrants.
Relative to the immigrant entrepreneurial shares shown in Figure 3b, entrepreneurial rate cal-culations are substantially more sensitive to definitional decisions that can have large impacton their levels (regardless of data source). From the CPS, we provide at the top of Figure 3c ameasure of the incorporated self-employment rate for immigrants in the sample. This includesself-employed owners who have held their business for many years, and thus provides a higherestimate of about 3.5% for the years; this share would exceed 10% if including unincorporatedself-employment. At the bottom of Figure 3c is the Kauffman Foundation Index that is derived
9Data available at: http://www.nber.org/data/morg.html. We thank Ethan Lewis for his guidance on thiswork.
18

from the CPS through entry into self-employment (Fairlie et al., 2015); due to its focus on en-trepreneurial transitions, the rate is much smaller at about 0.4%. For the LEHD, we show ourcore measure, where we use a three-year window for counting entrepreneurs, and the one-yearversion that is most comparable to the Kauffman Foundation Index. It is clear that our metricsfall in between the extremes of CPS-based approaches. We tend to see comparable stability,and both data sources speak to a growing rate for immigrants compared to natives in terms ofentrepreneurial transitions (which is mostly implied by Figure 3b).10
5 Analysis of Firm Survival and Growth
We next consider differences in the performance of firms founded by immigrants versus natives.Table 3 first provides descriptive statistics for the sample of firms used for analytical workcomparable to Tables 2a and 2b. The analytical sample includes firms founded 1992-2005 ina Primary Metropolitan Statistical Area (PMSA) within a state present in the LEHD since1992. Relative to Tables 2a and 2b, several data preparation steps are undertaken to excludeentrants that are multi-unit LBD entering firms and entrants lacking complete information for theconsidered LBD and LEHDmetrics (e.g., reported payroll). The metrics focus on the immigrant-native composition of the top three initial earners. The sample ends with 2005 entrants to allowobservation of LBD outcomes until 2011 and to circumvent any issues with the LEHD-LBDmatch (Business Registry Bridge) in later years.Table 4a shows a basic tabulation of the data over a three-year growth horizon. We include in
this analysis all entering cohorts of firms during the 1992-2005 period, with outcomes measuredafter three years for each entrant (e.g., 2004 employment for a 2001 entrant). In Panel A, eachrow represents a separate starting size category in terms of employment. We then tabulatethe share of entrants for each starting size category that grow to the level indicated by columnheaders by the third year, with rows summing to 100%. Thus, Column 2 shows that over one-third of firms close across this time span, while Column 7 shows that very few firms reach orexceed 100 employees, especially when starting from the smallest size category. The cells in boldrepresent the least moment from initial employment levels, which is the most likely outcomeother than business closure.11
Panel B provides for each cell the average initial immigrant entrepreneurship share for thefirms in that group. Entrepreneur definitions use the top three initial earners, independent ofwhether these individuals remain top earners in the firm across the three years. The Total rows
10The one-year rolling definition of entrepreneurship in the LEHD provides an entry rate that is about two-thirds of the three-year basis in Figure 3c. This limited gap is due to the high rate of business failure in the firstthree years of operation. By contrast, employment in new ventures shows a greater difference, as described abovefor Appendix Table 2b. This is because employment counts capture the growth and scaling of surviving venturesthrough their first three years, in addition to business failure effects. As our identification of entrepreneurs isfixed from the first year of each venture and with a maximum of three founders, this latter effect is not presentand the differences based upon windows is smaller in Figure 3c.11The majority of closed businesses are failed companies, but closures also include acquired companies should
the LBD identifiers change, some of which may be quite successful outcomes.
19
and columns provide the weighted average immigrant entrepreneurship rates for their groups.The shares in Column 8 decline across starting levels reflective of the lower sample averageinitial employment for immigrant-started businesses noted above. Panel C similarly provides theaverage initial immigrant employment share for grouped firms independent of initial earnings.The intriguing initial pattern in the data points to a greater volatility of immigrant entre-
preneur outcomes. The immigrant shares are frequently lowest among the bolded cells thatrepresent static employment levels. In all cases, immigrants are more represented among closedfirms in Column 2 compared to the bolded cells. Moreover, among the firms that begin with5-9 or 10+ employees, immigrant shares are lowest in the bolded cells compared to any othermovement. In the smallest category, which Panel A shows is the most stagnant of the initial sizecategories, immigrant shares among those firms remaining at 1-4 employees closely mirrors theoverall share. Table 4b similarly considers a six-year growth horizon for cohorts, which uses theLBD data up to 2011 for our 2005 entrants. Over half of entrants fail by year six, which reflectstypical start-up life expectancies. The patterns are mostly repeated here, especially in Panel C.In Panel B, there is less evidence of upside growth outcomes.While intriguing, these tabulations do not account for general differences in when immigrant
versus native firms are founded or their other measurable attributes. To address these issuesTable 5a considers regressions of the three-year outcomes that take the form,
Yf,t+3 = ηt + βImmigrantEntrepreneurSharef,t + γXf,t + εf,t,
where f and t index firms and entering cohorts. We include a vector of cohort fixed effects ηtand control for the initial attributes of the firms (Xf,t) in terms of their starting log employmentand log payroll. Regressions are unweighted and report robust standard errors. Panel A presentsthe summary statistics for outcome variables. Panel B provides the baseline regression, with thelast row giving the relative effect of increasing the immigrant entrepreneur share from zero toone compared to the sample mean.Column 1 considers firm survival until the third year. On average, 64% of firms survive
this long, with immigrant-founded firms being 0.3% less likely to survive compared to similarfirms with only native founders. Columns 2-7 consider traits of firms conditional on survivingto their third year. We first look at employment growth, measuring changes relative to thefirm’s average in two periods following Davis et al. (1996): [Yf,t+3 − Yf,t]/[(Yf,t+3 + Yf,t)/2].
This measure is bounded by [-2, 2], prevents outliers, and symmetrically treats positive andnegative shifts. Conditional on survival, firms founded by immigrants show greater growth.Columns 3 and 4, by contrast, show no difference in terms of growth of payroll or establishmentcounts. The lower payroll growth may indicate lower wage growth, additional jobs being lowerwage, or that partial employment is in greater use. Column 5 alternatively models employmentgrowth through indicator variables for the firm achieving more workers than its initial level,while Columns 6 and 7 are similarly defined for the firm reaching 100 workers or being among
20

the top 10% of firms in terms of employment in its specific industry. These approaches confirmthe employment growth observed in Column 2. The final regression shows immigrant-startedfirms are much more likely to receive VC financing.Panel C takes a more-stringent approach that controls for cohort-PMSA-industry fixed ef-
fects, with industry being defined at the two-digit level of the SIC classification. This approachremoves any differences between immigrants and natives to found firms in certain cities or sec-tors, which can be important for outcomes, and instead compares immigrant outcomes to nativeswithin these narrow cells. We do not view either approach as an inherently better way to describethe data, as differences in the choices of locations and industries are as relevant as differencesin within-cell outcomes (e.g., due to different management practices). In some cases, this choicehas material impacts, while in other cases the results are robust across the variation employedin the estimates.12
In Panel C, we see that immigrant entrepreneurs are more likely to survive for three yearscompared to their closest native peers. The baseline employment growth is substantially dimin-ished in Column 2 compared to Panel A, while some of the binary employment growth outcomesin Columns 5-7 retain more strength. The most robust outcome is achieving the top decile ofindustry employment, which already has a degree of industry-level benchmarking built into it.Payroll growth is now significantly less than native peers, while establishment count growth isagain flat.Table 5b repeats Table 5a for the six-year outcomes. The relationships in Panel B are quite
comparable to the three-year outcomes, with payroll and establishment count growth now moreevident. Payroll growth is again noticeably smaller than employment growth. In general, there isgreater statistical precision for the results with six-year outcomes, and the relative magnitudesare larger in size compared to the U.S. average outcomes than earlier. The introduction ofcohort-PMSA-industry fixed effects in Panel C of Table 5b has a similar effect to what it didfor the three-year outcomes. Appendix Tables 6a and 6b repeat these outcomes using simplythe initial immigrant employee share as the explanatory variable, finding comparable results.Perhaps the key difference is that the employment growth outcomes are now more robust to theinclusion of the cohort-PMSA-industry fixed effects.On the whole, the data paint some interesting differences, albeit tentative and non-causal,
between firms founded by immigrants versus natives. When incorporating industry and citychoice into the variation, immigrant founders have a greater volatility that somewhat mimics theup-or-out dynamics of young firm growth described in Haltiwanger et al. (2013). They fail morefrequently, but generate greater employment growth if they manage to stay in business. Over asix-year horizon they become more associated with higher payroll and establishment counts, but
12Our analysis uses the geocoding for the initial PMSA for the business. In a separate context, Kerr et al.(2015) describe the geographic information in much greater detail for the LEHD and the LEHD-Decennial match.There is capacity within the LEHD to observe movements over cities for all individuals; for those matched to theDecennial Census, there is further power to look very closely at the locations of residence versus business. Thesedimensions would be very interesting to consider in the immigrant context.
21

these are second-order to employment outcomes. However, much of this action appears to comethrough the way in which immigrant entrepreneurs chose locations and industries. Conditionalon these features, they are more likely to survive than their native peers and modestly morelikely to experience employment growth, with payroll growth under-performing comparable firmsfounded by natives.Unreported estimations consider whether the industry or geography controls are more impor-
tant for the differences observed across panels in Tables 5a and 5b. The intriguing answer is thatgeography plays the central role– and especially one state. This can be expressed in two ways.First, where a reversal of coeffi cient direction occurs across panels, the same pattern usuallyoccurs when just introducing state fixed effects, while this is not true when introducing industryfixed effects. Second, adjustments in sample composition around the one state’s inclusion orexclusion can achieve similar shifts as well. We are not able to show these tabulations directlyor name the state due to the requirement that LEHD samples (or differences across two relatedsamples) contain three or more states. Our internal files record the state breakout. Thus, insome respect, the unconditional results evident in Panel B are the perspective taken when oneallows for much of immigrant entrepreneurship to be in one location. This can include possiblyendogenous flows of immigrants for opportunities, and it may reflect how immigrant entrepre-neurship impacts the state’s economic dynamics. By contrast, the patterns in Panel C of thesetwo tables are observations that control for these overall regional differences. Both perspectivesare quite important to consider.To look a little further behind these results, we also conduct several sample splits in Tables
6a and 6b for estimations with and without conditioning on cohort-PMSA-industry fixed effects.Each coeffi cient in the tables is from a separate regression. The top row repeats the baselinespecification, followed by splits between low- and high-wage firms, low- and high-tech sectors,and then VC backing (non-VC-backed results are not reported since they are so close to thebaseline outcomes). We most focus on Table 6b, where several intriguing differences are present.First, variation among low-wage and low-tech groups is generally responsible for our conditionalsurvival relationship. Second, employment growth is generally associated with high-wage andhigh-tech sectors. Third, payroll growth compared to natives is never present. Fourth, whileimmigrant-founded ventures are more likely to access VC financing, they do not display strongeroutcomes conditional on this financing. This is in many respects a parallel finding to our ob-servation that city-industry choice accounts for much of the observed differences in the generalsample. Finally, where employment growth occurs, it is usually about achieving any employ-ment expansion relative to the initial level or reaching the top deciles of an industry, rather thansurpassing the threshold of 100 employees (a benchmark that few newly started firms make).This is true for the general and VC-backed samples, suggesting that employment effects due toimmigrant entrepreneurship are more likely to come from accumulated contributions of manyfirms compared to the extreme outcomes of a few high-growth entities that are often emphasized
22

in the popular debate.In unreported estimations, we also look at the probability of achieving an IPO by 2005, both
in the whole sample and among firms backed by VC investors. We do not observe differencesfor immigrant entrepreneurs in this regard, but we also hesitate to emphasize this result giventhe early end date of the Compustat Bridge File for our sample.While this study does not identify why immigrants might choose riskier city-industry cells,
some preliminary candidates can be listed. One is that the self-selection process of internationalmigration leads to a pool of foreign-born individuals in the United States who have a greatertolerance for risk and uncertainty than the average U.S. native. This could lead to differencesin the distributions of businesses started by the two groups with respect to potential growthoutcomes. A second possibility is that immigrants have weaker wage-based options, due to somecombination of factors like limited language skills, reduced acceptance of education credentials,spatial isolation in ethnic enclaves, social exclusion, or similar (e.g., Lewis, 2013b). These re-duced outside options may make immigrants willing to launch a business of any form and ventureinto riskier domains. A third, more positive, possibility is that the tight social structures forsome immigrant groups allow them a group-based capacity to enter into riskier domains and relyon each other, similar to the studies of immigrant entrepreneurial specialization (e.g., Kerr andMandorff, 2015).This comparative advantage could be consistent with benefits of immigrant-generated diversity documented by Ottaviano and Peri (2006), Mazzolari and Neumark (2012),Nathan (2015), and similar. Another possibility, to complete a first and incomplete list, is thatillegal immigration and undocumented workers in immigrant-led firms have somehow led us tomismeasure some of the growth/survival properties. We believe the LEHD-based platform pro-vides power going forward to investigate these questions, for example, by taking advantage of theobservation of wage histories before and after entrepreneurial spells to understand outside op-tions. Similarly, the detailed information on country-of-birth can aid analyses of social isolation,group concentration on entrepreneurship in certain industries, and similar features.Table 7 provides our final analysis, which is fairly brief. One goal of this project is to
evaluate whether the 2000 Census traits can be incorporated systematically into the immigrantentrepreneurship analysis. Given the policy interest on the age at arrival of immigrants, wechoose this dimension and show some initial tabulations in the transition framework of Tables4a and 4b. We restrict the sample to start-ups that have immigrant founders, and samplesizes require that we combine the final growth outcomes in Column 6 to achieving 20 or moreemployees. The cells now represent the share of immigrant founders in the cell who came to theUnited States as children. At starting employment levels of nine workers or less, immigrantscoming to the United States as children are generally associated with better outcomes in termsof lower closure rates and higher representation among the larger size categories. Immigrantscoming to the United States as children are also more likely to start larger firms, and among thislargest category they tend to be over-represented among business closures and the firms that
23

achieve the largest employment outcomes. As important, we form a general conclusion fromthis exercise that researchers will be able to split the samples suffi ciently along traits availablein the 2000 Census match to explore outcomes associated with different traits of immigrantentrepreneurs. Tabulations of growth by two or more dimensions (e.g., education and age ofarrival) will quickly become strained, requiring multi-variate regression analysis instead.
6 Conclusions and Future Research
The constructed data platform provides new statistics regarding the patterns of business for-mation by immigrant entrepreneurs and the medium-term success of those businesses. Thedefinition of an entrepreneur used in this study is in many ways dictated by the coverage of theLBD and the LEHD, and hence it is useful to compare our calculations and estimates to thosederived from other data sources. Looking back at Table 1, our results tend to fall in the upper-end of the estimates for the immigrant entrepreneur share. There are several factors potentiallyat work. First, the LEHD data does not identify the actual founders of businesses, and we maybe over- or under-inclusive in our definition using the top three initial earners. We have yet toidentify a technique to quantify this effect relative to other definitions possible for founders. Oneof the most feasible comparisons may be business ownership records in the SBO (e.g., Fairlie,2008, 2012). Ownership estimates will be higher than entrepreneurship estimates due to thelarger existing stock of native small business owners compared to new firm formation, and so wedo not expect this difference to close. But through the study of new entrants captured in theSBO, perhaps the entrepreneurship metrics can be enhanced or their properties better defined.Beyond immigrant shares of entrepreneurs, rates of entry are more diffi cult to reconcile due
to many alternatives for both the numerator (who is an entrepreneur?) and the denominator(what population are we comparing this to?). Our data have some distinct traits. First, theLEHD only includes employer firms that file UI records, and thus excludes non-employer firmsand self-employment. Addition of these individuals will most likely alter the estimated rates bymainly boosting the numerator. That said, most of the policy focus and academic interest centerson attracting "growth entrepreneurs" that create jobs, in which case a restriction of the analysisto employer firms is actually desired. Second, our denominator focuses on private-sector workersin the LEHD. This denominator could be also more inclusive by incorporating the entire publicsector or by being expanded to be all working-age adults in the covered states (e.g., drawn fromthe Current Population Survey). Using a larger population for the denominator will obviouslyreduce our measured rate of entrepreneurship. In general, our calculations seek to provide a new,longitudinal view into the patterns of immigrant entrepreneurship and not directly replicate nornecessarily displace findings from earlier studies. Our platform sacrifices on some dimensions(e.g., state coverage, ownership data) and gains on others (e.g., universal samples, longitudinaldepth, homogeneity across skills).
24
While there has been considerable recent interest in immigrant entrepreneurship, as surveyedby Fairlie and Lofstrom (2014), the state of the field in terms of academic studies is still mostlywide open. Even establishing the basic facts has been hampered by the availability of large-scale, nationally representative longitudinal data that would capture both firm founders andtheir firms. Below we describe several promising areas for further research, many of which wouldbenefit from greater data availability from administrative sources.First, it would be helpful to build a more solid research foundation for quantifying the mag-
nitudes of immigrant contributions to the creation of new entrepreneurial firms in the Science,Engineering, Technology and Mathematics (STEM) fields. Many immigration policies specif-ically target this area– e.g., the longer Optional Practical Training (OPT) period for STEM-degree holders– and much of the concern over encouraging immigrant entrepreneurship focuseshere. In doing so, researchers could utilize the employer-employee panel data developed here andideally also engage in a more-causal analysis of policy changes affecting high-skilled immigrationin general and post-study immigration of STEM graduates from U.S. universities in the 2000sand thereafter.Second, a better understanding of how the existing immigrants in the United States can more
effectively engage in starting new businesses requires careful study of the choices and policy con-straints faced by immigrants in their decisions to build and grow new firms versus being workersin a larger corporation. We also lack a clear picture of how the successful immigrant foundersenter the United States, which can be for reasons as diverse as schooling, employment, familyreunification, and more. A study of the transitions or the sequence of events explaining entryby immigrant entrepreneurs and the role of policies in allowing/blocking this transition wouldbe a helpful start. For example, a frequent policy misconception is that the H-1B immigrantsare responsible for lots of start-ups, and expanding the H-1B cap would boost entrepreneurship.While it might indeed do so over some horizon, we would anticipate a significant time lag be-cause H-1B workers are tied to their sponsoring employers until a green card is approved, oftentaking six or more years. A specific evaluation could focus on the transitions of H-1B holdersinto entrepreneurship. While the current data platform can provide reasonable approximationsof H-1B holders– e.g., isolating immigrant computer programmers aged 25-30 who were bornin India via the 2000 Census match– a better scenario would be to gain access to the USCISrecords on H-1B visa holders and match them to the LEHD and other Census Bureau datasources. Other visa categories lend themselves to similar evaluations, including the OPT visasfor F-1 students. A less-intensive alternative is to link smaller sets of individuals like the H-1Bvisa lotteries studied by Doran et al. (2015). Accomplishing such linkages may be diffi cult, butbetter-quality data ingredients will result in substantially better advice for policy makers.Continuing on these themes, it is widely thought that immigrant entrepreneurs contribute
disproportionately to innovation and technological advancement in the United States (similar tothe more-established facts about the role of immigrants for innovation generally). One way to
25

quantify immigrant entrepreneur contributions in the science and innovation arena is the USPTOpatent data (Hall et al., 2001), matched to the person- and firm-level data sources availablefrom the Census Bureau. Indeed, while there exist recent studies on the effect of high-skilledimmigration on U.S. innovation, we lack a systematic evaluation of how the creation of newfirms by immigrant founders contributes to the overall pace and direction of U.S. innovation andwhether these firms produce different types of innovations compared to native-founded firms(e.g., exploration versus exploitation work). Several studies have made progress on the firm-level matching using name-matching techniques (e.g., Kerr and Fu, 2008; Balasubramanian andSivadasan, 2011; Akcigit and Kerr, 2010). These studies typically find record matching to beeasier for larger firms than small start-ups. It would be terrific to have a match of LEHD workersto the inventor records in the USPTO database. Such a match would enable detailed studies oftechnological trajectories for workers (how start-ups relate to the innovative work of their prioremployer), provide greater assurance about the quality of the matches overall, and facilitateinteresting work on immigration and other related labor market policies (e.g., non-competeclauses).In a very similar vein, we have also made significant headway towards identifying firms backed
by VC investors in the Census Bureau data (e.g., Chemmanur et al., 2011; Puri and Zarutskie,2012). Subsequent work in entrepreneurial finance frequently focuses on individual entrepre-neurs and/or their specific VC investors. Individual-level connections of the LEHD workers tothese data would provide a very powerful platform for the study of VC-backed entrepreneurialoutcomes.While the current study provides some descriptive analyses for a broader set of geographic
areas, a more-detailed analysis of the impact of immigrant entrepreneurship on local job growthand economic development is warranted. Feldman and Kogler (2010) and Carlino and Kerr(2015) review the literature on the geography of innovation that has come since Audretsch andFeldman (1996). Glaeser et al. (2015) consider the general link of entrepreneurship to cityemployment growth, and Samila and Sorenson (2011) consider the specific case of VC-backedstart-ups. It would be useful to build on this past work to understand the specific case of im-migrant entrepreneurship. Many cities and local areas are attempting to leverage immigrantentrepreneurship directly, and we need to know more about the potential effi cacy of such effortsand how any stimulus actually accrues. Kerr (2010) finds that ethnic entrepreneurs are par-ticularly important in the reallocation of inventive activity to be near sources of breakthroughinnovations and their scaling process (e.g., Duranton, 2007); study of these phenomena withinthe LEHD data family is quite promising. Similarly, we skip in this study the ethnicity andimmigration status of hired employees due to data features noted above (e.g., the expansion offirms across LEHD state lines), and such features would be very natural to incorporate in a localgrowth context given the complete definitions of employee traits.
26

References[1] Abowd, J.M., Stephens, B.E., Vilhuber, L., Andersson, F., McKinney, K.L., Roemer, M.
and Woodcock, S. (2008). The LEHD Infrastructure Files and the Creation of the QuarterlyWorkforce Indicators.
[2] Akcigit, U. and Kerr, W. (2010). "Growth Through Heterogeneous Innovations." NBERWorking Paper 16443.
[3] Akee, R.K.Q., Jaeger, D.A. and Tatsiramos, K. (2007). "The Persistence of Self-Employment Across Borders: New Evidence on Legal Immigrants to the United States."IZA Discussion Papers 3250, Institute for the Study of Labor (IZA).
[4] Anderson, S. and Platzer, M. (2006). "American Made: The Impact of Immigrant Entre-preneurs and Professionals on U.S. Competitiveness." National Venture Capital AssociationReport.
[5] Andersson, F., García-Pérez, M., Haltiwanger, J., McCue, K., and Sanders, S. (2014)."Workplace Concentration of Immigrants." Demography, 51:6, 2281-2306.
[6] Andersson, F., Burgess, S., and Lane, J. (2012). "Do as the Neighbors Do: The Impact ofSocial Networks on Immigrant Employment." Working Paper.
[7] Åslund, O., Hensvik, L., and Skans, O. (2014). "Seeking Similarity: How Immigrants andNatives Manage in the Labor Market." Journal of Labor Economics, 32:3, 405-441.
[8] Audretsch, D. and Feldman, M. (1996). "R&D Spillovers and the Geography of Innovationand Production." American Economic Review, 86, 630-640.
[9] Balasubramanian, N. and Sivadasan, J. (2011). "What Happens When Firms Patent? NewEvidence from US Manufacturing Census Data." Review of Economics and Statistics, 93:1,126-146.
[10] Bengtsson, O. and Hsu, D. (2014). "Ethnic Matching in the U.S. Venture Capital Market."Journal of Business Venturing, 30:2, 338-354.
[11] Blau, F. and Kahn, L. (2016). "Immigration and Gender Roles: Assimilation vs. Culture."NBER Working Paper 21756.
[12] Borjas, G. (1986). "The Self-Employment Experience of Immigrants." Journal of HumanResources, 21, 487-506.
[13] Borjas, G. and Doran, K. (2012) "The Collapse of the Soviet Union and the Productivityof American Mathematicians." Quarterly Journal of Economics, 127:3, 1143-1203.
[14] Carlino, G. and Kerr, W.R. (2015). "Agglomeration and Innovation." In Duranton, G.,Henderson, V. and Strange, W. (eds.) Handbook of Urban and Regional Economics, Vol. 5,349-404.
[15] Chemmanur, T., Krishnan, K. and Nandy, D. (2011). "How Does Venture Capital FinancingImprove Effi ciency in Private Firms? A Look Beneath the Surface." Review of FinancialStudies, 24:12, 4037-4090.
[16] Chung, W. and Kalnins, A. (2006). "Social Capital, Geography, and the Survival: GujaratiImmigrant Entrepreneurs in the U.S. Lodging Industry." Management Science, 52:2, 233-247.
27

[17] Clark, K. and Drinkwater, S. (2000). "Pushed Out or Pulled In? Self-employment AmongEthnic Minorities in England and Wales." Labour Economics, 7:5, 603-628.
[18] Clark, K. and Drinkwater, S. (2006). "Changing Patterns of Ethnic Minority Self-Employment in Britain: Evidence from Census Microdata." IZA Discussion Papers 2495,Institute for the Study of Labor (IZA).
[19] Cole, R. (2011). "How do Firms Choose Legal Form of Organization." Small Business Ad-ministration Release 383, MPRA Working Paper 32591.
[20] Davis, S., Haltiwanger, J. and Schuh, S. (1996). Job Creation and Destruction, MIT Press,Cambridge, MA.
[21] Decker, R., Haltiwanger, J., Jarmin, R. and Miranda, J. (2014). "The Role of Entrepre-neurship in US Job Creation and Economic Dynamism." Journal of Economic Perspectives,28:3, 3-24.
[22] Doran, K., Gelber, A. and Isen, A. (2015). "The Effects of High-Skill Immigration on Firms:Evidence from H-1B Visa Lotteries." NBER Working Paper 20668.
[23] Duranton, G. (2007). "Urban Evolutions: the Fast, the Slow, and the Still." AmericanEconomic Review, 97, 197-221.
[24] Fairlie R.W. (2012). "Immigrant Entrepreneurs and Small Business Owners, and their Ac-cess to Financial Capital." U.S. Small Business Administration Report.
[25] Fairlie, R.W. (2013). "Minority and Immigrant Entrepreneurs: Access to Financial Capital."In Constant, A.F. and Zimmermann, K.F. (eds.) International Handbook on the Economicsof Migration, Edward Elgar, Cheltenham UK.
[26] Fairlie, R.W. and Lofstrom, M. (2014). "Immigration and Entrepreneurship." In Chiswick,B.R. and Miller, P.W. (eds.) Handbook on the Economics of International Migration, Else-vier.
[27] Fairlie, R.W. and Meyer, B.D. (2003). "The Effect of Immigration on Native Self-Employment." Journal of Labor Economics, 21:3, 619-650.
[28] Fairlie, R.W., Morelix, A., Reddy, E.J. and Russell, J. (2015). "The Kauffman Index 2015."Kauffman Foundation Report.
[29] Fairlie, R.W., Zissimopoulos, J. and Krashinsky H.A. (2010). "The International AsianBusiness Success Story: A Comparison of Chinese, Indian, and Other Asian Businessesin the United States, Canada, and United Kingdom." In Lerner, J. and Schoar, A. (eds.)International Differences in Entrepreneurship, University of Chicago Press and NationalBureau of Economic Research, 179-208.
[30] Feldman, M. and Kogler, D. (2010). "Stylized Facts in the Geography of Innovation." In:Hall, B. and Rosenberg, N. (eds.) Handbook of the Economics of Innovation, Vol.1, Elsevier,Oxford, 381-410.
[31] García-Pérez, M. (2012). "A Matching Model on the Use of Immigrant Social Networks andReferral Hiring." Saint Cloud State University Working Papers 2012-21.
[32] Glaeser, E., Kerr, S.P. and Kerr, W.R. (2015). "Entrepreneurship and Urban Growth: AnEmpirical Assessment with Historical Mines." Review of Economics and Statistics, 97:2,498-520.
28

[33] Hall, B., Jaffe, A. and Trajtenberg, M. (2001). "The NBER Patent Citation Data File:Lessons, Insights and Methodological Tools." NBER Working Paper 8498.
[34] Haltiwanger, J., Jarmin, R. and Miranda, J. (2013). "Who Creates Jobs? Small vs. Largevs. Young." Review of Economics and Statistics, 95:2, 347-361.
[35] Hart, D.M. and Acs, Z.J. (2011). "High-Tech Immigrant Entrepreneurship in the UnitedStates." Economic Development Quarterly, 25:2, 116-129.
[36] Hecker D. (1999) "High-Technology Employment: A Broader View."Monthly Labor Review,June 1999.
[37] Hegde, D. and Tumlinson, J. (2014). "Does Social Proximity Enhance Business Relation-ships? Theory and Evidence from Ethnicity’s Role in US Venture Capital." ManagementScience, 60:9, 2355-2380.
[38] Hunt, J. (2011). "Which Immigrants are Most Innovative and Entrepreneurial? Distinctionsby Entry Visa." Journal of Labor Economics, 29:3, 417-457.
[39] Hunt, J. (2015). "Are Immigrants the Most Skilled US Computer and Engineering Work-ers?" Journal of Labor Economics, 33:S1, S39-S77.
[40] Hunt, J. and Gauthier-Loiselle, M. (2010). "How Much Does Immigration Boost Innova-tion?" American Economic Journal: Macroeconomics, 2:2, 31-56.
[41] Kerr, S.P. and Kerr, W.R. (2013). "Immigration and Employer Transitions for STEMWork-ers." American Economic Review Papers and Proceedings, 103:3, 193-197.
[42] Kerr, S.P., Kerr, W.R. and Lincoln, W.F. (2015a). "Firms and the Economics of SkilledImmigration." In Kerr, W.R., Lerner, J. and Stern, S. (eds.) Innovation Policy and theEconomy Vol. 15, University of Chicago Press, 115-152.
[43] Kerr, S.P., Kerr, W.R. and Lincoln, W.F. (2015b). "Skilled Immigration and the Employ-ment Structures of U.S. Firms." Journal of Labor Economics, 33:S1, S109-S145.
[44] Kerr, S.P., Kerr, W.R. and Nanda, R. (2015). "House Money and Entrepreneurship." NBERWorking Paper 21458.
[45] Kerr, W.R. (2008). "Ethnic Scientific Communities and International Technology Diffu-sion." Review of Economics and Statistics, 90:3, 518-37.
[46] Kerr, W.R. (2010). "Breakthrough Inventions and Migrating Clusters of Innovation." Jour-nal of Urban Economics, 67:1, 46-60.
[47] Kerr, W.R. (2013). "U.S. High-Skilled Immigration, Innovation, and Entrepreneurship: Em-pirical Approaches and Evidence." NBER Working Paper 19377.
[48] Kerr, W.R. and Fu, S. (2008). "The Survey of Industrial R&D—Patent Database LinkProject." Journal of Technology Transfer, 33:2, 173-186.
[49] Kerr, W.R. and Lincoln, W.F. (2010). "The Supply Side of Innovation: H-1B Visa Reformsand U.S. Ethnic Invention." Journal of Labor Economics, 28:3, 473-508.
[50] Kerr, W.R. and Mandorff, M. (2015). "Social Networks, Ethnicity, and Entrepreneurship."NBER Working Paper 21597.
29

[51] Kerr, W.R., Nanda, R. and Rhodes-Kropf, M. (2014). "Entrepreneurship as Experimenta-tion." Journal of Economic Perspectives, 28:3, 25-48.
[52] Lewis, E. (2013a). "Immigration and Production Technology."Annual Review of Economics,5, 165-191.
[53] Lewis, E. (2013b). "Immigrant Native Substitutability: The Role of Language." In Card,D. and Raphael, S. (eds.) Immigration, Poverty, and Socioeconomic Inequality. New York:Russell Sage Foundation.
[54] Lewis, E. and Peri, G. (2015). "Immigration and the Economy of Cities and Regions."In Duranton, G., Henderson, V. and Strange, W. (eds.) Handbook of Urban and RegionalEconomics, Vol. 5.
[55] Lofstrom, M. (2002). "Labor Market Assimilation and the Self-Employment Decision ofImmigrant Entrepreneurs." Journal of Population Economics, 15:1, 83-114.
[56] Lofstrom, M., Bates, T. and Parker, S. (2014). "Why Are Some People More Likely to Be-come Small-Businesses Owners than Others: Entrepreneurship Entry and Industry-SpecificBarriers." Journal of Business Venturing, 29:2, 232-251.
[57] Mazzolari, F. and Neumark, D. (2012). "Immigration and Product Diversity." Journal ofPopulation Economics, 25:3, 1107-1137.
[58] McKinney, K. and Vilhuber, L. (2008). Longitudinal Employer-Household Dynamics. LEHDInfrastructure Files in the Census RDC-Overview: Revision 219.
[59] McKinney, K. and Vilhuber, L. (2011). LEHD Infrastructure Files in the Census RDC:Overview of S2004 Snapshot. CES 11-13.
[60] Monti, D.J., Smith-Doerr, L. and MacQuaid, J. (2007). "Immigrant Entrepreneurs in theMassachusetts Biotechnology Industry." Immigrant Learning Center, Boston, MA.
[61] Moser, P., Voena, A., and Waldinger, F. (2014) "German Jewish Emigres and U.S. Inven-tion." American Economic Review, 104:10, 3222-3255.
[62] Nathan, M. (2015). "Same Difference? Minority Ethnic Inventors, Diversity and Innovationin the UK." Journal of Economic Geography, 15:1, 129-168.
[63] Ottaviano, G. and Peri, G. (2006). "The Economic Value of Cultural Diversity: Evidencefrom US Cities." Journal of Economic Geography, 6:1, 9-44.
[64] Patel, K. and Vella, F. (2013). "Immigrant Networks and their Implications for OccupationalChoice and Wages." Review of Economics and Statistics, 95:4, 1249-1277.
[65] Peri, G. (2007). "Higher Education, Innovation and Growth." In Brunello, G., Garibaldi, P.and Wasmer, E. (eds.) Education and Training in Europe, Oxford University Press, 56-70.
[66] Peri, G., Shih, K. and Sparber, C. (2015). "STEM Workers, H-1B Visas and Productivityin US Cities." Journal of Labor Economics, 33:S1, S225-S255.
[67] Puri, M. and Zarutskie, R. (2012). "On the Lifecycle Dynamics of Venture-Capital- andNon-Venture-Capital-Financed Firms." Journal of Finance, 67:6, 2247-2293.
[68] Samila, S. and Sorenson, O. (2011). "Venture Capital, Entrepreneurship and EconomicGrowth." Review of Economics and Statistics, 93, 338-349.
30

[69] Saxenian, A. (1999). "Silicon Valley’s New Immigrant Entrepreneurs." San Francisco: Pub-lic Policy Institute of California.
[70] Saxenian, A. (2002). "Silicon Valley’s New Immigrant High-Growth Entrepreneurs." Eco-nomic Development Quarterly, 16, 20-31.
[71] Schuetze, H.J. and Antecol, H. (2007). "Immigration, Entrepreneurship and the VentureStart-Up Process. The Life Cycle of Entrepreneurial Ventures." In Parker, S. (ed.) Interna-tional Handbook Series on Entrepreneurship, Vol. 3, Springer, New York.
[72] Stephan, P. and Levin, S. (2001). "Exceptional Contributions to US Science by the Foreign-Born and Foreign-Educated." Population Research and Policy Review, 20:1, 59-79.
[73] Unger, J.M., Rauch, A., Frese, M. and Rosenbusch, N. (2011). "Human Capital and En-trepreneurial Success: A Meta-Analytical Review." Journal of Business Venturing, 26:3,341-358.
[74] Van Der Sluis, J., Van Praag, M. and Vijverberg, W. (2008). "Education and Entrepre-neurship Selection and Performance: A Review of the Empirical Literature." Journal ofEconomic Surveys, 22:5, 795-841.
[75] Wadhwa, V., Saxenian, A., Rissing, B. and Gereffi , G. (2007). "America’s New ImmigrantEntrepreneurs." Durham, NC: Duke University.
[76] Zucker, L., Darby, M., and Brewer, M. (1998). "Intellectual Human Capital and the Birthof U.S. Biotechnology Enterprises." American Economic Review, 88:1, 290-306.
31

A Data Appendix: LEHD, Immigration, and Firms
This appendix explains in more detail how the LEHD data are structured and what types of issuesare likely to arise when attempting to follow persons and firms over time within the LEHD. It ismeant to provide guidance and useful suggestions for researchers interested in utilizing these datato study immigration and entrepreneurship at the firm level. Our analysis files for the currentstudy and some previous studies (Kerr and Kerr, 2013; Kerr et al., 2015b) are available forresearchers within the Census RDC network. We can also provide any SAS and Stata programsthat have been redacted for any company identification to researchers who do not have accessto the Census RDC network, although these files are likely to be of limited use without accessto the raw data.
A.1 LEHD File Structure and Key Identifiers
The LEHD is available for researchers at the Census Research Data Centers. Access to theLEHD requires an approved project and security clearance. This section gives an outline ofthe LEHD and is geared towards building a firm sample using the LEHD and auxiliary CensusBureau data sets. The LEHD structure is described in greater technical detail in three CensusBureau documents: McKinney and Vilhuber (2008, 2011) and Abowd et al. (2008). We providehere a short description of the relevant data files and variables for the construction of a firmpanel, omitting details of other LEHD structure files and variables for brevity. Prospective usersof the LEHD are highly encouraged to review the full technical documentation, as well as anyprevious studies utilizing the LEHD, since the database has complications and issues for whichresearchers are building codified and tacit knowledge.The LEHD data are currently available for research purposes for a total of 31 states. All states
have signed the Memorandum of Understanding (MOU) to include their data in the LEHD, andonce entered into the LEHD they will also retroactively include the data series as far back intime as their state’s information and records permit. It is not yet clear when the remainingstates will be included in the database. Discussion below includes more details on the partialstate coverage and practical concerns that it raises.The LEHD covers all private companies operating in the United States, and it allows re-
searchers to analyze these companies and their workers at a very detailed level over a longperiod of time. Firms and their business units are identified in the LEHD by three main vari-ables: SEIN, EIN, and ALPHA. The SEIN is a state tax identifier, the EIN is a federal taxidentifier, and ALPHA is the Census Bureau’s identifier of overall firms. In addition, as firmscan have multiple establishments within a state, the LEHD also provides the SEINUNIT num-ber that corresponds to the SEIN reporting unit (i.e., establishment). These variables uniquelyidentify a firm and its establishments within a calendar quarter and state. The person identifier(PIK) uniquely identifies a worker across all jobs that the individual holds, is derived from Social
32

Security Numbers, and is anonymized to protect the person’s identity.The LEHD consists of several separate files describing the firm, worker, and job that the
person holds within the firm. These files are organized separately by state, and they have auniform structure across all states. First, data contained in the employer characteristics file(ECF) and the employment history file (EHF) are essentially provided at the establishmentlevel (i.e., by SEIN and SEINUNIT). As SEINs are only uniquely associated to a specific firmduring a given calendar quarter within a given state, creating a firm-level panel requires firstassigning each SEIN to a single ALPHA that can then be linked to a single firm entity. Thisprocess is discussed in detail below. The person-level information contained in the individualcharacteristics file (ICF) can then be easily linked to the EHF using the PIK.The Business Register Bridge (BRB) files are the key for creating firms that combine all
multi-unit entities into a single company across all states. The BRB consists of two separatefiles: the BR list and the ECF list.13 The former contains the full list of EINs belonging to eachALPHA and is organized by year, EIN, state, county, four-digit SIC, and Census File Number(CFN). The ECF list reports all SEINs belonging to each EIN, and each record is identified bySEIN, SEINUNIT, year, and calendar quarter. The dual nature and differing record structuresof the BRB files make them somewhat cumbersome to use, and creating a full mapping of SEINsfor each company name in our sample requires several data cleaning steps and additional researchfor unclear cases. These steps are documented in more detail later in this appendix.The individual-level information contained in the ICF includes person characteristics such
as the date of birth, gender, race, place of birth, and citizenship status. Similarly, the firm-levelinformation in the ECF describes location, industry, payroll, and other firm characteristics atthe SEIN and SEINUNIT levels. In turn, each job that a person holds in any of the companiescovered by the LEHD is recorded in the EHF. The EHF tells for each calendar quarter how muchthe person earned while employed in each company that they worked for. The EHF (mergedwith the ICF) is crucial for calculating statistics on the company workforce over time.The key ICF variables for identifying immigrants are the place of birth (POBST)14, the
indicator for foreign place of birth (POBFIN), and the indicator for ever being an alien (ALIEN).These variables allow us to construct a "country of birth" variable.15 On the other hand, the
13The BRB files are further separated into two vintage files. The older vintage files cover years until 2001, andthe newer vintage files cover years 1997-2004. While data for the overlapping years should be mostly identical,there are instances where the linkage information differs between the two files. We prioritize the later vintageinformation where conflict exists.14The LEHD country codes are based on the offi cial country codes used, for example, by the Department of
Defense. They require some additional processing due to the fact that countries have changed over time and theLEHD records the country as written down by the person in their application for a Social Security Number. Forexample, Germany can show up as GM, BZ, GC or GE depending on the time of application. In unclear caseswe used the city of birth variable (POBCITY) to resolve conflicts.15Kerr et al. (2015b) further aggregates these into 10 country groups: [1] China, Hong Kong, and Macao, [2]
India, Pakistan, and Bangladesh, [3] other Asian countries, [4] English-speaking countries, [5] Russia and formermember states of the Soviet Union, [6] other European countries, [7] Middle East, [8] Africa, [9] Central andSouth America, and [10] other countries. A detailed breakdown of the country codes is available from the authorsby request.
33

LEHD is missing some information that would be relevant for a study of high-skilled immigration,or indeed for many other economic topics. First, it does not contain information on the jobcharacteristics such as occupation, position held, hours worked, or hourly wage. The employmentdata do not identify reporting relationships or similar attributes of the corporate hierarchy.Second, the ICF does not report the person’s actual education (an imputed version is provided)or their immigrant status (e.g., green card, H-1B visa), or changes in these characteristics. Wewould ideally like to know the person’s initial year of entry into the United States, as well asany changes that have occurred in their immigrant status over time.
A.2 Other Census Data Required for Firm Identification
The LEHD can be used (and is perhaps most naturally used) at the SEIN level, which for mostcompanies roughly corresponds to an establishment, and for single-unit firms contains the entirefirm. In theory, researchers can construct larger "Census firms" by using the BRB to identifyall SEINs that belong to a single ALPHA, and then consider the ALPHA to be the uniquecompany identifier. This approach often works fine if one is primarily interested in looking atthe cross-section of firms at a specific point in time, but the approach does not work well whenone needs to track large, multi-unit companies over time. It is true that most large firms haveone core ALPHA under which most of their employment falls within any given year, and thisidentifier is mostly fixed over time. However, a more careful look at the larger, multi-unit firmsstudied in Kerr et al. (2015b) finds corporate events such as mergers, acquisitions, spin-offs, etc.substantially weaken the exclusive use of ALPHAs for longitudinal analyses. In other words,an ALPHA with a large number of employees may temporarily disappear, switch to a differentALPHA, or lose (or gain) a very large number of employees from one year to the next as a resultof corporate restructuring.This is undesirable if one is interested in describing changes in a firm’s workforce related to
a specific phenomenon, such as high-skilled immigration. Some of our prior work (Kerr et al.,2015b; Kerr and Kerr, 2013) thus pursues the creation of composite firm entities.16 Such stepsrequire identifying all of the ALPHAs from the company’s workforce during the period of study.With that objective, we find the best approach to be to [1] identify the relevant firms by theirnames as recorded in the LBD/SSEL and [2] use the LBD/SSEL to identify all ALPHAs that areever associated with the company name. In other words, the company name becomes the uniquefirm identifier, and this approach works best when building records for large companies presentacross the full time period. The most reliable process of identifying ALPHAs for target companiesinvolves a careful review of company histories to identify significant mergers, acquisitions, and
16There can also be conceptual concerns. For example, if the research goal is to study whether immigrantsare displacing natives in firms, corporate restructurings need to be very carefully considered. Strictly speaking,an acquisition includes the simultaneous hiring of many immigrant and native workers from the acquired firm,which would have substantial effects on the estimated relationship, but this is not conceptually what studies areafter. Kerr et al. (2015b) pursues the creation of composite firms to remove these biases.
34

spin-offs that take place during the period of interest. The review of company histories is likelyto result in a long list of such events. In addition, one should conduct additional research aroundcases where there is, based on the LBD, a very large shift in the firm employment from one yearto the next. These cases often turn out to be mass layoffs, firms going out of business, or othernormal events in the firm life-cycle. In some cases, however, one finds overlooked corporateevents that should again be accounted for in the compiling of composite firms.Researchers should further search the LBD by company name and name variations, including
the companies that have merged into the original sample companies. For each company and itsacquisitions, one needs to collect all ALPHAs that are contained in the LBD under any of thename variations. For example, if company AAA has acquired companies BBB and CCC, wewould find three (or more) separate ALPHAs in the LBD and group these with a compositecompany identifier that is used in subsequent work. This process produces a unique companyname, along with the full list of ALPHAs that should be combined together in the LEHD foreach company. Kerr et al. (2015b) further describes the application of this manual process forthe study’s group of 319 large firms and major patenting firms. These firm lists and associatedidentifiers are available to researchers with appropriate approvals and data access.
A.3 Identification of Firms in the LEHD
Once the full list of company names and the various ALPHAs belonging to each of the companiesare obtained from the LBD, the next step is to use the BRB to identify all EINs ever belongingto those ALPHAs. While the BRB uniquely associates EINs to an ALPHA within a calendarquarter and state, EINs are not necessarily stable over time, potentially creating abrupt changesin the firm employment series that will cause measurement error. The same is true for theSEINs that need to be linked to the ALPHAs via the EIN using the ECF-list. Indeed McKinneyand Vilhuber (2008) note that the EIN and SEIN exist for tax administrative purposes, andwarn that no straight-forward method exists for linking multiple SEINs into a single firm. Ourpreferred approach is described in greater detail below.As LEHD identifiers do not uniquely capture a complete firm entity, we suggest using the
cleaned version of company name from the LBD as a unique firm identifier. As explained above,each of these firms may contain one or more ALPHAs, and almost certainly contain more thanone EIN and SEIN. Using the BR-list, one can create a list of ALPHAs that are ever associatedwith each EIN. Similarly, using the ECF-list, one can create for each SEIN the full list of EINsthat the SEIN was ever associated with. Combining these two lists provides the full list ofSEINs that ever appeared with an ALPHA. Using the groupings of ALPHAs derived from theLBD, one assembles the full list of SEINs that ever belonged to a composite company. Atthis point, there are a number of SEINs that appear to belong to multiple companies, and thismultiplicity requires careful attention. Also, as some of the company restructuring takes place atthe establishment level (e.g., the sale of a plant or division), there are also cases where a specific
35

EIN or SEIN belongs to multiple companies during the sample period. These cases require someadditional research and data cleaning that is also described below.
A.4 Cleaning up EIN and SEIN Associations
The data thus far contain unique SEINs for which the LEHD data needs to be collected. Beforeproceeding, one needs to check whether each SEIN in the company sample is a unique matchor requires special attention. In the latter cases, researchers are best served prioritizing casesfor review through the employment levels of SEINs. Reviewing the employment series is alsohelpful when verifying whether the SEIN overlap is caused by a corporate event that had notbeen recognized in the initial firm sample construction. The cleaning process at this stage isfairly manual, and may involve searches for company events. Our preferred method in residual,unclear cases is to assign the SEIN based on the number of years that it is associated withcompanies.
A.5 Partial LEHD State Coverage
Appendix Table 1 provides a breakdown of the states included in the LEHD by the year inwhich their data series begins. As the aim of Kerr et al. (2015b) and similar work is to studythe evolution of companies and their employment structures, it is problematic if large shifts incompany workforce result simply from the fact that new business units are added into the datawhen a large state enters the LEHD. We often utilize balanced panels of states that begin atone of three points: 1992 (once Florida joins), 1995 (once Texas joins), or 2000 (once the bulk ofstates enter). Second, one should consider dropping firms for which the included states do notmeet a certain threshold in terms of included employment. For example, one may want to excludefinance firms that have much of their employment in New York, even if they have establishmentspresent in covered states, as one cannot reliably represent the firm and its employment patternsusing the LEHD states. These coverage ratios can be determined using the LBD.
A.6 Merging External Firm-Level Data into the LEHD
There are many firm-level data sources that are of interest for the analysis of firms and immi-gration. For example, researchers may want to incorporate Labor Condition Application (LCA)data from the Department of Labor (DOL), which is a first step in the application for an H-1Bvisa from the United States Citizenship and Immigration Services (USCIS). While the USCISdoes not release systematic data on the number of H-1B applications and granted visas by firm,microdata on LCAs are available by firm from the DOL.17 These data contain all LCAs startingfrom 2001 and include the employer name, address, the number of jobs they wish to fill, and thespecific job characteristics (title, occupation, proposed wage, etc.).
17The data can be retrieved from: http://www.flcdatacenter.com/CaseH1B.aspx
36

The firm names in the LCA database are entered as they appear on the original application.Since the applications are sent separately by different company locations, there may be variationsof the company name that need to be dealt with before aggregating the LCAs under the overallcompany name. For example, 7-Eleven may submit LCAs under slight name variations such as"7-Eleven", "7 Eleven", "7-Eleven Inc", and "7-Eleven Incorporated". Also, the issues relatedto corporate restructurings resurface here as well. Once the names in the LCA data are cleanedand aggregated, we create a crosswalk for the company names to merge the LCA data into theLEHD data. The aggregated LCAs can then be easily merged into the LEHD by the clean firmname.A second example is the merger of patent data into the LEHD-LBD to study innovation out-
comes. Again, as firm naming conventions vary between the LBD and the USPTO data, anothername cleaning step is required. Researchers also must aggregate multiple USPTO assignees intoparent firms. Finally, for many purposes it would be useful to know more about the actual firmsthan is reported in the LEHD. One example of an external firm-level data set is the Compustatcompany database. Compustat provides standardized company financials for publicly tradedcompanies. These data are merged via bridge files or crosswalks similar to those described. Allbridge files are available to approved Census projects but should be explicitly requested in initialresearch proposals to the Census Bureau.
A.7 Merging Internal Person-Level Data into the LEHD
While merging the company-specific data into our LEHD platform is relatively easy using thecompany name, person-specific data matches require the use of the PIK created by the CensusBureau. Three internal data sources can be directly linked to the LEHD: [1] long-form responsesfrom the 1990 and 2000 Decennial Censuses, as well as the related American Housing Surveys, [2]the Current Population Survey (CPS), and [3] the Survey of Income and Program Participation(SIPP). For the purposes of our study, the Census and the CPS contain some very relevantinformation that is not present in the LEHD, including occupation and actual education. As theLEHD contains the CPS person and household identification numbers, as well as the years duringwhich the PIK matches the CPS identifier, it is relatively straight forward to combine CPS datainto the LEHD. The CPS does not provide a time series of observations for each respondent, andthe occupation is a point-in-time snapshot for each person that does not necessarily correspondto the actual job that the person is doing in the LEHD. Similarly, the Census data is easy to linkinto the LEHD using the PIKs. Household characteristics can be linked to each of the matchedpersons using the household identifiers that are internal to the Census Bureau data.Most person-level record in the LEHD have a one-to-one match to the CPS and Census.
We exclude the few cases where we find multiple CPS or Census observations (e.g., in differentstates). As such persons make up less than 0.01% of the sample, including them either multipletimes or randomly allocating the information from one of the CPS or Census observations makes
37

no difference in terms of the results of the statistical analysis.
A.8 Possible LEHD Interfaces
We close this appendix by describing potential future interfaces between the LEHD and otherdata products. The weakest dimension of the LEHD for entrepreneurship research relates tothe identification of business founders/owners, and our approach in this study is not perfect.Indeed, we envision that future work can greatly expand and improve on the current approach bylinking in founder/owner data from additional sources. These include, for example, the businessownership data from the Internal Revenue Service (IRS) Form K-1, the Doing-Business-As filingsfrom State Secretaries, data on the Legal Form of the Organization (LFO) that could identifysole proprietorships, and perhaps also the forthcoming longitudinal Survey of Business Owners(SBO-X) as well as the existing 2007 and 2012 cross-sectional SBOs.More specifically, the IRS collects data on business ownership by U.S. individuals via the K-1
form (http://www.irs.gov/pub/irs-pdf/f1120ssk.pdf). Provided that the Census Bureau couldassign each of the K-1 owners a PIK to merge into the LEHD, these tax records would provide oneavenue for linking the owner information from the K-1 data to the LEHD. The second potentialdata effort is related to the State Secretaries’corporate information that comes from the Doing-Business-As (DBA) registration process (http://www.secstates.com/). Each state collects thesedata, and they are held by the Secretaries of State. The registration data generally contain thename and address of the business and the name and other details of the owner, and could inprinciple be brought into the Census Bureau for the purpose of assigning of company and personidentifiers.The SBO data also contain details of business owners, including their age, gender, race and
whether they are born in the United States. This level of detail would be suffi cient for linkingthe SBO ownership percentages into the LEHD, for better identification of whether the owner isamong the persons who are on the company payroll. This of course would not cover the entireLEHD, given the survey design of the SBO, but it would help validate/refine definitions andenable analysis of interesting data on the company’s start-up and expansion capital.As unincorporated businesses are not included in the LEHD, we envision utilizing the ILBD
database to also cross-verify the status of the owner. The ILBD can be then used to pro-vide descriptive details of the unincorporated businesses, while the Census and ACS provide adescription of the characteristics of the entrepreneurs/owners.For employer sole proprietors, our approach of identifying firm founders is likely not satis-
factory as the business owner will not be on the payroll. Indeed, some fraction of new employerbusinesses start as sole proprietorships and may later change their legal form of organization.Recent research using the Kauffman Firm Surveys found that about one in three firms begin asa proprietorship, while almost as many begin as limited-liability companies and as corporations.Of course, not all sole proprietorships are among employer firms. Cole (2011) provides data
38

that suggests that the share of firms that start as employer sole proprietorships is smaller thanone-third; the average sole proprietorship has 0.6 employees. That provides some guidance asto the error that may be introduced by ignoring the LFO in the LEHD context. We hope thatfuture research continues to bring together these data elements to provide ever sharper metricsfor entrepreneurship and the role of immigrants.
39

Notes: The figure indicates with shading the states that are covered by the 2008 version of the LEHD used in this study. Alaska is not covered. Stars indicate the 11 states whose coverage begins by 1992. The wider sample used in this study includes all shadedstates excepting Arkansas. Coverage for all states ends in 2008.
Figure 1: LEHD state coverageStars indicate 11 states whose coverage begins by 1992

Notes: See Table 2a. Sample includes 11 states present in the LEHD by 1992: CA, CO, FL, ID, IL, LA, MD, NC, OR, WA, and WI. New firms are defined through the LBD and retain their entering status for the first three years of the firm's life. Entrepreneurs are defined as top three initial earners in business.
Figure 2: LEHD immigrant entrepreneurship trendsEntrepreneurs are defined as top three initial earners in business

Notes: Samples from both data sources include 11 states present in the LEHD by 1992: CA, CO, FL, ID, IL, LA, MD, NC, OR, WA, and WI. Included individuals are aged 25 to 50, employed in the private sector, and meet certain educational and work history restrictions. An immigrant is defined as a person born outside of the United States.
Figure 3a: LEHD-CPS comparison for immigrant worker sharesWorkers in the private sector in 11 focal LEHD states

Notes: See Figure 3a. LEHD entrepreneurs are defined as top three initial earners in business and retain this status for the first three years after the firm’s start. CPS entrepreneurs are defined as those entering incorporated self-employment.
Figure 3b: LEHD-CPS for immigrant entrepreneurial sharesEntrepreneurship and self-employment in the private sector in 11 focal LEHD states

Notes: CPS measures include the overall incorporated self-employment rate for immigrants in the sample, which retains self-employed owners who have held their business for many years, and the Kauffman Foundation's Index that is derived from the CPS through new entry into self-employment. LEHD measures are provided with one- and three-year windows for comparison.
Figure 3c: LEHD-CPS for immigrant entrepreneurial ratesComparison of immigrant entrepreneurial measures to immigrant population

Study Data sources Sample design PeriodImmigrant
entrepreneur shareFounding rate
among immigrantsFounding rate among natives
(1) (2) (3) (4) (5) (6) (7)
Saxenian (1999) Dun & Bradstreet, surveys Silicon Valley tech firms 1980-1998 24% n/a n/aAnderson & Platzer
(2006)Thomson Financial, survey,
internet340 publicly-traded, venture-
capital backed firms, independent in 1990-2005
1990-2005 25% n/a n/a
Wadhwa et al. (2007)
Dun & Bradstreet, surveys US tech firms with >$1m sales and >20 employees
1995-2005 25% n/a n/a
Reynolds & Curtin (2007)
Panel Study of Entrepreneurial Dynamics
New founders who plan to grow firm to 50+ employees
1999 15% n/a n/a
Monti et al. (2007) MA Biotech Council member list
New England biotech firms 2006 26% n/a n/a
Fairlie (2008) Census IPUMS 2000, Current Population Survey 1996-2007
Working-age business owners, work >15 hours per week
2000, 1996-2007
17% 0.4% 0.3%
Hart & Acs (2010) Survey "High-impact" high-tech companies
2002-2006 16% n/a n/a
Robb et al. (2010) Kauffman Firm Survey High- and medium-tech firms founded in 2004
2004 10.3% n/a n/a
Firms founded in 2004 that survived until to 2008
2008 9.4% n/a n/a
Hunt (2011) NSCG 2003 College degree holders, working in 2003
1998-2003 n/a 0.8% 0.6%
Fairlie (2012) Survey of Business Owners 2007, Current Population
Survey 1996-2010
Owners of businesses in 2007, Workforce in 2010
2007, 2010 13% 0.6% 0.3%
Table 1: Previous studies on immigrant entrepreneurship
Notes: The immigrant share of entrepreneurs in Saxenian (1999) covers only Chinese and Indian ethnic groups, based on the CEO surnames. The founding rate in Hunt (2011) covers firms founded between 1988 and 2003 that have at least 10 employees in 2003. The founding rates in Fairlie (2008, 2012) are monthly. Fairlie (2008) defines the immigrant entrepreneur share as the percentage of new companies that had at least one immigrant founder (of all business owners 12.5% are immigrants). Hart and Acs (2010) use Corporate Research Board’s American Corporate Statistical Library (ACSL) listings to identify the set of "high-impact" companies and obtain survey responses from 29% of them.

Year
Immigrant rate of
employment in new firms
Immigrant entrepreneur rate, defined as top three
initial earners in business
Immigrant share of
employment in new firms
Immigrant entrepreneur
share, defined as top three
initial earners in business
Column 5 restricted to top
quartile of entrepreneurial income in start
year
Share of entering
LEHD SEINs with one or
more immigrant
Share of entering LBD
firms with one or more immigrant
Immigrant share of
workers in entering LBD
firms
Column 9 weighted by employment
(1) (2) (3) (4) (5) (6) (7) (8) (9) (10)
1995 6.3 1.6 20.6 16.7 15.6 29.8 31.1 19.3 18.81996 6.4 2.0 21.0 19.3 15.5 30.9 33.1 20.3 19.41997 6.2 2.1 21.5 21.0 16.3 31.7 33.0 20.5 19.81998 6.1 2.1 21.9 22.1 16.9 32.4 33.8 20.8 20.01999 6.2 2.1 22.0 22.6 16.9 33.5 34.3 21.3 20.22000 6.1 2.1 22.7 23.2 18.5 34.2 35.9 22.1 20.92001 6.0 2.1 23.5 24.3 18.8 35.6 36.6 23.6 22.62002 5.9 2.2 24.7 25.6 20.0 36.7 38.5 25.1 23.42003 6.1 2.3 25.2 26.6 19.4 36.0 38.6 25.7 24.02004 6.3 2.4 25.7 27.0 20.3 35.8 36.8 24.9 24.12005 6.3 2.5 25.7 27.1 20.7 35.9 37.4 25.3 24.02006 6.0 2.4 25.6 27.2 19.8 35.9 37.8 26.3 24.42007 5.5 2.3 25.4 26.9 19.7 34.2 36.0 25.2 24.42008 4.9 2.0 25.6 27.1 20.1 35.6 37.0 26.2 24.8
Mean 6.0 2.2 23.7 24.1 18.5 34.2 35.7 23.3 22.2Ratio 08/95 0.78 1.24 1.24 1.62 1.29 1.19 1.19 1.36 1.32Ratio 05/97 1.02 1.22 1.20 1.29 1.27 1.13 1.13 1.23 1.21
Table 2a: Trends in immigrant entrepreneurship and participation in new firms
Notes: Table provides broad trends related to employment in new firms by natives and immigrants in the LEHD and LBD. The sample includes 11 states present in the LEHD by 1992: CA, CO, FL, ID, IL, LA, MD, NC, OR, WA, and WI. Columns 2 and 3 consider immigrant participation rates in new firms relative to the total immigrant workforce in the LEHD. Columns 4-10 consider immigrant shares of activities relative to natives. New firms are defined through the LBD as described in the text and retain their entering status for the first three years of the firm's life. Caution should be exercised with Column 2 and 3's trends from 2006 onwards due to declines in match rates for the Business Registry Bridge between the LEHD and LBD late in the sample. Caution should also be used for Column 3's entry rates in 1995 and 1996 due to ongoing initialization that required minor extrapolation. Share-based calculations in Columns 4-10 are substantially less sensitive to these issues. The appendix provides complementary statistics: [1] considering shorter series for 28 states present in the LEHD by 2000, [2] adjusting the definition of new firms to apply to the first year of business entry only, and [3] separating one-digit SIC industries.

Year
Immigrant rate of
employment in new firms
Immigrant entrepreneur rate, defined as top three
initial earners in business
Immigrant share of
employment in new firms
Immigrant entrepreneur
share, defined as top three
initial earners in business
Column 5 restricted to top
quartile of entrepreneurial income in start
year
Share of entering
LEHD SEINs with one or
more immigrant
Share of entering LBD
firms with one or more immigrant
Immigrant share of
workers in entering LBD
firms
Column 9 weighted by employment
(1) (2) (3) (4) (5) (6) (7) (8) (9) (10)
1995 1.1 0.06 28.3 24.7 20.1 50.8 61.6 23.6 18.61996 1.4 0.08 28.4 24.7 25.1 49.6 73.3 25.5 22.71997 1.8 0.09 24.3 25.6 25.1 53.7 64.4 23.6 20.81998 1.6 0.12 24.3 27.0 24.0 55.5 74.1 28.9 24.41999 2.0 0.14 24.2 27.1 27.4 57.5 76.1 28.4 26.12000 2.2 0.17 23.5 27.8 26.4 62.0 87.9 31.7 27.42001 2.1 0.16 26.0 30.5 38.5 57.2 76.1 33.6 31.02002 1.7 0.13 26.1 32.9 31.5 59.1 83.0 37.7 35.72003 1.4 0.11 27.2 31.2 33.1 54.8 77.7 35.4 36.02004 1.3 0.10 24.6 30.4 31.3 59.9 79.3 35.7 33.92005 1.9 0.10 28.5 30.0 29.1 57.9 79.4 34.9 33.3
Mean 1.7 0.11 25.9 28.4 28.3 56.2 75.7 30.8 28.2Ratio 05/95 1.73 1.71 1.01 1.21 1.45 1.14 1.29 1.48 1.79Ratio 05/97 1.06 1.08 1.17 1.17 1.16 1.08 1.23 1.48 1.60
Notes: See Table 2a. Companies backed by venture capital investors are identified through firm names and locations as described in the text. Venture capital matching is available through 2005. Inclusion in the venture capital group occurs if venture capital financing is ever received, rather than being specific to the first years of the firm.
Table 2b: Table 2a for firms backed by venture capital

Year
Immigrant entrepreneur
share, defined as top three
initial earners in business
Column 2 with employment
weights
Share of entering firms
with one or more
immigrant entrepreneur
Immigrant entrepreneur
share, defined as top three
initial earners in business
Column 2 with employment
weights
Share of entering firms
with one or more
immigrant entrepreneur
(1) (2) (3) (4) (5) (6) (7)
1995 19.2 18.1 23.7 22.3 15.2 35.61996 20.2 18.4 25.1 21.9 17.4 42.61997 20.5 19.3 25.5 25.2 23.3 39.41998 20.7 19.2 25.9 28.1 17.0 44.01999 21.2 19.4 26.7 28.0 25.1 48.52000 22.2 20.6 28.1 28.7 21.6 49.42001 23.6 21.9 29.4 30.1 24.5 53.82002 25.0 22.3 30.8 34.4 26.8 58.02003 25.6 23.3 31.3 30.9 25.1 52.12004 24.9 23.5 30.3 32.0 22.7 57.52005 25.2 23.2 30.6 31.2 27.0 49.5
Mean 22.6 20.8 27.9 28.4 22.3 48.2Ratio 05/95 1.31 1.28 1.29 1.40 1.78 1.39Ratio 05/97 1.23 1.20 1.20 1.24 1.16 1.26
Table 3: Trends for samples used in analytical work
Notes: Table provides descriptive statistics for the sample of firms used for analytical work. The sample includes firms founded 1992-2005 in a PMSA within a state present in the LEHD since 1992. Relative to Tables 2a and 2b, several data preparation steps are undertaken to exclude entrants that are multi-unit LBD entering firms and entrants lacking complete information for considered LBD and LEHD metrics (e.g., reported payroll). Metrics focus on the immigrant-native composition of the top three initial earners. The sample ends with 2005 entrants to allow observation of LBD outcomes to 2011 and to circumvent issues with the LEHD-LBD match in later years. Employment weights are capped at 50 initial employees.
Firms backed by venture capital Full sample

Row headers groupby initial employment: Closed 1-4 empl. 5-9 empl. 10-19 empl. 20-99 empl. 100+ empl. Total
(1) (2) (3) (4) (5) (6) (7) (8)
1-4 employees 0.392 0.448 0.110 0.034 0.014 0.0015-9 employees 0.356 0.167 0.281 0.144 0.049 0.00310+ employees 0.385 0.040 0.087 0.209 0.246 0.033
1-4 employees 0.226 0.220 0.205 0.200 0.205 0.212 0.2205-9 employees 0.208 0.206 0.180 0.182 0.213 0.187 0.19610+ employees 0.200 0.207 0.202 0.179 0.181 0.166 0.190
Total 0.220 0.219 0.196 0.187 0.191 0.173 0.212
1-4 employees 0.230 0.224 0.209 0.205 0.213 0.240 0.2245-9 employees 0.213 0.209 0.183 0.187 0.221 0.218 0.20010+ employees 0.215 0.217 0.203 0.182 0.197 0.232 0.203
Total 0.226 0.222 0.199 0.191 0.204 0.232 0.217
Notes: Table describes transition/growth properties over 3-year horizon for entering cohorts 1992-2005, with outcomes measured after three years for each entrant (e.g., 2004 for a 2001 entrant). Panel A tabulates the share of entrants for each starting size category that grow to the level indicated by column headers, with rows summing to 100%. Panel B provides for each cell the average initial immigrant entrepreneurship share for grouped firms. Entrepreneur definitions use top three initial earners, independent of whether these individuals remain with the firm or as a top earner in the firm. Panel C provides for each cell the average initial immigrant employment share for grouped firms.
Panel B: Starting immigrant entrepreneurship share in new firms by outcome distribution
Table 4a: Growth tabulations and immigrant entrepreneurship share, 3-year horizonEmployment after three years:
Panel A: Distribution of outcomes by initial firm size, full sample (rows sum to 100%)
Panel C: Starting immigrant employment share in new firms by outcome distribution

Row headers groupby initial employment: Closed 1-4 empl. 5-9 empl. 10-19 empl. 20-99 empl. 100+ empl. Total
(1) (2) (3) (4) (5) (6) (7) (8)
1-4 employees 0.571 0.299 0.082 0.032 0.015 0.0015-9 employees 0.536 0.130 0.180 0.105 0.046 0.00310+ employees 0.566 0.037 0.065 0.136 0.171 0.024
1-4 employees 0.226 0.215 0.203 0.198 0.201 0.221 0.2205-9 employees 0.208 0.192 0.178 0.174 0.203 0.178 0.19610+ employees 0.198 0.199 0.206 0.175 0.173 0.155 0.190
Total 0.220 0.213 0.196 0.183 0.186 0.170 0.212
1-4 employees 0.230 0.219 0.206 0.203 0.209 0.241 0.2245-9 employees 0.212 0.195 0.179 0.180 0.209 0.220 0.20010+ employees 0.214 0.205 0.204 0.177 0.189 0.215 0.203
Total 0.225 0.216 0.198 0.188 0.198 0.221 0.217
Notes: See Table 4a. Outcome distributions use a 6-year horizon for each entrant (e.g., 2007 for a 2001 entrant).
Table 4b: Table 4a with a 6-year horizonEmployment after six years:
Panel A: Distribution of outcomes by initial firm size, full sample (rows sum to 100%)
Panel B: Starting immigrant entrepreneurship share in new firms by outcome distribution
Panel C: Starting immigrant employment share in new firms by outcome distribution

Fraction alive in third year
Employment growth
relative to firm's average
Payroll growth relative to
firm's average
Establishment count growth
relative to firm's average
(0,1) 3rd-year employment
exceeds initial level
(0,1) 3rd-year employment exceeds 100
workers
(0,1) 3rd-year employment is in top decile of industry
(0,1) received venture capital
support
(1) (2) (3) (4) (5) (6) (7) (8)
Mean 0.6418 0.2726 0.2449 0.0033 0.5133 0.0086 0.0848 0.0027SD 0.4866 0.6823 0.7216 0.0567 0.4998 0.0921 0.2787 0.0515Observations 535,580 329,260 329,260 329,260 329,260 329,260 329,260 535,580
Firm's immigrant -0.00335 0.03130 0.00037 -0.00025 0.01919 0.00159 0.00362 0.00232entrepreneur share (0.00186) (0.00301) (0.00356) (0.00022) (0.00241) (0.00036) (0.00109) (0.00020)
ß / Mean of DV -0.005 0.115 0.002 -0.076 0.037 0.185 0.043 0.872
Firm's immigrant 0.01851 0.00190 -0.02375 -0.00024 0.00656 0.00047 0.00298 0.00045entrepreneur share (0.00247) (0.00483) (0.00569) (0.00036) (0.00384) (0.00064) (0.00184) (0.00031)
ß / Mean of DV 0.029 0.007 -0.097 -0.073 0.013 0.055 0.035 0.169
Table 5a: Regressions of 3-year outcomes using LBD firms
Panel A: Summary statistics
Panel B: Estimation with cohort fixed effects and controls for initial traits
Panel C: Estimation with cohort-PMSA-industry fixed effects and controls for initial traits
Notes: See Tables 3 and 4a. Table quantifies how the outcomes of new firms vary by the share of the top three initial earners who are immigrants. The sample includes firms founded 1992-2005 in a PMSA within a state present in LEHD since 1991. Outcome variables are measured through 2011 using the LBD. Columns 2-4 measure growth by comparing the change during the period to the average of the start and end values for the firm. Regressions are unweighted, report robust standard errors, and control for the initial traits of starting log employees and log payroll of the venture. Observation counts are approximated per Census Bureau requirements.
Traits of surviving firms in the third year

Fraction alive in sixth year
Employment growth
relative to firm's average
Payroll growth relative to
firm's average
Establishment count growth
relative to firm's average
(0,1) 6th-year employment
exceeds initial level
(0,1) 6th-year employment exceeds 100
workers
(0,1) 6th-year employment is in top decile of industry
(1) (2) (3) (4) (5) (6) (7)
Mean 0.4350 0.3097 0.3643 0.0034 0.5362 0.0102 0.0842SD 0.4958 0.7403 0.7984 0.0591 0.4987 0.1003 0.2776Observations 535,580 233,000 233,000 233,000 233,000 233,000 233,000
Firm's immigrant -0.01365 0.04678 0.00876 0.00047 0.02899 0.00233 0.00386entrepreneur share (0.00188) (0.00393) (0.00468) (0.00029) (0.00290) (0.00048) (0.00134)
ß / U.S. mean -0.031 0.151 0.024 0.138 0.054 0.228 0.046
Firm's immigrant 0.01795 0.00760 -0.02769 -0.00032 0.01326 0.00157 0.00029entrepreneur share (0.00243) (0.00665) (0.00794) (0.00038) (0.00489) (0.00087) (0.00245)
ß / U.S. mean 0.041 0.025 -0.076 -0.094 0.025 0.154 0.003
Notes: See Table 5a.
Table 5b: Table 5a with a 6-year horizonTraits of surviving firms in the sixth year
Panel A: Summary statistics
Panel B: Estimation with cohort fixed effects and controls for initial traits
Panel C: Estimation with cohort-PMSA-industry fixed effects and controls for initial traits

Fraction alive in third year
Employment growth
relative to firm's average
Payroll growth relative to
firm's average
Establishment count growth
relative to firm's average
(0,1) 3rd-year employment
exceeds initial level
(0,1) 3rd-year employment exceeds 100
workers
(0,1) 3rd-year employment is in top decile of industry
(0,1) received venture capital
support
(1) (2) (3) (4) (5) (6) (7) (8)
Full sample -0.00335 0.03130 0.00037 -0.00025 0.01919 0.00159 0.00362 0.00232(0.00186) (0.00301) (0.00356) (0.00022) (0.00241) (0.00036) (0.00109) (0.00020)
Low-wage firms 0.01380 0.00410 -0.00157 -0.00045 0.00320 0.00000 -0.00285 0.00006(0.00247) (0.00394) (0.00478) (0.00024) (0.00331) (0.00038) (0.00125) (0.00006)
High-wage firms -0.02681 0.06039 0.00316 -0.00023 0.04215 0.00273 0.00848 0.00484(0.00280) (0.00463) (0.00531) (0.00038) (0.00353) (0.00064) (0.00180) (0.00045)
Low-tech firms -0.00015 0.03169 -0.00220 -0.00018 0.01994 0.00169 0.00271 0.00092(0.00193) (0.00312) (0.00368) (0.00023) (0.00252) (0.00037) (0.00112) (0.00014)
High-tech firms -0.02383 0.02898 0.02307 -0.00126 0.01794 -0.00021 0.01088 0.00988(0.00627) (0.01116) (0.01346) (0.00083) (0.00822) (0.00145) (0.00422) (0.00160)
VC-backed firms 0.03990 -0.11521 -0.11576 -0.00624 -0.01279 -0.07686 -0.09093 n.a.(0.03374) (0.05524) (0.07042) (0.01009) (0.02701) (0.02287) (0.04436)
Table 6a: Split sample regressions for estimations with cohort fixed effectsTraits of surviving firms in the third year
Estimation with cohort fixed effects and controls for initial traits
Notes: See Panel B of Table 5a. Each entry in table is a coefficient from a separate regression with the indicated sample.

Fraction alive in third year
Employment growth
relative to firm's average
Payroll growth relative to
firm's average
Establishment count growth
relative to firm's average
(0,1) 3rd-year employment
exceeds initial level
(0,1) 3rd-year employment exceeds 100
workers
(0,1) 3rd-year employment is in top decile of industry
(0,1) received venture capital
support
(1) (2) (3) (4) (5) (6) (7) (8)
Full sample 0.0185 0.0019 -0.0238 -0.0002 0.0066 0.0005 0.0030 0.0005(0.0025) (0.0048) (0.0057) (0.0004) (0.0038) (0.0006) (0.0018) (0.0003)
Low-wage firms 0.0280 -0.0337 -0.0186 -0.0002 -0.0209 0.0003 -0.0027 0.0000(0.0037) (0.0076) (0.0093) (0.0005) (0.0064) (0.0008) (0.0026) (0.0001)
High-wage firms 0.0000 0.0464 -0.0216 -0.0007 0.0370 -0.0005 0.0089 0.0009(0.0039) (0.0076) (0.0087) (0.0006) (0.0058) (0.0011) (0.0031) (0.0007)
Low-tech firms 0.0222 0.0001 -0.0271 -0.0003 0.0062 0.0008 0.0018 0.0002(0.0027) (0.0051) (0.0060) (0.0004) (0.0041) (0.0007) (0.0019) (0.0002)
High-tech firms -0.0022 0.0258 -0.0084 -0.0001 0.0254 -0.0021 0.0133 0.0023(0.0085) (0.0180) (0.0221) (0.0016) (0.0135) (0.0027) (0.0071) (0.0025)
VC-backed firms 0.0319 -0.2620 -0.3500 0.0101 -0.0709 -0.0311 -0.1061 n.a.(0.0871) (0.1549) (0.1868) (0.0138) (0.0792) (0.0557) (0.1163)
Table 6b: Split sample regressions for estimations with cohort-PMSA-industry fixed effectsTraits of surviving firms in the third year
Estimation with cohort-PMSA-industry fixed effects and controls for initial traits
Notes: See Panel C of Table 5a. Each entry in table is a coefficient from a separate regression with the indicated sample.

Row headers groupby initial employment: Closed 1-4 empl. 5-9 empl. 10-19 empl. 20+ empl. Total
(1) (2) (3) (4) (5) (6) (7)
1-4 employees 0.344 0.366 0.450 0.462 0.333 0.3725-9 employees 0.329 0.455 0.329 0.438 0.410 0.37310+ employees 0.493 0.455 0.343 0.337 0.503 0.464
Total 0.391 0.379 0.394 0.403 0.469 0.400
1-4 employees 0.348 0.379 0.449 0.426 0.419 0.3725-9 employees 0.349 0.368 0.361 0.478 0.424 0.37310+ employees 0.484 0.211 0.375 0.358 0.504 0.464
Total 0.392 0.368 0.410 0.418 0.477 0.400
Table 7: Distributions of child immigrant entrepreneurshipEmployment after three or six years:
Panel A: Share of immigrant entrepreneurs who migrated as children, 3-year distribution
Panel B: Share of immigrant entrepreneurs who migrated as children, 6-year distribution
Notes: See Tables 4a and 4b. Values document the share of immigrant entrepreneurs in each cell that migrated to the United States by age 18. The sample is restricted to immigrant entrepreneurs aged 20-54 in 2000 who are surveyed by the long form of the Decennial Census.

Year States entering LEHD Cumulative state count
(1) (2) (3)
1991 or before CA, CO, ID, IL, LA, MD, NC, OR, WA, WI 101992 FL 111993 MT 121994 121995 HI, NM, RI, TX 161996 ME, NJ 181997 WV 191998 GA, IA, IN, SC, TN, VA 251999 UT 262000 OK, VT 282001 282002 AR 29
Appendix Table 1: Initial year of state inclusion in the LEHD
Notes: LEHD files for states run through 2008 in version used in this study. The start year differs by state and is tabulated in this table. Parts of the records for Georgia and Indiana (EHF, ECF) start earlier than 1998.
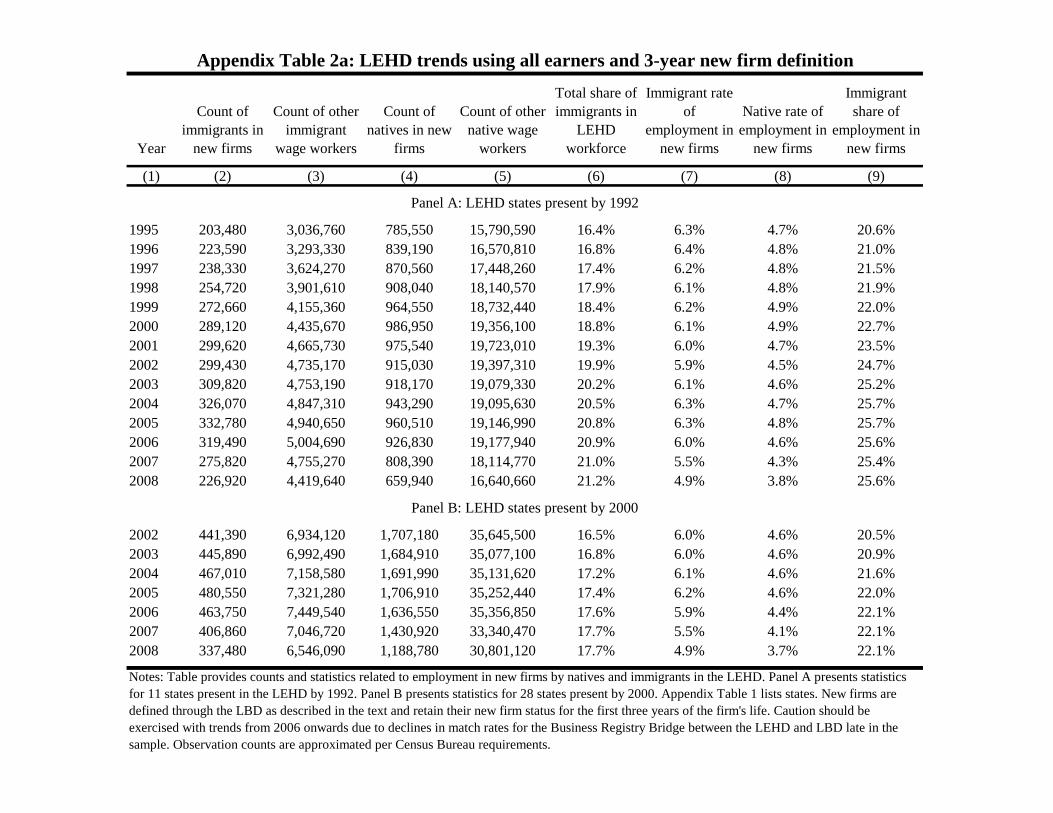
Year
Count of immigrants in
new firms
Count of other immigrant
wage workers
Count of natives in new
firms
Count of other native wage
workers
Total share of immigrants in
LEHD workforce
Immigrant rate of
employment in new firms
Native rate of employment in
new firms
Immigrant share of
employment in new firms
(1) (2) (3) (4) (5) (6) (7) (8) (9)
1995 203,480 3,036,760 785,550 15,790,590 16.4% 6.3% 4.7% 20.6%1996 223,590 3,293,330 839,190 16,570,810 16.8% 6.4% 4.8% 21.0%1997 238,330 3,624,270 870,560 17,448,260 17.4% 6.2% 4.8% 21.5%1998 254,720 3,901,610 908,040 18,140,570 17.9% 6.1% 4.8% 21.9%1999 272,660 4,155,360 964,550 18,732,440 18.4% 6.2% 4.9% 22.0%2000 289,120 4,435,670 986,950 19,356,100 18.8% 6.1% 4.9% 22.7%2001 299,620 4,665,730 975,540 19,723,010 19.3% 6.0% 4.7% 23.5%2002 299,430 4,735,170 915,030 19,397,310 19.9% 5.9% 4.5% 24.7%2003 309,820 4,753,190 918,170 19,079,330 20.2% 6.1% 4.6% 25.2%2004 326,070 4,847,310 943,290 19,095,630 20.5% 6.3% 4.7% 25.7%2005 332,780 4,940,650 960,510 19,146,990 20.8% 6.3% 4.8% 25.7%2006 319,490 5,004,690 926,830 19,177,940 20.9% 6.0% 4.6% 25.6%2007 275,820 4,755,270 808,390 18,114,770 21.0% 5.5% 4.3% 25.4%2008 226,920 4,419,640 659,940 16,640,660 21.2% 4.9% 3.8% 25.6%
2002 441,390 6,934,120 1,707,180 35,645,500 16.5% 6.0% 4.6% 20.5%2003 445,890 6,992,490 1,684,910 35,077,100 16.8% 6.0% 4.6% 20.9%2004 467,010 7,158,580 1,691,990 35,131,620 17.2% 6.1% 4.6% 21.6%2005 480,550 7,321,280 1,706,910 35,252,440 17.4% 6.2% 4.6% 22.0%2006 463,750 7,449,540 1,636,550 35,356,850 17.6% 5.9% 4.4% 22.1%2007 406,860 7,046,720 1,430,920 33,340,470 17.7% 5.5% 4.1% 22.1%2008 337,480 6,546,090 1,188,780 30,801,120 17.7% 4.9% 3.7% 22.1%
Notes: Table provides counts and statistics related to employment in new firms by natives and immigrants in the LEHD. Panel A presents statistics for 11 states present in the LEHD by 1992. Panel B presents statistics for 28 states present by 2000. Appendix Table 1 lists states. New firms are defined through the LBD as described in the text and retain their new firm status for the first three years of the firm's life. Caution should be exercised with trends from 2006 onwards due to declines in match rates for the Business Registry Bridge between the LEHD and LBD late in the sample. Observation counts are approximated per Census Bureau requirements.
Appendix Table 2a: LEHD trends using all earners and 3-year new firm definition
Panel A: LEHD states present by 1992
Panel B: LEHD states present by 2000

Year
Count of immigrants in
new firms
Count of other immigrant
wage workers
Count of natives in new
firms
Count of other native wage
workers
Total share of immigrants in
LEHD workforce
Immigrant rate of employment
in new firms
Native rate of employment in
new firms
Immigrant share of
employment in new firms
(1) (2) (3) (4) (5) (6) (7) (8) (9)
1992 44,770 2,138,260 210,120 12,714,680 14.4% 2.1% 1.6% 17.6%1993 51,640 2,333,490 229,890 13,581,600 14.7% 2.2% 1.7% 18.3%1994 59,350 2,523,290 253,490 14,236,840 15.1% 2.3% 1.7% 19.0%1995 69,060 3,171,180 262,370 16,313,760 16.4% 2.1% 1.6% 20.8%1996 78,990 3,437,930 289,720 17,120,320 16.8% 2.2% 1.7% 21.4%1997 79,920 3,782,690 285,110 18,033,710 17.4% 2.1% 1.6% 21.9%1998 89,420 4,066,900 320,520 18,728,090 17.9% 2.2% 1.7% 21.8%1999 96,200 4,331,820 338,820 19,358,170 18.4% 2.2% 1.7% 22.1%2000 99,720 4,625,080 326,510 20,016,540 18.8% 2.1% 1.6% 23.4%2001 97,340 4,867,410 289,260 20,409,280 19.3% 2.0% 1.4% 25.2%2002 98,290 4,936,300 278,210 20,034,130 19.9% 2.0% 1.4% 26.1%2003 107,280 4,955,730 311,420 19,686,080 20.2% 2.1% 1.6% 25.6%2004 113,290 5,060,100 322,450 19,716,470 20.5% 2.2% 1.6% 26.0%2005 108,710 5,164,720 312,650 19,794,860 20.8% 2.1% 1.6% 25.8%2006 89,640 5,234,540 268,900 19,835,880 20.9% 1.7% 1.3% 25.0%2007 69,370 4,961,720 220,510 18,702,570 21.0% 1.4% 1.2% 23.9%2008 53,730 4,592,830 161,870 17,138,720 21.2% 1.2% 0.9% 24.9%
2000 145,660 6,725,760 603,720 36,644,220 15.6% 2.1% 1.6% 19.4%2001 142,060 7,105,810 538,650 37,404,240 16.0% 2.0% 1.4% 20.9%2002 143,950 7,231,560 510,020 36,842,660 16.5% 2.0% 1.4% 22.0%2003 145,430 7,292,940 542,420 36,219,590 16.8% 2.0% 1.5% 21.1%2004 163,690 7,461,900 570,290 36,253,320 17.2% 2.1% 1.5% 22.3%2005 159,460 7,642,370 559,920 36,639,440 17.3% 2.0% 1.5% 22.2%2006 131,500 7,781,790 471,920 36,521,490 17.6% 1.7% 1.3% 21.8%2007 100,410 7,353,160 385,290 34,386,140 17.7% 1.3% 1.1% 20.7%2008 79,880 6,803,680 299,580 31,690,320 17.7% 1.2% 0.9% 21.1%
Appendix Table 2b: LEHD trends using all earners and 1-year new firm definition
Panel A: LEHD states present by 1992
Panel B: LEHD states present by 2000
Notes: See Table 2a. Table adjusts the definition of new firms to apply to the first year of business entry only.
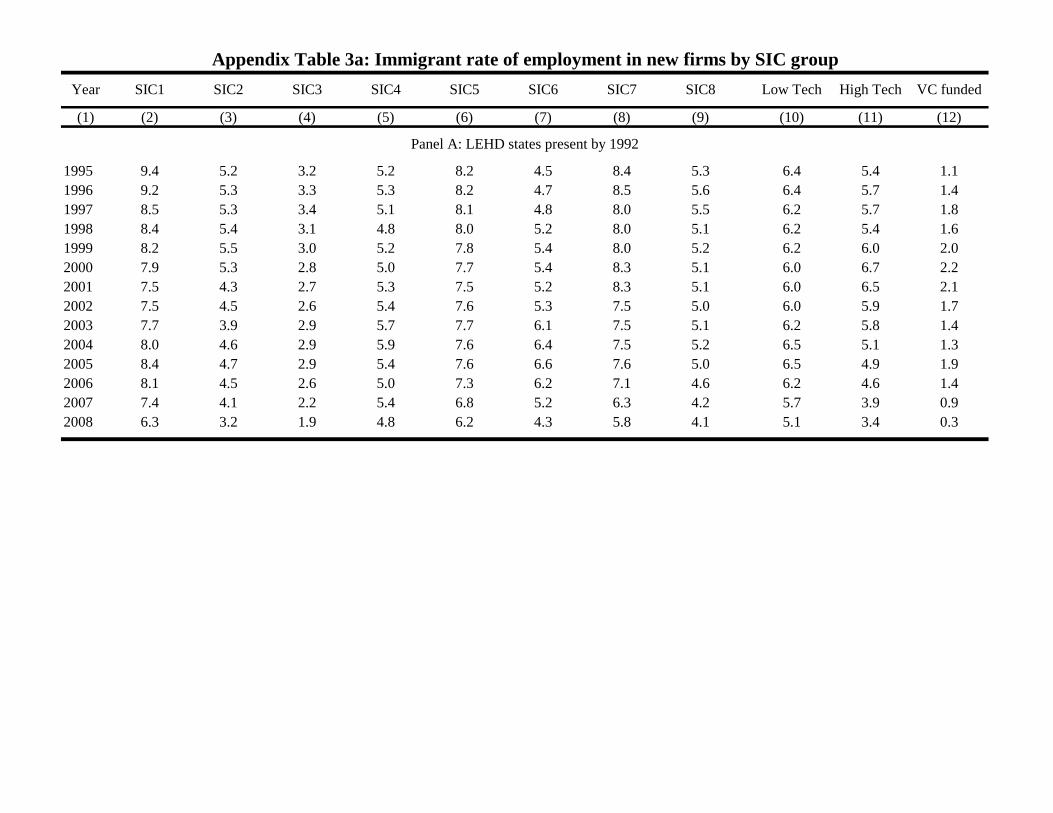
Year SIC1 SIC2 SIC3 SIC4 SIC5 SIC6 SIC7 SIC8 Low Tech High Tech VC funded
(1) (2) (3) (4) (5) (6) (7) (8) (9) (10) (11) (12)
1995 9.4 5.2 3.2 5.2 8.2 4.5 8.4 5.3 6.4 5.4 1.11996 9.2 5.3 3.3 5.3 8.2 4.7 8.5 5.6 6.4 5.7 1.41997 8.5 5.3 3.4 5.1 8.1 4.8 8.0 5.5 6.2 5.7 1.81998 8.4 5.4 3.1 4.8 8.0 5.2 8.0 5.1 6.2 5.4 1.61999 8.2 5.5 3.0 5.2 7.8 5.4 8.0 5.2 6.2 6.0 2.02000 7.9 5.3 2.8 5.0 7.7 5.4 8.3 5.1 6.0 6.7 2.22001 7.5 4.3 2.7 5.3 7.5 5.2 8.3 5.1 6.0 6.5 2.12002 7.5 4.5 2.6 5.4 7.6 5.3 7.5 5.0 6.0 5.9 1.72003 7.7 3.9 2.9 5.7 7.7 6.1 7.5 5.1 6.2 5.8 1.42004 8.0 4.6 2.9 5.9 7.6 6.4 7.5 5.2 6.5 5.1 1.32005 8.4 4.7 2.9 5.4 7.6 6.6 7.6 5.0 6.5 4.9 1.92006 8.1 4.5 2.6 5.0 7.3 6.2 7.1 4.6 6.2 4.6 1.42007 7.4 4.1 2.2 5.4 6.8 5.2 6.3 4.2 5.7 3.9 0.92008 6.3 3.2 1.9 4.8 6.2 4.3 5.8 4.1 5.1 3.4 0.3
Appendix Table 3a: Immigrant rate of employment in new firms by SIC group
Panel A: LEHD states present by 1992

Year SIC1 SIC2 SIC3 SIC4 SIC5 SIC6 SIC7 SIC8 Low Tech High Tech VC funded
(1) (2) (3) (4) (5) (6) (7) (8) (9) (10) (11) (12)
2002 7.6 4.0 2.9 5.4 7.8 5.0 7.6 4.8 6.0 6.0 1.52003 7.5 3.6 3.0 5.4 7.8 5.6 7.5 4.7 6.0 5.7 1.22004 7.8 4.0 3.0 5.5 7.7 5.8 7.4 4.9 6.2 5.2 1.22005 8.1 4.1 2.9 5.2 7.7 6.1 7.6 4.7 6.3 4.9 1.62006 7.7 4.0 2.7 4.8 7.4 5.6 7.2 4.4 6.0 4.7 1.22007 7.3 3.6 2.3 5.2 7.0 4.8 6.6 4.1 5.6 4.2 0.82008 6.4 2.9 2.2 4.7 6.3 4.1 6.0 3.9 5.1 3.8 0.3
Appendix Table 3a, continued
Panel B: LEHD states present by 2000
Notes: The one-digit SIC codes cover the following industries; SIC1: Metal Mining, Coal Mining, Oil & Gas Extraction, Nonmetal Minerals (except Fuels), General Building Contractors, Heavy Construction (excl. Building), Special Trade Contractors, SIC2: Food & Kindred Products, Tobacco Products, Textile Mill Products, Apparel & Other Textile Products, Lumber & Wood Products, Furniture & Fixtures, Paper & Allied Products, Printing & Publishing, Chemicals & Allied Products, Petroleum & Coal Products, SIC3: Rubber & Misc. Plastics Products, Leather & Leather Products, Stone & Clay & Glass Products, Primary Metal Industries, Fabricated Metal Products, Industrial Machinery & Equipment, Electronic & Other Electric Equipment, Transportation Equipment, Instruments & Related Products, Misc. Manufacturing, SIC4: Railroad Transportation, Local & Interurban Passenger Transit, Trucking & Warehousing, Water Transportation, Pipelines (except Natural Gas), Transportation Services, Communications, Electric, Gas & Sanitary Services, SIC5: Wholesale Trade - Durable Goods, Wholesale Trade - Nondurable Goods, Building Materials & Garden Supplies, General Merchandise Stores, Food Stores, Automotive Dealers & Service Stations, Apparel & Accessories Stores, Furniture & Home Furnishings Stores, Eating & Drinking Places, SIC6: Depository Institutions, Nondepository Institutions, Security & Commodity Brokers, Insurance Carriers, Holdings & Other Investment Offices, SIC7: Hotels & Other Lodgings Places, Personal Services, Business Services, Auto Repair & Services & Parking's, Miscellaneous Repair Services, Motion Pictures, Amusement & Recreation Services, SIC8: Health Services, Legal Services, Educational Services, Social Services, Museums & Botanical & Zoological Gardeners, Membership Organizations, Services NEC. The high-tech industries are based on the three-digit SIC classification as shown in Hecker (1999).

Year SIC1 SIC2 SIC3 SIC4 SIC5 SIC6 SIC7 SIC8 Low Tech High Tech VC funded
(1) (2) (3) (4) (5) (6) (7) (8) (9) (10) (11) (12)
1995 13.7 33.2 27.9 16.8 24.5 14.1 20.0 16.0 20.4 22.9 28.31996 14.1 33.8 25.7 16.8 25.7 14.8 21.2 16.6 20.9 22.5 28.41997 14.2 32.6 26.7 17.1 26.6 15.3 21.8 16.8 21.3 22.9 24.31998 14.9 34.4 26.5 17.5 26.8 16.0 22.4 16.8 21.8 22.8 24.31999 15.6 34.9 25.8 19.1 26.8 16.0 22.9 17.0 22.0 22.0 24.22000 16.6 33.4 28.0 20.8 26.8 16.4 24.0 17.5 22.5 23.6 23.52001 17.3 33.0 28.7 21.4 27.5 16.6 25.8 18.4 23.3 24.6 26.02002 18.2 33.6 28.2 23.3 29.7 17.7 26.8 19.4 24.6 25.4 26.12003 19.3 31.6 26.3 23.6 30.1 19.1 26.3 20.8 25.2 25.4 27.22004 19.6 31.0 25.9 23.1 31.3 19.7 27.0 21.9 25.8 24.8 24.62005 19.7 30.9 25.9 23.3 31.8 19.9 26.9 21.9 25.6 24.6 28.52006 19.9 30.4 25.5 23.0 31.4 20.1 27.0 22.0 25.7 24.7 26.92007 19.9 30.4 25.7 21.0 31.1 19.6 26.7 22.1 25.5 24.7 26.32008 19.6 28.9 24.6 21.6 30.8 19.4 27.0 22.8 25.7 24.4 28.1
2002 16.1 25.3 22.1 17.3 25.5 14.5 22.9 15.9 20.4 21.9 22.72003 16.6 23.7 21.5 16.9 26.3 15.6 22.6 16.8 20.8 22.0 23.42004 17.0 24.3 21.8 17.4 27.1 16.3 23.4 18.0 21.6 21.5 21.02005 17.1 24.7 21.6 18.3 27.9 16.6 23.7 18.2 22.0 21.7 24.62006 17.2 24.7 20.9 18.8 28.0 16.8 24.1 18.3 22.1 21.5 23.72007 17.5 24.4 20.5 18.4 28.3 16.5 24.1 18.4 22.2 21.5 23.12008 17.5 23.3 20.2 18.3 27.9 16.4 24.0 18.8 22.2 21.2 25.3
Appendix Table 3b: Immigrant share of employment in new firms by SIC group
Panel A: LEHD states present by 1992
Panel B: LEHD states present by 2000
Notes: See Appendix Table 3a.

Immigrant/ DifferenceTrait Mean SD Mean SD native ratio p-value
(1) (2) (3) (4) (5) (6) (7)
Age 37.6 9.2 36.2 9.9 1.037 0.000Male 61.8 48.6 57.7 49.4 1.071 0.000Average quarterly earnings in year before founding $7,335 $25,140 $9,028 $29,878 0.812 0.000Average quarterly earnings in year of founding $9,305 $155,301 $10,236 $31,949 0.909 0.000Average quarterly earnings in year after founding $10,199 $23,236 $11,339 $33,915 0.899 0.000N 1,605,970 5,700,570
Age 34.8 8.2 34.6 8.9 1.008 0.000Male 0.71 0.46 0.64 0.48 1.100 0.000Average quarterly earnings in year before founding $21,160 $102,666 $19,516 $134,875 1.084 0.089Average quarterly earnings in year of founding $20,137 $20,603 $18,525 $21,456 1.087 0.000Average quarterly earnings in year after founding $24,957 $23,524 $23,503 $28,566 1.062 0.000N 18,650 48,910
Appendix Table 4: LEHD comparisons of immigrant and native employees in new firms
Panel B: Panel A for firms backed by venture capital
Notes: Descriptive traits are developed from LEHD.
Immigrants Natives
Panel A: Traits of initial employees in new firms, full sample

Immigrant/ DifferenceTrait Mean SD Mean SD native ratio p-value
(1) (2) (3) (4) (5) (6) (7)
Age 38.1 9.2 36.9 10.0 1.032 0.000Male 60.0% 49.0% 56.5% 49.6% 1.064 0.000Married 66.4% 47.3% 53.7% 49.9% 1.235 0.000Number of children 1.40 1.39 0.98 1.17 1.429 0.000Bachelor's education and higher 25.2% 43.4% 22.7% 41.9% 1.109 0.000Home owner 56.6% 49.6% 65.3% 47.6% 0.868 0.000Home value (max=$1 million) $188,172 $169,972 $163,722 $152,863 1.149 0.000Implied rental value $165,472 $84,305 $154,054 $88,127 1.074 0.000Move-in date 1994.2 5.7 1992.7 7.7 1.001 0.000Household income (max=$2.5 million) $65,737 $74,124 $69,286 $72,430 0.949 0.000Year of arrival to United States 1984.0 9.7
Notes: Descriptive traits are developed from 2000 Decennial Census match to LEHD. Implied rental value of dwelling is 20x monthly rent.
Appendix Table 5: 2000 Census comparisons of immigrant and native employees in new firmsImmigrants Natives
Traits of employees in new firms, full sample

Fraction alive in third year
Employment growth
relative to firm's average
Payroll growth relative to
firm's average
Establishment count growth
relative to firm's average
(0,1) 3rd-year employment
exceeds initial level
(0,1) 3rd-year employment exceeds 100
workers
(0,1) 3rd-year employment is in top decile of industry
(1) (2) (3) (4) (5) (6) (7)
Mean 0.6418 0.2726 0.2449 0.0033 0.5133 0.0086 0.0848SD 0.4866 0.6823 0.7216 0.0567 0.4998 0.0921 0.2787Observations 535,580 329,260 329,260 329,260 329,260 329,260 329,260
Firm's immigrant -0.01017 0.03382 -0.00062 -0.00047 0.01913 0.00479 0.00881employee share (0.00182) (0.00295) (0.00350) (0.00019) (0.00238) (0.00032) (0.00097)
ß / Mean of DV -0.016 0.124 -0.003 -0.142 0.037 0.557 0.104
Firm's immigrant 0.01753 0.00298 -0.02772 -0.00039 0.00629 0.00454 0.01103employee share (0.00244) (0.00479) (0.00566) (0.00033) (0.00383) (0.00054) (0.00167)
ß / Mean of DV 0.027 0.011 -0.113 -0.118 0.012 0.528 0.130
Appendix Table 6a: Table 5a with immigrant share of all initial employees
Panel A: Summary statistics
Notes: See Table 5a.
Panel B: Estimation with cohort fixed effects and controls for initial traits
Panel C: Estimation with cohort-PMSA-industry fixed effects and controls for initial traits
Traits of surviving firms in the third year

Fraction alive in sixth year
Employment growth
relative to firm's average
Payroll growth relative to
firm's average
Establishment count growth
relative to firm's average
(0,1) 6th-year employment
exceeds initial level
(0,1) 6th-year employment exceeds 100
workers
(0,1) 6th-year employment is in top decile of industry
(1) (2) (3) (4) (5) (6) (7)
Mean 0.4350 0.3097 0.3643 0.0034 0.5362 0.0102 0.0842SD 0.4958 0.7403 0.7984 0.0591 0.4987 0.1003 0.2776Observations 535,580 233,000 233,000 233,000 233,000 233,000 233,000
Firm's immigrant -0.02096 0.05274 0.01198 -0.00012 0.02953 0.00552 0.00967employee share (0.00183) (0.00386) (0.00461) (0.00023) (0.00286) (0.00043) (0.00122)
ß / U.S. mean -0.048 0.170 0.033 -0.035 0.055 0.541 0.115
Firm's immigrant 0.01591 0.01240 -0.02835 -0.00039 0.01319 0.00484 0.00779employee share (0.00236) (0.00663) (0.00789) (0.00038) (0.00490) (0.00078) (0.00228)
ß / U.S. mean 0.037 0.040 -0.078 -0.115 0.025 0.475 0.093
Notes: See Table 5b.
Appendix Table 6b: Table 5b with immigrant share of all initial employeesTraits of surviving firms in the sixth year
Panel A: Summary statistics
Panel B: Estimation with cohort fixed effects and controls for initial traits
Panel C: Estimation with cohort-PMSA-industry fixed effects and controls for initial traits