economic well-being of the elderly immigrant … borjas final.pdfeconomic well-being of the elderly...
TRANSCRIPT

Economic Well-Being of the Elderly Immigrant Population
George J. Borjas
Harvard University
August 2009
This research was supported by the U.S. Social Security Administration through grant #10‐M‐98363‐1‐01 to the National Bureau of Economic Research as part of the SSA Retirement Research Consortium. The findings and conclusions expressed are solely those of the author(s) and do not represent the views of SSA, any agency of the Federal Government, or the NBER.

2
I. Introduction
In a relatively short period of time, immigration became an important force of
demographic and economic change in the United States. In the 1950s, approximately 250
thousand legal immigrants were admitted to the United States each year, and there was
little illegal immigration. By 2000, nearly one million legal immigrants were being
admitted to the country each year, with another half a million entering illegally (Passel,
2006). As a result of these trends, nearly half of population growth is now due to
immigration, and the foreign-born share of the U.S. population more than doubled, from
5 to 12.5 percent, between 1970 and 2007.
The resurgence of large-scale immigration sparked the development of an
extensive literature that examines the performance of immigrant workers in the labor
market, including their earnings upon entry and their subsequent assimilation toward the
earnings of native-born workers (see Borjas, 1999; and LaLonde and Topel, 1996, for
surveys). An important finding of this literature is that, over the period 1960-1990, there
was a continuous decline in the relative entry wage of new immigrants.
The skill composition of the immigrant population—and, particularly, how the
skills of immigrant workers compare to those of native workers—is the key determinant
of the economic impact of immigration on the United States. For instance, it determines
which native workers are more likely to feel an adverse impact of immigration on their
labor market opportunities (Borjas, 2003; Card, 2001; Friedberg and Hunt, 1995).
Similarly, the relative skills of immigrants determine the economic benefits from
immigration (Borjas, 1995b). Economic theory suggests that the receiving country
benefits from immigration because it can import workers with scarce qualifications and
abilities.
As the foreign-born workforce nears retirement age, many of these issues will
inevitably arise in the context of the elderly population. One question will become an
increasingly important concern in the economics of aging: how do immigrants fare in
their post-retirement years? This paper uses microdata from the 1970-2000 decennial
censuses, as well as the 2005-2007 American Community Surveys, to document and
examine the trends in the economic well being of the elderly immigrant population. In
particular, the paper documents the trends in the relative economic status of elderly

3
immigrants and examines a variety of factors that cause disparities in incomes between
elderly immigrants and natives.
The key empirical finding of the analysis is that there has been a significant drop
in the relative income of elderly immigrants in the past few decades. In 1970, the average
income of elderly immigrants was only about 5 percent below that of elderly natives. By
2007, the income gap had widened to 30 percent. This study examines the immigrant-
native gap in the various sources of income that determine the economic well being of the
elderly population, including investment income, retirement benefits, and public
assistance. The analysis finds that a crucial factor in generating the growing immigrant
disadvantage is that immigrants are much less likely to receive retirement benefits than
natives, either through the Social Security system or through private sources. Moreover,
even among those immigrants who do receive retirement benefits, there is a sizable gap
in the level of benefits received.
The study also reveals that many of the findings familiar in the literature that
analyzes the labor market outcomes of immigrants reappear when the focus shifts to the
elderly population. For instance, the cohort effects that have been documented in the
earlier literature (Borjas, 1985, 1985a) reappear in the context of elderly immigrants, with
elderly immigrants who arrived prior to 1990 having significantly better post-retirement
prospects than those who arrived after 1990. Similarly, there are huge differences in the
economic outcomes experienced by elderly immigrants in different national origin
groups. Because the changing national origin mix of elderly immigrants will likely
change rapidly in the next two decades (as the immigrants who migrated in the 1950s and
1960s from Western European countries are replaced by those who originated in less
developed countries), it is almost inevitable that the decline in the relative incomes of
elderly immigrants will continue.
II. Data and Basic Trends
The empirical analysis uses data drawn from the 1970-2000 Integrated Public Use
Microdata Series (IPUMS) of the U.S. Census, and the pooled 2005-2007 American
Community Surveys (which, for simplicity, I will call the 2007 census). In 1970 and

4
2007, the data represent a 3 percent random sample of the population.1 In 1980, 1990,
and 2000, the data represent a 5 percent sample. The study focuses on describing the
economic status of persons in their post-retirement years; hence the analysis is restricted
to persons aged 65 or more at the time of the census. All of the available observations in
each of these surveys are used in the analysis. Finally, persons who are not citizens or
who are naturalized citizens are classified as immigrants; all other persons are classified
as natives.2
Figure 1 begins the descriptive analysis by illustrating the trend in the immigrant
share in the population of elderly persons—that is, the fraction of the elderly population
aged 65 or more that is foreign-born. The immigrant share in this population declined
steadily from 1970 to 1990, when it reached a low of 8.6 persons. The immigrant share,
however, has risen rapidly since 1990. By 2007, 11.5 percent of the elderly population
was foreign-born. Much of this increase can be attributed to the aging of immigrants who
arrived at younger ages. In particular, there has not been a dramatic surge in the number
of elderly immigrants who are recent arrivals to the country. In 1990, for instance, 14.8
percent of the elderly immigrants lived in the United States fewer than 10 years, while the
respective statistic for 2007 is 13.5 percent.
Equally important, the immigrant share in the elderly population is bound to
increase significantly in the next few decades, simply as a result of the aging of the
population. Figure 1 also illustrates the trend in the immigrant share among persons aged
50-64, who are nearing their retirement years. By 2007, almost 13 percent of this
population was foreign-born. Put differently, even if the immigration of persons aged 65
or more were to be completely curtailed in the future, the immigrant share among persons
in their post-retirement years would increase by another 1.5 percentage points in the next
2 decades.
Figure 2 summarizes what is one of the central empirical findings of the study.
Each of the available censuses provides information on the total personal income of the
1 The 3 percent random sample in 1970 is obtained by pooling the state file, the metropolitan area
file, and the neighborhood file.
2 This definition ensures that Puerto Ricans who moved to the United States and are U.S. citizens by birth are not classified as immigrants.

5
elderly person. This variable, of course, adds up the incomes that elderly persons receive
from various sources (described below. I used this information to calculate the log
income gap between the typical elderly immigrant and the typical elderly native.3 The
figure clearly documents a precipitous decline in the relative economic status of elderly
immigrants in the 1970-2007 period. In 1970, the income disadvantage of elderly
immigrants stood at 4.5 percent.4 By 1990, the income gap had widened to 15.6 percent;
and by 2007, the income gap stood at 30.5 percent. In short, there has been a significant
deterioration in the economic well being of elderly immigrants, at least as measured by
their total income relative to comparably aged native persons.
Figure 2 also illustrates that the decline in the relative economic position of
elderly immigrants cannot be attributed to shifts in the gender distribution of the various
populations.5 In fact, since 1980 the observed decline in the log income gap between
elderly immigrants and natives follows a similar track for both men and women. Among
men, the immigrant disadvantage of 11.9 percent in 1980 widened to 27.4 percent by
2007. Among women, the immigrant disadvantage of 13.6 percent in 1980 widened to
31.9 percent by 2007.
The precipitous decline in the relative income of elderly immigrants can also not
be attributed to a change in the number of immigrants who are new arrivals to the
country. Figure 3 divides the elderly immigrant population in each cross-section into two
groups: immigrants who have been in the country fewer than 10 years, and immigrants
who have been in the country at least 10 years. The figure presents the trend in the log
income gap between each of these groups and elderly natives.
The data summarized in Figure 3 has a number of interesting implications. First,
there is a huge difference between the income of newly arrived immigrants and the
3 A non-trivial fraction of immigrants report either no income or a negative income (due to business losses) during the relevant calendar year. In 2000, for example, 7.0 percent of natives and 14.3 percent of immigrants report total incomes less than or equal to 0. To avoid deleting these observations from the analysis, the graph illustrates the difference in the log of mean incomes (rather than the mean log income) between the two groups.
4 For expositional convenience, unless otherwise noted, I will often use the convention of interpreting the difference in log points (times 100) as a percent difference. This approximation is useful as long as the difference in log points is relatively small.
5 In 1970, 45.2 percent of natives were male and 46.2 percent of immigrants were male. By 2007, the respective statistics are 45.9 and 45.0 percent.

6
income of earlier arrivals in each cross-section. For example, the typical newly arrived
immigrant in 2007 had an average annual income of only $6,300 dollars, as compared to
an average income of $18,400 for immigrants who had been in the country at least 10
years.
Second, the precipitous decline in relative economic status is clearly evident even
among immigrants who have been in the country at least 10 years, and who have
presumably already experienced a significant amount of economic assimilation.6 In 1970,
this group of “assimilated” immigrants had an income disadvantage of 3.2 percent. The
disadvantage grew to 9.3 percent by 1990, and to 23.1 percent by 2007.
Finally, there seem to be numerically important cohort effects that drive the trend
in the economic status of newly arrived elderly immigrants. Among elderly immigrants
who have been in the country fewer than 10 years, the income gap between each
immigrant cohort and natives stood at -.586 log points in 1970, -.965 log points in 1990,
and -1.31 log points in 2007. In other words, each new wave of elderly immigrants (or,
more precisely, of immigrants who arrived in the country after age 65) is substantially
more disadvantaged than the preceding waves.
Beginning in 1990, the census data consistently identify six different sources of
income for elderly persons: earned income (from both wage-and-salary jobs as well as
business income), investment income, Social Security income, other retirement income,
(i.e., retirement income from sources other than Social Security), public assistance
income, and the residual category of “other” income. The average income of a particular
elderly population is defined by:
(1) Y = qj yj ,j∑
where Y gives the average total income of the group; qj gives the recipiency rate for
type-j income, i.e., the fraction of the group’s population that receives that particular
6 The literature on the labor market experiences of immigrants typically finds that much of the
income growth experienced by newly arrived immigrants occurs in the first decade or 15 years after migration; see, for example, Borjas (1985), Carliner (1978), Chiswick (1978), Duleep and Regets (1996), LaLonde and Topel (1992), Lubotsky (2007), and Yuengert (1994).

7
type of income; and yj gives the conditional mean income from source j, where the
average is calculated in the subsample of persons who received some income in that
category. Equation (1) suggests a simple way of decomposing the total income of
immigrants and natives into its various components, which obviously depend on
recipiency rates and on conditional mean incomes for the various income sources.
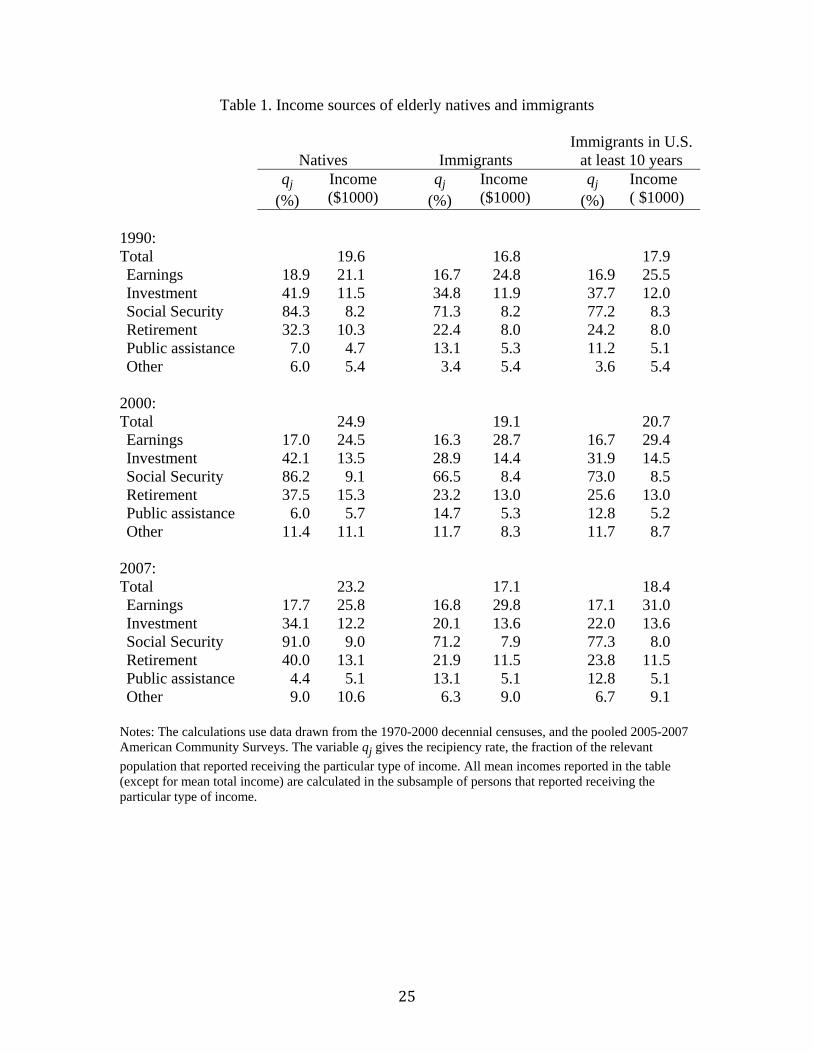
Consider initially the role played by earned income in determining the total
income of elderly immigrants and natives. Table 1 shows that about 18 percent of both
elderly immigrants and elderly natives receive some income from their participation in
the labor market, but that those immigrants who do work tend to have much higher levels
of earned income.7
In contrast, the role of income from investment sources declined in importance for
both immigrants and natives over the 1990-2007 period. In 1990, 41.9 percent of natives
and 34.1 percent of immigrants received some investment income. By 2007, however, the
respective recipiency rates had declined to 34.1 and 20.1 percent, respectively. As with
earned income, however, those immigrants who do receive investment income do tend to
receive slightly higher levels.
Consider next the two sources of retirement income available in the data: Social
Security benefits and private retirement incomes. Elderly immigrants lag far behind
elderly natives in the propensity to receive either type of retirement income. In 2007, only
71.2 percent of elderly immigrants receive Social Security income, as compared to 91.0
percent of natives. Similarly, only 21.9 percent of immigrants received income from
other retirement sources as compared to 40.0 percent of natives. Moreover, the
conditional means of the incomes received from either of these sources are lower for
immigrants than for natives. The data in Table 1, therefore, highlight the key source of
the substantial total income gap between immigrants and natives documented in Figure 2:
immigrants are far less likely to receive the retirement benefits that natives commonly
7 The higher levels of annual earned income, of course, may be due to either a larger number of
hours worked or a higher hourly income. The relative importance of these two factors is explored in the next section.

8
receive, and those immigrants who do receive these types of retirement benefits tend to
receive lower amounts.8
Finally, Table 1 documents the rising importance played by public assistance
income in the elderly immigrant population. By 2007, 13.1 percent of elderly immigrants
received cash assistance, as compared to only 4.4 percent of elderly natives. Practically
all of this public assistance was through participation in the Supplemental Security
Income (SSI) program.9
Table 1 shows that the differences between immigrants and natives are
narrower—but do not disappear—when one focuses on the sample of immigrants who
have been in the United States for at least 10 years. Even within this group of
“assimilated” immigrants, the immigrants are far less likely to receive investment income
or retirement benefits, and far more likely to receive public assistance. It is important to
emphasize that because these immigrants have lived in the United States for at least 10
years, they theoretically qualify for Social Security benefits as long as they worked a total
of 40 quarters. Nevertheless, the assimilated immigrants still have a substantially smaller
propensity for receiving Social Security benefits. In 2007, only 77.3 percent of the
immigrants who had resided in the United States for at least 10 years received Social
Security benefits, as compared to 91.0 percent for natives.
Table 2 summarizes the available data in a different way, by calculating the
income shares attributable to the various sources of income in the immigrant and native
populations. The income share accounted by type-j income is defined by:
(2) s j =qj yj
Y.
8 The lower recipiency rate of immigrants in the Social Security program persists even after the
immigrant has resided in the country for 20 years. The recipiency rate for these immigrants was 78.2 percent in 2000 and 82.3 in 2007, still far below the 86.2 and 91.0 percent recipiency rate of natives. I will show in the next section that the persistenly lower Social Security recipiency rates among immigrants cannot be explained by differences between immigrants and natives in observable socioeconomic characteristics.
9 In 2007, 81.7 percent of elderly natives and 84.4 percent of elderly immigrants receiving public assistance participated in the SSI program.

9
The income shares reported in Table 2 shows that earned income has always been a
relatively more important part of the total income accruing to immigrants, and that its
importance has increased over time. In 1990, for example, earned income accounted for
19.8 percent of the total income accruing to natives and 24.8 percent of the total income
accruing to immigrants. By 2007, earned income still accounted for 19 percent of the
income accruing to natives, but now accounted for 29 percent of the income accruing to
immigrants.
In contrast, immigrants are much less likely to depend on private retirement
funds—even if the immigrants have been in the United States for more than 10 years.
Nearly 23 percent of native income is from this source, as compared to only 15 percent
for immigrants. However, public assistance income plays a larger role in determining
economic well being for elderly immigrants. Only about 1.0 percent of the income
accruing to natives is from public assistance, as compared to almost 4 percent for
immigrants.
III. Regression Analysis
To examine if the differences between elderly immigrants and natives
documented in the previous section remain even after adjusting for various
socioeconomic background variables, I estimated a set of regressions using the following
generic specification:
(3) zit = Xitγ t +α t Fit0 + βt Fit
1 + ε,
where z is the socioeconomic outcome of interest for individual i at time t, such as the
recipiency rate for a particular type of income; X is a vector of standardizing variables,
discussed below; F0 is a dummy variable indicating if the person is foreign-born and has
been in the United States fewer than 10 years; and F1 is a dummy variable indicating if
the person is foreign-born and has been in the United States at least 10 years.
Tables 3a and 3b report the estimates of the coefficients α and β in the 2000
census, respectively, for each of the variables under study. Each column of the table

10
represents a different specification of the regression model. For example, the first column
reports the coefficients when the vector X does not include any standardizing variables.
Column 2 estimates a regression that adjusts for differences in age, sex, and race; column
3 adds educational attainment to the list of standardizing variables; and column 4 adds a
vector of variables describing the person’s household composition, including marital
status, the number of persons in the household, and a dummy variable indicating if the
person is a householder. Finally, the last column of the table estimates a regression that
adds a vector of state-of-residence fixed effects to the vector X.
Perhaps the most important insight from the empirical exercise summarized in
Tables 3a and 3b is that the raw differences observed between immigrants and natives in
practically all of the variables that determine total income (i.e., the recipiency rate, qj, and
the conditional mean income, yj) cannot be “explained” by the extensive set of
background characteristics included in the regression models. For example, consider the
regression in the first row where the dependent variable is the log of total income. The
log income gap between “assimilated” immigrants (i.e., immigrants who have been in the
United States at least 10 years) and natives in 2000 is -.223. This gap is unchanged when
the regression controls for age, sex, and race; and drops slightly to -.180 when the
regression also includes educational attainment. The addition of household composition
variables and state-of-residence fixed effects reveals that the adjusted income gap
between assimilated immigrants and natives remains at 18 percent.
The variables measuring the importance of earned income are also not very
sensitive to the inclusion of the various standardizing characteristics. It is important to
note that to analyze the determinants of earned income, I used a slightly different
decomposition than the one presented in the previous section. In particular, total earned
income depends on both labor supply and the hourly earnings.10 Hence I define the two
components of earned income as: (1) the fraction of time worked during the year (i.e.,
annual hours worked divided by 2000); and (2) the hourly earnings. The regression
coefficients reported in Tables 3a and 3b indicate that newly arrived elderly immigrants
10 In the previous section, I had decomposed earned income in terms of a recipiency rate (whether
any earned income was reported) and the annual level of earned income. The approach used in this section better captures the potential changes in the labor supply behavior of elderly immigrants.

11
work slightly fewer hours than natives, and have a substantially lower wage rate. In 2007,
for example, the typical new arrival earned about 17.3 percent less than the typical native
worker, even after adjusting for the complete set of standardizing variables. In contrast,
the assimilated immigrants earn about 1.3 percent more than statistically comparable
natives.
The examination of the remaining rows of Tables 3a and 3b, where the dependent
variables are the recipiency rates and conditional means that determine total income,
show a disadvantage for elderly immigrants for almost all the variables under analysis.
Consider, for instance, the propensity for the elderly person to receive Social Security
income. The raw differential in the recipiency rate between assimilated immigrants and
natives is -13.2 percentage points, while the standardized differential in the general
specification reported in column 5 is –10.8 percentage points. Similarly, consider the
recipiency rate for private retirement benefits. The raw differential is -12.0 percent, and
the standardized differential in column 5 is -9.9 percent. Finally, consider the recipiency
rate for public assistance income. The raw differential is +6.8 percent, and the
standardized differential is 5.6 percent.
The surprising robustness of the observed differences between elderly immigrants
and natives in most of the variables that determine the total income of elderly persons has
an interesting policy implication. Suppose, for example, that policy makers wished to
implement policy shifts that would improve the relative economic well being of the
elderly immigrant population. The regression results suggest that many of the obvious
policy shifts, which would likely depend on observable socioeconomic characteristics,
may well be ineffective. For instance, an immigration policy that stresses observable
skills in awarding entry visas, or a welfare policy that changes eligibility requirements to
more carefully account for the household composition of the elderly immigrant, are
unlikely to drastically improve the economic well being of elderly immigrants.
Although the descriptive analysis reported in Table 3 is useful, it is also of interest
to examine the role that cohort and aging effects play in determining the trend in the
economic well being of elderly immigrants. As I showed in Figure 2, there seems to be a
strong cohort effect in the data, with more recent waves of elderly immigrants being at a

12
stronger disadvantage. In particular, consider stacking the data from the post-1980
censuses and estimating the following generic regression model in the pooled data:
(4) zij = δ i Aj +α rj +βCj +γ i π j + ε ij
(5) znl = Xlφn +δnAl +γ n π l + εnl ,
where zij gives the outcome of interest for immigrant j; znl gives the outcome of interest
for native l; A gives the person’s age as of the time of the Census; rj indicates the number
of years that the person has resided in the United States; C is a vector of dummy variables
indicating the calendar year in which the migration occurred; and π is a vector of
variables indicating the census from which the observation is drawn.
The coefficient vectors γi and γn give the period effects for immigrants and
natives, respectively. Note that the coefficient α measures the assimilation effect—the
impact of accumulating U.S.-specific “experience” (holding age constant). Because the
vector C contains fixed effects indicating the (calendar year) cohort of arrival, the
coefficient vector β measure the cohort effects, the differences in outcomes across the
various immigrant cohorts.
It is well known that the parameters of the model in equations (4) and (5) are not
identified (Borjas, 1985, 1995). In order to separately identify the period effects, the
assimilation effect, and the cohort effects, a restriction must be imposed on the model.
The typical restriction used in the literature is that the period effects are the same for
immigrants and natives, or:
(6) γ n =γ i .
In other words, changes in macroeconomic conditions have the same impact on the
various socioeconomic outcomes experienced by immigrants and natives.
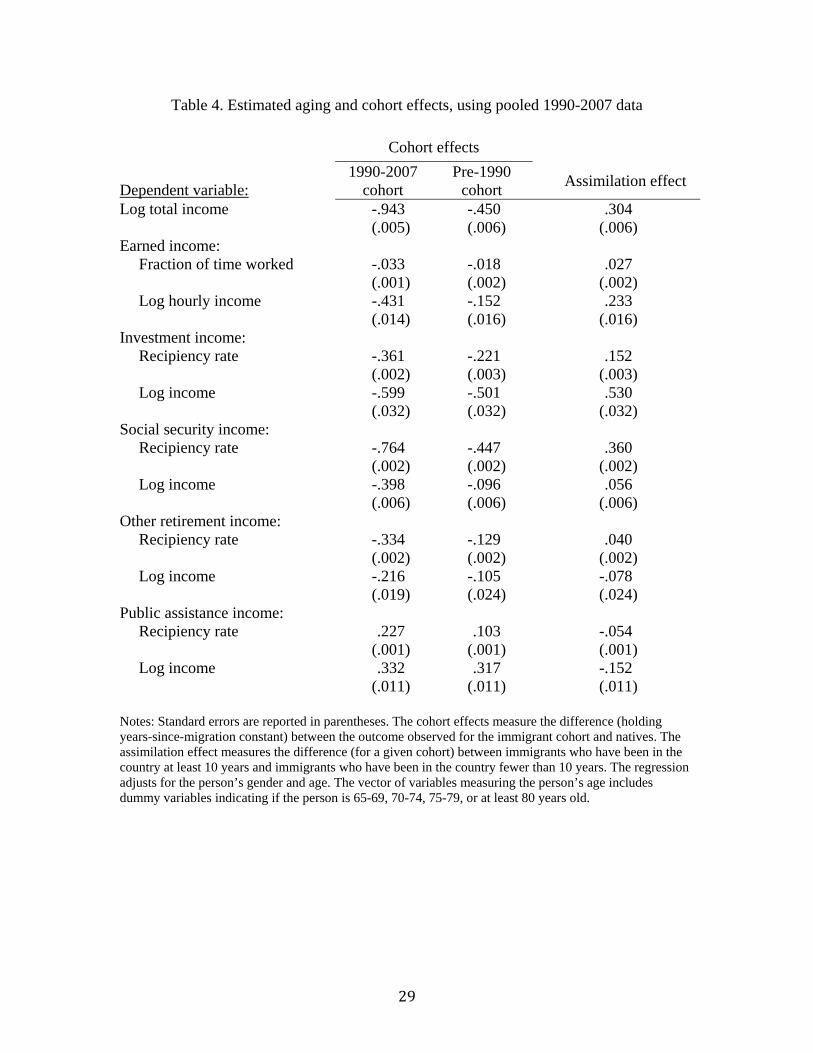
Table 4 reports the regression results. To summarize the information contained in
the data in an instructive and straightforward fashion, the model specifies a particularly
simple type of assimilation effect. In particular, the variable r is defined as a dummy

13
variable indicating if the immigrant has lived in the United States for at least 10 years.
Hence the coefficient α measures the typical change that takes place as an immigrant
evolves from being a new arrival (i.e., living less than 10 years in the country) to being
“assimilated” (i.e., living at least 10 years in the country). Similarly, the vector measuring
cohort effects, C, contains two dummy variables, indicating if the immigrant is a post-
1990 arrival or a pre-1990 arrival. The cohort effects measured by the coefficient vector
β can then be interpreted as giving the difference between each of these immigrant
cohorts and natives as of the time of entry. 7
As implied by the descriptive analysis discussed earlier, there exist significant
cohort differences in total income, as well as in the recipiency rates and conditional
means that determine the total income of the group. The coefficients of the cohort
variables typically indicate that post-1990 arrivals experience worse economic outcomes
than pre-1990 arrivals. For instance, the earned hourly income for post-1990 arrivals is
around 43.1 percent lower than that of comparable natives, while the earned hourly
income for pre-1990 arrivals was only 15.2 percent lower. Similarly, holding years since
migration constant, the recipiency rate of post-1990 arrivals for other retirement income
is 33.4 percentage points lower than that of natives, while that of pre-1990 arrivals is only
12.9 percentage points lower. Finally, the recipiency rate for public assistance income is
22.7 percentage points higher than that of natives for post-1990 arrivals, but only 10.3
percentage points higher for pre-1990 arrivals.
The last column of Table 4 reports the coefficient of the assimilation variable, and
indicates (for a given immigrant cohort) the difference in outcomes between immigrants
who have lived at last 10 years in the United States and immigrants who have lived fewer
than 10 years. The table reveals that practically all of the dependent variables examined
do exhibit some degree of assimilation, and that the assimilation is often quite large. For
instance, the growth rate in total income attributable to assimilation is 30.4 percent.
Similarly, the growth rate in the recipiency rate for Social Security benefits is 36.0
percentage points (aided, of course, by the fact that a person must work in the United
States for 40 quarters to be eligible for these benefits). Finally, the recipiency rate for
investment income grows by 15.2 percentage points as a result of assimilation.

14
Note, however, that the measured assimilation rates (though numerically sizable)
are not sufficiently large to overcome the initial disadvantage measured by the cohort
effects. In particular, consider the regression model for total log income. The initial log
income disadvantage for the pre-1990 immigrant cohort (relative to natives) is around .45
log points. The assimilation process narrows this gap by .3 log points. In the end,
therefore, the elderly immigrant would still have about 15 percent lower incomes than
natives. The situation is bleaker for the more recent immigrant waves. The initial
disadvantage is around -.9 log points, and the assimilation process narrows this gap down
to about -.6 log points. A fully assimilated post-1990 elderly immigrant, therefore, would
be predicted to still have about 45 percent lower incomes than natives.
IV. National Origin
The previous section documented significant differences in the economic
outcomes experienced by elderly immigrants across cohorts as well as over time, as the
assimilation process takes place. The immigration literature has also emphasized the
importance of national origin as a determinant of socioeconomic outcomes in the United
States (Borjas, 1992; Jasso and Rosenzweig, 1986). It is well known that there are huge
differences in labor market characteristics across the various national origin groups that
make up the immigrant population. Not surprisingly, these differences persist into their
post-retirement years.
Table 5 illustrates some of the differences in 2007 across some of the largest
national origin groups in the population of immigrants aged 65 or more. The numerical
magnitude of the differences in total income (relative to natives) is dramatic. The typical
elderly immigrant from Canada, for example, has an income that is about 8 percent more
than that of natives. In contrast, the income for the typical immigrant from Mexico is -.9
log points below that of natives, suggesting a 60 percent difference. Similarly, the income
of the typical elderly immigrant from the Philippines is about 30 percent lower than that
of natives.
The table also documents equally sizable differences across national origin groups
in the various components of total income, namely the recipiency rates and the
conditional mean incomes. To simplify the discussion in the text, I report the recipiency

15
data in terms of the actual recipiency rates, while the log income data are reported
relative to the mean income of natives. For instance, 34.1 percent of elderly natives
receive investment income, 5.6 of Mexican immigrants, 11.9 percent of Cuban
immigrants, and 20.4 percent of Chinese immigrants receive investment income.
Similarly, 4.4 percent of elderly natives receive welfare income. This contrasts with a
recipiency rate of 14.3 percent for Cuban immigrants, 3.1 percent for Canadian
immigrants, and 31.2 percent for Vietnamese immigrants. Finally, there are even
substantial national origin differentials in the recipiency rate for Social Security benefits.
The recipiency rate for these benefits is 91.0 percent for elderly natives, 68.4 percent for
Mexican immigrants, 51.2 percent for Vietnamese immigrants, and 61.1 percent for
Filipino immigrants. In short, national origin plays a very important role in determining
the economic well being of the elderly immigrant population.
The analysis of the national origin differences reveals an additional interesting
fact: the national origin composition of elderly immigrants differs substantially from that
of younger immigrants. This fact is documented in Table 6, which reports the top ten
source countries in the foreign-born elderly population aged 65, as well as in the
population of “prime-age” persons aged 18-64. There are four source countries which
played an important role in generating the elderly immigrant influx, but which are now
much less important sources of immigration: Germany, Canada, Italy, and England. It is
well known that although these countries played a crucial role in generating the
immigrant influx before the 1960s, their importance declined after the enactment of the
1965 Amendments to the Immigration and National Act. This legislation removed the
admissions preferences for immigrants originating in Western Europe and placed family
reunification at the center of U.S. immigrant admissions policy.
Table 6 also documents that even among those countries that do appear in both
lists, there are important differences in their relative importance. Mexico, for example,
accounts for almost a third of prime-age immigration, but only for 13.1 percent of the
elderly immigrants. In contrast, Cuba, which accounts for almost 7 percent of the elderly
immigrants, accounts for only 2.1 percent of prime-age immigrants.
I documented earlier that national origin plays an important role in determining
economic outcomes in the elderly immigration. The importance of national origin and the

16
changing national origin mix of the population suggests that there will inevitably be
substantial changes in the average economic well being of elderly immigrants as elderly
persons from the “traditional” source countries of Germany and Italy are replaced by the
newer immigrant waves from El Salvador and Korea.
It is easy to estimate the nature of this change by assuming that the average
performance of immigrants from a particular country of origin (as measured, for instance,
by the total income of the national origin group relative to natives) is roughly constant
over time. In fact, the data indicate that the correlation over time across countries is quite
strong. Figure 4 presents the scatter diagram relating the log total income of elderly
immigrants (relative to natives) from the 64 countries identified in both the 1990 and
2007 census data.11 It is evident that there is a very strong correlation; in fact the
correlation coefficient is over 0.8. Moreover, the coefficient of the regression line
illustrated in Figure 4 is 0.903, with a standard error of 0.082, so that one cannot reject
the hypothesis that the coefficient is equal to 1. The data, therefore, suggests a strong
stability in the pattern of economic outcomes (as measured by relative total income)
experienced by specific groups of elderly immigrants over time.
Let Zt be the average value for a particular economic outcome observed in the
elderly immigrant population (relative to that of natives) in year t. By definition, Zt can
be written as:
(7) Zt = pxtzxtx∑ ,
where zit is the average value of the variable observed among immigrants from national
origin group x in year t (again, relative to natives); and pxt is the fraction of the immigrant
flow originating in country x in year t.
11 The analysis uses the 3-digit birthplace coding in the IPUMS (rather than the more detailed 5-
digit coding) to identify country of origin. The 3-digit aggregation allows for sufficiently large samples for the countries in the analysis. It is important to note that there is little overlap in the content of the sample of elderly immigrants in the two data sets. Almost 85 percent of the elderly immigrants in the 2007 census data were below the age of 65 in 1990.

17
Suppose (as suggested by the data) that the distribution of zxt is roughly constant
over time. To predict the average outcome that will be observed in the future, I calculated
the national origin mix of the population of persons aged 40 to 55 in 2005. All persons in
this population will be in their post-retirement years by 2030. Let pxτ be the fraction of
immigrants originating in source country i for this particular population. The predicted
average value for the economic outcome of interest once the elderly population reflects
the national origin mix of this younger group is given by:
(8) Zt = pxτzxtx∑ , .
The effect of the changing national origin mix on the value of the mean economic
outcome, of course, is defined by the difference between equations (6) and (8). The
decomposition implied by this approach is identical to the Oaxaca decomposition used in
labor economics to calculate the various sources of racial or gender wage differentials
(Oaxaca, 1973).12
Table 7 summarizes the results from this decomposition. Consider initially the log
differential in total income between elderly immigrants and natives. Column 1 of the
table shows that the current national origin mix of the elderly immigrant population leads
to a -.377 log point disadvantage. This gap, however, is predicted to grow to a -.553 log
point disadvantage simply because the current crop of elderly immigrants will inevitably
be replaced by elderly immigrants originating in countries that do not perform as well. In
other words, the changing national origin mix of the elderly population will widen the
income gap between immigrants and natives by 18 percentage points.
In fact, the table suggests that the changing national origin mix of immigrants will
lead to a growing disadvantage for elderly immigrants among most of the variables that
define the total income of elderly persons. For instance, the current national mix of
elderly immigrants implies a recipiency rate for investment income of 20.1 percent. The
12 It is well known that the difference between equations (7) and (8) is not the only possible
measure of the change in Z due to the shift in the national origin composition of the immigrant flow. In particular, one could have used time τ values of the average characteristics z instead. In the current context, however, those values are not observed.

18
changing national origin mix, however, will lower this recipiency rate to 13.8 percent.
Similarly, the current recipiency rate for public assistance income is 13.1 percent, but this
recipiency rate is predicted to increase by 1.5 percentage points as a result of the
changing national origin mix of elderly immigrants.
V. Summary
This paper used data drawn from the 1970-2000 decennial censuses, as well as the
2005-2007 American Community Surveys, to examine the trends in the relative economic
status of the elderly immigrant population. The main empirical finding of the analysis is
that there has been a significant decline in the relative income of elderly immigrants since
1970. In 1970, the average income of elderly immigrants was only about 5 percent below
that of elderly natives. By 2007, the income gap had widened to 30 percent.
The study examined the various source of income that determine the total income
of elderly workers, including earned income, investment income, Social Security
benefits, other retirement benefits, and public assistance income. The data revealed that
elderly immigrants have significantly lower recipiency rates for investment incomes,
Social Security benefits, and other retirement benefits. On the other hand, immigrants are
much more likely to received earned income and public assistance income. The data
suggested that much of the immigrant disadvantage in total income can be attributed to
the fact that immigrants are much less likely to receive retirement benefits than natives,
either through the Social Security system or through private sources.
The study also documented the existence of strong cohort effects in the sample of
elderly immigrants, with those immigrants who arrived prior to 1990 having significantly
better income prospects than those who arrived after 1990. Similarly, there are huge
differences in the economic outcomes experienced by elderly immigrants in different
national origin groups. The national origin mix of the elderly immigrant population is
likely to shift rapidly in the next two decades, with the aging of the large immigrant
population that originated in less developed countries. Because these immigrants often
tend to exhibit worse economic outcomes, it is likely that the average income gap
between elderly immigrants and natives will widen in the future.

19
References Borjas, George J. 1985. “Assimilation, Changes in Cohort Quality, and the Earnings of Immigrants.” Journal of Labor Economics 3(4): 463-89. Borjas, George J. 1992. “National Origin and the Skills of Immigrants in the Postwar Period.” In Immigration and the Work Force: Economic Consequences for the United States and Source Areas, edited by George J. Borjas and Richard B. Freeman, 17-47. Chicago: University of Chicago Press. Borjas, George J. 1995. “Assimilation and Changes in Cohort Quality Revisited: What Happened to Immigrant Earnings in the 1980s?” Journal of Labor Economics 13(2): 201-245 (a).
Borjas, George J. 1995. “The Economic Benefits from Immigration.” Journal of Economic Perspectives 9(2): 3-22 (b). Borjas, George J. 1999. “The Economic Analysis of Immigration.” In Handbook of Labor Economics, Vol. 3, edited by Orley C. Ashenfelter and David Card, 1697-1760. Amsterdam: Elsevier. Borjas, George J. 2003. “The Labor Demand Curve Is Downward Sloping: Reexamining the Impact of Immigration on the Labor Market.” Quarterly Journal of Economics 118(4): 1335-74.
Card, David. 2001. “Immigrant Inflows, Native Outflows, and the Local Labor Market Impacts of Higher Immigration.” Journal of Labor Economics 19(1): 22-64.
Carliner, Geoffrey. 1980. “Wages, Earnings, and Hours of First, Second and Third Generation American Males.” Economic Inquiry 18(1): 87-102. Chiswick, Barry R. 1978. “The Effect of Americanization on the Earnings of Foreign-Born Men.” Journal of Political Economy 86(5): 897-921.
Duleep, Harriet Orcutt and Mark C. Regets. 1996. “Immigrant Entry Earnings and Human Capital Growth.” Research in Labor Economics 16: 297-317. Friedberg, Rachel M. and Jennifer Hunt. 1995. “The Impact of Immigration on Host Country Wages, Employment and Growth.” Journal of Economic Perspectives 9(2): 23-44. Jasso, Guillermina and Mark R. Rosenzweig. 1986. “What’s In a Name? Country-of-Origin Influences on the Earnings of Immigrants in the United States.” Research in Human Capital and Development 4:75-106.

20
LaLonde, Robert J. and Topel, Robert H. 1992. “The Assimilation of Immigrants in the U.S. Labor Market.” In Immigration and the Work Force: Economic Consequences for the United States and Source Areas, edited by George J. Borjas and Richard B. Freeman, 67-92. Chicago: University of Chicago Press. LaLonde, Robert J. and Robert H. Topel. 1996. “Economic impact of international migration and the economic performance of immigrants.” In Handbook of Population and Family Economics, Vol. 1, edited by Mark R. Rosenzweig and Oded Stark, 799-850. Amsterdam: North-Holland. Darren Lubotsky. 2007. “Chutes or Ladders? A Longitudinal Analysis of Immigrant Earnings.” Journal of Political Economy 115(5): 820-67. Passel, Jeffrey. 2005. “Unauthorized Migrants: Numbers and Characteristics.” Pew Hispanic Center. Yuengert, Andrew. “Immigrant Earnings, Relative to What? The importance of Earnings Function Specification and Comparison Points.” Journal of Applied Econometrics 9(1): 71-90.

21
Figure 1. Trends in the immigrant share of the population, 1970-2007
Sources: 1970-2000 decennial censuses, and the pooled 2005-2007 American Community Surveys.

22
Figure 2. Trends in log income differential between elderly immigrants and natives, by gender
Notes: The calculations use data drawn from the 1970-2000 decennial censuses, and the pooled 2005-2007 American Community Surveys. The income variable measures the personal income received by the elderly person from all sources.

23
Figure 3. Log income differential between elderly immigrants and natives, by years of residence in the United States
Notes: The calculations use data drawn from the 1970-2000 decennial censuses, and the pooled 2005-2007 American Community Surveys. The income variable measures the personal income received by the elderly person from all sources.

24
Figure 4. Scatter diagram relating relative income of elderly immigrants in 1990 and 2007, by national origin
Notes: The calculations use data drawn from the 1970-2000 decennial censuses, and the pooled 2005-2007 American Community Surveys. The income variable measures the personal income received by the elderly person from all sources.
25
Table 1. Income sources of elderly natives and immigrants
Natives
Immigrants Immigrants in U.S.
at least 10 years qj
(%) Income ($1000)
qj (%)
Income ($1000)
qj (%)
Income ( $1000)
1990: Total 19.6 16.8 17.9 Earnings 18.9 21.1 16.7 24.8 16.9 25.5 Investment 41.9 11.5 34.8 11.9 37.7 12.0 Social Security 84.3 8.2 71.3 8.2 77.2 8.3 Retirement 32.3 10.3 22.4 8.0 24.2 8.0 Public assistance 7.0 4.7 13.1 5.3 11.2 5.1 Other 6.0 5.4 3.4 5.4 3.6 5.4
2000: Total 24.9 19.1 20.7 Earnings 17.0 24.5 16.3 28.7 16.7 29.4 Investment 42.1 13.5 28.9 14.4 31.9 14.5 Social Security 86.2 9.1 66.5 8.4 73.0 8.5 Retirement 37.5 15.3 23.2 13.0 25.6 13.0 Public assistance 6.0 5.7 14.7 5.3 12.8 5.2 Other 11.4 11.1 11.7 8.3 11.7 8.7
2007: Total 23.2 17.1 18.4 Earnings 17.7 25.8 16.8 29.8 17.1 31.0 Investment 34.1 12.2 20.1 13.6 22.0 13.6 Social Security 91.0 9.0 71.2 7.9 77.3 8.0 Retirement 40.0 13.1 21.9 11.5 23.8 11.5 Public assistance 4.4 5.1 13.1 5.1 12.8 5.1 Other 9.0 10.6 6.3 9.0 6.7 9.1
Notes: The calculations use data drawn from the 1970-2000 decennial censuses, and the pooled 2005-2007 American Community Surveys. The variable qj gives the recipiency rate, the fraction of the relevant population that reported receiving the particular type of income. All mean incomes reported in the table (except for mean total income) are calculated in the subsample of persons that reported receiving the particular type of income.

26
Table 2. Shares of income sources for elderly natives and immigrants
Natives Immigrants
Immigrants in U.S. less than
10 years
Immigrants in U.S. more than
10 years 1990 Mean total income 19604.5 16777.3 7463.0 17859.4
Earnings 0.198 0.243 0.360 0.238 Investment 0.245 0.247 0.128 0.253 Social Security 0.354 0.350 0.187 0.358 Retirement 0.170 0.107 0.082 0.108 Public assistance 0.017 0.041 0.231 0.032 Other 0.017 0.011 0.011 0.011
2000 Mean total income 24893.0 19133.2 8586.0 20691.6
Earnings 0.164 0.241 0.340 0.235 Investment 0.227 0.216 0.109 0.223 Social Security 0.314 0.293 0.185 0.300 Retirement 0.230 0.158 0.110 0.161 Public assistance 0.014 0.041 0.175 0.032 Other 0.051 0.051 0.081 0.049
2007 Mean total income 23196.5 17101.2 6277.6 18406.6
Earnings 0.194 0.290 0.403 0.286 Investment 0.178 0.160 0.117 0.162 Social Security 0.352 0.330 0.204 0.336 Retirement 0.226 0.147 0.124 0.148 Public assistance 0.010 0.039 0.122 0.035 Other 0.041 0.033 0.031 0.033
Notes: The calculations use data drawn from the 1970-2000 decennial censuses, and the pooled 2005-2007 American Community Surveys.

27
Table 3a. Standardized differences between recent immigrants and natives, in 2000 census
Specification Dependent variable: (1) (2) (3) (4) (5) Log total income -.760 -.810 -.751 -.626 -.660 (.008) (.007) (.007) (.007) (.007) Earned income:
Fraction of time worked -.007 -.029 -.020 -.020 -.018 (.002) (.002) (.002) (.002) (.002) Log hourly income -.220 -.256 -.183 -.111 -.173
(.020) (.020) (.019) (.020) (.020) Investment income:
Recipiency rate -.337 -.339 -.299 -.190 -.190 (.004) (.003) (.003) (.003) (.003) Log income -.666 -.597 -.571 -.313 -.405
(.044) (.044) (.043) (.043) (.043) Social security income:
Recipiency rate -.639 -.634 -.627 -.566 -.555 (.002) (.002) (.002) (.002) (.002) Log income -.261 -.249 -.225 -.189 -.195
(.008) (.008) (.008) (.007) (.007) Other retirement income:
Recipiency rate -.300 -.302 -.278 -.234 -.236 (.003) (.003) (.003) (.003) (.003) Log income -.210 -.227 -.179 -.118 -.154
(.024) (.024) (.023) (.023) (.022) Public assistance income:
Recipiency rate .216 .222 .207 .187 .182 (.002) (.002) (.002) (.002) (.002) Log income .174 .155 .140 .093 .009
(.014) (.014) (.014) (.014) (.014) Controls for age, gender, race No Yes Yes Yes Yes Controls for education No No Yes Yes Yes Controls for marital status, family size, householder status
No No No Yes Yes
Controls for state of residence No No No No Yes Notes: Standard errors are reported in parentheses. An immigrant is “recent” if he or she has been in the country less than 10 years. The recipiency rate is a dummy variable set to unity if the person receives the particular type of income. The vector of variables measuring the person’s age includes dummy variables indicating if the person is 65-69, 70-74, 75-79, or at least 80 years old. The race variable indicates if the person is African-American. The education vector includes dummy variables indicating if the person is a high school dropout, a high school graduate, has some college, is a college graduate, or has post-college education.

28
Table 3b. Standardized differences between earlier immigrants and natives, in 2000 census
Specification Dependent variable: (1) (2) (3) (4) (5) Log total income -.223 -.227 -.180 -.150 -.182 (.003) (.002) (.002) (.002) (.002) Earned income:
Fraction of time worked .013 .010 .015 .013 .016 (.001) (.001) (.001) (.002) (.002) Log hourly income .072 .063 .064 .076 .013
(.007) (.007) (.007) (.007) (.007) Investment income:
Recipiency rate -.101 -.109 -.085 -.060 -.060 (.001) (.001) (.001) (.001) (.003) Log income .051 .059 .096 .137 .078
(.009) (.009) (.009) (.009) (.009) Social security income:
Recipiency rate -.132 -.134 -.131 -.116 -.108 (.001) (.001) (.001) (.001) (.001) Log income -.079 -.078 -.067 -.059 -.070
(.001) (.002) (.002) (.002) (.002) Other retirement income:
Recipiency rate -.120 -.118 -.104 -.095 -.099 (.001) (.003) (.003) (.001) (.001) Log income -.184 -.165 -.141 -.133 -.157
(.025) (.005) (.005) (.005) (.005) Public assistance income:
Recipiency rate .068 .072 .063 .058 .056 (.001) (.001) (.001) (.001) (.001) Log income .070 .058 .071 .044 -.036
(.014) (.008) (.008) (.009) (.009) Controls for age, gender, race No Yes Yes Yes Yes Controls for education No No Yes Yes Yes Controls for marital status, family size, householder status
No No No Yes Yes
Controls for state of residence No No No No Yes Notes: Standard errors are reported in parentheses. An immigrant is an “earlier” arrival if he or she has been in the country at least 10 years. The recipiency rate is a dummy variable set to unity if the person receives the particular type of income. The vector of variables measuring the person’s age includes dummy variables indicating if the person is 65-69, 70-74, 75-79, or at least 80 years old. The race variable indicates if the person is African-American. The education vector includes dummy variables indicating if the person is a high school dropout, a high school graduate, has some college, is a college graduate, or has post-college education.
29
Table 4. Estimated aging and cohort effects, using pooled 1990-2007 data Cohort effects
Dependent variable: 1990-2007
cohort Pre-1990
cohort Assimilation effect
Log total income -.943 -.450 .304 (.005) (.006) (.006) Earned income:
Fraction of time worked -.033 -.018 .027 (.001) (.002) (.002) Log hourly income -.431 -.152 .233
(.014) (.016) (.016) Investment income:
Recipiency rate -.361 -.221 .152 (.002) (.003) (.003) Log income -.599 -.501 .530
(.032) (.032) (.032) Social security income:
Recipiency rate -.764 -.447 .360 (.002) (.002) (.002) Log income -.398 -.096 .056
(.006) (.006) (.006) Other retirement income:
Recipiency rate -.334 -.129 .040 (.002) (.002) (.002) Log income -.216 -.105 -.078
(.019) (.024) (.024) Public assistance income:
Recipiency rate .227 .103 -.054 (.001) (.001) (.001) Log income .332 .317 -.152
(.011) (.011) (.011) Notes: Standard errors are reported in parentheses. The cohort effects measure the difference (holding years-since-migration constant) between the outcome observed for the immigrant cohort and natives. The assimilation effect measures the difference (for a given cohort) between immigrants who have been in the country at least 10 years and immigrants who have been in the country fewer than 10 years. The regression adjusts for the person’s gender and age. The vector of variables measuring the person’s age includes dummy variables indicating if the person is 65-69, 70-74, 75-79, or at least 80 years old.

30
Table 5. Country of origin and income of elderly immigrants in 2007 Canada Mexico Cuba China Philippines VietnamLog total income 0.085 -0.897 -0.547 -0.604 -0.357 -0.855 Earned income:
Fraction time worked 0.106 0.121 0.122 0.072 0.177 0.113 Log hourly income 0.166 -0.433 -0.157 0.122 -0.025 -0.108
Investment income: Recipiency rate 0.375 0.056 0.119 0.204 0.135 0.066 Log income 0.213 -0.340 -0.049 -0.225 -0.527 -0.834
Social security income:
Recipiency rate 0.833 0.684 0.787 0.568 0.611 0.512 Log income 0.017 -0.320 -0.198 -0.324 -0.204 -0.298
Other retirement income:
Recipiency rate 0.377 0.128 0.182 0.147 0.225 0.102 Log income -0.024 -0.440 -0.420 -0.254 -0.023 -0.278
Public assistance income:
Recipiency rate 0.031 0.133 0.143 0.218 0.175 0.312 Log income 0.133 -0.031 0.054 0.278 0.287 0.388
Source: Pooled American Community Surveys, 2005-2007. All income figures are relative to natives.

31
Table 6. Main source countries of prime-age and elderly immigrants, 2007
Source countries of immigrants aged 18-64
Source countries of immigrants aged 65+
Percent of immigrants
Percent of immigrants
Mexico 32.4 Mexico 13.1 Philippines 4.4 Cuba 6.6 India 4.2 Philippines 5.6 China 3.2 China 5.5 El Salvador 3.1 Germany 5.5 Vietnam 3.1 Canada 5.2 Korea 2.7 Italy 4.4 Cuba 2.1 India 2.5 Dominican Republic 2.1 England 2.5 Guatemala 2.0 Vietnam 2.4
Source: Pooled American Community Surveys, 2005-2007.

32
Table 7. Forecasting the impact of a shift in national origin mix Actual mean, using
current national origin mix
Predicted mean, using future
national origin mix Log total income (relative to natives) -.377 -.553 Earned income:
Fraction time worked .126 .138 Log hourly income (relative to natives) .017 -.080
Investment income: Recipiency rate .201 .138 Log income (relative to natives) .089 -.025
Social security income: Recipiency rate .712 .650 Log income (relative to natives) -.138 -.213
Other retirement income: Recipiency rate .219 .170 Log income (relative to natives) -.182 -.226
Public assistance income: Recipiency rate .131 .146 Log income (relative to natives) .208 .170
Source: Pooled American Community Surveys, 2005-2007. All income figures are relative to natives.