image acquisition geometry analysis for the fusion of ... · new possibilities for optical and...
TRANSCRIPT
Image acquisition geometry analysis for the fusion of optical and radar remote sensing data Gintautas Palubinskas1, Peter Reinartz and Richard Bamler German Aerospace Center DLR, Germany German Aerospace Center DLR Remote Sensing Technology Institute Münchener Str. 20, 82234 Wessling, Germany E-mail: {[email protected], [email protected], [email protected]} Tel: {+49-8153-281490, +49-8153-282757, +49-8153-282673} Fax: {+49-8153-281444, +49-8153-281420} http://www.dlr.de/caf/ Author Posting. (c) 'Copyright Holder', 2010. This is the author's version of the work. It is posted here by permission of 'Copyright Holder' for personal use, not for redistribution. The definitive version was published in International Journal of Image and Data Fusion, Volume 1 Issue 3, September 2010. doi:10.1080/19479832.2010.484152 (http://dx.doi.org/10.1080/19479832.2010.484152)
1 Corresponding author
Fusion of optical and radar remote sensing data is becoming an actual topic recently in various application areas though the results are not always satisfactory. In this paper we analyze some disturbing aspects of fusing orthoimages from sensors having different acquisition geometries. These aspects arise due to errors in Digital Elevation Models (DEM), used for image orthorectification, and existence of 3D objects in the scene which are not accounted in the DEM. We analyze how these effects influence the ground displacement in orthoimages produced from optical and radar data. Further, we propose sensor formations with acquisition geometry parameters which allow to minimize or compensate for ground displacements in different orthoimages due to the above mentioned effects and to produce good prerequisites for the following fusion for specific application areas e.g. matching, filling data gaps, classification etc. To demonstrate the potential of the proposed approach two pairs of optical-radar data were acquired over the urban area – Munich city, Germany. The first collection of WorldView-1 and TerraSAR-X data followed the proposed recommendations for acquisition geometry parameters, whereas the second collection of IKONOS and TerraSAR-X data was acquired with accidental parameters. The experiment fully confirmed our ideas. Moreover, it opens new possibilities for optical and radar image fusion.
Keywords: image fusion; SAR; remote sensing; sensor formation; acquisition geometry
1. Introduction
Data fusion is a rapidly developing topic in various application areas during the last decades. Image fusion in remote sensing is one of them. However fusion of different sensor data such as optical and radar imagery is still a challenge. In this paper the term ‘radar’ is equivalent to Synthetic Aperture Radar (SAR). Though knowledge on data fusion is well spread over different communities there are quite few attempts of its definition. The first one is the so called JDL information fusion definition (JDL, 1991) popular in the military community. This definition is based on the functional model including processing levels and full control on sensors thus making it difficult to transfer to other communities. Another data fusion definition more suitable for a broader community is introduced in (Pohl, 1998) mainly emphasizing (and thus simultaneously limiting to) methods, tools and algorithms used. A more general definition is proposed in (Wald 1999, DFS): Data fusion is a formal framework in which are expressed the means and tools for the alliance of data originating from different sources. It aims at obtaining information of greater quality; the exact definition of 'greater quality' will depend upon the application. According this definition an alignment of information originating from different sources now becomes a part of the fusion process itself. There exist numerous remote sensing applications e.g. image matching and co-registration (Suri 2010), pan-sharpening (Klonus 2008), orthoimage generation, DEM generation (Eineder 2003), filling data gaps, object detection, recognition (Soergel 2008), reconstruction (Wegner 2009) and classification (Palubinskas 2008), change detection, etc which are already profiting or can profit significantly from data fusion.
For the fusion of data from sensors exhibiting different acquisition geometries such as optical and radar systems it is important to understand their influence on the fusion process and to optimize it if necessary. In this paper we analyze the effect of ground displacements in orthoimages of optical and radar sensors due to the height error in the DEM used during orthorectification process and 3D objects characteristics (height) for various data acquisition parameters such as sensor look angle (elevation) and look direction, satellite flight direction and sun illumination direction.
Already in 1990’s a same or opposite side complementarity data acquisition of optical and radar data was used for some special applications, e.g. stereo-mapping (Toutin 1995, 2000) and improvement of optical sensor models (Gonçalves 2002), but was limited to low resolution data (10-20 m). Our proposed sensor formation approach is general, can be applied in airborne and space borne case and is not limited to particular sensors or applications and, moreover, is aiming at using currently available very high resolution (meter) data. A 90° opposite side sensor formation experiment was not possible for former space borne satellites, whereas we present data of the first 90° experiment from space.
The paper is organized in the following way. First, the methodology used for
the proposed approach is presented in detail. Then, data used in experiments are described, followed by the presentation of experimental results, conclusion, and acknowledgments.
2. Methodology
In this section we analyze theoretically two effects: height error in DEM used during orthorectification process and 3D object height and their influence on ground displacements in orthoimages from optical and radar sensors. The study results in a proposal of several data acquisition parameters: sensor look angle (elevation) and look direction, satellite flight direction and sun illumination direction leading to an optimal sensor formation for the following optical and radar data fusion.
2.1 Influence of DEM height error
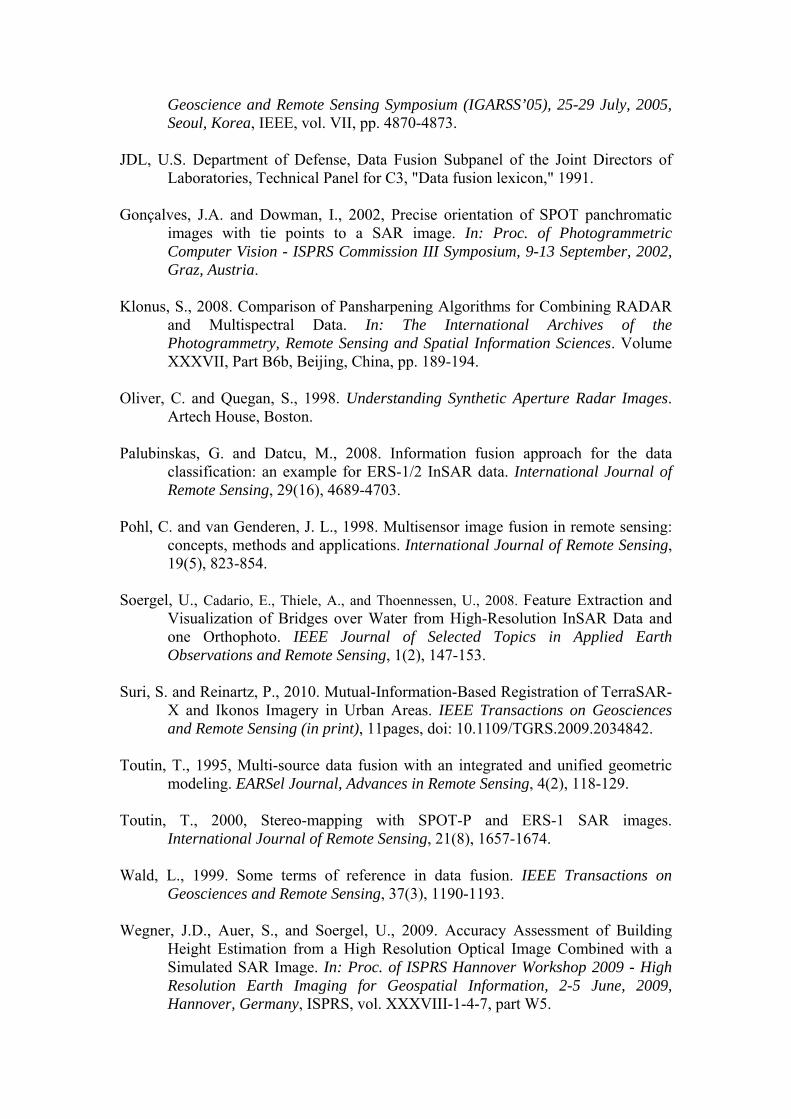
Ground displacements Δx due to the height error Δh in a flat DEM for an optical and a radar sensor orthoimage are shown in Figure 1. We see, that the direction of displacement depends on the sign of DEM error, e.g. for an optical sensor it is away from a sensor for Δh > 0 and towards a sensor for Δh < 0 (Fig. 1, left drawing). For a radar sensor the direction of displacement is the opposite way around, that is away from a sensor for Δh < 0 and towards a sensor for Δh > 0 (Fig. 1, right drawing). Ground displacements are equal to (e.g. Gonçalves 2002) optopt hx tan (1)
for optical sensors and
rad
rad
hx
tan
(2)
for radar sensors (except signs). We have to note, that formulae (2) is valid under an assumption of line propagation SAR geometry, which is only an approximation of true circle geometry (for more details see (Oliver, 1998)). For line approximation, e.g. for an orbit height of 500 km and an object height of 100 m a ground displacement error is about 24 cm (0.09%) for look angle of 20° and 1 cm (0.02%) for 50°. We think, this is negligible even for very high (meter) resolution imagery and most applications. Further, we would like to note that ground displacement changes in an across track direction over a scene due to dependency on a look angle. Especially for airborne sensors this effect should be accounted for in further analysis.
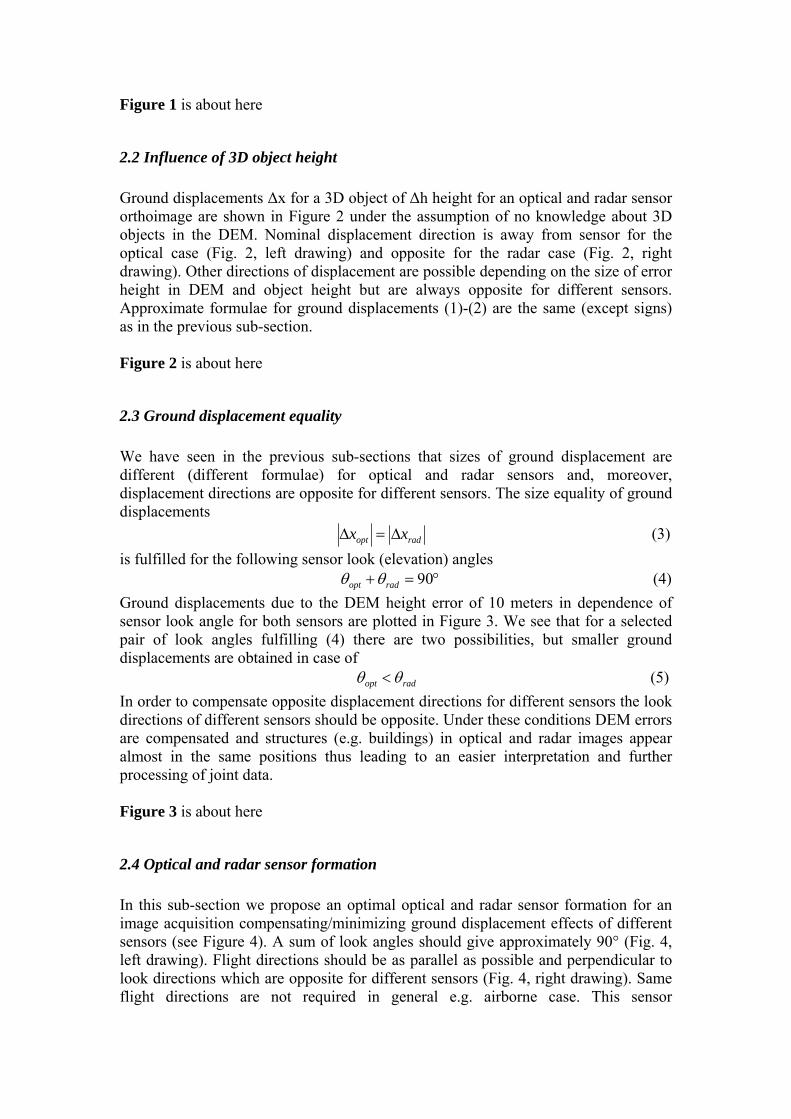
Figure 1 is about here
2.2 Influence of 3D object height
Ground displacements Δx for a 3D object of Δh height for an optical and radar sensor orthoimage are shown in Figure 2 under the assumption of no knowledge about 3D objects in the DEM. Nominal displacement direction is away from sensor for the optical case (Fig. 2, left drawing) and opposite for the radar case (Fig. 2, right drawing). Other directions of displacement are possible depending on the size of error height in DEM and object height but are always opposite for different sensors. Approximate formulae for ground displacements (1)-(2) are the same (except signs) as in the previous sub-section. Figure 2 is about here
2.3 Ground displacement equality
We have seen in the previous sub-sections that sizes of ground displacement are different (different formulae) for optical and radar sensors and, moreover, displacement directions are opposite for different sensors. The size equality of ground displacements
radopt xx (3)
is fulfilled for the following sensor look (elevation) angles 90radopt (4)
Ground displacements due to the DEM height error of 10 meters in dependence of sensor look angle for both sensors are plotted in Figure 3. We see that for a selected pair of look angles fulfilling (4) there are two possibilities, but smaller ground displacements are obtained in case of radopt (5)
In order to compensate opposite displacement directions for different sensors the look directions of different sensors should be opposite. Under these conditions DEM errors are compensated and structures (e.g. buildings) in optical and radar images appear almost in the same positions thus leading to an easier interpretation and further processing of joint data. Figure 3 is about here
2.4 Optical and radar sensor formation
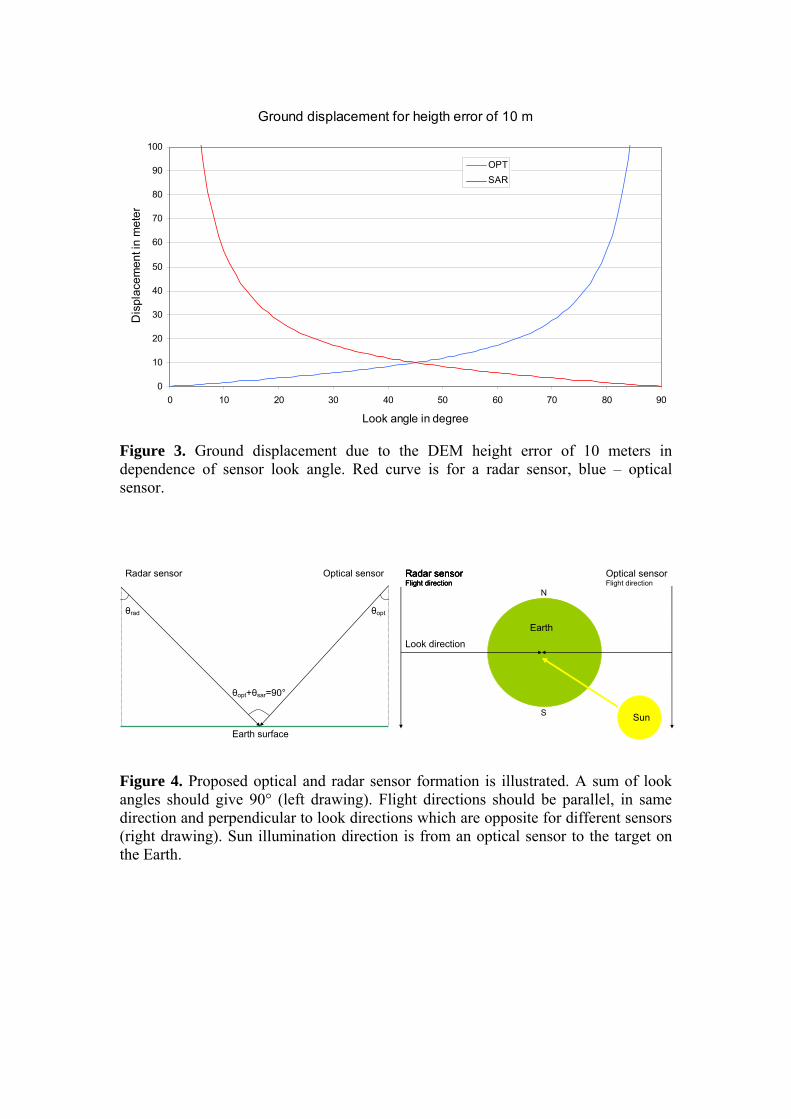
In this sub-section we propose an optimal optical and radar sensor formation for an image acquisition compensating/minimizing ground displacement effects of different sensors (see Figure 4). A sum of look angles should give approximately 90° (Fig. 4, left drawing). Flight directions should be as parallel as possible and perpendicular to look directions which are opposite for different sensors (Fig. 4, right drawing). Same flight directions are not required in general e.g. airborne case. This sensor
configuration allows e.g. a recovery of 3D object shadows during further data fusion, except a case when the Sun illumination direction is the same as for SAR look direction. Displayed left looking radar and right looking optical sensor formation can be preferable due to the Sun illumination direction which is from an optical sensor to the target on the Earth in order to see that side of a 3D object which is in shadow in the radar image and thus enable full reconstruction of a 3D object. Of course, the second possible sensor formation with a right looking radar and left looking optical sensor can be useful for data fusion too.
Our approach could be applied in both airborne and space borne remote sensing. As an example we consider a practical realization of the proposed formation for satellites. Currently, most space borne optical remote sensing satellites are acquiring data in descending mode, so a radar satellite should also acquire in a descending orbit. Thus both satellites would fly in the same direction (quasi-parallel orbits). The requirement of opposite look angles and a special sun illumination direction (optional) result in a left/right looking radar sensor and a right/left looking optical sensor what is achievable with current radar missions though not in a nominal mode (left looking radar). Additionally, larger look angle of SAR sensor than look angle of optical sensor allow minimizing the sizes of ground displacements. In the following sections the first 90° space borne experiment is described. Figure 4 is about here
3. Data
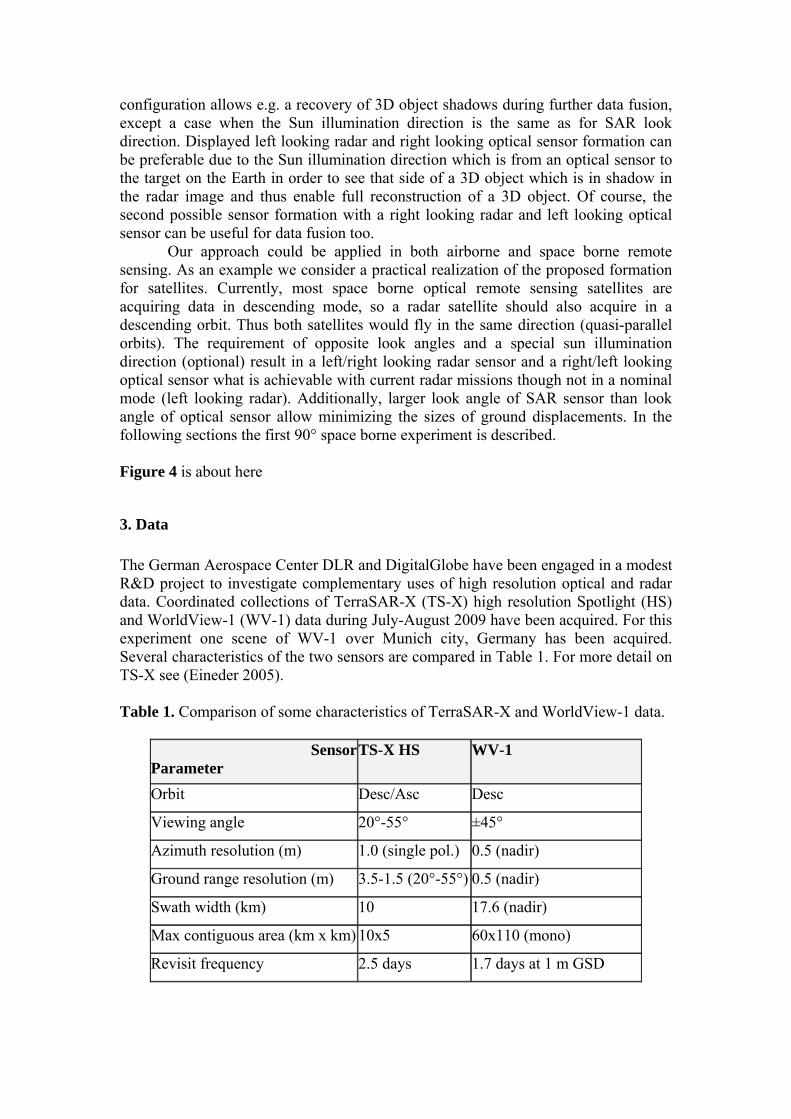
The German Aerospace Center DLR and DigitalGlobe have been engaged in a modest R&D project to investigate complementary uses of high resolution optical and radar data. Coordinated collections of TerraSAR-X (TS-X) high resolution Spotlight (HS) and WorldView-1 (WV-1) data during July-August 2009 have been acquired. For this experiment one scene of WV-1 over Munich city, Germany has been acquired. Several characteristics of the two sensors are compared in Table 1. For more detail on TS-X see (Eineder 2005). Table 1. Comparison of some characteristics of TerraSAR-X and WorldView-1 data.
SensorParameter
TS-X HS WV-1
Orbit Desc/Asc Desc
Viewing angle 20°-55° ±45°
Azimuth resolution (m) 1.0 (single pol.) 0.5 (nadir)
Ground range resolution (m) 3.5-1.5 (20°-55°) 0.5 (nadir)
Swath width (km) 10 17.6 (nadir)
Max contiguous area (km x km) 10x5 60x110 (mono)
Revisit frequency 2.5 days 1.7 days at 1 m GSD
Other scenes of the same urban area of TerraSAR-X and IKONOS have been ordered from existing archives.
4. Experiments
Two experiments, one with a proposed sensor formation and one with an accidental sensor formation were performed to show the potential of our approach. Geometrical alignment of orthoimages is an important pre-requisite for image fusion. The following approach was adopted. The optical images have been corrected for absolute position by ground control, which yielded a global shift value of approximately 10 m in across-track-direction for the WV-1 data and 6 m in across-track-direction and 2 m in along-track-direction for the IKONOS data in comparison to image rectification without ground control. TS-X data Enhanced Ellipsoid Corrected (EEC) product can be used without ground control, since absolute positioning Root Mean Square Error (RMSE) for the Spotlight mode is in the order of 1 m (Bresnahan, 2009).
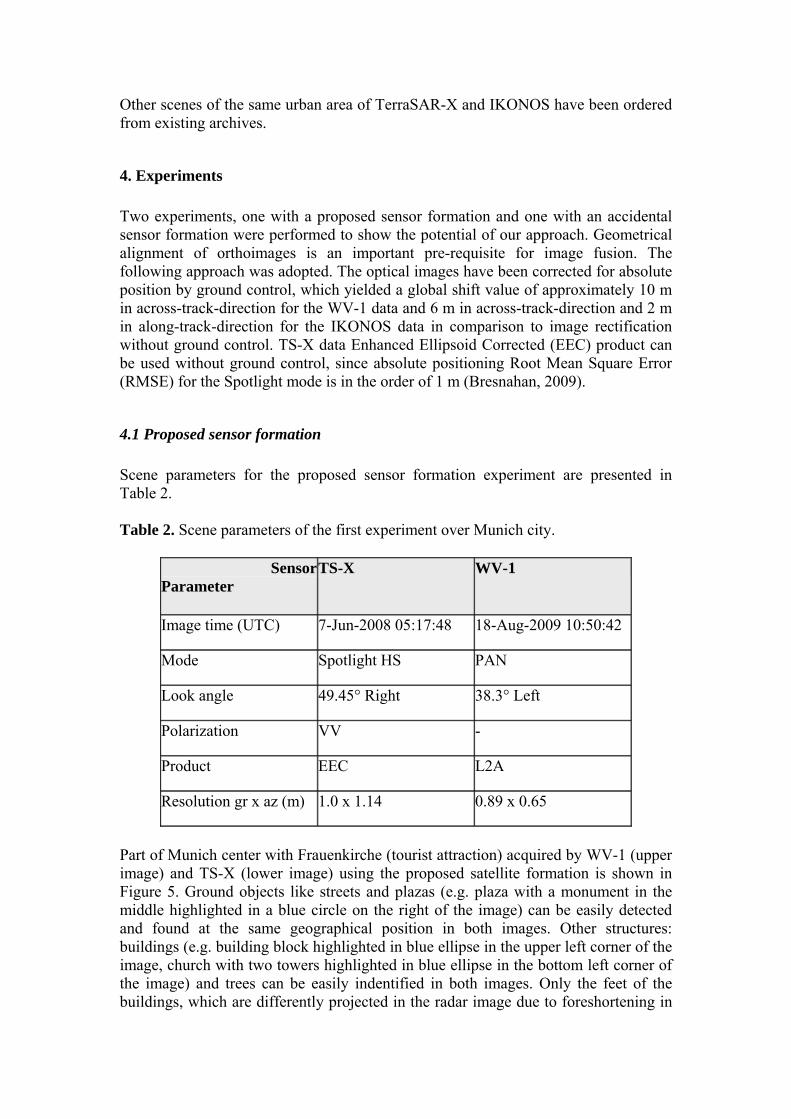
4.1 Proposed sensor formation
Scene parameters for the proposed sensor formation experiment are presented in Table 2. Table 2. Scene parameters of the first experiment over Munich city.
Sensor Parameter
TS-X WV-1
Image time (UTC) 7-Jun-2008 05:17:48 18-Aug-2009 10:50:42
Mode Spotlight HS PAN
Look angle 49.45° Right 38.3° Left
Polarization VV -
Product EEC L2A
Resolution gr x az (m) 1.0 x 1.14 0.89 x 0.65
Part of Munich center with Frauenkirche (tourist attraction) acquired by WV-1 (upper image) and TS-X (lower image) using the proposed satellite formation is shown in Figure 5. Ground objects like streets and plazas (e.g. plaza with a monument in the middle highlighted in a blue circle on the right of the image) can be easily detected and found at the same geographical position in both images. Other structures: buildings (e.g. building block highlighted in blue ellipse in the upper left corner of the image, church with two towers highlighted in blue ellipse in the bottom left corner of the image) and trees can be easily indentified in both images. Only the feet of the buildings, which are differently projected in the radar image due to foreshortening in
radar are found at slightly different positions. So the roofs and tree crowns are well in place and can be overlaid correctly for any further processing. A zoomed view of Frauenkirche with different proportions of optical and radar data overlay is shown in Figure 6 and provides a good impression of the complementary nature of different sensors. Figure 5 is about here Figure 6 is about here
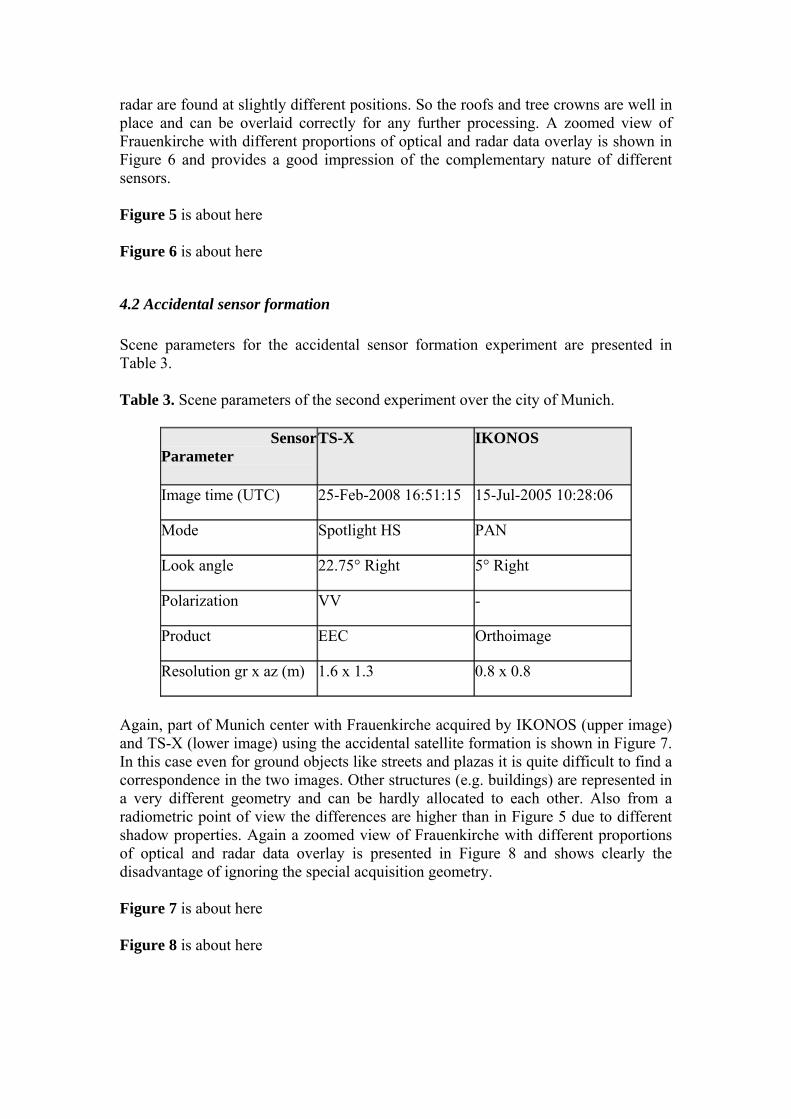
4.2 Accidental sensor formation
Scene parameters for the accidental sensor formation experiment are presented in Table 3. Table 3. Scene parameters of the second experiment over the city of Munich.
Sensor Parameter
TS-X IKONOS
Image time (UTC) 25-Feb-2008 16:51:15 15-Jul-2005 10:28:06
Mode Spotlight HS PAN
Look angle 22.75° Right 5° Right
Polarization VV -
Product EEC Orthoimage
Resolution gr x az (m) 1.6 x 1.3 0.8 x 0.8
Again, part of Munich center with Frauenkirche acquired by IKONOS (upper image) and TS-X (lower image) using the accidental satellite formation is shown in Figure 7. In this case even for ground objects like streets and plazas it is quite difficult to find a correspondence in the two images. Other structures (e.g. buildings) are represented in a very different geometry and can be hardly allocated to each other. Also from a radiometric point of view the differences are higher than in Figure 5 due to different shadow properties. Again a zoomed view of Frauenkirche with different proportions of optical and radar data overlay is presented in Figure 8 and shows clearly the disadvantage of ignoring the special acquisition geometry. Figure 7 is about here Figure 8 is about here
5. Conclusion
In this paper we address a fusion problem for very high resolution optical and radar satellite imagery. Alignment of image information coming from different sources is an important prerequisite for the following fusion in various applications. Especially for a rapid fusion of optical and radar data a specific imaging is of advantage. We propose an optical and radar sensor formation which accounts for different acquisition geometries and minimizes displacement differences for ground and 3D-objects in orthoimages of optical and radar sensors. The preferred sensor formation is a perpendicular viewing from the two sensor systems due to the complimentary nature of their viewing geometries. For this case the image geometries are nearly independent to errors in the underlying DEM and especially to buildings or other 3D objects, not represented in the DEM. A fast and consistent overlay of the two data sets for on ground and other surfaces is reached. As an example two pairs of high resolution optical (WorldView-1 and IKONOS) and radar (TerraSAR-X) images have been acquired over an urban area - Munich city in Germany – for different sensor formations. Results show a great potential of the proposed approach for further applications of data fusion with optical and radar instrumentation since the most geometric positions of the objects or object parts can be allocated at the same absolute position.
Acknowledgements We would like to thank our colleague Junyi Tao for valuable comments on the manuscript. Special thanks to DigitalGlobe for the collection and provision of WorldView-1 scene over Munich city, Germany and European Space Imaging (EUSI) for providing the IKONOS-2 scene.
References
Bamler, R. and Eineder, M., 2008. The Pyramids of Gizeh Seen by TerraSAR-X - A
Prime Example for Unexpected Scattering Mechanisms in SAR, IEEE Geoscience and Remote Sensing Letters, 5(3), 468 – 470.
Bresnahan, P., 2009. Absolute Geolocation Accuracy Evaluation of TerraSAR-X
Spotlight and Stripmap Imagery – Study Results, In: Proceedings of Civil Commercial Imagery Evaluation Workshop, 31 March – 2 April 2009, USGS, Fairfax Virginia, USA.
DFS, Data Fusion Server. Available from: http://www.data-fusion.org/ [Accessed 4
March 2010] Eineder, M., 2003. Problems and Solutions for InSAR DEM Generation of
Mountainous Terrain. In: Presentation at FRINGE 2003 Workshop, 1-5 December 2003, Frascati, Italy.
Eineder, M., Schättler, B., Breit, H., Fritz, T., and Roth, A., 2005. TerraSAR-X SAR
products and processing algorithms. In: Proc. of IEEE International
Geoscience and Remote Sensing Symposium (IGARSS’05), 25-29 July, 2005, Seoul, Korea, IEEE, vol. VII, pp. 4870-4873.
JDL, U.S. Department of Defense, Data Fusion Subpanel of the Joint Directors of
Laboratories, Technical Panel for C3, "Data fusion lexicon," 1991. Gonçalves, J.A. and Dowman, I., 2002, Precise orientation of SPOT panchromatic
images with tie points to a SAR image. In: Proc. of Photogrammetric Computer Vision - ISPRS Commission III Symposium, 9-13 September, 2002, Graz, Austria.
Klonus, S., 2008. Comparison of Pansharpening Algorithms for Combining RADAR
and Multispectral Data. In: The International Archives of the Photogrammetry, Remote Sensing and Spatial Information Sciences. Volume XXXVII, Part B6b, Beijing, China, pp. 189-194.
Oliver, C. and Quegan, S., 1998. Understanding Synthetic Aperture Radar Images.
Artech House, Boston. Palubinskas, G. and Datcu, M., 2008. Information fusion approach for the data
classification: an example for ERS-1/2 InSAR data. International Journal of Remote Sensing, 29(16), 4689-4703.
Pohl, C. and van Genderen, J. L., 1998. Multisensor image fusion in remote sensing:
concepts, methods and applications. International Journal of Remote Sensing, 19(5), 823-854.
Soergel, U., Cadario, E., Thiele, A., and Thoennessen, U., 2008. Feature Extraction and
Visualization of Bridges over Water from High-Resolution InSAR Data and one Orthophoto. IEEE Journal of Selected Topics in Applied Earth Observations and Remote Sensing, 1(2), 147-153.
Suri, S. and Reinartz, P., 2010. Mutual-Information-Based Registration of TerraSAR-
X and Ikonos Imagery in Urban Areas. IEEE Transactions on Geosciences and Remote Sensing (in print), 11pages, doi: 10.1109/TGRS.2009.2034842.
Toutin, T., 1995, Multi-source data fusion with an integrated and unified geometric
modeling. EARSel Journal, Advances in Remote Sensing, 4(2), 118-129. Toutin, T., 2000, Stereo-mapping with SPOT-P and ERS-1 SAR images.
International Journal of Remote Sensing, 21(8), 1657-1674. Wald, L., 1999. Some terms of reference in data fusion. IEEE Transactions on
Geosciences and Remote Sensing, 37(3), 1190-1193. Wegner, J.D., Auer, S., and Soergel, U., 2009. Accuracy Assessment of Building
Height Estimation from a High Resolution Optical Image Combined with a Simulated SAR Image. In: Proc. of ISPRS Hannover Workshop 2009 - High Resolution Earth Imaging for Geospatial Information, 2-5 June, 2009, Hannover, Germany, ISPRS, vol. XXXVIII-1-4-7, part W5.
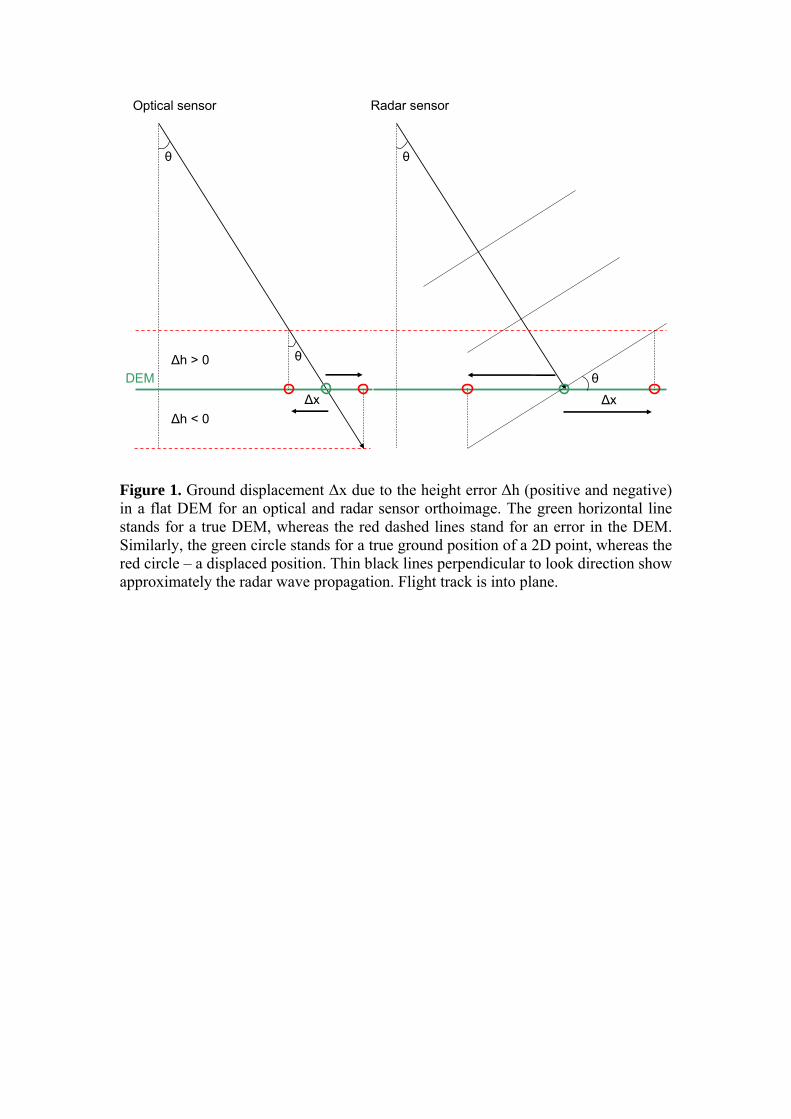
Figure 1. Ground displacement Δx due to the height error Δh (positive and negative) in a flat DEM for an optical and radar sensor orthoimage. The green horizontal line stands for a true DEM, whereas the red dashed lines stand for an error in the DEM. Similarly, the green circle stands for a true ground position of a 2D point, whereas the red circle – a displaced position. Thin black lines perpendicular to look direction show approximately the radar wave propagation. Flight track is into plane.
θ
Δh > 0
Δx
Optical sensor
θ
Δh < 0
DEM
θ
Δx
Radar sensor
θ
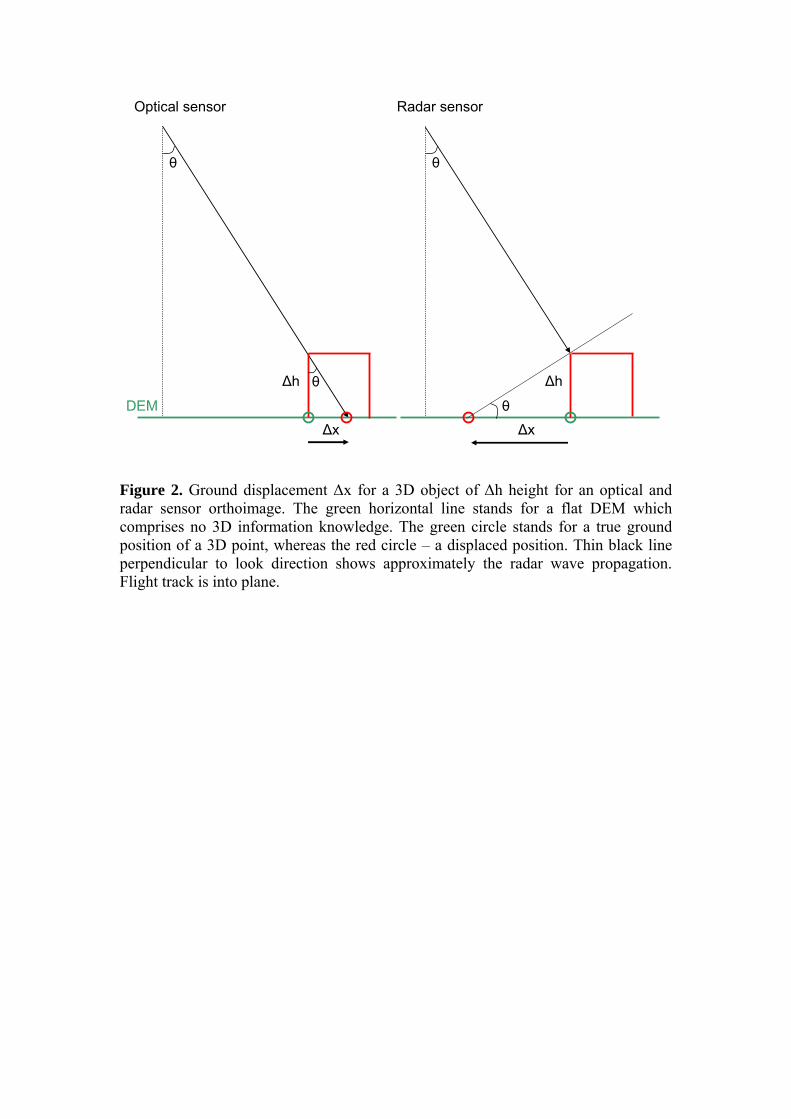
Figure 2. Ground displacement Δx for a 3D object of Δh height for an optical and radar sensor orthoimage. The green horizontal line stands for a flat DEM which comprises no 3D information knowledge. The green circle stands for a true ground position of a 3D point, whereas the red circle – a displaced position. Thin black line perpendicular to look direction shows approximately the radar wave propagation. Flight track is into plane.
θ
Δh
Δx
Optical sensor
θ
DEM
θ
Δh
Δx
Radar sensor
θ
Ground displacement for heigth error of 10 m
0
10
20
30
40
50
60
70
80
90
100
0 10 20 30 40 50 60 70 80 90
Look angle in degree
Dis
pla
cem
ent i
n m
ete
r
OPT
SAR
Figure 3. Ground displacement due to the DEM height error of 10 meters in dependence of sensor look angle. Red curve is for a radar sensor, blue – optical sensor. Figure 4. Proposed optical and radar sensor formation is illustrated. A sum of look angles should give 90° (left drawing). Flight directions should be parallel, in same direction and perpendicular to look directions which are opposite for different sensors (right drawing). Sun illumination direction is from an optical sensor to the target on the Earth.
θrad
Radar sensor Optical sensor
θopt
θopt+θsar=90°
Earth surface
Radar sensor Flight direction
Optical sensorFlight direction
Radar sensor Flight direction Radar sensor Flight direction
Look direction
Sun
Earth
N
S
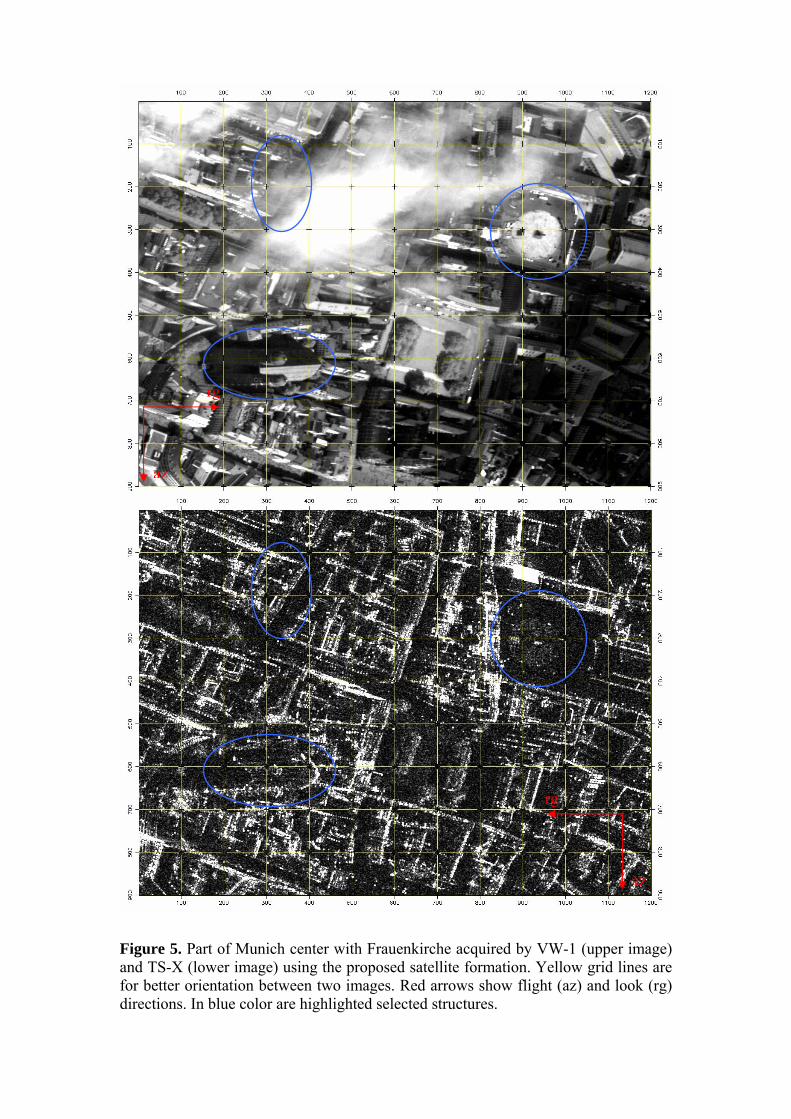
Figure 5. Part of Munich center with Frauenkirche acquired by VW-1 (upper image) and TS-X (lower image) using the proposed satellite formation. Yellow grid lines are for better orientation between two images. Red arrows show flight (az) and look (rg) directions. In blue color are highlighted selected structures.
rg
az
rg
az
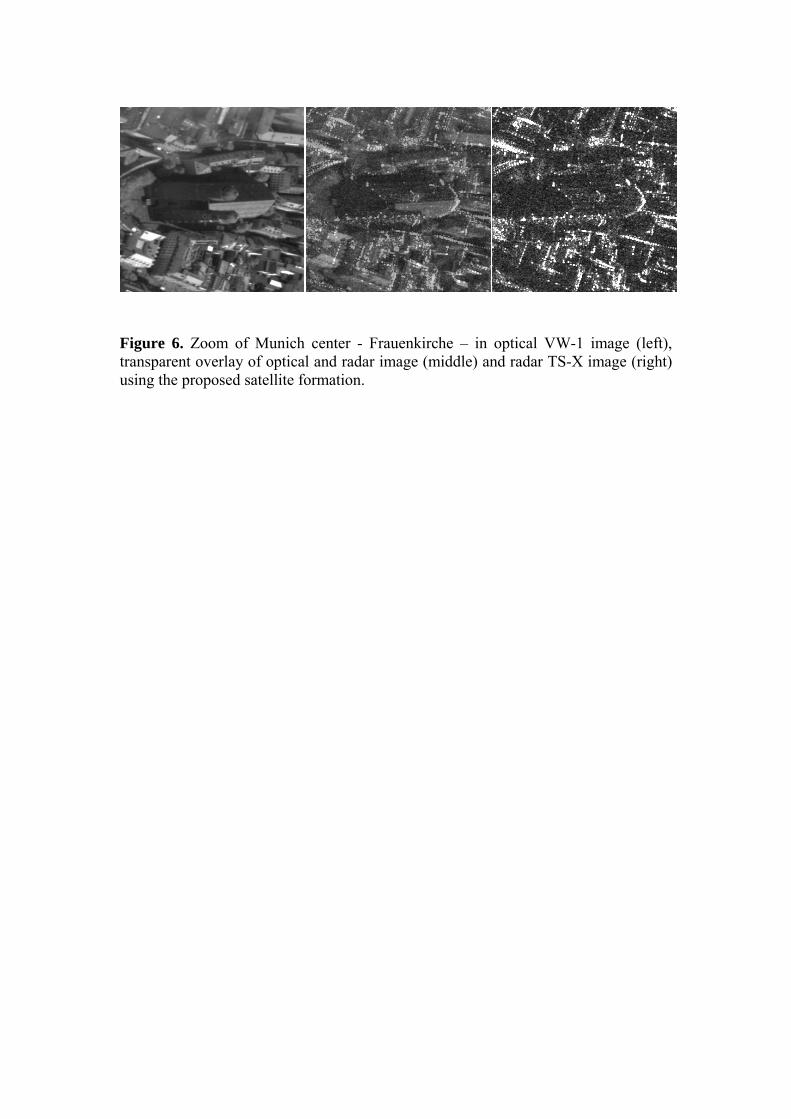
Figure 6. Zoom of Munich center - Frauenkirche – in optical VW-1 image (left), transparent overlay of optical and radar image (middle) and radar TS-X image (right) using the proposed satellite formation.
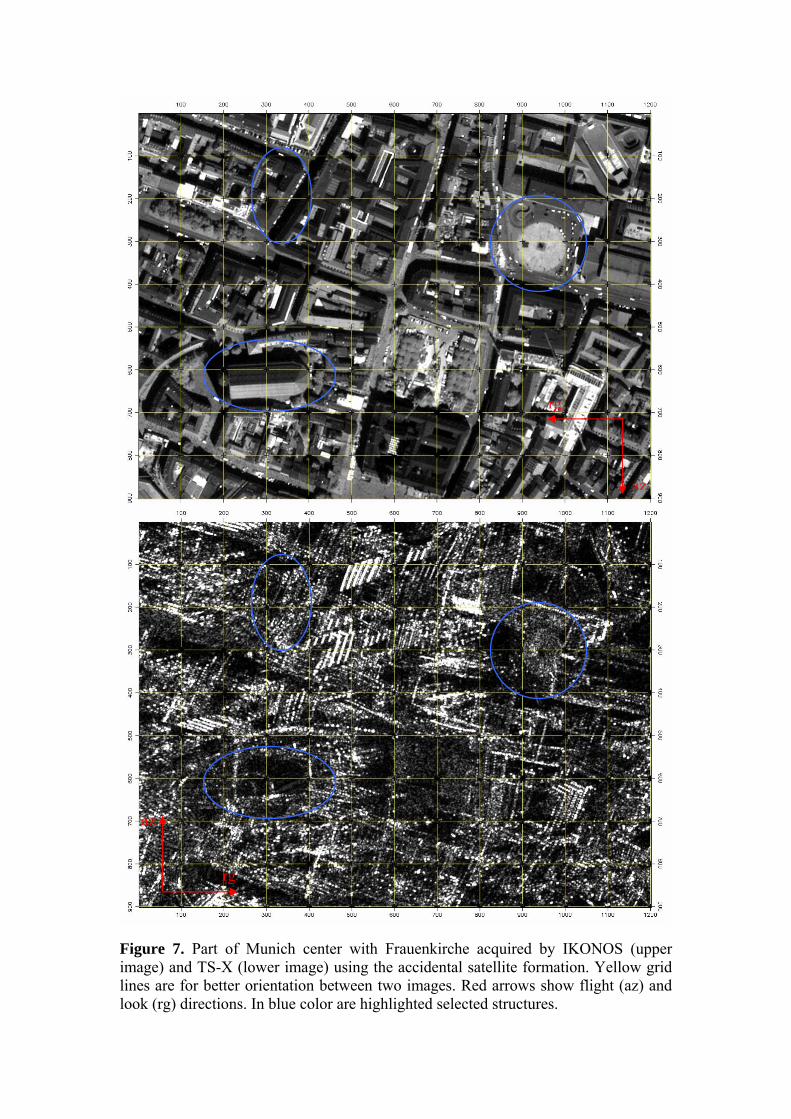
Figure 7. Part of Munich center with Frauenkirche acquired by IKONOS (upper image) and TS-X (lower image) using the accidental satellite formation. Yellow grid lines are for better orientation between two images. Red arrows show flight (az) and look (rg) directions. In blue color are highlighted selected structures.
rg
az
rg
az
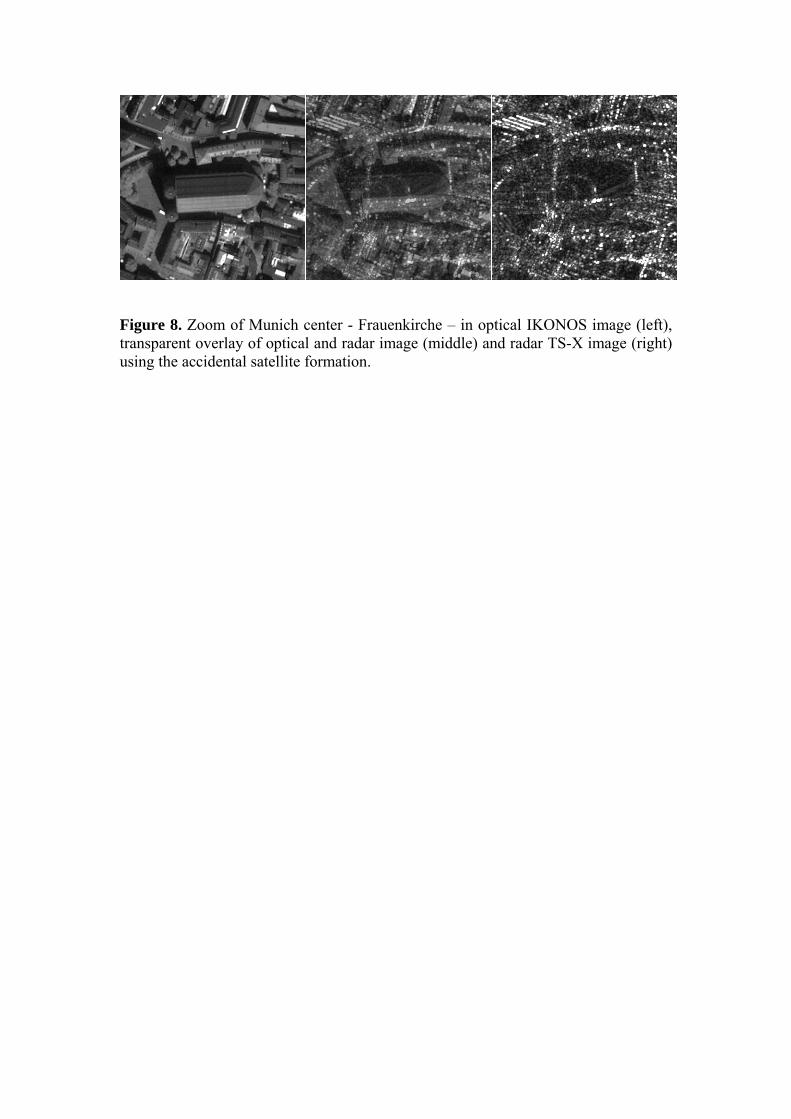
Figure 8. Zoom of Munich center - Frauenkirche – in optical IKONOS image (left), transparent overlay of optical and radar image (middle) and radar TS-X image (right) using the accidental satellite formation.