illinois community college board - eric · stated anot her way, community college annual...
TRANSCRIPT


i
Illinois Community College Board
STUDENT ENROLLMENTS AND COMPLETIONS IN THEILLINOIS COMMUNITY COLLEGE SYSTEM — FISCAL YEAR 2004
TABLE OF CONTENTSPage
Introduction . . . . . . . . . . . . . . . . . . . . . . . . . . . . . . . . . . . . . . . . . . . . . . . . . . . . . . . . . . . . . . . . . . . . . . . . . . . . . . . . . . . . . . . . . . . . . . . . iiHighlights of Fiscal Year 2004 Annual Report . . . . . . . . . . . . . . . . . . . . . . . . . . . . . . . . . . . . . . . . . . . . . . . . . . . . . . . . . . . . . . . . . . . . . iiiOverall Fiscal Year 2004 Student Enrollments . . . . . . . . . . . . . . . . . . . . . . . . . . . . . . . . . . . . . . . . . . . . . . . . . . . . . . . . . . . . . . . . . . . . 1Fiscal Year 2004 Student Credit Enrollments . . . . . . . . . . . . . . . . . . . . . . . . . . . . . . . . . . . . . . . . . . . . . . . . . . . . . . . . . . . . . . . . . . . . . . 2
Student Credit Enrollment by Community College . . . . . . . . . . . . . . . . . . . . . . . . . . . . . . . . . . . . . . . . . . . . . . . . . . . . . . . . . . . . 2Male/Female Distribution . . . . . . . . . . . . . . . . . . . . . . . . . . . . . . . . . . . . . . . . . . . . . . . . . . . . . . . . . . . . . . . . . . . . . . . . . . . . . . . 2Ethnic Origin . . . . . . . . . . . . . . . . . . . . . . . . . . . . . . . . . . . . . . . . . . . . . . . . . . . . . . . . . . . . . . . . . . . . . . . . . . . . . . . . . . . . . . . . . 2Student Age . . . . . . . . . . . . . . . . . . . . . . . . . . . . . . . . . . . . . . . . . . . . . . . . . . . . . . . . . . . . . . . . . . . . . . . . . . . . . . . . . . . . . . . . . . 2Summary of Enrollments by Instructional Program Area . . . . . . . . . . . . . . . . . . . . . . . . . . . . . . . . . . . . . . . . . . . . . . . . . . . . . . . 3Enrollment Hours by Term and Type of Attendance . . . . . . . . . . . . . . . . . . . . . . . . . . . . . . . . . . . . . . . . . . . . . . . . . . . . . . . . . . 5Highest Degree Earned by Students Prior to Attending Community College . . . . . . . . . . . . . . . . . . . . . . . . . . . . . . . . . . . . . . . . 5Attempted Versus Earned Credit Hours . . . . . . . . . . . . . . . . . . . . . . . . . . . . . . . . . . . . . . . . . . . . . . . . . . . . . . . . . . . . . . . . . . . . 5
Accumulated College-Level Credits . . . . . . . . . . . . . . . . . . . . . . . . . . . . . . . . . . . . . . . . . . . . . . . . . . . . . . . . . . . . . . . . . . . . . . . 6Grade Point Averages . . . . . . . . . . . . . . . . . . . . . . . . . . . . . . . . . . . . . . . . . . . . . . . . . . . . . . . . . . . . . . . . . . . . . . . . . . . . . . . . . . 6High School Graduation Percentile Rank . . . . . . . . . . . . . . . . . . . . . . . . . . . . . . . . . . . . . . . . . . . . . . . . . . . . . . . . . . . . . . . . . . . 6ACT Scores of Community College Students . . . . . . . . . . . . . . . . . . . . . . . . . . . . . . . . . . . . . . . . . . . . . . . . . . . . . . . . . . . . . . . . 6
Fiscal Year 2004 Student Noncredit Course Enrollments . . . . . . . . . . . . . . . . . . . . . . . . . . . . . . . . . . . . . . . . . . . . . . . . . . . . . . . . . . . . . 7Student Noncredit Enrollment by Community College . . . . . . . . . . . . . . . . . . . . . . . . . . . . . . . . . . . . . . . . . . . . . . . . . . . . . . . . 7Characteristics of Noncredit Students . . . . . . . . . . . . . . . . . . . . . . . . . . . . . . . . . . . . . . . . . . . . . . . . . . . . . . . . . . . . . . . . . . . . . . 8Noncredit Category of Activity (Duplicated) . . . . . . . . . . . . . . . . . . . . . . . . . . . . . . . . . . . . . . . . . . . . . . . . . . . . . . . . . . . . . . . . 9Largest Noncredit Offerings (Duplicated) . . . . . . . . . . . . . . . . . . . . . . . . . . . . . . . . . . . . . . . . . . . . . . . . . . . . . . . . . . . . . . . . . . . 9Noncredit Term Attendance (Duplicated) . . . . . . . . . . . . . . . . . . . . . . . . . . . . . . . . . . . . . . . . . . . . . . . . . . . . . . . . . . . . . . . . . . . 10Noncredit Enrollment Distribution by Site/Location (Duplicated) . . . . . . . . . . . . . . . . . . . . . . . . . . . . . . . . . . . . . . . . . . . . . . . . 10
Fiscal Year 2004 Completions . . . . . . . . . . . . . . . . . . . . . . . . . . . . . . . . . . . . . . . . . . . . . . . . . . . . . . . . . . . . . . . . . . . . . . . . . . . . . . . . . 11Degrees and Certificates Awarded by Community College . . . . . . . . . . . . . . . . . . . . . . . . . . . . . . . . . . . . . . . . . . . . . . . . . . . . 11Degrees and Certificates Awarded by Program Categories . . . . . . . . . . . . . . . . . . . . . . . . . . . . . . . . . . . . . . . . . . . . . . . . . . . . 11Summary of Graduates by Degree Categories . . . . . . . . . . . . . . . . . . . . . . . . . . . . . . . . . . . . . . . . . . . . . . . . . . . . . . . . . . . . . . . 12
Summary . . . . . . . . . . . . . . . . . . . . . . . . . . . . . . . . . . . . . . . . . . . . . . . . . . . . . . . . . . . . . . . . . . . . . . . . . . . . . . . . . . . . . . . . . . . . . . . . . 14Appendix A: Credit Enrollment Data Tables . . . . . . . . . . . . . . . . . . . . . . . . . . . . . . . . . . . . . . . . . . . . . . . . . . . . . . . . . . . . . . . . . . . . . 15Appendix B: Noncredit Course Enrollment Data Tables . . . . . . . . . . . . . . . . . . . . . . . . . . . . . . . . . . . . . . . . . . . . . . . . . . . . . . . . . . . . 38Appendix C: Completion Data Tables . . . . . . . . . . . . . . . . . . . . . . . . . . . . . . . . . . . . . . . . . . . . . . . . . . . . . . . . . . . . . . . . . . . . . . . . . . 54

ii
Student Enrollments and CompletionsFiscal Year 2004
INTRODUCTION
The colleges in the Illinois Community College System submit detailed student records twice during each fiscal year. Fall opening enrollment(E1) data for credit-generating students are recorded by the colleges at the end of the regular fall registration period, which is usually the 10thday of the term. Annual student enrollment and completion (A1) data are reported for the small number of individuals who are officially enrolledat the college in credit coursework at any time during the fiscal year. An A1 record is also submitted for students who graduate, but are notofficially enrolled during the year. The N1 submission includes data on noncredit course enrollment. Since fiscal year 1999 the IllinoisCommunity College System has been using a noncredit enrollment database to house demographic and course information on the wide rangeof noncredit instruction provided annually. Previously, between fiscal year 1994 and 1998, only aggregate noncredit enrollment data wasgathered through the use of an annual survey. During the transition period (1999 through 2002), both detailed data (N1) and aggregate data(internet survey) were gathered. In fiscal year 2003, the transition to the N1 data system as the source of noncredit information was complete.
Fall enrollment data provide a point-in-time or "snapshot" of opening fall term enrollment allowing year-to-year and institution-to-institutioncomparisons and are comparable to fall enrollment data in postsecondary institutions nationwide. Looking at the fall and annual data for fiscalyear 2004 shows the substantial differences between the coverage of these submissions for Illinois community colleges. During the fall termincluded in fiscal year 2004, there were 365,019 students enrolled in credit coursework in public community colleges at the start of the semester.During the entire fiscal year of 2004, a total of 698,707 students took credit coursework at the colleges. Hence, over one-half of the students whoattended a community college during the entire fiscal year of 2004 were enrolled at the beginning of the fall term. Stated another way, communitycollege annual enrollments are nearly twice as large as the fall credit opening enrollments reflect. In the noncredit arena, the differences are evenmore pronounced as fall noncredit data only accounted for 31.5 percent of the annual 2004 noncredit enrollments. Hence, annual data more fullycaptures the impact of the community college system.
The diversity of the community college system and its students are best captured in annual student enrollment and completion records. . Students"stop in and out" of college according to their individual needs and may not always be enrolled at the beginning of a fall semester. The increasein module classes adds to the complexity of tabulating student enrollments at any given point-in-time. Additionally, with elevated emphasis onstudent outcomes and program effectiveness, analyses of student completions have become increasingly important. Therefore, the analyses inthis report focuses on annual enrollment and completion data in an effort to provide the most comprehensive and accurate information available.
This year’s report is based on fiscal year 2004 enrollments and completions and comparative information is supplied from the four previous fiscalyears (2000-2003) are also presented. Detailed tables comparing fiscal year 2003 and fiscal year 2004 credit headcount, full-time equivalent(FTE) enrollments, and graduates by college are included. FTE enrollments in this report are based on all credit hours attempted (includingnonreimbursable credit hours).

iii
Student Enrollments and CompletionsFiscal Year 2004
HIGHLIGHTS OF FISCAL YEAR 2004 ANNUAL REPORT Student Enrollments
< The Illinois Community College System recorded a totalapproaching one million (959,081) students in credit and noncreditcourses in fiscal year 2004, a decrease of 1.2 percent since fiscalyear 2003.
< Credit-generating students accounted for 72.9 percent of the overallfiscal year 2004 headcount.
< During fiscal year 2004, the 48 public community colleges in Illinoisenrolled 698,707 students in instructional credit courses. This is anincrease of 0.8 percent from the previous year. The full-timeequivalent (FTE) enrollment was 245,184, a slight increase of 2.6percent since fiscal year 2003.
< Statewide, 26,363 noncredit course sections were conducted duringfiscal year 2004.
< From fiscal year 2003 to fiscal year 2004, the number of individualsreceiving instruction through noncredit course offerings decreased6.1 percent to 260,374 students.
< Statewide, 31,484 of 959,081 total students enrolled in both creditand noncredit courses during fiscal year 2004 (A1 and N1). Whilethere is some overlap, these data suggest that credit and noncreditcourses are meeting largely different student and community needs.
< Females comprised 55.9 percent of the fiscal year 2004 studentpopulation enrolled in credit-generating programs.
< Minority (non-white) students accounted for over one-third (35.7percent) of the credit students enrolled. Black student representationrose to 14.6 percent, its highest level in the past five years. Hispanicstudent representation decreased slightly to 15.8 percent. Asianstudent representation remained the same at 4.5 percent, whileforeign/nonresident alien representation decreased minimally to 0.5percent.
< The median age of credit-generating students was 26.3 during fiscalyear 2004, slightly younger than the previous year. Likewise, theaverage age decreased slightly to 30.9 years.
< Baccalaureate/transfer remained the largest credit instructionalprogram area enrolling 37.7 percent of fiscal year 2004 IllinoisCommunity College System students. Enrollments in Baccalaureate/transfer programs increased 1.9 percent from last year.
< Statewide, career and technical education credit programenrollments accounted for more than one-quarter of all creditstudents (27.3 percent). Enrollments in occupational programsincreased 2.1 percent from the previous year.
< Although 37.7 percent of the fiscal year 2004 credit studentpopulation was enrolled in the baccalaureate/transfer area, only 29.5percent of all students indicated an intent to transfer.
< Students enrolled in adult education courses in community collegescomprised 18.1 percent of the credit generating students. Enrollmentin adult education decreased by 3.9 percent over fiscal year 2003.
< Of the students in adult education, approximately 58.3 percent wereenrolled in English as a Second Language (ESL) courses. This isdown slightly from 58.7 percent in fiscal year 2003.
< More than one-half (52.0 percent) of the fiscal year 2004 creditstudents enrolled in the colleges indicated that they were notpursuing a degree, but attending to complete one or several courses.Participation in college to take courses instead of pursue a degree orcertificate decreased by 2.7 percent over last year.

iv
Student Enrollments and CompletionsFiscal Year 2004
HIGHLIGHTS OF FISCAL YEAR 2004 ANNUAL REPORT(Continued)
Student Enrollments
< Nearly three-out-of-four credit students attended on a part-time basisduring both the fall (70.9 percent) and spring (72.9 percent)semesters in fiscal year 2004.
< Over 18 percent of the credit-generating students are known toalready have earned some type of college certificate or degree. Thisincludes 38,090 who earned a bachelors degree or higher which isan increase of 370 over last year.
< Illinois community college students were enrolled in 7,355,508credit hours throughout fiscal year 2004 and earned 76.3 percent ofthose hours.
< Accumulated credit hours were available for 69.6 percent of thefiscal year 2004 student population. Of that percentage, 33.4 percenthad accumulated 30 or more college-level hours (sophomore level).
< Cumulative grade point average data was reported for 66.4 percentof the fiscal year 2004 students. Over 46 percent (46.4) held an A-Baverage.
< Noncredit course enrollment figures in the report for fiscalyear 2004 were generated by the Noncredit Course Enrollment Datasubmission (N1).
< Fiscal year 2004 unduplicated noncredit headcount decreased6.1 percent over last year. Similarly, the duplicated headcount or“seatcount” was 7.9 percent lower than the previous year.
< Female students accounted for 57.1 percent of 2004 noncreditenrollments for which gender data were reported.
< Minority students accounted for about one-quarter of the individualsenrolled in noncredit programs who supplied racial/ethnic data.
< Just over one-half of the noncredit students were 40 years of age orabove based on the individuals who supplied this information.
< Fifty-four percent of the noncredit offerings (duplicated) were in thepersonal and social development category of activity. Nearly 30percent of the noncredit coursework were dedicated to developingworkplace skills: professional/vocational (20.6 percent) andbusiness and industry contractual training (9.2 percent).
< Across all categories of activity, eight programs (two-digit CIP) hadover 8,000 noncredit students enrolled. These eight program areasaccounted for approximately 65.2 percent of the students enrolled innoncredit courses where CIP data were reported. Thirty-eightpercent of these enrollments are in work related programs: businessmanagement (19.2 percent), transportation workers (10.1 percent),health professions (4.7 percent) and computer information systems(4.0 percent).
< Instructional site information shows that 61.2 percent of thenoncredit courses offered in 2004 were held on main collegecampuses.

v
Student Enrollments and CompletionsFiscal Year 2004
HIGHLIGHTS OF FISCAL YEAR 2003 ANNUAL REPORT(Continued)
Student Completions
< Collegiate-level degrees and certificates were awarded to 47,986students at Illinois community colleges in fiscal year 2004,5.9 percent more than in fiscal year 2003.
< Baccalaureate/transfer degrees were earned by 14,022 studentsduring the fiscal year, an increase of 3.1 percent since 2003.Baccalaureate/transfer degrees accounted for 29.2 percent of allcompletions.
< Nearly 69 percent of all fiscal year 2004 collegiate degrees andcertificates were earned through completion of career and technicaleducation programs.
< Students successfully completed 33,080 career and technicaleducation degrees and certificates in Illinois community collegesduring fiscal year 2004, a 7.2 percent increase from the previousyear.
< Approximately 26.4 percent of the career and technical educationawards in fiscal year 2004 were AAS degrees.
< Females accounted for 57.0 percent of all completions during fiscalyear 2004. A similar proportion was reflected in the career andtechnical education program areas. In the baccalaureate/ transferprograms females accounted for 61.2 percent of the completions .
< The largest number of male (9,546) and female (9,248) completersof a specific degree or certificate was in the career and technicaleducation certificate of less than one year program.
< Although small in number (103), the Associate in EngineeringScience program had the highest proportion of male graduates (81.6percent).
< Minority students earned nearly 30 percent of the collegiate-leveldegrees and certificates granted in the Illinois community collegesystem during fiscal year 2004. Black students earned 15.1 percent,Hispanic students earned 8.2 percent and Asian students earned 5.7percent of all degrees and certificates.
< Minorities accounted for more than nineteen percent of totalbaccalaureate/transfer degree recipients. Black students accountedfor 8.6 percent, 6.8 percent were Hispanic, and 3.2 percent were ofAsian origin.
< More than four times as many minority graduates completedcareer and technical education degrees and certificates (11,242)than baccalaureate/transfer degrees (2,724).
< Among the largest minority groups, Black students completed 3,312more collegiate-level programs than Hispanic students.
< Approximately 12.3 percent of the students who were awardeddegrees and certificates during fiscal year 2004 were less than 21years of age. The age groups with the largest percentages ofgraduates were the 21 to 24 (30.7 percent), 25 to 30 (18.4 percent),and 40 to 55 year olds (18.4 percent).
< Nearly three-quarters of the students who successfully completedbaccalaureate/transfer degrees in fiscal year 2004 indicated an intentto transfer to a four-year institution.
< Nearly 22 percent of the fiscal year 2004 AAS degree graduatesindicated goals to only complete one or several courses or finish acertificate, not to earn an associate degree. This demonstrates thatstudents sometimes alter their goals as they progress through thecommunity college system.

Student Enrollments & CompletionsFiscal Year 2004
Page 1
Fig. 1. Overall Annual Enrollments, FY 2000-2004
OVERALL FISCAL YEAR 2004 STUDENT ENROLLMENTS
The Illinois Community College System recorded a total of 959,081 students during fiscal year 2004. This overall enrollment figure, whichincludes student enrollments in credit and noncredit courses, decreased 1.2percent since fiscal year 2003.
Table 1 provides a summary comparison of fiscal year 2000 through fiscalyear 2004 credit and noncredit unduplicated enrollments. Totalenrollments include those students who may be concurrently enrolled incredit-generating and noncredit courses during the fiscal year.
Table 1SUMMARY COMPARISON OF ANNUAL ENROLLMENTS
IN ILLINOIS PUBLIC COMMUNITY COLLEGESFISCAL YEARS 2000-2004
UnduplicatedHeadcount FY 00 FY 01 FY 02 FY 03 FY 04
Credit 668,676 666,491 676,412 693,285 698,707
% Change 2.8% -0.3% 1.5% 2.5% 0.8%
Noncredit** 339,351 313,094 269,249 277,220 260,374
% Change 5.7% -7.7% -14.0% 3.0% -6.1%
Total* 1,008,027 979,585 945,661 970,505 959,081
% Change 3.7% -2.8% -3.5% 2.6% -1.2%
*Includes individuals enrolled in credit and noncredit courses during the samefiscal year **FY 2001 and 2002 higher value generated by Noncredit Course Enrollment Data Submission (N1) or Annual Noncredit Enrollment SurveySOURCES OF DATA: Annual Enrollment (A1) Records Annual Noncredit Enrollment Surveys or N1 Records
Comparisons of fiscal year 2000 through fiscal year 2004 unduplicatedcredit and noncredit headcount enrollments for each community collegeare provided in Appendix tables A-1 and B-1, respectively.
As depicted in Figure 1, credit-generating students account for 72.9percent of the overall fiscal year 2004 headcount. An examination of thefive-year period indicates that the proportion of credit-generating studentshas increased 6.6 percent since fiscal year 2000, when the proportion ofcredit-generating students was 66.3 percent of the overall studentpopulation. There was a noncredit enrollment decrease from fiscal year2000 to 2002 followed by an increase in 2003; however, over the pastyear, noncredit enrollment decreased again to the lowest level during thefive-year period.
Statewide, 31,484 students of the 959,081 total enrolled in both credit andnoncredit courses during fiscal year 2004 (A1 and N1). While there issome overlap, these data suggest that credit and noncredit courses aremeeting largely different student and community needs.

Student Enrollments & CompletionsFiscal Year 2004
Page 2
FISCAL YEAR 2004 STUDENT CREDIT ENROLLMENTS
Student Credit Enrollment by Community CollegeAnnual credit enrollment for fiscal year 2004 was 698,707, and full-timeequivalent (FTE) students totaled 245,184. Table 2 contains comparativeenrollment data for the last five years. Fiscal year 2004 total headcountenrollment increased slightly by 0.8 percent from the previous year, andfiscal year 2004 FTE enrollment increased by 2.6 percent. Headcountenrollments have increased 4.5 percent since 2000, while FTEenrollments have increased 12.8 percent. Historically, headcountenrollments reached an all-time high of 727,310 in fiscal year 1992. FTEenrollments reached a record high of 245,184 during the most recentfiscal year.
Table 2COMPARISON OF ANNUAL CREDIT ENROLLMENTS
IN ILLINOIS PUBLIC COMMUNITY COLLEGESFISCAL YEARS 2000-2004
FY 00 FY 01 FY 02 FY 03 FY 04
Headcount 668,676 666,491 676,412 693,285 698,707
% Change 2.8% -0.3% 1.5% 2.5% 0.8%
FTE 217,311 218,843 228,089 238,894 245,184
% Change 0.3% 0.7% 4.2% 4.7% 2.6%
SOURCE OF DATA: Annual Enrollment (A1) Records
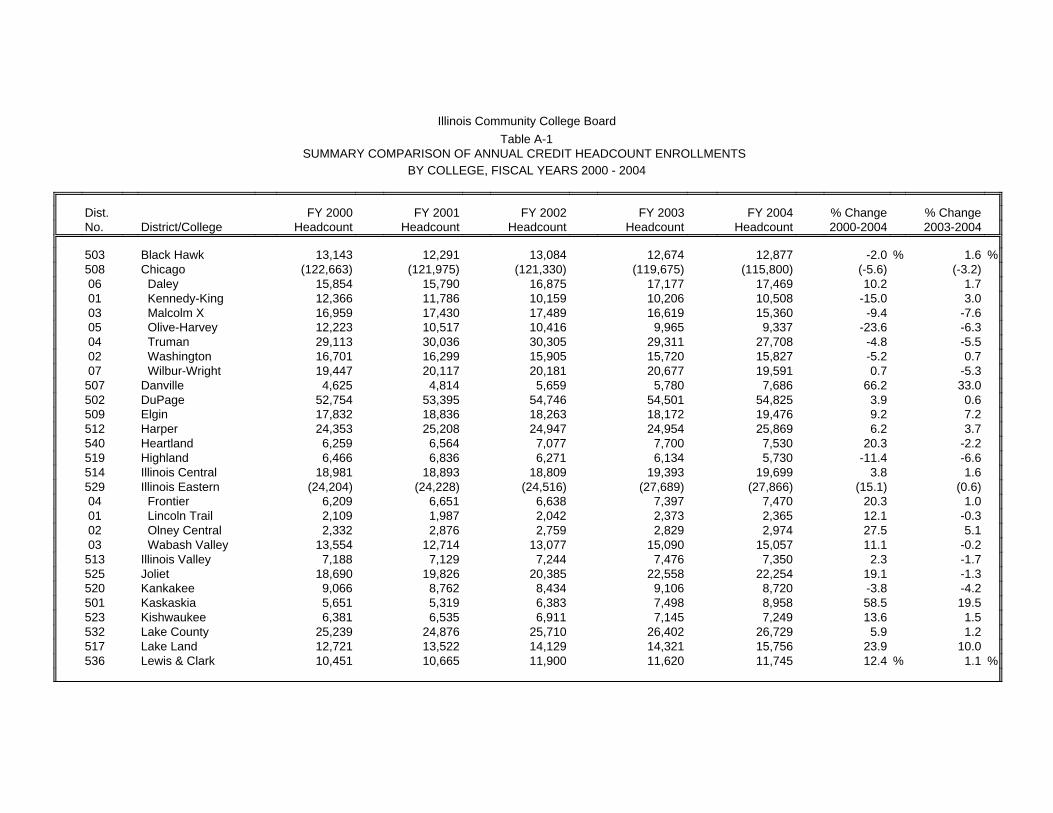
Table A-1 in the appendix provides a comparison of fiscal year 2000through fiscal year 2004 headcount enrollments for each communitycollege. Of the 48 community colleges, 24 colleges experiencedincreases in headcount while 17 exhibited decreases during fiscal year2004. Seven colleges experienced little or no change (1.0 percent or less)during fiscal year 2004. Table A-2 contains a comparison of FTEenrollments for fiscal years 2000 through 2004 and indicates that 32colleges experienced increases in FTE during fiscal year 2004, elevenexperienced decreases, and five colleges experienced little or no change.
Male/Female DistributionThe male/female distribution of students typically fluctuates little fromyear to year. Females comprised 55.9 percent of the student populationin fiscal year 2004. The percentage of male students has averaged 44.4percent over the past five years (see Table A-3).
Ethnic OriginIn fiscal year 2004, just over one-third (35.7 percent) of those attendingcredit courses in community colleges were minority (non-white) students.Minority representation remained virtually the same from fiscal year 2003to fiscal year 2004. During the past five years, minorities have comprisedan average of just over one-third (35.0 percent) of the student population.Hispanic students (now numbering 109,782) became the largest minoritygroup in 2000, followed by Black students (now numbering 101,453). Infiscal year 2004, the number of African American students enrolled inIllinois community colleges increased by 2.1 percent and the number ofHispanic students enrolled decreased slightly by 0.4 percent (see TableA-4).
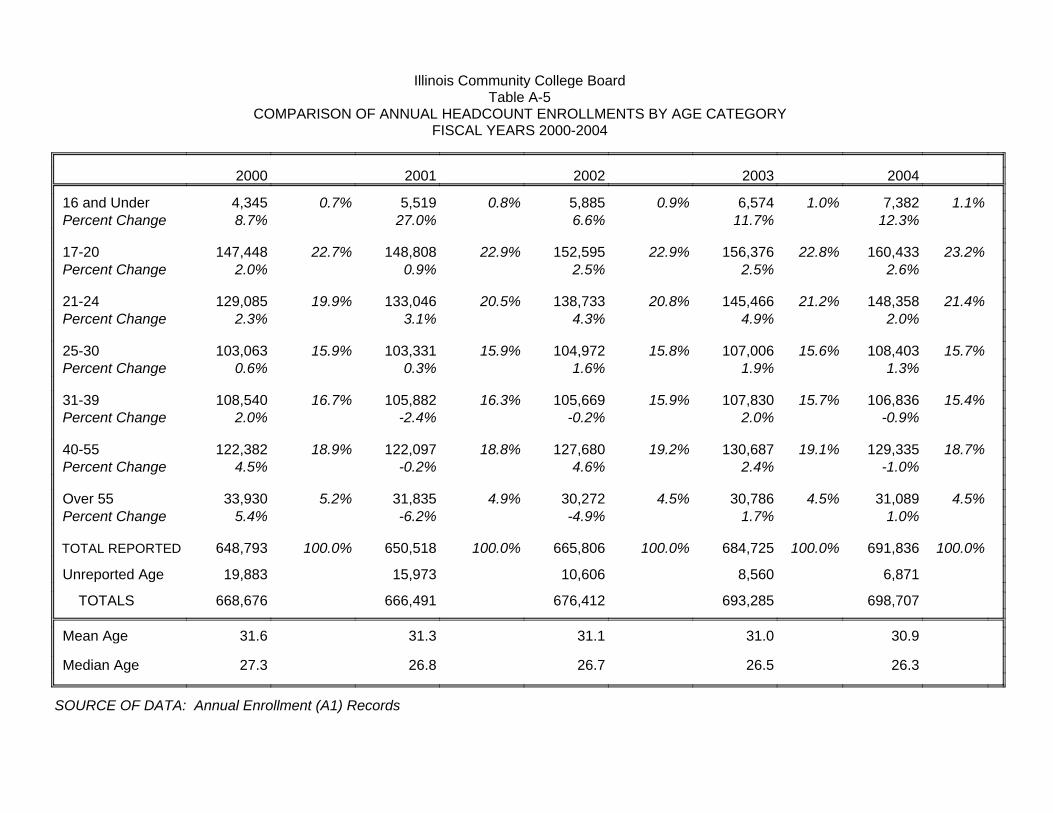
Student AgeIn fiscal year 2004, the average age of the Illinois community collegestudent was 30.9 years, slightly younger than in fiscal year 2003. Themedian age was 26.3 years, again slightly younger than last year. Thelargest proportion of students (23.2 percent) was age 17 through 20, apercent change increase of 2.6 percent over fiscal year 2003. The secondlargest proportion of students (21.4 percent) was age 21 through 24, apercent change increase of 2.0 percent over fiscal year 2003. The thirdlargest proportion of students (18.7 percent) was age 40 through 55, apercent change decrease of 1.0 percent over fiscal year 2003. Duringfiscal year 2004, 15.4 percent of students were age 31 through 39 and15.7 percent were age 25 through 30. Always the smallest in size, the 16and under age group grew substantially (12.3 percent change), but stillrepresented only 1.1 percent of the student population in fiscal year 2004(see Table A-5).

Student Enrollments & CompletionsFiscal Year 2004
Page 3
Summary of Enrollments by Instructional Program AreaThe baccalaureate/transfer program is the largest instructional programoffered in the Illinois Community College System. Statewide, enrollmentin this program area has increased 1.9 percent over the past year and 16.0percent from fiscal year 2000 to 2004.
Career and technical education programs are the second largest creditprogram in the Illinois Community College System. Career and technicaleducation enrollments have increased 2.1 percent over last year and 8.4percent over the most recent five-year period. In the past year,enrollment in vocational skills programs increased by 0.3 percent andenrollment in general studies certificates decreased by 12.9 percent.Enrollment in general associate degree programs increased by 13.0percent in fiscal year 2004 (see Table A-6a).
Students enrolled in adult education courses comprised 18.1 percent ofthe credit generating students in fiscal year 2004. Hence, nearly one outof five community college students is enrolled in adult education skillsbuilding coursework. Statewide, there was a 3.9 percent decrease in adulteducation enrollments over the previous year. In fiscal year 2004, 58.3percent of the students in adult education were enrolled in English as aSecond Language (ESL) courses. This is down slightly from 58.7 percentin fiscal year 2003.
The City Colleges of Chicago account for 41.0 percent of statewidecommunity college adult education enrollment. Adult educationenrollment at the City Colleges of Chicago decreased compared to lastyear (-7.0 percent). This coincides with the decrease in overall enrollment(-3.2 percent) for City Colleges of Chicago. Excluding the City Collegesof Chicago, there was a 1.7 percent decrease in adult educationenrollment in fiscal year 2004. Hence, across the rest of the communitycollege system, there is less of a decrease in adult education enrollments.(see Table A-6a and A-6b).
Excluding the City Colleges of Chicago, the remainder of the systemexperienced a long-term increase in enrollments (6.8 percent) across allinstructional program areas between 2000 and 2004. Analysis ofinstructional program area information, excluding City Colleges of
Chicago data, produces mostly positive results. A moderate long-termincrease was exhibited in baccalaureate/transfer programs (12.4 percent)between fiscal years 2000 and 2004. Adult education growth was 12.6percent over the same five-year period. The general associate programsrecorded 21.0 percent growth, excluding the City Colleges of Chicago.There was a moderate increase (8.4 percent) in career and technicaleducation program enrollment and a moderate decrease (-9.7 percent) invocational skills program enrollment (see Table A-6b).
Instructional Program Enrollments by Gender. During fiscal year 2004,females outnumbered males in all instructional areas; the adult education(ABE/ASE/ESL) programs contained the highest proportion of malestudents (46.8 percent). The highest proportion of female students wereenrolled in the general associate degree program (61.6 percent) followedclosely by the general studies certificate program (60.7 percent). Thebaccalaureate/transfer program consisted of 58.4 percent female students,while 54.6 percent of those enrolled in vocational programs were female(see Table A-7).
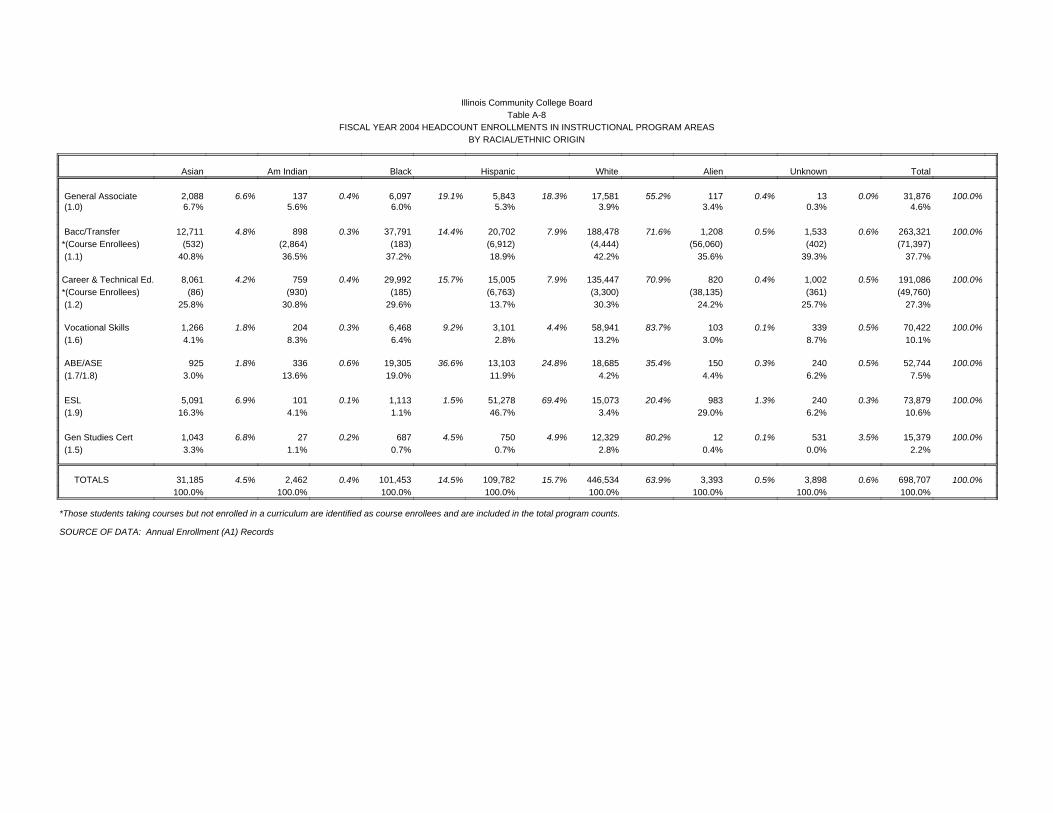
Instructional Program Enrollments by Racial/Ethnic Origin. Figure 2illustrates the distribution of minorities in the two largest program areas,baccalaureate/transfer and career/ technical education. An examination ofeach racial/ethnic group's representation across program areas in fiscalyear 2004 indicates that the largest percentage of white (42.2 percent),Asian (40.8 percent), Black (37.2 percent), American Indian (36.5percent), and Nonresident Alien students (35.6 percent) were enrolled inbaccalaureate/transfer programs. The highest percentage of Hispanic(46.7 percent) students and were enrolled in English as a SecondLanguage programs. Overall, minority students were least represented inthe vocational skills (16.3 percent), general studies certificate (19.8percent), and baccalaureate/transfer (28.4 percent) areas (see Table A-8).
Instructional Program Enrollments by Age. During fiscal year 2004, 45.3percent of community college students were under 25 years of age. Morethan half (52.6 percent) of the students under 25 were enrolled inbaccalaureate/transfer programs.

Student Enrollments & CompletionsFiscal Year 2004
Page 4
Fig. 2. Fiscal Year 2004 Minority Enrollments in Baccalaureate/Transfer and Career/ Technical Education Programs
Overall, almost one-third (30.8 percent) of the student population wasbetween 25-39 years of age. Approximately 31.4 percent of students inthis age group were enrolled in the career and technical educationprogram area, while 28.8 percent were enrolled in baccalaureate/transferprograms. More than one-fifth (22.9 percent) of Illinois' communitycollege students were at least 40 years of age. Nearly one-third (31.8percent) of students 40 years of age and older were enrolled in career andtechnical education programs. Students 40 years of age and older alsohad substantial enrollment in vocational skills (24.4 percent) andbaccalaureate/transfer (21.1 percent) programs (see Table A-9).
Largest Occupational Programs. An examination of career and technicaleducation curricula with at least 5,000 students enrolled during either ofthe last two years revealed some changes in the top five curriculaaccording to program size. With 14,160 students, Associate DegreeNursing remained the largest program, as enrollment increased by 9.1
percent (1,179 students). Criminal Justice Technology (N = 8,231)became the second largest program as it increased by 4.1 percent (321students). Likewise, Child Care Provider/Assistant, increased moderately(4.2 percent; 324 students) and became the third largest program in 2004.Business Data Programming was the fourth largest program as it droppeda substantial 21.2 percent (1,953 students) since the previous year.Business Administration & Management showed a slight decrease inenrollment of 1.8 percent (-107 students), remaining the fifth largestprogram (see Table A-10).
Instructional Program Enrollments by Intent. Intent data convey theprimary goal that the student wants to achieve as a result of his/herstudies. Intent data are self-reported by students when they initiallyenroll at the college. Students are asked to update this informationperiodically by providing a current intent, as well as entry intent. Anexamination of the intent data across program areas illustrates thediversity of student interests and needs that Illinois community collegesserve. Three goals combined represent the aspirations of 60.9 percent ofcommunity college students: 29.5 percent were preparing for transfer toa four-year institution, 14.9 percent were improving their basic skills/preparing for the GED, and 16.5 percent were preparing for a jobimmediately after community college.
Examination of student intent by program area reveals interestingobservations. With the exception of adult education, career and technicaleducation, and baccalaureate/transfer programs, less than half of thestudents in any program area were pursuing the particular goal most oftenassociated with a given major. Only 57.8 percent of those studentsenrolled in baccalaureate/transfer programs indicated they intended totransfer to a four-year institution. Similarly, just 61.2 percent of thestudents in career and technical education programs enrolled with theintent of preparing for a job after community college or to improve theirpresent job skills. About three-quarters (75.3 percent) of the ABE/ASEand ESL students listed a desire to remedy basic skills deficiencies or toprepare for the GED test as their reason for enrolling in these programs(see Table A-11).

Student Enrollments & CompletionsFiscal Year 2004
Page 5
Instructional Program Enrollments by Degree Objective. Degreeobjective data are also self-reported and are designed to assist colleges inclassifying students by curriculum or course enrollee category. Theobjective conveys the student's expected outcome from attending thecommunity college. In fiscal year 2004, 52.0 percent of all studentsindicated that they were enrolling with no intention of pursuing adegree — only to complete one or several courses. A review of studentobjectives by program area reveals expected results: 58.6 percent of thebaccalaureate/transfer students planned to complete an associate degree,while 36.8 percent were interested in completing one or several courses.Less than half (43.4 percent) of the career and technical educationstudents indicated they expected to complete an associate degree, while34.4 percent expected to complete one or several courses. Nearly 22percent wanted to complete a certificate. These data illustrate the varietyof aspirations among students enrolled in community college career andtechnical education programs. While many students complete an entireprogram, others simply want to improve their current skills or obtain newskills to enter a different career. In ESL, general studies, ABE/ASE, andvocational programs, the vast majority (93.9; 95.0; 92.1; and 92.2percent, respectively) of students planned only to complete one or severalcourses (see Table A-12).
Enrollment Hours by Term and Type of AttendanceMore than nine out of ten students (91.1 percent) attending during thesummer term of fiscal year 2004 were part-time (less than nine credithours). Almost 71 percent of the students attended college on a part-time(less than 12 credit hours) basis during the fall semester. The part-timeproportion was slightly higher (72.9 percent) in the spring. In a patternnot typical among higher education institutions, Illinois communitycolleges enrollment during the fall (413,159) and spring semesters(417,560) was similar (see Table A-13). Statewide, 234,434 studentsattended in both the fall and spring semesters.
Highest Degree Earned by Students Prior to AttendingCommunity College
The prior earned degree data reiterate that community colleges servediverse populations. Figure 3 illustrates the educational background offiscal year 2004 students. Among the 65.6 percent of students whoreported their prior degrees (excluding adult education students whowould typically not possess earned degrees), 18.1 percent earned sometype of postsecondary certificate or degree. More than 14 percent hadalready earned degrees at or beyond the community college level (seeTable A-14).
Attempted vs. Earned Credit HoursAt all colleges and universities, there are students who, for a variety ofreasons, are unable or unwilling to complete the requirements for theclass(es) in which they enroll. In fiscal year 2004, Illinois communitycollege students completed 5,612,241 credit hours, 76.3 percent of theirattempted hours. Overall, full-time students earned a higher percent ofattempted hours than did part-time students (see Table A-15).

Student Enrollments & CompletionsFiscal Year 2004
Page 6
Accumulated College-Level Credit HoursOf the 486,233 students (69.6 percent) for whom data were available,about two-thirds (66.6 percent) had accumulated less than 30 college-level hours (freshman level). Nearly 20 (19.8) percent had accumulatedbetween 30 to 59 credit hours (sophomore status), and 13.6 percentearned 60 or more credit hours (See Table A-16).
Grade Point AveragesCumulative grade point average data were available for 66.4 percent ofthe students enrolled in fiscal year 2004. Approximately 82.7 percent ofthe students had grade point averages of 2.01 or above, which is a “C”average or higher. Slightly more than 36 percent had achieved gradepoint averages between 2.01 and 3.00 (“C” to “B”), while 46.4 percenthad achieved grade point averages in the 3.01 to 4.00 (“B” to “A”) range(see Table A-17).
High School Graduation Percentile RankHigh school class rank was reported for 14.4 percent of the fiscalyear 2004 community college students. Of this population, 4.2 percentwere in the top 10 percent of their graduating class, while 47.3 percentgraduated in the top half of their class (see Table A-18).
ACT Scores of Community College StudentsACT score data were available for 12.4 percent of the students enrolledin fiscal year 2004. Slightly over 60 (60.2) percent of the studentsreceived a 19 or higher on the ACT exam. A minimum of 18 on the ACTexam is typically required for acceptance into many colleges oruniversities. For those fiscal year 2004 students from whom data weregathered, the average ACT score was 19.8. The median score was 20.0(see Table A-19).
Student Enrollments & CompletionsFiscal Year 2004
Page 7
FISCAL YEAR 2004 STUDENT NONCREDIT COURSE ENROLLMENTS
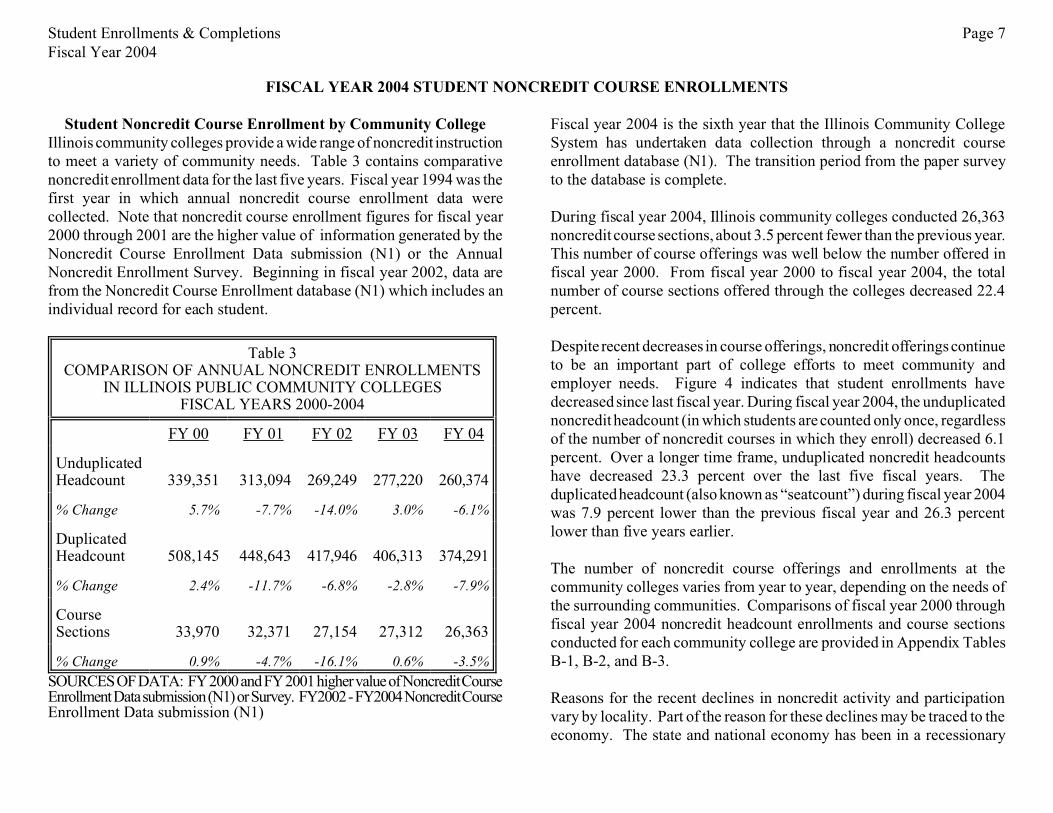
Student Noncredit Course Enrollment by Community CollegeIllinois community colleges provide a wide range of noncredit instructionto meet a variety of community needs. Table 3 contains comparativenoncredit enrollment data for the last five years. Fiscal year 1994 was thefirst year in which annual noncredit course enrollment data werecollected. Note that noncredit course enrollment figures for fiscal year2000 through 2001 are the higher value of information generated by theNoncredit Course Enrollment Data submission (N1) or the AnnualNoncredit Enrollment Survey. Beginning in fiscal year 2002, data arefrom the Noncredit Course Enrollment database (N1) which includes anindividual record for each student.
Table 3COMPARISON OF ANNUAL NONCREDIT ENROLLMENTS
IN ILLINOIS PUBLIC COMMUNITY COLLEGESFISCAL YEARS 2000-2004
FY 00 FY 01 FY 02 FY 03 FY 04
UnduplicatedHeadcount 339,351 313,094 269,249 277,220 260,374
% Change 5.7% -7.7% -14.0% 3.0% -6.1%
DuplicatedHeadcount 508,145 448,643 417,946 406,313 374,291
% Change 2.4% -11.7% -6.8% -2.8% -7.9%
CourseSections 33,970 32,371 27,154 27,312 26,363
% Change 0.9% -4.7% -16.1% 0.6% -3.5%
SOURCES OF DATA: FY 2000 and FY 2001 higher value of Noncredit CourseEnrollment Data submission (N1) or Survey. FY2002 - FY2004 Noncredit CourseEnrollment Data submission (N1)
Fiscal year 2004 is the sixth year that the Illinois Community CollegeSystem has undertaken data collection through a noncredit courseenrollment database (N1). The transition period from the paper surveyto the database is complete.
During fiscal year 2004, Illinois community colleges conducted 26,363noncredit course sections, about 3.5 percent fewer than the previous year.This number of course offerings was well below the number offered infiscal year 2000. From fiscal year 2000 to fiscal year 2004, the totalnumber of course sections offered through the colleges decreased 22.4percent.
Despite recent decreases in course offerings, noncredit offerings continueto be an important part of college efforts to meet community andemployer needs. Figure 4 indicates that student enrollments havedecreased since last fiscal year. During fiscal year 2004, the unduplicatednoncredit headcount (in which students are counted only once, regardlessof the number of noncredit courses in which they enroll) decreased 6.1percent. Over a longer time frame, unduplicated noncredit headcountshave decreased 23.3 percent over the last five fiscal years. Theduplicated headcount (also known as “seatcount”) during fiscal year 2004was 7.9 percent lower than the previous fiscal year and 26.3 percentlower than five years earlier.
The number of noncredit course offerings and enrollments at thecommunity colleges varies from year to year, depending on the needs ofthe surrounding communities. Comparisons of fiscal year 2000 throughfiscal year 2004 noncredit headcount enrollments and course sectionsconducted for each community college are provided in Appendix TablesB-1, B-2, and B-3.
Reasons for the recent declines in noncredit activity and participationvary by locality. Part of the reason for these declines may be traced to theeconomy. The state and national economy has been in a recessionary

Student Enrollments & CompletionsFiscal Year 2004
Page 8
Fig. 4. Noncredit Course Enrollments, FY2000-2004
period over the last four years. Some individuals and businesses havefewer discretionary funds and are searching for ways to cut theirexpenses. Additionally, selected colleges may still be encountering someresistence from participants in noncredit courses about providingcomplete information to create the Noncredit Course Enrollment Datasubmission (N1). Likewise, noncredit coursework is offered by multipleentities within each college. Reporting may be more complete from someentities within the college than others. Records were not added to thenoncredit database unless the category of activity information wassupplied – business/industry contract; professional/vocationaldevelopment; personal/social development; and youth programs. Thenoncredit database requires more detailed reporting.
Characteristics of Noncredit StudentsCollege officials are recognized for the substantial effort they put intocollecting these detailed data on noncredit students. Due to extensivework by college officials, sufficient information is available to provideadditional information about the characteristics of the students enrolledin noncredit coursework at community colleges. Yet, there tends to be
more unknown/unreported information in the noncredit submission thanin the credit data. Cited percentages among noncredit enrollments arebased on the reported (known) data. Student characteristic informationis based on unduplicated counts. Information pertaining to courseofferings is based on duplicated counts, since course attributes change.
Noncredit Student Gender. Similar to the distribution for creditprograms, female students accounted for 57.1 percent of 2004 noncreditenrollments for which gender data were reported. Approximately one inten students did not provide gender data. Gender data by category ofactivity show that most missing gender information was amongindividuals enrolled in personal and social development courses (seeTable B-4).
Noncredit Student Ethnic Origin. Racial/ethnic reporting amongnoncredit students was less complete than among credit students, asnearly one-third (30.1 percent) of noncredit records were missingracial/ethnic data. Minority students accounted for nearly one-quarter(24.6 percent) of the individuals enrolled in noncredit programs whosupplied racial/ethnic data. In credit programs during the past five years,minorities accounted for an average of about one-third of the studentpopulation. Available noncredit data indicated the following racial/ethnicdistribution: White(75.5 percent), Black (11.0 percent), Hispanic (8.0percent), Asian (4.5 percent), Alien (0.8 percent), and American Indian(0.3 percent) (see Table B-5).
Noncredit Student Age. Based on available data, the average age ofstudents enrolled in noncredit coursework during fiscal year 2004 was37.1 years and the median age was 36.8 years. Age information wasmissing for just over one-quarter (26.0 percent) of noncredit students. Asdepicted in Figure 5, available data indicated that during 2004 noncreditprogramming served a more mature clientele than credit courses. One-half (50.1 percent) of noncredit students were 40 years of age or above.One-third (33.4 percent) of noncredit students were between 40 and 55years of age and another 28.7 percent were age 25 and 39. Just over one-fifth (21.3 percent) of noncredit students were under 25 years of age (seeTable B-6).

Student Enrollments & CompletionsFiscal Year 2004
Page 9
Noncredit Category of Activity (Duplicated)For state reporting purposes, noncredit coursework is grouped into fourbroad categories: Business and Industry Contract, Professional/Vocational Development, Personal and Social Development, and YouthPrograms. Records were not added to the database unless the categoryof activity information was supplied. Duplicated noncredit enrollmentcounts are used in the category of activity information depicted in Figure6 (also see Table B-12).
Based on a duplicated count, 54.1 percent of the noncredit offerings werein the personal and social development category. Personal and socialdevelopment programming is an important community service providedby the colleges. Typically, these courses are offered as long as demandis sufficient to at least cover the cost of course delivery. Nearly one-third(29.8 percent) of the noncredit coursework was dedicated to developingworkplace skills: professional/vocational (20.6 percent) and business and
industry contractual training (9.2 percent). These courses meet the needsof area residents who are interested in acquiring specific new skillswithout earning academic credit. Providing customized training is animportant economic development activity in which colleges tailorinstruction to the specific needs of local employers. Illinois communitycolleges are relied upon extensively to develop and deliver courseworkaddressing the unique training requirements of area businesses,industries, and governmental organizations. The remaining 16.2 percenthelped serve the needs of youth in the community (i.e., academicenrichment activities, athletic skills building, study skills, etc.).
Largest Noncredit Offerings (Duplicated)Two-digit classification of instructional program (CIP) codes provideadditional information about the areas where noncredit instruction wereprovided. Percentages cited are based on known CIP codes.
Across all categories of activity, eight programs (two-digit CIP) had over8,000 noncredit students enrolled. These eight program areas accounted

Student Enrollments & CompletionsFiscal Year 2004
Page 10
for nearly two-thirds (65.2 percent) of the students enrolled in noncreditcourses where CIP data were reported. Thirty-eight percent of theenrollments were in work-related programs: business management (19.2percent), transportation workers (10.1 percent), health professions (4.7percent) and computer information systems (4.0 percent). The twolargest programs, each enrolling over 50,000 students were in thefollowing areas: leisure and recreation (31.7 percent) and selfimprovement (21.8 percent). Basic skill development accounted for 4.9percent of those enrolled in these eight programs (see Table B-7).
Noncredit Term of Attendance (Duplicated)
Term of enrollment was provided for all noncredit coursework for fiscalyear 2004 (see Table B-9). The distribution of enrollments by term wasas follows: spring (40.2 percent), fall (31.5 percent), summer (26.4percent), and winter (1.9 percent). Overall, the distribution is similar tofiscal year 2004 credit offerings with somewhat higher summer noncreditactivity and lower fall noncredit enrollments.
Noncredit Enrollment Distribution by Site/Location (Duplicated)For state reporting purposes, five broad instructional site locations havebeen identified: Main Campus, Off-campus College Owned, Off-campusCollege-leased, Community Based, and Business Based. Acquiring morecomplete information about community college facility utilization andneeds was one of the underlying reasons for collecting more detailednoncredit data. Complete data were available on the instructional site andFigure 8 shows that most enrollment occurred on main college campuses(See Table B-8).
Further information about the differences between the categories follows.Community-based sites are rented or leased, with site maintenance andupkeep the responsibility of the organization furnishing the space. Off-campus college-leased sites are controlled by the college, with sitemaintenance and upkeep the responsibility of the college. Off-campuscollege-owned facilities are college-controlled branch or extension centersites located away from the main campus. Business-based sites areprovided by businesses who contract for training services.

Student Enrollments & CompletionsFiscal Year 2004
Page 11
Table 4SUMMARY COMPARISON OF ANNUAL COMPLETIONS
IN ILLINOIS PUBLIC COMMUNITY COLLEGESFISCAL YEARS 2000 - 2004
FY 00 FY 01 FY 02 FY 03 FY 04
Trans/Gen Assoc/Gen Studies 13,919 13,787 13,580 14,475 14,906
% Change 0.5% -0.9% -1.5% 6.6% 3.0%
Career & Tech Ed 20,881 24,633 25,366 30,854 33,080
% Change 6.0% 18.0% 3.0% 21.6% 7.2%
TOTALS 34,800 38,420 38,946 45,329 47,986
% Change 3.8% 10.4% 1.4% 16.4% 5.9%
SOURCE OF DATA: Annual Enrollment and Completion (A1) Records.
FISCAL YEAR 2004 COMPLETIONS
Degrees and Certificates Awarded by Community College The number of collegiate-level degrees and certificates awarded toIllinois community college students in fiscal year 2004 totaled 47,986.Table 4 contains comparative completion data for the last five years. Thenumber of degrees and certificates awarded increased by 5.9 percent overfiscal year 2003. Compared to fiscal year 2000, the total number of fiscalyear 2004 completions increased 37.9 percent.
Table C-1 in the appendix provides a comparison of fiscal year 2000through fiscal year 2004 duplicated completions for each communitycollege. Compared to last year, among the 48 colleges, 27 experiencedincreases in degree and certificate awards, while 17 exhibited decreasesin the past year. Four colleges experienced little or no change.
Degrees and Certificates Awarded by Program CategoriesOf the 47,986 completions during fiscal year 2004, 68.9 percent werecareer and technical education degrees or certificates. Baccalaureate/transfer degrees accounted for 29.2 percent of all the collegiate-levelcompletions. Among these baccalaureate/transfer degrees, the associatein arts degree was most commonly awarded (61.0 percent). Almost onethird (31.1 percent) of the baccalaureate/transfer degrees earned wereassociate in science degrees. The proportion of AA degrees granted hasbeen remarkably stable over the past five years. The total number oftransfer degrees awarded increased 3.1 percent from last fiscal year(14,022 in FY 2004 versus 13,599 in FY 2003). Overall, the number ofbaccalaureate/transfer degrees awarded in fiscal year 2004 increasedmoderately from fiscal year 2000 (9.1 percent).
Overall career and technical education completions are up 7.2 percentcompared to last year. Further examination of career and technicaleducation degrees and certificates awarded in fiscal year 2004 shows that26.4 percent were associate in applied science degrees. The number ofassociate in applied science degrees increased 2.8 percent since fiscalyear 2003. More than one-half (56.8 percent) of the career completionswere for certificates of less than one year. There was a moderate increasein the number of vocational skills certificates awarded in fiscal year 2004(15.2 percent; 38 additional certificates). A longer term comparison offiscal year 2004 career and technical education completions to thoseawarded five years earlier reveals that the total number of awardsincreased by 58.4 percent. A closer look shows that this is due to thesubstantial increase in short-term certificates (11,352 students or 152.5percent). The number of long-term certificates awarded also increased(15.5 percent), but much less dramatically. Between fiscal years 2000and 2004, there was an overall increase in associate in applied sciencedegrees (1.7 percent) and no change in vocational skills certificatesawarded.

Student Enrollments & CompletionsFiscal Year 2004
Page 12
Fig. 8. FY 2004 Associate Degrees Earned by Minority Students
Summary of Graduates by Degree CategoriesGender of Graduates by Degree Category. During fiscal year 2004,female students earned nearly six out of ten degrees and certificates (57.0percent). The three degrees and certificates attained by the highestproportion of females were the associate in arts (63.8 percent), associatein applied science (66.2 percent), and vocational skills certificate (71.5percent). Although small in overall number (103), associate inengineering science — one of the newest degree programs in the IllinoisCommunity College System — had the highest proportion of malegraduates (81.6 percent). Certificates of less than one year were thespecific award category with the largest number of male graduates(9,546). The male/female distribution within the baccalaureate/transferdegree and career and technical education degree and certificate areasdrive the overall gender proportion (see Table C-3).
Racial/Ethnic Origin of Graduates by Degree Category. Thirty percentof all degrees and certificates in fiscal year 2004 were awarded tominority (nonwhite) students. Twenty percent of all fiscal year 2004baccalaureate/transfer degrees were earned by minority students, themajority of which were associate in arts degrees (71.2 percent), while25.7 percent were associate in science degrees. The overall proportion ofminority baccalaureate/transfer completers was similar to last year (68.8percent associate in arts and 26.3 percent associate in science). Morethan four times as many minority graduates completed career andtechnical education degrees and certificates (11,242) than baccalaureate/transfer degrees (2,724). Almost twice as many Black students (7,229)completed collegiate-level programs than did Hispanic students (3,917)in fiscal year 2004 (see Table C-4). Figure 8 illustrates the distributionof minority students who successfully completed degree programs in theIllinois Community College System during fiscal year 2004.
Age of Graduates by Degree Category. Twelve percent of all completerswere in the under 21 year old age group. These graduates werepredominately (52.0 percent) in career and technical education programs.The 21-24 age group accounted for 30.7 percent of all graduates, whilethe 25-30 and 31-39 age groups accounted for 18.4 and 17.5 percent,respectively. Nearly 41 percent of students 30 and under completedbaccalaureate/transfer degrees, while only 11.1 percent of graduates over
the age of 30 completed baccalaureate/transfer programs. More than fourout of five (86.6 percent) graduates over 30 earned career and technicaleducation degrees and certificates. In general, the proportion of careerand technical education graduates increased as age advanced (seeTable C-5).
Intent of Graduates by Degree Category. Self-reported intent datadisclose the primary goal a student wants to achieve as a result of his/herstudies. The community colleges examine current intent versus studentintent at the time of initial enrollment at the college. In these analyses,current intent (when available) was analyzed to reflect the changing needsand desires of the community college student. Only 74.6 percent ofstudents who attained a baccalaureate/transfer degree in fiscal year 2004

Student Enrollments & CompletionsFiscal Year 2004
Page 13
indicated that they intended to prepare for transfer to a four-yearinstitution. Just over one-tenth (10.4 percent) of these successful studentsindicated a desire to prepare for a job immediately after communitycollege or to improve present job skills — intent that would most oftenbe associated with seeking a career and technical education degree orcertificate. Likewise, only 63.2 percent of those students who attained acareer and technical education degree or certificate indicated they werepreparing for a job immediately after completing community college orimproving present job skills. One-fifth (20.0 percent) of the career andtechnical education graduates indicated that they were preparing fortransfer to a four-year institution. Pursuing a career and technicaleducation degree does not preclude a student from transferring to a four-year institution (see Table C-6).
Degree Objective of Graduates by Degree Category. The self-reporteddegree objective provides an indication of the student's expected outcomefrom attending the community college, and one might anticipate that theywould mirror student completion patterns. More than three-quarters (79.6percent) of the students who earned baccalaureate/transfer degrees infiscal year 2004 indicated that they enrolled with a desire to complete anassociate degree. However, 16.7 percent indicated that they wanted tocomplete only one or several courses and were not pursuing a degree. Areview of career and technical education graduates reveals the samepattern; 77.8 percent of the career and technical education students whoearned an associate in applied science degree had listed completing anassociate degree as their objective, but 21.9 percent of the students whohad planned to only complete one or several courses or a certificate endedup surpassing their goal by earning an associate in applied science degree(see Table C-7).

Student Enrollments & CompletionsFiscal Year 2004
Page 14
SUMMARY
As indicated by the demographic data presented in this report, the IllinoisCommunity College System serves a diverse student clientele through avariety of credit and noncredit programs and courses. For studentsenrolled in credit coursework, more than half are female (55.9 percent),more than one-third are of minority ethnicity (35.8 percent), and morethan a third of students are 31 years of age or above (38.6 percent).Available information on students enrolled in noncredit courses shownearly identical gender representation (57.1 percent female), less minorityparticipation with about one-quarter minority students in noncreditcoursework, and participation by a more mature population in noncreditcourses with just over two-thirds of the students 31 years of age or above.
In the past year, there was a slight increase of 0.8 percent in creditenrollment in the community college system. However, coupled with adecrease of 6.1 percent in noncredit enrollment, there was an overalldecline of 1.2 percent in combined community college enrollment. Theeconomic climate in fiscal year 2004 is one factor influencing thenoncredit enrollment decline. In tight economic times, some individualsand businesses have fewer discretionary funds and are searching for waysto reduce their expenses. In the long run, investing in education andtraining makes sense for both individuals and employers.
In fiscal year 2004, community colleges as a whole experienced anincrease in completions (5.9 percent) compared to last year. Remarkably,this is the fifth consecutive year of increase in the number of communitycollege system graduates. Of the 47,986 completions during fiscal year2004, 49.3 percent were associate degrees, and 50.7 percent werecertificates. Fiscal year 2004 was the first time that certificates awardedoutnumbered associate degrees. In an era of increased accountability,fully capturing and reporting graduates through the Annual Enrollmentand Completion Submission (A1) is becoming increasingly important.At the same time, it is recognized that there are individuals served bycommunity colleges who attend with an exclusive interest in completingparticular courses to provide specific skills for success in their chosenfield. Fiscal year 2004 data show that 52.0 percent of all students identify
themselves as not pursuing a formal award. Approximately 34.4 percentof the career and technical education students reported attending tocomplete one or several courses. Yet, there are individuals attendingcommunity colleges who meet certificate and sometimes degreerequirements, but either do not recognize that they have done so or do notfile the necessary paperwork to receive their formal academic award. Topromote student success, each achievement should be recognized as it isaccomplished.
Systemwide over the past two years, in conjunction with a PostsecondaryPerkins initiative, community colleges have been undertaking projectsto develop, implement, or expand upon local computerized automateddegree and certificate audit systems. These efforts will continue throughthe next fiscal year. Results of these systemwide efforts are contributingto positive results as the number of certificates awarded has nearlydoubled over the past five fiscal years. Over the same time period, thesystem has seen an increase of nearly 38 percent in the total number ofcertificates and degrees awarded. Computerized certificate and degreeaudits are useful in recognizing student accomplishments and helpingstudents reach their goals. The implementation of automated degreeaudits has an up-front cost and requires an ongoing commitment to keepthese computerized systems updated as degree and certificaterequirements can change frequently and the list of permitted electivestends to be extensive. Yet, investing in processes that promote studentsuccess and student outcomes are a priority for community colleges.
Overall, the large number of students served through credit and/ornoncredit courses affirms that the Illinois Community College Systemcontinues to adapt to the evolving educational needs of the communitieseach college serves. Recognizing and encouraging student progress andoutcomes is a priority. Student completions are being captured morefully. Ongoing efforts to promote degree and certificate completion forstudents with an interest in earning a formal academic award is payingdividends for students, area employers, and the colleges. The number ofcommunity college system graduates has increased for each of the pastfive years.

Student Enrollments & CompletionsFiscal Year 2004
Page 15
Appendix A
CREDIT ENROLLMENT DATA TABLES
Illinois Community College BoardTable A-1
SUMMARY COMPARISON OF ANNUAL CREDIT HEADCOUNT ENROLLMENTS BY COLLEGE, FISCAL YEARS 2000 - 2004
% Change% ChangeFY 2004FY 2003FY 2002FY 2001FY 2000Dist. 2003-20042000-2004HeadcountHeadcountHeadcountHeadcountHeadcountDistrict/CollegeNo.
%1.6%-2.012,87712,67413,08412,29113,143Black Hawk503 (-3.2)(-5.6)(115,800)(119,675)(121,330)(121,975)(122,663)Chicago508
1.710.217,46917,17716,87515,79015,854 Daley 06 3.0-15.010,50810,20610,15911,78612,366 Kennedy-King 01
-7.6-9.415,36016,61917,48917,43016,959 Malcolm X 03 -6.3-23.69,3379,96510,41610,51712,223 Olive-Harvey 05 -5.5-4.827,70829,31130,30530,03629,113 Truman 04 0.7-5.215,82715,72015,90516,29916,701 Washington 02
-5.30.719,59120,67720,18120,11719,447 Wilbur-Wright 07 33.066.27,6865,7805,6594,8144,625Danville507 0.63.954,82554,50154,74653,39552,754DuPage502 7.29.219,47618,17218,26318,83617,832Elgin5093.76.225,86924,95424,94725,20824,353Harper512
-2.220.37,5307,7007,0776,5646,259Heartland540-6.6-11.45,7306,1346,2716,8366,466Highland519 1.63.819,69919,39318,80918,89318,981Illinois Central514
(0.6)(15.1)(27,866)(27,689)(24,516)(24,228)(24,204)Illinois Eastern529 1.020.37,4707,3976,6386,6516,209 Frontier 04
-0.312.12,3652,3732,0421,9872,109 Lincoln Trail 01 5.127.52,9742,8292,7592,8762,332 Olney Central 02
-0.211.115,05715,09013,07712,71413,554 Wabash Valley 03 -1.72.37,3507,4767,2447,1297,188Illinois Valley513 -1.319.122,25422,55820,38519,82618,690Joliet525 -4.2-3.88,7209,1068,4348,7629,066Kankakee520 19.558.58,9587,4986,3835,3195,651Kaskaskia501 1.513.67,2497,1456,9116,5356,381Kishwaukee523 1.25.926,72926,40225,71024,87625,239Lake County532
10.023.915,75614,32114,12913,52212,721Lake Land517 %1.1%12.411,74511,62011,90010,66510,451Lewis & Clark536

Illinois Community College BoardTable A-1
(Continued)SUMMARY COMPARISON OF ANNUAL CREDIT HEADCOUNT ENROLLMENTS
BY COLLEGE, FISCAL YEARS 2000 - 2004
% Change% ChangeFY 2004FY 2003FY 2002FY 2001FY 2000Dist. 2003-20042000-2004HeadcountHeadcountHeadcountHeadcountHeadcountDistrict/CollegeNo.
%-5.9%-20.815,10516,04818,09019,82519,061Lincoln Land526 11.720.713,08911,71311,23811,14310,841Logan530 -3.04.711,39211,74811,58911,40610,883McHenry528 3.49.427,98427,05126,91825,22325,585Moraine Valley524
-6.91.67,2927,8307,0407,1157,180Morton527 -6.720.933,75736,19534,56629,47427,925Oakton535 2.315.116,77116,39615,12314,66214,565Parkland505
-2.91.610,95011,27310,38910,47310,782Prairie State515 3.7-4.510,82810,44310,1819,82111,344Rend Lake521
-3.7-2.87,0607,3316,7997,0497,266Richland537 -0.05.015,55215,55915,13614,24914,812Rock Valley511 6.09.07,0416,6406,0366,2896,457Sandburg518
-1.316.05,0215,0874,9134,0654,330Sauk Valley506 2.129.46,6826,5425,2975,0685,162Shawnee531 7.717.917,53816,28215,39515,30714,873South Suburban5107.632.78,1377,5605,9075,6906,130Southeastern533 5.111.525,96124,70423,58722,25523,287Southwestern/Belleville522 7.515.34,7574,4273,9753,9124,126Spoon River534 1.6-29.726,20025,77727,80733,31737,250Triton504
-2.18.417,11817,48416,37316,23015,794Waubonsee516 -1.0-0.14,3534,3974,2554,2444,356Wood539
%0.8%4.5698,707693,285676,412666,491668,676TOTALS/AVERAGES
SOURCE OF DATA: Annual Enrollment (A1) Data

Illinois Community College BoardTable A-2
SUMMARY COMPARISON OF ANNUAL FTE* ENROLLMENTS BY COLLEGE, FISCAL YEARS 2000 - 2004
% Change% ChangeFY 2004FY 2003FY 2002FY 2001FY 2000Dist. 2003-20042000-2004FTEFTEFTEFTEFTEDistrict/CollegeNo.
%-0.3%-0.15,2275,2415,2785,0655,231Black Hawk503 (-1.7)(-1.0)(47,868)(48,677)(48,150)(47,206) (48,348)Chicago508
3.515.88,1927,9167,6056,9667,075 Daley 06 0.2-9.34,5904,5804,5084,7005,063 Kennedy-King 01
-7.1-18.96,8907,4187,7308,3078,491 Malcolm X 03 -1.2-11.54,1294,1784,0253,7954,665 Olive-Harvey 05 -2.36.510,83511,09511,03310,58110,170 Truman 04 -2.07.35,5175,6325,3075,1265,140 Washington 02 -1.8-0.47,7147,8597,9427,7317,745 Wilbur-Wright 07 4.519.12,0601,9711,8761,7471,729Danville507 3.317.219,12518,51517,75116,61816,315DuPage502 8.015.66,7536,2546,0746,1745,842Elgin5097.016.59,8189,1798,8578,5858,424Harper512 1.136.13,1443,1102,8122,5852,311Heartland5404.97.41,9081,8201,7841,8891,777Highland519 6.113.48,0377,5777,1797,0267,089Illinois Central514
(2.8)(15.4)(5,707)(5,550)(5,226)(5,110)(4,944)Illinois Eastern529 -10.01.8854950845791839 Frontier 04
-0.46.51,1411,1451,0511,0591,071 Lincoln Trail 01 16.135.81,5451,3311,3991,4081,138 Olney Central 02
2.014.32,1672,1241,9311,8521,896 Wabash Valley 03 3.112.62,8772,7902,6912,6502,555Illinois Valley513
-3.234.87,8428,1007,5376,8745,819Joliet525 4.45.03,1172,9862,6242,7962,969Kankakee520
22.057.23,6292,9742,5512,2612,308Kaskaskia501 4.919.62,8562,7242,6022,4752,388Kishwaukee523 4.318.28,8178,4548,0227,4937,459Lake County532 7.122.46,0655,6655,4355,1374,955Lake Land517
%6.1%34.14,0033,7733,5653,0192,986Lewis & Clark536

Illinois Community College BoardTable A-2
(Continued)SUMMARY COMPARISON OF ANNUAL FTE* ENROLLMENTS
BY COLLEGE, FISCAL YEARS 2000 - 2004
% Change% ChangeFY 2004FY 2003FY 2002FY 2001FY 2000Dist. 2003-20042000-2004FTEFTEFTEFTEFTEDistrict/CollegeNo.
%-10.0%-7.24,3584,8444,9694,6714,698Lincoln Land526 6.012.23,8263,6113,4213,4293,409Logan530 4.420.84,0263,8583,6313,4173,334McHenry528 8.422.410,88610,0419,5928,9838,895Moraine Valley524
-2.419.62,4202,4802,1872,1102,024Morton527 0.613.18,0447,9977,6987,5017,114Oakton535 1.921.06,8886,7576,0405,7025,692Parkland5052.412.43,6513,5652,9013,1743,247Prairie State515
11.415.12,8852,5892,5902,4582,506Rend Lake521 -7.6-0.12,3802,5752,3002,5412,382Richland537 1.721.75,7385,6405,2174,6234,716Rock Valley511 5.324.62,6382,5042,2492,2022,116Sandburg518
-2.69.81,7681,8151,8481,6511,610Sauk Valley506 2.221.31,7471,7091,6121,4601,440Shawnee531 8.324.36,0575,5935,1664,7834,872South Suburban5104.7-3.72,1292,0342,0962,1382,210Southeastern533 5.415.19,0918,6288,3857,8937,900Southwestern/Belleville522 5.216.11,5211,4451,3731,3021,310Spoon River534 2.96.79,0738,8188,2548,0558,500Triton504 0.825.15,3575,3144,9424,4934,282Waubonsee516
%7.5%15.01,8451,7171,6071,5491,604Wood539
%2.6%12.8245,184238,894228,089218,843**217,311TOTALS/AVERAGES
*Full-time equivalent enrollments are based on all credit hours attempted (including nonreimburseable credit hours).** Adjusted TotalSOURCE OF DATA: Annual Enrollment (A1) Data

Illinois Community College Board
Table A-3
COMPARISON OF MALE AND FEMALE ANNUAL HEADCOUNT ENROLLMENTSFISCAL YEARS 2000 -2004
20042003200220012000
44.1%308,07944.0%304,84144.6%301,40944.7%297,90244.4%296,990 Male1.1%1.1%1.2%0.3%3.3% Percent Change
55.9%390,62856.0%388,44455.4%375,00355.3%368,58955.6%371,670 Female0.6%3.6%1.7%-0.8%2.4% Percent Change
100.0%698,707100.0%693,285100.0%676,412100.0%666,491100.0%668,660 Total0.8%2.5%1.5%-0.3%2.8%
SOURCE OF DATA: Annual Enrollment (A1) Records

Illinois Community College Board
Table A-4
COMPARISON OF ANNUAL HEADCOUNT ENROLLMENTS BY ETHNIC ORIGINFISCAL YEARS 2000 - 2004
20042003200220012000
4.5%31,1854.5%30,8074.7%31,2224.7%30,8644.6%30,744 Asian/Pacific Islander1.2%-1.3%1.2%0.4%4.8% Percent Change
0.4%2,4620.3%2,3010.3%2,3000.3%2,2410.3%2,232 American Indian/Alaskan7.0%0.0%2.6%0.4%-2.5% Percent Change
14.6%101,45314.4%99,35014.1%94,77113.9%91,86014.0%92,762 Black2.1%4.8%3.2%-1.0%0.5% Percent Change
15.8%109,78216.0%110,24516.2%108,57215.9%105,12414.5%96,176 Hispanic-0.4%1.5%3.3%9.3%9.6% Percent Change
64.3%446,53464.1%441,46364.1%430,22864.7%428,50665.6%435,683 White1.1%2.6%0.4%-1.6%2.0% Percent Change
0.5%3,3930.7%4,6350.6%4,2940.6%4,1360.9%6,083 Non-Resident Alien-26.8%7.9%3.8%-32.0%10.0% Percent Change
100.0%694,809100.0%688,801100.0%671,387100.0%662,731100.0%663,680 Total Known
0.6%3,8980.7%4,4840.7%5,0250.6%3,7600.8%4,996 All Other Unknown
698,707693,285676,412666,491668,676 TOTALS
SOURCE OF DATA: Annual Enrollment (A1) Records
Illinois Community College BoardTable A-5
COMPARISON OF ANNUAL HEADCOUNT ENROLLMENTS BY AGE CATEGORYFISCAL YEARS 2000-2004
20042003200220012000
1.1%7,3821.0%6,5740.9%5,8850.8%5,5190.7%4,345 16 and Under12.3%11.7%6.6%27.0%8.7% Percent Change
23.2%160,43322.8%156,37622.9%152,59522.9%148,80822.7%147,448 17-202.6%2.5%2.5%0.9%2.0% Percent Change
21.4%148,35821.2%145,46620.8%138,73320.5%133,04619.9%129,085 21-242.0%4.9%4.3%3.1%2.3% Percent Change
15.7%108,40315.6%107,00615.8%104,97215.9%103,33115.9%103,063 25-301.3%1.9%1.6%0.3%0.6% Percent Change
15.4%106,83615.7%107,83015.9%105,66916.3%105,88216.7%108,540 31-39-0.9%2.0%-0.2%-2.4%2.0% Percent Change
18.7%129,33519.1%130,68719.2%127,68018.8%122,09718.9%122,382 40-55-1.0%2.4%4.6%-0.2%4.5% Percent Change
4.5%31,0894.5%30,7864.5%30,2724.9%31,8355.2%33,930 Over 551.0%1.7%-4.9%-6.2%5.4% Percent Change
100.0%691,836100.0%684,725100.0%665,806100.0%650,518100.0%648,793 TOTAL REPORTED
6,8718,56010,60615,97319,883 Unreported Age
698,707693,285676,412666,491668,676 TOTALS
30.931.031.131.331.6 Mean Age
26.326.526.726.827.3 Median Age
SOURCE OF DATA: Annual Enrollment (A1) Records

Illinois Community College BoardTable A-6a
COMPARISON OF ANNUAL HEADCOUNT ENROLLMENTS IN INSTRUCTIONAL PROGRAM AREASFISCAL YEARS 2000-2004
20042003200220012000
4.6%31,8764.1%28,2003.9%26,0524.0%26,8065.2%34,745 General Associate13.0%8.2%-2.8%-22.8%-6.7% Percent Change
37.7%263,32137.3%258,34236.2%244,64134.9%232,93134.0%227,065 Baccalaureate/Transfer(71,397)(71,490)(65,744) (61,010)(59,874) *(Course Enrollees)
1.9%5.6%5.0%2.6%1.6% Percent Change
27.3%191,08627.0%187,08726.9%181,86326.7%177,68226.4%176,284 Career & Technical Ed.(49,760)(48,261)(47,576) (47,937)(49,602) *(Course Enrollees)
2.1%2.9%2.4%0.8%2.8% Percent Change
10.1%70,42210.1%70,18110.4%70,52911.2%74,82712.6%84,430 Vocational Skills0.3%-0.5%-5.7%-11.4%13.9% Percent Change
18.1%126,62319.0%131,82519.8%134,22519.8%131,74218.5%123,595 ABE/ASE/ESL-3.9%-1.8%1.9%6.6%4.4% Percent Change
2.2%15,3792.5%17,6502.8%19,1023.4%22,5033.4%22,557 General Studies Cert-12.9%-7.6%-15.1%-0.2%-12.7% Percent Change
100.0%698,707100.0%693,285100.0%676,412100.0%666,491100.0%668,676 TOTALS
*Those students taking courses but not enrolled in a curriculum are identified as course enrollees and are included in the total program counts.
SOURCE OF DATA: Annual Enrollment (A1) Records

Illinois Community College BoardTable A-6b
COMPARISON OF ANNUAL HEADCOUNT ENROLLMENTS IN INSTRUCTIONAL PROGRAM AREASFISCAL YEARS 2000-2004
EXCLUDING CITY COLLEGES OF CHICAGO
20042003200220012000
3.1%18,0342.7%15,4682.6%14,2362.5%13,5002.7%14,905 General Associate16.6%8.7%5.5%-9.4%-13.8% Percent Change
40.2%234,09840.0%229,17039.1%216,93938.3%208,50238.2%208,338 Baccalaureate/Transfer2.2%5.6%4.0%0.1%1.8% Percent Change
30.0%175,14230.0%171,90129.8%165,56629.5%160,89929.6%161,528 Career & Technical Ed.1.9%3.8%2.9%-0.4%2.4% Percent Change
11.3%65,62311.1%63,65311.4%63,43612.2%66,22413.3%72,659 Vocational Skills3.1%0.3%-4.2%-8.9%19.6% Percent Change
12.8%74,76113.3%76,07113.7%75,98813.4%73,12812.2%66,369 ABE/ASE/ESL-1.7%0.1%3.9%10.2%11.8% Percent Change
2.6%15,2493.0%17,3473.4%18,9174.1%22,2634.1%22,214 General Studies Cert-12.1%-8.3%-15.0%0.2%-10.6% Percent Change
100.0%582,907100.0%573,610100.0%555,082100.0%544,516100.0%546,013 TOTALS
SOURCE OF DATA: Annual Enrollment (A1) Records

Illinois Community College BoardTable A-7
FISCAL YEAR 2004 HEADCOUNT ENROLLMENTS IN INSTRUCTIONAL PROGRAM AREASBY GENDER
TotalFemaleMale
100.0%31,87661.6%19,63438.4%12,242 General Associate4.6%5.0%4.0%
100.0%263,32158.4%153,83441.6%109,487 Baccalaureate/Transfer(71,397)(41,247)(30,150) *(Course Enrollees)
37.7%39.4%35.5%
100.0%191,08653.4%102,00046.6%89,086 Career & Technical Ed.(49,760)(23,604)(26,156) *(Course Enrollees)
27.3%26.1%28.9%
100.0%70,42254.6%38,44845.4%31,974 Vocational Skills10.1%9.8%10.4%
100.0%52,74452.7%27,80547.3%24,939 ABE/ASE7.5%7.1%8.1%
100.0%73,87953.6%39,57246.4%34,307 ESL10.6%10.1%11.1%
100.0%15,37960.7%9,33539.3%6,044 General Studies Certificate2.2%2.4%2.0%
100.0%698,70755.9%390,62844.1%308,079 TOTALS100.0%100.0%100.0%
*Those students taking courses but not enrolled in a curriculum are identified as course enrollees and are included in the total program counts.
SOURCE OF DATA: Annual Enrollment (A1) Records
Illinois Community College BoardTable A-8
FISCAL YEAR 2004 HEADCOUNT ENROLLMENTS IN INSTRUCTIONAL PROGRAM AREASBY RACIAL/ETHNIC ORIGIN
TotalUnknownAlienWhiteHispanicBlackAm IndianAsian
100.0%31,8760.0%130.4%11755.2%17,58118.3%5,84319.1%6,0970.4%1376.6%2,088 General Associate4.6%0.3%3.4%3.9%5.3%6.0%5.6%6.7% (1.0)
100.0%263,3210.6%1,5330.5%1,20871.6%188,4787.9%20,70214.4%37,7910.3%8984.8%12,711 Bacc/Transfer(71,397)(402)(56,060)(4,444)(6,912)(183)(2,864)(532) *(Course Enrollees)
37.7%39.3%35.6%42.2%18.9%37.2%36.5%40.8% (1.1)
100.0%191,0860.5%1,0020.4%82070.9%135,4477.9%15,00515.7%29,9920.4%7594.2%8,061 Career & Technical Ed.(49,760)(361)(38,135)(3,300)(6,763)(185)(930)(86) *(Course Enrollees)
27.3%25.7%24.2%30.3%13.7%29.6%30.8%25.8% (1.2)
100.0%70,4220.5%3390.1%10383.7%58,9414.4%3,1019.2%6,4680.3%2041.8%1,266 Vocational Skills10.1%8.7%3.0%13.2%2.8%6.4%8.3%4.1% (1.6)
100.0%52,7440.5%2400.3%15035.4%18,68524.8%13,10336.6%19,3050.6%3361.8%925 ABE/ASE7.5%6.2%4.4%4.2%11.9%19.0%13.6%3.0% (1.7/1.8)
100.0%73,8790.3%2401.3%98320.4%15,07369.4%51,2781.5%1,1130.1%1016.9%5,091 ESL10.6%6.2%29.0%3.4%46.7%1.1%4.1%16.3% (1.9)
100.0%15,3793.5%5310.1%1280.2%12,3294.9%7504.5%6870.2%276.8%1,043 Gen Studies Cert2.2%0.0%0.4%2.8%0.7%0.7%1.1%3.3% (1.5)
100.0%698,7070.6%3,8980.5%3,39363.9%446,53415.7%109,78214.5%101,4530.4%2,4624.5%31,185 TOTALS100.0%100.0%100.0%100.0%100.0%100.0%100.0%100.0%
*Those students taking courses but not enrolled in a curriculum are identified as course enrollees and are included in the total program counts.
SOURCE OF DATA: Annual Enrollment (A1) Records

Illinois Community College BoardTable A-9
FISCAL YEAR 2004 HEADCOUNT ENROLLMENTS IN INSTRUCTIONAL PROGRAM AREASBY AGE GROUP
25-3021-2417-2016 & Under
18.4%5,87825.2%8,01925.8%8,2370.2%60 General Associate5.4%5.4%5.1%0.8% (1.0)
13.3%34,90228.5%75,07133.9%89,1510.8%2,077 Bacc/Transfer(7,472)(17,433)(25,664)(1,467) *(Course Enrollees)32.2%50.6%55.6%28.1% (1.1)
16.8%32,05118.9%36,07017.5%33,4921.2%2,330 Career & Technical Ed.(6,088)(5,267)(8,285)(2,068) *(Course Enrollees)29.6%24.3%20.9%31.6% (1.2)
9.2%6,4785.6%3,9235.2%3,6472.5%1,779 Vocational Skills6.0%2.6%2.3%24.1% (1.6)
15.9%8,37120.1%10,59233.5%17,6661.4%759 ABE/ASE7.7%7.1%11.0%10.3% (1.7/1.8)
26.0%19,20717.3%12,8178.0%5,8750.2%115 ESL17.7%8.6%3.7%1.6% (1.9)
9.9%1,51612.1%1,86615.4%2,3651.7%262 General Studies Cert1.4%1.3%1.5%3.5% (1.5)
15.5%108,40321.2%148,35823.0%160,4331.1%7,382 TOTALS100.0%100.0%100.0%100.0%
*Those students taking courses but not enrolled in a curriculum are identified as course enrollees and are included in the total program counts.
SOURCE OF DATA: Annual Enrollment (A1) Records

Illinois Community College BoardTable A-9
(Continued)FISCAL YEAR 2004 HEADCOUNT ENROLLMENTS IN INSTRUCTIONAL PROGRAM AREAS
BY AGE GROUP
TotalUnknownOver 5540-5531-39
100.0%31,8761.0%3131.8%58512.3%3,92915.2%4,855 General Associate4.6%4.6%1.9%3.0%4.5% (1.0)
100.0%263,3210.4%1,1602.5%6,57610.4%27,26110.3%27,123 Bacc/Transfer(71,397)(534)(2,838)(9,062)(6,927) *(Course Enrollees)
37.7%16.9%21.2%21.1%25.4% (1.1)
100.0%191,0860.4%7104.1%7,76222.6%43,23218.5%35,439 Career & Technical Ed.(49,760)(347)(4,000)(14,957)(8,748) *(Course Enrollees)
27.3%10.3%25.0%33.4%33.2% (1.2)
100.0%70,4225.5%3,86411.8%8,31243.7%30,75916.6%11,660 Vocational Skills10.1%56.2%26.7%23.8%10.9% (1.6)
100.0%52,7440.3%1652.7%1,41712.1%6,40114.0%7,373 ABE/ASE7.5%2.4%4.6%4.9%6.9% (1.7/1.8)
100.0%73,8790.2%1694.5%3,33318.7%13,81625.1%18,547 ESL10.6%2.5%10.7%10.7%17.4% (1.9)
100.0%15,3793.2%49020.2%3,10425.6%3,93712.0%1,839 General Studies Cert2.2%7.1%10.0%3.0%1.7% (1.5)
100.0%698,7071.0%6,8714.4%31,08918.5%129,33515.3%106,836 TOTALS100.0%100.0%100.0%100.0%100.0%
*Those students taking courses but not enrolled in a curriculum are identified as course enrollees and are included in the total program counts.
SOURCE OF DATA: Annual Enrollment (A1) Records

Illinois Community College BoardTable A-10
COMPARATIVE SUMMARY OF CAREER AND TECHNICAL EDUCATION CURRICULAENROLLMENTS OVER 5,000
FISCAL YEARS 2003 AND 2004
PercentNumberFYFYChangeChange20042003CURRICULA & CIP
9.1%1,17914,16012,981Associate Degree Nursing511601
4.1%3218,2317,910Criminal Justice Technology430107
4.2%3248,1087,784Child Care Provider/Assistant200202
-21.2%-1,9537,2469,199Business Data Programming521202
-1.8%-1075,9966,103Business Administration & Management520201
SOURCE OF DATA: Annual Enrollment (A1) Records

Illinois Community College BoardTable A-11
FISCAL YEAR 2004 ANNUAL HEADCOUNT ENROLLMENTS IN INSTRUCTIONAL PROGRAM AREASBY STUDENT INTENT*
PersonalImprovePrepare forImprovePrepare forOtherInterest/Basic SkillsJob AfterPresentTransfer toor NoSelfOr PrepareCommunityJobFour-Year
TotalIndicationDevelopmentfor GEDCollegeSkillsInstitution
100.0%31,87617.3%5,4997.1%2,2703.1%98620.5%6,5319.0%2,87743.0%13,713 Gen Assoc4.6%5.5%2.9%0.9%5.7%3.1%6.7% (1.0)
100.0%263,32114.4%37,8919.8%25,8691.4%3,60610.7%28,1706.0%15,69457.8%152,091 Bacc/Transf(71,397)(13,722)(14,252)(1,357)(5,493)(5,307)(31,266) **(Crse Enr)
37.7%37.6%33.2%3.5%24.4%16.7%73.8% (1.1)
100.0%191,08611.5%21,8937.2%13,6851.4%2,70538.5%73,53522.7%43,39618.8%35,872 Career & Technical Ed.(49,760)(7,055)(4,404)(941)(9,672)(21,693)(5,995) '**(Crse Enr)
27.3%21.7%17.6%2.6%63.8%46.1%17.4% (1.2)
100.0%70,42229.7%20,89517.9%12,5911.7%1,2035.5%3,87941.7%29,3503.6%2,504 Vocational10.1%20.7%16.2%1.2%3.4%31.2%1.2% (1.6)
100.0%52,74410.9%5,7567.2%3,79077.3%40,7972.5%1,2971.4%7140.7%390 ABE/ASE7.5%5.7%4.9%39.1%1.1%0.8%0.2% (1.7/1.8)
100.0%73,8798.7%6,43214.2%10,48273.8%54,5591.6%1,2071.0%7390.6%460 ESL10.6%6.4%13.5%52.3%1.0%0.8%0.2% (1.9)
100.0%15,37916.2%2,49859.6%9,1692.7%4174.6%7119.2%1,4107.6%1,174 Gen Std Cert2.2%2.5%11.8%0.4%0.6%1.5%0.6% (1.5)
100.0%698,70714.4%100,86411.1%77,85614.9%104,27316.5%115,33013.5%94,18029.5%206,204 TOTALS100.0%100.0%100.0%100.0%100.0%100.0%100.0%
*Current student intent is examined. When not available, student intent at time of college entrance is used.**Those students taking courses but not enrolled in a curriculum are identified as course enrollees and are included in the total program counts.
SOURCE OF DATA: Annual Enrollment (A1) Records

Illinois Community College BoardTable A-12
FISCAL YEAR 2004 HEADCOUNT ENROLLMENTS IN INSTRUCTIONAL PROGRAM AREASBY DEGREE OBJECTIVE
Complete OneOther orTo Completeor Several
Noan AssociateTo CompleteCourses - NotTotalIndicationDegreea CertificatePursuing Degree
100.0%31,8760.0%1076.2%24,28913.5%4,31910.2%3,258 General Associate4.6%0.2%9.1%7.0%0.9% (1.0)
100.0%263,3210.6%1,51358.6%154,3144.0%10,47936.8%97,015 Bacc/Transfer(71,397)(0)(11,382)(1,721)(58,294) *(Course Enrollees)
37.7%28.0%57.5%17.0%26.7% (1.1)
100.0%191,0860.6%1,20143.4%82,87221.6%41,28934.4%65,724 Career & Technical Ed.(49,760)(607)(5,326)(4,620)(39,207) *(Course Enrollees)
27.3%22.3%30.9%67.1%18.1% (1.2)
100.0%70,4221.0%7254.1%2,8592.7%1,88092.2%64,958 Vocational Skills10.1%13.4%1.1%3.1%17.9% (1.6)
100.0%52,7442.0%1,0592.4%1,2863.5%1,83992.1%48,560 ABE/ASE7.5%19.6%0.5%3.0%13.4% (1.7/1.8)
100.0%73,8790.8%5953.3%2,4092.1%1,53293.9%69,343 ESL10.6%11.0%0.9%2.5%19.1% (1.9)
100.0%15,3791.9%2922.0%3011.2%18295.0%14,604 Gen Studies Cert2.2%5.4%0.1%0.3%4.0% (1.5)
100.0%698,7070.8%5,39538.4%268,3308.8%61,52052.0%363,462 TOTALS100.0%100.0%100.0%100.0%100.0%
*Those students taking courses but not enrolled in a curriculum are identified as course enrollees and are included in the total program counts.
SOURCE OF DATA: Annual Enrollment (A1) Records

Illinois Community College BoardTable A-13
FISCAL YEAR 2004 DUPLICATED HEADCOUNT ENROLLMENTSBY TERM AND TYPE OF ATTENDANCE
TotalFull-timePart-time
100.0%216,9968.9%19,29591.1%197,701 Summer
100.0%413,15929.1%120,38470.9%292,775 Fall
100.0%27,3115.6%1,54394.4%25,768 Winter
100.0%417,56027.1%112,99572.9%304,565 Spring
SOURCE OF DATA: Annual Enrollment (A1) Records

Illinois Community College BoardTable A-14
FISCAL YEAR 2004 HEADCOUNT ENROLLMENTS(EXCLUDING ADULT EDUCATION)
BY HIGHEST DEGREE EARNED PRIOR TO ENROLLMENT
% of KnownEnrollment DEGREE
5.9%26,991 GED
58.4%267,682 High School
17.3%79,421 Some College Courses
3.6%16,402 Certificate
6.1%28,093 Associate Degree
6.1%27,759 Bachelor's Degree
1.9%8,563 Master's Degree
0.2%740 First Professional Degree
0.2%1,028 Doctoral Degree
0.4%1,839 Other
100.0%458,518 Total Known
240,189 None/Unknown
698,707 Total
SOURCE OF DATA: Annual Enrollment (A1) Records
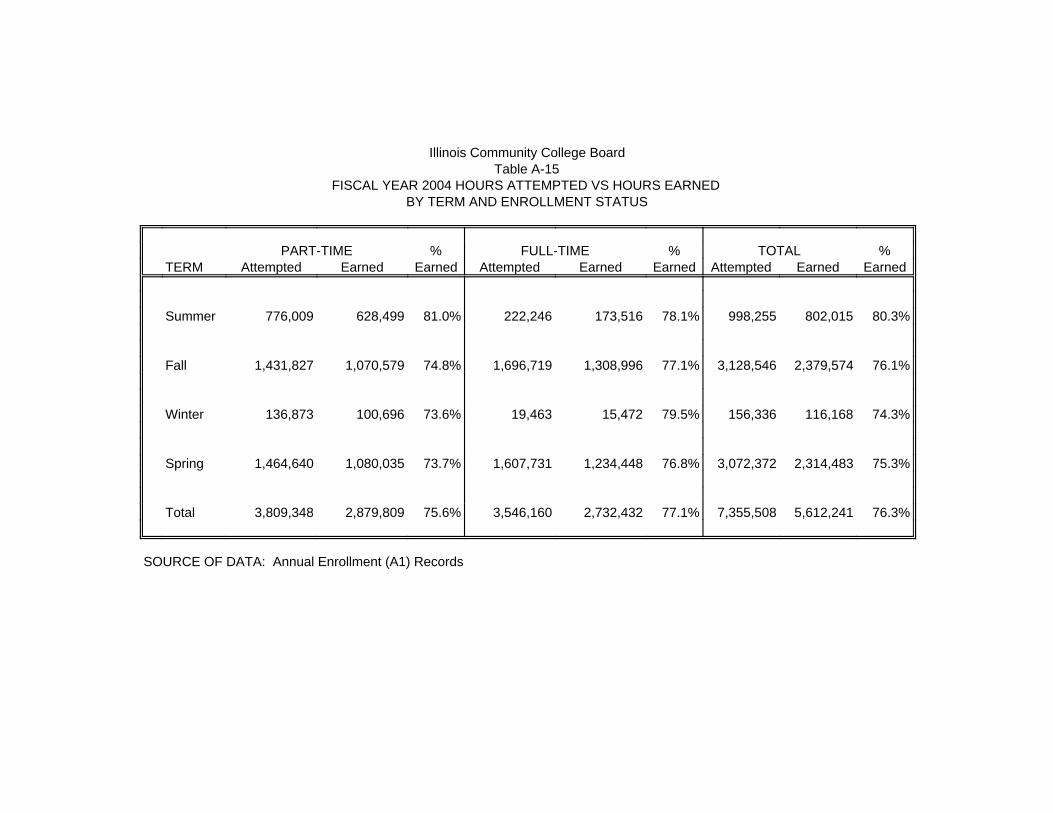
Illinois Community College BoardTable A-15
FISCAL YEAR 2004 HOURS ATTEMPTED VS HOURS EARNED BY TERM AND ENROLLMENT STATUS
%TOTAL%FULL-TIME%PART-TIMEEarnedEarnedAttemptedEarnedEarnedAttemptedEarnedEarnedAttemptedTERM
80.3%802,015998,25578.1%173,516222,24681.0%628,499776,009Summer
76.1%2,379,5743,128,54677.1%1,308,9961,696,71974.8%1,070,5791,431,827Fall
74.3%116,168156,33679.5%15,47219,46373.6%100,696136,873Winter
75.3%2,314,4833,072,37276.8%1,234,4481,607,73173.7%1,080,0351,464,640Spring
76.3%5,612,2417,355,50877.1%2,732,4323,546,16075.6%2,879,8093,809,348Total
SOURCE OF DATA: Annual Enrollment (A1) Records

Illinois Community College BoardIllinois Community College Board
Table A-17Table A-16
FISCAL YEAR 2004 HEADCOUNT ENROLLMENTSFISCAL YEAR 2004 HEADCOUNT ENROLLMENTSBY CUMULATIVE GRADE POINT AVERAGEBY COLLEGE LEVEL HOURS ACCUMULATED
% of KnownStudents Gradepoint% of KnownEnrollmentHours
0.8%3,849 0.01 - 0.5066.6%323,9481-29
3.6%16,662 0.51 - 1.0019.8%96,38730-59
3.2%14,947 1.01 - 1.5011.2%54,22060-89
9.7%44,827 1.51 - 2.001.9%9,26590-119
12.5%57,781 2.01 - 2.500.4%2,103120-159
23.8%110,617 2.51 - 3.000.1%310160+
18.2%84,404 3.01 - 3.50100.0%486,233 Total Known
28.2%130,848 3.51 - 4.00
100.0%463,935 Total Known212,474 None/Unknown
234,772 Not Reported698,707Total
698,707 TotalSOURCE OF DATA: Annual Enrollment (A1) Records
SOURCE OF DATA: Annual Enrollment (A1) Records
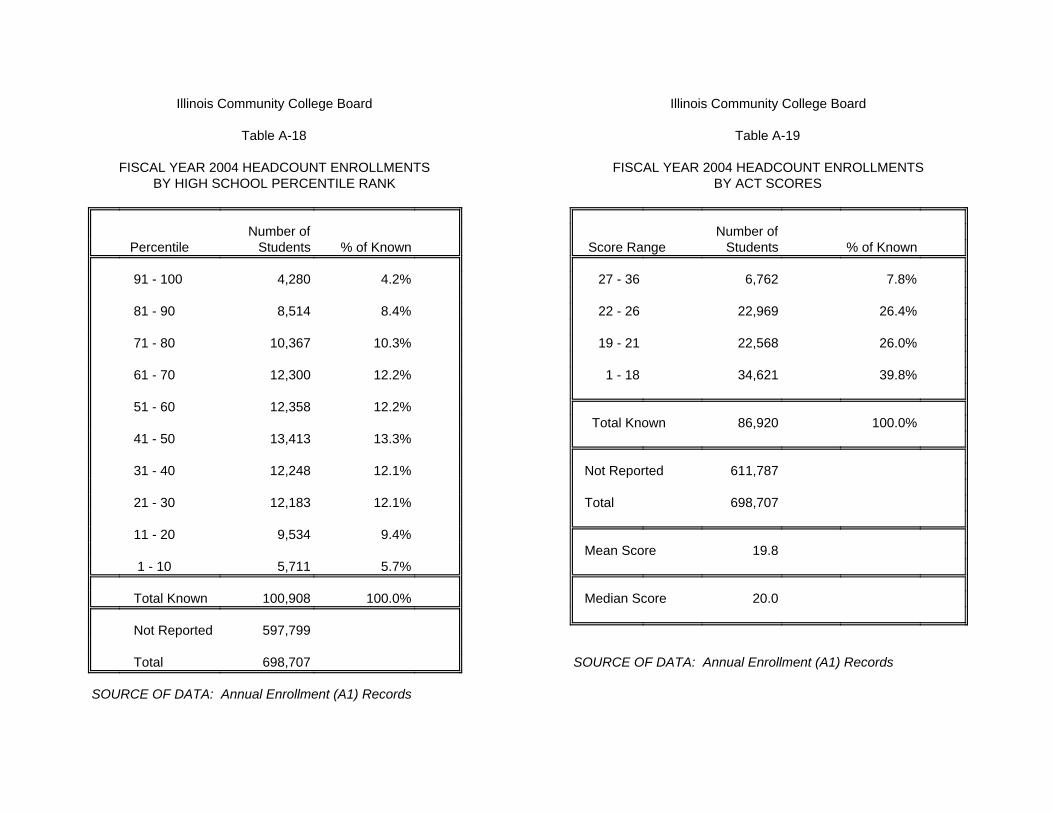
Illinois Community College BoardIllinois Community College Board
Table A-19Table A-18
FISCAL YEAR 2004 HEADCOUNT ENROLLMENTSFISCAL YEAR 2004 HEADCOUNT ENROLLMENTSBY ACT SCORESBY HIGH SCHOOL PERCENTILE RANK
Number ofNumber of% of KnownStudents Score Range% of KnownStudents Percentile
7.8%6,76227 - 364.2%4,280 91 - 100
26.4%22,96922 - 268.4%8,514 81 - 90
26.0%22,56819 - 2110.3%10,367 71 - 80
39.8%34,6211 - 1812.2%12,300 61 - 70
12.2%12,358 51 - 60100.0%86,920 Total Known
13.3%13,413 41 - 50
611,787 Not Reported12.1%12,248 31 - 40
698,707 Total12.1%12,183 21 - 30
9.4%9,534 11 - 2019.8 Mean Score
5.7%5,711 1 - 10
20.0 Median Score100.0%100,908 Total Known
597,799 Not Reported
SOURCE OF DATA: Annual Enrollment (A1) Records698,707 Total
SOURCE OF DATA: Annual Enrollment (A1) Records

Illinois Community College BoardTable A-20
COVERAGE OF ANNUAL VERSUS FALL ENROLLMENTS WITHIN THE SAME FISCAL YEARS (2000-2004)
FY 2004FY 2003FY 2002FY 2001FY 2000
698,707693,285676,412666,491668,676Annual Enrollment
365,019353,705339,002340,101339,673Enrollment During Fallof Same Fiscal Year
52.2%51.0%50.1%51.0%50.8%Percent of AnnualEnrollment

Student Enrollments & CompletionsFiscal Year 2004
Page 38
Appendix B
NONCREDIT COURSE ENROLLMENT DATA TABLES

Illinois Community College BoardTable B-1
SUMMARY COMPARISON OF ANNUAL UNDUPLICATED NONCREDIT COURSE ENROLLMENTSBY COLLEGE, FISCAL YEARS 2000 - 2004
% Change% ChangeFY 2004FY 2003FY 2002FY 2001FY 2000Dist. 2003-20042000-2004HeadcountHeadcountHeadcountHeadcountHeadcountDistrict/CollegeNo.
%-5.6%-39.55,031 5,328 5,552 6,200 8,309Black Hawk503 (-14.2)(-27.1)(29,609)(34,498)(35,129)*(37,253) (40,601)Chicago508
-10.1-12.05,0205,5855,435*5,751*5,702 Daley 06 -6.6-25.51,8061,9331,542*1,636 2,423 Kennedy-King 01
-16.2-12.32,0792,4812,586*2,454 2,370 Malcolm X 03 -32.8-44.62,7664,1143,833*4,270*4,997 Olive-Harvey 05
-5.2-34.73,1313,3043,485*4,315 4,796 Truman 04 -25.9-36.87,3919,97010,308*11,227*11,702 Washington 02
4.3-13.97,4167,1117,940*7,600*8,611 Wilbur-Wright 07 -1.8-17.1890906993 989*1,073Danville507 -6.0-14.718,94720,16621,572*24,021*22,224DuPage502
-13.3-23.15,8656,7677,230*7,484*7,623Elgin509-11.1-36.311,46812,90313,783 14,068 17,997Harper512
4.923.83,8023,6253,577*3,722 3,071Heartland540-39.0-67.06571,0771,372*1,906*1,990Highland519
6.821.09,2228,6339,430 8,466*7,619Illinois Central514(-3.2)(-40.7)(1,179)(1,218)(1,411) (1,299) (1,988)Illinois Eastern529
1.3-47.9312308387 410 599 Frontier 04 -25.1-69.2326435589 594 1,060 Lincoln Trail 01 12.0110.4484432384 247 230 Olney Central 02 32.6-42.4574351 48 99 Wabash Valley 03
1.7-4.43,8533,7874,364 4,133 4,031Illinois Valley513 -21.6-28.313,78217,57417,354*16,494 19,231Joliet525
3.1-19.73,7213,6084,009 4,546 4,633Kankakee520 -15.3-44.41,8782,2173,267*3,721 3,379Kaskaskia501 -31.8-36.32,8614,1934,055*4,402*4,491Kishwaukee523
8.922.037,51134,43332,911 33,304*30,758Lake County532 4.537.23,5403,3872,048 2,332 2,580Lake Land517
%16.2%48.66,4035,5123,814*4,735*4,310Lewis & Clark536

Illinois Community College BoardTable B-1
(Continued)SUMMARY COMPARISON OF ANNUAL UNDUPLICATED NONCREDIT COURSE ENROLLMENTS
BY COLLEGE, FISCAL YEARS 2000 - 2004
% Change% ChangeFY 2004FY 2003FY 2002FY 2001FY 2000Dist. 2003-20042000-2004HeadcountHeadcountHeadcountHeadcountHeadcountDistrict/CollegeNo.
%-34.2%-51.33,4295,210 4,715 6,199 7,044Lincoln Land526 2.0-29.62,6862,6333,532 3,863*3,818Logan530
-10.211.120,14822,42519,979 22,144 18,135McHenry528 -19.9-21.55,8767,3367,133 7,048 7,482Moraine Valley524 -12.5-20.69481,083888 1,241 1,194Morton527
-2.2-80.07,0427,1995,761 41,338 35,151Oakton535 -4.5-86.13,7813,9613,754*4,075 27,157Parkland505
-21.0-19.21,4591,8482,103 2,081*1,805Prairie State515 -14.9103.62,5512,9972,479 1,676 1,253Rend Lake521 -38.8-44.02,3373,8193,591 3,939 4,170Richland537 39.7113.219,25813,7879,506*9,269*9,031Rock Valley511
-25.719.72,3913,2172,572*2,437*1,997Sandburg518 -34.41.81,8752,8591,747 1,856*1,842Sauk Valley506 -10.1-88.362**69105 241 530Shawnee531 -23.1-41.22,5173,2753,203 2,680 4,280South Suburban510-15.2185.81,9292,2742,125*1,184*675Southeastern533
-0.545.84,3974,4184,676*3,054*3,016Southwestern/Belleville522 -25.4-42.91,2871,7252,359*2,387*2,255Spoon River534
-5.57.19,66910,2289,486*8,827 9,028Triton504 -12.7-63.63,2863,7653,760*4,358 9,021Waubonsee516
%-3.1%-29.23,2273,3293,9044,122*4,559Wood539
%-6.1%-23.3260,374277,289269,249313,094339,351TOTALS/AVERAGES
# Estimated*FY 2000 Data from Noncredit Course Enrollment Data (N1) Submission**Aggregate data provided from the Noncredit Enrollment SurveySOURCE OF DATA: FY 2000 - 2001 higher value generated by Noncredit Course Enrollment Data Submission or Annual Noncredit Enrollment Survey and FY 2002 - 2004 Noncredit Course Enrollment Data Submission (N1)

Illinois Community College BoardTable B-2
SUMMARY COMPARISON OF ANNUAL DUPLICATED NONCREDIT COURSE ENROLLMENTS BY COLLEGE, FISCAL YEARS 2000 - 2004
% Change% ChangeFY 2004FY 2003FY 2002FY 2001FY 2000Dist. 2003-20042000-2004HeadcountHeadcountHeadcountHeadcountHeadcountDistrict/CollegeNo.
%-8.0%-34.68,966*9,745*9,602*9,285*13,709Black Hawk503 (-17.5)(-30.8)(51,083) (61,890) (65,058) (67,408)*(73,856)Chicago508
-18.6-17.87,700*9,455*9,246*8,972*9,369 Daley 06 -3.3-24.92,524*2,609*2,156*2,099*3,362 Kennedy-King 01
-17.3-0.13,605*4,360*4,180*3,971*3,607 Malcolm X 03 -26.3-31.07,528*10,212*8,284*9,771*10,913 Olive-Harvey 05 -3.2-31.55,460*5,639*5,605*6,900*7,975 Truman 04
-28.0-46.810,301*14,300*19,704*20,653*19,350 Washington 02 -8.8-27.613,965 15,315 15,883 15,042*19,280 Wilbur-Wright 07 -6.3-20.01,022 1,091 1,157 1,232*1,278Danville507 -5.5-13.329,260*30,968*32,019*35,638*33,768DuPage502
-16.9-29.88,490*10,222*10,714*11,294*12,098Elgin509-7.2-17.723,177 24,977 26,355 26,829*28,164Harper512 11.321.96,800*6,107*5,769*6,159*5,579Heartland540
-43.3-71.5806*1,421*1,889*2,935*2,828Highland519 14.214.012,597 11,028 12,147 11,617*11,047Illinois Central514
(-11.8)(-39.2)(1,500) (1,700) (1,944) (1,833) (2,469)Illinois Eastern529 2.9-34.6429 417 523 572 656 Frontier 04
-45.6-71.0397 730 844 794*1,371 Lincoln Trail 01 13.861.5554 487 485 330 343 Olney Central 02 81.821.2120 66 92 137 99 Wabash Valley 03 -0.2-5.54,801*4,810*5,671*5,292*5,082Illinois Valley513
-22.4-24.014,530*18,721*37,002*17,602*19,110Joliet525 5.7-18.14,033 3,816 4,385 4,987 4,926Kankakee520
-24.5-56.72,963 3,922 6,714 8,239 6,843Kaskaskia501 -19.3-35.94,701*5,824*5,813*6,426*7,335Kishwaukee523
6.522.641,695 39,139 36,588 37,960*34,017Lake County532 5.729.24,182 3,958 2,429 3,130 3,237Lake Land517
%11.3%27.39,737*8,747*7,410*9,100*7,651Lewis & Clark536

Illinois Community College BoardTable B-2
(Continued)SUMMARY COMPARISON OF ANNUAL DUPLICATED NONCREDIT COURSE ENROLLMENTS
BY COLLEGE, FISCAL YEARS 2000 - 2004
% Change% ChangeFY 2004FY 2003FY 2002FY 2001FY 2000Dist. 2003-20042000-2004HeadcountHeadcountHeadcountHeadcountHeadcountDistrict/CollegeNo.
%-27.9%-53.96,0528,392 7,333 11,700 13,130Lincoln Land526 -19.2-40.52,6863,325 4,342 4,751*4,515Logan530 -12.210.924,30727,683 25,380 27,259 21,913McHenry528 -21.2-18.48,50110,793 10,078 9,969 10,423Moraine Valley524 -17.3-32.01,4111,707 1,470 2,270 2,075Morton527
1.8-66.011,25711,058 8,539 43,833 33,100Oakton535 -5.1-90.66,0566,383 5,531 5,610 64,512Parkland505
-24.3-16.92,1112,790*3,293*3,078*2,540Prairie State515 -11.1109.13,8374,316*3,417*2,243*1,835Rend Lake521 -36.7-37.53,2715,170*4,744*4,976*5,234Richland537 30.991.527,51721,022 18,317 15,766*14,369Rock Valley511
-28.520.04,0285,637*4,552*4,256*3,358Sandburg518 -31.67.52,6953,942*2,308*2,476*2,508Sauk Valley506 -36.1-89.062**97 140 523 564Shawnee531 -23.0-38.13,3894,404*4,578*3,883 5,479South Suburban510-17.2270.82,9223,530*3,345*1,512*788Southeastern533 -7.525.76,5617,092*7,562*4,364*5,220Southwestern/Belleville522
-45.2-25.42,2384,083*3,333*3,975*2,999Spoon River534 -6.5-15.114,36015,355*14,576*15,391 16,911Triton504
-19.3-72.34,0765,052*5,153*5,829 14,722Waubonsee516 %1.8%-26.26,6116,493*7,289*8,013*8,953Wood539
%-7.9%-26.3374,291406,410417,946448,643508,145
DNA-Data Not Available*FY 2000 -2001 Data from Noncredit Course Enrollment (N1) Data Submission**Aggregate data provided from the Noncredit Enrollment SurveySOURCE OF DATA: FY 2000-2001 higher value generated by Noncredit Course Enrollment Data Submission or Annual Noncredit Enrollment Survey and FY 2002-2004 Noncredit Course Enrollment Data Submission

Illinois Community College BoardTable B-3
SUMMARY COMPARISON OF NONREIMBURSABLE COURSE SECTIONS CONDUCTEDBY COLLEGE, FISCAL YEARS 2000 - 2004
% Change% ChangeFY 2004FY 2003FY 2002FY 2001FY 2000Dist. 2003-20042000-2004SectionsSectionsSectionsSectionsSectionsDistrict/CollegeNo.
%-11.9%-26.98529678611,407*1,166Black Hawk503 (-12.4)(-39.4)(3,470)(3,961)(4,195)(5,191) (5,725)Chicago508
-25.6-41.6486653648840 832 Daley 06 3.6-55.3144139163222 322 Kennedy-King 01
-22.6-18.3236305300355 289 Malcolm X 03 -17.2-54.4370447453724 812 Olive-Harvey 05
3.0-36.6373362402552 588 Truman 04 -17.4-45.26628019091,199 1,208 Washington 02 -4.4-28.41,1991,2541,3201,299 1,674 Wilbur-Wright 07 -6.113.7108115123109*95Danville507 1.10.22,7162,6862,6862,886*2,711DuPage502 0.7-23.99169101,148*1,105 1,203Elgin5094.6-30.31,7891,7111,8492,615 2,566Harper512
-7.9-15.4692751527907 818Heartland540-51.9-76.864133158321 276Highland519 56.648.8570364390544*383Illinois Central514
(-20.9)(-47.1)(117)(148)(152)(143) (221)Illinois Eastern529 -5.7-13.233354334 38 Frontier 04
-55.9-76.430686662 127 Lincoln Trail 01 18.5-20.032272832 40 Olney Central 02 22.237.522181515 16 Wabash Valley 03 -6.110.4382407438*390 346Illinois Valley513
-17.3-10.81,2691,5341,5221,521 1,422Joliet525 6.076.5443418244267 251Kankakee520
17.5-4.4262223243538*274Kaskaskia501 -5.22.3488515480491*477Kishwaukee523 1.025.31,9001,8821,6201,555*1,516Lake County532
36.441.9281206184233 198Lake Land517 %-2.4%-38.0409419421*833*660Lewis & Clark536

Illinois Community College BoardTable B-3
(Continued)SUMMARY COMPARISON OF NONREIMBURSABLE COURSE SECTIONS CONDUCTED
BY COLLEGE, FISCAL YEARS 2000 - 2004
% Change% ChangeFY 2004FY 2003FY 2002FY 2001FY 2000Dist. 2003-20042000-2004SectionsSectionsSectionsSectionsSectionsDistrict/CollegeNo.
%-21.9%-34.0418535433720 633Lincoln Land526 -13.1-34.6166191242250*254Logan530 -3.2-3.81,3751,4201,4501,4831,430McHenry528
-16.6-24.6719862917963 953Moraine Valley524 2.8-55.7747267178 167Morton527
-1.4-52.8631640478549 1,336Oakton535 -3.8-81.3329342308422 1,758Parkland505
-27.7-36.8170235*338*331 269Prairie State515 8.235.7369341297282 272Rend Lake521
-45.7-60.4184339368574 465Richland537 46.642.21,8661,2731,2551,542 1,312Rock Valley511
-20.222.0316396336371 259Sandburg518 -15.1-14.3191225*183*175*223Sauk Valley506 -30.0-87.37**101341 55Shawnee531 -1.1-36.0456461482501 712South Suburban510-7.8118.41071168886 49Southeastern533
-12.816.7566649673429*485Southwestern/Bellevil522 -34.4-41.3172262250335 293Spoon River534 -8.3-46.1506552660906 938Triton504
-18.1-63.0448547563586 1,211Waubonsee516 %12.1%-3.9565504512591 588Wood539
%-3.5%-22.426,36327,32227,15432,37133,970TOTALS/AVERAGES
*FY 2000 - FY 2001 Data from Noncredit Course Enrollment Data Submission**Aggregate data provided from the Noncredit Enrollment SurveySOURCE OF DATA: FY 2000 -2001 higher value generated by Noncredit Course Enrollment Data Submission or Annual Noncredit Enrollment Survey and FY2002 - 2004 Noncredit Course Enrollment Data Submission (N1)

Illinois Community College Board
Table B-4
FISCAL YEAR 2004 ANNUAL UNDUPLICATED NONCREDIT HEADCOUNTENROLLMENTS BY GENDER AND CATEGORY OF ACTIVITY
GrandTotalTotalUnknownKnownFemaleMaleCategory of Activity
24,58280100.0%24,50251.6%12,65448.4%11,848Business and Industry10.6%9.6%11.9%Contract
53,0821,038100.0%52,04460.5%31,50139.5%20,543Professional/Vocational22.5%23.8%20.7%Development
150,92426,470100.0%124,45458.1%72,25441.9%52,200Personal and Social53.7%54.6%52.5%Development
31,786989100.0%30,79751.9%15,98448.1%14,813Youth Programs13.3%12.1%14.9%
260,37428,577100.0%231,79757.1%132,39342.9%99,404 TOTALS100.0%100.0%100.0%
SOURCE OF DATA: Noncredit Course Enrollment (N1) Records

Illinois Community College Board
Table B-5
FISCAL YEAR 2004 ANNUAL UNDUPLICATED NONCREDIT HEADCOUNTENROLLMENTS BY RACIAL\ETHNIC ORIGIN AND CATEGORY OF ACTIVITY
GrandTotalAfrican American/TotalUnknownKnownAlienWhiteHispanicBlackAm IndianAsianCategory of Activity
24,5824,014100.0%20,5680.5%10477.7%15,9846.5%1,33911.4%2,3480.5%993.4%694Business and Industry11.3%7.5%11.6%9.2%11.8%17.2%8.5%Contract
53,0829,239100.0%43,8430.7%31065.9%28,8958.4%3,68819.9%8,7210.4%1914.6%2,038Professional/Vocational24.1%22.3%21.0%25.5%43.8%33.3%24.9%Development
150,92458,472100.0%92,4520.6%59780.8%74,7087.9%7,2916.3%5,8360.3%2344.1%3,786Personal and Social50.8%42.9%54.4%50.3%29.3%40.8%46.3%Development
31,7866,685100.0%25,1011.5%37971.0%17,8258.6%2,16812.0%3,0220.2%506.6%1,657Youth Program13.8%27.3%13.0%15.0%15.2%8.7%20.3%
260,37478,410100.0%181,9640.8%1,39075.5%137,4128.0%14,48611.0%19,9270.3%5744.5%8,175 TOTALS100.0%100.0%100.0%100.0%100.0%100.0%100.0%
SOURCE OF DATA: Noncredit Course Enrollment (N1) Records

Illinois Community College Board
Table B-6
FISCAL YEAR 2004 ANNUAL UNDUPLICATED NONCREDIT HEADCOUNTENROLLMENTS BY AGE GROUP AND CATEGORY OF ACTIVITY
GrandTotalTotalUnknownKnownOver 5540-5531-3925-3021-2417-2016 & Under
24,5823,432100.0%21,15010.7%2,26545.9%9,71322.3%4,70612.3%2,6126.3%1,3232.3%4840.2%47Business and Industry 11.0%7.1%15.1%14.1%12.0%9.2%2.8%0.5%Contract
53,0823,937100.0%49,14512.8%6,30939.5%19,39219.7%9,67112.9%6,3397.4%3,6496.3%3,0771.4%708Professional/Vocational 25.5%19.7%30.2%28.9%29.1%25.5%17.6%7.8%Development
150,92435,853100.0%115,07120.2%23,19930.2%34,75516.4%18,81711.0%12,6198.1%9,26810.9%12,5773.3%3,836Personal and Social59.8%72.3%54.0%56.3%57.8%64.7%71.8%42.1%Development
31,78624,578100.0%7,2084.2%3016.2%4503.2%2313.4%2471.1%7819.0%1,37262.8%4,529Youth Program3.7%0.9%0.7%0.7%1.1%0.5%7.8%49.7%
260,37467,800100.0%192,57416.7%32,07433.4%64,31017.4%33,42511.3%21,8177.4%14,3189.1%17,5104.7%9,120 TOTALS100.0%100.0%100.0%100.0%100.0%100.0%100.0%100.0%
SOURCE OF DATA: Noncredit Course Enrollment (N1) Records

Illinois Community College Board
Table B-7
FISCAL YEAR 2004 LARGEST NONCREDIT COURSEWORKBASED ON DUPLICATED ENROLLMENTS BY
TWO DIGIT CLASSIFICATION OF INSTRUCTIONAL PROGRAM (CIP) CATEGORIES
EnrollmentCourse Area (2 Digit CIP)
77,418Leisure and Recreation
53,312Self Improvement
46,782Business Management
24,758Transportation
11,988Basic Skills
11,520Health Professions
9,887Computer Information Systems
8,500Visual and Performing Arts
SOURCE OF DATA: Noncredit Course Enrollment (N1) Records

Illinois Community College Board
Table B-8
FISCAL YEAR 2004 DUPLICATEDNONCREDIT HEADCOUNT ENROLLMENTS
BY INSTRUCTIONAL SITE
Percentof TotalEnrollmentInstructional Site
%61.2229,194Main Campus
%13.048,786Off-campus College Owned
%7.226,787Off-campus College Leased
%13.751,233Community Based
%4.818,072Business Based
%0.1219Other
%100.0374,291Total
SOURCE OF DATA: Noncredit Course Enrollment (N1) Records

Illinois Community College Board
Table B-9
FISCAL YEAR 2004 DUPLICATED NONCREDIT HEADCOUNT ENROLLMENTS BY TERM
% of TotalTotal
%26.498,848 Summer
%31.5117,770 Fall
%1.97,084 Winter
%40.2150,589 Spring
%100.0374,291 Total
SOURCE OF DATA: Noncredit Course Enrollment (N1) Records

Illinois Community College Board
Table B-10
FISCAL YEAR 2004 UNDUPLICATEDNONCREDIT HEADCOUNT ENROLLMENTS
BY HIGHEST DEGREE EARNED PRIOR TO ENROLLMENT
Percentof KnownEnrollment Degree
%3.72,784 GED
%45.734,810 High School
%13.710,406 Some College Courses
%2.62,003 Certificate
%8.26,229 Associate Degree
%15.511,799 Bachelor's Degree
%7.45,627 Master's Degree
%0.5345 First Professional Degree
%1.1802 Doctoral Degree
%1.71,312 Other
%100.076,117 Total Known
184,257 None/Unknown
260,374 Grand Total
SOURCE OF DATA: Noncredit Course Enrollment (N1) Records

Illinois Community College Board
Table B-11
FISCAL YEAR 2004 ANNUAL UNDUPLICATEDNONCREDIT HEADCOUNT ENROLLMENTS
BY NUMBER OF HOURS
Percentof KnownEnrollmentHours
%48.2117,9531-4
%20.850,8455-9
%11.628,33610-14
%6.816,66215-19
%5.112,39320-24
%1.02,35425-29
%4.09,91730-59
%1.63,94460-89
%0.243090-119
%0.1309120-159
%0.71,729160+
%100.0244,872 Total Known
15,502 None/Unknown
260,374Grand Total
SOURCE OF DATA: Noncredit Course Enrollment (N1) Records

Illinois Community College Board
Table B-12
FISCAL YEAR 2004 ANNUAL DUPLICATED NONCREDIT HEADCOUNTENROLLMENTS BY CATEGORY OF ACTIVITY
DuplicatedPercentEnrollmentCategory of Activity
%9.234,273Business and Industry Contract
%20.676,917Professional/Vocational Development
%54.1202,647Personal and Social Development
%16.260,454Youth Program
%100.0374,291TOTAL
SOURCE OF DATA: Noncredit Course Enrollment (N1) Records

Student Enrollments & CompletionsFiscal Year 2004
Page 54
Appendix C
COMPLETION DATA TABLES

Illinois Community College BoardTable C-1
SUMMARY COMPARISON OF ANNUAL DUPLICATED COMPLETIONS*BY COLLEGE, FISCAL YEARS 2000-2004
% Change% ChangeFY 2004FY 2003FY 2002FY 2001FY 2000Dist. 2003-20042000-2004 Completions Completions Completions Completions CompletionsDistrict/CollegeNo.
%-1.1%-5.2745753848683786Black Hawk503 (20.6)(73.2)(8,076)(6,694)(5,236)(6,698)(4,662)Chicago508
0.142.2819818656492576 Daley 06 -10.8-43.9472529788913842 Kennedy-King 01
9.319.0433396370331364 Malcolm X 03 -36.753.5591934283490385 Olive-Harvey 05 -10.4-7.3734819779591792 Truman 04 70.9228.24,0432,3661,5423,1421,232 Washington 02 18.3108.9984832818739471 Wilbur-Wright 07 -4.5-26.4256268317323348Danville507 -4.129.83,3373,4802,7192,7062,570DuPage502 0.993.42,0081,9901,5181,0431,038Elgin5091.64.01,4281,4051,3411,3281,373Harper512 1.054.9604598532431390Heartland5401.234.9348344305313258Highland519 2.66.01,5661,5261,4501,5641,477Illinois Central514
(-3.1)(15.0)(1,416)(1,462)(1,374)(1,322)(1,231)Illinois Eastern529 -16.7-2.1185222221159189 Frontier 04
-3.2-1.3454469417409460 Lincoln Trail 01 7.993.8504467465488260 Olney Central 02
-10.2-15.2273304271266322 Wabash Valley 03 -5.130.0845890859750650Illinois Valley513 6.814.61,006942946941878Joliet525
44.65.0441305317420420Kankakee520 6.270.2977920878800574Kaskaskia501 6.953.0779729678571509Kishwaukee523
10.648.91,7651,5961,4581,1871,185Lake County532 2.213.01,4371,4061,3441,3011,272Lake Land517
%52.6%39.71,108726715742793Lewis & Clark536

Illinois Community College BoardTable C-1
(Continued)SUMMARY COMPARISON OF ANNUAL DUPLICATED COMPLETIONS*
BY COLLEGE, FISCAL YEARS 2000-2004
% Change% ChangeFY 2004FY 2003FY 2002FY 2001FY 2000Dist. 2003-20042000-2004 Completions Completions Completions Completions CompletionsDistrict/CollegeNo.
%-8.7%26.31,4231,5581,3961,1771,127Lincoln Land526 10.553.7944854748720614Logan530 22.018.2787645676698666McHenry528
8.516.31,4451,3321,3031,2901,242Moraine Valley524 -12.121.2378430373356312Morton527 43.468.41,044728728674620Oakton535
1.934.01,0961,076822815818Parkland50516.24.7530456354435506Prairie State515 28.2117.61,040811766595478Rend Lake521 13.670.5544479479430319Richland537 16.132.31,4371,2389621,1711,086Rock Valley511
-15.64.7450533466470430Sandburg518 -42.249.7515891444419344Sauk Valley506
-4.53.4276289117240267Shawnee531 16.5125.01,5321,315931912681South Suburban51013.18.9744658784721683Southeastern533
-23.951.52,5813,3922,2971,7711,704Southwestern/Belleville522 12.012.0280250279230250Spoon River534 -0.7-17.68938999299601,084Triton504 52.981.91,466959787842806Waubonsee516
%-12.5%25.8439502470371349Wood539
%5.9%37.947,98645,32938,94638,42034,800TOTALS/AVERAGES
*Collegiate level only - advancements in adult education and ESL programs are not included.
SOURCE OF DATA: Annual Enrollment and Completions (A1) Data

Illinois Community College Board
Table C-2
COMPARISON OF ANNUAL DUPLICATED COMPLETIONS*BY DEGREE, FISCAL YEARS 2000-2004
20042003200220012000 COLLEGIATE LEVEL
1.8%8721.9%8702.1%8112.4%9062.9%1,021 GENERAL ASSOCIATE0.2%7.3%-10.5%-11.3%21.0% Percent Change
29.2%14,02230.0%13,59932.8%12,76133.4%12,84436.9%12,852 BACC/TRANSFER3.1%6.6%-0.6%-0.1%-1.1% Percent Change
8,5488,2787,7117,7987,861 Assoc. in Arts4,3634,2504,0684,1034,272 Assoc. in Science
946887831797578 Assoc. in Arts & Science103110939284 Assoc. in Engineering Science6274585457 Assoc. in Fine Arts
68.9%33,08068.1%30,85465.1%25,36664.1%24,63360.0%20,881 CAREER & TECHNICAL ED.7.2%21.6%3.0%18.0%6.0% Percent Change
8,7468,5078,1458,3718,604 Assoc. in Applied Science5,2524,8434,6024,7884,547 Cert. of 1 Yr. or More
18,79417,25412,39811,3807,442 Cert. of Less than 1 Yr.28825022194288 Vocational Skills Cert.
0.0%120.0%60.0%80.1%370.1%46 GENERAL STUDIES CERT.100.0%-25.0%-78.4%-19.6%360.0% Percent Change
100.0%47,986100.0%45,329100.0%38,946100.0%38,420100.0%34,800 TOTAL COMPLETIONS5.9%16.4%1.4%10.4%3.8% Percent Change
* Collegiate level only - advancements in adult education and ESL programs are not included.
SOURCE OF DATA: Annual Enrollment & Completion (A1) Records

Illinois Community College Board
Table C-3
FISCAL YEAR 2004 DUPLICATED COMPLETERS*BY DEGREE AND GENDER
TotalFemaleMale COLLEGIATE LEVEL
1.8%8721.7%4532.0%419 GENERAL ASSOCIATE100.0%51.9%48.1%
29.2%14,02231.4%8,58526.4%5,437 BACC/TRANSFER100.0%61.2%38.8%
8,5485,4533,095 Assoc. in Arts4,3632,5051,858 Assoc. in Science
946575371 Assoc. in Arts & Science1031984 Assoc. in Engineering Science623329 Assoc. in Fine Arts
68.9%33,08067.0%18,32271.6%14,758 CAREER & TECHNICAL ED.100.0%55.4%44.6%
8,7465,7882,958 Assoc. in Applied Science5,2523,0802,172 Cert. of 1 Yr. or More
18,7949,2489,546 Cert. of Less than 1 Yr.28820682 Vocational Skills Cert.
0.0%120.0%50.0%7 GENERAL STUDIES CERT.100.0%41.7%58.3%
100.0%47,986100.0%27,365100.0%20,621 TOTAL COMPLETIONS100.0%57.0%43.0%
* Collegiate level only - advancements in adult education and ESL programs are not included.
SOURCE OF DATA: Annual Enrollment & Completion (A1) Records

Illinois Community College Board
Table C-4
FISCAL YEAR 2004 DUPLICATED COMPLETERS*BY DEGREE AND ETHNICITY
TotalUnknownAlienWhiteHispanicBlackAm IndianAsian COLLEGIATE LEVEL
1.8%8720.7%11.0%21.6%5521.8%693.1%2262.4%50.6%17 GENERAL ASSOCIATE100.0%0.1%0.2%63.3%7.9%25.9%0.6%1.9%
29.2%14,02232.1%4437.8%7433.5%11,25424.4%95516.8%1,21216.7%3516.4%448 BACC/TRANSFER100.0%0.3%0.5%80.3%6.8%8.6%0.2%3.2%
8,54839216,56971291024273 Assoc. in Arts4,3635373,65922027411157 Assoc. in Science
946012893922010 Assoc. in Arts & Science10303808408 Assoc. in Eng. Science6201536200 Assoc. in Fine Arts
68.9%33,08067.2%9261.2%12064.8%21,74673.9%2,89380.1%5,79180.9%16983.0%2,269 CAREER & TECHNICAL ED.100.0%0.3%0.4%65.7%8.7%17.5%0.5%6.9%
8,74626376,95050187229331 Assoc. in Applied Science5,25217143,67644692921149 Cert. of 1 Yr. or More
18,794496911,0221,8903,9121151,737 Cert. of Less than 1 Yr.28800985678452 Vocational Skills Cert.
0.0%120.0%00.0%00.0%120.0%00.0%00.0%00.0%0 GENERAL STUDIES CERT.100.0%0.0%0.0%100.0%0.0%0.0%0.0%0.0%
100.0%47,986100.0%137100.0%196100.0%33,564100.0%3,917100.0%7,229100.0%209100.0%2,734 TOTAL COMPLETIONS100.0%0.3%0.4%69.9%8.2%15.1%0.4%5.7%
* Collegiate level only - advancements in adult education and ESL programs are not included.
SOURCE OF DATA: Annual Enrollment & Completion (A1) Records

Illinois Community College Board
Table C-5
FISCAL YEAR 2004 DUPLICATED COMPLETERS*BY DEGREE AND AGE GROUP
TotalUnknownOver 5540-5531-3925-3021-24Under 21 COLLEGIATE LEVEL
1.8%8722.5%22.2%262.2%1952.4%2001.9%1691.7%2540.4%26 GENERAL ASSOCIATE100.0%0.2%3.0%22.4%22.9%19.4%29.1%3.0%
29.2%14,02213.8%115.1%599.7%85513.4%1,13222.3%1,97848.8%7,18347.5%2,804 BACC/TRANSFER100.0%0.1%0.4%6.1%8.1%14.1%51.2%20.0%
8,5485476037121,2734,5231,385 Assoc. in Arts4,3634102043585922,1431,052 Assoc. in Science
94621334687432345 Assoc. in Arts & Science10300514184818 Assoc. in Eng. Science
62011028374 Assoc. in Fine Arts
68.9%33,08083.8%6792.6%1,07988.1%7,77984.1%7,08275.7%6,70649.5%7,29652.0%3,071 CAREER & TECHNICAL ED.100.0%0.2%3.3%23.5%21.4%20.3%22.1%9.3%
8,746161471,7871,8651,8602,606465 Assoc. in Applied Science5,25261111,2551,1911,1651,168356 Cert. of 1 Yr. or More
18,794458174,6943,9613,5993,4522,226 Cert of Less than 1 Yr.288044365827024 Vocational Skills Cert.
0.0%120.0%00.1%10.1%50.0%40.0%00.0%10.0%1 GENERAL STUDIES CERT.100.0%0.0%8.3%41.7%33.3%0.0%8.3%8.3%
100.0%47,986100.0%80100.0%1,165100.0%8,834100.0%8,418100.0%8,853100.0%14,734100.0%5,902 TOTAL COMPLETIONS100.0%0.2%2.4%18.4%17.5%18.4%30.7%12.3%
* Collegiate level only - advancements in adult education and ESL programs are not included.
SOURCE OF DATA: Annual Enrollment & Completion (A1) Records

Illinois Community College Board
Table C-6
FISCAL YEAR 2004 DUPLICATED COMPLETERS*BY DEGREE AND STUDENT INTENT**
PersonalImprovePrepare forImprovePrepare forOtherInterest/Basic SkillsJob AfterPresentTransfer toor NoSelfor PrepareCommunityJobFour-Year
TotalIndicationDevelopmentfor GEDCollegeSkillsInstitution COLLEGIATE LEVEL
1.8%8722.5%1082.6%800.8%41.2%1911.1%742.4%415 GENERAL ASSOCIATE100.0%12.4%9.2%0.5%21.9%8.5%47.6%
29.2%14,02231.1%1,32623.1%71113.7%677.3%1,1494.6%31459.8%10,455 BACC/TRANSFER100.0%9.5%5.1%0.5%8.2%2.2%74.6%
8,548685561517252326,294 Assoc. in Arts4,36325413014348673,550 Assoc. in Science
9463731327113474 Assoc. in Arts & Science10311502184 Assoc. in Eng. Science
623203153 Assoc. in Fine Arts
68.9%33,08066.4%2,83474.2%2,28585.5%41791.5%14,43994.3%6,48237.9%6,623 CAREER & TECHNICAL ED.100.0%8.6%6.9%1.3%43.6%19.6%20.0%
8,746898486464,4238902,003 Assoc. in Applied Science5,252483328392,787624991 Cert. of 1 Yr. or More
18,7941,4301,4473327,1874,9573,441 Cert. of Less than 1 Yr.288232404211188 Vocational Skills Cert.
0.0%120.0%00.1%20.0%00.0%50.0%20.0%3 GENERAL STUDIES CERT.100.0%0.0%16.7%0.0%41.7%16.7%25.0%
100.0%47,986100.0%4,268100.0%3,078100.0%488100.0%15,784100.0%6,872100.0%17,496 TOTAL COMPLETIONS100.0%8.9%6.4%1.0%32.9%14.3%36.5%
* Collegiate level only - advancements in adult education and ESL programs are not included.**Current student intent is examined. When not available, student intent at time of college entrance is used.
SOURCE OF DATA: Annual Enrollment & Completion (A1) Records

Illinois Community College Board
Table C-7
FISCAL YEAR 2004 DUPLICATED COMPLETERS*BY DEGREE AND DEGREE OBJECTIVE
Complete OneTo Completeor Several
Noan AssociateTo CompleteCourses - NotTotalIndicationDegreea CertificatePursuing Degree COLLEGIATE LEVEL
1.8%8720.0%02.4%6351.0%1041.2%133 GENERAL ASSOCIATE100.0%0.0%72.8%11.9%15.3%
29.2%14,02237.1%5341.8%11,1664.6%45721.1%2,346 BACC/TRANSFER100.0%0.4%79.6%3.3%16.7%
8,548466,5403261,636 Assoc. in Arts4,36373,588105663 Assoc. in Science
94609061822 Assoc. in Arts & Science103084811 Assoc. in Eng. Science62048014 Assoc. in Fine Arts
68.9%33,08062.9%9055.8%14,90594.4%9,44177.7%8,644 CAREER & TECHNICAL ED.100.0%0.3%45.1%28.5%26.1%
8,746266,8066021,312 Assoc. in Applied Science5,252262,4681,855903 Cert. of 1 Yr. or More
18,794385,4006,9746,382 Cert. of Less than 1 Yr.28802311047 Vocational Skills Cert.
0.0%120.0%00.0%50.0%30.0%4 GENERAL STUDIES CERT.100.0%0.0%41.7%25.0%33.3%
100.0%47,986100.0%143100.0%26,711100.0%10,005100.0%11,127 TOTAL COMPLETIONS100.0%0.3%55.7%20.8%23.2%
* Collegiate level only - advancements in adult education and ESL programs are not included.
SOURCE OF DATA: Annual Enrollment & Completion (A1) Records

Illinois Community College Board
Table C-8
COMPARISON OF ANNUAL DUPLICATED COMPLETIONS*BY ASSOCIATE DEGREES AND CERTIFICATES, FISCAL YEARS 2000-2004
% Change% Change20042003200220012000 COLLEGIATE LEVEL2003-20042000-2004
2.9%5.2%49.3%23,64050.7%22,97655.8%21,71757.6%22,12164.6%22,477ASSOCIATE DEGREES2.9%5.8%-1.8%-1.6%0.1% Percent Change
8.9%97.6%50.7%24,34649.3%22,35344.2%17,22942.4%16,29935.4%12,323CERTIFICATES8.9%29.7%5.7%32.3%11.1% Percent Change
5.9%37.9%100.0%47,986100.0%45,329100.0%38,946100.0%38,420100.0%34,800 TOTAL COMPLETIONS5.9%16.4%1.4%10.4%3.8% Percent Change
* Collegiate level only - advancements in adult education and ESL programs are not included.
SOURCE OF DATA: Annual Enrollment & Completion (A1) Records