iiii - self storage publications, books, & education · iiii ideas into action cushman &...
TRANSCRIPT


I D E A S I N T O A C T I O N
Cushman & Wakefield’s Self Storage practice group combines local experience
with international resources. Our clients benefit from our market research
database, geographic coverage, and single point of accountability. With more
than 20 practice group members serving 100 major markets, we leverage our
expertise to quantify the current value and projected performance of your
real estate. What can our team do for you? cushwakeselfstorage.com
S E L F S T O R A G E I N D U S T R Y G R O U P
FOR OUR CLIENTS
WE DELIVEREXCEPTIONAL RESULTS CREATED THROUGH INSIGHT
KATE SPENCER, MAI, Managing Director
+1 214 558 9953 [email protected]
Appraisal | Brokerage | Due Diligence for Acquisition | Litigation Support | Market & Feasibility Studies
Portfolio Valuation | Self Storage Data Services (SSDS) | Property Tax Services


4 THE 2017 SELF-STORAGE EXPENSE GUIDEBOOK
Welcome to the 2017 Self-Storage
Expense GuideBook. First published in 2004, the
Expense GuideBook was the result of many requests for additional expense information above and beyond what was traditionally presented in the Self-Storage
Almanac. Over the past 12 years, it has become one of the most sought after products produced by MiniCo Publishing.
Just as we continue to refine the scope of the Self-Storage Almanac, so do we strive to continually improve the scope of the data in the
Expense GuideBook. As such, we would like to offer a very special thank you to Aaron Swerdlin, Executive Managing Director of NGKF Capital Markets Self Storage Group, and Kate Spencer, Managing Director of Self Storage at Cushman & Wakefield, for their partnership and invaluable contribution to this project. Their insight into industry trends and data helped to make this edition possible.
Once again in this year’s edition you will find the overall expense to income ratio on a national basis, as well as overall facility income and rental revenue growth and the traditional expense data broken down into more precise categories.
It is important to note that the data in this edition is not collected on a same store basis; therefore, the numbers represent an average based on the facilities that responded to the 2017 Expense GuideBook Survey and partner data.
For additional self-storage data and statistics, we suggest that you look to the 2017 Self-Storage Almanac and the many other educational products offered by MiniCo Publishing. Above all, we hope you find this edition of the Expense GuideBook to be a valuable tool with which to pursue your self-storage endeavors.
Publisher’s Note
PUBLISHERPoppy Behrens
PRODUCTION MANAGERJeffry Pettingill
EDITORErica Shatzer
ADVERTSINGSALES EXECUTIVE
James Appleton(800) 824-6864
PUBLISHING COORDINATORSamantha Traina(602) 308-6340
CIRCULATION & ONLINE SALES COORDINATOR
Ginger Coates(800) 352-4636
SUBSCRIPTION SALES& CUSTOMER SERVICE
(800) 352-4636
WEBSITESwww.ministoragemessenger.com
www.minico.com • www.aranins.com
Unsolicited manuscripts, artwork and photographmust be accompanied by an addressed return
envelope and the necessary postage.Publisher assumes no responsibility
for the return of materials.
© 2017 MiniCo Insurance Agency, LLC.
All rights reserved. Reproduction in whole orin part without written permission is prohibited.
Printed in the United States.
Poppy Behrens –Publisher

THE 2017 SELF-STORAGE EXPENSE GUIDEBOOK 5
The 2017 Expense GuideBookFor more than 38 years, real estate professionals, investors, brokers, owners, managers, researchers, appraisers, govern-
mental agencies, and market observers across the country have turned to MiniCo’s publications to answer questions about
self-storage data, statistics, and information. First published in 2004, the Self-Storage Expense GuideBook was the result of
numerous requests from readers of the annual Self-Storage Almanac who were looking for additional information regarding
operating expense data for self-storage properties.
Since its inception, the Expense GuideBook has become the industry’s leading source of self-storage operating expense
information, offering ranges and averages by region in the major facility expense categories. Once again partnering with the
self-storage team at Newmark Grubb Knight Frank, we are proud to present the 2017 Expense GuideBook, offering valuable
industry expense information in a new format, which includes newly defined categories as designated in the map below:
The 2017 edition of the GuideBook is based upon responses from owners and operators of self-storage properties, nation-
wide. Important to note is that the statistical base does not include data from any large operators—including any of the publi-
cally traded companies. Therefore, it is important to note that the context of this data is more consistent with owners and
operators of small portfolios of properties, or even just one property, and does not reflect significant economies of scale. We
believe that this dynamic makes the data extremely relevant on an individual basis. Moreover, it also provides a dataset against
which the publically reported operating data can be compared; and from that the economies of portfolios may be gleaned.
FLORIDA
ALABAMA
MARYLAND
CALIFORNIACOLORADO
CONNECTICUT
DELAWARE
ARKANSAS
GEORGIA
IDAHO
IOWA
KANSAS KENTUCKY
LOUISIANA
MAINE
MASSACHUSETTS
MICHIGAN
MINNESOTA
MISS
MISSOURI
MONTANA
NEBRASKA
NEVADA
NEW HAMPSHIRE
NEW JERSEY
NEW YORK
NORTHCAROLINA
NORTH DAKOTA
OHIO
OKLAHOMA
OREGON
PENNSYLVANIA
RHODE ISLAND
SOUTH CAROLINA
SOUTH DAKOTA
TENNESSEE
TEXAS
UTAH
VERMONT
VIRGINIA
WEST VA
WASHINGTON
WASHINGTON D.C.
WISCONSIN
WYOMING
INDIANA ILLINOIS
NEW MEXICOARIZONA
WEST / SOUTHWEST SOUTH MIDWEST SOUTHEAST EAST

6 THE 2017 SELF-STORAGE EXPENSE GUIDEBOOK
Occupancy Data
Both economic and physical occupancy data were collected as seen in Table 1. Based upon the consolidated responses, when
measured against the published data from large operators, significant upside exists in the operating performance of privately
operated facilities. Although discounts and rent concession data was not collected, based upon the variance between physical
and economic occupancy, it is likely that the variance is an indication of where the respective region operates with discounts
and concessions. And although this is one way to interpret the data, other factors influence the variance, such as average length
of stay, aggressiveness of rate increases on existing tenants, frequency of street rate increases, and delinquent rent recovery.
Make-Up Of IncomeFacility income is reflected in Tables 2 and 3. As seen in Table 2, income generated at a facility, excluding rent revenue, is a
major contributor to profit. Managing the other income sources, and recognizing the impact on NOI, is critical to maximizing
the profitability of the facility. Again, keeping in mind that a majority of respondents operate as small or one-off operators,
contrasting these categories (especially the tenant insurance income) to the large operators, the potential for revenue growth
in non-rent categories exceed incremental amounts.
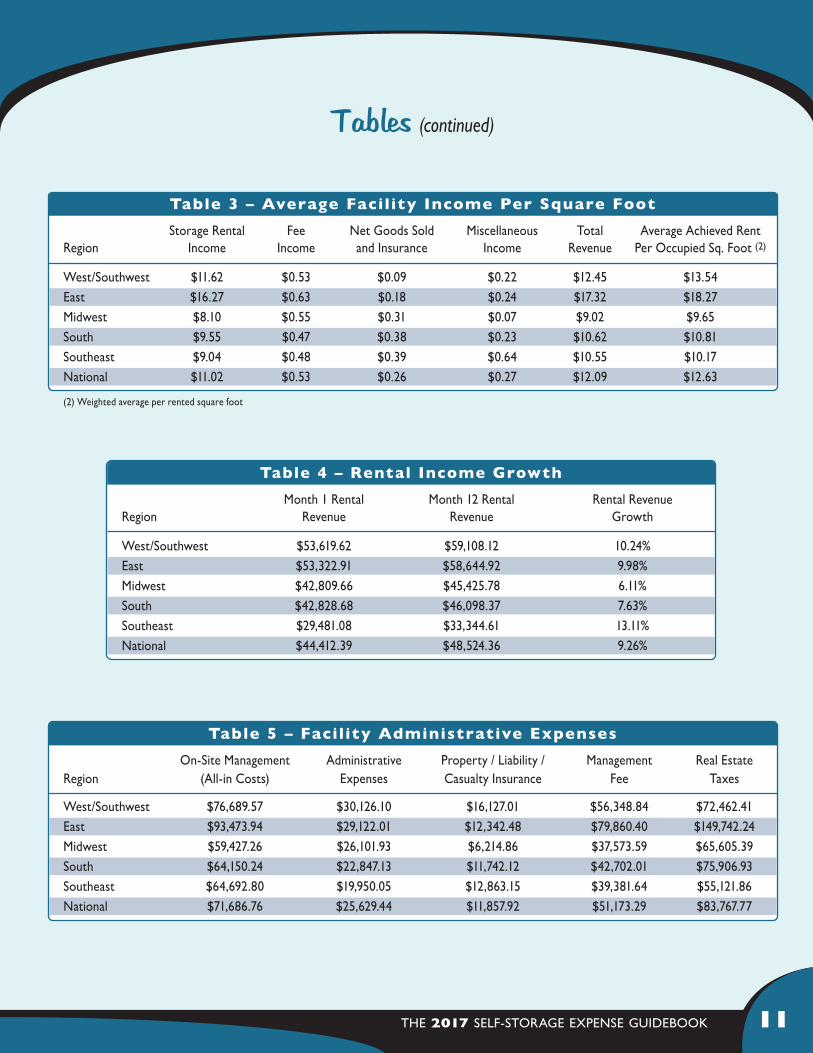
Rental Rate GrowthSurvey respondents were asked to provide rental revenue for the first and last month of a 12-month period. Based upon
the representative growth, the regions all performed at above-GDP growth with rental income as seen in Table 4. The highest
rental rate growth was reported for the Southeast and West/Southwest regions, with the Midwest and South seeing the lowest
growth rate.

THE 2017 SELF-STORAGE EXPENSE GUIDEBOOK 7
Expenses
Definitions Of Expenses
Tables 5 through 8 reflect self-storage facility expense information in two categories. The following are represented as
administrative expenses:
• On-site Management • Property, Liability, and Casualty Insurance • Real Estate Taxes
• Administrative Expenses • Management Fees
The second category includes the following other expenses:
• Advertising / Technology • Phone Costs • Utilities
• Postage & Handling / Office • Other Miscellaneous Expenses • Maintenance & Repairs
• Credit Card / Bank Charges
In general, as seen in this year’s tables, property operating expenses were observed to be relatively consistent across regions,
fluctuating most in payroll and real estate taxes for the East, and administrative expenses in the Southeast. Insurance costs also
saw a wide spread between the West/Southwest and the Midwest.
The purpose of the 2017 Expense GuideBook is to provide a foundation or benchmark for analyzing operating expenses.
Therefore, it is important to note that expenses can vary widely, particularly when analyzed solely on a single unit of analysis
such as per square foot of rentable building area. Therefore, we offer the following clarification on some of the expenses listed
above:
• On-Site Management – On-site management expenses account for full-time management including assistant managers,
relief managers, and payroll-related costs. In today’s self-storage industry, hiring quality managers is essential, especially given
their direct impact on rental rates, occupancy, and ancillary income such as merchandise sales.
• Administrative Expenses – In this category, expenses relate to office functions such as dues, subscriptions, copy
machine, office supplies, printing, professional fees including legal services (eviction costs), data processing, travel expenses,
partnership professional fees (legal and accounting), local licensing and permit fees, computer hardware and software, and
other expenses incurred in the operation of a self-storage property.

8 THE 2017 SELF-STORAGE EXPENSE GUIDEBOOK
Definitions Of Expenses (continued)
• Insurance – Insurance includes property, liability, and casualty insurance expenses. Due to the significant variables involved
when underwriting insurance, lower rates may in some cases be achieved by blanket policies with significant rate reductions.
Therefore, unless there are special circumstances such as portfolio analysis, insurance rates are typically forecast for a single
property. Other items that must be considered when seeking insurance are property specific technology in fire, life, and
safety construction and design.
• Management Fee – This category includes either:
1. Any costs associated with a third-party management service, or
2. All general and administrative costs associated with expenses at the corporate office for a facility operated by
vertically integrated ownership.
The cost allocation to this expense generally covers salaries, accounting staff, corporate systems, and all of other corpo-
rate office expense. Generally, it is charged to the property as a percentage of collected gross revenue.
• Real Estate Taxes – Taxes account for real property taxes only. In most forecasts of income and expenses, real estate
taxes are adjusted to market value according to an iterative process that multiplies market value against the tax rate. As a
result, there tends to be a “lag effect” in the data which results in current taxes being somewhat higher than those indicated
in the historical data. As such, it is imperative that local tax statutes are carefully analyzed and considered when estimating
property taxes.
Other expenses that may require clarification are:
• Utilities – This expense category includes natural or propane gas, electricity, water, sewer service, and regular trash ser-
vice. The age of the facility can have an impact on this category especially given that many newer sites utilize motion detec-
tors to control lighting, thereby reducing utility costs. Moreover, single-level facilities with drive-up access only will have
lower utility costs than multi-story facilities with indoor/elevator access.

THE 2017 SELF-STORAGE EXPENSE GUIDEBOOK 9
Definitions Of Expenses (continued)
• Maintenance & Repairs – This expense category will be influenced by the age of the facility, the quality of construction,
and overall condition of the property. Actual expenses may include but are not limited to items such as:
• Electrical repairs
• Elevator maintenance and repairs
• Gate maintenance and repairs
• Landscaping
• Pest control
• Plumbing repairs
• Other – This category of expenses primarily accounts for all other variables. It is used as a catch-all for miscellaneous
expenses that vary between sites, are infrequently used, and do not match the other categories. Amounts in this category
typically account for less than 10 percent of the total expenses at a given property.
Data Methodology NotesAll of the information, where appropriate, has been averaged using a weighted approach. Also included with each table
is a breakdown of the data on a per-square-foot basis. Deviations of gross amounts begin to materially diverge when using
rentable square feet multipliers that differ more than 9,000 square feet from the weighted average of the respective region,
especially as it relates to non-controllable expenses.
• Roll-up door maintenance and repairs
• Roof repairs and maintenance
• Security system, alarms, and monitor maintenance
• Site clean-up
• Trash removal

10 THE 2017 SELF-STORAGE EXPENSE GUIDEBOOK
Table 2 – Average Facility Income
Storage Rental Fee Net Goods Sold Miscellaneous TotalRegion Income Income and Insurance Income Revenue
West/Southwest $877,963.25 $39,852.73 $6,845.04 $16,288.35 $940,949.36East $1,216,966.04 $47,405.90 $13,749.15 $17,844.01 $1,295,965.10Midwest $572,723.61 $38,702.76 $22,021.57 $4,671.79 $638,119.73South $668,382.34 $32,868.32 $26,254.97 $16,203.75 $743,709.37Southeast $591,176.34 $31,454.09 $25,424.03 $41,587.91 $689,642.37National $785,442.32 $38,056.76 $18,858.95 $19,319.16 $861,677.19
Overall Expenseto Income Ratio*
41.01%* National Average
Tables
Table 1 – Facility Information
Total Net Rentable Sq. Ft. Average / Economic Physical Avg. Units /Region Per Property Occupancy (1) Occupancy (1) Per Property
West/Southwest 75,551 79.63% 85.83% 624East 74,810 81.89% 89.01% 576Midwest 70,716 79.10% 83.93% 552South 70,005 78.69% 88.35% 497Southeast 65,382 73.74% 88.92% 439National 71,293 78.61% 87.21% 538
(1) Weighted Average
THE 2017 SELF-STORAGE EXPENSE GUIDEBOOK 11
Table 3 – Average Facility Income Per Square Foot
Storage Rental Fee Net Goods Sold Miscellaneous Total Average Achieved RentRegion Income Income and Insurance Income Revenue Per Occupied Sq. Foot (2)
West/Southwest $11.62 $0.53 $0.09 $0.22 $12.45 $13.54East $16.27 $0.63 $0.18 $0.24 $17.32 $18.27Midwest $8.10 $0.55 $0.31 $0.07 $9.02 $9.65South $9.55 $0.47 $0.38 $0.23 $10.62 $10.81Southeast $9.04 $0.48 $0.39 $0.64 $10.55 $10.17National $11.02 $0.53 $0.26 $0.27 $12.09 $12.63
(2) Weighted average per rented square foot
Table 4 – Rental Income Growth
Month 1 Rental Month 12 Rental Rental RevenueRegion Revenue Revenue Growth
West/Southwest $53,619.62 $59,108.12 10.24%East $53,322.91 $58,644.92 9.98%Midwest $42,809.66 $45,425.78 6.11%South $42,828.68 $46,098.37 7.63%Southeast $29,481.08 $33,344.61 13.11%National $44,412.39 $48,524.36 9.26%
Tables (continued)
Table 5 – Facility Administrative Expenses
On-Site Management Administrative Property / Liability / Management Real EstateRegion (All-in Costs) Expenses Casualty Insurance Fee Taxes
West/Southwest $76,689.57 $30,126.10 $16,127.01 $56,348.84 $72,462.41East $93,473.94 $29,122.01 $12,342.48 $79,860.40 $149,742.24Midwest $59,427.26 $26,101.93 $6,214.86 $37,573.59 $65,605.39South $64,150.24 $22,847.13 $11,742.12 $42,702.01 $75,906.93Southeast $64,692.80 $19,950.05 $12,863.15 $39,381.64 $55,121.86National $71,686.76 $25,629.44 $11,857.92 $51,173.29 $83,767.77

12 THE 2017 SELF-STORAGE EXPENSE GUIDEBOOK
Table 8 – Other Expenses Per Square Foot
Advertising / Postage & Credit Card / Phone MaintenanceRegion TechnologySpend Handling/Office BankCharges Costs Other Utilities &Repairs
West/Southwest $0.22 $0.12 $0.15 $0.11 $1.28 $0.24 $0.30 East $0.30 $0.07 $0.14 $0.05 $0.23 $0.44 $0.57 Midwest $0.19 $0.06 $0.12 $0.11 $0.02 $0.18 $0.33 South $0.23 $0.05 $0.12 $0.06 $0.10 $0.34 $0.26 Southeast $0.25 $0.04 $0.08 $0.05 $0.09 $0.37 $0.28 National $0.24 $0.07 $0.12 $0.08 $0.35 $0.31 $0.35
Table 7 – Other Expenses
Advertising / Postage & Credit Card / Phone MaintenanceRegion TechnologySpend Handling/Office BankCharges Costs Other Utilities &Repairs
West/Southwest $16,809.04 $8,935.72 $11,149.11 $8,220.05 $96,625.92 $18,015.13 $22,741.91East $22,634.44 $5,592.36 $10,679.07 $3,849.98 $17,327.50 $32,939.98 $42,617.74Midwest $13,403.63 $3,926.32 $8,134.44 $7,494.55 $1,663.33 $12,913.13 $23,248.51South $16,106.50 $3,711.16 $8,172.28 $4,168.02 $7,231.22 $23,564.12 $17,972.40Southeast $16,352.96 $2,533.76 $5,409.00 $3,341.06 $6,174.89 $24,097.90 $18,323.32National $17,061.31 $4,939.87 $8,708.78 $5,414.73 $25,804.57 $22,306.05 $24,980.78
Tables (continued)
Table 6 – Facility Administrative Expenses Per Square Foot
On-Site Management Administrative Property / Liability / Management Real EstateRegion (All-in Costs) Expenses Casualty Insurance Fee Taxes
West/Southwest $1.02 $0.40 $0.21 $0.75 $0.96 East $1.25 $0.39 $0.16 $1.07 $2.00 Midwest $0.84 $0.37 $0.09 $0.53 $0.93 South $0.92 $0.33 $0.17 $0.61 $1.08 Southeast $0.99 $0.31 $0.20 $0.60 $0.84 National $1.00 $0.36 $0.17 $0.71 $1.16

We have what you need. Published since 1979, the Mini-Storage Messenger has become the most respected international trade magazine for self-storage operators, owners, developers and investors. Each monthly issue delivers a valuable mix of self-storage business news, research data and interviews, as well as reports on various aspects of the development, management and marketing of pro�table self-storage facilities.
Start your subscription today! www.ministoragemessenger.com
It shouldn’t be this hard!
Looking for information?
Get the answers you need in the Mini-Storage Messenger, the Education Destination for Self-Storage Management
800.352.4636
