iftekhair ibnul bashar -...
TRANSCRIPT
EVALUATION OF MECHANICAL AND FRACTURE
BEHAVIOUR OF POFA-FA-METAKAOLIN BASED
GEOPOLYMER FIBRE REINFORCED CONCRETE
IFTEKHAIR IBNUL BASHAR
FACULTY OF ENGINEERING
UNIVERSITY OF MALAYA
2014
EVALUATION OF MECHANICAL AND FRACTURE
BEHAVIOUR OF POFA-FA-METAKAOLIN BASED
GEOPOLYMER FIBRE REINFORCED CONCRETE
IFTEKHAIR IBNUL BASHAR
DISSERTATION SUBMITTED IN FULFILMENT OF THE
REQUIREMENT FOR THE DEGREE OF MASTER OF
ENGINEERING SCIENCE
FACULTY OF ENGINEERING
UNIVERSITY OF MALAYA
KUALA LUMPUR
2014

iii
ABSTRACT
The depletion of natural resources, emission of CO2 from the cement industries and the
waste products from industrial by-products pose irreparable danger to the ecological
balance. There have been many attempts to replace ordinary Portland cement (OPC) and
the aggregates through the use of industrial by-products and waste materials in recent
years.
In Malaysia, the availability of industrial by-products such as palm oil fuel ash (POFA)
and fly ash (FA) could be considered as viable binders along with Metakaolin (MK) to
develop geopolymer concrete (GC). In addition, other industrial by-products such as
manufactured sand (M-sand) and oil palm shell (OPS) could ideally replace the
conventional fine and coarse aggregates, respectively.
This dissertation reports the development of POFA-FA-MK-based geopolymer concrete
(PFMGC) using M-sand and OPS as fine and coarse aggregates, respectively. The
mechanical properties of GC varying different proportion of POFA, FA and MK as binder
was investigated. An appropriate mixture design for structural grade PFMGC is also
proposed. The effect of steel fibres on the development of mechanical properties and
fracture behaviour was investigated for two different aspect ratios (AR 80 and 65) and
three different percent of volume as 0.25%, 0.50% and 0.75%. The ratios of M-
sand/binder, OPS/ binder, water/ binder and alkaline solution/ binder were kept constant
as 1.125, 0.375, 0.18 and 0.4, respectively. The specimens were cured in oven of 650C
temperature for 48 hours and then kept in room temperature and relative humidity of 280C
and 79%, respectively till the age of testing. The mechanical properties and the fracture
behaviour of the fibre-reinforced PFMGC were compared with fibred and non-fibred
concrete consisting OPS and crushed granite aggregate.
iv
The results show that the POFA-MK based geopolymer concrete (PMGC) achieved better
strength than that of the PFMGC due to presence of the appropriate ratios of Silica/
Alumina, Sodium oxide (and Potassium oxide)/ Silica and Sodium oxide (and Potassium
oxide)/ Alumina as 8.73, 0.11 and 0.93, respectively. The corresponding 28-day
compressive strengths of concretes having 90% and 80% of POFA with MK as binder
were 23.2 and 23.6 MPa, respectively. The highest values of the splitting tensile strength
and flexure strength of 2.14 MPa and 3.41 MPa were obtained for the binder consisting
90% of POFA and 10% of MK. The early strength development at the age of 3-day was
found above 80% and this is attributed to geopolymerization process at high temperature.
The low values of static modulus of elasticity and the Poisson’s ratio of 6.36 GPa and
0.176, respectively for PMGC (POFA: MK=90:10) is due to the low stiffness of OPS
aggregate. The stress-strain relations of PMGC fit well with the expression developed for
OPC concrete. The flexural strength, splitting tensile strength and fracture behaviour were
significantly affected by the AR and the volume of steel fibres. The addition of steel fibre
with AR of 80 produced higher splitting tensile & flexural strengths and total fracture
energy, respectively of 5%, 6% and 50-80% compared to results of the corresponding
values with steel fibre with AR of 65.

v
ABSTRAK
Kekurangan sumber semula jadi, pelepasan CO2 akibat pengilangan simen dan bahan
buangan industri adalah memudaratkan daripada segi keseimbangan ekologi. Banyak
percubaan telah dilakukan untuk menggantikan simen Portland biasa (OPC) dan agregat
melalui penggunaan bahan buayan sejak kebelakayan ini.
Di Malaysia , kewujudan abu bahan api kelapa sawit (POFA) dan abu terbang (FA) boleh
dianggap sebagai pengikat yang berdaya maju bersama-sama dengan metakaolin (MK)
untuk membangunkan geopolymer konkrit geopolimer (GC). Di samping itu, bahan
buayan industry lain seperti pasir yang dikilong (M- pasir) dan tempurung kelapa sawit
(OPS) boleh digunokan untuk menggantikan agregat halus dan halus, masing-masing.
Disertasi ini melaporkan kejian pembangunan konkrit geopolimer penggunaan
berasaskan POFA-FA-MK (PFMGC) dengan menggunakan M-sand dan OPS sebagai
agregat halus dan kasar, masing-masing . Ciri-ciri mekanikal GC dengan perkadaran
bohan pengikol POFA, FA dan MK yang berbeza telah dikaji. Reka bentuk bancuhan
yang sesuai untuk mencapai gred struktur PFMGC juga telah dicadangkan . Kesan
penggunaan gentian keluli kepada pembangunan sifat-sifat mekanikal dan kelakuan patot
telah disiasat untuk dua aspek nisbah yang berbeza (AR 80 dan 65) dan tiga peratuson
isipokdu sentian yang berbeza, 0.25%, 0.50% dan 0.75 %. Nisbah M-sand/pengikat, OPS
/ pengikat , air / pengikat dan laruton alkali / pengikat telah dikawal padanisboh 1.125 ,
0.375, 0.18 dan 0.4 masing-masing . Spesimen telah diawetkan dalam ketuhor pada suhu
650C selama 48 jam dan kemudian disimpan pada suhu bilik dan kelembapan relatif 280C
dan 79 % masing-masing sehingga hari ujian. Sifat-sifat mekanikal dan kelakuan pecah
PFMGC bertetulang gentian telah dibandingkan dengan konkrit bertetulay gentian dan
torpa sention, yang mengundungi OPS dan agregat granit terhancur.

vi
Keputuson yang didopcti menunjukkan konkrit geopolimer berososkan POFA-MK
(PMGC) telah mencapai kekuatan yang lebih tinggi daripada PFMGC akibat daribada
nisbah Silika/ Alumina, Natrium oksida (dan Kalium oksida)/ Silika dan Natrium oksida
(dan Kalium oksida)/ Alumina yang sesvai sebagai 8.73, 0.11 dan 0.93, masing-masing.
Kekuatan mompatan 28 hari yang sepadan bagi konkrit mempunyai 90% dan 80% POFA
dengan MK sebagai pengikat adalah 23.2 dan 23.6 MPa, masing-masing . Nilai-nilai
tertinggi untuk kekuatan tegangan pecah dan kekuatan lentuan adolah tidak langsung
tegangan dan lenturan kekuatan lenturan adalah 2.14 MPa dan 3.41 MPa, masing-masing,
yang diperolehi untuk konkrit yang mengadugin 90% POFA dan 10% daripada MK.
Pembangunan kekuatan awal pada usia 3 hari didapati melebihi 80% dan ini disebabkan
oleh proses pempolimeron-geo pada suhu tinggi. Nilai modulus keanjalan statik dan
nisbah Poisson yong rendan, sebanyak 6.36 GPa dan 0.176 masing-masing untuk PMGC
(POFA:MK=90:10) adalah disebabkan oleh kekukuhan aggregate OPS rendah.
Hubungan tegasan -terikan PMGC juga memafuhi korelasi yong telah dibangunkan untuk
konkrit OPC. Kekuatan tegangan lenturan dan tegangan pecah, dan kelakuan patoh juga
dipengorul nisbah aspek dan kondung gentian keluli. Penambahan gentian keluli dengan
AR 80 menyebobkan kekuatan tegangan pecah dan lentuan donteraga pecah jumlah yang
lebih tinggi, masing-masing sebanyak 5% , 6% dan 50-80% berbanding dengan
keputusan nilai-nilai yong bersepadanan untuk konkrit dengan gentian keluli dengan
AR65.

vii
ACKNOWLEDGEMENT
I would like to thank almighty Allah (swt) for providing me the opportunity to pursue my
studies and research work.
I wish to express my sincere thanks and profound appreciation to my supervisors, Dr.
Ubagaram Johnson Alengaram and Prof. Ir. Dr. Mohd. Zamin Jumaat for their guidance,
encouragement and valuable time spent on the fruitful discussion throughout the work.
I am grateful to the University of Malaya for the financial support through the HIR-
MOHE Project UM.C/HIR/MOHE/ENG/02.
I would like to thank the laboratory staffs for their cooperation and assistance.
Finally, I would like to thank the most important people in my life, my parents, sister,
wife and son, Abdullah Saaiq Ihtishaam, who have provided their endless support and
patience throughout the years.

viii
TABLE OF CONTENTS
Original literary work declaration (English) ..................................................................... ii
Abstract ............................................................................................................................ iii
Abstrak .............................................................................................................................. v
Acknowledgement........................................................................................................... vii
Table of contents ............................................................................................................ viii
List of figures ................................................................................................................. xiii
List of tables .................................................................................................................... xv
List of symbols and abbreviations................................................................................. xvii
List of appendices ........................................................................................................... xx
CHAPTER 1 Introduction ........................................................................................... 1
1.1 Background .............................................................................................................. 1
1.2 Significance of research work ................................................................................. 4
1.3 Aims and objectives ................................................................................................. 4
1.4 Scope........................................................................................................................ 5
1.5 Research highlights .................................................................................................. 7
1.6 Structure of the dissertation ..................................................................................... 7
CHAPTER 2 Literature review ................................................................................... 9
2.1 Introduction.............................................................................................................. 9
2.2 Geopolymer Technology ......................................................................................... 9
2.2.1 Geopolymer theory ......................................................................................... 9
2.2.2 Advantages of GC ........................................................................................ 12
2.3 Pozzolans as source material of geopolymer ......................................................... 13
2.3.1 Fly ash (FA) ................................................................................................. 13
2.3.2 Palm oil fuel ash (POFA) ............................................................................. 15
2.3.3 Metakaolin (MK).......................................................................................... 16
ix
2.4 Geopolymer concrete ............................................................................................. 17
2.4.1 Binder proportion ......................................................................................... 17
2.4.2 Alkaline activator ......................................................................................... 17
2.4.3 Mechanical vibration .................................................................................... 18
2.4.4 Heat curing ................................................................................................... 18
2.4.5 Mechanical properties .................................................................................. 19
2.4.6 Toughness..................................................................................................... 20
2.5 Development of geopolymer research ................................................................... 22
2.5.1 Invention of first mineral resin ..................................................................... 22
2.6 Manufactured sand and Quarry dust as fine aggregate .......................................... 23
2.7 Oil palm shell (OPS) as aggregate ......................................................................... 24
2.8 Previous research works and research gap ............................................................ 25
2.9 Summary ................................................................................................................ 25
CHAPTER 3 Materials and Methods ........................................................................ 27
3.1 Introduction............................................................................................................ 27
3.2 Materials ................................................................................................................ 27
3.2.1 Binding materials (POFA, FA, MK) ............................................................ 27
3.2.2 Fine aggregates (Conventional mining sand, manufactured sand-M-sand,
Quarry Dust-QD).......................................................................................... 28
3.2.3 Coarse aggregates ......................................................................................... 28
3.2.4 Steel fibres .................................................................................................... 29
3.2.5 Water ............................................................................................................ 30
3.2.6 Alkaline solution .......................................................................................... 30
3.3 Development of geopolymer concrete ................................................................... 31
3.3.1 Mixture proportion ....................................................................................... 31
3.3.2 Casting, specimen preparation, curing and testing age ................................ 33

x
3.4 Testing ................................................................................................................... 36
3.4.1 Fresh concrete tests ...................................................................................... 36
3.4.2 Mechanical properties of concrete ............................................................... 36
3.4.3 Fracture test .................................................................................................. 40
3.5 Summary ................................................................................................................ 44
CHAPTER 4 Results and Discussions ...................................................................... 45
4.1 Introduction............................................................................................................ 45
4.2 Properties of materials ........................................................................................... 45
4.2.1 Binding materials ......................................................................................... 45
4.2.2 Fine aggregates ............................................................................................. 46
4.2.3 Coarse aggregate .......................................................................................... 49
4.3 Mix Design 1: Effect of molarity, N-sand, M-sand and QD in geopolymer mortar
............................................................................................................................... 49
4.3.1 Density ......................................................................................................... 50
4.3.2 Development of compressive strength ......................................................... 51
4.3.3 Failure mode ................................................................................................. 53
4.3.4 Role of POFA-FA on the development of compressive strength................. 54
4.3.5 Effect of particle size of N-sand/ M-sand/QD on geopolymerization ......... 55
4.3.6 Effect of molarity of alkaline activated solution on development of
compressive strength .................................................................................... 56
4.3.7 Effect of fineness modulus on compressive strength ................................... 58
4.3.8 Effect of N-sand, M-Sand and QD on development of compressive strength
59
4.3.9 Comparison of M-sand and QD in geopolymer mortar with published data
63
4.4 Mix Design 2: POFA-FA-MK and POFA-MK based geopolymer concrete ........ 63
xi
4.4.1 Properties of fresh concrete .......................................................................... 64
4.4.2 Compressive strength ................................................................................... 65
4.4.3 Flexural and indirect tensile strengths .......................................................... 73
4.4.4 Static modulus of elasticity .......................................................................... 77
4.5 Mix design 3: Effect of steel fibres on mechanical properties .............................. 79
4.5.1 Properties of fresh concrete .......................................................................... 79
4.5.2 Compressive strength ................................................................................... 80
4.5.3 Flexural strength ........................................................................................... 82
4.5.4 Indirect tensile strength (Splitting tensile test) ............................................. 84
4.5.5 Static modulus of elasticity .......................................................................... 86
4.6 Mix design 3: Effect of steel fibres on fracture toughness .................................... 87
4.6.1 Characteristics of fracture toughness ........................................................... 87
4.6.2 First peak deflection (FPD) .......................................................................... 90
4.6.3 Fracture strength ........................................................................................... 91
4.6.4 Fracture toughness........................................................................................ 93
CHAPTER 5 Conclusion and recommendation ........................................................ 95
5.1 Introduction............................................................................................................ 95
5.1.1 Development of appropriate mix proportion (objective 1) .......................... 95
5.1.2 Investigation on the mechanical properties of OPSGC (objective 2) .......... 97
5.1.3 Investigation of Mechanical properties of FOPSGC and FNWGC (Objective
3)................................................................................................................... 99
5.1.4 Investigation of fracture behaviour of FOPSGC (objective 4) .................. 100
5.2 Recommendation for future work ........................................................................ 101
References ..................................................................................................................... 102
List of publications ........................................................................................................ 112
Journal articles .............................................................................................................. 112

xii
Conference papers ......................................................................................................... 112
Appendix A ................................................................................................................... 113
Calculation of Alkaline solution ................................................................................... 113
Calculation for Mix design 1......................................................................................... 114
Calculation for Mix design 2......................................................................................... 115
Calculation for Mix design 3......................................................................................... 118
Appendix B ................................................................................................................... 120
xiii
LIST OF FIGURES
Figure 2.1: Computer molecular graphics of polymeric Mn-(-Si-O-Al-O-) poly(silicate)
and Mn-(-Si-O-Al-O-Si-O-)n poly(sialate-siloxo), and related frameworks
(Davidovits, 1994b) ...................................................................................... 10
Figure 2.2: Chemical structures of geopolymer .............................................................. 11
Figure 2.3: Typical detail of processing of Palm oil fuel ash in industry ....................... 16
Figure 2.4: Compressive and flexural strength gain of geopolymers (Duxson et al., 2005)
...................................................................................................................... 19
Figure 3.1: Collection of POFA ...................................................................................... 28
Figure 3.2: Collection of OPS ......................................................................................... 29
Figure 3.3: Steel fibres of AR 80(above) & 65(below) .................................................. 30
Figure 3.4: Casting of geopolymer fibre reinforced concrete ......................................... 34
Figure 3.5: Preparation of specimens .............................................................................. 35
Figure 3.6: ELE testing machine of capacity 2000 kN ................................................... 36
Figure 3.7: Flexural strength test (BS EN 12390-5:2009, 2009) .................................... 37
Figure 3.8: Indirect tensile strength ................................................................................ 38
Figure 3.9: Static modulus of elasticity test .................................................................... 39
Figure 3.10: Fracture test (ASTM C1609/C1609M-12, 2012) ....................................... 41
Figure 3.11: Specimens for fracture test ......................................................................... 41
Figure 4.1: Particle size distribution of POFA, FA and MK .......................................... 46
Figure 4.2: Particle shape of manufactured sand (2.36 mm retained) ........................... 47
Figure 4.3: Particle shape of quarry dust (2.36 mm retained) ......................................... 47
Figure 4.4: Particle size distribution curve for N-sand, M-sand and QD ....................... 48
Figure 4.5: Density vs age (days) .................................................................................... 50
Figure 4.6: Relationship between density and compressive strength at different ages ... 51
Figure 4.7: Compressive strengths for different mix design ........................................... 53

xiv
Figure 4.8: Satisfactory failures (BS EN 12390-3:2009 (2009)) .................................... 53
Figure 4.9: Failure mode of geopolymer mortar ............................................................. 54
Figure 4.10: Effect of molarity of alkaline activated solution in compressive strength . 57
Figure 4.11: Development of early age compressive strength ........................................ 57
Figure 4.12: Effect of fineness modulus of composite fine aggregates in development of
compressive strength .................................................................................... 58
Figure 4.13: Compressive strength (MPa) vs age (days) ................................................ 59
Figure 4.14: % Compressive strength development vs age (days) ................................. 60
Figure 4.15: N-sand/ M-sand/ QD interlocking in geopolymer mortar (Magnification rate
= 5) ............................................................................................................... 61
Figure 4.16: Compressive strength of GC for different mix proportions of (a) POFA, FA
& MK and (b) POFA & MK ........................................................................ 66
Figure 4.17: Compressive strength at age of 3-, 7-, 14- and 28-day ............................... 67
Figure 4.18: Relationship between compressive strength and oxide compounds ........... 72
Figure 4.19: Bond failure of OPSGC .............................................................................. 74
Figure 4.20: Relationship between SiO2/Al2O3 and mechanical properties (f’c, f’t, f’f) .. 74
Figure 4.21: Numerical relationship among fcube, ff and ft ............................................... 75
Figure 4.22: Numerical relationship among fcube, E and Poisson’s ratio ......................... 77
Figure 4.23: 28-day compressive strength ...................................................................... 81
Figure 4.24: Development of flexural strength for different % volume of steel fibre .... 84
Figure 4.25: Development of flexural strength for different % volume of steel fibre .... 85
Figure 4.26: Development of MoE for different % volume of steel fibre ...................... 86
Figure 4.27: Fracture failure ........................................................................................... 88
Figure 4.28: First peak deflection for all mix designs .................................................... 90
Figure 4.29: First peak load and strength ........................................................................ 91
Figure 4.30: Residual load and strength .......................................................................... 92
xv
Figure 4.31: Toughness and equivalent flexural strength ratio ....................................... 93
LIST OF TABLES
Table 1.1: Mix proportion of N-sand, M-sand and QD in POFA-FA based geopolymer
mortar ............................................................................................................. 6
Table 1.2: Mix proportion of POFA, FA and MK ............................................................ 6
Table 1.3: Mix proportion of POFA, FA and MK ............................................................ 7
Table 2.1: Range of chemical composition for low and high-calcium fly ashes (BS EN
450-1:2012) .................................................................................................. 14
Table 2.2: Phase composition of UK fly ashes Dhir (1986) ........................................... 15
Table 2.3: The principle phases found in coals and the phases formed after combustion
...................................................................................................................... 15
Table 2.4: Chemical composition of POFA Mijarsh et al. (2014) .................................. 16
Table 0.1: Previous research work and research gap ..................................................... 26
Table 3.1: Mix design with variables of N-sand, M-sand and QD ................................. 32
Table 3.2: Mix design with variables of POFA, FA and MK ......................................... 32
Table 3.3: Mix design with variables of steel fibre proportion and aspect ratio ............. 33
Table 3.4: Specimens for testing of concrete .................................................................. 34
Table 4.1: Chemical composition and physical properties of POFA and FA ................. 45
Table 4.2: Particle size distribution of N-sand, M-sand and QD .................................... 48
Table 4.3: Specific gravity and absorption of N-sand, M-sand and QD ......................... 49
Table 4.4: Physical properties of coarse aggregate ......................................................... 49
Table 4.5: Development of compressive strength for different mix designs .................. 52
Table 4.6: Percentage of increment of compressive strength ......................................... 55
Table 4.7: Categorization of fineness of sand, using fineness modulus (Alexander and
Mindess, 2005) ............................................................................................. 59
Table 4.8: Development of compressive strength using N-sand, M-sand and QD ......... 63

xvi
Table 4.9: Fresh density and slump value of fresh concrete ........................................... 64
Table 4.10: Effect of heat curing temperature and time on compressive strength .......... 69
Table 4.11: Compressive strength of geopolymer concrete using alkaline activator ..... 70
Table 4.12: Compressive strength (Mix design 2) .......................................................... 71
Table 4.13: Estimated chemical composition in mix proportions................................... 71
Table 4.14: Indirect tensile and flexural strength............................................................ 76
Table 4.15: Young’s modulus of elasticity and Poisson’s ratio ...................................... 78
Table 4.16: Density (kg/m3) of FOPSGC and FGGC ..................................................... 80
Table 4.17: Compressive strength ................................................................................... 81
Table 4.18: Flexural strength .......................................................................................... 83
Table 4.19: Indirect tensile strength (Mix design 3) ....................................................... 85
Table 4.20: Modulus of elasticity ................................................................................... 86
Table 4.21: Fracture characteristics for different mix designs ........................................ 89

xvii
LIST OF SYMBOLS AND ABBREVIATIONS
Symbols Description
AA Alkaline activator
AIV Aggregate impact value
AR Aspect ratio
B Binder
Cc Coefficient of curvature
Cu Uniformity coefficient
E Young’s modulus of elasticity (GPa)
f'c Compressive strength (MPa) of mortar
fcu Cube compressive strength (MPa)
fcy Cylinder compressive strength (MPa)
ft Indirect tensile strength (MPa)
ff Flexure strength (MPa)
FA Fly ash
FM Fineness modulus
FNWGC Fibre reinforced normal weight geopolymer concrete
FOPSGC Fibre reinforced oil palm shell based geopolymer concrete
FPD First peak deflection

xviii
MK Metakaolin
M-sand Manufactured sand
M2O Na2O (Sodium oxide) or K2O (Potassium oxide)
or combination of Na2O and K2O
NWGC Normal weight geopolymer concrete
N-sand Mining sand
NWC Normal weight concrete
OD Oven dry
OPS Oil palm shell
OPSGC Oil palm shell based geopolymer concrete
PFMGC POFA-FA-MK based OPSGC
POFA Palm oil fuel ash
PMGC POFA-MK based OPSGC
QD Quarry dust
S/A Silica/ alumina ratio
SD Standard deviation
SH Sodium hydroxide
SH Molarity of sodium hydroxide solution
SS Sodium silicate

xix
SSD Saturated surface dry
ρ Density (kg/m3)

xx
LIST OF APPENDICES
Appendix A ................................................................................................................... 113
Calculation of Alkaline solution .......................................................................... 113
Calculation for Mix design 1 ............................................................................... 114
Calculation for Mix design 2 ............................................................................... 115
Calculation for Mix design 3 ............................................................................... 118
Appendix B ................................................................................................................... 120

1
CHAPTER 1 INTRODUCTION
1.1 Background
The use of ordinary Portland cement (OPC) in concrete as binder and its associated issues
in greenhouse gas emissions is well established. The amount of the carbon dioxide (CO2)
released during the manufacture of OPC is mainly due to the calcination of limestone and
combustion of fossil fuel. Eq. 1.1 shows the reaction of the constituent materials in cement
production and the result of CO2 emission. The production of 1 tonne of cement directly
generates 0.55 tonnes of chemical CO2 and requires the combustion of carbon fuel to
yield an additional 0.4 tonnes of CO2. In other words, the production of 1 tonne of cement
emits 1 tonne of CO2.
5CaCO3 + 2SiO2 = (3CaO, SiO2)(2CaO, SiO2) + 5CO2 Eq. 1.1
Thus, the enormous amount of CO2 from cement industry contributes to global warming.
Nevertheless, the demand for concrete is on the rise, 11 billion metric tonnes of concrete
(Mehta and Monteiro, 2006) is being produced annually, and this leads to exploitation of
natural resources. The depletion of natural reserves in alarming phase drew attention of
the whole world and the construction industry along with researchers are engaged in
research to find alternate materials to replace OPC. There have been research works on
the use of alkaline activated materials (Žvironaitė et al., 2012; Noorvand et al., 2013; Tan
and Du, 2013; Venkatanarayanan and Rangaraju, 2013; Yusuf et al., 2014) to address
some of the issues related to cement industry.
Davidovits (2008) revealed that the geopolymers could be ideal alternate to OPC as in
geopolymers the polymeric reaction between silica and alumina could be exploited
through the use of alkaline activators . The binder can be produced by a polymeric
synthesis of the alkali-activated material from geological origin or by-product materials.

2
The alkalinity of the activator can be low to mild or high. The main contents to be
activated are the silicon and the aluminium present in the by-product material (Palomo et
al., 1999). The materials that contain silica and alumina are called pozzolanic materials.
Many researchers (Hussin and Awal, 1996; Awal and Hussin, 1997; Rukzon and
Chindaprasirt, 2009) reported that fly ash (FA), rice husk ash (RHA) and palm oil fuel
ash (POFA) have a potentiality of being pozzolanic material. The abundance and
availability of pozzolanic industrial by-product such as POFA, FA and RHA, in the
South-East Asia, has created an ideal platform for the researchers to work on this
pozzolanic material as source material in the development of geopolymer concrete (GC).
Several research publications are available in GC using FA, MK, GGBS and RHA (Autef
et al., 2013b; Li et al., 2013; Yost et al., 2013; Yusuf et al., 2013; Abdulkareem et al.,
2014); However, research works on POFA-based geopolymer concrete is limited and the
incorporation of FA and MK along with POFA is another avenue for research.
Besides the environmental pollution due to the production of cement, consumption of
large quantity of concrete leads to depletion of natural resources. Many countries face the
shortage of conventional river sand/ mining sand and crushed granite aggregates for fine
and coarse aggregates, respectively. The exploitation of the conventional sand and
quarrying of rock deposits leads to ecological imbalance globally and its effect has been
felt in the construction industry more than any other field. Millions of tons of industrial
wastes are generated every year and these wastes cause environmental issue due to
shortage of storage facility; this subsequently leads to land and water pollution near
factories. In order to ensure sustainable development, researchers all around the world
have focused their research on replacing and recycling waste materials to replace
conventional materials (Rukzon and Chindaprasirt, 2009; Safiuddin et al., 2011a;
Safiuddin et al., 2011b; Alengaram et al., 2013a).

3
Balamurugan and Perumal (2013), Ji et al. (2013) and Raman et al. (2011) reported the
potentiality of using quarry fines as a replacement of river/ mining sand. The quarry
industries produce millions of tons of wastes in the form of quarry dust (QD); it is
produced as waste after crushing granite for the use of coarse aggregates. About 25% QD
is produced from the coarse aggregate production by stone crusher (Appukutty and
Murugesan, 2009). These wastes are dumped in the factory yards and hence reuse of QD
might help in reducing the overuse of mining and quarrying. The sophisticated technology
known as Vertical Shaft Impact Crusher System (VSI) allows QD to be centrifuged to
remove flaky and sharp edges of QD. The end product is commonly known as
manufactured sand (M-Sand) and it is popular in some of the developing countries
(Westerholm et al., 2008); the use of M-sand and QD are one of the right direction to
achieve sustainable material.
Apart from the use of M-sand to replace conventional sand, another potential local waste
from palm oil industry is oil palm shell (OPS). Researchers (Liu et al., 2014; Yap et al.,
2014) explored the suitability of OPS as lightweight aggregate and found structural grade
lightweight concrete could be produced using OPS as coarse aggregate. During the last
three decades, many research works have been carried out using OPS in OPC concrete as
lightweight aggregate to replace conventional granite aggregate (Okpala, 1990; Abdullah,
1996; Alengaram et al., 2008; Alengaram et al., 2011a; Alengaram et al., 2013b; Liu et
al., 2014; Mo et al., 2014b); Yap et al. (2014) reported the possibility of significant cost
saving production of OPS based concrete.
According to ACI 213R-14 (2014), the minimum cylinder compressive strength of
structural lightweight concrete is 17.24 MPa (estimated cube compressive strength 21.55
MPa). This research work focusses on the utilization of POFA, FA and MK as a binding
material in OPS based geopolymer concrete (OPSGC) of strength 22 MPa. The optimum
content of POFA in the development of OPSGC is also being explored in this research.

4
The investigation on the mechanical properties and fracture behaviour of the hardened
OPSGC with and without steel fibres is also carried out and reported.
1.2 Significance of research work
The significance of this research work is due to the usage of 90% of POFA by weight in
the structural grade lightweight geopolymer concrete. Though research works on the
geopolymer concrete using few other pozzolanic material such as FA, MK and rice husk
ash as a binding element have been done, the utilization of POFA in a large volume in
geopolymer concrete was investigated for the first time.
The emphasis on POFA is given because of the abundant production of POFA as an
industrial by-product in Malaysia, Australia, Thailand and few other countries. The
utilization of the POFA in the construction industry will eliminate the problem involving
the storage of waste materials. Further, this geopolymer concrete will keep significant
effect in the reduction of greenhouse effect.
The fracture analysis of geopolymer concrete incorporating steel fibres has been carried
out in this research work. No previous research work was found as published in any
journal article on the fracture behaviour of geopolymer concrete. Therefore, this research
work could claim its novelty on the analysis of fracture behaviour and utilization of large
volume of POFA in geopolymer lightweight concrete.
1.3 Aims and objectives
The main objective of this research work is to utilize local waste materials to develop
sustainable structural geopolymer concrete (GC) of grade 20. The variables include
different binder and fine aggregate contents; the effect of oil palm shell (OPS) as coarse
aggregate in GC is also investigated. In addition, the use of steel fibres in the concrete to
5
enhance its fracture energy and toughness was investigated. The objectives of the research
could be listed as given below:
(1) To develop an appropriate mixture design for lightweight structural grade (Cube
compressive strength 20MPa) POFA-FA-MK based oil palm shell geopolymer concrete
(OPSGC).
(2) To investigate the hardened properties of OPSGC through the measures of
compressive strength, flexural strength, splitting tensile strength, static modulus of
elasticity and the Poisson’s ratio.
(3) To analyse the effect of steel fibres in the mechanical properties of OPSGC.
(4) To examine the fracture behaviour of fibre reinforced OPSGC.
1.4 Scope
The scope of the research work is set out based on the objectives of the research and is
given under four different aspects namely, materials characterization, variable of mining
sand, manufactured sand and quarry dust, binder variation and addition of fibre in the
mixes. The different tests conducted in the investigation are given along with the variables
in tabular form.
Manufactured sand (M-sand) and quarry dust (QD) to be used in proportion as
replacement of mining sand (N-sand) to investigate the effect in POFA-FA-based
geopolymer mortar (Table 1.1).

6
Table 1.1: Mix proportion of N-sand, M-sand and QD in POFA-FA based geopolymer
mortar
Variables (% by weight) Constants Tests
Fine aggregate
Binder : Fine aggregate = 1 : 1.5
POFA : FA = 1 : 1
Water / Binder = 0.2
Alkaline activator / Binder = 0.4
Molarity of NaOH solution = 12 & 14
NaOH solution : liquid Na2SiO3 = 1 : 2.5
Curing temperature 650C
Curing period 24 hours
Fresh and harden density
Compressive strength test (3-
, 7-, 14- and 28-day)
N-sand M-sand QD
100
75 25
25 75
100
75 25
25 75
100
25 75
75 25
25 25 50
25 50 25
50 25 25
(b) POFA, FA and MK to be used in proportion for the development of GC of grade 20
(Table 1.2). Since 100% POFA contains very less proportion of alumina, POFA is
required to use with another pozzolanic material of high alumina contents. Maximum
90% of POFA was used as binder to develop OPSGC of grade 20.
Table 1.2: Mix proportion of POFA, FA and MK
Variables (% by weight) Constants Tests
Binder
Binder : M-sand : OPS = 1 : 1.125 :
0.375
Water / Binder = 0.18
Alkaline activator / Binder = 0.4
Molarity of NaOH solution = 14
NaOH solution : liquid Na2SiO3 = 1 :
2.5
Curing temperature 650C
Curing period 48 hours
Fresh and harden density
Slump test
UPV test
Compressive strength test (3-
, 7-, 14- and 28-day)
Flexure test
Indirect tensile strength test
(Splitting test)
Static modulus of elasticity
POFA FA MK
10 85 5
10 80 10
10 75 15
10 70 20
10 65 25
90 10
80 20
70 30
60 40
7
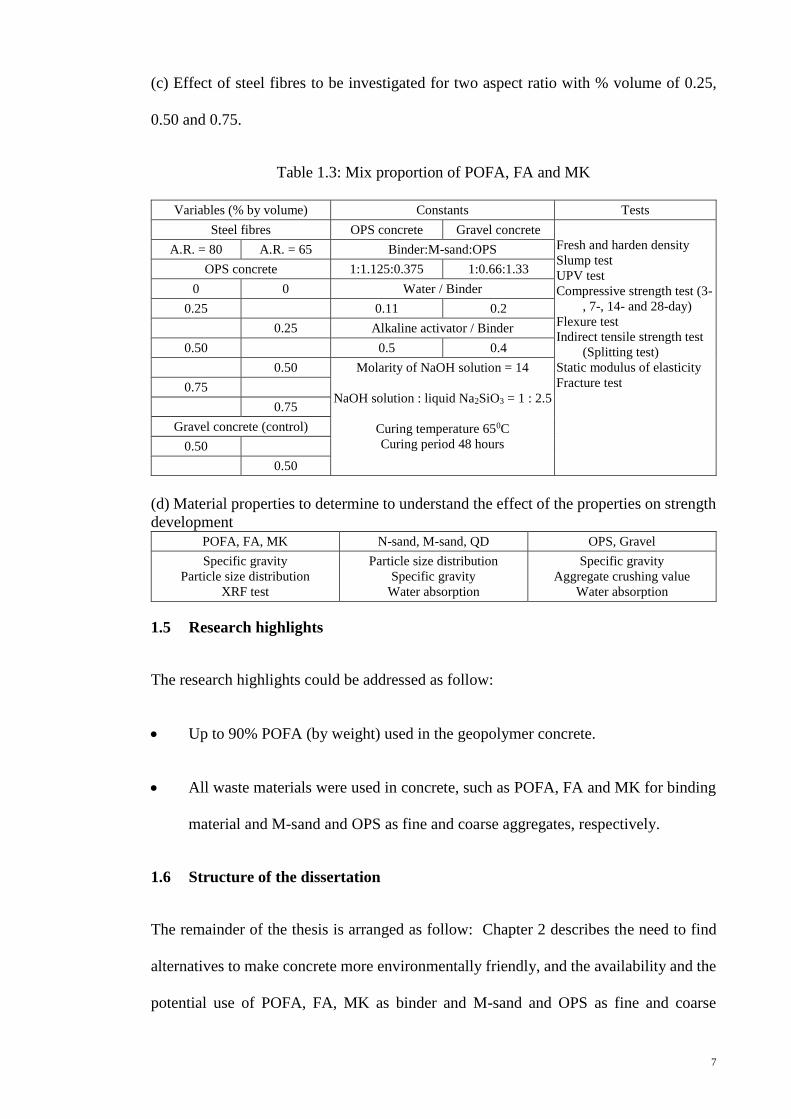
(c) Effect of steel fibres to be investigated for two aspect ratio with % volume of 0.25,
0.50 and 0.75.
Table 1.3: Mix proportion of POFA, FA and MK
Variables (% by volume) Constants Tests
Steel fibres OPS concrete Gravel concrete
Fresh and harden density
Slump test
UPV test
Compressive strength test (3-
, 7-, 14- and 28-day)
Flexure test
Indirect tensile strength test
(Splitting test)
Static modulus of elasticity
Fracture test
A.R. = 80 A.R. = 65 Binder:M-sand:OPS
OPS concrete 1:1.125:0.375 1:0.66:1.33
0 0 Water / Binder
0.25 0.11 0.2
0.25 Alkaline activator / Binder
0.50 0.5 0.4
0.50 Molarity of NaOH solution = 14
NaOH solution : liquid Na2SiO3 = 1 : 2.5
Curing temperature 650C
Curing period 48 hours
0.75
0.75
Gravel concrete (control)
0.50
0.50
(d) Material properties to determine to understand the effect of the properties on strength
development
POFA, FA, MK N-sand, M-sand, QD OPS, Gravel
Specific gravity
Particle size distribution
XRF test
Particle size distribution
Specific gravity
Water absorption
Specific gravity
Aggregate crushing value
Water absorption
1.5 Research highlights
The research highlights could be addressed as follow:
Up to 90% POFA (by weight) used in the geopolymer concrete.
All waste materials were used in concrete, such as POFA, FA and MK for binding
material and M-sand and OPS as fine and coarse aggregates, respectively.
1.6 Structure of the dissertation
The remainder of the thesis is arranged as follow: Chapter 2 describes the need to find
alternatives to make concrete more environmentally friendly, and the availability and the
potential use of POFA, FA, MK as binder and M-sand and OPS as fine and coarse

8
aggregates respectively. This chapter also provides a brief literature review of
geopolymer technology.
Chapter 3 describes the experimental program carried out to develop the mixture
proportions, the mixing process, and the curing regime of OPSGC and the tests performed
to study the engineering properties of the fresh and hardened concrete as well as the
fracture behaviour of the hardened concrete.
Chapter 4 presents and discusses the test results. Chapter 5 states the summary and the
conclusions of this study, followed by a set of recommendations for future work. The
thesis ends with a Reference List and several Appendices.

9
CHAPTER 2 LITERATURE REVIEW
2.1 Introduction
Energy conservation and protection of environment has become a main concern to the
researchers and engineers in the current age and this has led to exploration of alternatives
to customary building materials. The challenge to reduction of greenhouse gas emissions
and minimize the energy required for materials assert the researchers to find out new
material. The conventional construction binding material Ordinary Portland cement
(OPC) leads to fulfil the demand of over one and half billion tons annually which is
energy intensive and is liable for releasing a significant volume of carbon dioxide (CO2)
to atmosphere (Sumajouw et al., 2004).
The estimation shows that one ton of OPC produces one ton of CO2 and the production
process also involves high temperature, destruction of quarries and emission of CO2
(Fernandez-Jimenez et al., 2006). Besides on the environmental impact, the costs
associated with these energy involved, are significant. This lead to further investigation
on new environment friendly binding material. Geopolymer technology is one of them.
2.2 Geopolymer Technology
2.2.1 Geopolymer theory
Geopolymer is a term covering a class of synthetic aluminosilicate materials with
potential use in a number of areas, essentially, as a replacement for Portland cement and
for advanced high-tech composites, ceramic applications or as a form of cast stone. The
name Geopolymer was first applied to these materials by Davidovits (2008) in 1972. The
properties and uses of geopolymers are being explored in many scientific and industrial
disciplines and in all types of engineering process technologies.

10
For the chemical designation of geopolymers based on silico-aluminates, poly(silicate)
was suggested by (Davidovits, 1994b). Silicate is an abbreviation for silicon-oxo-
aluminate. The silicate network consists of SiO4 and AlO4 tetrahedra linked alternately
by sharing all the oxygens. Positive ions (Na+, K+, Li+, Ca++, Ba++, NH4+, H3O
+) must be
present in the framework cavities to balance the negative charge of Al3+ in IV-fold
coordination. Poly (silicates) have the following empirical formula (Eq. 2.1).
𝑀𝑛[−(𝑆𝑖𝑂2)𝑧𝑒 − 𝐴𝑙𝑂2]𝑛, 𝑤𝐻2𝑂 Eq. 2.1
Wherein M is a cation such as potassium, sodium or calcium, and “n” is a degree of
polycondensation; “z” is 1, 2, 3 (Davidovits, 1979). Poly(silicates) are chain and ring
polymers with Si4+ and Al3+ in IV-fold coordination with oxygen and range from
amorphous to semi-crystalline. Some related frameworks are displayed in Figure 2.1.
Figure 2.1: Computer molecular graphics of polymeric Mn-(-Si-O-Al-O-) poly(silicate)
and Mn-(-Si-O-Al-O-Si-O-)n poly(sialate-siloxo), and related frameworks (Davidovits,
1994b)

11
The amorphous to semi-crystalline three dimensional silico-auminate structures were
christened “geopolymers” of the types:
Figure 2.2: Chemical structures of geopolymer
Crystalline Poly(silicate) Mn-(-Si-O-Al-O-)n) and Poly(sialate-siloxo) Mn-(Si-O-Al-O-Si-
O-)n result from hydrothermal setting conditions (Davidovits, 1994b).
Geopolymers are generally formed by reaction of an alumina-silicate powder (Si2O5,
Al2O2) with an alkaline silicate solution at roughly ambient conditions. Eq. 2.2 shows an
example of polycodensation by alkali into poly (sialate-siloxo) (Davidovits, 1994b).
Eq. 2.2
Unlike ordinary Portland/ pozzolanic cements, geopolymers do not form calcium-silicate-
hydrates (CSHs) for matrix formation and strength, but utilise the polycondensation of
silica and alumina precursors and a high alkali content to attain structural strength.

12
Therefore, geopolymers are sometimes referred to as alkali-activate alumina silicate
binders (Davidovits, 1994a; Palomo et al., 1999; Roy, 1999; Van Jaarsveld et al., 2002).
Geopolymers can also be made from sources of pozzolanic materials, such as lava or fly
ash from coal. Most studies on geopolymers have been carried out using natural or
industrial waste sources of metakaolin and other aluminosilicates. Industrial and high-
tech applications rely on more expensive and sophisticated siliceous raw materials.
2.2.2 Advantages of GC
In many sense, geopolymer concrete is considered the better solution of Portland cement
concrete. Ordinary Portland cement (OPC) results from the calcination of limestones
(calcium carbonate) and silica according to the following reaction (Eq. 2.3).
5CaCO3 + 2SiO2 = (3CaO, SiO2)(2CaO, SiO2) + 5CO2 Eq. 2.3
The production of 1 tonne of cement directly generates 0.55 tonnes of chemical CO2 and
requires the combustion of carbon fuel to yield an additional 0.4 tonnes of CO2. Simply,
1T of Cement = 1T of CO2.
The elastic properties of hardened geopolymer concrete and the behaviour and strength
of reinforced geopolymer concrete structural members are similar to those found in OPC.
Therefore, design standards and provisions are similar.
OPC is not fire resistant. It explodes above 3000C causing destruction of concrete
structures. Geopolymer concrete is a good fire resistant material. It can resist upto 12000C
temperature.

13
2.3 Pozzolans as source material of geopolymer
The pozzolan is a material consisting siliceous or aluminous and silicious material
(ASTM C125 - 13b, 2013) and reacts chemically with lime at ordinary temperature in
presence of moisture and forms strong-slow-hardening cement. Due to the presence of
silica and alumina in pozzolanic material, it is used as a raw material in the geopolymer
product (Khale and Chaudhary, 2007).
In the earlier age, the term pozzolana was associated with the naturally formed volcanic
ash and calcined earths. Presently, this term covers all silicious and aluminous materials.
Pozzolanic material like fly ash (FA), palm oil fuel ash (POFA) and metakaolin (MK) are
common in using as a replacement material in cement industry due to its reactivity with
calcium hydroxide (CH) which helps in the improvement of durability of concrete (Sabir
et al., 2001). The geopolymer technology may apply using this pozzolanic material for a
complete replacement of OPC. The source and properties of such well-known pozzolanic
material like FA, POFA and MK are reviewed in following clauses.
2.3.1 Fly ash (FA)
Fly ash is produced by the combustion of finely ground coal injected at high speed with
a stream of hot air into the furnace at electricity generating power plants. On entry into
the boiler, where the temperatures are usually around 15000C, the coal in suspension is
burnt instantaneously. The remaining matter present in the coal, such as shales and clays
(essentially consisting of silica, alumina and iron oxide), melts whilst in suspension, and
then on rapid cooling, as they are carried out by the flue gases, solidifies into fine spherical
particles.
About 80% of the coal ash is eventually carried out of the boiler with the flue gases. It
must be removed before the flue gases are discharged to the atmosphere. This is the

14
material, which is called pulverized fuel ash and more commonly fly ash. The remainder
of the coal ash falls to the bottom of the furnace where it sinters to form a coarser material
called bottom ash (Davidovits, 2008).
Fly ash is divided into two distinct categories:
Class F Low-calcium fly ash: CaO content is less than 10%. This class of fly ash is
usually produced from anthracite and bituminous coals (ASTM C618-12a, 2012).
Class C High-calcium fly ash: CaO content is greater than 10%. This type of fly ash is
usually produced from sub-bituminous and lignite coals (ASTM C618-12a, 2012). An
indication of the composition in oxide values for both low and high-lime is given in Table
2.1: Range of chemical composition for low and high-calcium fly ashes Table 2.1.
Table 2.1: Range of chemical composition for low and high-calcium fly ashes (BS EN
450-1:2012)
Class F
%
Class C
Lignite based %
SiO2 47.2 to 54 18 to 24.8
Al2O3 27.7 to 34.9 12.1 to 14.9
Fe2O3 3.6 to 11.5 6.3 to 7.8
CaO 1.3 to 4.1 13.9 to 49
Free lime content 0.11 18 to 25
MgO 1.4 to 2.5 19 to 2.8
SO3 0.1 to 0.9 5.5 to 9.1
Na2O 0.2 to 1.6 0.5 to 2
K2O 0.7 to 5.7 1 to 3
Jarrige (1971)
The fly ash spheres are made of amorphous (glass) and crystalline elements, mostly
mullite, haematite, magnetite, quatz and unburned carbon residue.

15
Table 2.2: Phase composition of UK fly ashes Dhir (1986)
Phase Mean % Min % Max %
Amorphous 59 30 78
Mullite 19 7 46
Haematite 7 2 15
Magnetite 6 2 10
Quartz 5 1 12
Carbon 4 1 13
It appears that the reactivity of the fly ash depends upon the nature and proportion of the
glass phase present, which in turn, for a given type and source of coal, is generally
determined by the operating temperatures within the boiler (Davidovits, 2008).
Table 2.3: The principle phases found in coals and the phases formed after combustion
It seems that the chemical reactivity depends on the glass content, glass composition and
the physical state of the glass (Davidovits, 2008).
2.3.2 Palm oil fuel ash (POFA)
Palm Oil Fuel Ash (POFA) is generally produced in mills due to usage of palm oil shell
and fibres as fuel. In practice, POFA produced in Malaysian palm oil mill is dumped as
waste without any profitable return (Sumadi and Hussin, 1995). Since Malaysia produces
palm oil as a source of national income and the cultivation of palm oil extracted on regular
basis and the wastes are burnt more POFA is being produced; hence the utilization of
POFA would lead to sustainable development as the storage of POFA in the vicinity of
the factories cause land and environmental pollution.
Common coal minerals Phases formed after combustion
8500C 15000C 18000C
Quatrz Quartz Cristobalite Glass
Kaolinite Metakaolin Glass + Mullite Glass
Illite Illite Glass + Mullite Glass
Pyrite FeS2 FeS/ FeO Fe2O3 haematite + glass Glass
Calcite Lime CaO Glass glass
Davidovits (2008)

16
BURNER
INTERNAL
TEMPERATURE
250 degree celcius
PALM OIL FUEL
PALM OIL
FLY ASH
POFA
Figure 2.3: Typical detail of processing of Palm oil fuel ash in industry
Mijarsh et al. (2014) reported the chemical composition of POFA as shown in Table 2.4.
Table 2.4: Chemical composition of POFA Mijarsh et al. (2014)
Oxide form weight (%) Oxide form % weight
SiO2 65 SO3 0.33
Al2O3 5.7 TiO2 0.25
Fe2O3 4.4 MnO 0.11
CaO 8.2 Na2O 0.07
MgO 4.6 C <1
P2O5 4.7 LoI 2.53
K2O 6.5
2.3.3 Metakaolin (MK)
Metakaolin (Al2Si2O7) is a form of calcined clay blended with lime and it shows the
properties of pozzolanic material. Metakaolin is being using for thousands years as a
cementitious material. The procedure of producing metakaolin involves the calcination
process of kaolinitic clay at high temperature ranging 5000 – 8000C.

17
Metakaolin lioke other pozzolanic materials react with Ca(OH)2 and produces CSH gel
(He et al., 1995; Zhang and Malhotra, 1995). Metakaolin may gain early age strength
depending on the calcining tenperature and clay type (Sabir et al., 2001).
2.4 Geopolymer concrete
2.4.1 Binder proportion
Geopolymer binding material and the proportion for proper geopolymerization depends
on the type, ratios and concentrations of mixing constituents. Each constituent and ratios
have significant role in the production of final geopolymer binding material.
2.4.2 Alkaline activator
A mechanically sound cementing material as a product of geopolymerization process
depends on the activation of the pozzolans. The activators keep important role during
precipitation and crystallization of the silica and alumina compounds in the solution.
Hydroxyl ion acts as catalyst in the geopolymetric reaction. The metal cation serves to
form a structural element and balance the negetive framework carried by the tetrahedral
aliminum (Rangan, 2008). The ability of the alkaline solution drives the mechanism of
the reaction and assists in releasing silicon and aluminum in solution. The pozzolanic raw
material dissolves quickly in this alkaline solution. Amorphous or semi-amorphous
structure is formed by micro-crystallization (Khale and Chaudhary, 2007). The various
groups of activating agents may classified as Alkalis (MOH), weak acid salts (M2CO3,
M2SO3, M3PO4, MF), silicates (M2O*nSiO3), aluminates (M2O*nAlO3), aluminosilicates
(M2O*nAl2SO3*(2-6)SiO2) and strong salt Acids (M2SO4) where M represents an alkali
ion (Pacheco-Torgal et al., 2008). The commonly used activators in geopolymer
chemistry are NaOH, Na2SO4, waterglass, Na2CO3, K2CO3, KOH, K2SO4 and cement
clinker (Khale and Chaudhary, 2007). However, NaOH, KOH and sodium waterglass
18
(nSiO2Na2O) or potassium waterglass (nSiO2K2O) are used widely for the availability
and economy (Kong and Sanjayan, 2008).
2.4.3 Mechanical vibration
The geopolymeric material is generally highly viscous due to the alkaline material and
their reactivity. The air may easily encapsulate into the matrix and proper vibration is
mandatory for geopolymer matrix. Mechanical vibrator is useful for reducing
substantially trapped air pocket and improves the porosity by proper vibration (Saeed et
al., 2010).
2.4.4 Heat curing
The heat curing has an important role in the geopolymerization process. Proper heat
curing expedite the geopolymerization process and early age strength development is
noticed (Rangan, 2008). Temperature in a range of 50 – 800C are accepted for a successful
geopolymer hydration. Curing time as well as temperature has direct influence in the
development of mechanical properties of geopolymer concrete. The research results shew
that there was a yield of development of compressive strength of 15% over the strea
curing method than dry curing (Škvára et al., 2005) and increase of temperature and
reaction time has positive effect. The curing temperature may have negative effect if
reaction time increases at later age and this attributed a decrease of final strength
(Sumajouw and Rangan, 2006).
The basis of the theory of geopolymerization lies within the initial heavy formation of the
reaction product and a successive densification of material instantly upon the presence of
alkaline solution. The final production may exponentially less over time and increment
of temperature serves to degrade previously created aluminosilicate gels within the matrix
which may weaken the overall out product (Sumajouw and Rangan, 2006).

19
Initial 2-5 hours heat curing is important for geopolymer material and strength
development beyond 48 hours is insignificant and the research results shew that the
compressive strength of 60 MPa could be achieved only after five hours by heat curing at
a temperature of 850C (Khale and Chaudhary, 2007).
2.4.5 Mechanical properties
Compressive strength
The research works show that compressive strength of about 70% of 28-day strength is
developed during the first few hours and the rate of compressive strength is very low
afterwards (Duxson et al., 2005; Rangan, 2008). The initial reactivity is highly intense in
proper temperature and heating duration and the activation of pozzolanic materials is
occurred. But the reactive products eventually goes to unreactive pozzolan that reduce
the efficiency of activation as well as the reaction rate (Duxson et al., 2005). Since the
activator permeats slowly through the newly formed coating, the rate of reaction slows
down and compressive strength continues gradually rise.
Figure 2.4: Compressive and flexural strength gain of geopolymers (Duxson et al., 2005)
McDonald and Thompson (2003) found the highest compressive strength 100-160 MPa
at 28-day age in geopolymer material using fly ash and blast furnace slag mixtures and
he concluded that pozzolan mixtures promoted a considerably smaller porosity in the

20
range of 2-10 % which maximized the strength potentially. Temperatures was found
beneficially for curing in the range of 70-900C in this experimental work. The added heat
increase the viscosity of the material and this develops a rthe compressive strength
potentially in geopolymer paste (Khale and Chaudhary, 2007).
Flexural strength
The flexural strength of geopolymer binding materials is substandard to its compressive
strength. McDonald and Thompson (2003) observed that the compressive to tensile
strength ratio under flexural loading is in the ratio of 10:5.5. The benefit of such an
increased tensile potential suggests a possible reduction in reinforcement quantity for
structural elements of identical geometry.
2.4.6 Toughness
This is established now a day that geopolymer mortars and concrete products have
capability to develop mechanical strengths and can resist many harsh chemical
compounds. The effect of steel fibres in geopolymer concrete was not analysed in detail
by the previous research work and the fracture behaviour of fibre-reinforced geopolymer
concrete was not clearly identified. There are previous research works on the effect of
steel fibre in the normal weight concrete and lightweight conventional concrete
(Sivakumar and Santhanam, 2007; Atiş and Karahan, 2009; Hamid et al., 2013; Mo et al.,
2014b). The addition of steel fibres in conventional concrete enhances the flexural
strength and fracture toughness (İpek et al., 2012; Wang et al., 2013; Mo et al., 2014a).
Short fibre
The addition of steel fibre in concrete takes place good role in the development of flexural
as well as fracture toughness. The steel fibre improves the ductility of concrete (Wallah
and Rangan, 2006). The addition of short polyvinyl alcohol (PVA) fibers reinforced

21
geopolymer composites and resulted in good flexural strength and reasonable toughness,
while adding short basalt fibers reduced the strength of tested specimens and drastically
improved the work of fracture element (Hardjito and Rangan, 2005).
The incorporation of short steel fibres increased the flexural strength of geopolymer
composite as reported in previous research work (Hardjito and Rangan, 2005). The
homogeneity of the fibre material is important and this is ensured by the ultrasonic
scattering technology. Short fibres exhibits the advantage of possessing high modulus and
strength characteristics and an addition of 3.5 percent of short fiber material increased
specimen strength by a magnitude of 4.4, yielding value increases from 16.8 to 91.3 MPa
(Hardjito and Rangan, 2005).
The lower aspect ratio as well as the short fibres is directly related to the transmission of
load and the cohesion between the fibre and matrix. The larger fibres imparts more
restriction on deformation and the shorter fibres create added friction due to the increased
number on available fibre ends (Hardjito and Rangan, 2005). The mechanisms that play
role in the toughness and flexural strength development in concrete due to the usage of
steel fibres are due to the fibre bridging and enhancement of pull-out resistance in matrix
(Hardjito and Rangan, 2005).
Long fibres
The long fibres provide mechanical stability and toughness from a different perspective
than those identified for short fibre material. Long fibres i.e. the fibres with high impact
ratio can improve cement functionality as well as toughness due to its sustainability of
greater tensile forces prior to the pull out. The ability of the longer steel fibre to withstand
additional stress facilitate to enhance the toughness energy. The longer steel fibre can
absorb additional tensile load due to its elasticity. The matrix along the tensile side begins
to expand under load and the resistance to tensile failure of the matrix acquire additional

22
stiffness due to the elastic property of longer steel fibre. The longer steel fibre provide
higher plasticity prior to final pull out and failure. A fibre length of 7 mm is identified as
the critical length, essential for the production of geopolymeric materials with optimum
reinforcement and improved toughness (Hardjito and Rangan, 2005).
Steel adhesion
An interesting property of geopolymer cements is their ability to form an extremely strong
bond with steel products. Pull out testing has concluded that the bond strength between
this alkaline concrete mix and steel reinforcement is so great that 8 mm bars embedded
in the matrix broke in two prior to experiencing slippage or concrete cracking (Fernandez-
Jimenez et al., 2006). Additional samples did not cause steel failure, but the loads being
applied to cause bar slippage were 12 MPa and 17 MPa, respectively. This not only
surpasses the 9.70 N/mm requirement specified in the Spanish concrete code (EHE) as
the minimum load to pass the beam test (Fernandez-Jimenez et al., 2006), but it signifies
the intense bonding characteristics of alkali-activated cement systems.
2.5 Development of geopolymer research
2.5.1 Invention of first mineral resin
Since October 1, 1975 Davidovits, J. has been studying the behaviour of metakaolin in
Siliface system. The first goal was to find a process for the manufacture of synthetic
zeolites (type zeolite A) by reacting metakaolin +NaOH. It was noticed that that mixture
was prone to a very important exothermic reaction (t0 exceeding 1000C after 1 hour of
storage in a bag) (Davidovits, 2008).
Davidovits (2008) used that exothermic reaction in the manufacturing of insulating blocks
consisting entirely of a mineral core made of expanded shale or expanded glass spheres,
agglomerated with metakaolin +NaOH. In a panel covered with a siliface facing, the
23
temperature in the centre of a 15 cm thick core reaches 1000C after only 3-4 minutes. The
addition of a binder such as Na-Silicate leads to a liquid coating, and allows reducing the
quantity of mineral binder used in the process (Davidovits, 2008).
It seemed that metakaolin behaved as a hardener for Na-Silicate. Consequently, a mixture
involving Na-Silicate +NaOH + Metakaolin has the following advantages:
a. Exothermicity (hardening to the heart of thick material);
b. Reaction with Na-Silicate (very fast hardening of the liquid binder).
Another consequence of that discovery was that one can treat common clays at 500-
6000C, to obtain a very reactive argillaceous raw material (metakaolin type) being able to
be used in the preceding examples in place of pure metakaolin, together with Na-Silicate,
or alone. It was a step towards more knowledge on the specific reactions involving
mineral polymers, either by using natural raw materials for example standard clay like
Clerac B16, dried, ground or by performing the suitable treatment to transform them into
reactive raw material. It was the first mineral resin ever manufactured (Davidovits, 2008).
2.6 Manufactured sand and Quarry dust as fine aggregate
The main characteristics of the fine aggregate that affect the compressive strength of fresh
and hardened concrete are shape, grade and maximum size. The factors such as shape and
texture of the fine aggregate affect the workability of fresh concrete and influence the
strength and durability characteristics of hardened concrete. The spherical particles have
less surface area than the particles with flat surface and elongated shape. The cubical and
spherical shape contributes in good workability with less water (Shilstone, 1999). Flaky
and elongated particles have negative effect on workability, producing very harsh
mixtures. For given water content, these poorly shaped particles lead to less workable
mixtures than cubical or spherical particles. Conversely, for given workability, flaky and

24
elongated particles increase the demand for water thus affecting strength of hardened
concrete. The void content is also affected by angularity.
In fact, the angular particles tend to increase the demand for water as these particles
increase the void content compared to rounded particles (Quiroga & Fowler, 2004). The
rough aggregate increase the water demand for given workability (Hudson, 1999b). Since
natural sand is often rounded and smooth compared to M-sand, natural sand usually
require less water than M-sand for given workability (Quiroga & Fowler, 2004).
However, workable concrete can be made with angular and rough particles if they are
cubical and well graded.
2.7 Oil palm shell (OPS) as aggregate
Besides the mining sand, the usage of conventional granite in a high rate in construction
industry, effects on the ecological imbalance. The replacement of conventional coarse
aggregate by locally available waste or industrial by-product could reduce the
environmental imbalance. The oil palm shell (OPS) which is abundant in Malaysia,
Indonesia, Philippine and other few countries worldwide has a potentiality to use as a
coarse aggregate.
OPS is the industrial by-product and obtained during extraction of palm oil from the palm
oil nut. This is experimented and well known now a day as a lightweight aggregate. The
research works show that OPS has comparable mechanical and physical properties like
conventional aggregate to produce medium and high strength concrete.
Yew et al. (2014) investigated the effects of heat treatment on OPS aggregates and
reported that selection of a suitable temperature and duration of heat treatment for OPS
aggregates are potentially usable as a new eco-friendly alternative to enhance concrete

25
strength. (Shafigh et al., 2013b) found an early age strength development of for intial
water curing of OPS lightweight concrete consisting ground granulated blast furnace slug.
2.8 Previous research works and research gap
The geopolymer research work was initiated in 1972 and Davidovits is the pioneer of the
geopolymer technology in the practical use. The significant research works on
geopolymer concrete and the research gap are shown in Table 0.1.
2.9 Summary
Geopolymer technology has been proved its potentiality to use as a complete replacement
of Portland cement in near future. Since the industrial wastes like POFA, FA, RHA, etc
are the raw material of developing geopolymer binding material; this could lead to solve
the dumping problem of huge production of waste POFA, FA, RHA, etc in Malaysia and
other south-Asian countries. Besides the replacement of natural aggregate in the
geopolymer concrete by agricultural waste material like OPS and industrial by-product
such as M-sand and quarry dust, may contribute resisting the depletion of natural
resources as well as the ecological imbalance.

26
Table 0.1: Previous research work and research gap
Research
area
Author Previous research work Research gap
Geo
poly
mer
con
cret
e
Abdulkareem et al. (2014),
Bagheri and Nazari (2014),
Phoo-ngernkham et al.
(2014), Alida et al. (2013), Li
et al. (2013), Pangdaeng et al.
(2013)
- Effect of elevated temperature on the development of
geopolymer concrete
- Compressive strength of high strength class C fly
ash-based geopolymers
- Effect of adding nano-SiO2 and nano-Al2O3
- Effect of Acidic to the Fly Ash Based Geopolymer
- Immobilization of simulated radionuclide 133Cs+ by
fly ash-based geopolymer
- Influence of curing conditions
- Lack of analysis on the mechanical
properties of POFA based geopolymer
concrete
- Fracture analysis on geopolymer concrete
was not done
- Lack of usage of POFA in large volume
with MK for geopolymer concrete
- Microstructural analysis of POFA-FA-MK-
based geopolymer concrete
- Impact resistance of geopolymer concrete
- Development of POFA-based geopolymer
concrete incorporating nano-alumina
Oil
pal
m s
hel
l Alengaram et al. (2008),
Jumaat (2010), Alengaram et
al. (2011b), Shafigh et al.
(2013a)
- Influence of Sand Content and Silica Fume on
mechanical properties of OPS concrete
- Comparison of mechanical and bond properties of
OPSC with NWC
- Enhancement and prediction of modulus of elasticity
of palm kernel shell concrete
- OPS was not used as a coarse aggregate in
geopolymer concrete
- Mechanical properties of OPS based
geopolymer concrete was not examined
before.
Man
ufa
c
ture
d
sand
P.Sravana (2013), Chow et
al. (2013)
- Effect of Manufacture sand on Strength
Characteristics
- Effect of M-sand was not determined in the
geopolymer mortar.
27
CHAPTER 3 MATERIALS AND METHODS
3.1 Introduction
This chapter discussed on the preparation of materials, proportions of mix designs and
procedure of casting, curing and testing. All these are described in detail below.
3.2 Materials
3.2.1 Binding materials (POFA, FA, MK)
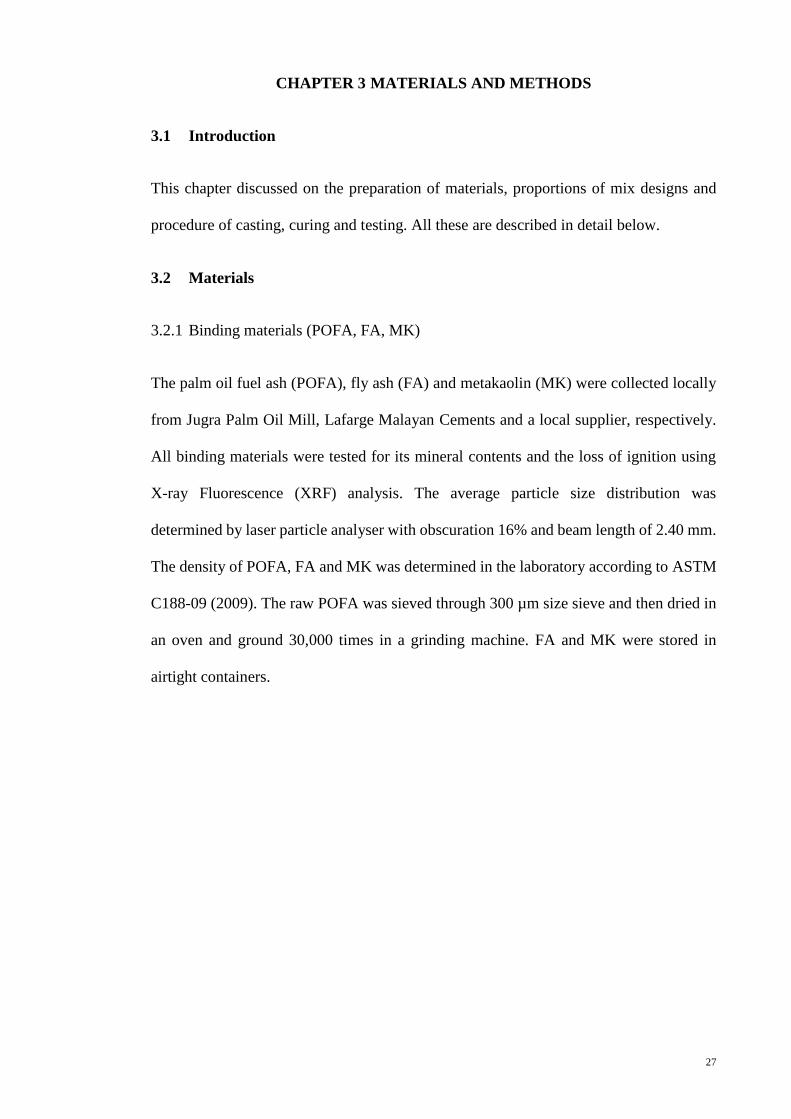
The palm oil fuel ash (POFA), fly ash (FA) and metakaolin (MK) were collected locally
from Jugra Palm Oil Mill, Lafarge Malayan Cements and a local supplier, respectively.
All binding materials were tested for its mineral contents and the loss of ignition using
X-ray Fluorescence (XRF) analysis. The average particle size distribution was
determined by laser particle analyser with obscuration 16% and beam length of 2.40 mm.
The density of POFA, FA and MK was determined in the laboratory according to ASTM
C188-09 (2009). The raw POFA was sieved through 300 µm size sieve and then dried in
an oven and ground 30,000 times in a grinding machine. FA and MK were stored in
airtight containers.
28
Figure 3.1: Collection of POFA
3.2.2 Fine aggregates (Conventional mining sand, manufactured sand-M-sand, Quarry
Dust-QD)
The manufactured sand (M-sand), quarry dust (QD) and the conventional mining sand
(N-sand) were collected locally. The N-sand, M-sand and QD were dried, sieved through
5 mm sieve and retained on 300 µm sieve were used in the preparation of geopolymer
mortar and concrete. The sieve analysis and fineness modulus of fine aggregate were
conducted according to ASTM C136-06 (2006) while the specific gravity as well as
absorption tests were done in accordance with ASTM C128-12 (2012).
3.2.3 Coarse aggregates
The oil palm shell (OPS) and crushed granite aggregates were collected from local oil
palm and quarry industry, respectively. . The OPS was washed, dried and crushed before
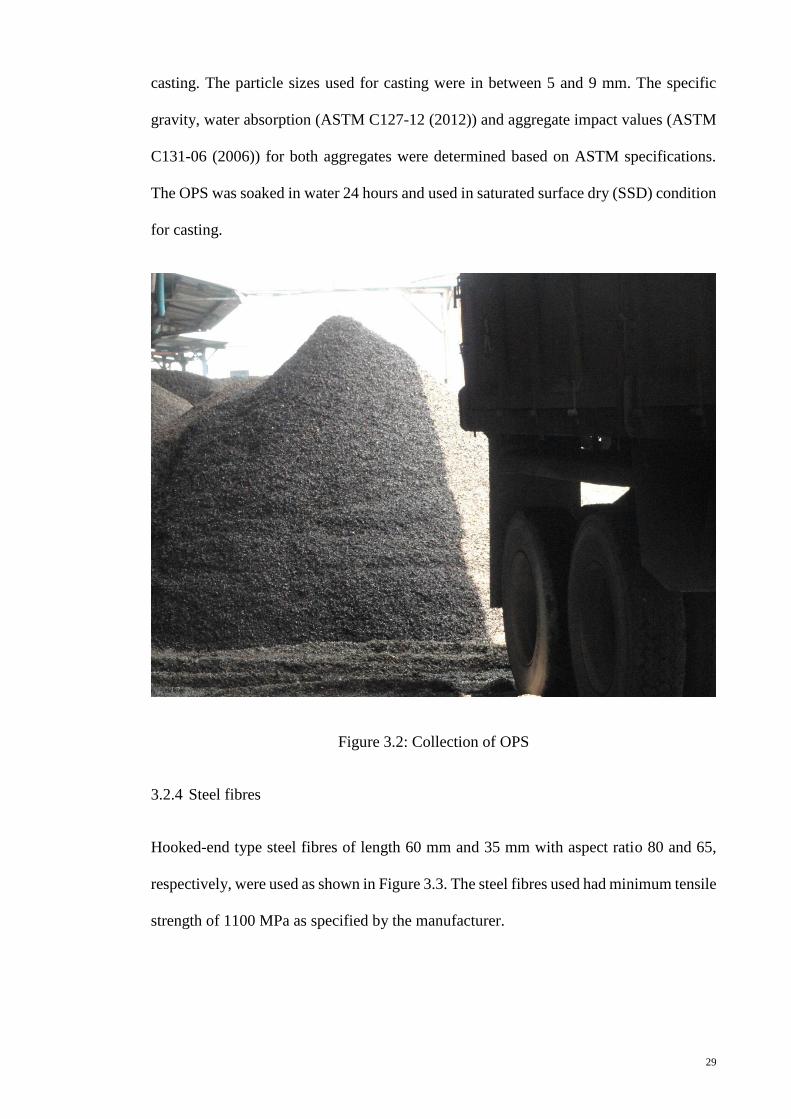
29
casting. The particle sizes used for casting were in between 5 and 9 mm. The specific
gravity, water absorption (ASTM C127-12 (2012)) and aggregate impact values (ASTM
C131-06 (2006)) for both aggregates were determined based on ASTM specifications.
The OPS was soaked in water 24 hours and used in saturated surface dry (SSD) condition
for casting.
Figure 3.2: Collection of OPS
3.2.4 Steel fibres
Hooked-end type steel fibres of length 60 mm and 35 mm with aspect ratio 80 and 65,
respectively, were used as shown in Figure 3.3. The steel fibres used had minimum tensile
strength of 1100 MPa as specified by the manufacturer.

30
Figure 3.3: Steel fibres of AR 80(above) & 65(below)
3.2.5 Water
Potable water was used for casting. The water was free from organic materials and
suspended solids.
3.2.6 Alkaline solution
The alkaline activator using sodium hydroxide (NaOH) and sodium silicate (Na2SiO3)
was prepared at least 24 hours before the casting. The sodium hydroxide (NaOH) solution
of molarity 14 M was prepared for each mix proportion. The modulus of sodium silicate
(i.e. ratio of SiO2/ Na2O) was 2.5. The sodium silicate liquid was mixed with NaOH
solution by weight proportion of 1: 2.5 (NaOH solution: liquid Na2SiO3).

31
3.3 Development of geopolymer concrete
3.3.1 Mixture proportion
The mixture design was carried on in three different aspects as follows to fulfil the
objectives of this research project. The purpose of the first mix design governs the
investigation of the effect of the replacement of mining sand by two industrial by-product
such as quarry dust and manufactured sand in the development of compressive strength
of geopolymer mortar. The best mix proportion for the replacement of mining sand was
used in the second stage of the mix design to determine an appropriate mix proportion of
POFA, FA and MK as a binding material by the study of the mechanical properties of
lightweight geopolymer concrete. The mix proportion that satisfy the minimum
compressive strength of 20MPa as mentioned in the objective, was chosen for further
improvement of tensile strength by using two types of steel fibre with varying volume as
shown in mix design 3. Normal weight geopolymer concrete of similar compressive
strength of the lightweight geopolymer concrete was designed by trial mixes as a control
for the comparison purpose of mechanical properties as well as fracture behaviour.
Mix design 1: The variables of this mixture design were N-sand, M-sand and QD as
shown in Table 3.1. The quantities of POFA, FA, alkaline activator and water used in the
mixes were respectively 343, 343, 274 and 137 kg/m3. The binder content (POFA: FA)
was kept constant at 50:50 with the variable of different proportions of fine aggregate
contents.

32
Table 3.1: Mix design with variables of N-sand, M-sand and QD
Mortar
Designation*
Mix Proportions by weight (kg/m3)
Fine Aggregates
N-Sand M-Sand QD
M 1 1029 (100**) 0 0
M 2 771 (75) 257 (25) 0
M 3 257 (25) 771 (75) 0
M 4 0 1029 (100) 0
M 5 0 257 (75) 771 (25)
M 6 0 771 (25) 257 (75)
M 7 0 0 1029 (100)
M 8 257 (25) 0 771 (75)
M 9 771 (75) 0 257 (25)
M 10 514 (50) 257 (25) 257 (25)
M 11 257 (25) 514 (50) 257 (25)
M 12 257 (25) 257 (25) 514 (50) * Legend:
N100 Normal mining sand 100%
N25-Q75 Normal mining sand 25% and quarry dust 75%
** Proportion in percent in bracket ( )
Mix design 2: The proportion of POFA, FA and MK was varied as shown in Table 3.2.
The ratios of M-sand/ binder, OPS/ binder, alkaline activator/ binder and water/ binder
were 1.125, 0.375, 0.4 and 0.18, respectively. Alkaline solution was prepared using 14 M
NaOH solution and liquid Na2SiO3 with a proportion of 1:2.5.
Table 3.2: Mix design with variables of POFA, FA and MK
Concrete
Designation
Binder (kg/m3)
POFA FA MK
P10-F85-M05 60 (10*) 507 (85) 30 (5)
P10-F80-M10 60 (10) 478 (80) 60 (10)
P10-F75-M15 60 (10) 448 (75) 90 (15)
P10-F70-M20 60 (10) 418 (70) 119 (20)
P10-F65-M25 60 (10) 388 (65) 149 (25)
P90-M10 537 (90) - 60 (10)
P80-M20 478 (80) - 119 (20)
P70-M30 418 (70) - 179 (30)
P60-M40 358 (60) - 239 (40)
* Proportion in percent in bracket ( )

33
Mix design 3: The effect of steel fibres on the mechanical properties and fracture
behaviour was investigated for two different aspect ratios. The volume proportions of the
steel fibres were 0.25, 0.50 and 0.75% (Table 3.3). The mixes OG-65/0.25 to OG-80/0.75,
GG-65/0.5 and GG-80/0.5 had fibre contents varying between 0.25 and 0.75% of total
volume of concrete; the mixes OG and GG were designed as control mixes without fibres
for comparison. The proportions of alkaline solution and water are shown in Table 3.3.
Table 3.3: Mix design with variables of steel fibre proportion and aspect ratio
Concrete
designation
POFA MK M-sand OPS Gravel
Steel
Fibre-
65/35
Steel
fibre-
80/60 Alkaline/
binder
Water/
binder
Proportion (kg/m3) by weight
OG 508 56 636 212 - - -
0.5 0.11
OG-65/0.25 508 56 636 212 - 19.75
(0.25*) -
OG-80/0.25 508 56 636 212 - - 19.75
(0.25)
OG-65/0.5 508 56 636 212 - 39.50
(0.5) -
OG-80/0.5 508 56 636 212 - - 39.50
(0.5)
OG-65/0.75 508 56 636 212 - 59.25
(0.75) -
OG-80/0.75 508 56 636 212 - - 59.25
(0.75)
GG 510 57 380 - 753 - -
0.4 0.2 GG-65/0.5 510 57 380 - 753
39.50
(0.5) -
GG-80/0.5 510 57 380 - 753 - 39.50
(0.5)
* Proportion in percent in bracket ( )
3.3.2 Casting, specimen preparation, curing and testing age
The binders were mixed with the aggregates and steel fibres (for mixture design 3) in the
drum mixture of capacity 0.2 m3 (Figure 3.4). The alkaline activator was then added and
mixed properly. It was taken around 15 minutes to mix all with alkaline solution properly.
The water was then added to the mixture. The slump and fresh density were then tested

34
for fresh concrete. Prior to casting, the moulds were cleaned and coated with oil. The
dimensions and numbers of specimens prepared are shown in Table 3.4.
Figure 3.4: Casting of geopolymer fibre reinforced concrete
Table 3.4: Specimens for testing of concrete
Test
(age)
Specimens and dimensions (mm) Remarks
Compressive strength test
(3-, 7-, 14- and 28-day)
Cubes 100 mm (concrete)
50 mm (mortar)
Mechanical properties
tests were conducted for
both OPSGC and
NWGC with fibres and
without fibres; special
arrangement was made
for fracture toughness
test based on ASTM
C1609/C1609M-12
(2012).
Indirect tensile strength
test
(28-day)
Cylinders
ϕ100 mm x 200 mm height
Flexural strength test
(28-day)
Prisms
100 mm x 100 mm x 500 mm
Static modulus of elasticity
(28-day)
Cylinders
ϕ150 mm x 300 mm height
Fracture toughness test
(28-day)
Prism of 100 mm x 100 mm x 500
mm with 30 mm groove

35
The concrete was poured into the moulds in three consecutive layers (Figure 3.5). After
each pour, the vibrating table was set to run for 10 seconds and this vibration was kept
consistent for all the mix proportions. Since a minimum quantity of water used,
segregation was not noticed during the vibration. The minimum amount of water was
determined by the trial mix design. After the vibration, the top surface was trowelled to
give a smooth surface. Specimens were then covered and kept into the oven for 48 hours
at a temperature of 650C after 3 to 5 hours. Hardjito and Rangan (2005) reported that a
delay in starting heat curing up to five days had no noticeable degradation in the
compressive strength. The specimens were demoulded after 48 hours and kept in a room
temperature and relative humidity of 280C and 79%, respectively.
Figure 3.5: Preparation of specimens

36
3.4 Testing
3.4.1 Fresh concrete tests
The slump test was conducted according to ASTM C143/C143M-12 (2012)for evaluating
workability and consistency of concrete. The fresh density was tested in compliance with
ASTM C1688/C1688M-13 (2013).
3.4.2 Mechanical properties of concrete
Compressive strength test
The compressive strength test was carried out according to BS EN 12390-3:2009 (2009).
The specimens were tested at the age of 3-, 7-, 14- and 28-day. An ELE testing machine
(Figure 3.6) of capacity 2000 kN was used. The loading pace was 2.4 kN/sec. The
compressive strength (MPa) was calculated based on Eq. 3.1.
σ =
Failure load
Area
Eq. 3.1
Figure 3.6: ELE testing machine of capacity 2000 kN
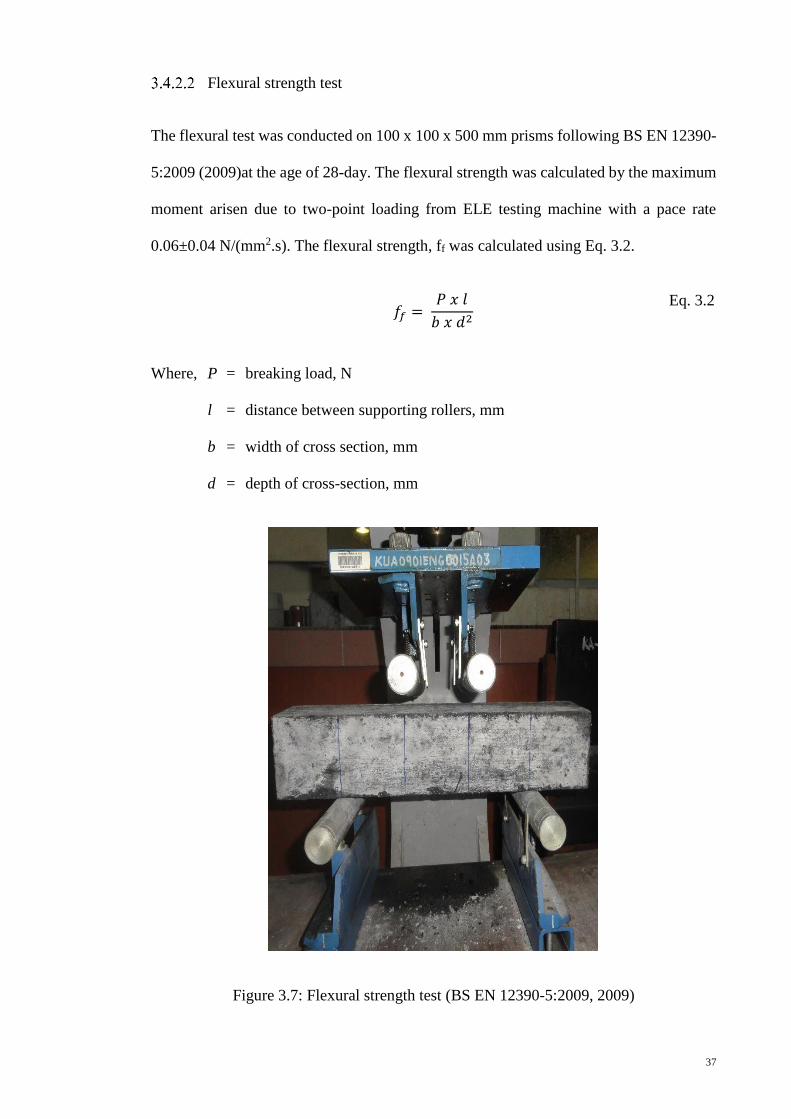
37
Flexural strength test
The flexural test was conducted on 100 x 100 x 500 mm prisms following BS EN 12390-
5:2009 (2009)at the age of 28-day. The flexural strength was calculated by the maximum
moment arisen due to two-point loading from ELE testing machine with a pace rate
0.06±0.04 N/(mm2.s). The flexural strength, ff was calculated using Eq. 3.2.
𝑓𝑓 =
𝑃 𝑥 𝑙
𝑏 𝑥 𝑑2
Eq. 3.2
Where, P = breaking load, N
l = distance between supporting rollers, mm
b = width of cross section, mm
d = depth of cross-section, mm
Figure 3.7: Flexural strength test (BS EN 12390-5:2009, 2009)
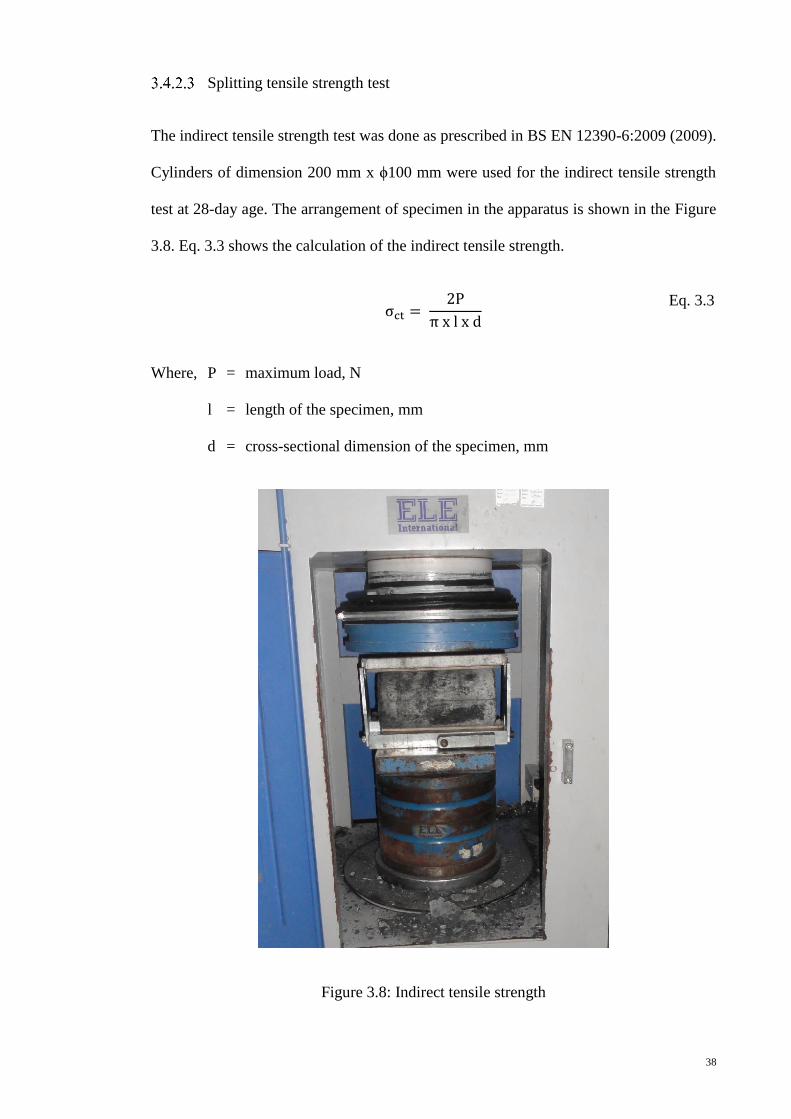
38
Splitting tensile strength test
The indirect tensile strength test was done as prescribed in BS EN 12390-6:2009 (2009).
Cylinders of dimension 200 mm x ϕ100 mm were used for the indirect tensile strength
test at 28-day age. The arrangement of specimen in the apparatus is shown in the Figure
3.8. Eq. 3.3 shows the calculation of the indirect tensile strength.
σct =
2P
π x l x d
Eq. 3.3
Where, P = maximum load, N
l = length of the specimen, mm
d = cross-sectional dimension of the specimen, mm
Figure 3.8: Indirect tensile strength

39
Static modulus of elasticity test
The static modulus of elasticity was carried out in accordance with ASTM C469 - 14 .
Two cylinders of dimension 300 mm x ϕ150 mm were tested at the age of 28-day. The
compressometer was attached axially to the specimen (Figure 3.9) and placed centrally in
the ELE compression machine. The pace of loading was fixed to 4.418 kN/sec. An initial
stress of 0.5 MPa was applied and the strain gauge readings were recorded. Final stress
was applied at the one-third cylinder compressive strength of concrete. The stress was
maintained 60 seconds in both the initial and final stress. The static modulus of elasticity
(E, GPa) is determined by the Eq. 3.4.
E = (Final stress−Initial stress)x 2 x 200
(Final gauge reading−Initial gauge reading) x 0.01 x 10⁻³ Eq. 3.4
Figure 3.9: Static modulus of elasticity test

40
3.4.3 Fracture test
The fracture and flexural toughness were determined from the test prescribed by ASTM
C1609/C1609M-12 (2012) and ASTM C1018-97 (1997).
ASTM C1609/C1609M-12 (2012)evaluates the flexural performance of fibre reinforced
concrete from the load-deflection curve obtained by third-point loading (Figure 3.10).
The modulus of rupture can be determined from the Eq. 3.5.
𝑓 =
𝑃𝐿
𝑏𝑑2
Eq. 3.5
Where,
f = modulus of rapture (MPa)
P = load (N)
L = span length (mm)
b = the average width of the specimen at the fracture, as oriented for testing, (mm)
d = the average depth of the specimen at the fracture, as oriented for testing (mm)
First peak, peak loads, corresponding stresses, residual loads at specified deflection and
the corresponding residual strength are also required to determine from this test for the
modulus of rapture calculation by Eq. 3.5. Specimen toughness obtained by the load-
deflection area is an expression of the energy absorption capability of that particular
specimen.

41
Figure 3.10: Fracture test (ASTM C1609/C1609M-12, 2012)
Figure 3.11: Specimens for fracture test

42
The definition and calculation of the terminologies used in the fracture test is given in the
following clauses.
End point deflection: The deflection value on the load-deflection curve equal to
1⁄150 of the span length, or a larger value as specified at the option of the specifier of
tests.
First peak load, P1: The load value at the first point on the load-deflection curve
where the slope is zero.
First-peak deflection, δ1: The net deflection value on the load-deflection curve
at first-peak load.
First-peak strength, f1: The stress value obtained when the first-peak load is
inserted in the formula for modulus of rupture given in Eq. 3.5.
Load-deflection curve: The plot of load versus net deflection of a flexural beam
specimen loaded to the end-point deflection.
Net deflection: The deflection measured at mid-span of a flexural beam
specimen exclusive of any extraneous effects due to seating or twisting of the specimen
on its supports or deformation of the support and loading system.
Peak load, PP: The maximum load on the load-deflection curve.
Peak-load deflection, δP: The net deflection value on the load-deflection curve
at peak load.
Peak strength, fP: The stress value obtained when the peak load is inserted in the
formula for modulus of rupture given by Eq. 3.5.

43
D: Nominal depth of the beam specimen in mm. To simplify nomenclature, the
nominal beam depth is shown in units of mm for both the SI and inch-pound version of
this test method.
L: Span length or distance between the supports.
Residual load, PD600: The load value corresponding to a net deflection of L/600
for a beam of nominal depth D.
Residual load, PD150: The load value corresponding to a net deflection of L/150
for a beam of nominal depth D.
Residual strength, fD600: The stress value obtained when the residual load PD
600
is inserted in the formula for modulus of rupture given in Eq. 3.5.
Residual strength, f D150: The stress value obtained when the residual load PD
150
is inserted in the formula for modulus of rupture given in Eq. 3.5.
Specimen toughness, TD150: Toughness of beam specimen of nominal depth D at
a net deflection of L/150.
Equivalent flexural strength ratio, RDT, 150: The value obtained when the
specimen toughness TD150 is inserted in Eq. 3.6.
𝑅𝑇,150
𝐷 = 150. 𝑇150
𝐷
𝑓1. 𝑏. 𝑑2. 100%
Eq. 3.6

44
3.5 Summary
The main focus was given to the usage of POFA in large quantity in geopolymer
lightweight concrete. The compressive strength of 20 MPa was considered as a
benchmark for the minimum compressive strength for the structural lightweight concrete.
The mix designs does not reflect the optimum mix design. The steel fibres were used to
improve the tensile properties of OPSGC.

45
CHAPTER 4 RESULTS AND DISCUSSIONS
4.1 Introduction
The properties of materials such as chemical composition of binding materials, particle
size distribution of POFA, FA, MK, fine and coarse aggregate and water absorption rate
of aggregates were measured and have been reported in this chapter. The fresh and
hardened density, slump value, compressive strength, tensile properties and fracture
behaviour of concrete are discussed also in this chapter.
4.2 Properties of materials
4.2.1 Binding materials
The test results on X-ray fluorescence (XRF) for chemical composition and particle size
distribution of POFA, FA and MK are shown in Figure 4.1 and Table 4.1.
The percentages of SiO2, Al2O3 & Fe2O3 are 76.14, 87.15 and 97.12 in POFA, FA and
MK respectively. According to ASTM C618-12a (2012), the POFA and FA are
categorized as class F, since these samples contain at least 70% of SiO2, Al2O3 & Fe2O3.
Table 4.1: Chemical composition and physical properties of POFA and FA
Chemical
compounds
CaO SiO2 Al2O3 MgO Na2O SO3 K2O Fe2O3 LoI
POFA 5.57 67.72 3.71 4.04 0.16 1.07 7.67 4.71 6.20
FA 5.31 54.72 27.2 1.10 0.43 1.01 1.00 5.15 6.80
MK 0.04 52.68 42.42 0.12 0.07 0.05 0.34 2.02 1.40
Physical
properties
Colour S.G. S.S.A. D[4, 3] D[3, 2] D(v, 0.1) D(v, 0.5) D(v, 0.9)
POFA Black 2.2 3.41 20.06 3.49 3.23 18.46 38.27
FA Grey 2.34 1.72 36.43 1.76 0.48 16.50 101.74
MK Off-white 2.5 4.33 10.95 1.39 0.48 4.26 32.67
S.G. = Specific gravity S.S.A. = Specific surface area, m2/g
D[4, 3] = Volume moment mean, μm D[3, 2] = Surface area moment mean, μm
D(v, 0.1) = 10% of particle by volume below this size (mm)
D(v, 0.5) = 50% of particle by volume below this size (mm)
D(v, 0.9) = 90% of particle by volume below this size (mm)
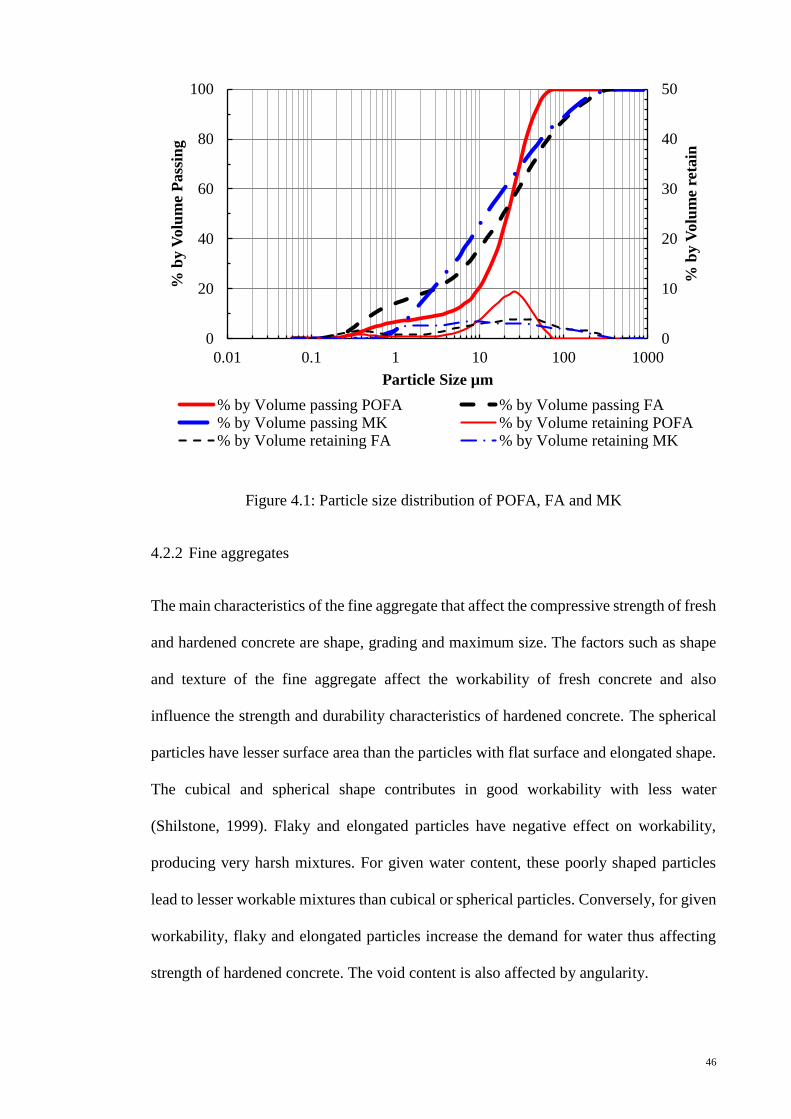
46
Figure 4.1: Particle size distribution of POFA, FA and MK
4.2.2 Fine aggregates
The main characteristics of the fine aggregate that affect the compressive strength of fresh
and hardened concrete are shape, grading and maximum size. The factors such as shape
and texture of the fine aggregate affect the workability of fresh concrete and also
influence the strength and durability characteristics of hardened concrete. The spherical
particles have lesser surface area than the particles with flat surface and elongated shape.
The cubical and spherical shape contributes in good workability with less water
(Shilstone, 1999). Flaky and elongated particles have negative effect on workability,
producing very harsh mixtures. For given water content, these poorly shaped particles
lead to lesser workable mixtures than cubical or spherical particles. Conversely, for given
workability, flaky and elongated particles increase the demand for water thus affecting
strength of hardened concrete. The void content is also affected by angularity.
0
10
20
30
40
50
0
20
40
60
80
100
0.01 0.1 1 10 100 1000
% b
y V
olu
me
reta
in
% b
y V
olu
me
Pass
ing
Particle Size µm
% by Volume passing POFA % by Volume passing FA% by Volume passing MK % by Volume retaining POFA% by Volume retaining FA % by Volume retaining MK
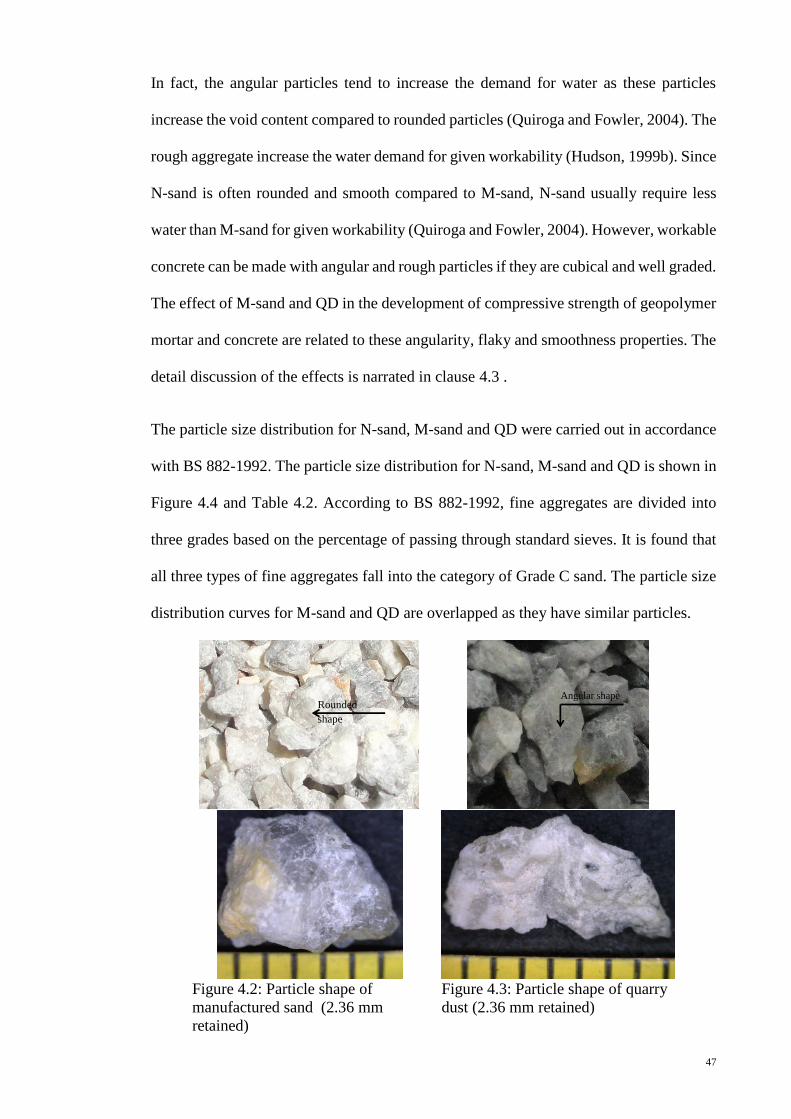
47
In fact, the angular particles tend to increase the demand for water as these particles
increase the void content compared to rounded particles (Quiroga and Fowler, 2004). The
rough aggregate increase the water demand for given workability (Hudson, 1999b). Since
N-sand is often rounded and smooth compared to M-sand, N-sand usually require less
water than M-sand for given workability (Quiroga and Fowler, 2004). However, workable
concrete can be made with angular and rough particles if they are cubical and well graded.
The effect of M-sand and QD in the development of compressive strength of geopolymer
mortar and concrete are related to these angularity, flaky and smoothness properties. The
detail discussion of the effects is narrated in clause 4.3 .
The particle size distribution for N-sand, M-sand and QD were carried out in accordance
with BS 882-1992. The particle size distribution for N-sand, M-sand and QD is shown in
Figure 4.4 and Table 4.2. According to BS 882-1992, fine aggregates are divided into
three grades based on the percentage of passing through standard sieves. It is found that
all three types of fine aggregates fall into the category of Grade C sand. The particle size
distribution curves for M-sand and QD are overlapped as they have similar particles.
Figure 4.2: Particle shape of
manufactured sand (2.36 mm
retained)
Figure 4.3: Particle shape of quarry
dust (2.36 mm retained)
Rounded
shape
Angular shape

48
Table 4.2: Particle size distribution of N-sand, M-sand and QD
Sieve size Percentage of passing
N-sand M-sand QD
5 mm 99.99 100.00 99.98
2.36 mm 81.63 70.91 73.66
1.18 mm 60.60 52.09 52.52
600 µm 33.18 30.34 29.41
300 µm 12.16 13.12 11.01
Fineness modulus 2.88 2.66 2.67
D10, mm 0.27 0.30 0.31
D30, mm 0.50 0.55 1.41
D60, mm 1.24 1.42 0.57
Cu = D60 / D10 4.53 4.80 4.56
Cc = D302 / (D10 x D60) 0.74 0.73 0.74
Cu = Uniformity coefficient; Cc = Coefficient of
curvature
Figure 4.4: Particle size distribution curve for N-sand, M-sand and QD
0
20
40
60
80
100
0.1 1 10
% P
assi
ng
Sieve Size (mm)
N-sand M-sand QD
Grade C based on BS EN 933-8-2012 Fineness Modulus: 2.88, 2.66, 2.67 for N-sand, M-sand & QD respectively
Grade C Upper limit
Grade C Lower limit

49
The Specific gravity, and absorption of N-sand, M-sand and QD were measured (Table
4.3) according to ASTM C29/29M & ASTM 128.
Table 4.3: Specific gravity and absorption of N-sand, M-sand and QD
N-sand M-sand QD
Specific gravity
OD 2.77 1.97 2.09
SSD 2.79 2.63 2.61
Absorption (%) 0.81 0.91 0.92
OD Oven Dry
SSD Saturated Surface Dry
4.2.3 Coarse aggregate
The fineness modulus, specific gravity, water absorption and aggregate impact value
(AIV) of crushed granite and OPS were determined according to ASTM C127-12 (2012),
ASTM C131-06 (2006) and ASTM C136-06 (2006). Table 4.4 shows the physical
properties of granite and OPS. It is noticed that the water absorption of OPS is higher
than granite and the AIV is lower than granite.
Table 4.4: Physical properties of coarse aggregate
Coarse
aggregates
Fineness
modulus
Specific gravity Water
absorption, %
Aggregate
impact factor, %
Granite 7.43 2.67 <1 11.9
OPS 6.25 1.32 24.74 3.93
4.3 Mix Design 1: Effect of molarity, N-sand, M-sand and QD in geopolymer
mortar
The following discussions focus on the mortar mix developed using POFA and FA with
three different types of fine aggregates, namely N-sand, M-sand and QD. The fresh and
hardened densities, compressive strength, effect of molarity, fineness modulus etc. are
analyzed and reported in the subsequent sections.

50
4.3.1 Density
The fresh and hardened densities of mortar for different mix proportions at the ages of 3-
, 7-, 14- & 28-day are shown in Figure 4.5. The fresh densities of the 12 mixes are shown
along the X-axis for zero compressive strength. The fresh and hardened densities vary in
the range of 2060 - 2154 kg/m3 and 1981- 2069 kg/m3, respectively. The apparent density
increases with the ratio of Si:Al (Davidovits, 2008). Since the main variables for different
mix proportions in geopolymer mortar are N-sand, M-sand & QD, and the specific gravity
of these materials influence the variation of densities. Thus the influence of fresh densities
of mixes M1 (100% NS), M4 (100% M-sand) and M7 (100% QD) of 2146, 2060 and
2060 kg/m3, respectively could be related to the respective specific gravities of fine
aggregates of 2.79 (NS), 2.63 (M-sand) and 2.61 (QD).
Figure 4.5: Density vs age (days)
The changes in density at different ages are influenced by the geopolymerization and
curing condition as these undergo several dehydroxylation and crystallization phases at
1980
2020
2060
2100
2140
2180
0 7
14
21
28
Den
sity
(kg/m
3)
Age (Days)
M1 M2 M3 M4 M5 M6
M7 M8 M9 M10 M11 M12
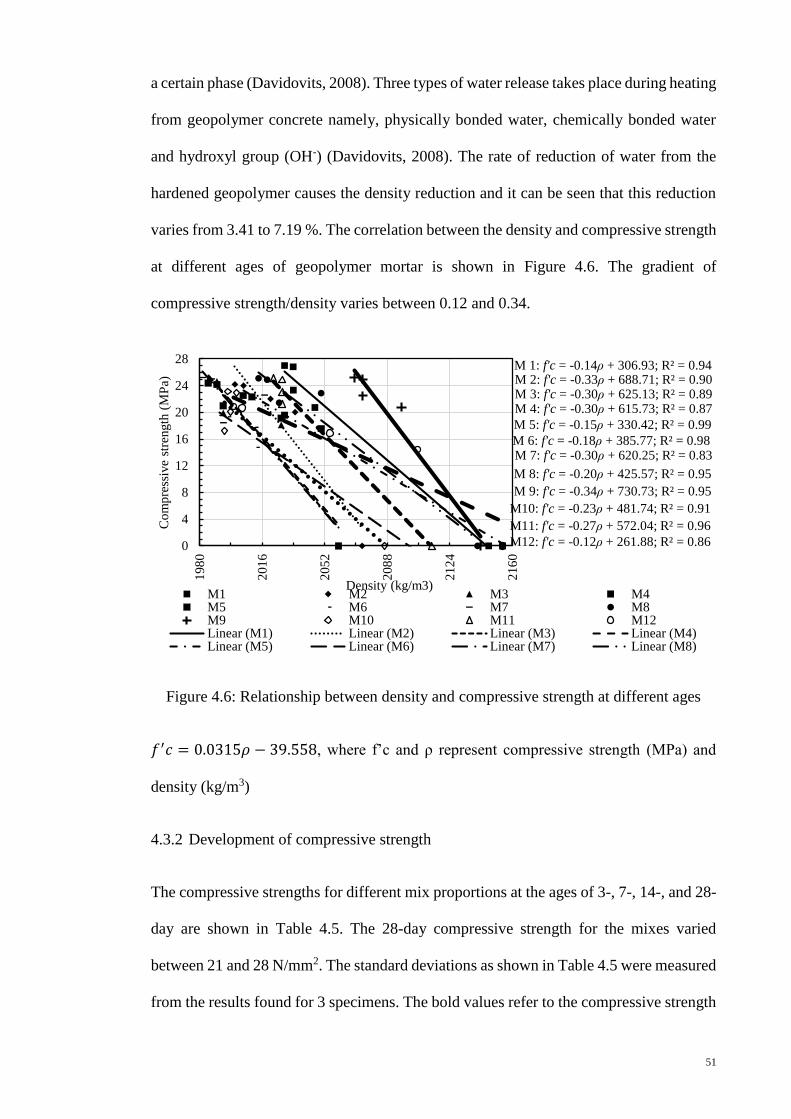
51
a certain phase (Davidovits, 2008). Three types of water release takes place during heating
from geopolymer concrete namely, physically bonded water, chemically bonded water
and hydroxyl group (OH-) (Davidovits, 2008). The rate of reduction of water from the
hardened geopolymer causes the density reduction and it can be seen that this reduction
varies from 3.41 to 7.19 %. The correlation between the density and compressive strength
at different ages of geopolymer mortar is shown in Figure 4.6. The gradient of
compressive strength/density varies between 0.12 and 0.34.
Figure 4.6: Relationship between density and compressive strength at different ages
𝑓′𝑐 = 0.0315𝜌 − 39.558, where f’c and ρ represent compressive strength (MPa) and
density (kg/m3)
4.3.2 Development of compressive strength
The compressive strengths for different mix proportions at the ages of 3-, 7-, 14-, and 28-
day are shown in Table 4.5. The 28-day compressive strength for the mixes varied
between 21 and 28 N/mm2. The standard deviations as shown in Table 4.5 were measured
from the results found for 3 specimens. The bold values refer to the compressive strength
M 1: f'c = -0.14ρ + 306.93; R² = 0.94M 2: f'c = -0.33ρ + 688.71; R² = 0.90M 3: f'c = -0.30ρ + 625.13; R² = 0.89M 4: f'c = -0.30ρ + 615.73; R² = 0.87
M 5: f'c = -0.15ρ + 330.42; R² = 0.99
M 6: f'c = -0.18ρ + 385.77; R² = 0.98M 7: f'c = -0.30ρ + 620.25; R² = 0.83
M 8: f'c = -0.20ρ + 425.57; R² = 0.95
M 9: f'c = -0.34ρ + 730.73; R² = 0.95
M10: f'c = -0.23ρ + 481.74; R² = 0.91
M11: f'c = -0.27ρ + 572.04; R² = 0.96
M12: f'c = -0.12ρ + 261.88; R² = 0.860
4
8
12
16
20
24
28
198
0
201
6
205
2
208
8
212
4
216
0
Co
mp
ress
ive
stre
ngth
(M
Pa)
Density (kg/m3)M1 M2 M3 M4M5 M6 M7 M8M9 M10 M11 M12Linear (M1) Linear (M2) Linear (M3) Linear (M4)Linear (M5) Linear (M6) Linear (M7) Linear (M8)

52
of mortar with 100% N-sand, M-sand and QD. The average 3-day compressive strength
of all mixes was found to be 76% of the 28-day strength. The pattern of early age strength
development supports the findings reported by previous researchers (Davidovits, 2008;
Lloyd and Rangan, 2009).
Figure 4.7 shows the comparison of the compressive strengths for different mortar
mixtures with varying proportion of N-sand, M-sand and QD. Though the mortar with
100% N-sand produced the highest 28-day strength, the combination of N-sand with M-
sand and QD reduced the strength. The shape, texture and particle size distribution affect
the compressive strength (Quiroga and Fowler, 2004) that might have attributed to the
variation of the compressive strength as seen in Figure 4.7. The packing density is another
factor that influences the workability as well as the compressive strength. Fung et al.
(2009) cited from Powers (1969) that for a constant volume of binder paste, higher
packing density lead to higher workability.
Table 4.5: Development of compressive strength for different mix designs
Designation Compressive strength (N/mm2)
3 day SD 7 day SD 14 day SD 28 day SD
M 1 20.8 0.6 23.3 0.3 26.8 0.2 27.8 0.4
M 2 20.0 0.3 22.0 0.9 24.0 0.4 25.1 0.5
M 3 18.1 0.2 19.9 0.2 24.7 0.1 25.7 0.2
M 4 19.1 1.0 21.0 0.2 24.2 0.5 25.2 0.6
M 5 17.6 1.1 19.6 0.5 22.3 0.9 23.4 0.8
M 6 14.8 1.2 17.8 0.6 19.4 0.3 20.5 0.7
M 7 21.6 0.1 23.0 0.4 25.0 0.2 26.1 0.2
M 8 21.5 1.0 22.9 1.2 24.9 0.9 26.0 1.0
M 9 20.8 0.3 22.5 0.3 25.0 1.1 26.1 0.6
M 10 17.2 0.3 20.1 0.3 22.9 0.8 24.0 0.4
M 11 21.3 0.6 23.1 0.7 24.9 0.8 26.0 0.6
M 12 14.5 0.7 16.9 0.7 20.7 0.7 21.8 0.7

53
Figure 4.7: Compressive strengths for different mix design
4.3.3 Failure mode
The failure mode of N-sand/ M-sand/ QD based geopolymer mortar was found similar to
the N-sand based cement mortar. Also, the mode of failure was found satisfactory as
specified in BS EN 12390-3:2009 (2009) (Figure 4.8and Figure 4.9).
Figure 4.8: Satisfactory failures (BS EN 12390-3:2009 (2009))
0
6
12
18
24
30
0
20
40
60
80
100
M1
M2
M3
M4
M5
M6
M7
M8
M9
M1
M1
0
M1
1
M1
2
Co
mp
ress
ive
stre
ngth
(M
Pa)
% o
f N
-San
d,
M-S
and
and
QD
in M
ort
ar
Mortar ID
% of N-Sand % of M-Sand% of QD 3 day compressive strength7 day compressive strength 14 day compressive strength
Explosive failure

54
Figure 4.9: Failure mode of geopolymer mortar
4.3.4 Role of POFA-FA on the development of compressive strength
The high content of pozzolanic silica and alumina in POFA and FA causes the silica-
based geopolymerization in presence of alkaline solution. The silica/ alumina ratio, total
content of silica, alumina and Fe2O3 affect the strength development (Davidovits, 2008).
It is to be noted that the binders, POFA and FA were kept at equal proportion for all the
mixes. The silica/alumina ratio and the total contents of silica, alumina and Fe2O3 in the
POFA-FA mixture were found to be 3.95 and 82%, respectively and Autef et al. (2013a)
reported that high amount of silica content increased the rate of geopolymerzation.
As seen from Table 4.1, 90% of the particles of POFA and FA were found below 38.27
and 101.74 μm, respectively. The finer particles decrease the volume of capillary pore
effectively (Chindaprasirt et al., 2007). The angular and irregular shaped QD particles
create voids within the mortar. The filler effect of the fine FA and POFA might reduce
the voids and Ashtiani et al. (2013) reported that higher packing factor enhanced the
compressive strength.
The effect of oven curing on the strength development also plays significant role in
geopolymer mortar as seen from the 3-day compressive strength; as seen from Table 4.6,

55
the achievement of 76% of 28-day compressive strength at the age of 3-day is attributed
to the heat curing in oven at 650C temperature for 24 hours. However, the rate of strength
increment from 3-day to 7-day was found between 12 and 16% and beyond 7-day, it is
much lower as reported in Table 4.6. Similar finding on high early strength development
due to heat curing at elevated temperature was reported elsewhere (Davidovits, 2008;
Pangdaeng et al., 2013). The fineness of POFA and FA also have significant effect on the
development of early age strength at 3-day. The finer particles have larger surface area
that may increase the reactivity in the geopolymerization process (Somna et al., 2011).
Table 4.6: Percentage of increment of compressive strength
Equations Mortar ID
M1 M2 M3 M4 M5 M6 M7 M8 M9 M10 M11 M12
3 to 7 day 𝑆7 − 𝑆3
𝑆3𝑥100
12.5 9.9 9.8 9.8 11.2 20.4 6.8 6.8 8.1 16.6 8.6 16.8
7 to 14
day
𝑆14 − 𝑆7
𝑆7𝑥100
14.9 9.0 23.9 15.1 14.2 9.0 8.8 8.8 11.1 14.3 7.9 22.7
14 to 28
day
𝑆28 − 𝑆14
𝑆3𝑥100
3.7 4.2 4.1 4.1 4.5 5.2 4.0 4.0 4.0 4.4 4.0 4.8
S3, S7, S14, S28 are the compressive strengths at 3-, 7-, 14-, and 28-day, respectively
4.3.5 Effect of particle size of N-sand/ M-sand/QD on geopolymerization
The volume of fine particles (below 600 µm) of N-sand is slightly higher than that of M-
sand and QD (Table 4.2). The fine particles may have positive effect on the
geopolymerization process and therefore a slightly higher 28-day compressive strength
(27.8 MPa) was noticed for N-sand than that of M-sand (25.2 MPa) and QD (26.1 MPa).
Tasong et al. (1998) reported that a wide range of chemical interactions is anticipated
within the interfacial transition zone between aggregate and cement paste matrix. Isabella
et al. (2003) found a positive effect on the addition of soluble silicates into leaching
solution by promoting significant structural breakdown of sand & metakaolin; they also
reported that larger surface area of the aggregate interacted with soluble silicates releasing
a greater amount of Si. It is conceivable that the fine particles of N-sand/ M-sand/ QD
may interact with the alkaline solution in mortar; the rate of interaction with N-sand, M-

56
sand and QD surfaces may be related to their particle surface area. A strong bonding
between geopolymer matrix and the aggregate surface by the ionic interaction may exist
(Lee and van Deventer, 2007) and this could enhance the development of compressive
strength of N-sand/ M-sand/ QD based geopolymer mortar.
4.3.6 Effect of molarity of alkaline activated solution on development of compressive
strength
The effect of molarity of alkaline activated solution (NaOH solution) on the 28-day
compressive strength is shown in Figure 4.10. As shown in Figure 4.11 the early age
compressive strength at the age of 3-day for the mix with 14 M was found between 55
and 77% of the 28-day strength and this is higher than the corresponding strength of mixes
with 12M. The use of low concentrated alkaline solution causes a weak reaction (Puertas
et al., 2000). The compressive strength increase in the mixes with high molarity based
alkaline solution was due to the leaching of silica and alumina (Chindaprasirt et al., 2009).
The NaOH concentration performs the dissolution process and bonding of solid particles
in the geopolymeric environment (Álvarez-Ayuso et al., 2008). The use of high
concentration of NaOH solution leads to greater dissolution and increases the
geopolymerization reaction (Guo et al., 2010) and this is supported by various studies
(Kovalchuk et al., 2007; Hardjito et al., 2009; Somna et al., 2011; Memon et al., 2013).

57
Figure 4.10: Effect of molarity of alkaline activated solution in compressive strength
Figure 4.11: Development of early age compressive strength
0
5
10
15
20
25
30
M1 M2 M3 M4 M5 M6 M7 M8 M9 M10 M11 M12
28
-day
co
mp
ress
ive
stre
ngth
(M
Pa)
Mortar ID
14 Molarity NaOH solution 12 Molarity NaOH solution
65
70
75
80
85
90
M1 M2 M3 M4 M5 M6 M7 M8 M9 M10 M11 M12% C
om
pre
ssiv
e st
rength
dev
elo
pm
ent
at 3
-day
age
Mortar ID
14 Molarity NaOH solution 12 Molarity NaOH solution

58
4.3.7 Effect of fineness modulus on compressive strength
Figure 4.12 shows the variation of fineness modulus due to the different mix proportion
of N-sand, M-sand and QD. The fineness modulus for the composite mix proportion was
calculated by arithmetic proportion (Alexander and Mindess, 2005). For example, mortar
ID M11 represents N-sand: M-sand: QD = 25: 50: 25.
Fineness modulus (FM) for M11 = FMN-sand x 0.25 + FMM-sand x 0.50 + FMQD x 0.25 =
2.72
Hence, the fineness moduli of the various combination of the fine aggregates using N-
sand, M-sand and QD vary from 2.66 to 2.88 The values of fineness modulus of the
combined fine aggregates in this investigation fall in the medium range based on the
classification as proposed by Alexander and Mindess (2005) which is shown in Figure
4.7. It is to be noted that the binder content is kept constant for all the mixes; The mixes
with more fine particles need large volume of paste as the surface area is more. The
variation in the compressive strength of the mortars between 20.36 and 26.03 MPa could
be attributed to the paste volume and the fineness or coarseness of the fine aggregates.
Figure 4.12: Effect of fineness modulus of composite fine aggregates in development of
compressive strength
10
14
18
22
26
30
2.65
2.75
2.85
2.95
3.05
3.15
M1
M2
M3
M4
M5
M6
M7
M8
M9
M1
M1
0
M1
1
M1
2 Co
mp
ress
ive
stre
ngth
(M
Pa)
Fin
enes
s m
od
ulu
s
Mortar ID
Fineness modulus 28-day compressive strength

59
Table 4.7: Categorization of fineness of sand, using fineness modulus (Alexander and
Mindess, 2005)
Fineness modulus Sand fineness
<1.0 Very fine
1.0 – 2.0 Fine
2.0 – 2.9 Medium
2.9 – 3.5 Coarse
>3.5 Very coarse
4.3.8 Effect of N-sand, M-Sand and QD on development of compressive strength
The compressive strengths at different ages along with their respective percentages with
age are shown in Figure 4.13 and Figure 4.14. The mortar using 100% N-sand shows
better compressive strength performance than the mix with M-sand. The replacement of
N-sand by M-sand reduces compressive strength.
Figure 4.13: Compressive strength (MPa) vs age (days)
14
19
24
3
10
17
24
Co
mp
ress
ive
stre
ngth
(M
Pa)
Age (Days)
M1 M2 M3 M4 M5 M6
M7 M8 M9 M10 M11 M12

60
Figure 4.14: % Compressive strength development vs age (days)
The N-sand contains rounder and smoother particle than M-sand (Quiroga and Fowler,
2004). Hudson (1999a) reported that rough aggregates have a propensity for increasing
water demand for a given workability. Thus, for a given water content, the N-sand is more
workable than M-sand (Quiroga and Fowler, 2004). The rough surfaces of M-sand
particles demand more water than N-sand. In this study, the water and binder content was
kept constant. This could lead to absorption of water from the alkali-solution and this
might have affected the reactivity of binder in alkali solution. Thus, the reduction of the
compressive strength due to the replacement of N-sand by M-sand could be attributed to
absorption of water by the rough surfaces of M-sand.
The 28-day compressive strengths of about 28 MPa and 25 MPa were obtained for
specimens with 100% N-sand and 100% M-sand, respectively. The reduction of strength
between these two mixes was found only 3 MPa and similar finding on the strength
difference for M-sand and N-sand was reported by Dumitru et al. (1999).
65
75
85
95
0 2 4 6 8
10
12
14
% C
om
pre
ssiv
e st
rength
dev
elo
pm
ent
Age (Days)
M1 M2 M3 M4 M5 M6
M7 M8 M9 M10 M11 M12

61
The mortar using 100% QD shows better performance than the mix with M-sand in Figure
4.13 and Figure 4.14. The presence of high percentage of QD in composite fine aggregate
mixture of M-sand & QD reduces the strength (M5, M6). The particle shape and texture
may influence the strength reduction.
Figure 4.15: N-sand/ M-sand/ QD interlocking in geopolymer mortar (Magnification
rate = 5)
The QD has sharp angular particles as shown in Figure 4.3. According to Quiroga and
Fowler (2004) and Kaplan (1960), the angularity of aggregates has a positive effect on
the compressive strength. Further, the angularity of the aggregates enhances the bond
between the matrix and the aggregates due to its surface texture. Galloway (1994) also
reported the effect of surface texture on the strength significantly as rough surface
Angular shape
QD
M-sand M-sand
QD N-sand

62
increase bonding between the aggregate surface and the paste. Figure 4.15 shows the
interlocking of N-sand/ M-sand/ QD in geopolymer mortar.
The combination of M-sand and QD might tend to create voids due to the combination of
semi-rounded particles and the sharp angular particles. Further, the increase in voids
demands more water for a given workability and hence decreases the strength (Quiroga
and Fowler, 2004). Since the water-binder ratio was maintained constant for all the mixes,
the composite mixes that contained both M-sand and QD might have absorbed more water
that could influence the geopolymerization process. This might reduce the strength for
mixes with high percentage of QD in the mixes that contained both the M-sand and QD.
Nevertheless, the strength reduction between the mixes with 100% QD and 100% M-sand
was negligible and similar finding was reported by Dumitru et al. (1999).
Figure 4.13 and Figure 4.14 shows that there is not much significant difference in the
compressive strength due to the replacement of N-sand by QD either partially or fully.
The mixes with N-sand developed better strength due to its well-graded and round
particles. As mentioned the angularity of QD particles enhances the compressive strength
and for a given workability, the rough surface increases water demand (Quiroga and
Fowler, 2004).
The 28-day compressive strength of mixes with N-sand and QD were 28 MPa and 26
MPa, respectively. Again, the strength difference between these two mixes was about 2
MPa and negligible. Raman et al. (2011) found the similar effect of QD in rice husk ash
based concrete and reported that inclusion of QD as partial replacement for sand slightly
decreases the compressive strength of concrete. Dumitru et al. (1999) reported that the
replacement of N-sand by QD produces comparable strength and hence QD is viable
replacement to conventional N-sand for sustainable material.

63
4.3.9 Comparison of M-sand and QD in geopolymer mortar with published data
Dumitru et al. (1999) investigated the effect of river sand, manufactured quarry fines and
unprocessed quarry fines, that are comparable to the research materials N-sand, M-sand
and QD, respectively used in this research work.
Table 4.8: Development of compressive strength using N-sand, M-sand and QD
Age 3-day 7-day 14-day 28-day
Fine
aggregate
NC GM NC GM NC GM NC GM
N-sand
(100%)
22 21 28 23 33 27 37 28
M-Sand
(100%)
15 19 23 21 26 24 32 25
QD (100%) 19 21 28 23 32 25 37 26
NC results from [Dumitru et al. (1999)] experiment on OPC concrete
GM results from this experiment on geopolymer mortar
The development of 3-, 7-, 14- and 28-day compressive strength is quite similar to the
outcome from this investigation; as seen from the Table 4.8. The effect of QD, M-sand
and N-sand in both normal concrete (NC) and geopolymer mortar (GM) between the 3-
and 14-day shows similar trends, albeit these are different kinds of concretes. As known,
the geopolymer concrete develops high early strength due to geopolymerization and
hence the strength difference between the 14- and 28-day strength was not much different,
unlike normal concrete where the strength development continues beyond 14-day.
4.4 Mix Design 2: POFA-FA-MK and POFA-MK based geopolymer concrete
After developing appropriate mortar, the next stage of work aimed at developing
structural grade geopolymer concrete using OPS as coarse aggregate; in addition, the use
of POFA-FA-MK and POFA-MK as combined binders was investigated and reported in
the subsequent sections. Since M-sand was found to produce equivalent strength as that
of N-sand in the mortar, it was used to replace conventional N-sand in the development

64
of geopolymer concrete. The binder combination that produced structural grade concrete
was used for further investigation.
4.4.1 Properties of fresh concrete
The fresh density and the slump value are shown in Table 4.9. The changes of fresh
density in this experiment were due to the specific gravity of binding material since all
other proportions were kept constant. The specific gravity of POFA, FA and MK were
measured as 2.2, 2.34 and 2.5, respectively. The specific gravity of the mix proportions
were calculated by arithmetic proportion as shown in Table 4.9. The fresh density of
concrete increases with the replacement of POFA/ FA by MK since the specific gravity
of MK is higher than POFA and MK. The arithmetic calculation for the composite binding
material also reflects the increment of specific gravity due to the replacement of POFA/
FA by MK.
Table 4.9: Fresh density and slump value of fresh concrete
Properties
of fresh
concrete
P1
0-F
85
-M05
P1
0-F
80
-M10
P1
0-F
75
-M15
P1
0-F
70
-M20
P1
0-F
65
-M25
P9
0-M
10
P8
0-M
20
P7
0-M
30
P6
0-M
40
Fresh
density,
kg/m3
1856 1857 1859 1860 1862 1833 1839 1845 1851
Slump,
mm
120 75 50 42 30 0 0 0 0
Specific
gravity of
binders
2.33 2.34 2.35 2.36 2.37 2.23 2.26 2.29 2.32
The slump is an important factor of measuring the workability of fresh concrete.
However, no standard or limit has yet been established for geopolymer concrete.
Generally, water or superplasticizer is added in normal Portland cement concrete to
achieve good workability. Nevertheless, usage of excessive water decreases the strength
of geopolymer concrete. Excessive quantity of water is not recommended for proper

65
geopolymerization (Davidovits, 1991, 1994b). Therefore, minimum required water was
used in consistent rate for all mix proportions; however, this resulted in zero slump for
POFA-MK based concrete. Extended vibration (10 second/ layer casting) was provided
during the casting of specimens into the moulds to overcome low or zero workability.
Segregation was not noticed for the extended vibration. On the other hand, the mixes with
POFA-FA-MK based binding materials produced higher slump values of 30-120 mm. It
is well established that FA with spherical particles produce high workability in concrete;
however, the replacement of FA with MK reduces the slump values due to viscous mixes.
As the additional water was kept constant for all the mixes, the effect of adding more MK
for the replacement of FA has negative effect on the workability.
4.4.2 Compressive strength
The variation of compressive strength of oil palm shell geopolymer concrete (OPSGC)
consisting of different proportion of pozzolanic binding materials such as POFA-FA-MK
and POFA-MK is shown in Figure 4.16 and Figure 4.17. Table 4.12 also shows the
development of compressive strength at the ages of 3-, 7-, 14-, and 28-day. The ratios of
aggregate/ binder, water/ binder, alkaline activator/ binder and the curing condition were
kept constant for all OPSGC. The physical and chemical properties of materials as well
as activators and the curing condition have significant effect on the development of
compressive strength as reported by many researchers (Shafigh et al., 2013a;
Abdulkareem et al., 2014; Bagheri and Nazari, 2014; Liu et al., 2014; Yew et al., 2014;
Yusuf et al., 2014).
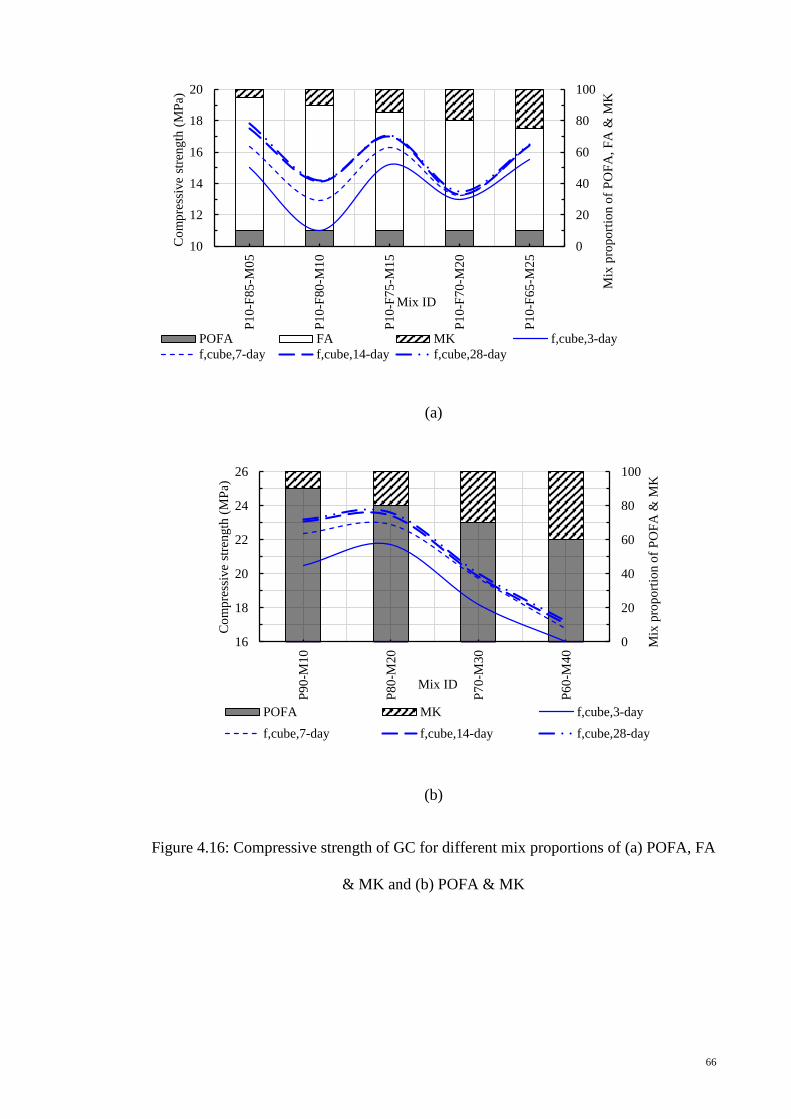
66
(a)
(b)
Figure 4.16: Compressive strength of GC for different mix proportions of (a) POFA, FA
& MK and (b) POFA & MK
0
20
40
60
80
100
10
12
14
16
18
20
P1
0-F
85
-M0
5
P1
0-F
80
-M1
0
P1
0-F
75
-M1
5
P1
0-F
70
-M2
0
P1
0-F
65
-M2
5
Mix
pro
po
rtio
n o
f P
OF
A,
FA
& M
K
Co
mp
ress
ive
stre
ngth
(M
Pa)
Mix ID
POFA FA MK f,cube,3-day
f,cube,7-day f,cube,14-day f,cube,28-day
0
20
40
60
80
100
16
18
20
22
24
26
P9
0-M
10
P8
0-M
20
P7
0-M
30
P6
0-M
40
Mix
pro
po
rtio
n o
f P
OF
A &
MK
Co
mp
ress
ive
stre
ngth
(M
Pa)
Mix ID
POFA MK f,cube,3-day
f,cube,7-day f,cube,14-day f,cube,28-day

67
Figure 4.17: Compressive strength at age of 3-, 7-, 14- and 28-day
The compressive strength varies (Figure 4.16) between 11 and 18 MPa for the mixes with
FA, MK and POFA; it should be noted that in these mixes, the FA was replaced with MK
from 5-25% keeping POFA constant at 10%. Among these mix proportions of POFA-
FA-MK, the maximum 28-day compressive strength of about 18 MPa was obtained for
the mix with 5% of MK and 85% of FA. There was no consistent variation in the
compressive strength due to the gradual replacement of FA. A decrease of compressive
strength (14 MPa, 28-day) was found for the replacement of FA with MK; however, an
enhancement in the compressive strength (16 MPa, 28-day) was found for 15% FA
replacement with MK. The inconsistent strength development might be due to the
variation of the combination of chemical compounds of binding materials. The binder
combination of FA-MK-POFA did not produce the desired compressive strength due to
the required silica-alumina proportion.
The change of the binder contents by omitting the FA and replacing it with POFA
produced the highest strength. The highest 28-day compressive strength of about 24 MPa
was obtained for the mix with the combination of POFA and MK; this mix consisted of
90% of POFA and 10% of MK. POFA, which has a major compound of silica reacts with
0
4
8
12
16
20
24
28
0 7
14
21
28
Co
mp
ress
ive
stre
ngth
(M
Pa)
Age of concrete (days)
P10-F85-M05 P10-F80-M10 P10-F75-M15
P10-F70-M20 P10-F65-M25 P90-M10
P80-M20 P70-M30 P60-M40

68
MK due to the presence of alumina compounds in MK. The reactivity also depends on
the curing condition, alkaline solution and additional water. The curing condition,
alkaline solution and water content were kept constant for all the mixes. The effects of
these factors as well as the variables such as POFA and MK on the development of
compressive strength are described in the following sub-clauses.
Selection of curing temperature
The mix proportions of the POFA-FA-MK and POFA-MK based binding materials as
investigated in this research work are a combination of low-calcium based geopolymer
solid materials (Table 4.13) according to the definition of ASTM C618-12a (2012). The
heat curing was adopted due to proper geopolymeric reaction as recommended by Rangan
(2008). Both curing time and temperature have substantial effect on the development of
strength (Hardjito and Rangan, 2005). Bagheri and Nazari (2014) specified the curing
temperature as the most effective factor on the compressive strength and the proportion
of pozzolans (i.e. the quantity of the reactive granulated blast furnace slag with fly ash),
the concentration of sodium hydroxide (NaOH) and oven curing time as other relevant
parameters that affect the compressive strength albeit with less significance.
The curing temperature of 40 – 750C is normally required to obtain a reasonable strength
development in fly ash-based i.e. alumino-silicate based geopolymer concrete (Bakharev,
2006; Pangdaeng et al., 2013). The higher curing temperature may enhance compressive
strength of conventional geopolymer concrete (Hardjito and Rangan, 2005); on the
contrary, light-weight-aggregate-geopolymer-concrete (LWAGC) loses the compressive
strength at a very low rate with increasing elevated temperature after 700C (Abdulkareem
et al., 2014).

69
Table 4.10: Effect of heat curing temperature and time on compressive strength
Research
Work
Mix proportion Binding
Material
AA/binder SS/SH(M) Heat curing
condition
f'c, MPa
(age-day)
1 1:1.16:2.72
(Binder:Sand:Granite)
FA 0.35 2.5 (14) 48 hours
(300C)
49
(7)
24 hours
(600C)
68
(28)
2 1:3:0
(Binder:Sand)
MK 0.83 - 4 hours
(600C)
50
(7)
3 1:2.41:1.42 FA 0.60 1 (12) 24 hours
(700C)
18.75
(28)
4 1:1.125:0.375
(Binder:M-sand:OPS)
POFA-FA-MK,
POFA-MK
0.40 2.5 (14) 48 hours
(650C)
12.25 – 23.60
(28)
Legend:
1 Hardjito and Rangan (2005) 3 Abdulkareem et al. (2014)
2 Rovnaník (2010) 4 This research work
AA/binder Alkaline activator/ binder
SS/SH(M) liquid Sodium Silicate/ Sodium hydroxide solution (molarity of NaOH solution)
FA = Fly ash M-sand= Manufactured sand
MK = Metakaoline
POFA = Palm oil fuel ash OPS = Oil palm shell
(Yusuf et al., 2014)Generally, the development of compressive strength takes place up to
48 hours with a high temperature curing condition (Hardjito et al., 2005). Thus based on
the recommendation from previous research work for light-weight concrete, a
temperature of 650C for a period of 48 hours was selected. After the removal of the
specimens from the curing chamber, these were kept in laboratory condition of 280C and
relative humidity of 79%.
Effect of alkaline solution and water content on the development of compressive
strength
The combination of sodium hydroxide (NaOH) and sodium silicate (Na2SiO3) or
potassium hydroxide and potassium silicate is used for geopolymer concrete, mostly
(Palomo et al., 1999; Barbosa et al., 2000; Rangan, 2008; Memon et al., 2013). Previous
researchers found liquid Na2SiO3 in combination with NaOH as an effective activator due
to the reactivity and the cost of the alkaline solutions (Palomo et al., 1999; Xu and Van
Deventer, 2000; Fernández-Jiménez et al., 2005). Hardjito et al. (2005) observed an
insignificant effect on the compressive strength due to the increase of Na2O/SiO2 ratio

70
and recommended higher concentration (in terms of molar) of sodium hydroxide (NaOH)
solution that could enhance the compressive strength. Table 4.11 shows a comparison of
compressive strength with the previous research works due to the effect of alkaline
solution and water content.
Table 4.11: Compressive strength of geopolymer concrete using alkaline activator
Research
works
SS/SH
(SH)
AA/B M2O/SiO2
(M2O/Al2O3)
SiO2/ Al2O3
(H2O/M2O)
f'c, MPa
(Specimen)
Remarks
1 - 0.25 &
0.30
1.23 - 52.7 & 62.6
Concrete with
NWA
650C curing for 24h
2 1.5
(15)
0.66 0.26
(1.08)
4.14
(10.40)
32
(mortar)
Sand/binder=2
650C curing for 48hrs
3 2.5
(14)
0.4 0.06 – 0.13
(0.13 – 1.19)
2.08 – 9.26
(4.12 –
9.89)
12.25 – 23.60
(OPSGC)
OPS/binder=0.375
M-sand/binder=1.125
650C curing for 48hrs
Legend:
1 Palomo et al. (1999)
2 Chindaprasirt et al. (2009)
3 Present research work SS/SH liquid Na2SiO3/NaOH solution; SH NaOH molarity
AA/B - Alkaline activator/binder; f’c Compressive strength
M2O - Na2O or K2O or combination of Na2O and K2O
In this work, the ratios of liquid Na2SiO3/NaOH solution (14M) and alkaline solution/
binder were kept constant as 2.5 and 0.4; the compressive strength of the mixes was found
in range of 12 to 24 MPa. Palomo et al. (1999) obtained the highest compressive strength
using the ratio of alkaline activator to FA of 0.25 to 0.30. The higher compressive strength
of their work could be attributed to NWA used in their work compared to OPS that has
less stiffness. Xu and Van Deventer (2000) achieved the maximum compressive strength
of 19 MPa by a geopolymeric reaction with alkaline activator to alumino-silicate powder
ratio of 0.33 by mass. Bakharev (2005) prepared low-calcium (Class F) FA-based
geopolymers with a proportion of 0.3 of activator to FA and activated FA using either
water glass (sodium silicate) or with NaOH solution. Hardjito and Rangan (2005) used
two different concentration of NaOH solution and prepared FA-based geopolymer
applying activator/ FA ratio as 0.35. Rangan (2008) recommended the activator/ FA mass
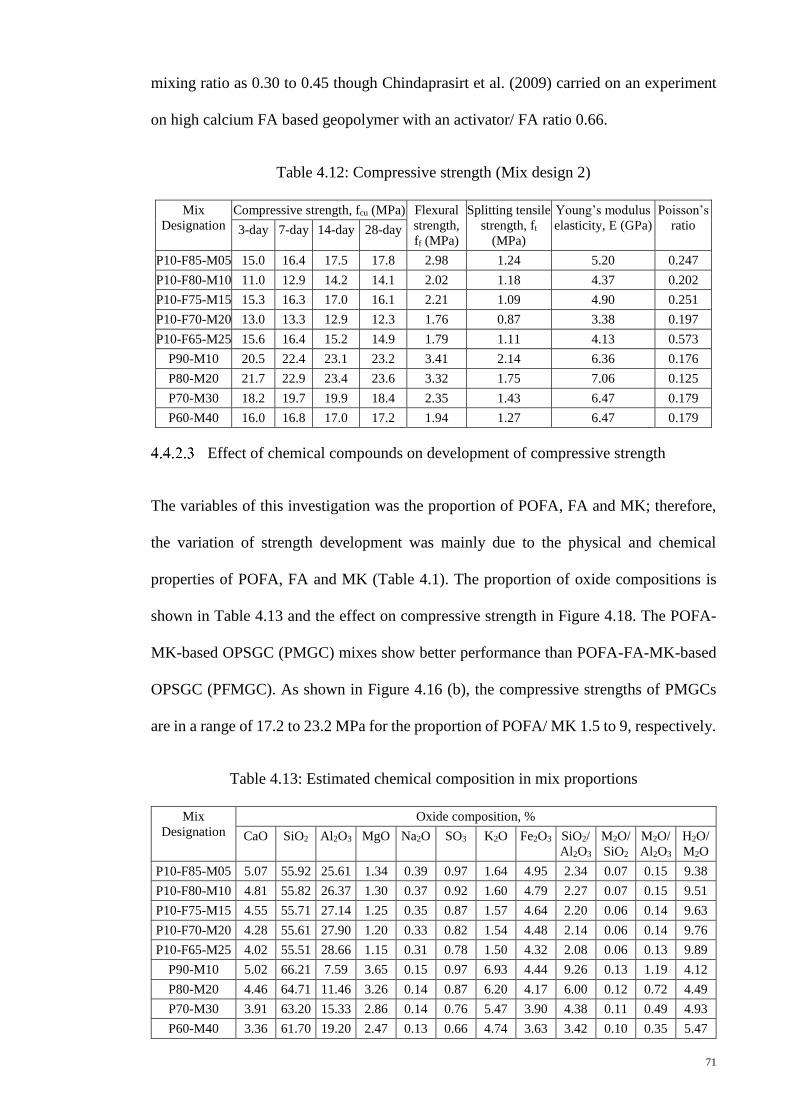
71
mixing ratio as 0.30 to 0.45 though Chindaprasirt et al. (2009) carried on an experiment
on high calcium FA based geopolymer with an activator/ FA ratio 0.66.
Table 4.12: Compressive strength (Mix design 2)
Mix
Designation
Compressive strength, fcu (MPa) Flexural
strength,
ff (MPa)
Splitting tensile
strength, ft
(MPa)
Young’s modulus
elasticity, E (GPa)
Poisson’s
ratio 3-day 7-day 14-day 28-day
P10-F85-M05 15.0 16.4 17.5 17.8 2.98 1.24 5.20 0.247
P10-F80-M10 11.0 12.9 14.2 14.1 2.02 1.18 4.37 0.202
P10-F75-M15 15.3 16.3 17.0 16.1 2.21 1.09 4.90 0.251
P10-F70-M20 13.0 13.3 12.9 12.3 1.76 0.87 3.38 0.197
P10-F65-M25 15.6 16.4 15.2 14.9 1.79 1.11 4.13 0.573
P90-M10 20.5 22.4 23.1 23.2 3.41 2.14 6.36 0.176
P80-M20 21.7 22.9 23.4 23.6 3.32 1.75 7.06 0.125
P70-M30 18.2 19.7 19.9 18.4 2.35 1.43 6.47 0.179
P60-M40 16.0 16.8 17.0 17.2 1.94 1.27 6.47 0.179
Effect of chemical compounds on development of compressive strength
The variables of this investigation was the proportion of POFA, FA and MK; therefore,
the variation of strength development was mainly due to the physical and chemical
properties of POFA, FA and MK (Table 4.1). The proportion of oxide compositions is
shown in Table 4.13 and the effect on compressive strength in Figure 4.18. The POFA-
MK-based OPSGC (PMGC) mixes show better performance than POFA-FA-MK-based
OPSGC (PFMGC). As shown in Figure 4.16 (b), the compressive strengths of PMGCs
are in a range of 17.2 to 23.2 MPa for the proportion of POFA/ MK 1.5 to 9, respectively.
Table 4.13: Estimated chemical composition in mix proportions
Mix
Designation
Oxide composition, %
CaO SiO2 Al2O3 MgO Na2O SO3 K2O Fe2O3 SiO2/
Al2O3
M2O/
SiO2
M2O/
Al2O3
H2O/
M2O
P10-F85-M05 5.07 55.92 25.61 1.34 0.39 0.97 1.64 4.95 2.34 0.07 0.15 9.38
P10-F80-M10 4.81 55.82 26.37 1.30 0.37 0.92 1.60 4.79 2.27 0.07 0.15 9.51
P10-F75-M15 4.55 55.71 27.14 1.25 0.35 0.87 1.57 4.64 2.20 0.06 0.14 9.63
P10-F70-M20 4.28 55.61 27.90 1.20 0.33 0.82 1.54 4.48 2.14 0.06 0.14 9.76
P10-F65-M25 4.02 55.51 28.66 1.15 0.31 0.78 1.50 4.32 2.08 0.06 0.13 9.89
P90-M10 5.02 66.21 7.59 3.65 0.15 0.97 6.93 4.44 9.26 0.13 1.19 4.12
P80-M20 4.46 64.71 11.46 3.26 0.14 0.87 6.20 4.17 6.00 0.12 0.72 4.49
P70-M30 3.91 63.20 15.33 2.86 0.14 0.76 5.47 3.90 4.38 0.11 0.49 4.93
P60-M40 3.36 61.70 19.20 2.47 0.13 0.66 4.74 3.63 3.42 0.10 0.35 5.47
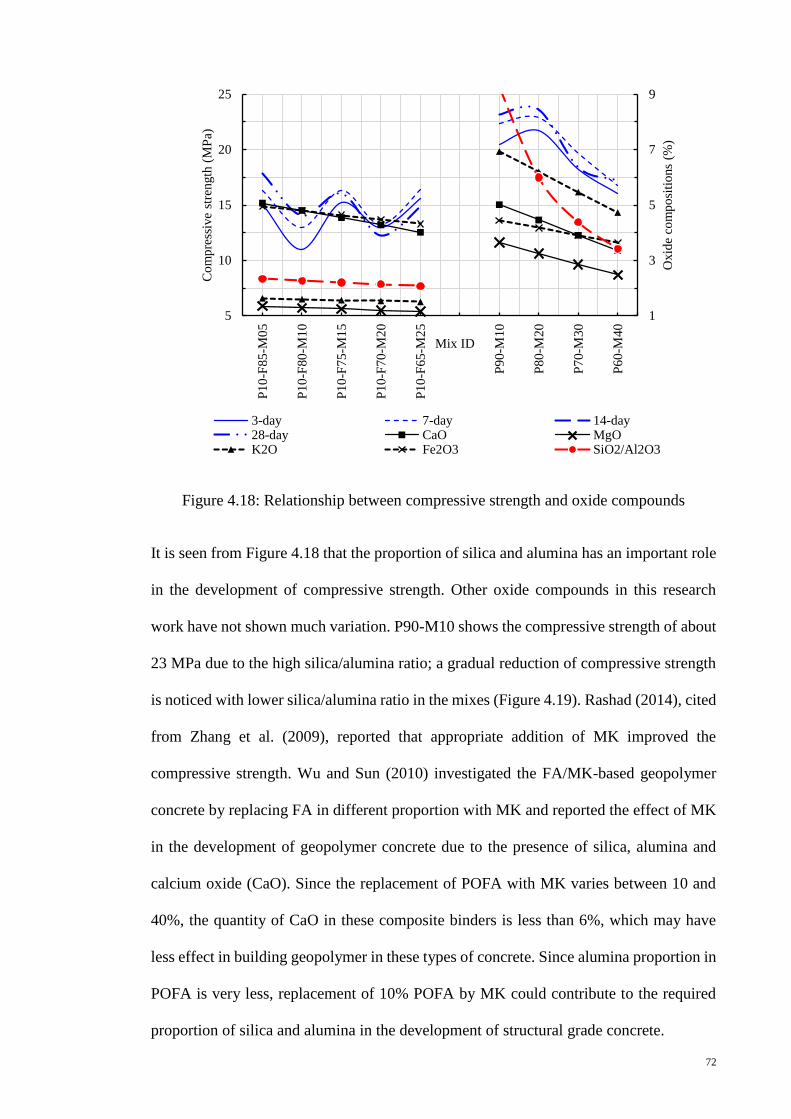
72
Figure 4.18: Relationship between compressive strength and oxide compounds
It is seen from Figure 4.18 that the proportion of silica and alumina has an important role
in the development of compressive strength. Other oxide compounds in this research
work have not shown much variation. P90-M10 shows the compressive strength of about
23 MPa due to the high silica/alumina ratio; a gradual reduction of compressive strength
is noticed with lower silica/alumina ratio in the mixes (Figure 4.19). Rashad (2014), cited
from Zhang et al. (2009), reported that appropriate addition of MK improved the
compressive strength. Wu and Sun (2010) investigated the FA/MK-based geopolymer
concrete by replacing FA in different proportion with MK and reported the effect of MK
in the development of geopolymer concrete due to the presence of silica, alumina and
calcium oxide (CaO). Since the replacement of POFA with MK varies between 10 and
40%, the quantity of CaO in these composite binders is less than 6%, which may have
less effect in building geopolymer in these types of concrete. Since alumina proportion in
POFA is very less, replacement of 10% POFA by MK could contribute to the required
proportion of silica and alumina in the development of structural grade concrete.
1
3
5
7
9
5
10
15
20
25
P1
0-F
85
-M0
5
P1
0-F
80
-M1
0
P1
0-F
75
-M1
5
P1
0-F
70
-M2
0
P1
0-F
65
-M2
5
P9
0-M
10
P8
0-M
20
P7
0-M
30
P6
0-M
40
Oxid
e co
mp
osi
tio
ns
(%)
Co
mp
ress
ive
stre
ngth
(M
Pa)
Mix ID
3-day 7-day 14-day28-day CaO MgOK2O Fe2O3 SiO2/Al2O3

73
4.4.3 Flexural and indirect tensile strengths
Figure 4.20 shows the relationship among compressive strength, indirect tensile strength,
flexure strength and silica/ alumina ratio (S/A). This proportion may be applicable for
silica and alumina based geopolymer concrete. The reason of the variation of compressive
strength is explained in the sub-clause 4.4.2 . The relationship of flexural and indirect
tensile strength with S/A ratio is graphically represented in Figure 4.20. It should be noted
that the only variable in this experimental analysis is the proportion of binding materials
as well as S/A ratio. Table 4.13 shows the estimated chemical composition computed
from the raw material chemical analysis. Hence, the relationships of compressive, indirect
tensile and flexure strength with S/A ratio as listed in Figure 4.20 could be appropriate
only for the S/A variable.
Table 4.13 shows that there is a very slight difference in the oxide composition of POFA-
FA-MK based binding materials and it has insignificant effect on the results of indirect
tensile strength. On the other hand, the S/A ratio for the mix P90-M10 as shown in Table
4.12 of about 9.26 has significant effect on both the flexural and indirect tensile strengths
(Figure 4.20). Further, the achievement of indirect tensile strength between 1.27 and 2.14
MPa for the S/A ratio of 3.42 to 9.26 (Table 4.13) could be attributed to the higher S/A
ratio compared to the PFMGC mixes.
The structural grade concrete mix, P90-M10 with a cube compressive strength of 23 MPa
mix also fulfills the minimum requirement of 2MPa for splitting tensile strength. The
failure mode of the specimens as shown in Figure 4.19 shows bond failure between the
OPS and the matrix.

74
Figure 4.19: Bond failure of OPSGC
Figure 4.20: Relationship between SiO2/Al2O3 and mechanical properties (f’c, f’t, f’f)
f'c, 3-day = -0.2778(S/A)2 + 4.0253(S/A) + 6.7642
R² = 0.8006f'c, 7-day = -0.2697(S/A)2 + 4.0527(S/A) + 7.7299
R² = 0.8456f'c, 14-day = -0.2687(S/A)2 + 4.114(S/A) + 7.8497
R² = 0.8529
f'c, 28-day = -0.2469(S/A)2 + 3.956(S/A) + 7.7334
R² = 0.8338
f't = -0.005(S/A)2 + 0.2116(S/A) + 0.6782
R² = 0.9408
f'f = -0.0098(S/A)2 + 0.317(S/A) + 1.4635
R² = 0.6015
1
2
3
4
5
10
15
20
25
2 3 4 5 6 7 8 9
Ind
irec
t te
nsi
le,
f't&
flex
ure
str
ength
, f'
f(M
Pa)
Co
mp
ress
ive
stre
ngth
, f'
c(M
Pa)
SiO2/Al2O3 ratio, S/A
3-day comp.
7-day comp.
14-day comp.
28-day comp.
Indirect tensile
strengthFlexure strength
Poly. (3-day comp.)
Poly. (7-day comp.)
Poly. (14-day
comp.)

75
Figure 4.21: Numerical relationship among fcube, ff and ft
The experimental correlation between the compressive, indirect tensile and flexure
strengths is shown in Figure 4.21. Ryu et al. (2013) recommended Eq. 4.1 for the
estimation of indirect tensile strength of fly ash based geopolymer normal weight
concrete.
𝑓𝑡 = 0.17(𝑓𝑐𝑦)3
4 Eq. 4.1
Short and Kinniburgh (1978) cited Eq. 4.2 for the lightweight aggregate concrete (LWC).
𝑓𝑡 = 𝐾𝑓𝑐𝑦
12⁄ Eq. 4.2
Where, K varies from 0.37 – 0.5, in average to consider 0.42.
Table 4.14 shows the comparison of experimental data with the Eq. 4.1 and Eq. 4.2. The
present research work falls in between the equations proposed by Ryu et al. (2013) and
Short and Kinniburgh (1978) due to the geopolymer paste and lightweight aggregate used.
However, the prediction of the splitting tensile strength by these two equations seems to
be in the range of the experimental value.
ft = 0.4145e0.0653f'c
R² = 0.8964
ff = 0.0033f'cube2 + 0.0236f'cube + 0.9248
R² = 0.753
0
1
2
3
4
0.8
1.15
1.5
1.85
2.2
12
14
16
18
20
22
24
Fle
xure
str
ength
, ff
(M
Pa)
Indir
ect
tensi
le s
tren
gth
, f t
(MP
a)
Compressive strength, f'cube
I. tensile strength Flexure strength
Expon. (I. tensile strength) Poly. (Flexure strength)

76
Table 4.14: Indirect tensile and flexural strength
Mix
Designation
Compressive
strength (MPa)
Indirect tensile strength (MPa) Flexural strength (MPa)
28-day
cube
strength
28-day
cylinder
strength
Experimental
data
(LWGC)
Eq. 4.1
(NWGC)
Eq. 4.2
(LWC)
Experimental
data
(LWGC)
Eq. 4.3
(NWC)
Eq. 4.4
(LWC)
P10-F85-M05 17.82 13.19 1.24 1.18 1.53 2.98 2.83 2.05
P10-F80-M10 14.05 10.40 1.18 0.98 1.35 2.02 2.51 1.75
P10-F75-M15 16.08 11.90 1.09 1.09 1.45 2.21 2.69 1.91
P10-F70-M20 12.25 9.07 0.87 0.89 1.26 1.76 2.35 1.59
P10-F65-M25 14.88 11.01 1.11 1.03 1.39 1.79 2.58 1.81
P90-M10 23.20 17.17 2.14 1.43 1.74 3.41 3.23 2.44
P80-M20 23.60 17.46 1.75 1.45 1.75 3.32 3.25 2.47
P70-M30 18.43 13.64 1.43 1.21 1.55 2.35 2.88 2.09
P60-M40 17.20 12.73 1.27 1.15 1.50 1.94 2.78 2.00
LWGC Lightweight geopolymer concrete
NWC Normal weight concrete
LWC Lightweight concrete
The flexural strength was also significantly affected by the S/A ratio like indirect tensile
strength. Short and Kinniburgh (1978) proposed Eq. 4.3 for the estimation of flexural
strength from the cube strength of NWC.
𝑓𝑡 = 0.67 𝑓𝑐𝑢
12⁄ Eq. 4.3
Alengaram et al. (2008) reported following Eq. 4.4 to determine the flexural strength of
OPS based lightweight concrete.
𝑓𝑓 = 0.3𝑓𝑐𝑢
23⁄ Eq. 4.4
The comparison of the experimental flexural strength with the proposed Eq. 4.3 and Eq.
4.4 are shown in Table 4.14.
It is noticed from Table 4.14 that the experimental data were found to in close range to
that of the predicted by these two equations, Eq. 4.1 and Eq. 4.2. The effect of both the
binding material and the OPS could be attributed to the flexural strength. Similar to the
indirect splitting strength, the mix with 90% of POFA and 10% of MK produced the
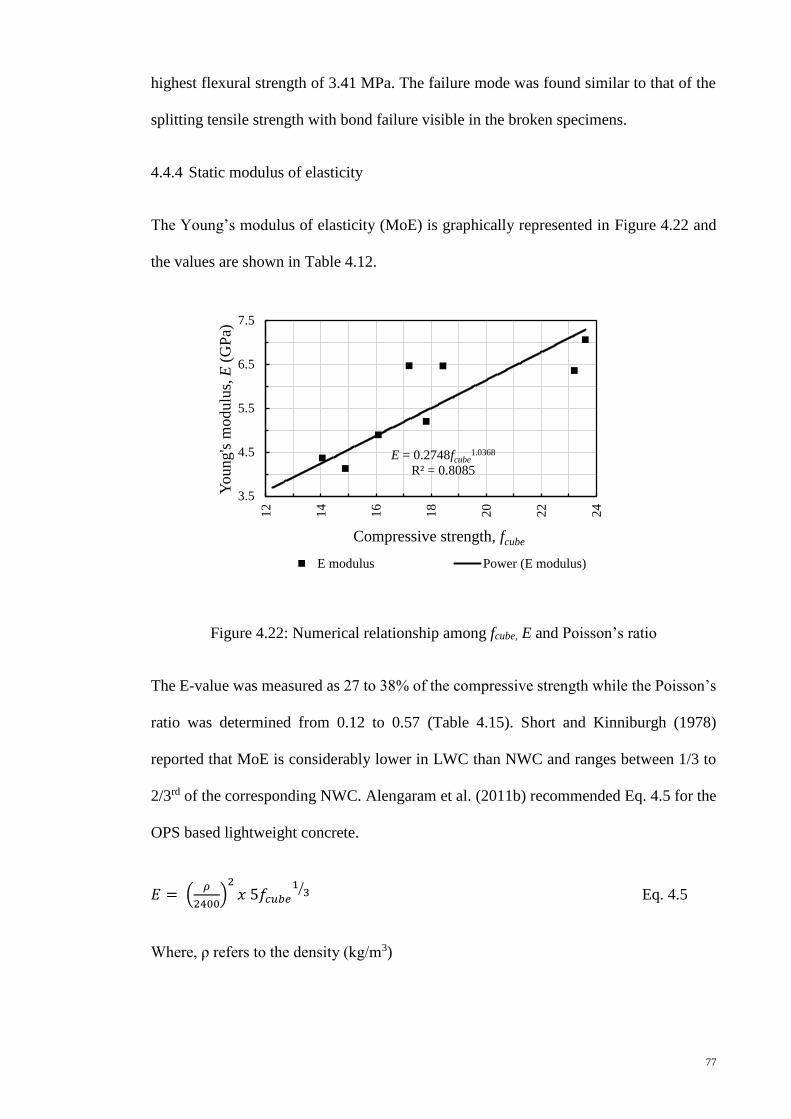
77
highest flexural strength of 3.41 MPa. The failure mode was found similar to that of the
splitting tensile strength with bond failure visible in the broken specimens.
4.4.4 Static modulus of elasticity
The Young’s modulus of elasticity (MoE) is graphically represented in Figure 4.22 and
the values are shown in Table 4.12.
Figure 4.22: Numerical relationship among fcube, E and Poisson’s ratio
The E-value was measured as 27 to 38% of the compressive strength while the Poisson’s
ratio was determined from 0.12 to 0.57 (Table 4.15). Short and Kinniburgh (1978)
reported that MoE is considerably lower in LWC than NWC and ranges between 1/3 to
2/3rd of the corresponding NWC. Alengaram et al. (2011b) recommended Eq. 4.5 for the
OPS based lightweight concrete.
𝐸 = (𝜌
2400)
2
𝑥 5𝑓𝑐𝑢𝑏𝑒
13⁄ Eq. 4.5
Where, ρ refers to the density (kg/m3)
E = 0.2748fcube1.0368
R² = 0.8085
3.5
4.5
5.5
6.5
7.5
12
14
16
18
20
22
24
You
ng's
mod
ulu
s, E
(GP
a)
Compressive strength, fcube
E modulus Power (E modulus)
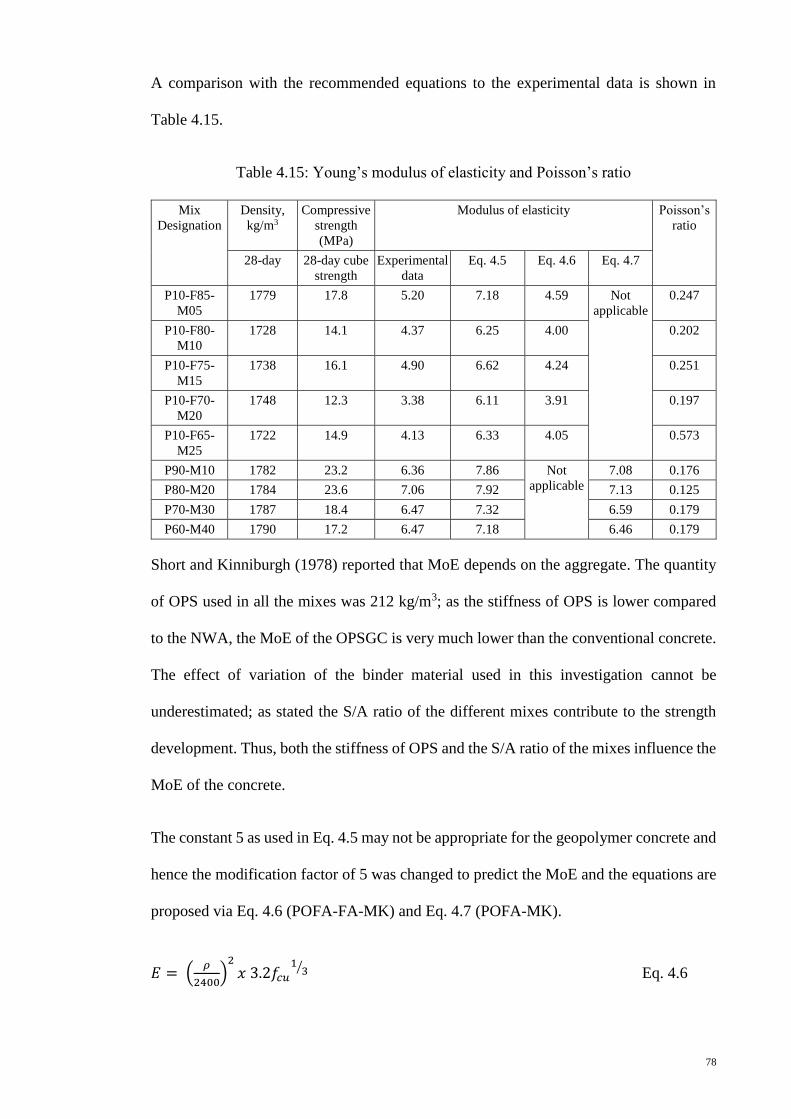
78
A comparison with the recommended equations to the experimental data is shown in
Table 4.15.
Table 4.15: Young’s modulus of elasticity and Poisson’s ratio
Mix
Designation
Density,
kg/m3
Compressive
strength
(MPa)
Modulus of elasticity Poisson’s
ratio
28-day 28-day cube
strength
Experimental
data
Eq. 4.5 Eq. 4.6 Eq. 4.7
P10-F85-
M05
1779 17.8 5.20 7.18 4.59 Not
applicable
0.247
P10-F80-
M10
1728 14.1 4.37 6.25 4.00 0.202
P10-F75-
M15
1738 16.1 4.90 6.62 4.24 0.251
P10-F70-
M20
1748 12.3 3.38 6.11 3.91 0.197
P10-F65-
M25
1722 14.9 4.13 6.33 4.05 0.573
P90-M10 1782 23.2 6.36 7.86 Not
applicable
7.08 0.176
P80-M20 1784 23.6 7.06 7.92 7.13 0.125
P70-M30 1787 18.4 6.47 7.32 6.59 0.179
P60-M40 1790 17.2 6.47 7.18 6.46 0.179
Short and Kinniburgh (1978) reported that MoE depends on the aggregate. The quantity
of OPS used in all the mixes was 212 kg/m3; as the stiffness of OPS is lower compared
to the NWA, the MoE of the OPSGC is very much lower than the conventional concrete.
The effect of variation of the binder material used in this investigation cannot be
underestimated; as stated the S/A ratio of the different mixes contribute to the strength
development. Thus, both the stiffness of OPS and the S/A ratio of the mixes influence the
MoE of the concrete.
The constant 5 as used in Eq. 4.5 may not be appropriate for the geopolymer concrete and
hence the modification factor of 5 was changed to predict the MoE and the equations are
proposed via Eq. 4.6 (POFA-FA-MK) and Eq. 4.7 (POFA-MK).
𝐸 = (𝜌
2400)
2
𝑥 3.2𝑓𝑐𝑢
13⁄ Eq. 4.6

79
𝐸 = (𝜌
2400)
2
𝑥 4.5𝑓𝑐𝑢
13⁄ Eq. 4.7
Where, ρ = density (kg/m3)
4.5 Mix design 3: Effect of steel fibres on mechanical properties
Based on the mix design for OPSGC in the previous section, P80-M20 shows the highest
compressive strength. Though P90-M10 achieved slightly lower compressive strength
than P80-M20, P90-M10 was chosen as the structural grade concrete for further
investigation in the effect of fibres in the OPSGC due to the usage of higher volume of
POFA and better performance in the development of tensile strength. Two different steel
fibres with aspect ratio (AR) of 65 and 80 were used and the mechanical properties were
investigated and reported. The second variable in this investigation is the use of different
volume of fibres (0.25%, 0.5% and 0.75%) of concrete volume. The results were
compared with geopolymer concrete prepared using normal weight aggregate (NWGC)
as mentioned in the methodology for 0.5% of steel fibre volume. Only one NWGC with
0.5% was chosen for comparison as the main focus was the effect of fibres in the OPSGC.
4.5.1 Properties of fresh concrete
The fresh concrete properties include slump and densities. The slump test was conducted
using conventional slump test used for normal concrete. The geopolymer concrete is
cohesive and sticky and slump test may not be suitable to test the workability. At present,
there are no standard tests available for measuring the workability of geopolymer
concrete. Thus using the slump test, the workability was measured and all mixes produced
zero slump; this could be due to the cohesive mix and low amount of additional water;
further, no superplasticizer was used in the mixes. The fresh densities of all mixes
including normal weight geopolymer concrete (NWGC) are shown in Table 4.16.
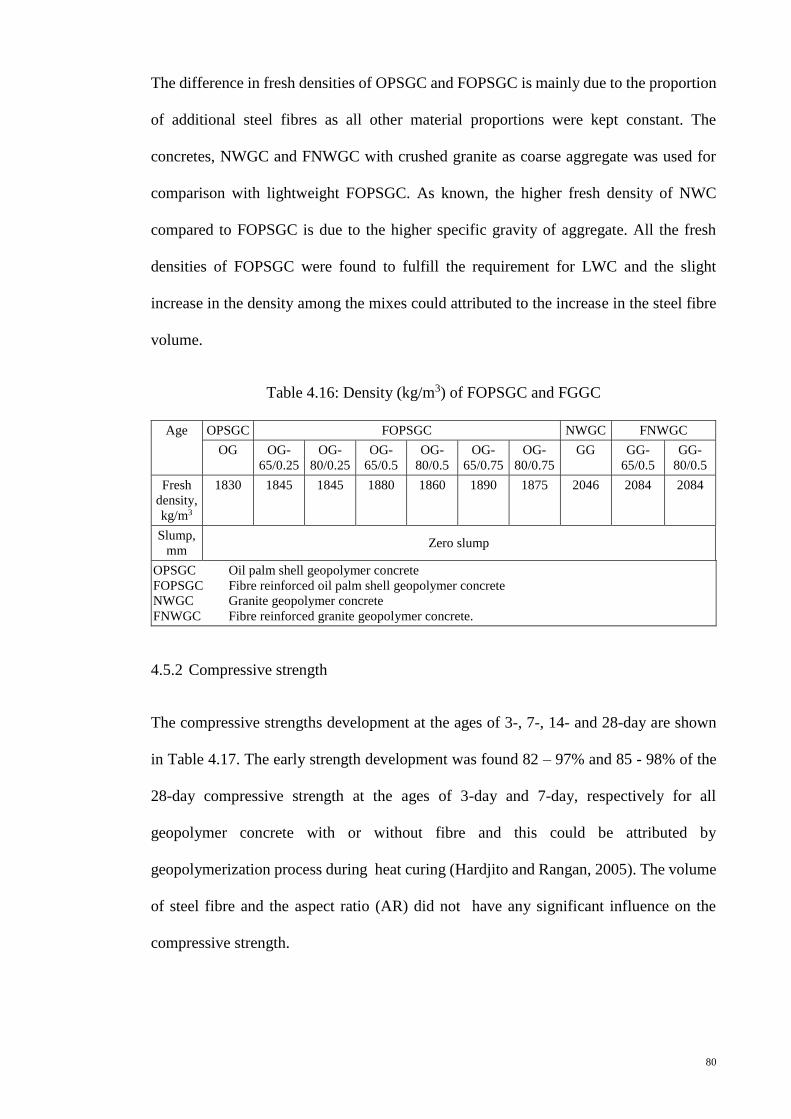
80
The difference in fresh densities of OPSGC and FOPSGC is mainly due to the proportion
of additional steel fibres as all other material proportions were kept constant. The
concretes, NWGC and FNWGC with crushed granite as coarse aggregate was used for
comparison with lightweight FOPSGC. As known, the higher fresh density of NWC
compared to FOPSGC is due to the higher specific gravity of aggregate. All the fresh
densities of FOPSGC were found to fulfill the requirement for LWC and the slight
increase in the density among the mixes could attributed to the increase in the steel fibre
volume.
Table 4.16: Density (kg/m3) of FOPSGC and FGGC
Age OPSGC FOPSGC NWGC FNWGC
OG OG-
65/0.25
OG-
80/0.25
OG-
65/0.5
OG-
80/0.5
OG-
65/0.75
OG-
80/0.75
GG GG-
65/0.5
GG-
80/0.5
Fresh
density,
kg/m3
1830 1845 1845 1880 1860 1890 1875 2046 2084 2084
Slump,
mm Zero slump
OPSGC Oil palm shell geopolymer concrete
FOPSGC Fibre reinforced oil palm shell geopolymer concrete
NWGC Granite geopolymer concrete
FNWGC Fibre reinforced granite geopolymer concrete.
4.5.2 Compressive strength
The compressive strengths development at the ages of 3-, 7-, 14- and 28-day are shown
in Table 4.17. The early strength development was found 82 – 97% and 85 - 98% of the
28-day compressive strength at the ages of 3-day and 7-day, respectively for all
geopolymer concrete with or without fibre and this could be attributed by
geopolymerization process during heat curing (Hardjito and Rangan, 2005). The volume
of steel fibre and the aspect ratio (AR) did not have any significant influence on the
compressive strength.

81
Table 4.17: Compressive strength
Mix Designation fcu (MPa)
3-day 7-day 14-day 28-day
OG 28.7 29.0 30.0 30.0
OG-65/0.25 28.3 30.6 29.4 31.4
OG-80/0.25 28.0 29.4 28.5 29.9
OG-65/0.5 26.8 29.0 30.2 30.9
OG-80/0.5 26.1 27.2 31.9 31.9
OG-65/0.75 30.5 30.9 26.8 31.3
OG-80/0.75 29.2 28.5 30.5 30.5
GG 26.4 27.0 27.6 27.6
GG-65/0.5 27.9 28.2 29.1 29.2
GG-80/0.5 30.3 30.5 31.1 31.7
The 28-day compressive strength of OPSGC varies between 30.9 to 31.35 MPa and 29.96
to 31.86 MPa for % volume of 0.25, 0.50 and 0.75 of steel fibre of AR65 and AR80,
respectively; the addition of 0.5% volume of steel fibre with AR80 shows the highest
compressive strength for both OPSGC and NWGC (Figure 4.23).
Figure 4.23: 28-day compressive strength
The slight difference of compressive strength was observed due to the different volume
of steel fibres and aspect ratio. An insignificant change in the compressive strength at 28-
day age was noticed for AR65; while AR80 shows a reduction of compressive strength
due to addition of more steel fibre for 0.75%. AR80 for 0.5% volume of steel fibre shows
27
28
29
30
31
32
OG
OG
-65/0
.25
OG
-80/0
.25
OG
-65/0
.5
OG
-80/0
.5
OG
-65/0
.75
OG
-80/0
.75
GG
GG
-65/0
.5
GG
-80/0
.5Co
mp
ress
ive
stre
ngth
at
28
day
, f c
u
(MP
a)
Mixture designation
82
better performance than AR65 with same % volume of steel fibre. Previous research
works (Gao et al., 1997; Neves and Almeida, 2005) also show that higher AR provides
better performance. Mo et al. (2014a) related the occurrence of micro-crack in the
lightweight aggregate during loading as an explanation of how the steel fibre help
improving compressive strength. It is known that lightweight aggregate has less aggregate
crushing value than normal weight aggregate. Therefore, crack may occur in the coarse
aggregate before extending into the binding material and bonds.
The steel fibre may take a role in this part to enhance the strength of the concrete by
controlling the propagation of crack in the lightweight aggregate. A sufficient good
bonding between steel fibre and binding material increases the compressive strength of
light weight concrete (Gao et al., 1997). The larger surface area of steel fibre may enhance
the possibility of good bonding and this is the reason why higher AR performs better than
lower AR. The previous research findings (Neves and Almeida, 2005) claims this reason
that higher AR control the crack propagation due to the stiffness of fibre.
The mix with AR of 80 was found to produce higher compressive strength between 3-6%
than the mix with AR of 65; however, for the FNWGC, the effect was slightly higher than
that of FOPSGC as the strength increase was found between 5-14% for similar addition
volume of steel fibre.
4.5.3 Flexural strength
The steel fibre has an important role in the development of flexural strength and its
significance is more than that in the development of compressive strength. The
experimental value of flexural strength for different volume proportion of steel fibre with
AR 65 and 80 is shown in Table 4.18. The increment of flexural strength due to the
addition of steel fibre was noticed in the range of 5 to 12%. The highest flexural strength

83
of 5.14 MPa was achieved for the OG-80/0.75. The pattern of loading tension and
compression may not comparable for the effect of steel fibres in concrete.
Table 4.18: Flexural strength
Mix Designation 28-day Compressive
strength (MPa)
Flexural strength
(MPa)
OG 30.0 4.33
OG-65/0.25 31.4 4.69
OG-80/0.25 29.9 4.65
OG-65/0.5 30.9 4.72
OG-80/0.5 31.9 4.80
OG-65/0.75 31.3 4.86
OG-80/0.75 30.5 5.14
GG 27.6 3.41
GG-65/0.5 29.2 3.61
GG-80/0.5 31.7 3.67
The effect of fibre volume had direct influence on the flexural strength (Figure 4.24). GG
shows the lowest flexural strength among all the mix proportions. OG performed better
flexural strength. The improvement of flexural strength due to the OPS is reported by
other research work also (Yap et al., 2013). Further, the flexural improvements of 8 to
12% and 7 to 18% were found for AR65 and AR80, respectively using 0.25, 0.5 and
0.75% of steel fibre. The gradient of the dotted line in Figure 4.24 shows higher than the
other one.
This reflects the more possibility of improvement of flexural strength using AR80 with
higher volume than that of AR65.

84
Figure 4.24: Development of flexural strength for different % volume of steel fibre
Other research works (Gao et al., 1997; Köksal et al., 2008) also support this finding.
Köksal et al. (2008) studied the reason of effectiveness of higher AR and concluded with
the point of length of steel fibre due to the higher capability of delaying crack propagation
in concrete.
4.5.4 Indirect tensile strength (Splitting tensile test)
The splitting tensile test, which is known as the indirect tensile strength test, provides
information on the maximum tensile load may induce on the concrete member before
cracking. The experimental data in this study shows the effect of volume and aspect ratio
steel fibre in the development of indirect tensile strength (ITS).
The ITS of the specimens with different volume of steel fibre of AR 65 and 80 are shown
in Table 4.19. The 28-day compressive strength of OG is slightly higher than GG and in
terms of flexural strength, the performance of OG and GG shows inversely. However, the
addition of same volume of steel fibre changes the scenario, i.e. the addition of steel fibre
in OPSGC shows better performance than NWGC.
ff,65 = 0.34(%S) + 4.5867
R² = 0.8775
ff,80 = 0.98(%S) + 4.3733
R² = 0.9523
4.5
4.6
4.7
4.8
4.9
5
5.1
5.2
0.25 0.35 0.45 0.55 0.65 0.75
Fle
xura
l st
rength
, M
Pa
% volume steel fibre, %S
AR65 AR80 Linear (AR65) Linear (AR80)

85
Table 4.19: Indirect tensile strength (Mix design 3)
Mix Designation 28-day Compressive
strength (MPa)
Indirect tensile
strength (MPa)
OG 30.0 2.22
OG-65/0.25 31.4 2.81
OG-80/0.25 29.9 2.55
OG-65/0.5 30.9 2.88
OG-80/0.5 31.9 2.89
OG-65/0.75 31.3 2.93
OG-80/0.75 30.5 3.07
GG 27.6 2.31
GG-65/0.5 29.2 2.62
GG-80/0.5 31.7 2.60
The development of ITS is similar to flexural strength due to the addition of the steel
fibre. The bonding between steel fibre and matrix enhance the capability of reducing the
propagation of cracks in concrete. The highest value of ITS was noticed for the OG-
80/0.75 as 3.07 MPa. The data in Table 4.19 shows that 12 to 29% increase was noticed
for specimens with steel fibre in NWGC and LWGC. AR80 developed more ITS than
AR65 with 0.75% volume steel fibre. However, the mixes with AR 65 and 80 give similar
ITS for 0.5% volume of steel fibre (Figure 4.25).
Figure 4.25: Development of flexural strength for different % volume of steel fibre
ft,65 = 0.24(%S) + 2.7533
R² = 0.9908
ft,80 = 1.04(%S) + 2.3167
R² = 0.9694
2.5
2.6
2.7
2.8
2.9
3
3.1
3.2
0.25 0.35 0.45 0.55 0.65 0.75
Ind
irec
t te
nsi
le s
tren
gth
, M
Pa
% volume steel fibre, %S
AR65 AR80 Linear (AR65) Linear (AR80)

86
4.5.5 Static modulus of elasticity
The Young’s modulus of elasticity (MoE) is shown in Table 4.20 for the different volume
of steel fibre addition in NWGC and LWGC. The MoE of LWGC is 3.5 times less than
LWGC. The highest value of MoE in LWGC was found for OG-80/0.75 as 10 GPa. It is
noted that flexural and indirect tensile strength also shows the highest result for OG-
80/0.75. The addition of steel fibre improves the MoE 4 to 60% and 1 to 4% in LWGC
and NWGC, respectively; the higher volume of steel fibre in concrete, higher the MoE.
Kurugöl et al. (2008) reported similar outcome that addition of steel fibre increased the
MoE.
Table 4.20: Modulus of elasticity
Mix Designation
OG
OG
-65
/0.2
5
OG
-80
/0.2
5
OG
-65
/0.5
OG
-80
/0.5
OG
-65
/0.7
5
OG
-80
/0.7
5
GG
GG
-65
/0.5
GG
-80
/0.5
28-day Density,
kg/m3
1833 1816 1811 1819 1815 1814 1813 2020 2022 2023
28-day
compressive
strength, MPa
30 31.35 29.96 30.90 31.86 31.30 30.54 27.62 29.17 31.67
Modulus of
Elasticity, GPa
6.25 6.56 8.68 8.69 9.10 8.72 10.00 22.35 22.70 23.21
Eq. 4.8 NA NA 7.64 NA 8.72 NA 7.97 Not Applicable (NA)
Figure 4.26: Development of MoE for different % volume of steel fibre
E65 = 4.32(%S) + 5.83
R² = 0.7604
E80 = 2.64(%S) + 7.94
R² = 0.9578
6.5
7
7.5
8
8.5
9
9.5
10
10.5
0.25 0.35 0.45 0.55 0.65 0.75
Mo
dulu
s o
f el
asti
city
, G
Pa
% volume steel fibre, %S
AR65 AR80 Linear (AR65) Linear (AR80)
87
A comparison of volume of steel fibre and MoE is shown in Figure 4.26. MoE increases
with increment of % volume of steel fibre of both AR65 and 80. Mo et al. (2014a)
proposed following Eq. 4.8 to correlate the MoE with the compressive strength of fibre
reinforced OPS based lightweight concrete containing steel fibre of AR80.
𝐸 = 6.31√𝑓𝑐𝑢 − 26.90 Eq. 4.8
A comparison is shown for the experimental result and the above equation. The deviation
of the estimated result could be due to the usage of different proportion of OPS and
binding material.
4.6 Mix design 3: Effect of steel fibres on fracture toughness
4.6.1 Characteristics of fracture toughness
The steel fibres have significant effect on the fracture behaviour of concrete. The fracture
failure is shown in Figure 4.27. Table 4.21 shows the characteristic properties of fracture
toughness. These properties are derived from the load deflection curve and shown the
performance of fibre reinforced concrete. According to ASTM C1609/C1609M-12
(2012), toughness properties are determined in two residual position , as recommended
by the deflection limit such as beam span/ 600 and beam span/ 150. The end point
deflection which is calculated at beam span/ 150 is a constant value for all types of
concrete material and this depends on the span of the beam only which is computed as 2
in this experiment (Table 4.21).
The first peak load (P1) is the load for the first point of zero slope in the load-deflection
curve. The OPS based geopolymer concrete (OPSGC) without fibre (OG) shows the P1
value as 6.99 kN whereas the gravel based geopolymer concrete without fibre (GG)
performed up to 6.09 kN. This could be attributed to the ductility characteristic of OPS.
P1 values were varied from 6.39 to 11.16 kN for the steel fibre of aspect ratio (AR) 65

88
with different % of volume as 0.25, 0.50 and 0.75. The highest P1 (11.16 kN) was
achieved for the 0.75% volume (OG65/0.75). The bonding effect between the fibre and
paste could influence the variation of first peak load (P1). Similarly, steel fibre with AR
80 has effect on the P1. A range of the values of 6.13 to 7.05 kN of P1 was observed for
the volume 0.25, 0.50 and 0.75% steel fibre of AR 80. The deviation in P1 value for
different % volume of AR 80 is insignificant.
The effect of steel fibre in OPSGC was found more significant than NWGC. GG65/0.5
and GG80/0.5, which contained 0.5% of steel fibre of AR 65 and AR80 respectively,
achieved P1 5.85 and 3.22 kN, respectively. It should be noted that GG was designed for
the similar compressive strength of OG for a comparison. It was noted that AR80 showed
lower P1 than AR 65 for all mixes. The first peak strength (f1) and deflection (δ1) were
related to P1 and have significance in the fracture performance of FOPSGC. A maximum
δ1 of 1.49 mm was noticed for the 0.25% steel fibre of AR 80; the maximum first peak
load (11.16 kN) was obtained for mix OG65/0.75 with 0.75% of steel fibre of AR 65.
AR80 has longer fibre length than AR 65, which could influence the deflection.
Figure 4.27: Fracture failure

89
Table 4.21: Fracture characteristics for different mix designs
Fracture characteristics OG OG65/0.25 OG80/0.25 OG65/0.50 OG80/0.50 OG65/0.75 OG80/0.75 GG GG65/0.50 GG80/0.50
End point deflection - 2.00 2.00 2.00 2.00 2.00 2.00 - 2.00 2.00
First-peak load, P1 (kN) 6.99 8.05 6.56 6.39 6.13 11.16 7.05 6.05 5.85 3.22
First-peak deflection, δ1 (mm) 1.14 1.05 1.49 0.86 0.26 1.26 1.07 0.39 0.93 1.35
First-peak strength, f1 (MPa) 2.61 4.93 3.82 3.54 3.28 6.53 3.84 3.64 3.58 1.97
Peak load, Pp (kN) 6.99 8.05 7.67 6.39 6.13 11.16 7.05 6.05 5.85 3.86
Peak-load deflection, δp (mm) 1.14 1.05 3.39 0.86 0.26 1.26 1.07 0.39 0.93 6.32
Peak strength, fp (Mpa) 2.61 4.93 4.47 3.54 3.28 6.53 3.84 3.64 3.58 2.37
Residual load, PD600 (kN) 1.74 3.09 2.62 3.92 4.31 7.23 0.28 0.04 2.03 1.31
Residual load, PD150 (kN) 6.99 2.09 6.37 0.36 3.03 9.57 2.60 0.18 2.03 3.24
Residual strength, fD600 (MPa) 0.65 1.89 1.53 2.17 2.30 4.23 0.15 0.02 1.24 0.80
Residual strength, fD150 (MPa) 2.61 1.28 3.71 0.20 1.62 5.60 1.42 0.11 1.24 1.99
Specimen toughness, TD150 (Joule) 3.03 9.86 9.20 4.22 7.64 16.27 6.05 0.94 6.80 4.40
Equvalent flexural strength ratio, RDT, 150 0.02 0.06 0.07 0.03 0.06 0.07 0.04 0.01 0.06 0.07

90
4.6.2 First peak deflection (FPD)
Figure 4.28: First peak deflection for all mix designs
The first peak deflection (FPD) is the measure of the deflection during the first peak load.
Figure 4.30 shows a comparison of the first peak deflection of all the mix designs with
and without steel fibres of AR65 and 80 in FOPSGC and NWGC. The FPD was measured
about 34% higher for OG than GG and this could due to higher ductility of the former. It
should be noted that OG and GG have no steel fibre, therefore, no residual deflection
could be found and an immediate failure of the specimens was observed after the first
peak load. An addition of 0.25 and 0.5% of steel fibre of AR 65 has insignificant effect
and reduces the FPD whereas, 0.75% of steel fibre of AR 65 has slight improvement of
FPD. The highest FPD was observed for the addition of 0.25% of steel fibre with AR 80
in OPSGC. The longer fiber size and an appropriate mix proportion of 0.25% of AR 80
in OPSGC could be attributed to the enhanced performance of mix with AR 80. The
addition of steel fibre with GG improves FPD and AR 80 has better role than AR 65 in
the FPD.
0
0.2
0.4
0.6
0.8
1
1.2
1.4
1.6
OG
GG
OG
65
/0.2
5
OG
65
/0.5
0
OG
65
/0.7
5
GG
65
/0.5
0
OG
80
/0.2
5
OG
80
/0.5
0
OG
80
/0.7
5
GG
80
/0.5
0
Fir
st p
eak
def
lect
ion
(m
m)
Mix designationFirst peak deflection

91
4.6.3 Fracture strength
Figure 4.29: First peak load and strength
The first-peak strength (FPS) has the significance on the characterization of the fibre-
reinforced concrete (ASTM C1609/C1609M-12, 2012). The behavior of first peak load
and the first peak strength of OPSGC and NWGC with and without fibre are shown in
Figure 4.29. The FPS in NWGC without fibre is 39% higher than that in OPSGC without
fibre. The FPS improved on the addition of steel fibre in both OPSGC and NWGC. The
addition of 0.75% steel fibre of AR65 shows the highest FPS. The OPSGC containing
0.75% volume of steel fibre with AR80 produced 41% lower strength than the
corresponding volume of fibre with AR 65. The higher FPS of AR65 was found for 0.25%
and 0.5% volume of steel fibre. This could be attributed by the total surface area of the
steel fibre that has an important role in the development of bond strength. For a given
volume of steel fibre, the number of fibres with AR65 is more than that of AR80 and
hence in an identical % volume of fibres, AR65 consists of more surface area than AR80.
0
1
2
3
4
5
6
7
0
2
4
6
8
10
12
OG
GG
OG
65
/0.2
5
OG
65
/0.5
0
OG
65
/0.7
5
GG
65
/0.5
0
OG
80
/0.2
5
OG
80
/0.5
0
OG
80
/0.7
5
GG
80
/0.5
0
Fir
st p
eak s
tren
gth
(M
Pa)
Fir
st p
eak l
oad
(kN
)
Mix designationFirst peak load First peak strength

92
It is noticed that 0.75% of steel fibre gives the highest FPS among 0.25, 0.5 and 0.75%
of volume in both case of AR65 and AR80. A slight reduction of FPS was found for
0.50% volume of steel fibre.
Figure 4.30: Residual load and strength
The residual load (RL) and residual strength (RS) are two important characteristics of
fracture behaviour and are determined generally for the limiting deflection of 1/600 and
1/150 of beam span. The RS at specified deflections characterizes the residual capacity
of the specimen after cracking. Figure 4.30 shows the RL and RS of all mix proportions
of OPSGC and NWGC with/ without fibre. OG, which contains OPS as aggregate and no
fibre, achieved more RL and RD than the NWGC without fibre (GG). The RL (L/150)
and RS (L/150) of OG are relatively 62 and 75% higher than the RL (L/600) and RS
(L/600); however, this variation was found lower in GG.
The addition of steel fibres influences the RL as explained below. The highest RL (L/150)
and RS (L/150) were obtained for 0.75% volume of steel fibre of AR65. The OPSGC
with steel fibre AR65 of 0.75% volume achieved about 74% higher RL (L/150) and RS
0
1
2
3
4
5
6
0
2
4
6
8
10
12
OG
GG
OG
65
/0.2
5
OG
65
/0.5
0
OG
65
/0.7
5
GG
65
/0.5
0
OG
80
/0.2
5
OG
80
/0.5
0
OG
80
/0.7
5
GG
80
/0.5
0
Res
idual
str
ength
(M
Pa)
Res
idual
load
(kN
)
Mix designation
Residual load (L/600) Residual load (L/150)
Residual strength (L/600) Residual strength (L/150)

93
(L/150) than that of OG80/0.75. Similar reduction in RL (L/150) and RS (L/150) was also
found in OG80/0.25 and OG80/0.50.
The values of RL and RS in two-deflection limit of L/600 and L/150 indicate the
progressive failure, which reflects the ductility of the concrete material.
4.6.4 Fracture toughness
Figure 4.31: Toughness and equivalent flexural strength ratio
The toughness and equivalent flexural strength ratio are shown in Figure 4.31. The
toughness determines the capacity of energy absorption of the specimen and is expressed
in terms of Joules (J). The higher toughness indicates the better post-cracking response
(Mo et al., 2014a) and the better ductility performance of the fibre reinforced concrete.
The OPSGC and NWGC without fibre shows the toughness as 3.03 and 0.94 J,
respectively (Table 4.21) and it indicates OG as more ductile than GG. Further, the
toughness as well as the ductility performance increases by adding steel fibres. Similar
findings were reported by Yap et al. (2014) and Mo et al. (2014a).
0
0.02
0.04
0.06
0.08
0
2
4
6
8
10
12
14
16
18
OG
GG
OG
65
/0.2
5
OG
65
/0.5
0
OG
65
/0.7
5
GG
65
/0.5
0
OG
80
/0.2
5
OG
80
/0.5
0
OG
80
/0.7
5
GG
80
/0.5
0
Equiv
alen
t fl
exura
l st
rength
rat
io
Toughnes
s (J
oule
)
Mix designation
Toughness Equivalent flexural strength ratio
94
Steel fibre with AR65 shows more enhancement of toughness than AR80. The highest
toughness was recorded among all the mix proportions is 16.27 J for the material
OG65/0.75 and this value is 5.5 and 17 times higher than OG and GG, respectively. Mo
et al. (2014a) added 0.5, 0.75 and 1% of steel fibre and reported the increment of
toughness about 6 to 17 times compared to the control concrete. Şahin and Köksal (2011)
used normal weight concrete of grade 45 and steel fibres of aspect ratio of 80, and found
the increase of fracture energy by about 2.2 and 3.6 times for the addition of steel fibres
from 0.33% to 0.67% and 0.33% to 1.0%, respectively. The equivalent flexural strength
ratio (EFSR) was also found the maximum value for OG65/0.75. It is noted from Figure
4.31 that the EFSR changes simultaneously with the change of toughness.

95
CHAPTER 5 CONCLUSION AND RECOMMENDATION
5.1 Introduction
This chapter contains the conclusions of each experimental findings and recommendation
for further research. The conclusions are separated into four clauses based on each
objectives.
5.1.1 Development of appropriate mix proportion (objective 1)
This objective was concerned with the investigation on the appropriate mix design using
palm oil fuel ash (POFA), fly ash (FA) and metakaolin (MK) as binding material and to
investigate the effect of manufactured sand (M-sand) and quarry dust (QD) in geopolymer
mortar as a replacement of conventional mining sand as fine aggregate. The conclusions
are listed below:
The M-sand was found to be a potential replacement of conventional mining sand.
The mix with 100% replacement of N-sand by QD showed higher compressive
strength compared to replacing N-sand by different proportion of M-sand and QD.
Though the compressive strength slightly reduces due to the replacement of N-sand
or QD by M-sand, the M-sand is considered as a viable alternative to conventional
sand due to depletion of natural resources. The slight variation in the compressive
strength might be attributed to the aggregate shape and texture.
The usage of 100% M-Sand in POFA-FA-based geopolymer mortar produced
comparable strength as that of 100% N-sand. The use of QD as fine aggregate also
reinforces the use of waste material as replacement for conventional N-sand; the
high strength of specimens with 100% QD is attributed to the rough surfaces of QD
that enhances the bond between the paste and the aggregates.

96
The replacement of conventional N-sand with M-sand and QD shows comparable
strength as that of N-sand based specimens and the use of M-sand and QD is
recommended in geopolymer concrete.
The high concentration of sodium hydroxide solution increases the compressive
strength. The mixes with more fine particles require more past to cover the surface
areas; but for the mixes with constant binder content, the influence of the finer
particles can’t be ignored.
The failure mode of geopolymer mortar was found similar to that of Portland
cement mortar. The density and compressive strength relationship of N-sand/M-
sand/QD based geopolymer mortar was also found similar to that of the Portland
cement mortar.
The POFA and MK mix proportions achieve the better mix proportion than POFA,
FA and MK. The mix proportion consisting 90% POFA and 10% MK gives the
highest strength.
No significant changes on the compressive strength were observed for the
replacement of FA by MK while the proportion of POFA remains constant. This is
due to the consistent of silica/ alumina ratio in all proportion of POFA-FA-MK.
Silica/ alumina ratio has the main role in finding an appropriate mix proportion of
raw binding materials. The silica/ alumina ratio of 9.26 contributes in the
development of structural grade light weight concrete. The replacement of POFA
by MK from 10% to 40% gradually reduces the compressive strength due to the
gradual reduction of silica/ alumina ratio from 9.26 to 3.42.
97
Heat curing in a temperature of 650C for 48 hours and the alkaline solution with 14
molarity sodium hydroxide are effective to develop about 80% of 28-day
compressive strength by the age of 3-day.
There was no significant detrimental effect detected on the usage of oil palm shell
(OPS) in geopolymer concrete.
5.1.2 Investigation on the mechanical properties of OPSGC (objective 2)
The investigation of the fresh and hardened properties of oil palm shell geopolymer
concrete (OPSGC) shows following outcomes.
The fresh density of OPSGC increases with the replacement of POFA/ FA by MK
since the specific gravity of MK is higher than POFA and MK.
The usage of excessive water decreases the strength of OPSGC effecting proper
geopolymerization. The usage of minimum required additional water may enhance
the compressive strength and reduce the slump value. Proper vibration during
casting helps to overcome the workability issue for less water content and no
honeycomb was found after demoulding and crushing the concrete specimens.
The POFA and MK mix proportions achieved higher strength than that of POFA,
FA and MK proportions due to the appropriate Silica/ Alumina ratio.
The mix proportion consisting 80% POFA and 20% MK produced the highest
compressive strength (23.6 MPa), however 90% POFA and 10% MK is the
considerable mix proportions since the compressive strength (23.2 MPa) is very
close to the highest compressive strength and this proportion contains more quantity
of industrial by-product POFA and also usable for the preparation of structural
grade lightweight concrete.
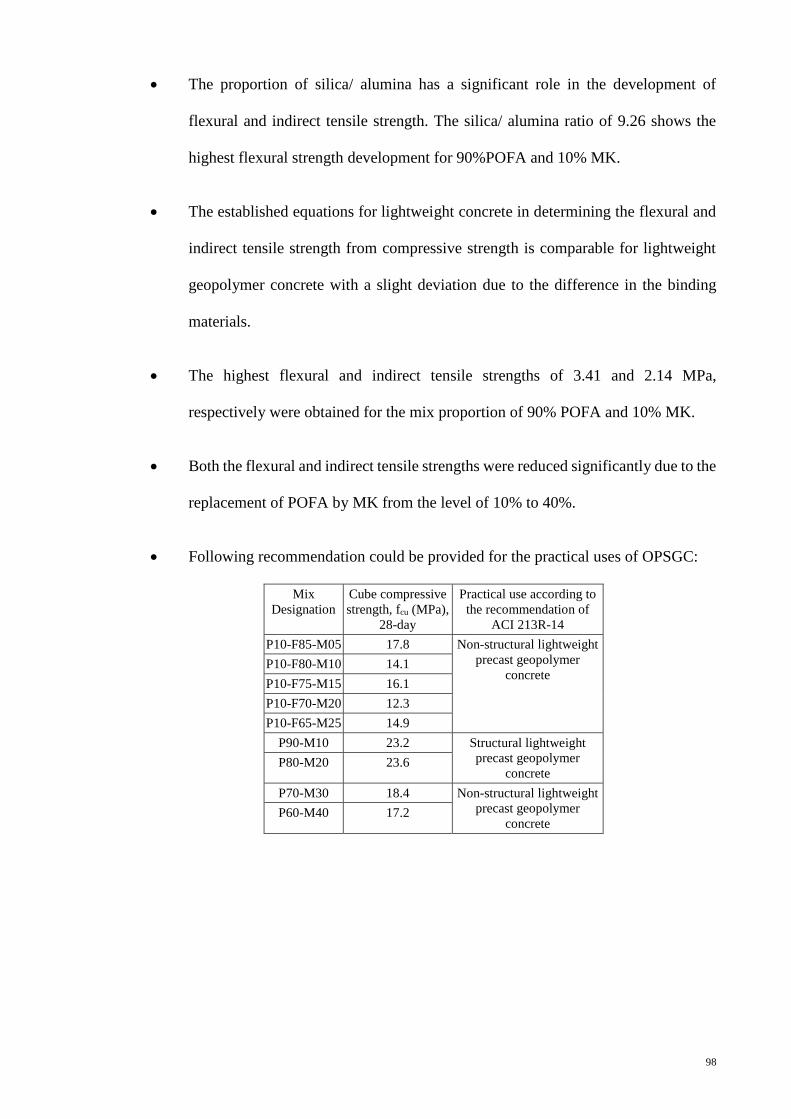
98
The proportion of silica/ alumina has a significant role in the development of
flexural and indirect tensile strength. The silica/ alumina ratio of 9.26 shows the
highest flexural strength development for 90%POFA and 10% MK.
The established equations for lightweight concrete in determining the flexural and
indirect tensile strength from compressive strength is comparable for lightweight
geopolymer concrete with a slight deviation due to the difference in the binding
materials.
The highest flexural and indirect tensile strengths of 3.41 and 2.14 MPa,
respectively were obtained for the mix proportion of 90% POFA and 10% MK.
Both the flexural and indirect tensile strengths were reduced significantly due to the
replacement of POFA by MK from the level of 10% to 40%.
Following recommendation could be provided for the practical uses of OPSGC:
Mix
Designation
Cube compressive
strength, fcu (MPa),
28-day
Practical use according to
the recommendation of
ACI 213R-14
P10-F85-M05 17.8 Non-structural lightweight
precast geopolymer
concrete P10-F80-M10 14.1
P10-F75-M15 16.1
P10-F70-M20 12.3
P10-F65-M25 14.9
P90-M10 23.2 Structural lightweight
precast geopolymer
concrete P80-M20 23.6
P70-M30 18.4 Non-structural lightweight
precast geopolymer
concrete P60-M40 17.2
99
5.1.3 Investigation of Mechanical properties of FOPSGC and FNWGC (Objective 3)
A significant effect volume and aspect ratio (AR) of steel fibre in the development of
mechanical properties of OPSGC was found from this research experiment. The ARs used
in this investigation were 80 and 65 with % volume of 0.25, 0.5 and 0.75. The main
findings are concluded as follows:
All the FOPSGC produced zero slump due to the addition of fibres and the cohesive
nature of the mixes.
The highest fresh density of 1890 kg/m3 was observed for OPSGC with 0.75% of
steel fibre of AR80 and this is attributed by the specific gravity and % volume of
steel fibre in concrete. The lowest fresh density of 1845 kg/m3 was noted in the
fibre reinforced OPSGC for the 0.25% volume of steel fibre of both AR.
The volume and AR of steel fibre had insignificant effect in the development of
strength.
The different volume and AR of steel fibre in OPSGC had insignificant effect on
the compressive strength. The compressive strength was varied in the range of
30.54 to 31.86 MPa for the variation of steel fibres in OPSGC. The highest
compressive strength of fibre reinforced OPSGC was achieved with addition of
0.5% of steel fibre of AR80.
The AR80 has more effect in the development of strength compared to AR65 for
the same % volume of steel fibre in OPSGC and this could be due to the capability
of fibre in reducing the crack propagation in concrete.
The contribution of steel fibre in the development of strength was found more in
lightweight geopolymer concrete than the normal weight geopolymer concrete.

100
The bonding between steel fibre and binding material influences the development
of strength and this is related to the surface area of the steel fibre.
5.1.4 Investigation of fracture behaviour of FOPSGC (objective 4)
The fracture behavior of fibre reinforce OPSGC and NWGC were examined and
compared. The conclusions on the effect of volume and AR of steel fibres on the
characteristics of fracture behavior, i.e. first peak deflection, fracture strength and the
fracture toughness are given below:
The 0.75% volume of steel fibre with AR65 shows the best performance among
0.25, 0.5, 0.75% volumes with AR80 & 65 and this could be attributed to the
efficiency of energy absorption of high volume of steel fibre with lower aspect ratio.
The highest values of fracture toughness, strength and residual strength (L/150)
produced by OG96/0.75 are 16.27J, 6.53MPa and 5.60 MPa, respectively.
OG containing OPS as aggregate without fibre producedhigher RL and RD than the
corresponding NWGC (GG).
The highest RL (L/150) and RS (L/150) were obtained for specimens with 0.75%
volume of steel fibre of AR65.
101
5.2 Recommendation for future work
The following recommendations for future research work are made based on the findings
from this research work:
The workability of PMGC is lower or nonexistant and the cohesive mixes require
improvement and hence further investigation on this aspect needs to be conducted.
Microstructure analysis will be beneficial for better understanding of the
geopolymeric reaction in the PMGC.
An investigation on the structural behavior of beam and columns using PMGC is
recommended.
The experiments on the durability and thermal conductivity are required to be
investigated to study the properties of PMGC.
The effect of steel fibres in the development of impact and torsional resistance of
structural beam/ slabs of FOPSGC may be examined.
To investigate a design guideline for the PMGC.
Special type of mixer machine is necessary for geopolymer concrete for proper
mixing with less amount of water.
Long term properties such as shrinkage, creep and other durability aspects have to
be examined.

102
REFERENCES
Abdulkareem, O. A., Mustafa Al Bakri, A. M., Kamarudin, H., Khairul Nizar, I., & Saif,
A. e. A. (2014). Effects of elevated temperatures on the thermal behavior and
mechanical performance of fly ash geopolymer paste, mortar and lightweight
concrete. Construction and Building Materials, 50(0), 377-387.
Abdullah, A. A. A. (1996). 10 - Palm oil shell aggregate for lightweight concrete. In S.
Chandra (Ed.), Waste Materials Used in Concrete Manufacturing (pp. 624-636).
Westwood, NJ: William Andrew Publishing.
ACI 213R-14. (2014). Guide for structural lightweight aggregate concrete: American
Concrete Institute.
Alengaram, U. J., Jumaat, M. Z., & Mahmud, H. (2008). Influence of sand content and
silica fume on mechanical properties of palm kernel shell concrete. Paper
presented at the International conference on construction and building technology
ICCBT.
Alengaram, U. J., Jumaat, M. Z., Mahmud, H., & Fayyadh, M. M. (2011a). Shear
behaviour of reinforced palm kernel shell concrete beams. Construction and
Building Materials, 25(6), 2918-2927.
Alengaram, U. J., Mahmud, H., & Jumaat, M. Z. (2011b). Enhancement and prediction
of modulus of elasticity of palm kernel shell concrete. Materials and Design,
32(4), 2143-2148.
Alengaram, U. J., Muhit, B. A. A., & Jumaat, M. Z. (2013a). Utilization of oil palm kernel
shell as lightweight aggregate in concrete – A review. Construction and Building
Materials, 38, 161-172.
Alengaram, U. J., Muhit, B. A. A., Jumaat, M. Z., & Jing, M. L. Y. (2013b). A comparison
of the thermal conductivity of oil palm shell foamed concrete with conventional
materials. Materials and Design, 51, 522-529.
Alexander, M., & Mindess, S. (2005). Aggregates in concrete. 2 Park Square, Milton
Park, Abingdon, Oxon OX 14 4RN: Taylor & Francis.
Alida, A., Al Bakri, A. M., Kamarudin, H., Ruzaidi, C., Salleh, M. M., & Chin, K. H.
(2013). The Effect of Acidic to the Fly Ash Based Geopolymer Artificial
Aggregate. Australian Journal of Basic and Applied Sciences, 7(5), 303-307.
Álvarez-Ayuso, E., Querol, X., Plana, F., Alastuey, A., Moreno, N., Izquierdo, M., . . .
Barra, M. (2008). Environmental, physical and structural characterisation of
geopolymer matrixes synthesised from coal (co-) combustion fly ashes. Journal
of Hazardous Materials, 154(1), 175-183.
Appukutty, P., & Murugesan, R. (2009). Substitution of quarry dust to sand for mortar in
brick masonry works. International Journal on Design and Manufacturing
Technologies, 3(1), 59-63.

103
Ashtiani, M. S., Scott, A. N., & Dhakal, R. P. (2013). Mechanical and fresh properties of
high-strength self-compacting concrete containing class C fly ash. Construction
and Building Materials, 47, 1217-1224.
ASTM C125 - 13b. (2013). Standard Terminology Relating to Concrete and Concrete
Aggregates. West Conshohocken, PA: ASTM International.
ASTM C127-12. (2012). Standard Test Method for Density, Relative Density (Specific
Gravity), and Absorption of Coarse Aggregate. West Conshohocken, PA: ASTM
International.
ASTM C128-12. (2012). Standard Test Method for Density, Relative Density (Specific
Gravity), and Absorption of Fine Aggregate. West Conshohocken, PA: ASTM
International.
ASTM C131-06. (2006). Standard Test Method for Resistance to Degradation of Small-
Size Coarse Aggregate by Abrasion and Impact in the Los Angeles Machine. West
Conshohocken, PA: ASTM International.
ASTM C136-06. (2006). Standard Test Method for Sieve Analysis of Fine and Coarse
Aggregates. West Conshohocken, PA: ASTM International.
ASTM C143/C143M-12. (2012). Standard Test Method for Slump of Hydraulic-Cement
Concrete. West Conshohocken, PA: ASTM International.
ASTM C188-09. (2009). Standard test method for density of hydraulic cement. West
Conshohocken, PA: ASTM International.
ASTM C469 - 14. Standard Test Method for Static Modulus of Elasticity and Poisson's
Ratio of Concrete in Compression. West Conshohocken, PA, 2003: ASTM
International.
ASTM C618-12a. (2012). Standard Specification for Coal Fly Ash and Raw or Calcined
Natural Pozzolan for Use in Concrete. West Conshohocken, PA: ASTM
International.
ASTM C1018-97. (1997). ASTM C1018-97 Standard Test Method for Flexural
Toughness and First-Crack Strength of Fiber-Reinforced Concrete (Using Beam
With Third-Point Loading). West Conshohocken, PA: ASTM International.
ASTM C1609/C1609M-12. (2012). Standard Test Method for Flexural Performance of
Fiber-Reinforced Concrete (Using Beam With Third-Point Loading). West
Conshohocken, PA: ASTM International.
ASTM C1688/C1688M-13. (2013). Standard Test Method for Density and Void Content
of Freshly Mixed Pervious Concrete. West Conshohocken, PA: ASTM
International.
Atiş, C. D., & Karahan, O. (2009). Properties of steel fiber reinforced fly ash concrete.
Construction and Building Materials, 23(1), 392-399.
Autef, A., Joussein, E., Gasgnier, G., & Rossignol, S. (2013a). Role of the silica source
on the geopolymerization rate: A thermal analysis study. Journal of Non-
Crystalline Solids, 366, 13-21.

104
Autef, A., Joussein, E., Poulesquen, A., Gasgnier, G., Pronier, S., Sobrados, I., . . .
Rossignol, S. (2013b). Influence of metakaolin purities on potassium geopolymer
formulation: the existence of several networks. Journal of Colloid and Interface
Science(0).
Awal, A. S. M. A., & Hussin, M. W. (1997). The effectiveness of palm oil fuel ash in
preventing expansion due to alkali-silica reaction. Cement and Concrete
Composites, 19(4), 367-372.
Bagheri, A., & Nazari, A. (2014). Compressive strength of high strength class C fly ash-
based geopolymers with reactive granulated blast furnace slag aggregates
designed by Taguchi method. Materials & Design, 54(0), 483-490.
Bakharev, T. (2005). Geopolymeric materials prepared using Class F fly ash and elevated
temperature curing. Cement and Concrete Research, 35(6), 1224-1232.
Bakharev, T. (2006). Thermal behaviour of geopolymers prepared using class F fly ash
and elevated temperature curing. Cement and Concrete Research, 36, 1134-1147.
Balamurugan, G., & Perumal, P. (2013). Use of Quarry Dust to Replace Sand in
Concrete–An Experimental Study. International Journal of Scientific and
Research Publications, 3(12).
Barbosa, V. F. F., MacKenzie, K. J. D., & Thaumaturgo, C. (2000). Synthesis and
characterisation of materials based on inorganic polymers of alumina and silica:
sodium polysialate polymers. International Journal of Inorganic Materials, 2(4),
309-317.
BS EN 12390-3:2009. (2009). Testing hardened concrete Compressive strength of test
specimens: BSI.
BS EN 12390-5:2009. (2009). Testing hardened concrete Flexural strength of test
specimens: BSI.
BS EN 12390-6:2009. (2009). Testing hardened concrete tensile splitting strength of test
specimens: BSI.
Chandra, S., & Berntsson, L. (2002). Light weight aggregate concrete. 13 Eaton Avenue,
Norwich, NY 13815: Noyels publications.
Chindaprasirt, P., Jaturapitakkul, C., Chalee, W., & Rattanasak, U. (2009). Comparative
study on the characteristics of fly ash and bottom ash geopolymers. Waste
Management, 29(2), 539-543.
Chindaprasirt, P., Jaturapitakkul, C., & Sinsiri, T. (2007). Effect of fly ash fineness on
microstructure of blended cement paste. Construction and Building Materials,
21(7), 1534-1541.
Chow, R. K. K., Yip, S. W. S., & Kwan, A. K. H. (2013). Processing crushed rock fine
to produce manufactured sand for improving overall performance of concrete.
HKIE Transactions, 1-10.
Davidovits, J. (1979). Synthesis of new high-temperature geo-polymers for reinforced
plastics/composites.

105
Davidovits, J. (1991). Geopolymers. Journal of Thermal Analysis and calorimetry, 37(8),
1633-1656.
Davidovits, J. (1994a). High-alkali cements for 21st century concretes. ACI Special
Publication, 144.
Davidovits, J. (1994b). Properties of geopolymer cements. Paper presented at the First
International Conference on Alkaline Cements and Concretes.
Davidovits, J. (2008). Geopolymer chemistry & application (3rd ed.). 16 rule Galilee, F-
02100 Saint-Quentin, France: Institute Géopolymèr.
Dhir, R. K. (1986). Pulverized-fuel ash. Cement Replacement Materials (Ed. RN Swamy),
Survey University Pres, London.
Dumitru, I., Zdrilic, T., & Smorchevsky, G. (1999). The use of manufactured quarry fines
in concrete. Paper presented at the Proc. 7 th Annual Symposium on Aggregates-
Concrete, Bases and Fines, Austin.
Duxson, P., Provis, J. L., Lukey, G. C., Mallicoat, S. W., Kriven, W. M., & Van Deventer,
J. S. (2005). Understanding the relationship between geopolymer composition,
microstructure and mechanical properties. Colloids and Surfaces A:
Physicochemical and Engineering Aspects, 269(1), 47-58.
Fernández-Jiménez, A., Palomo, A., & Criado, M. (2005). Microstructure development
of alkali-activated fly ash cement: a descriptive model. Cement and Concrete
Research, 35(6), 1204-1209.
Fernandez-Jimenez, A. M., Palomo, A., & Lopez-Hombrados, C. (2006). Engineering
properties of alkali-activated fly ash concrete. ACI Materials Journal, 103(2).
Fung, W. W. S., Kwan, A. K. H., & Wong, H. H. C. (2009). Wet packing of crushed rock
fine aggregate. Materials and structures, 42(5), 631-643.
Galloway, J. E. (1994). Grading, Shape and Surface Properties (Vol. 169C): ASTM
International.
Gao, J., Sun, W., & Morino, K. (1997). Mechanical properties of steel fiber-reinforced,
high-strength, lightweight concrete. Cement and Concrete Composites, 19(4),
307-313.
Guo, X., Shi, H., & Dick, W. A. (2010). Compressive strength and microstructural
characteristics of class C fly ash geopolymer. Cement and Concrete Composites,
32(2), 142-147.
Hamid, A., Azlina, N., Thamrin, R., & Ibrahim, A. (2013). Shear capacity of non-metallic
(FRP) reinforced concrete beams with stirrups. Unpublished
(http://eprints.uthm.edu.my/view/creators/Thamrin=3ARendy=3A=3A.html).
Hardjito, D., Cheak, C. C., & Ing, C. H. L. (2009). Strength and setting times of low
calcium fly ash-based geopolymer mortar. Modern Applied Science, 2(4), 3-11.

106
Hardjito, D., & Rangan, B. V. (2005). Development and properties of low-calcium fly-
ash based geopolymer concrete Research Report GC 1. Engineering Faculty,
Curtin University of Technology, Perth, Australia.
Hardjito, D., Wallah, S. E., Sumajouw, D. M., & Rangan, B. V. (2005). Fly ash-based
geopolymer concrete. Australian Journal of Structural Engineering, 6(1), 77-84.
He, C., Osbaeck, B., & Makovicky, E. (1995). Pozzolanic reactions of six principal clay
minerals: activation, reactivity assessments and technological effects. Cement and
Concrete Research, 25(8), 1691-1702.
Hudson, B. P. (1999a). Concrete workability with high fines content sands. Quarry, 7(2),
22-25.
Hudson, B. P. (1999b). Modification to the fine aggregate angularity test. Paper presented
at the Seventh Annual Symposyum Austin, TX.
Hussin, M. W., & Awal, A. S. M. A. (1996). Influence of palm oil fuel ash on strength
and durability of concrete. Paper presented at the Proc., 7th Int. Conf. on
Durability of Building Materials and Components.
İpek, M., Yilmaz, K., & Uysal, M. (2012). The effect of pre-setting pressure applied
flexural strength and fracture toughness of reactive powder concrete during the
setting phase. Construction and Building Materials, 26(1), 459-465.
Isabella, C., Lukey, G. C., Xu, H., & Deventer, J. S. J. v. (2003, 7-12 September 2003).
The effect of aggregate particle size on formation of geopolymeric gel. Paper
presented at the Advanced materials for construction of bridges, buildings and
other structures III, Davos, Switzerland.
Jarrige, A. (1971). Les Cendres Volantes properties - Applications Industrielles. from
http://trid.trb.org/view.aspx?id=1080769
Ji, T., Chen, C.-Y., Zhuang, Y.-Z., & Chen, J.-F. (2013). A mix proportion design method
of manufactured sand concrete based on minimum paste theory. Construction and
Building Materials, 44(0), 422-426.
Jumaat, Z. (2010). Comparison of mechanical and bond properties of oil palm kernel shell
concrete with normal weight concrete. International Journal of the Physical
Sciences, 5(8), 1231-1239-1231-1239.
Kaplan, M. (1960). The Flexural and Compressive Strength of Concrete as Affected by
the Properties of Coarse Aggregates: National Building Research Institute,
Council for Scientific and Industrial Research (CSIR).
Khale, D., & Chaudhary, R. (2007). Mechanism of geopolymerization and factors
influencing its development: a review. Journal of materials science, 42(3), 729-
746.
Köksal, F., Altun, F., Yiğit, İ., & Şahin, Y. (2008). Combined effect of silica fume and
steel fiber on the mechanical properties of high strength concretes. Construction
and Building Materials, 22(8), 1874-1880.

107
Kong, D. L., & Sanjayan, J. G. (2008). Damage behavior of geopolymer composites
exposed to elevated temperatures. Cement and Concrete Composites, 30(10), 986-
991.
Kovalchuk, G., Fernández-Jiménez, A., & Palomo, A. (2007). Alkali-activated fly ash:
Effect of thermal curing conditions on mechanical and microstructural
development–Part II. Fuel, 86(3), 315-322.
Kurugöl, S., Tanaçan, L., & Ersoy, H. Y. (2008). Young’s modulus of fiber-reinforced
and polymer-modified lightweight concrete composites. Construction and
Building Materials, 22(6), 1019-1028.
Lee, W. K. W., & van Deventer, J. S. J. (2007). Chemical interactions between siliceous
aggregates and low-Ca alkali-activated cements. Cement and Concrete Research,
37(6), 844-855.
Li, Q., Sun, Z., Tao, D., Xu, Y., Li, P., Cui, H., & Zhai, J. (2013). Immobilization of
simulated radionuclide 133Cs+ by fly ash-based geopolymer. Journal of
Hazardous Materials, 262(0), 325-331.
Liu, M. Y. J., Alengaram, U. J., Jumaat, M. Z., & Mo, K. H. (2014). Evaluation of thermal
conductivity, mechanical and transport properties of lightweight aggregate
foamed geopolymer concrete. Energy and Buildings, 72(0), 238-245.
Lloyd, N., & Rangan, V. (2009). Geopolymer Concrete-Sustainable Cementless
Concrete. ACI Special Publication, 261(3), 33-54.
McDonald, M., & Thompson, J. (2003). Sodium silicate a binder for the 21st century.
Industrial Chemicals Division. The PQ Corporation.
Mehta, P. K., & Monteiro, P. J. M. (2006). Concrete - Microstructure, Properties, and
Materials (3rd ed.): McGraw-Hill Companies, Inc.
Memon, F. A., Nuruddin, M. F., Khan, S., Shafiq, N., & Ayub, T. (2013). Effect of
Sodium Hydroxide concentration on fresh properties and compressive strength of
self-compacting geopolymer concrete. Journal of Engineering Science and
Technology, 8(1), 44-56.
Mijarsh, M. J. A., Johari, M. A. M., & Ahmad, Z. A. (2014). Synthesis of geopolymer
from large amounts of treated palm oil fuel ash: Application of the Taguchi
method in investigating the main parameters affecting compressive strength.
Construction and Building Materials, 52(0), 473-481.
Mo, K. H., Yap, K. K. Q., Alengaram, U. J., & Jumaat, M. Z. (2014a). The effect of steel
fibres on the enhancement of flexural and compressive toughness and fracture
characteristics of oil palm shell concrete. Construction and Building Materials,
55(0), 20-28.
Mo, K. H., Yap, S. P., Alengaram, U. J., Jumaat, M. Z., & Bu, C. H. (2014b). Impact
resistance of hybrid fibre-reinforced oil palm shell concrete. Construction and
Building Materials, 50(0), 499-507.
Neves, R. D., & Almeida, J. F. d. (2005). Compressive behaviour of steel fibre reinforced
concrete. structural concrete, 6(1), 1-8.

108
Noorvand, H., Ali, A. A. A., Demirboga, R., Noorvand, H., & Farzadnia, N. (2013).
Physical and chemical characteristics of unground palm oil fuel ash cement
mortars with nanosilica. Construction and Building Materials, 48(0), 1104-1113.
Okpala, D. C. (1990). Palm kernel shell as a lightweight aggregate in concrete. Building
and Environment, 25(4), 291-296.
P.Sravana, S. K. T. C. S. R. (2013). Effect of Manufacture sand on Strength
Characteristics of Roller Compacted Concrete. International Journal of
Engineering Research & Technology (IJERT), 2(2).
Pacheco-Torgal, F., Castro-Gomes, J., & Jalali, S. (2008). Alkali-activated binders: A
review: Part 1. Historical background, terminology, reaction mechanisms and
hydration products. Construction and Building Materials, 22(7), 1305-1314.
Palomo, A., Grutzeck, M. W., & Blanco, M. T. (1999). Alkali-activated fly ashes: a
cement for the future. Cement and Concrete Research, 29(8), 1323-1329.
Pangdaeng, S., Phoo-ngernkham, T., Sata, V., & Chindaprasirt, P. (2013). Influence of
curing conditions on properties of high calcium fly ash geopolymer containing
Portland cement as additive. Materials and Design.
Phoo-ngernkham, T., Chindaprasirt, P., Sata, V., Hanjitsuwan, S., & Hatanaka, S. (2014).
The effect of adding nano-SiO2 and nano-Al2O3 on properties of high calcium
fly ash geopolymer cured at ambient temperature. Materials and Design, 55, 58-
65.
Powers, T. C. (1969). The properties of fresh concrete (W. D. Transportation Research
Board, Trans.). 111 River Street, Hoboken, NJ 07030-6000 USA: Road Research
Laboratory, UK.
Puertas, F., Martı́nez-Ramı́rez, S., Alonso, S., & Vazquez, T. (2000). Alkali-activated fly
ash/slag cement Strength behaviour and hydration products. Cement and Concrete
Research, 30(10), 1625-1632.
Quiroga, P. N., & Fowler, D. W. (2004). The effects of aggregates characteristics on the
performance of Portland cement concrete. 1 University Station C1755, Austin,
TX 78712-0277: International Centre for Aggregates Research (ICAR), The
University of Texas at Austin.
Raman, S. N., Ngo, T., Mendis, P., & Mahmud, H. B. (2011). High-strength rice husk ash
concrete incorporating quarry dust as a partial substitute for sand. Construction
and Building Materials, 25(7), 3123-3130.
Rangan, B. V. (2008). Fly ash-based geopolymer concrete Research Report GC 4.
Engineering Faculty, Curtin University of Technology, Perth, Australia.
Rashad, A. M. (2014). A comprehensive overview about the influence of different
admixtures and additives on the properties of alkali-activated fly ash. Materials
& Design, 53(0), 1005-1025.
Rovnaník, P. (2010). Effect of curing temperature on the development of hard structure
of metakaolin-based geopolymer. Construction and Building Materials, 24(7),
1176-1183.

109
Roy, D. M. (1999). Alkali-activated cements opportunities and challenges. Cement and
Concrete Research, 29(2), 249-254.
Rukzon, S., & Chindaprasirt, P. (2009). Use of disposed waste ash from landfills to
replace Portland cement. Waste Management & Research, 27(6), 588-594.
Ryu, G. S., Lee, Y. B., Koh, K. T., & Chung, Y. S. (2013). The mechanical properties of
fly ash-based geopolymer concrete with alkaline activators. Construction and
Building Materials, 47(0), 409-418.
Sabir, B., Wild, S., & Bai, J. (2001). Metakaolin and calcined clays as pozzolans for
concrete: a review. Cement & Concrete Composites, 23(6), 441-454.
Saeed, A., Hammons, M. I., & Petermann, J. C. (2010). Alkali-Activated Geopolymers:
A Literature Review: Applied RESEARCH ASSOCIATES INC PANAMA CITY
FL.
Safiuddin, M., Abdus Salam, M., & Jumaat, M. Z. (2011a). Utilization of palm oil fuel
ash in concrete: a review. Journal of Civil Engineering and Management, 17(2),
234-247.
Safiuddin, M., Alengaram, U. J., Salam, M. A., Jumaat, M. Z., Jaafar, F. F., & Saad, H.
(2011b). Properties of high-workability concrete with recycled concrete
aggregate. Materials Research, 14(2), 248-255.
Şahin, Y., & Köksal, F. (2011). The influences of matrix and steel fibre tensile strengths
on the fracture energy of high-strength concrete. Construction and Building
Materials, 25(4), 1801-1806.
Shafigh, P., Alengaram, U. J., Mahmud, H., & Jumaat, M. Z. (2013a). Engineering
properties of oil palm shell lightweight concrete containing fly ash. Materials and
Design, 49, 613-621.
Shafigh, P., Jumaat, M. Z., Mahmud, H., & Alengaram, U. J. (2013b). Oil palm shell
lightweight concrete containing high volume ground granulated blast furnace slag.
Construction and Building Materials, 40, 231-238.
Shilstone, J. M. (1999). The Aggregate: The most important value-adding component in
concrete. Paper presented at the Seventh Annual Symposium Austin, Texas.
Short, A., & Kinniburgh, W. (1978). Lightweight concrete (3rd ed.): Applied Science
Publishers London.
Sivakumar, A., & Santhanam, M. (2007). Mechanical properties of high strength concrete
reinforced with metallic and non-metallic fibres. Cement and Concrete
Composites, 29(8), 603-608.
Škvára, F., Jílek, T., & Kopecký, L. (2005). Geopolymer materials based on fly ash.
Ceram.-Silik, 49(3), 195-204.
Somna, K., Jaturapitakkul, C., Kajitvichyanukul, P., & Chindaprasirt, P. (2011). NaOH-
activated ground fly ash geopolymer cured at ambient temperature. Fuel, 90(6),
2118-2124.

110
Sumadi, S. R., & Hussin, M. W. (1995). Palm oil fuel ash (POFA) as a future partial
cement replacement material in housing construction. Journal of Ferrocement,
25(1), 25-34.
Sumajouw, D., Hardjito, D., Wallah, S., & Rangan, B. (2004). Geopolymer concrete for
a sustainable future. Paper presented at the Proceedings of the second
international conference on sustainable processing of minerals and metals, green
processing.
Sumajouw, M. D. J., & Rangan, B. V. (2006). Low-calcium fly ash-based geopolymer
concrete: Reinforced beams and columns Research Report GC 3. Engineering
Faculty, Curtin University of Technology, Perth, Australia.
Tan, K. H., & Du, H. (2013). Sandless concrete with fly ash as supplementary cementing
material. Journal of Sustainable Cement-Based Materials(ahead-of-print), 1-12.
Tasong, W. A., Cripps, J. C., & Lynsdale, C. J. (1998). Aggregate-cement chemical
interactions. Cement and Concrete Research, 28(7), 1037-1048.
Van Jaarsveld, J. G. S., Van Deventer, J. S. J., & Lukey, G. C. (2002). The effect of
composition and temperature on the properties of fly ash-and kaolinite-based
geopolymers. Chemical Engineering Journal, 89(1), 63-73.
Venkatanarayanan, H. K., & Rangaraju, P. R. (2013). Decoupling the effects of chemical
composition and fineness of fly ash in mitigating alkali-silica reaction. Cement
and Concrete Composites(0).
Wallah, S. E., & Rangan, B. V. (2006). Low-calcium fly ash-based geopolymer concrete:
Long-term properties Research Report GC 2. Engineering Faculty, Curtin
University of Technology, Perth, Australia.
Wang, B., Han, Y., & Liu, S. (2013). Effect of highly dispersed carbon nanotubes on the
flexural toughness of cement-based composites. Construction and Building
Materials, 46(0), 8-12.
Westerholm, M., Lagerblad, B., Silfwerbrand, J., & Forssberg, E. (2008). Influence of
fine aggregate characteristics on the rheological properties of mortar. Cement and
Concrete Composites, 30(4), 274-282.
Wu, H.-C., & Sun, P. (2010). Effect of Mixture Compositions on Workability and
Strength of Fly Ash-Based Inorganic Polymer Mortar. ACI Materials Journal,
107(6).
Xu, H., & Van Deventer, J. S. J. (2000). The geopolymerisation of alumino-silicate
minerals. International Journal of Mineral Processing, 59(3), 247-266.
Yap, S. P., Alengaram, U. J., & Jumaat, M. Z. (2013). Enhancement of mechanical
properties in polypropylene– and nylon–fibre reinforced oil palm shell concrete.
Materials and Design, 49, 1034-1041.
Yap, S. P., Bu, C. H., Alengaram, U. J., Mo, K. H., & Jumaat, M. Z. (2014). Flexural
toughness characteristics of steel–polypropylene hybrid fibre-reinforced oil palm
shell concrete. Materials and Design, 57, 652-659.

111
Yew, M. K., Mahmud, H., Ang, B. C., & Yew, M. C. (2014). Effects of heat treatment
on oil palm shell coarse aggregates for high strength lightweight concrete.
Materials and Design, 54, 702-707.
Yost, J. R., Radlińska, A., Ernst, S., & Salera, M. (2013). Structural behavior of alkali
activated fly ash concrete. Part 1: mixture design, material properties and sample
fabrication. Materials and structures, 46(3), 435-447.
Yusuf, M. O., Johari, M. A. M., Ahmad, Z. A., & Maslehuddin, M. (2013). Evolution of
Alkaline Activated Ground Blast Furnace-Ultrafine Palm Oil Fuel Ash Based
Concrete. Materials and Design.
Yusuf, M. O., Johari, M. A. M., Ahmad, Z. A., & Maslehuddin, M. (2014). Effects of
addition of Al(OH)3 on the strength of alkaline activated ground blast furnace
slag-ultrafine palm oil fuel ash (AAGU) based binder. Construction and Building
Materials, 50(0), 361-367.
Zhang, M., & Malhotra, V. (1995). Characteristics of a thermally activated alumino-
silicate pozzolanic material and its use in concrete. Cement and Concrete
Research, 25(8), 1713-1725.
Zhang, Z.-h., Yao, X., Zhu, H.-j., Hua, S.-d., & Chen, Y. (2009). Preparation and
mechanical properties of polypropylene fiber reinforced calcined kaolin-fly ash
based geopolymer. Journal of Central South University of Technology, 16(1), 49-
52.
Žvironaitė, J., Pundienė, I., Gaidučis, S., & Kizinievič, V. (2012). Effect of different
pozzolana on hardening process and properties of hydraulic binder based on
natural anhydrite. Journal of Civil Engineering and Management, 18(4), 530-536.

112
LIST OF PUBLICATIONS
Journal articles
Bashar, I. I., Alengaram, U. J., Jumaat, M. Z., & Islam, A. (2014). The effect of variation
of molarity of alkali activator and fine aggregate content on the compressive strength of
the fly ash – palm oil fuel ash based geopolymer mortar. Advances of Materials Science
and Engineering (Under review)
Islam, A., Alengaram, U. J., Jumaat, M. Z., & Bashar, I. I. (2014). The development of
compressive strength of ground granulated blast furnace slag-palm oil fuel ash-fly ash
based geopolymer mortar. Materials and Design, 56, 833-841. doi:
http://dx.doi.org/10.1016/j.matdes.2013.11.080 (Published)
Conference papers
Bashar, I. I., Alengaram, U. J., Jumaat, M. Z., & Islam, A. (2014, 24th - 26th November
2014). The development of sustainable geopolymer mortar from fly ash-palm oil fuel ash
based binder and manufactured sand. Paper will be presented at the International
Conference on Construction Materials and Structures (ICCMATS), Johannesburg,
South Africa. (Accepted abstract)
Islam, A., Alengaram, U. J., Jumaat, M. Z., & Bashar, I. I. (2014, 24th - 26th November
2014). Development of structural grade geopolymer concrete using palm oil fuel ash and
blast furnace slag as binders. Paper will be presented at the International Conference
on Construction Materials and Structures (ICCMATS), Johannesburg, South Africa.

113
APPENDIX A
Calculation of Alkaline solution
Estimation of chemicals
Binder weight, g 80000 Molarity NaOH NaOH Reference
Alkaline solution / Binder 0.4 (by weight) pellet, g solution, g
liquid Na2SiO3 / NaOH solution 2.5 (by weight) 8 262
1000
Hardjito
PhD thesis
10 314
Estimated chemical weight, g 12 361
Alkaline solution 32000 14 404
liquid Na2SiO3 / NaOH solution 22857 16 444
NaOH solution 9143 14 404 Calculation
NaOH molarity, M 14 NaOH pellet in 1 kg solution, g 404
NaOH pellet 3694
Liquid Na2SiO3 22857
Molarity NaOH pellet in 1 kg solution, g
14 399.7 Exponential
402.4 Linear
405.1 Logarithmic
404.4 Polynimial - 2 order
403.9 Polynimial - 3 order
403.9 Polynimial - 4 order
403.5 Power
250
290
330
370
410
450
8 10 12 14 16
NaO
H p
elle
t in
1 k
g
solu
tio
n,
g
Molarity

114
Calculation for Mix design 1
Material POFA FA Sand M-sand QD Alkaline solution Water
Specific gravity 2.2 2.4 2.77 1.97 2.09 1.18 1
density (kg/m3) 2200 2400 2770 1970 2090 1180 1000
Mix ID
Binder Fine Aggregate Alkaline solution Water Total
POFA FA Sand M-Sand Q-Dust
Proportion by weight (g)
N100 720 720 2160 0 0 576 288 4464
N75-M25 720 720 1620 540 0 576 288 4464
N25-M75 720 720 540 1620 0 576 288 4464
M100 720 720 0 2160 0 576 288 4464
M75-Q25 720 720 0 540 1620 576 288 4464
M25-Q75 720 720 0 1620 540 576 288 4464
Q100 720 720 0 0 2160 576 288 4464
N25-Q75 720 720 540 0 1620 576 288 4464
N75-Q25 720 720 1620 0 540 576 288 4464
N50-M25-Q25 720 720 1080 540 540 576 288 4464
N25-M50-Q25 720 720 540 1080 540 576 288 4464
N25-M25-Q50 720 720 540 540 1080 576 288 4464
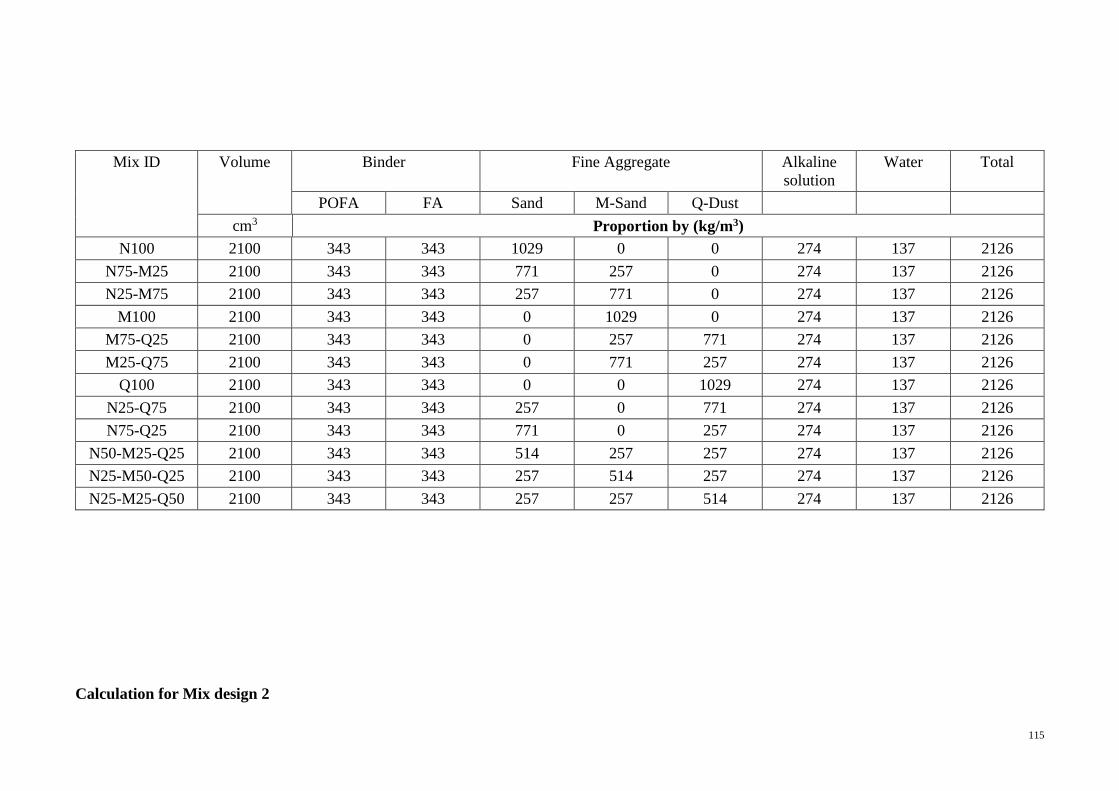
115
Mix ID
Volume Binder Fine Aggregate Alkaline
solution
Water Total
POFA FA Sand M-Sand Q-Dust
cm3 Proportion by (kg/m3)
N100 2100 343 343 1029 0 0 274 137 2126
N75-M25 2100 343 343 771 257 0 274 137 2126
N25-M75 2100 343 343 257 771 0 274 137 2126
M100 2100 343 343 0 1029 0 274 137 2126
M75-Q25 2100 343 343 0 257 771 274 137 2126
M25-Q75 2100 343 343 0 771 257 274 137 2126
Q100 2100 343 343 0 0 1029 274 137 2126
N25-Q75 2100 343 343 257 0 771 274 137 2126
N75-Q25 2100 343 343 771 0 257 274 137 2126
N50-M25-Q25 2100 343 343 514 257 257 274 137 2126
N25-M50-Q25 2100 343 343 257 514 257 274 137 2126
N25-M25-Q50 2100 343 343 257 257 514 274 137 2126
Calculation for Mix design 2

116
Material POFA FA MK M-sand COPS Alk. Sol. Water
S.G. 2.2 2.34 2.5 2.67 1.33 1.15 1
Density
(kg/m3)
2200 2340 2500 2670 1330 1150 1000
Mixture ID Binder Binder Aggregate Alkaline
solution
Water
POFA FA MK POFA FA MK M-sand COPS
Proportion of Binders (%) Proportion by weight (kg)
P10-F85-M05 10 85 5 4 34 2 45 15 16 7.2
P10-F80-M10 10 80 10 4 32 4 45 15 16 7.2
P10-F75-M15 10 75 15 4 30 6 45 15 16 7.2
P10-F70-M20 10 70 20 4 28 8 45 15 16 7.2
P10-F65-M25 10 65 25 4 26 10 45 15 16 7.2
P90-M10 90 0 10 36 - 4 45 15 16 7.2
P80-M20 80 0 20 32 - 8 45 15 16 7.2
P70-M30 70 0 30 28 - 12 45 15 16 7.2
P60-M40 60 0 40 24 - 16 45 15 16 7.2
Mixture ID Binder Aggregate Water Total

117
POFA FA MK M-sand COPS Alkaline
solution
Proportion by (kg/m3)
C 1 60 507 30 672 224 239 107 1839
C 2 60 478 60 672 224 239 107 1839
C 3 60 448 90 672 224 239 107 1839
C 4 60 418 119 672 224 239 107 1839
C 5 60 388 149 672 224 239 107 1839
C 6 537 - 60 672 224 239 107 1839
C 7 478 - 119 672 224 239 107 1839
C 8 418 - 179 672 224 239 107 1839
C 9 358 - 239 672 224 239 107 1839
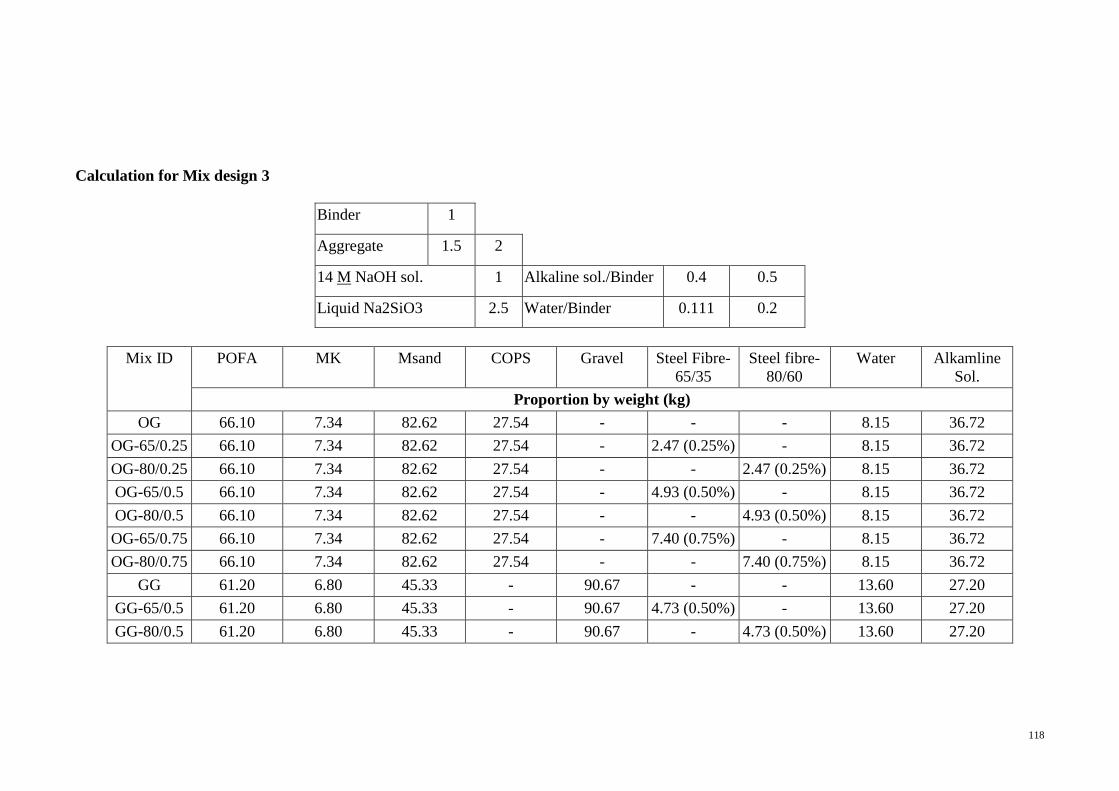
118
Calculation for Mix design 3
Binder 1
Aggregate 1.5 2
14 M NaOH sol. 1 Alkaline sol./Binder 0.4 0.5
Liquid Na2SiO3 2.5 Water/Binder 0.111 0.2
Mix ID
POFA MK Msand COPS Gravel Steel Fibre-
65/35
Steel fibre-
80/60
Water Alkamline
Sol.
Proportion by weight (kg)
OG 66.10 7.34 82.62 27.54 - - - 8.15 36.72
OG-65/0.25 66.10 7.34 82.62 27.54 - 2.47 (0.25%) - 8.15 36.72
OG-80/0.25 66.10 7.34 82.62 27.54 - - 2.47 (0.25%) 8.15 36.72
OG-65/0.5 66.10 7.34 82.62 27.54 - 4.93 (0.50%) - 8.15 36.72
OG-80/0.5 66.10 7.34 82.62 27.54 - - 4.93 (0.50%) 8.15 36.72
OG-65/0.75 66.10 7.34 82.62 27.54 - 7.40 (0.75%) - 8.15 36.72
OG-80/0.75 66.10 7.34 82.62 27.54 - - 7.40 (0.75%) 8.15 36.72
GG 61.20 6.80 45.33 - 90.67 - - 13.60 27.20
GG-65/0.5 61.20 6.80 45.33 - 90.67 4.73 (0.50%) - 13.60 27.20
GG-80/0.5 61.20 6.80 45.33 - 90.67 - 4.73 (0.50%) 13.60 27.20

119
Mix ID
POFA MK Msand COPS Gravel Steel Fibre-
65/35
Steel fibre-
80/60
Water Alkamline
Sol.
Proportion by weight (kg/m3)
OG 529 59 662 221 - - - 65 294
OG-65/0.25 528 59 660 220 - 19.75 - 65 293
OG-80/0.25 528 59 660 220 - - 19.75 65 293
OG-65/0.5 527 59 658 219 - 39.50 - 65 293
OG-80/0.5 527 59 658 219 - - 39.50 65 293
OG-65/0.75 525 58 657 219 - 59.25 - 65 292
OG-80/0.75 525 58 657 219 - - 59.25 65 292
GG 512 57 379 - 758 - - 114 227
GG-65/0.5 512 57 379 - 758 39.50 - 113 226
GG-80/0.5 512 57 379 - 758 - 39.50 113 226

120
APPENDIX B
Photo B.1: Palm oil bunch Photo B.2: Palm oil fibre and shell before burning
Photo B.3: Processing of separating shell Photo B.4: Collection of POFA
Photo B.5: Preparation of NaOH solution for trial Photo B.6: Liquid sodium silicate

121
Photo B.7: Curing oven Photo B.8: Liquid sodium silicate
Photo B.9: Outer surface of OPS Photo B.10: Inner surface of OPS
Photo B.11: Broken prisms after flexure test Photo B.12: Broken cylinder after splitting test

122
Photo B.13: Preparation of moulds for casting
Photo B.14: OPSGC for casting Photo B.15: Casting completed, specimen after
vibration
Photo B.16: Preparation for fracture test Photo B.17: Arrangement of fracture test