ifrs primer - financialstatement.nelson.comfinancialstatement.nelson.com/ifrs_primer.pdf ·...
TRANSCRIPT

Prepared by
Irene M. HerremansHaskayne School of Business, University of Calgary
IFRS Primer

Vice President, Editorial Director:Evelyn Veitch
Editor-in-Chief, Higher Education:Anne Williams
Senior Acquisitions Editor:Craig Dyer
Marketing Manager:Kathaleen McCormick
Developmental Editor:Toula Kanellopoulos
Photo Researcher and Permissions Coordinator:Natalie Russell
Content Production Manager:Christine Gilbert
Copy Editor:Matthew Kudelka
Proofreader:Matthew Kudelka
Production Coordinator:Ferial Suleman
Managing Designer:Franca Amore
Interior Design:Nelson Gonzalez
Compositor:Pamela Clayton
Printer:Transcontinental
IFRS Primer
Prepared by Irene M. Herremans
COPYRIGHT © 2010 by Nelson Education Ltd.
Printed and bound in Canada1 2 3 4 12 11 10 09
For more information contactNelson Education Ltd.,1120 Birchmount Road, Toronto,Ontario M1K 5G4. Or you can visitour Internet site at http://www.nelson.com.
ALL RIGHTS RESERVED. No part ofthis work covered by the copyrightherein, except for any reproduciblepages included in this work, maybe reproduced, transcribed, orused in any form or by any means—graphic, electronic, or mechanical,including photocopying, recording,taping, Web distribution, orinformation storage and retrievalsystems—without the writtenpermission of the publisher.
For permission to use materialfrom this text or product, submit all requests online at www.cengage.com/permissions.Further questions aboutpermissions can be e-mailed [email protected].
Every effort has been made totrace ownership of all copyrightedmaterial and to secure permissionfrom copyright holders. In theevent of any question arising as tothe use of any material, we will bepleased to make the necessarycorrections in future printings.

Thanks to Wayne Irvine and Jamal Nazari for their review of this document and
to Monica Ha for help in its preparation.


After studying this primer, youshould be able to:
LO 1 Understand, in general, whatinternational GAAP is.
LO 2 Comprehend the advantages anddisadvantages of changing from acountry’s own GAAP to internationalGAAP.
LO 3 Provide examples of why internationalGAAP is useful.
LO 4 Comprehend how international GAAP isdeveloped.
Who are the major players?
How does an accounting standardbecome generally accepted?
Who wants international GAAP andwhy?
Which countries currently use IFRS andwhich countries are considering it?
LO 5 Detect differences in format betweenstatements using international GAAPand Canadian GAAP.
LO 6 Identify distinctions betweeninternational GAAP and Canadian GAAP.
LO 7 Interpret financial ratios for a company,considering the country context of itsheadquarters.
LEARNING OBJECTIVES
IKEA is a manufacturing and retail company that offers affordable, well-designed home furnishings in a socially responsible manner. IKEA has devel-oped its own code of conduct, referred to as “The IKEA Way of PurchasingHome Furnishing Products,” or IWAY. Perhaps you have been in an IKEAstore at some time. IKEA stores can be found globally. But did you know thatwhen you picked up your favourite picture frame, bought some bookshelves,or ate in an IKEA restaurant, a complex web of manufacturing, distribution,and retail organizations was working all over the world to get the products toyour local store?
IKEA consists of the following:
■ 253 IKEA stores in 24 countries;
■ 27 distribution centres and 11 customer distribution centres in 16 coun-tries;
■ 41 trading service offices in 30 countries; and
■ 1,380 suppliers in 54 countries.
IKEA Industrial Group employs more than 17,100 workers in 49 factoriesand sawmills in 11 countries.
The countries that are IKEA’s best customers are China (18%), Poland(12%), Sweden (8%), Italy (7%), and Germany (6%). IKEA’s products aremade in Europe (64%), Asia (33%), and North America (3%).
When you picked up those bookshelves at IKEA you probably did not givemuch thought to the company’s accounting system and how it must collectaccounting data from its subsidiaries, customers, and suppliers in a variety ofdifferent countries, all with potentially different generally acceptedaccounting principles (GAAP). This process could be a nightmare! It wouldrequire someone with special expertise in the GAAP used by each countrywho knew how to translate the financial data from the country of operationsto the country of headquarters (e.g., from Canada to Sweden, or from Chinato Sweden).
As countries transition from their own unique GAAP to the InternationalFinancial Reporting Standards (IFRS), companies will no longer need totranslate financial data from another country’s GAAP to the GAAP of theircountry of operations; furthermore, users of financial data will find it easierto understand financial reports from different countries.
Using IFRS will mean that reporting will be similar. Every company willbe using the same GAAP to report its financial information. But even IFRSprovides for choices as to how to report financial information.
Since Canadian companies will be using IFRS by 2011 (for comparativepurposes, by 2010), it is important to understand the background of the stan-dards.
NEL
INTRODUCTION
IFRS PRIMER FOR CANADA

2 IFRS Primer for Canada
As you study accounting, you might get the perception that the principles and proce-dures you are learning have been around for many, many years and that they neverchange. Well, you would be partly right. The basis for double-entry accounting wasestablished by a Franciscan monk from Italy named Pacioli in the 1400s. From there,double-entry accounting spread to other countries in Europe and eventually to NorthAmerica, Asia, and other countries of the world. As some European countries, such asFrance, Spain, and Great Britain, established colonies throughout the world, the mothercountry influenced the accounting practices in those colonies. Then, as those coloniesachieved their independence, they changed their accounting systems somewhat toaccommodate their own unique needs. Accounting must constantly adapt to develop-ments in the business world. As companies involve themselves in more global transac-tions, accounting must adjust.
Even today, many countries have their own GAAP and have not adopted IFRS. Onlyin recent decades has interest grown in accepting IFRS and in ensuring that accountingstandards are more comparable among nations. Why has it taken so long for countriesto accept one set of accounting standards, when it seems like such a good idea?
Well, there are both advantages and disadvantages to having only one GAAP world-wide. Let’s understand what those are.
NEL
WHAT IS INTERNATIONAL GAAP?
LO 1 Understand, in general,what international GAAP is.
WHY A UNIQUE GAAP FOR EACH COUNTRY?
LO 2 Comprehend theadvantages and disadvantages ofchanging from a country’s own GAAPto international GAAP.
Countries vary in the manner in which business is carried out. Business practices areinfluenced by a given country’s legal and political system. That system then determineswhich types of business ownership and financial instruments are allowed. Anaccounting system reflects how business is conducted. It follows that each country’saccounting system will be unique because it is based on the types of industries withinthat country, the types of transactions in which those industries engage, the level of eco-nomic development in the country, cultural norms, and the types of individuals andorganizations that own the corporations.
Different industries predominate in different countries; certain types of transac-tions are then developed to account for activities in those industries. For example, acountry that does not have a nuclear industry will not need accounting principles thatdeal with that sector’s unique transactions.
As countries become more advanced economically, their companies use moresophisticated financial instruments to conduct business. For example, if a country doesnot allow the use of stock options (an option to buy stock based on some conditions) asa form of employee compensation, then the accounting system will not need to accountfor stock options. And if a country does allow stock options, it may only allow the useof a simple instrument, sometimes referred to as “plain vanilla.” More sophisticatedstock options, referred to as “exotic instruments,” may have many complexities. Again,the accounting system must adjust so that it reflects the sophistication of the businesstransactions that are taking place in the country at hand. So when a country choosesIFRS rather than its own GAAP, it may be trading relevance to its unique business envi-ronment in return for comparability of financial statements worldwide.
Question: How might accounting systems differ as a result of differences in politicalsystems?
Possible Answer: Political Systems
A centrally planned economy (such as in a communist country like China or Cuba)would be less concerned about individual company profitability than would a marketeconomy (such as in Canada or the United States).

IFRS Primer for Canada 3
Question: Can you think of other characteristics that might reflect differences in polit-ical systems? And how might accounting systems differ based on types of corporateownership?
Possible Answer: Corporate Ownership
Some countries allow companies to issue different types of stock (e.g., common or pre-ferred). Also, some countries allow a corporation to buy back some of its own stock;others do not. Countries differ as well regarding what happens when a company isfailing financially—for example, whether it can declare bankruptcy. In Canada and theUnited States, many citizens own stock indirectly in pension plans, mutual funds, orpersonal investment accounts. In other countries, such as Germany and Japan, there isless individual ownership of stock in corporations and more ownership by financialinstitutions and other businesses. A country’s accounting system must accommodatethe types of transactions in which corporations engage within its boundaries.
Question: Can you think of other characteristics that could differ owing to types ofcorporate ownership?
NEL
WHY ONLY ONE GAAP FOR ALL COUNTRIES?
LO 3 Provide examples of whyinternational GAAP is useful.
As a result of globalization, companies have become more dependent on one another.They buy and sell internationally. They receive payments in foreign currency. Theirinvestors may reside all over the world, not just in their home country. Companies selltheir stock on a number of different stock exchanges, each of which is governed by a dif-ferent set of laws and regulations. For example, many Canadian companies sell theirstock on both the Toronto Stock Exchange and the New York Stock Exchange. In turn,U.S. companies sell their stocks on both Canadian and U.S. stock exchanges.
Because of this dependency, companies that use different GAAP to prepare theirfinancial statements find it difficult to analyze situations and make decisions. Someexamples:
■ How can a manager in Canada know whether a potential client in Spain is finan-cially stable?
■ How can a Brazilian investor compare the financial ratios of Nike of the UnitedStates with those of Adidas of Germany?
■ How can a Japanese bank know which companies are consolidated (included) in aChinese company’s financial statements?
■ If a French company wants to sell its stock through the New York Stock Exchange,how can it do so without incurring the cost of translating its financial statements toU.S. GAAP?
From the above examples you can see that IFRS financial statements offer advan-tages to both preparers (operating companies) and users (mainly investors and credi-tors). Preparers spend less time preparing financial statements to conform to differentGAAP when securing financing for their businesses. Users are less confused about whichcompanies are actually performing better. As well, when so many different methods areused for financial statement preparation, one might wonder how credible the entireaccounting profession is.
For example, the terms “revenues” or “sales” are often used in North America,whereas “turnover” is more common in Europe. “Reserves” and “provisions” are oftenencountered on European financial statements but not on North American ones. Somecompanies refer to “depreciation” rather than “amortization” to indicate the deteriora-tion or the slow wearing out of an asset over several years. Why are there so many dif-ferent terms for the same accounts?

4 IFRS Primer for Canada NEL
WHERE DO IFRSs COME FROM?
LO 4 Comprehend howinternational GAAP is developed.
There are so many countries with different cultures, traditions, capital structures, andways of doing business that one might wonder how they can ever reach agreement onwhat should be accepted as an IFRS.
Well, the process has evolved slowly. By 1959 some accounting professionals werehaving thoughts about international accounting standards. Subsequently, efforts beganto reduce the differences among countries. In 1973 an International AccountingStandards Committee (IASC) was created, which began to develop InternationalAccounting Standards (IAS). In 1977 an international association of professionalaccountants was founded. Europe moved forward more quickly than North America onharmonizing accounting standards. At the time, Europe had many diverse countries, allof them following different GAAP. As European countries eliminated many barriers todoing business among themselves, they attempted to eliminate barriers to under-standing financial statements. Canada and the United States had already been workingto eliminate some of their accounting differences, given their high level of trade.However, major differences continued to exist between North America and Europe.
As the IASC began to provide standards, countries resisted abandoning theirnational standards, for each felt that its domestic standards were more suitable than theinternational ones. But at the same time, many countries began to compare their ownstandards with the international ones to determine how different they were. A majoradvance occurred when stock exchanges began to allow foreign companies using IAS tolist securities on their exchanges without having to translate their statements into localGAAP. Note that pronouncements previous to 2001 are still referred to as IAS and arestill in effect; pronouncements after 2001 are called IFRS. The two sets are equally valid.
As 2000 approached, major restructuring took place in the organizations involvedin promoting international accounting standards. The International AccountingStandards Committee (IASC) was turned into a foundation, and an independent stan-dards-setting board called the International Accounting Standards Board (IASB) wasdeveloped. The IASC Foundation appoints and governs the members of the IASB. Toensure appropriate representation, the foundation trustees include representatives fromEurope, North America, Asia/Oceania, South America, and Africa.
The IASB members, as well as the trustees, represent many different types of organ-izations. They include university professors and members of standards-setting boardsfrom specific countries, as well as representatives of multinational companies, securitiesregulators, and international public accounting firms.
Other organizations related to the standards-setting process have also been devel-oped. The IASC Foundation is accountable to a Monitoring Board consisting of capitalmarket authorities; a Standards Advisory Council (SAC) advises the IASB. Also, aninterpretations committee (IFRIC) helps provide interpretation to the IASB. All of theseorganizations help develop IFRS.

IFRS Primer for Canada 5
European countries were the first to require listed companies (i.e., those sellingsecurities to the public) to adopt IFRS, in 2005. Since that year, Australia, Hong Kong,New Zealand, China, Brazil, Canada, Chile, India, Japan, Korea, Israel, Malaysia, Mexico,Singapore, Russia, Turkey, and the United States either have adopted or are preparing toadopt IFRS. Others are ensuring that their GAAP is in line with IFRS. More than 100countries either require their listed companies to use IFRS or permit the use of IFRS ontheir stock exchanges.
NEL
Who Develops IFRS?
High quality, enforceable, and global
SAC
Monitoring
Board
Approves Trustees
Technically advises Interprets
Monitors
AppointsA
ppoi
nts A
ppointsInforms
Creates
Funds
Reviewseffectiveness
Reports to
Info
rms
IFRICIASB
IFRS
IASC Foundation
Source: IASB and the IASC Foundation, Who we are and what we do; page 2; http://www.iasb.org/NR/rdonlyres/95C54002-7796-4E23-A327-28D23D2F55EA/0/April09Whoweareandwhatwedo.pdf

6 IFRS Primer for Canada
Even though the United States has not provided a definite date for implementingIFRS, the Financial Accounting Standards Board (FASB) is working diligently with theIASB to ensure the acceptability of IFRS for the United States. So it is likely there will bechanges to IFRS in the near future as the two standards-setting boards work together toimprove both IFRS and U.S. GAAP. The United States has already eliminated the needto reconcile IFRS to U.S. GAAP for foreign companies listing securities in the UnitedStates and is accepting financial statements prepared under IFRS. At one time, Canadiancompanies listed on U.S. exchanges prepared reconciliations from Canadian to U.S.GAAP. After 2011 this reconciliation will no longer be required because Canada will beusing IFRS.
Accounting Communication—An Introduction
Who Must Report Their Financial Information Using IFRS Startingin 2011? All publicly accountable enterprises must use IFRS. A publicly account-able enterprise is a for-profit business whose debt or equity is traded in a public market,such as an exchange (e.g., the Toronto Stock Exchange). A publicly accountable enter-prise that holds assets for someone else—such as a bank, an insurance company, or aninvestment company—must also use IFRS. For example, a bank may hold money in asavings account or a chequing account for its customers. At this time, nonbusiness enti-ties—such as not-for-profit organizations, governments, and other public-sector enti-ties—are excluded from IFRS requirements. However, it is likely that nonbusinessentities will have to comply at some future time.
NEL
How Prevalent Are IFRS?
Countries that requireor permit IFRSs fordomestic entities
Countries seekingconvergence with,or pursuing adoptionof, IFRSs
Source: IASB and the IASC Foundation, Who we are and what we do; page 4; http://www.iasb.org/NR/rdonlyres/95C54002-7796-4E23-A327-28D23D2F55EA/0/April09Whoweareandwhatwedo.pdf

IFRS Primer for Canada 7
Financial Statements and the Annual Report
Reliability Versus Relevance: Cost Versus Fair Value Sometimeschoosing accounting principles requires choosing among qualitative characteristics.One major difference between Canadian GAAP and IFRS is the choice to use fair valuerather than historical cost (see LO6). Under Canadian GAAP, assets are generallyrecorded at the cost of purchase. As they lose value or are consumed in the operatingprocess, they are depreciated or amortized. The principle of conservatism suggests thatif assets are damaged or impaired in some manner, causing them to lose value morequickly than they would through normal wear and tear, then the original cost for theasset must be decreased to reflect the fair value (fair market value). The fair market valuerepresents the ultimate amount obtained (net realizable value) through a market trans-action. However, when assets increase in value above the original cost, under CanadianGAAP the value in the account is not increased, even though the fair value of the assetcould be more relevant for making decisions. Under Canadian GAAP, reliability is thefirst priority.
The reason for this principle relates to the trade-off between reliability and rele-vance. The original cost is verifiable through a purchase or sales document—thus morereliable. In contrast, the fair value is difficult to determine because there is no businessdocument to determine what value would occur in the market. The asset is not sold, buta fair value (or what the business could get for the asset if it were sold in the market)must be determined; therefore determining the value is more subjective (but possiblymore relevant) than determining the original cost. Because of these differences, IFRSprovides guidelines for determining the fair value in order to balance reliability with rel-evance. Under IFRS, relevance is the first priority.
Think about the purchase price (original cost) versus the fair value of a house.Which would be more relevant, and why? During a recession many home valuesdecrease; indeed, some decrease below the original cost of the purchase. During agrowth period, many homes increase to above the purchase price. If you were a bank,which amount would be most relevant?
Since the 2008 financial crisis many businesses have been questioning the appropri-ateness of using fair value for financial instruments—such as mortgages—recorded infinancial statements. Some say that fair value is not a true representation of the value ofthese assets because the values are too conservative.
NEL
CHANGE IN FORMAT OF BALANCE SHEET
LO 5 Detect differences informat between statements usinginternational GAAP and CanadianGAAP.
Under Canadian GAAP, assets are normally listed in order of liquidity—that is, howsoon they can be converted into cash or consumed in the operating process. Thereforecurrent assets are listed before noncurrent assets, such as property, plant, and equip-ment. In contrast, under IFRS the noncurrent assets are listed first, followed by the cur-rent assets—just the reverse of Canadian GAAP.
A similar format is used for liabilities. Under Canadian GAAP current liabilities arenormally listed in the order that payment is required (i.e., as they mature). Thosecoming due first are listed first. In contrast, under IFRS, long-term debt (liabilities) islisted first, followed by current liabilities.
Even though the ordering on the balance sheet is different, what is defined as a cur-rent asset and a current liability is generally consistent between Canadian GAAP andIFRS.

8 IFRS Primer for Canada NEL
Air Canada 2007 Annual Report, Consolidated Statement of Financial Position (prepared under Canadian GAAP)
2007 Air Canada Annual Report
80
CONSOLIDATED STATEMENT OF FINANCIAL POSITION
As at December 31(Canadian dollars in millions) 2007* 2006
ASSETS Current
$ $ Note 2PCash and cash equivalents Note 2QShort-term investments
109 Note 2RRestricted cash 886 Note 19Accounts receivable 841 Spare parts, materials and supplies421 Note 19Prepaid expenses and other current assets 535 Note 3Prepaid maintenance to ACTS 543 Note 9Future income taxes
2,478 4,194
Note 4Property and equipment Note 5
Deferred charges Note 6Intangible assets
Deposits and other assets
$ $
LIABILITIES Current
$ $ Note 19
Note 7
Advance ticket sales
Note 22Aeroplan miles obligation Current portion of long-term debt and capital leases Note payable to ACTS Current taxes payable
Non-controlling interest
Note 13Share capital Contributed surplus Retained earnings (deficit)
Note 2MAccumulated other comprehensive income
$ $
* Effective May 24, 2007, the results and financial position of Jazz are not consolidated within Air Canada (Note 1).The accompanying notes are an integral part of the consolidated financial statements. Commitments (Note 16); Contingencies, Guarantees and Indemnities (Note 18)
On behalf of the Board of Directors:
SHAREHOLDERS’ EQUITY
SignedRobert G. LongChair of the Audit, Finance and Risk Committe
SignedDavid I. RichardsonChairman
Accounts payable and accrued liabilities
Long-term debt and capital leasesFuture income taxesPension and other benefit liabilitiesOther long-term liabilities
527712
1,239
1,447798
2,245
7,91951
952437
11,837
1,2431,245
55413
--
2,956
4,00688
1,824336
9,210
184
2741,791
32256
2,443
11,837
2741,693(115)
-1,852
11,749
3,196134
1,876472
9,523
374
1,5211,019
58367535345
3,845
5,946103
1,194312
11,749
124750112253
--
Source: Air Canada Annual Report 2007, page 80; www.aircanada.com
IFRS Primer for Canada 9NEL
SA
S G
roup 2
007 A
nnual
Report
, B
ala
nce S
heet
(pre
pare
d u
nder
IFR
S)
AS
SE
TS
, M
SE
K
No
te
2
007
2006
SHA
REH
OLD
ERS’
EQ
UIT
Y A
ND
LIA
BIL
ITIE
S, M
SEK
N
ote
2007
2
006
TOTA
L SH
AR
EHO
LDER
S’ E
QU
ITY
AN
D L
IAB
ILIT
IES
4
8,77
0
51,
164
Fixe
d a
sset
sIn
tang
ible
ass
ets
Tang
ible
fix
ed a
sset
sLa
nd a
nd b
uild
ings
Airc
raft
Spar
e en
gine
s an
d sp
are
part
sW
orks
hop
and
airc
raft
ser
vici
ng e
quip
men
tO
ther
equ
ipm
ent
and
vehi
cles
Con
stru
ctio
n in
pro
gres
sPr
epay
men
ts r
elat
ing
to t
abgi
ble
fixed
ass
ets
Fin
anci
al f
ixed
ass
ets
Equi
ty in
aff
iliat
ed c
ompa
nies
Long
-ter
m r
ecei
vabl
es f
rom
aff
iliat
ed c
ompa
nies
Oth
er h
oldi
ngs
of s
ecur
ities
Pens
ion
fund
s, n
etD
eFer
red
tax
rece
ivab
leO
ther
long
-ter
m r
ecei
vabl
es
Cu
rren
t as
sets
Expe
ndab
le s
pare
par
ts a
nd in
vent
orie
sPr
epay
men
ts t
o su
pplie
rs
12 13 14 15 16 17 18 10 1984
9 199
3 3
1,22
6
568
10,7
661,
211
226
308
172
185
13,4
36
1,64
517
01,
466
13,8
49
17,1
30 693
2.07
93,
936 59
3,75
569
1 61
716
7,13
55,
685 57
3,47
360
317
8
1917
,149
2216
,388
1,64
517
01,
312
13,2
39
16,3
66
24
1,06
317
0 59,
496
690
577
12,0
01
26,6
63 850
996
Cu
rren
t re
ceiv
able
sA
ccou
nt r
ecei
vabl
esRe
ceiv
able
s fr
om a
ffili
ated
com
pani
esO
ther
rec
eiva
bles
Prep
aid
expe
nses
and
acc
rued
inco
me
20 21 22
1,95
151
02,
637
1,07
0
6,16
8
3,91
835
72,
767
1,13
4
8,17
6
Shor
t-te
rm in
vest
men
tsC
ash
and
bank
bal
ance
sA
sset
s he
ld f
or s
ale
Tota
l cu
rren
t as
sets
23 11
7,30
81,
586
6,19
8
22,1
07
9,11
71,
686
19,9
75
31,1
89
1,01
218
960
18,
805
1,37
81,
331
13,3
16
2,93
2
684
11,3
301,
383
215
634
378
317
14,9
41
Tota
l fix
ed a
sset
s
TOTA
L A
SSET
S48
,770
51,1
64
SAS
Gro
up b
alan
ce s
heet
Shar
eho
lder
s’ e
qu
ity
Shar
e ca
pita
lO
ther
con
trib
uted
cap
ital
Rese
rves
Reta
ined
ear
ning
s
Tota
l sh
areh
old
ers’
eq
uit
y at
trib
uta
ble
to
Par
ent
Co
mp
any
ow
ner
s
Lon
g-t
erm
liab
iliti
esSu
bord
inat
ed lo
ans
Bond
issu
esO
ther
loan
sPe
nsio
ns a
nd s
imila
r co
mm
itmen
tsD
efer
red
tax
liabi
lity
Oth
er p
rovi
sion
sO
ther
liab
ilitie
s
Cu
rren
t lia
bili
ties
Cur
rent
por
tion
of lo
ng-t
erm
loan
sSh
ort-
term
loan
sPr
epay
men
ts f
rom
cus
tom
ers
Acc
ount
s pa
yabl
eLi
abili
ties
to a
ffili
ated
com
pani
esTa
x pa
yabl
eU
near
ned
tran
spor
tatio
n re
venu
eC
urre
nt p
ortio
n of
oth
er p
rovi
sion
sO
ther
liab
ilitie
sA
ccru
ed e
xpen
ses
and
prep
aid
inco
me
Liab
ilitie
s at
trib
utab
le t
o as
sets
hel
d fo
r sa
le
Min
ority
inte
rest
s
Tota
l sh
areh
old
ers’
eq
uit
y
25 26 27 28 10 30 31 32 33 30 34 11
1,61
542
132
02,
108 94 5
3,84
219
01,
580
5,14
95,
323
814
2,04
318
13,
350
169 43
3,39
531
81,
845
4,74
4 -
1
1,27
4
1
7,84
7
2
0,34
7
1
6,92
9
Book
equ
ity p
er s
hare
(SEK
) 1
104
.13
99.4
9
Info
rmat
ion
abou
t th
e G
roup
’s p
ledg
ed a
sset
s, c
ontin
gent
liab
ilitie
s an
dle
asin
g co
mm
itmen
ts is
giv
en in
Not
es35
, 36
and
37.
1C
alcu
late
d on
164
,500
,000
sha
res.
Sour
ce: S
AS
Gro
up
An
nu
al R
epor
t 20
07

10 IFRS Primer for Canada
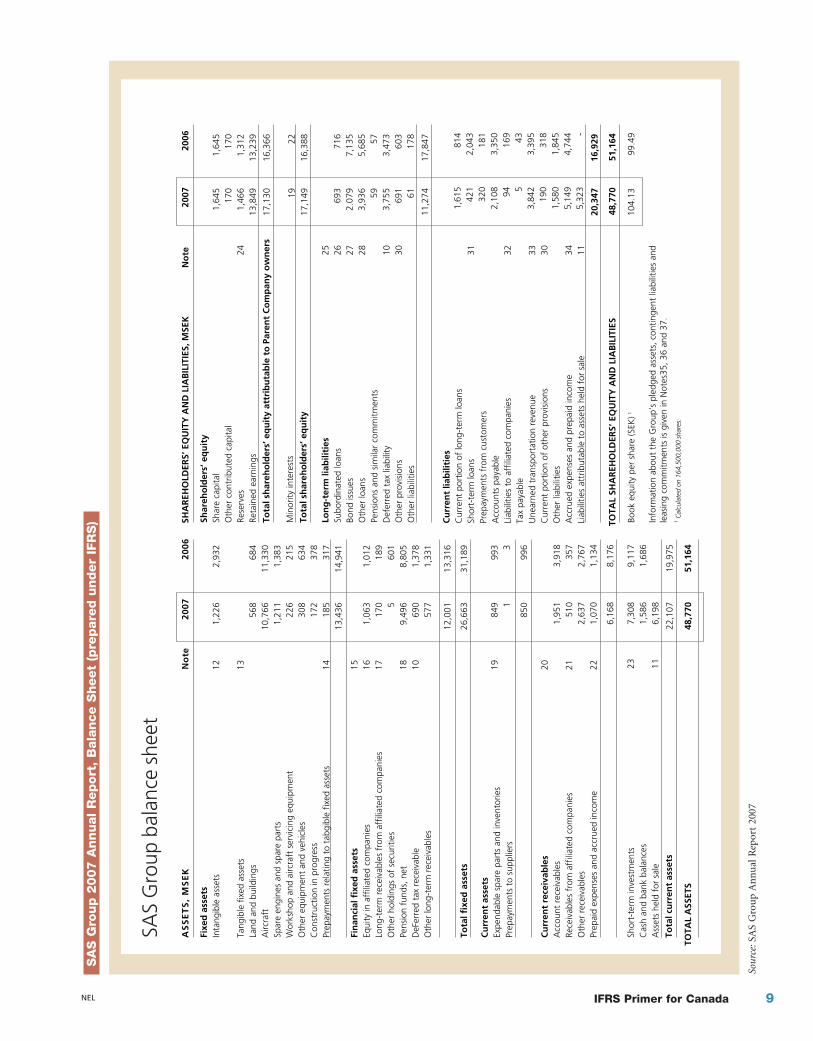
Compare the financial statements for SAS Airlines, based in Sweden, preparedaccording to IFRS, to those for Air Canada, based in Canada, prepared according toCanadian GAAP. What are the differences?
Note the following differences:
■ Air Canada lists Current Assets first on the Statement of Financial Position (a dif-ferent name for a Balance Sheet), whereas SAS lists Current Assets after Fixed Assets.
■ Cash, as the most liquid current asset, is the first asset under Current Assets for AirCanada, but Cash is far down the list of Current Assets for SAS.
■ Air Canada lists Current Liabilities, then Long-Term Liabilities, then Shareholders’Equity. SAS provides Shareholders’ Equity first, then Long-Term Liabilities, andfinally Current Liabilities.
■ Finally, note that SAS has an account titled Reserves in the Shareholders’ Equity sec-tion. This account name is not generally used under Canadian GAAP.
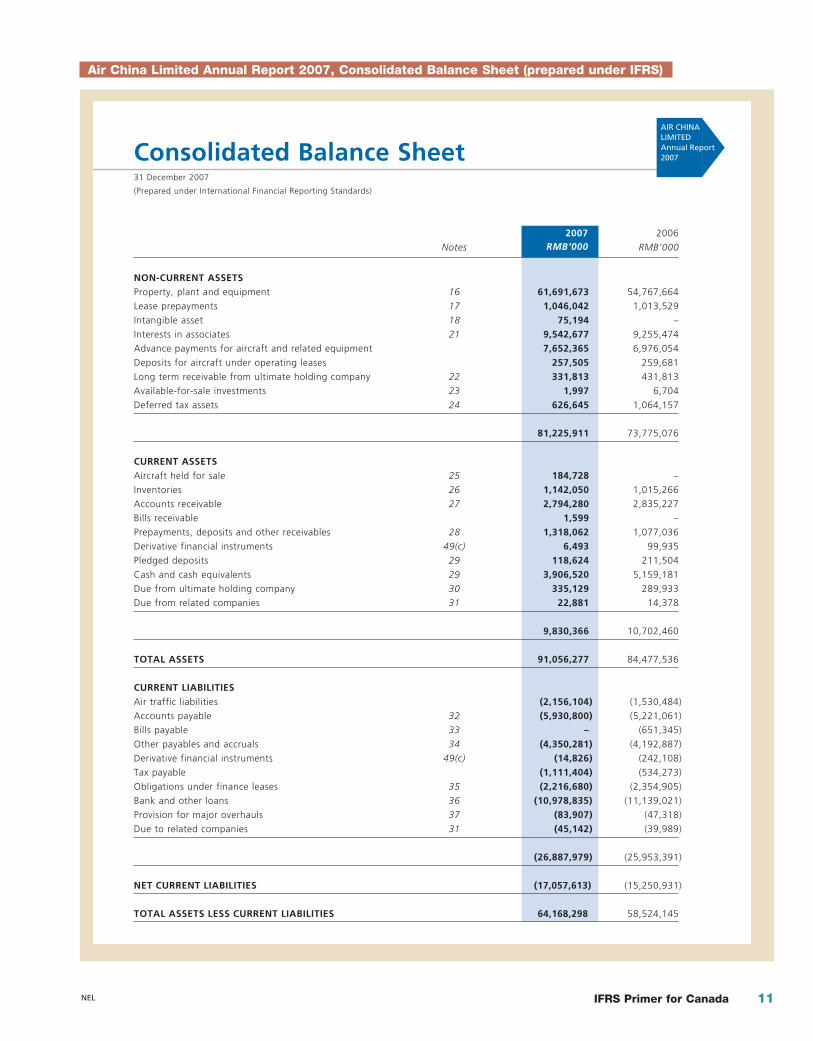
Now compare SAS Airlines with China Air, both prepared according to IFRS. Notethat China Air lists Fixed Assets first, followed by Current Assets. But then it lists CurrentLiabilities, followed by Non-Current Liabilities and Equity. This order gives the com-pany an opportunity to calculate working capital (the difference between current assetsand current liabilities) before showing the other liability and equity accounts. The dif-ference is labelled “Net Current Liabilities” because the amount for Current Liabilities isgreater than the amount for Current Assets. If the Current Assets amount were largerthan the Current Liabilities amount, the difference would be labelled “Net CurrentAssets.”
You will have noticed that the two financial statements, though both prepared usingIFRS, differed in some ways. Using IFRS does not mean that financial statements will bestandardized (i.e., that every element will be the same). The format of financial state-ments will still be influenced by the customs and traditions of a particular country.
NEL
IFRS Primer for Canada 11NEL
Air China Limited Annual Report 2007, Consolidated Balance Sheet (prepared under IFRS)
Consolidated Balance Sheet31 December 2007
(Prepared under International Financial Reporting Standards)
AIR CHINALIMITEDAnnual Report2007
2007RMB’000
2006
Notes RMB’000
NON-CURRENT ASSETSProperty, plant and equipment 16 61,691,673 54,767,664
Lease prepayments 17 1,046,042 1,013,529
Intangible asset 18 75,194 –
Interests in associates 21 9,542,677 9,255,474
Advance payments for aircraft and related equipment 7,652,365 6,976,054
Deposits for aircraft under operating leases 257,505 259,681
Long term receivable from ultimate holding company 22 331,813 431,813
Available-for-sale investments 23 1,997 6,704
Deferred tax assets 24 626,645 1,064,157
81,225,911 73,775,076
CURRENT ASSETSAircraft held for sale 25 184,728 –
Inventories 26 1,142,050 1,015,266
Accounts receivable 27 2,794,280 2,835,227
Bills receivable 1,599 –
Prepayments, deposits and other receivables 28 1,318,062 1,077,036
Derivative financial instruments 49(c) 6,493 99,935
Pledged deposits 29 118,624 211,504
Cash and cash equivalents 29 3,906,520 5,159,181
Due from ultimate holding company 30 335,129 289,933
Due from related companies 31 22,881 14,378
9,830,366 10,702,460
TOTAL ASSETS 91,056,277 84,477,536
CURRENT LIABILITIESAir traffic liabilities (2,156,104) (1,530,484)
Accounts payable 32 (5,930,800) (5,221,061)
Bills payable 33 – (651,345)
Other payables and accruals 34 (4,350,281) (4,192,887)
Derivative financial instruments 49(c) (14,826) (242,108)
Tax payable (1,111,404) (534,273)
Obligations under finance leases 35 (2,216,680) (2,354,905)
Bank and other loans 36 (10,978,835) (11,139,021)
Provision for major overhauls 37 (83,907) (47,318)
Due to related companies 31 (45,142) (39,989)
(26,887,979) (25,953,391)
(17,057,613)NET CURRENT LIABILITIES (15,250,931)
64,168,298TOTAL ASSETS LESS CURRENT LIABILITIES 58,524,145

12 IFRS Primer for Canada NEL
Air China Limited Annual Report 2007, Consolidated Balance Sheet (prepared under IFRS) (continued)
Consolidated Balance Sheet31 December 2007
(Prepared under International Financial Reporting Standards)
2007 2006
Notes RMB’000 RMB’000
NON-CURRENT LIABILITIESObligations under finance leases 35 (13,328,193) (11,247,855)
Bank loans, other loans and corporate bonds 36 (16,615,291) (12,701,977)
Provision for major overhauls 37 (1,190,415) (921,929)
Provision for early retirement benefits obligations (164,837) (201,199)
Long term payables 38 (190,005) (252,591)
Deferred income 39 (872,023) (948,966)
Deferred tax liabilities 24 (300,181) (513,935)
(32,660,945) (26,788,452)
NET ASSETS 31,507,353 31,735,693
EQUITY ATTRIBUTABLE TO EQUITY HOLDERSOF THE COMPANY
Issued share capital 40 12,251,362 12,251,362
Treasury shares 41 (1,283,492) (1,246,955)
Reserves 42 19,551,280 18,117,084
Proposed final dividend 14 837,987 602,767
31,357,137 29,724,258
MINORITY INTERESTS 150,216 2,011,435
TOTAL EQUITY 31,507,353 31,735,693
gnehC naFgnaijnaiJ iaCrotceriDrotceriD
Source: Air China Limited Annual Report, 2007, pages 53 and 54; www.airchina.com

IFRS Primer for Canada 13
Names of Financial Statements The most common names for the financialstatements under Canadian GAAP are the following:
■ Statement of Income
■ Statement of Comprehensive Income
■ Balance Sheet
■ Statement of Changes in Shareholders’ Equity or Statement of Retained Earnings
■ Statement of Cash Flows
Under IFRS the names may change slightly. Instead of having two separate incomestatements—one for recognized income, another for comprehensive income—IFRSrequires one Statement of Comprehensive Income that includes both recognizedincome (“profit” is often used for IFRS) and comprehensive income.
The Balance Sheet is referred to as the Statement of Financial Position. SomeCanadian companies already use this term. The IFRS statement name is more descrip-tive of what the statement contains. The statement includes the assets, liabilities, andequities of a company; thus it provides the company’s position in financial terms on thespecific data of the statement. However, some companies using IFRS continue to use theterm Balance Sheet.
Under IFRS, the titles Statement of Changes in Equity and Statement of Cash Flowsare essentially the same as under Canadian GAAP. However, some companies in Canadaprovide only a Statement of Retained Earnings. Under IFRS, all changes to equityaccounts must be indicated, not just retained earnings.
Under both IFRS and Canadian GAAP the financial statements are followed bynotes that provide information about significant accounting policies used to prepare thestatements. These notes provide other details about the accounts as well.
NEL
CASH FLOWS
LO 6 Identify distinctionsbetween international GAAP andCanadian GAAP.
Though in general the content of the Cash Flow Statement is the same using CanadianGAAP as it is using IFRS, there are a few differences in classifications. IFRS tends to bemore flexible than Canadian GAAP. Under Canadian GAAP, dividends declared and div-idends received are considered financing activities and are therefore classified under theFinancing section of the statement. Under IFRS, however, dividends declared andreceived may be classified under either Operating or Financing.
Under Canadian GAAP, interest is located in the Operating section. Under IFRS, incontrast, flexibility is given to interest (paid or received). Interest received may be clas-sified under Operating or Investing, whereas interest paid can be shown underOperating or Financing.
Inventories and Cost of Goods SoldIFRS does not allow the inventory method referred to as LIFO (last in, first out). In thepast, LIFO was allowed under Canadian GAAP, even though it was not often usedbecause LIFO was not allowed for tax purposes. In preparation for moving toward IFRS,LIFO is no longer allowed under Canadian GAAP. In the United States, which allowsLIFO for financial reporting and tax purposes, there can be significant tax savings whenusing the LIFO method when costs for products purchased or manufactured are rising.

14 IFRS Primer for Canada
When products in inventory lose value so that they cannot be sold for at least asmuch as their original cost, they must be reduced (written down) to net realizable value.Net realizable value is defined by IFRS as the estimated selling price less the estimatedcosts of completion and selling expenses. This principle is consistent with CanadianGAAP. However, IFRS, unlike Canadian GAAP, allows the amount in the inventoryaccount to be increased in the future if the net realizable value increases, though only tothe extent that inventory was written down earlier. An increase (write-up) above orig-inal cost would not be allowed. Any increase in the value of the inventory is then usedas a reduction in the amount of the cost of goods sold in the period.
Liquid Assets and Internal ControlThough internal control is not a reporting standard, the rigour of internal controlwithin an organization helps ensure that the financial statements are a fair representa-tion of the operations of a company and can be relied on for decision making. Putanother way, internal control forms the foundation for credible financial reporting.
During the early 2000s a number of corporate scandals and bankruptcies in severalcountries led to more regulation for business, especially for firms using the capital mar-kets to support themselves financially (i.e., by selling stocks and bonds to the public).Subsequently, in 2002 the Sarbanes-Oxley Act (SOX) was passed in the United States.SOX required more control on internal management processes, especially for publiclylisted companies in the United States. Because many Canadian firms are cross-listed(i.e., they sell their stock through Canadian and U.S. exchanges), they were compelled toimplement SOX’s requirements.
Later, a number of Canadian executives were polled. Many believed that new regu-lations needed to be put in place to strengthen investor confidence in global markets.This led to C-SOX, the Canadian equivalent of SOX. Because Canada and the UnitedStates have always worked closely to harmonize accounting standards, Canada agreed toadopt the various requirements of SOX unless there was a reason not to, such as a fun-damental difference in the Canadian markets as compared to the American ones.Canada differs from the United States in that it lacks a single securities regulator.Instead, each province has its own regulator. Canada does, however, have the CanadianSecurities Administrators (CSA), a voluntary association of member commissions.These commissions cooperate on items of national importance in an effort to harmo-nize the regulation of Canadian capital markets. It is expected that the various commis-sions will eventually combine to form a national regulatory commission.
All parts of the C-SOX regulations are essentially complete (a few are awaiting finalapproval), and many of them are similar to SOX. One important provision of SOX (a)requires a company’s management to report on the effectiveness of its internal controlsystem, and (b) requires the external auditor to assess and report on that system’s effec-tiveness. This provision is slightly different in Canada. Here, the chief executive officer(CEO) and the chief financial officer (CFO) must certify that they have evaluated theeffectiveness of the internal controls over financial reporting. They must also discusstheir conclusions regarding internal control in the Management Discussion andAnalysis (MD&A). Canadian companies are not required to obtain an auditor’s opinionon internal control, as in the United States, but they can contract an auditor’s help ifthey wish. However, in both the United States and Canada, the top executives (CEO andCFO) must certify the financial statements as to their accuracy.
Similar requirements do not exist in other countries. With the IASB working closelywith the U.S. FASB to harmonize standards, in the future some of these requirementsunder SOX and C-SOX may be implemented in other countries to ensure similar relia-bility of financial statements.
NEL

IFRS Primer for Canada 15
Capital Assets: Property, Plant, and Equipment,Natural Resources, and Intangibles
Property, Plant, and Equipment Regarding purchases of property, plant, andequipment, the only major difference between IFRS and Canadian GAAP is that underIFRS, companies can choose between the cost model and the revaluation model. Underthe cost model, a company that purchases an asset should then carry it at cost less anyaccumulated depreciation and any impairment losses. Under the revaluation model, theasset’s cost can be compared with the fair value (if reliably determined) and thenrevalued at the fair value less any accumulated depreciation and any impairment losses.
As noted earlier, the revaluation model probably provides more relevant informa-tion for decision making but is less reliable than the cost model. There is a lot of roomfor the subjective opinion of the person determining the fair value of the asset, sincethere is no transaction to verify the exact amount to record for fair value. It follows thatgood ethical judgment is required by those who are making these decisions and that agood internal control process is required by the organization to ensure that the financialstatements do not mislead readers.
Intangibles For intangible assets that can be traded in an active market, IFRSallows for a restatement of these assets to fair value. Assuming, then, that there is anactive market for customer lists and that you purchased a customer list from anothercompany, after a year’s time how might you go about determining its fair market value?Considerations might include the following:
■ How many of the listed customers are still at the same phone number, residence?
■ How many purchased products from you last year?
■ If they purchased products, what was the total dollar amount of products pur-chased?
■ Are these customers likely to purchase products from your company next year orthe year after?
■ How does the total forecasted purchase amount compare with the original cost ofthe customer list?
If the original cost is greater than the forecasted purchase amount (fair value), thecustomer list is probably impaired and should be reduced to the fair value. If the fore-casted amount is greater than the original cost, the company has an option of restatingthe original cost to the higher fair value.
Financial Statement AnalysisThough the process of financial statement analysis is the same under IFRS and CanadianGAAP, this question always arises: Are the ratios comparable when GAAP from differentcountries are used for the financial statements? For example, different liabilities may berecorded under one GAAP compared to the other, rendering a different debt-to-equityratio. If revenues are recorded under different principles, the profit margin or return onassets will not be comparable between companies that report using different GAAP.When all countries use IFRS, the financial ratios should be more comparable. Though theaccounts used to calculate the ratios are prepared with similar standards, how to interpreta ratio still depends on the business environment in which a company operates.
NEL

16 IFRS Primer for Canada
Interpreting Financial Ratios in the Context of theCountry of HeadquartersThough IFRS provides greater assurance that the numbers used for calculating ratiosand percentages have been created according to the same standards, companies still havechoices (e.g., cost versus fair value); so it is best to check the Notes to the FinancialStatements under Significant Accounting Policies to determine whether two companieshave made the same choices. And even when the same choices of standards have beenmade, the analyst must then interpret those ratios and percentages in the business andcountry context in which the company is headquartered. Different business contexts willcreate different levels of acceptable accounting ratios.
As an example, let’s look at Air China and Air Canada. Both are in the airline busi-ness, but they are headquartered in two different countries. Some financial data for bothcompanies are shown below. A few common percentages have been calculated for eachcompany. To begin, you may wonder what RMB stands for. Even when companies usesimilar standards, they will still report their financial statements in their home countrycurrency. China’s currency is referred to as the RMB or renminbi. It is not necessary toconvert RMB to Canadian dollars when calculating and comparing ratios—only whencomparing absolute amounts. However, if you want to get a better feel for the similari-ties in account balances for the two companies, conversion rates can be found on theInternet, or a number of banks will provide them. Conversion rates for 2007 (RMB toC$) are provided on page 17.
Even though Air Canada’s financial statements are prepared using Canadian GAAPand Air China’s are prepared using IFRS, the major differences in the ratios are not aresult of differences in standards; rather, they reflect differences in country characteris-tics. Note the difference in the debt/equity ratio. Air China has 1.90 RMB of debt foreach RMB of equity, whereas Air Canada has 3.77 dollars of debt for each dollar ofequity. Thus, Air Canada appears to be holding a riskier position than Air China.However, the current ratio is much lower (more risky) for Air China, at only 37% cov-erage of current liabilities; the number for Air Canada is 84% coverage of current liabil-ities. Air China’s profit margin is about double that of Air Canada, and Air China has atimes interest earned ratio of about four times that of Air Canada.
When attempting to interpret the financial statements, it is best to first determinewhether Air China is typical of Chinese airline companies and whether Air Canada istypical of Canadian airline companies. If so, then the differences may be attributable todifferent country characteristics.
NEL
CASE STUDY
LO 7 Interpret financial ratios fora company, considering the countrycontext of its headquarters.

IFRS Primer for Canada 17
Air China Air Canada (000s RMB) (000s Cdn)
Current liability 26,887,979 2,956,000 Noncurrent liability 32,660,945 6,254,000
Total debt 59,548,924 9,210,000
Total equity 31,357,137 2,443,000
Debt/equity ratio 1.90 3.77
Net profit after taxes 4,121,500 429,000
Revenue 51,330,451 10,599,000
Profit margin 8.03% 4.05%
Current assets 9,830,366 2,478,000
Current liabilities 26,887,979 2,956,000
Current ratio 36.56% 83.83%
EPS (basic) 0 4.29
EPS (diluted) N/A 4.27
EBIT 5,606,113 239,000
Annual interest expense 2,223,406 351,000
Times interest earned ratio 2.52 0.68
Average monthly exchange rate2007 RMB/CAD
January 0.151
February 0.151
March 0.151
April 0.1469
May 0.1426
June 0.1396
July 0.1387
August 0.1397
September 0.1363
October 0.13
November 0.1303
December 0.1361
Annual 0.1412
Year end Dec. 31, 2007 0.1353
Source: Copyright © 1995–2009, Bank of Canada.http://www.bankofcanada.ca/en/rates/exchange_avg_pdf.html on Apr 4, 2009
NEL

18 IFRS Primer for Canada
China Southern Airlines, Air China, and China Eastern Airlines dominate the air-line industry in China. China Southern Airlines is the nation’s largest airline, with a fleetof 307 aircraft in 2007; thus Air China does not seem to have a monopoly, nor is it thebiggest player. Sometimes companies that dominate the market can have ratios thatwould seem unusual under normal competitive conditions.
Using only one percentage for comparison, the current ratio (Canadian GAAP isconsistent with IFRS for this aspect) appears to be similarly low for all three companiesoperating in China, all of which use IFRS.
China Southern Airlines (reports under IFRS)
Current assets = 8,790
Current liabilities = 42,601
Current ratio = 20.6%
China Eastern Airlines (reports under IFRS)
Current assets = 9,013,652
Current liabilities = 33,629,826
Current ratio = 26.8%
When we compare Air Canada with other companies in the Canadian airlineindustry (all using Canadian GAAP), we find that the other companies have similarlyhigh current ratios.
WestJet (reports under Canadian GAAP)
Current assets = 717,788
Current liabilities = 590,606
Current ratio = 121.5%
Air Transat (reports under Canadian GAAP)
Current assets = 737,711
Current liabilities = 666,201
Current ratio = 110.7%
To synthesize, there is generally consistency among the airlines in each country, butinconsistency between countries. The low current ratio for Chinese airlines can beexplained by a different competitive environment. For the most part, there is more gov-ernment involvement in Chinese companies—in other words, they have the backing ofthe Chinese government. This is especially true of Air China, 40% of which is owned bythe Chinese government. The top three airlines have current ratios for 2007 of less than37%. The Management Discussion and Analysis (MD&A) and Notes provide someexplanatory information. Specifically, Air China’s annual report provides this informa-tion in the MD&A in the section about risk:
As at 31 December 2007, the Group’s current ratio, which represents current assetsdivided by current liabilities, was 0.36, representing a decrease of 0.05 percentage pointfrom 0.41 as at 31 December 2006, while its EBITDA interest cover was 4.78 times, rep-resenting an increase of 18.12% from 4.16 times as at 31 December 2006, resulting thatthe Group maintained a relatively sufficient operating cash flow position. The Companyis in the process of optimizing both its long-term and short-term debt structures step bystep to align with the changes in the financial market. The Group had already obtainedbank facilities with an aggregate amount of up to RMB 80.172 billion from a number ofbanks in the PRC and was therefore in a position to fully meet its own demand on cur-rent capital.
Source: Air China Annual Report 2007, page 19
NEL

IFRS Primer for Canada 19
As well, Air China explains in the Notes that China National Aviation HoldingCompany, a state-owned company, owns 40.4% of Air China.
Conversely, in Canada, the other two industry players (WestJet and Air Transat)have current ratios of greater than 100%, whereas Air Canada’s was 83.8%. Air Canadamentioned in its Notes that it had access to a $400 million revolving credit facility forliquidity requirements. In Canada there has been more competition in the industrysince the emergence of WestJet as the country’s sole national low-cost carrier. WestJet isincreasing its market share and has forced Air Canada to adjust its overall domesticoperations and price structure. Also, Air Transat has seen growth based on the risingnumbers of Canadians heading overseas to Europe for leisure or business purposes. AirTransat’s overseas charter service has given it a stronghold on the niche charter serviceto 25 countries.
In summary, even with enhanced comparatives due to IFRS reporting, there willstill be operating impacts within each industry and country that need to be taken intoconsideration when interpreting ratios. For example, China’s and Canada’s inflationrates are shown below. How might this statistic affect differences in financial ratios?
Inflation rates can affect a company’s ability to get sufficient cash to cover all its lia-bilities. To determine how a company is specifically affected by the inflation rate, theMD&A and Notes should provide additional information. The company might discussthe inflation rate in the risk section of the MD&A. The Notes will show whether the debthas fixed or floating interest rates. Fixed rates can be beneficial to a company because asinflation increases the cost of other materials and supplies, the interest rate on its debtis held to a lower rate, requiring less cash than if the interest rate were able to float withthe rate of inflation.
Can you think of other ways in which knowing the inflation rate in a specificcountry would help you interpret its financial statements?
NEL
Inflation Rate for China: 6.9% on December 31, 2007
7
6
5
4
3
2Feb/07
– Annual Change on Consumer Price Index
Mar/07 Apr/07 May/07 Jun/07 Jul/07 Aug/07 Sept/07 Oct/07 Nov/07 Dec/07
2.22.7
3.3 3.4
4.4
5.6
6.56.2
6.56.9
3
Source: Screen shot from http://tradingeconomics.com/Economics/Inflation-CPI.aspx?Symbol=CNY; filtered to 02/01/07 to 12/31/07
China’s Inflation Rate

20 IFRS Primer for Canada NEL
Inflation Rate for Canada: 2.5% on December 31, 2007
2.6
2.4
2.2
2
1.8
1.6
1.4
1.2
1Feb/07
– Annual Change on Consumer Price Index
Mar/07 Apr/07 May/07 Jun/07 Jul/07 Aug/07 Sept/07 Oct/07 Nov/07 Dec/07
1.1
2
2.32.2 2.2 2.2
1.7
2.5 2.52.4
2.2
Source: Screen shot from http://tradingeconomics.com/Economics/Inflation-CPI.aspx?Symbol=CAD; filtered to 02/01/07 to 12/31/07
Canada’s Inflation Rate