ifrs financial statements 2018 - iita.org · pmb 5320, oyo road, idi-oshe ibadan, nigeria tel.: +1...
TRANSCRIPT

IFRS Financial Statementsand Auditors’ Report for the year ended 31 December
2018
www.iita.org

ii iii
© International Institute of Tropical Agriculture
Publication design and layout by IITA
International mailing address:IITA IITA, Grosvenor House, 125 High Street Croydon CR0 9XP, UK

PB i
IITA - Financial Statements for the year ended 31 December, 2018
Table of ContentsPage
Statement of the Board Chair 1
Board Statement on IITA Risk Management - 2018 2
Report of Management 3
Report of the Auditors 4 - 5
Financial Statements
Statement of Financial Position 6
Statement of Activities 7
Statement of Changes in Net Assets 8
Statement of Cash Flows 9
Notes to the Financial Statements 10 - 37
Supplementary Information
Exhibit I - Unrestricted Grants 38
Exhibit II - CGIAR Funds: Windows 1&2 39
Exhibit III - CRP Window 3 40
Exhibit IV - Bilateral Projects and Challenge Programs 41
Exhibit V - CRP Windows 1&2 Grants and Expenditure 42
Exhibit VI - CRP Window 3 Grants and Expenditure 43 - 45
Exhibit VII - Bilateral Pledges & Expenditure 46 - 53
Exhibit VIII - Challenge Programs Pledges & Expenditure 54
Exhibit IX - Non-CRP Pledges & Expenditure 55 - 57
Exhibit X - Advancing Productive Engagement in Agribusiness through the IITA Youth Agripreneur approach in Nigeria, Kenya & DR Congo 58- 61
Exhibit XI - CRP Expenditure Report 62 - 63
Exhibit XII - CRP Windows 1&2 Funding Report 64
Acronyms and Abbreviations i - ii

ii 1

ii 1www.iita.org
Statement of the Board Chair
International mailing addressIITA, Grosvenor House, 125 High Street
Croydon CR0 9XP, UK
HeadquartersPMB 5320, Oyo Road, Idi-Oshe
Ibadan, NigeriaTel.: +1 201 6336094,
+234 7008004482,Fax.: +44 (208) 711 3786 (via UK)
www.iita.org www.cgiar.org
International mailing addressIITA, Grosvenor House, 125 High Street
Croydon CR0 9XP, UK
HeadquartersPMB 5320, Oyo Road, Idi-Oshe
Ibadan, NigeriaTel.: +1 201 6336094,
+234-7008004482,Fax.: +44 (208) 711 3786 (via UK)
Statement of the Board Chair for the year ended 31 December 2018 The mission of International Institute of Tropical Agriculture (IITA) is to be the leading research partner facilitating agricultural solutions to overcome hunger, poverty and natural resource degradation throughout the tropics. The refreshed strategy of the Institute established a goal of lifting 11 million people out of poverty and revitalizing 7.5 million hectares of degraded land by 2020. This is an ambitious target: however, the significant increase in research capacity over the past two years and the quality and relevance of the Institute’s programs will facilitate its achievement. The Board of Trustees is committed to provide governance, financial and programmatic oversight to ensure efficient and effective management of the Institute. 2018 was a similarly challenging year like 2017, following funding reductions from some major donors. Total revenue amounted to US$87.7 million (2017: US$99.0 million) against expenditure of US$87.3 million (2017: US$98.6 million). IITA continued to participate in Phase II of CGIAR Research Programs in 2018 - in five CRPs (Maize, RTB, A4NH, CCAFS & PIM) and in three Platforms (EiB, Big Data & Genebank). The Institute’s liquidity and reserve levels improved marginally; however, the reported days remain below the CGIAR recommended benchmarks. The 2018 audited financial statements show an operating result of US$0.419 million positive change in net assets due largely to aggressive costs recoveries and frugal spending. The implementation of IFRS has led to an increase in expenses and a reduction of undesignated reserves recognized by IITA compared to those recognized under CGIAR Financial Guidelines No. 2. However, based on IFRS reporting, the reserve days rose from 25 days in 2017 to 31 days at the end of 2018. The Board recognizes the need to increase reserves and expense days coverage and will continue to work with management to develop an action plan to improve reserve days to a desirable level. The Board of Trustees expresses its appreciation to the research and support staff of IITA for the excellent research conducted during 2018; attraction of new partners and funding; and the effective financial and administrative management of the Institute’s resources. Finally, the Trustees express our deep appreciation to IITA’s investors and partners for their contributions towards the laudable mission of the Institute, which is aimed at reducing hunger and poverty in Africa.
Amos Ngongi Namanga Chairman, Board of Trustees 16 April 2019 16 April 2019

2 3
Board Statement on IITA Risk Management - 2016International mailing address
IITA, Grosvenor House, 125 High StreetCroydon CR0 9XP, UK
HeadquartersPMB 5320, Oyo Road, Idi-Oshe
Ibadan, NigeriaTel.: +1 201 6336094,
+234 7008004482,Fax.: +44 (208) 711 3786 (via UK)
www.iita.org
International mailing addressIITA, Grosvenor House, 125 High Street
Croydon CR0 9XP, UK
HeadquartersPMB 5320, Oyo Road, Idi-Oshe
Ibadan, Nigeria Tel.: +1 201 6336094,
+234-7008004482,Fax.: +44 (208) 711 3786 (via UK)
BOARD STATEMENT ON IITA RISK MANAGEMENT - 2018
The Center’s Board of Trustees has responsibility for overseeing the effectiveness of the risk management system that IITA management has put in place to identify, manage and monitor significant risks to the achievement of IITA’s business objectives, and to ensure alignment with Consultative Group on International Agriculture Research (CGIAR) principles and guidelines that have been adopted by all CGIAR Centers.
These risks include operational, financial and reputational risks that are inherent in the nature, modus operandi and location of IITA’s activities and dynamics of the environment in which IITA operates. Together, they represent the potential for loss resulting from external events, human factors or inadequate or failed internal policies, processes or systems.
To these ends, the Board has adopted a risk management policy and risk mitigation practices, that have been communicated to all staff, that include a risk framework by which IITA management identifies, evaluates and prioritizes risks and opportunities across the organization; assigns risk owners and develops risk mitigation strategies (including internal controls) which balance benefits with costs; monitors the implementation of these strategies and reports semi-annually to the Audit Committee of the Board on results. During 2018 the management continued to review and further develop existing risk management strategies and guidelines to ensure the risk management system in IITA is comprehensive and relevant and continues to be in line with best practice.
The Board will monitor and review progress on an on-going basis as the IITA management seeks to deepen the implementation of the risk management framework, focus attention on higher priority risks. The Board notes that the effectiveness of risk management depends not only on the identification of the risks but the implementation of effective mitigation plans. The Board continues to assure itself that risk management is effective and sustained.
With regards to IITA’s 2018 financial statements and the effectiveness of internal control specific to financial reporting, the Board notes management’s assertion in its 2018 Management Letter of Representation (provided to the external auditors) and Management’s Statement of Responsibility for Financial Reporting included as part of the annual Financial Statements.
Amos Ngongi Namanga Chair, IITA Board of Trustees 15 April 2019
www.iita.org www.cgiar.org

2 3
www.iita.org
Report of ManagementInternational mailing address
IITA, Grosvenor House, 125 High StreetCroydon CR0 9XP, UK
HeadquartersPMB 5320, Oyo Road, Idi-Oshe
Ibadan, NigeriaTel.: +1 201 6336094,
+234 7008004482,Fax.: +44 (208) 711 3786 (via UK)

4 5

4 5

6 7
International Institute of Tropical AgricultureStatement of Financial Position
as at 31 December, 2018
Statement of Financial Position
Expressed in US$ Thousands 31 December 31 December
Notes 2018 2017AssetsCurrent assetsCash and short term deposit 9 7,609 8,474 Accounts receivable:
Donors - Net 10.1 21,465 21,646 Employees 10.2 1,031 1,172 CGIAR Centers 10 3,715 3,153 Other receivables 10.3 518 162
Prepayments 11 3 555 Inventories 12 1,624 1,492 Total current assets 35,965 36,654
Non-current assets Property, plant and equipment 13 88,457 87,025 Less accumulated depreciation 13 (59,461) (57,292)Property, plant and equipment- Net 28,996 29,733
Intangible assets 14 854 539 Less amortisation 14 (539) (513)Intangible assets - Net 315 26 Other assets 15 906 906 Total non-current assets 30,217 30,665 Total assets 66,182 67,319 Liabilities and net assetsCurrent liabilities Accounts payable:
Donors 16.1 13,781 16,094 Employees 16.2 8,992 8,468 CGIAR Centers 16 133 359 Other payables 16.3 2,741 2,080
Deferred income from donors 835 345 Total current liabilities 26,482 27,346 Non-current liabilities Employee benefit liability 17 1,834 1,731 Deferred income from donors 18 1,391 2,186 Total non-current liabilities 3,225 3,917 Total liabilities 29,707 31,263 Net assets Undesignated 19 6,786 6,367 Designated 19 29,689 29,689 Total net assets 36,475 36,056
Total liabilities and net assets 66,182 67,319 The accompanying notes on pages 5 to 46 form an integral part of these statements.The accompanying notes on pages 5 to 46 form an integral part of these statements.
Nteranya Sanginga Shalewa Sholola Director General Director of Finance 9 March, 2019

6 7
Statement of Activities
Inte
rnat
iona
l Ins
titut
e of
Tro
pica
l Agr
icul
ture
Stat
emen
t of A
ctiv
ities
and
oth
er C
ompr
ehen
sive
Inco
me
for t
he Y
ear E
nded
31
Dec
embe
r, 20
18
Ex
pres
sed
in U
S$ T
hous
ands
Rev
enue
and
gai
nsG
rant
inco
me
Win
dow
1 &
2
-
1
2,42
0
-
12,
420
–
1
2,22
9
-
12,
229
Win
dow
3
–
4
0,17
6
–
40,
176
–
4
6,43
6
–
46,
436
Bila
tera
l
248
2
1,02
2
13,
579
3
4,84
9
607
2
4,54
3
15,
025
4
0,17
5 To
tal g
rant
reve
nue
2
48
73,
618
1
3,57
9
87,
445
6
07
83,
208
1
5,02
5
98,
840
Oth
er o
pera
ting
inco
me
5 4
2
–
–
42
5
6
–
–
56
Tota
l rev
enue
and
gai
ns
2
90
73,
618
1
3,57
9
87,
487
6
63
83,
208
1
5,02
5
98,
896
Expe
nses
and
loss
esR
esea
rch
expe
nses
6
–
50,
877
1
1,79
8
62,
675
–
5
4,72
8
11,
048
6
5,77
6 C
GIA
R c
olla
bora
tion
expe
nses
6
–
1,1
04
280
1
,384
–
5
,130
1
,031
6
,161
No
n –
CGIA
R co
llabo
ratio
n ex
pens
es 6
–
11,
944
8
36
12,
780
–
1
2,95
0
2,3
26
15,
276
Man
agem
ent a
nd g
ener
al e
xpen
ses
7 9
,275
1
,140
–
1
0,41
5
11,
251
1
43
–
11,
394
Indi
rect
cos
t rec
over
y 8
(9,2
18)
8,5
53
665
–
(1
0,87
7)
10,
257
6
20
–
Tota
l exp
ense
s an
d lo
sses
57
7
3,61
8
13,
579
8
7,25
4
374
8
3,20
8
15,
025
9
8,60
7
Surp
lus
for t
he y
ear
2
33
–
–
233
2
89
–
–
289
Oth
er c
ompr
ehen
sive
inco
me
Oth
er c
ompr
ehen
sive
inco
me
not t
o
–
– –
– –
– –
be re
clas
sifie
d to
the
stat
emen
t of
activ
ities
in s
ubse
quen
t per
iods
Rem
easu
rem
ent g
ain
on d
efine
dbe
nefit
pla
ns
17.1
1
86
–
–
186
9
0
–
–
90
Tota
l sur
plus
and
oth
er
com
preh
ensi
ve in
com
e
419
–
–
4
19
379
–
–
3
79Th
e ac
com
pany
ing
note
s on
pag
es 5
to 4
6 fo
rm a
n in
tegr
al p
art o
f the
se s
tate
men
ts.
20
18
2017
Res
tric
ted
Res
tric
ted
R
estr
icte
d
Res
tric
ted
Not
eUn
rest
ricte
d C
RP
Non
-CR
P To
tal
Unre
stric
ted
CR
P N
on-C
RP
Tota
l

8 9
Statement of Changes in Net Assets
As
at 1
Jan
uary
201
8 6
,367
12
,680
1
7,05
3
26
(1
,070
) 1
,000
29
,689
36
,056
N
et c
hang
es in
inve
stm
ent i
npr
oper
ty a
nd e
quip
men
t –
36
5
(1,1
02)
–
737
–
–
–
N
et c
hang
es in
inve
stm
ent i
n in
tang
ible
ass
ets
––
–
289
(2
89)
–
–
–Su
rplu
s fo
r the
yea
r 2
33 –
–
–
–
–
2
33
Oth
er c
ompr
ehen
sive
inco
me
186
–
–
–
–
–
1
86
As
at 3
1 D
ecem
ber 2
018
6,7
86
13,0
45
15,
951
3
15
(622
) 1
,000
2
9,68
9 36
,475
As a
t 1 J
anua
ry 2
017
5,9
88
12,4
22
17,
632
4
1
(1,4
06)
1,0
00
29,
689
3
5,67
7 N
et c
hang
es in
inve
stm
ent i
npr
oper
ty p
lant
and
equ
ipm
ent
–
258
(5
79)
–
321
–
–
–
N
et c
hang
es in
inve
stm
ent i
n in
tang
ible
ass
ets
––
–
(1
5)
15
–
–
–
Net
cha
nges
in th
e ap
prop
riatio
n fo
r pur
chas
e of
inta
ngib
le a
sset
s –
–
–
–
–
–
–
–
Surp
lus
for t
he y
ear
289
–
–
–
–
–
–
289
O
ther
com
preh
ensi
ve in
com
e 9
0 –
–
–
–
–
–
9
0 A
s at
Dec
embe
r 201
7 6
,367
12
,680
1
7,05
3
26
(1
,070
) 1
,000
2
9,68
9
36,
056
The
acco
mpa
nyin
g no
tes
on p
ages
5 to
46
form
an
inte
gral
par
t of t
hese
sta
tem
ents
.
Und
esig
nate
dfu
nds
Inve
stm
ent
in p
rope
rty,
plan
t and
eq
uipm
ent
Inve
stm
ent
in re
stric
ted
asse
ts
Inve
stm
ent
in in
tang
ible
as
sets
Prop
erty
, pla
nt
and
equi
pmen
t/in
tang
ible
asse
tsac
quis
ition
and
re
plac
emen
tIn
stitu
tiona
lst
abilit
yTo
tal
desi
gnat
edTo
tal N
et
asse
ts
Inte
rnat
iona
l Ins
titut
e of
Tro
pica
l Agr
icul
ture
Stat
emen
t of C
hang
es in
Net
Ass
ets
for t
he Y
ear E
nded
31
Dec
embe
r, 20
18
Ex
pres
sed
in U
S$ T
hous
ands

8 9
International Institute of Tropical AgricultureStatement of Cash Flows
for the Year Ended 31 December, 2018
Statement of Cash Flows
Notes 2018 2017 Expressed in US$ Thousands
Surplus 233 289
Non–cash adjustments to reconcile surplus to net cashflows:Interest income 5 (16) (40)Gain on disposal of property, plant and equipment 5 (26) – Allowance for impairment loss 10.1 1,125 788Depreciation of unrestricted assets 13 1,035 871Depreciation of restricted assets 13 1,140 403Amortisation of intangible assets 14 26 36Unrealised exchange difference – 5Amortisation of deferred income from donors 18 (1,140) (487)Employee benefit expense 17.1 273 173
2,650 2,038Decrease/ (increase) in assetsInvestments 9 – –Accounts receivable:
Donors 10.1 (944) (1,319)Employees 10.2 141 (405)CGIAR Centers 10 (562) (480)Other receivables 10.3 (356) (73)
Prepayments 11 552 (81)Inventories 12 (132) 105Other assets 15 – (906)Increase/ (decrease) in liabilityAccounts payable:
Donors 16.1 (2,313) (2,434)Employees 16.2 524 619CGIAR Centers 16 (226) (488)Others 16.3 661 (270)
Employee benefit liability 17 147 46Deferred income from donors 18 835 345
977 (3,303)Interest income 16 40Benefit paid (131) (243)Net cash used in operating activities 862 (3,506)
Investing activitiesAcquisition of unrestricted property, plant and equipment 13 (603) (692)Acquisition of restricted property, plant and equipment 13 (835) (261)Acquisition of intangible assets 14 (315) (21)Proceeds from sale of property, plant, and equipment 26 –Net cash used in investing activities (1,728) (974)Net decrease in cash and cash equivalent (865) (4,480)Net foreign exchange difference – (5)Cash and cash equivalents at 1 January 9 8,474 12,959 Cash and cash equivalents at 31 December 7,609 8,474
The accompanying notes on pages 5 to 46 form an integral part of these statements.

10 11
International Institute of Tropical AgricultureNotes to the Financial Statements
for the year ended 31 December, 2018
1 Corporate information The financial statements of the
International Institute of Tropical Agriculture (“IITA”,”Institute” or “Center”) for the year ended 31 December 2018 were authorised for issue in accordance with a resolution of the Board of Trustees on …………April 2019.The International Institute of Tropical Agriculture (IITA) is a private, autonomous, international in character, not-for-profit, tax free, scientific and educational institute chartered under the laws of Nigeria by Decree number 32 dated July 1967, to engage in research on resource and crop management and the improvement of selected food crops in Sub-Saharan Africa. The registered office is located at IITA Campus, Ibadan, Nigeria.IITA is one of the 15 member Centers of the Consultative Group for International Agricultural Research (CGIAR). CGIAR is an international association sponsored by the World Bank, the Food and Agriculture Organisation of the United Nations and the United Nations Development Programme. CGIAR research is dedicated to reducing rural poverty, increasing food security, improving human health and nutrition, and ensuring more sustainable management of natural resources.
2 Adoption of new and revised IFRS standards
a) New standards, amendments and interpretations adopted by the Institute A number of new or amended standards became effective in the current year. Those that are applicable to the Institute are as follows:
i) Financial Instruments – IFRS 9 “IFRS 9 “Financial Instruments” IFRS 9, published in July 2014, replaces the existing guidance in IAS 39 “Financial instruments: recognition and measurement”. IFRS 9 includes revised guidance on the classification and measurement of financial instruments, including a new expected credit loss model for calculating impairment on financial assets, and the new general hedge accounting requirements. It also carries forward the guidance on recognition and de-recognition of financial instruments from IAS
39. The Institute does not currently apply any hedge accounting, so the new hedging rules do not presently affect the Institute.The Institute adopted the new standard on 1 January 2018 and has elected to apply the limited exemption in IFRS 9 relating to transition for classification and measurement and impairment, and accordingly has not restated comparative periods in the year of initial application.Consequently, any adjustments to carrying amounts of financial assets or liabilities are recognized at the beginning of the reporting period, with the difference recognized in opening equity. Accordingly, the information presented for 2017 does not generally reflect the requirements of IFRS 9, but rather those of IAS 39.The Institute has performed an assessment of the requirements of IFRS 9 and how these differ from IAS 39 and has concluded there is no significant impact on the financial statements from the date of adoption. There were no differences between previous carrying amounts and consequently no adjustment has been made to opening retained earnings.”
“IFRS 9 contains three principal classification categories for financial assets: measured at amortized cost, fair value through other comprehensive income (“FVOCI”) and fair value through profit or loss (“FVTPL”). The classification of financial assets under IFRS 9 is generally based on the business model in which a financial asset is managed and its contractual cash flow characteristics. IFRS 9 eliminates the previous IAS 39 categories of held to maturity, loans and receivables and available-for-sale.IFRS 9 largely retains the existing requirements in IAS 39 for the classification and measurement of financial liabilities.”
“ImpairmentoffinancialassetsIFRS 9 replaces the ‘incurred loss’ model in IAS 39 with an ‘expected credit loss’ (ECL) model. Under IFRS 9, credit losses are recognized earlier than under IAS 39. IFRS 9 requires the Institute to recognize an allowance for ECLs for all debt instruments not held at FVTPL.
Notes to the Financial Statements
10 11
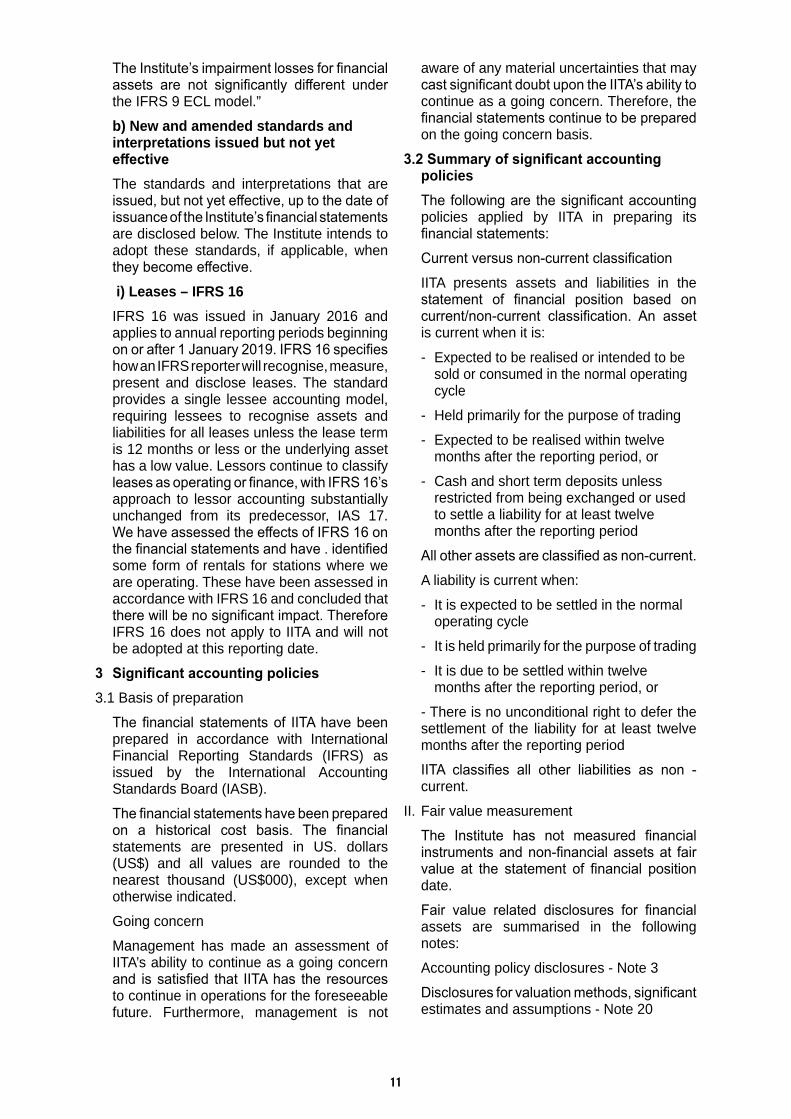
The Institute’s impairment losses for financial assets are not significantly different under the IFRS 9 ECL model.”
b) New and amended standards and interpretations issued but not yet effective
The standards and interpretations that are issued, but not yet effective, up to the date of issuance of the Institute’s financial statements are disclosed below. The Institute intends to adopt these standards, if applicable, when they become effective.
i) Leases – IFRS 16 IFRS 16 was issued in January 2016 and
applies to annual reporting periods beginning on or after 1 January 2019. IFRS 16 specifies how an IFRS reporter will recognise, measure, present and disclose leases. The standard provides a single lessee accounting model, requiring lessees to recognise assets and liabilities for all leases unless the lease term is 12 months or less or the underlying asset has a low value. Lessors continue to classify leases as operating or finance, with IFRS 16’s approach to lessor accounting substantially unchanged from its predecessor, IAS 17. We have assessed the effects of IFRS 16 on the financial statements and have . identified some form of rentals for stations where we are operating. These have been assessed in accordance with IFRS 16 and concluded that there will be no significant impact. Therefore IFRS 16 does not apply to IITA and will not be adopted at this reporting date.
3 Significantaccountingpolicies3.1 Basis of preparation The financial statements of IITA have been
prepared in accordance with International Financial Reporting Standards (IFRS) as issued by the International Accounting Standards Board (IASB).
The financial statements have been prepared on a historical cost basis. The financial statements are presented in US. dollars (US$) and all values are rounded to the nearest thousand (US$000), except when otherwise indicated.
Going concern Management has made an assessment of
IITA’s ability to continue as a going concern and is satisfied that IITA has the resources to continue in operations for the foreseeable future. Furthermore, management is not
aware of any material uncertainties that may cast significant doubt upon the IITA’s ability to continue as a going concern. Therefore, the financial statements continue to be prepared on the going concern basis.
3.2Summaryofsignificantaccountingpolicies
The following are the significant accounting policies applied by IITA in preparing its financial statements:
Current versus non-current classification IITA presents assets and liabilities in the
statement of financial position based on current/non-current classification. An asset is current when it is:
- Expected to be realised or intended to be sold or consumed in the normal operating cycle
- Held primarily for the purpose of trading - Expected to be realised within twelve
months after the reporting period, or - Cash and short term deposits unless
restricted from being exchanged or used to settle a liability for at least twelve months after the reporting period
All other assets are classified as non-current. A liability is current when: - It is expected to be settled in the normal
operating cycle - It is held primarily for the purpose of trading - It is due to be settled within twelve
months after the reporting period, or - There is no unconditional right to defer the
settlement of the liability for at least twelve months after the reporting period
IITA classifies all other liabilities as non - current.
II. Fair value measurement The Institute has not measured financial
instruments and non-financial assets at fair value at the statement of financial position date.
Fair value related disclosures for financial assets are summarised in the following notes:
Accounting policy disclosures - Note 3 Disclosures for valuation methods, significant
estimates and assumptions - Note 20

12 13
Quantitative disclosures of fair value measurement hierarchy - Note 20
Fair value is the price that would be received to sell an asset or paid to transfer a liability in an orderly transaction between market participants at the measurement date. The fair value measurement is based on the presumption that the transaction to sell the asset or transfer the liability takes place either:
- In the principal market for the asset or liability
Or - In the absence of a principal market, in the
most advantageous market for the asset or liability.
The principal or the most advantageous market must be accessible by IITA.
The fair value of an asset or a liability is measured using the assumptions that market participants would use when pricing the asset or liability, assuming that market participants act in their economic best interest.
A fair value measurement of a non-financial asset takes into account a market participant’s ability to generate economic benefits from the asset’s highest and best use or by selling it to another market participant that would utilise the asset in its highest and best use.
IITA uses valuation techniques that are appropriate in the circumstances and for which sufficient data are available to measure fair value, maximising the use of relevant observable inputs and minimising the use of unobservable inputs.
All assets and liabilities for which fair value is disclosed in the financial statements are categorized within the fair value hierarchy. This is described, as follows, based on the lowest level input that is significant to the fair value measurement as a whole:
- Level 1 — Quoted (unadjusted) market prices in active markets for identical assets or liabilities
- Level 2 — Valuation techniques for which the lowest level input that is significant to the fair value measurement is directly or indirectly observable
- Level 3 — Valuation techniques for which the lowest level input that is significant to the fair value measurement is unobservable
For the purpose of fair value disclosures, IITA has determined classes of assets and liabilities on the basis of the nature, characteristics and risks of the asset or liability and the level of the fair value hierarchy, as explained above.
III. Revenue Recognition Grant revenue comprises of donations
received from various sources. The main sources of donations are from CGIAR, Governments of different countries, Private Individuals, Charitable foundations and Companies. The grants, whether restricted or unrestricted, are not recognized until there is reasonable assurance that the Institute has complied with the conditions attached to the grant and that the grant will be received. Restricted grants are recognized as revenue to the extent of expenses incurred.
III. Revenue Recognition - continued Revenue is classified into two (2) streams: - Restricted grants (including Government
grants) are those received from a transfer of resources to the Institute in return for past or future compliance to the operating activities of the Institute. Restricted grants include Window 1,2, and 3, and Bilateral.
- Unrestricted grants (including Government grants) are those received from unconditional transfers of cash or other assets to the Institute. The two streams are further analysed into six (6) sub categories:
CRP (CGIAR Research Program) window 1: In window 1, CGIAR determines the CRP
to be executed and provides funds for the project. CGIAR identifies a lead center and participating partners with the competency required to execute the project and communicates to the lead center the project details and thereafter, funds are transferred to the lead center.
CRP (CGIAR Research Program) window 2: In window 2, the donor identifies a program
or project it wishes to fund, the funds are made available to CGIAR. CGIAR identifies a lead center and participating partners with the competency required for executing the project and communicates to the lead center the project details and thereafter funds are transferred to the lead center.
CRP (CGIAR Research Program) window 3: In window 3, the donor directly identifies the
research center with a program it wishes to

12 13
fund and remits the funds for the research through CGIAR funding window to the research center.
Bilateral funds These are funds sent by the Donor to
the identified research center without the involvement of CGIAR.
Challenge programs Challenge programs are programs initiated
to take on global challenges with a wide range of research partners. These funds originate from the Challenge Program lead center to the identified research center with the required geographical presence and expertise.
Non-CRP funds These are strategic funded projects which are
aligned to the strategic research framework (SRF) of CGIAR CRPs.
The grants, whether restricted or unrestricted, are not recognized until there is reasonable assurance that the Center has complied with the conditions attached to the grant.
Unrestricted grants in currencies other than US. dollars (US$) are recorded at exchange rates in effect at the time of receipt or, if outstanding as at December 31, at the exchange rate in effect at the year end.
Restricted grants in currencies other than US. dollars (US$) with specific request to be paid in that currency as partner funds, are recorded as income and expenses at the exchange rate in effect at the time of payment.
Grants-in-kind These are recorded at the fair value of the
assets (or services) received or promised.IV. Foreign currencies IITA’s financial statements are presented in
US. dollars (US$), which is also the Institute’s functional currency.
Transactions and balances Transactions in foreign currencies are initially
recorded by IITA at their functional currency spot rates at the date the transaction first qualifies for recognition.
Monetary assets and liabilities denominated in foreign currencies are retranslated at the currency spot rates of exchange ruling at the reporting date. Differences arising on settlement or translation of monetary items
are recognised in the statement of activities. Non-monetary items that are measured in terms of historical cost in a foreign currency are translated using the exchange rates as at the dates of the initial transactions.
V. Government grants Government grants are recognised when
there is a reasonable assurance that the grant will be received and all attached conditions will be complied with. When the grant relates to an expense item, it is recognised as income on a systematic basis over the periods that the costs, which it is intended to compensate, are expensed.
Where the grant relates to an asset, it is recognised as income in equal amounts over the expected useful life of the related asset. When IITA receives non - monetary grants, the asset and the grant are recorded at nominal amount.
VI. Cash and short - term deposits Cash and short-term deposits in the
statement of financial position comprises cash at banks and on hand and short-term deposits with a maturity of three months or less, which are subject to an insignificant risk of changes in value.
Cash and short term deposits also comprise of cash equivalents which are short-term, highly liquid investments that are: i) readily convertible to known amounts of cash; and ii) invested for a period of 3 months or less, hence the risk of changes in value due to changes in interest rates are insignificant.
VII. Property, plant and equipment Property, plant, and equipment are tangible
goods that are held for use related to the main objective of the Center, including research activities and administrative and technical support activities; and are expected to be used during more than one accounting period.
Property, plant and equipment are stated at cost, net of accumulated depreciation and/or accumulated impairment losses, if any. Such cost includes the cost of purchase, costs directly attributable to bringing the asset to the location and condition necessary for use.
Property, plant, and equipment acquired through non-monetary grants are recognized at the nominal amount at the date of the grant. Such grants are presented in the statement of financial position as deferred income and are taken into account as

14 15
revenue on a systematic and rational basis over the lifespan of the asset. Property, plant, and equipment acquired through monetary grants are recognized at cost at the date of acquisition.
All new facilities provided by host countries to the Center or built for the use of the Center, which will revert to the host country in the event the Center ceases operations, are recognized as assets. The land is recognised at nominal value and the buildings at historical cost.
Subsequent expenditures are added to the cost of the property, plant, and equipment only if the expenditure improves the condition of the asset beyond its originally assessed standard of performance. All other subsequent expenditures are recognised as expenses of the period where incurred.
VII. Property, plant and equipment-Continued Depreciation is calculated on a straight-line
basis over the estimated useful lives of the assets as follows:
Land Nil Buildings 50 years Infrastructure 40 years Power House 25 years Laboratory and Scientific equipment 6 years Furniture and equipment 6 years Motor vehicles 5 years Computer equipment 3 years
The land on which the headquarter is situated is a government grant which took the form of a transfer of a non-monetary assets, for the use of IITA. IITA has elected to record both the asset and grant at a nominal amount.
For assets acquired with restricted funds, IITA depreciates the assets over the project life.
Depreciation begins when the asset is available for use. Depreciation ceases at the earlier of the date that the asset is classified as held for sale, and the date the asset is derecognized. The depreciation charge for each period is recognized in the statement of activities.
An item of property, plant and equipment is derecognised upon disposal or when no future economic benefits are expected from its use or disposal. Any gain or loss arising on derecognition of the asset (calculated as the difference between the net disposal proceeds and the carrying amount of the asset) is included in the statement of activities precisely in other operating income
when there is a gain and in the management and general expenses when there is a loss.
The residual values, useful lives and methods of depreciation of property, plant and equipment are reviewed at each financial year end and adjusted prospectively, if appropriate.
VIII. Intangible assets Intangible assets acquired separately are
measured on initial recognition at cost. Following initial recognition, intangible assets are carried at cost less accumulated amortisation and accumulated impairment losses, if any. Internally generated intangible assets, excluding capitalised development costs, are not capitalised and expenditure is recognised in the statement of activities when it is incurred.
Intangible assets are subsequently measured using the cost model (cost less accumulated amortization and any accumulated impairment losses if any).
The useful lives of intangible assets are assessed to be finite.
The useful lives of an intangible assets are allocated on a straight line basis as shown below:
Computer software - 3 years Intangible assets with finite lives are amortised
over their useful economic lives and assessed for impairment whenever there is an indication that the intangible asset may be impaired. The amortisation period and the amortisation method for an intangible asset with a finite useful life are reviewed at least at the end of each reporting period. Changes in the expected useful life or the expected pattern of consumption of future economic benefits embodied in the asset are accounted for by changing the amortisation period or method, as appropriate, and are treated as changes in accounting estimates. The amortisation expense on intangible assets with finite lives is recognised in the management and general expenses in the statement of activities.
VIII. Intangible assets - continued “Research and development costsResearch costs are expensed as incurred.
Development expenditures on an individual project are recognised as an intangible asset when the Institute can demonstrate:
• The technical feasibility of completing the intangible asset so that it will be available for use or sale

14 15
• Its intention to complete and its ability to use or sell the asset
• How the asset will generate future economic benefits
• The availability of resources to complete the asset
• The ability to measure reliably the expenditure during development
Following initial recognition of the development expenditure as an asset, the cost model is applied requiring the asset to be carried at cost less any accumulated amortisation and accumulated impairment losses. Amortisation of the asset begins when development is complete and the asset is available for use. It is amortised over the period of expected future benefit. During the period of development, the asset is tested for impairment annually.”
IX. Inventories Inventories are supplies consumed in the
operations of the Institute. They are valued at the lower of cost and net realisable value. The cost of inventories comprises all costs of purchase and other costs incurred in bringing the inventories to their present location and condition.
The cost of inventories is assigned using weighted average method.
Inventory write down is recognized as an expense in the statement of activities. The amount of any reversal of any write - down of inventories, arising from an increase in net realisable value, is recognised as a reduction in the amount of inventories recognised as an expense in the period in which the reversal occurs.
X. Impairment of non - financial assets IITA assesses at each reporting date whether
there is an indication that an asset may be impaired. If any indication exists, or when annual impairment testing for an asset is required, the Institute estimates the asset’s recoverable amount. An asset’s recoverable amount is the higher of an asset’s or Cash Generating Unit’s (CGU) fair value less costs of disposal and its value in use. It is determined for an individual asset, unless the asset does not generate cash inflows that are largely independent of those from other assets or groups of assets. Where the carrying amount of an asset or Cash Generating Unit (CGU) exceeds its recoverable amount, the asset is considered impaired and is written down to its recoverable amount.
In assessing value in use, the estimated future cash flows are discounted to their present value using a pre-tax discount rate that reflects current market assessments of the time value of money and the risks specific to the asset. In determining fair value less costs of disposal, recent market transactions are taken into account. If no such transactions can be identified, an appropriate valuation model is used. These calculations are corroborated by valuation multiples, quoted share prices for publicly traded subsidiaries or other available fair value indicators.
A previously recognized impairment loss is reversed only if there has been a change in the assumptions used to determine the asset’s recoverable amount since the last impairment loss was recognised. The reversal is limited so that the carrying amount of the asset does not exceed its recoverable amount, nor exceed the carrying amount that would have been determined, net of depreciation, had no impairment loss been recognised for the asset in prior years. Such reversal is recognised in the statement of activities. Their subsquent recognition and measurement will depend on their classification.
XI. Financial instruments — initial recognition and subsequent measurement - Policy applicable from 1 January 2018
A financial instrument will be recognised in the statement of financial position when the Institute becomes party to contractual provisions of the instrument. At initial recognition, financial instruments are either measured at amortised cost or fair value through profit or loss or other comprehensive income (OCI). This is recognised less the costs that are directly attributable to the acquisition or issue of the financial asset or the financial liability. The fair value at initial recognition will be the transaction price unless there is evidence to show that it is not the case.
“The above classification depends on both the contractual characteristics of the financial instruments and the business model adopted for their management, which is determined at the time of initial recognition. Financial assets that are subsequently measured at either amortized cost or debt instruments at fair value through profit or loss or OCI, are subject to provisions for impairment.

16 17
The financial assets applicable to the Institute are:i) cash and cash equivalents and ii) loans and receivables.” Subsquent measurement Following the initial recognition of financial
assets and liabilities, their subsquent measurement and accounting treatment depends on their classification though there are a few exceptions to this. Either finanacial assets and liabilities that classified as fair value through profit or losses and other comprehensive income are measured at fair value or financial assets and liabilities at amortised cost. Amortised cost will be calculated using the effective interest rate.
Financial assets at amortised cost Financial assets are classified at amortized
cost only if both of the following criteria are met:
1. The objective of the entity’s business model is to hold the asset in order to collect the contractual cash flows; and
2.The contractual terms give rise on specified dates to cash flows that are solely payments of principal and interest on the principal outstanding:
(i) Principal is the fair value of the financial asset at initial recognition.
(ii) Interest consist of consideration for the time value of money, for the credit risk associated with the principal amount outstanding during a particular period of time and for other basic lending risks and costs, as well as a profit margin.
Interest income from these financial assets is included in finance income using the effective interest rate method. Any gain or loss arising on derecognition is recognised directly in profit or loss and presented in other gains/(losses) together with foreign exchange gains and losses. Impairment losses are presented as separate line item in the statement of profit or loss.
Financialasset,atfairvaluethroughprofitor loss (“FVTPL”)
Financial assets that are classified at fair value through profit or loss are initially measured at fair value and subsequently carried at fair value on the statement of financial position with all changes in fair value gains and losses and foreign exchange gains and losses, recognized in the income statement in the period in which they occur. Transaction costs on these financial assets are expensed in the income statement.
In addition, a debt instrument that could meet amortized cost criteria can be designated and measured at FVTPL. Upon initial recognition if such designation significantly reduces or eliminates a measurement or recognition inconsistency, referred to as an “accounting mismatch”, which would arise from measuring assets or recognizing the gains and losses on them on different bases
Financial assets, at fair value through other comprehensive income(“FVOCI”)
Assets that are held for collection of contractual cash flows and for selling the financial assets, where the assets’ cash flows represent solely payments of principal and interest, are measured at FVOCI. Movements in the carrying amount are taken through OCI, except for the recognition of impairment gains or losses, interest income and foreign exchange gains and losses which are recognised in profit or loss. When the financial asset is derecognised, the cumulative gain or loss previously recognised in OCI is reclassified from equity to profit or loss and recognised in other gains/(losses). Interest income from these financial assets is included in finance income using the effective interest rate method. Foreign exchange gains and losses are presented in other gains/(losses) and impairment expenses are presented as separate line item in the statement of profit or loss.
Impairment “For IITA, and in accordance with IFRS 9,
a loss allowance for expected credit losses is recognized on financial assets that are measured (i) at amortized cost (ii) at fair value through profit or loss or other comprehensive income.
The Instiute assesses on a forward looking basis the expected credit losses associated with its debt instruments carried at amortised cost and FVOCI. The impairment methodology applied depends on whether there has been a significant increase in credit risk.”
Financial liabilities Financialliabilitiesareclassifiedaseither
financial liabilities ‘at FVTPL’ or ‘otherfinancialliabilities’.
“Other financial liabilities (including borrowings and trade and other payables) are measured at fair value at initial recognition and subsequently at amortised cost using the effective interest method.
The effective interest method is a method of calculating the amortised cost of a financial liability and of allocating interest expense

16 17
over the relevant period. The effective interest rate is the rate that exactly discounts estimated future cash payments (including all fees and points paid or received that form an integral part of the effective interest rate, transaction costs and other premiums or discounts) through the expected life of the financial liability, or (where appropriate) a shorter period, to the net carrying amount on initial recognition.
The Institute derecognises financial liabilities when and only when, the Institute’s obligations are discharged, cancelled or they expire. The difference between the carrying amount of the financial liability derecognised and the consideration paid and payable is recognised in profit or loss.”
Renegotiated financial assets Modifications occur when the contractual cash
flows of a financial asset are renegotiated or otherwise modified. Some modifications result in derecognition of the existing asset and recognition of a new asset, while other modifications do not result in derecognition. Modifications that result in derecognition are considered to be substantial modifications. An exambple of these modifications will be when IITA renegotiates an agreement with the donors.
Write-offs According to the IFRS 9, the gross carrying
amount of a financial asset may be directly reduced when there is no reasonable expectation of recovering the financial asset in its entirety or a portion of it. As such, IITA can write of the write all receivables that have reached stage 3. The Institute can also on an ad-hoc basis examine any financial assets for write off.
Cash and cash equivalents Cash is a financial asset because it represents
the medium of exchange and is therefore the basis on which all transactions are measured and recognised in the financial statements. Cash deposits in banks give IITA the right to receive cash or draw cheques or other instruments against a favourable balance. All cash and bank balances will be recognised at fair value which is the transaction price unless their are indications that it has been impaired. IITA maintains the bulk of its funds in in US Dollars which helps in mitigating against exchage risks against local currencis in countries where the Institute operates.
Accounts receivable – Employees After initial measurement, accounts
receivable from employees are subsequently measured at amortised cost using the effective interest rate (EIR) method, less impairment. Amortised cost is calculated by taking into account any discount or premium on acquisition and fees or costs that are an integral part of the EIR. The EIR amortisation is included in the statement of activities. The losses arising from impairment are recognised in the statement of activities.
Derecognition A financial asset (or, where applicable, a
part of a financial asset or part of a group of similar financial assets) is derecognised when:
- The rights to receive cash flows from the asset have expired, or
- IITA has transferred its rights to receive cash flows from the asset or has assumed an obligation to pay the received cash flows in full without material delay to a third party under a ‘pass-through’ arrangement, and either
i. IITA has transferred substantially all the risks and rewards of the asset, or
ii. IITA has neither transferred nor retained substantially all the risks and rewards of the asset, but has transferred control of the asset.
XI. Financial instruments — initial recognition and subsequent measurement - Policy applicable prior to 1 January 2018
A financial instrument is any contract that gives rise to a financial asset of one entity and a financial liability or equity instrument of another entity.
Financial assets Initial recognition and measurement Financial assets are classified, at initial
recognition, as financial assets at fair value through profit or loss, loans and receivables, held-to-maturity investments, available for sale financial assets, or as derivatives designated as hedging instruments in an effective hedge, as appropriate. IITA only has loans and receivables.
All financial assets are recognised initially at fair value plus, in the case of assets not at fair value through profit or loss, transaction costs that are attributable to the acquisition of the financial asset.

18 19
Exhibit II. CGIAR Funds: Windows 1&2
Subsequent measurement The subsequent measurement of financial
assets depends on their classification as described below:
Accounts receivable – Donors:These are claims held against donors for the future receipt of money, goods, or services. Receivables due from donors can arise from unrestricted grants that are due as a receivable by the Center and amounts due from restricted grants that have been negotiated between a donor and the Center.Unrestricted accounts receivable are recognized initially at fair value. Restricted grants are recognized and measured at cost. After initial recognition such accounts receivable are subsequently measured at amortised cost.
“Accounts receivable – Donors” are classified as follows:Unrestricted grants: Receivables from unrestricted grants are recognized in full in the period specified by the donor. Restricted grants: Receivables from restricted grants are recognized in accordance with the terms of the underlying contract. Restricted grants include projects financed by W1/W2, W3, and Bilateral funding.
Accounts receivable – EmployeesAfter initial measurement, accounts receivable from employees are subsequently measured at amortised cost using the effective interest rate (EIR) method, less impairment. Amortised cost is calculated by taking into account any discount or premium on acquisition and fees or costs that are an integral part of the EIR. The EIR amortisation is included in the statement of activities. The losses arising from impairment are recognised in the statement of activities.
Derecognition A financial asset (or, where applicable, a part
of a financial asset or part of a group of similar financial assets) is derecognised when:
- The rights to receive cash flows from the asset have expired, or- IITA has transferred its rights to receive cash flows from the asset or has assumed an obligation to pay the received cash flows in full without material delay to a third party under a ‘pass-through’ arrangement, and eitheri. IITA has transferred substantially all the risks and rewards of the asset, or
ii. IITA has neither transferred nor retained substantially all the risks and rewards of the asset, but has transferred control of the asset.
XI. Financial instruments — initial recognition and subsequent measurement - Continued
Impairment of financial assets Disclosures relating to impairment of financial
assets are summarised in the following notes:
- Disclosures for significant assumptions - Note 4
- Account receivables - Note 10IITA assesses, at each reporting date, whether there is any objective evidence that a financial asset or a group of financial assets is impaired. An impairment exists if one or more events that has occurred since the initial recognition of the asset (an incurred ‘loss event’), has an impact on the estimated future cash flows of the financial asset that can be reliably estimated. Evidence of impairment may include indications that the donor or a group of donors is experiencing significant financial difficulty, the probability that they will enter bankruptcy or other financial reorganisation and where observable data indicates that there is a measurable decrease in the estimated future cash flows.Financial assets carried at amortised cost
For financial assets carried at amortised cost, IITA first assesses whether impairment exists individually for financial assets. Assets that are individually assessed for impairment and for which an impairment loss is, or continues to be, recognised are not included in a collective assessment of impairment.
The amount of any impairment loss identified is measured as the difference between the asset’s carrying amount and the present value of estimated future cash flows (excluding future expected credit losses that have not yet been incurred). The present value of the estimated future cash flows is discounted at the financial asset’s original effective interest rate.The carrying amount of the asset is reduced through the use of an allowance account and the amount of the loss is recognised in the management and general expenses line in the statement of activities. Interest income continues to be accrued on the reduced carrying amount using the rate of interest used

18 19
to discount the future cash flows for the purpose of measuring the impairment loss. The interest income is recorded as part of other revenue and gains in the statement of activities.
Loans, together with the associated allowance are written off when there is no realistic prospect of future recovery. If a write-off is later recovered, the recovery is credited to other operating income the statement of activities.
Financial liabilities Initial recognition and measurement Financial liabilities are classified, at initial
recognition, as financial liabilities at fair value through profit or loss and other financial liabilities.
Financial liabilities are recognised initially at fair value. Financial liabilities include payables employees, CGIAR Centres and other payables. After initial recognition, taking into account the payment policy of the Center, account payables are measured at amortised cost which does not have significant differences with the fair value.
Derecognition A financial liability is derecognised when the
obligation under the liability is discharged or cancelled or expires. When an existing financial liability is replaced by another from the same lender on substantially different terms, or the terms of an existing liability are substantially modified, such an exchange or modification is treated as a derecognition of the original liability and the recognition of a new liability. The difference in the respective carrying amounts is recognised in statement of activities.
Offsettingoffinancialinstruments Financial assets and financial liabilities are
offset with the net amount reported in the statement of financial position only if there is a current enforceable legal right to offset the recognised amounts and an intention to settle on a net basis, or to realise the assets and settle the liabilities simultaneously. The legally enforceable right must not be contingent on future events and must be enforceable in the normal course of business and in the event of default, insolvency or bankruptcy of the Institute or counterparty.
Impairment of financial assets Disclosures relating to impairment of financial
assets are summarised in the following notes:
- Disclosures for significant assumptions- Note 3
- Account receivables- Note 10 Financial liabilities Initial recognition and measurement Financial liabilities are classified, at initial
recognition, as financial liabilities at fair value through profit or loss and other financial liabilities.
Financial liabilities are recognised initially at fair value. Financial liabilities include payables employees, CGIAR Centres and other payables. After initial recognition, taking into account the payment policy of the Center, account payables are measured at amortised cost which does not have significant differences with the fair value.
XII.Employeebenefits Short - term benefits Short-term employee benefit obligations are
measured on an undiscounted basis and are expensed as the related service is provided.
Post - employment benefit Defined contribution plan Pension IITA operates a defined contribution
pension plan. Fixed contributions are paid to a separate entity. Once contributions are paid, IITA has no further obligation to the employee. Obligations for contributions to defined contribution plans are recognized as personnel cost in statement of activities in the periods during which services are rendered by employees. Staff contributions to the scheme are funded through payroll deductions.
Definedbenefitplan Repatriation benefit IITA provides repatriation benefits to its
internationally recruited staff. These benefits are payable on the return of the employee to his country of origin. The cost of providing benefits under the post retirement benefit plan is determined separately using the projected unit credit method. The benefit is discounted using the effective interest rate (EIR) the at the date of reporting. The benefit is amortised and recorded as a liability, the unwinding of the discount is recorded as an interest cost and the current service cost are recorded as personnel cost in the statement of activities.

20 21
Re - measurements, comprising of actuarial gains and losses, are recognized immediately in the statement of financial position with a corresponding debit or credit to undesignated fund through other comprehensive income in the period in which the gains or losses occur. Re - measurements are not reclassified to the statement profit or loss in subsequent periods.
Interest cost is calculated by applying the discount rate to the defined benefit liability. The Institute recognises the following changes in personnel cost under ‘management and general expenses in the statement of activities:
- Current service cost - Interest cost Other long term employee benefits Severance benefits IITA pays severance benefits to its employees
on the expiration of their respective contracts. The benefit is measured as the excess of 10% of gross emoluments over IITA contribution to the employee’s pension fund.
XIII. Prepayment Prepayments are payments made in advance
for services to be enjoyed in future. The amount is initially capitalised in the reporting period in which the payment is made and subsequently amortised over the period in which the service is to be enjoyed.
XIV. Interest income Interest income is recognised in the statement
of activities when it is probable that economic benefits will flow to the Institute and that amount can be reliably measured.
XV. Deferred income – Donors These include grants received from donors
for which conditions are not yet met and funds received in advance for restricted grants.
“Deferred income – Donors” are classified as follows:
“Unrestricted grants: are those received from the unconditional transfer of cash or other assets to the Center.”
Restricted grants: are those received from a transfer of resources to the Center in return for future compliance relating to the operating activities of the Center. Restricted Grants include W1/W2, W3, and Bilateral projects.
XVI. Indirect Cost Recovery “The indirect cost recovery represents the
overhead cost recovered from the restricted projects based on rates agreed and as stated in each project agreement with donors. Calculation of indirect cost recovery rate is based upon Section 10 of CGIAR Financial Guidelines Series, No. 5, “Cost Allocation Guidelines”.
XVII. Net assets Net assets comprise the residual interest
in the Institute’s assets after liabilities are deducted. They are classified as either undesignated or designated:
Undesignated net assets : Their use is not designated by IITA Management for specific purposes.
Designated net assets: Those that have been restricted by IITA as reserve for replacing property, plant and equipment, intangible assets and other activities or purposes.

20 21
International Institute of Tropical AgricultureNotes to the Financial Statements
for the year ended 31 December, 2018
4.Significantaccountingjudgments,estimates and assumptions
The preparation of IITA’s financial statements requires management to make judgements, estimates and assumptions that affect the reported amounts of revenues, expenses, assets and liabilities, and the accompanying disclosures, and the disclosure of contingent liabilities. IITA has identified the following areas where significant estimates and assumptions are required, and where if actual results were to differ, may materially affect the financial position or financial results reported in future periods. Further information on each of these and how they impact the various accounting policies are described in the relevant notes to the financial statements.
Judgements No judgment has been applied by the
management of IITA in the process of applying the accounting policies.
Estimates and assumptionsThe key assumptions concerning the future and other key sources of estimation uncertainty at the reporting date, that have a significant risk of causing a material adjustment to the carrying amounts of assets and liabilities within the next financial year, are described below. IITA based its assumptions and estimates on parameters available when the financial statements were prepared. Existing circumstances and assumptions about future developments, however, may change due to market changes or circumstances arising that are beyond the control of IITA. Such changes are reflected in the assumptions when they occur.
Impairment of financial assetsThe Institute reviews the estimation for impairment of receivable at the end of each reporting period and reflects the changes on a prospective basis.Depreciation and carrying value of property, plant and equipment and intangible assetsThe estimation of the useful lives of assets is based on management’s judgement. Any material adjustment to the estimated useful
lives of items of property, plant and equipment and intangible assets will have an impact on the carrying value of these items.
Definedbenefitplan Repatriation benefit The cost of the defined benefit plan namely:
the repatriation benefit is determined using the projected unit credit method (PUCM) to determine the present value of the obligation at the end of each reporting period. The PUCM involves making various assumptions that may differ from actual developments in the future. These include the determination of the discount rate and contract renewal period. Due to the complexities involved in the valuation and its long-term nature, other long term employee obligation is highly sensitive to changes in these assumptions. All assumptions are reviewed at each reporting date. The parameter most subject to change is the discount rate. In determining the appropriate discount rate to use, management's assumptions and yields on United States of America (USA) Treasury bills were used.
The assumptions used in estimating the obligation are:
- flight ticket increment rate - the number of family members - contract period

22 23
International Institute of Tropical AgricultureNotes to the Financial Statements
for the year ended 31 December, 2018
5. Other operating income2018 2017
($'000) ($'000)
Other revenue and gains - Unrestricted (interest income on short term investment) 14 40 Other revenue and gains - Unrestricted (gain on disposal of PPE) 26 Interest income 2 16
42 56
6. Program-related expensesProgram related expenses are expenses incurred by main research, research support, training and information services as described below:
i) Research programs: cover expenses on research for development in sub-Saharan Africa.
ii) Research support programs: include genetic resource and biometrics units, farm operations, plant growth facilities, post-harvest engineering, analytical laboratory and research management.
iii) Training costs: include training offices, fellowships, workshops, seminars, allowances to trainees and training-related travel.
iv) Information services: cover the costs of publication of annual reports and technical bulletins, translation and printing of various public information activities and library service.
Program related expenses incurred as of 31 December are as follows:
2018 2017($'000) ($'000)
Research - programs and support 72,804 83,108 Training 3,598 3,501 Information services 437 604
76,839 87,213
Represented by (per statement of activities)2018 2017$’000 $’000
Research expenses 62,675 65,776 CGIAR collaboration expenses 1,384 6,161 Non-CGIAR collaboration expenses 12,780 15,276
76,839 87,213

22 23
International Institute of Tropical AgricultureNotes to the Financial Statements
for the year ended 31 December, 2018
Expressed in US$ Thousands
7. Management and general expensesManagement and general expenses in the accompanying statement of activity consist of:
i) General Administration: Covers the costs of Board of Trustees, Director General’s office, administration, internal audit, finance, human resources, personnel, and purchasing departments.
ii) General Operations: Include expenses on physical plant services, utilities, communications, security, catering and general services.
Management and general expenses incurred as of 31 December were as follows: 2018 2017
($’000) ($’000)General administration and operations 10,415 11,394
8. Expenses and LossesExpensesbyNatureClassification
31 December 2018 Restricted
Unrestricted Restricted CRPs Non-CRPs TotalPersonnel Cost 10,827 23,712 3,493 38,032CGIAR Collaboration – 1,104 280 1,384Non-CGIAR Collaboration – 11,944 836 12,780Supplies and Services (2,869) 22,189 6,262 25,582Travel 249 3,937 1,254 5,440Cost Sharing Percentage – CSP 5 457 – 462Depreciation 1,037 1,722 789 3,548Amortization 26 – – 26Sub-total 9,275 65,065 12,914 87,254Indirect Cost Recovery (9,218) 8,553 665 –Total Expenses 57 73,618 13,579 87,254
31 December 2017 Restricted
Unrestricted Restricted CRPs Non-CRPs TotalPersonnel Cost 8,649 24,075 3,718 36,262CGIAR Collaboration – 5,130 1,031 6,161Non-CGIAR Collaboration – 12,950 2,326 15,276Supplies and Services 716 24,825 6,097 31,638Travel 1,107 3,794 1,042 5,943Cost Sharing Percentage – CSP 12 480 – 492Depreciation 1,054 1,554 191 2,799Amortization 36 – – 36Sub-total 11,394 72,808 14,405 98,607Indirect Cost Recovery (10,877) 10,257 620 –Total Expenses 517 83,065 15,025 98,607

24 25
9. Cash and Short term deposits 31 December 31 December
2018 2017($'000) ($'000)
Cash on hand 533 362Cash at bank 7,076 4,686Short term deposits – 3,426Investments – –
7,609 8,474
Cash at banks earns interest at floating rates based on daily bank deposit rates. Short-term deposits are made for varying periods of between one day and twelve months, depending on the immediate cash requirements of the Institute, and earn interest at the respective short-term deposit rates.
Forthepurposeofthestatementofcashflows,cashandcashequivalentconsist:
31 December 31 December2018 2017
($'000) ($'000)
Cash on hand 533 362Cash at bank 7,076 4,686Short term deposits – 3,426
7,609 8,474
10. Accounts Receivable
31 December 31 December2018 2017
($’000) ($’000)Donors (10.1) 21,456 21,646Employees 1,031 1,172CGIAR Centers 3,715 3,153Other Receivables (10.3) 518 162
26,729 26,133
10.1 Accounts Receivable – Donors As at December 31, accounts receivable from donors consist of:
31 December 31 December 2018 2017
($'000) ($'000)Unrestricted 73 –CRP Windows 1 & 2 3,876 3,692CRP Window 3 3,811 2,650Bilateral 6,672 8,132Non-CRP 7,493 7,719Challenge Programs 665 241
22,590 22,434Allowance for impairment (1,125) (788)
21,465 21,646 Account receivables from donors are non-interest bearing and are generally on items stated in the contract.

24 25
10.1 Accounts Receivable – DonorsAt 31 December 2018 IITA carried out an impairment assessment on all outstanding receivables from donors and an of $1,125,000 amount was found to be impaired and provided for. As at 31 December 2017, Accounts receivables from donors with an initial carrying value of $788,000 were impaired and fully provided for. See below the movements in the allowance for impairment:
Individually impaired($'000)
At 31 December 2016 1,312Reversal of impairment allowance no longer needed (524)At 31 December 2017 788Charge for the year 337At 31 December 2018 1,125
Impairment was recognised in management and general expenses in the statement of activities. See Note 21 on credit risk of accounts receivables from donors, which states how management manages its receivables from donors.
10.2 Accounts Receivable – EmployeesAs at December 31, accounts receivable from employees consist of:
31 December 31 December2018 2017
($'000) ($'000)Staff Loans 995 1,138Children educatiion advance 15 23Staff salary expenses 21 11
1,031 1,172
10.3 Accounts Receivable – Others As at December 31, accounts receivable: Others consist of:
31 December 31 December2018 2017
($'000) ($'000)Receivables from Stations 355 –Local Debtors 26 70Other Receivables 30 18Other NRS Receivables 107 74
518 16211 PrepaymentsPrepaid expenses as at December 31 consist of:
31 December 31 December2018 2017
($'000) ($'000)Insurance – 399Rent 3 156
3 55512 Inventories
31 December 31 December2018 2017
($'000) ($'000)Stores on hand 3,033 2,955Allowance for obsolescence (1,553) (1,509)
1,480 1,446Goods in transit 144 46
1,624 1,492In 2018 $0 (2017: $659) was recognised as an expense for inventories carried at net realisable value.This is recognised in managementand general expenses in the statement of activities.
26 27
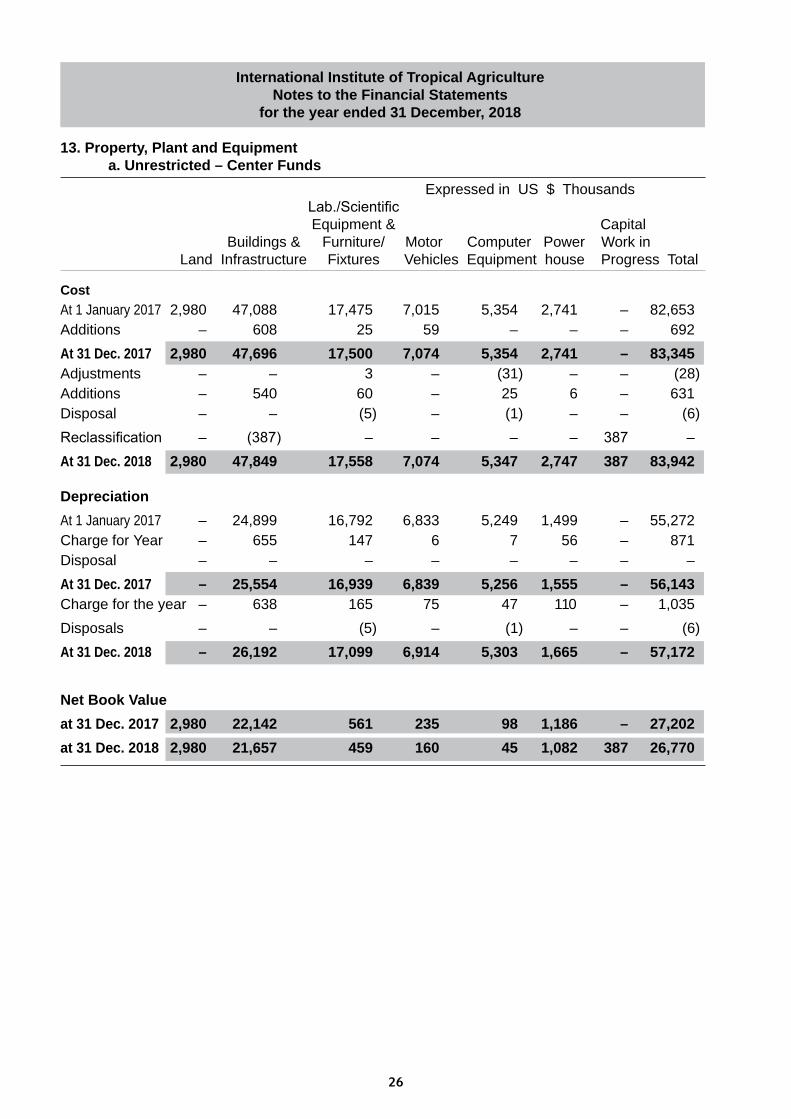
13. Property, Plant and Equipment a. Unrestricted – Center Funds
Expressed in US $ Thousands Lab./Scientific
Equipment & Capital Buildings & Furniture/ Motor Computer Power Work in
Land Infrastructure Fixtures Vehicles Equipment house Progress Total
CostAt 1 January 2017 2,980 47,088 17,475 7,015 5,354 2,741 – 82,653Additions – 608 25 59 – – – 692At 31 Dec. 2017 2,980 47,696 17,500 7,074 5,354 2,741 – 83,345Adjustments – – 3 – (31) – – (28)Additions – 540 60 – 25 6 – 631Disposal – – (5) – (1) – – (6)Reclassification – (387) – – – – 387 –At 31 Dec. 2018 2,980 47,849 17,558 7,074 5,347 2,747 387 83,942
DepreciationAt 1 January 2017 – 24,899 16,792 6,833 5,249 1,499 – 55,272Charge for Year – 655 147 6 7 56 – 871Disposal – – – – – – – –At 31 Dec. 2017 – 25,554 16,939 6,839 5,256 1,555 – 56,143Charge for the year – 638 165 75 47 110 – 1,035Disposals – – (5) – (1) – – (6)At 31 Dec. 2018 – 26,192 17,099 6,914 5,303 1,665 – 57,172
Net Book Valueat 31 Dec. 2017 2,980 22,142 561 235 98 1,186 – 27,202at 31 Dec. 2018 2,980 21,657 459 160 45 1,082 387 26,770
International Institute of Tropical AgricultureNotes to the Financial Statements
for the year ended 31 December, 2018

26 27
b.RestrictedProjectsExpressed in US $ Thousands
Lab./Scientific Equipment & Capital
Buildings & Furniture/ Motor Computer Power Work in Land Infrastructure Fixtures Vehicles Equipment house Progress Total
CostAt 1 January 2017 – 2,069 344 922 84 – – 3,419Additions – – 108 95 58 – – 261At 31 Dec. 2017 – 2,069 452 1,017 142 – – 3,680 Adjustments – – – – – – – –Additions – – 356 438 41 – – 835At 31 Dec. 2018 – 2,069 808 1,455 183 – – 4,515
DepreciationAt 1 January 2017 – 100 204 404 38 – – 746Charge for Year – 39 99 242 23 – – 403At 31 Dec. 2017 – 139 303 646 61 – – 1,149Charge for the year – 43 386 614 97 – – 1,140At 31 Dec. 2018 – 182 689 1,260 158 – – 2,289
Net Book Valueat 31 Dec. 2017 – 1,930 149 371 81 – – 2,531at 31 Dec. 2018 – 1,887 119 195 25 – – 2,226
Following IFRS, cost of property, plant and equipment still in use acquired with restricted funds before the date of transition to IFRS were capitalised.
International Institute of Tropical AgricultureNotes to the Financial Statements
for the year ended 31 December, 2018

28 29
LandBuildings &
Infrastructure
Lab./Scientific Equipment &
FurnitureFixtures
MotorVehicles
ComputerEquipment
Powerhouse
CapitalWork in
Progress Total
LandBuildings &
Infrastructure
Lab./Scientific Equipment &
FurnitureFixtures
MotorVehicles
ComputerEquipment
Powerhouse
CapitalWork in
Progress Total
Expressed in US $ Thousands
Expressed in US $ Thousands
At 31 Dec. 2018 2,980 49,918 18,366 8,529 5,531 2,747 387 88,457At 31 Dec. 2017 2,980 49,765 17,952 8,091 5,496 2,741 - 87,025
The total accumulated deprecation for both restricted and unrestricted assets are presented below:
The total net book value for both restricted and unrestricted assets are presented below:
The total cost for both restricted and unrestricted assets are presented below:
At 31 Dec. 2018 - 26,374 17,788 8,174 5,461 1,665 - 59,461At 31 Dec. 2017 - 25,693 17,242 7,485 5,317 1,555 - 57,292
LandBuildings &
Infrastructure
Lab./Scientific Equipment &
FurnitureFixtures
MotorVehicles
ComputerEquipment
Powerhouse
CapitalWork in
Progress Total
Expressed in US $ Thousands
At 31 Dec. 2018 2,980 23,544 579 355 70 1,082 387 28,996At 31 Dec. 2017 2,980 24,072 710 606 179 1,186 - 29,733
International Institute of Tropical AgricultureNotes to the Financial Statements
for the year ended 31 December, 2018

28 29
14. Intangible assets
ComputerSoftware
Cost ($'000)At 1 January 2017 518Additions 21At 31 December 2017 539Additions 315At 31 December 2018 854
AmortisationDisposal –At 1 January 2017 477Charge for the year 36At 31 December 2017 513Charge for the Year 26At 31 December 2018 539
Net Book Value At 31 December 2018 315At 31 December 2017 26
Intangible assets comprises of a purchased software that has been customised to suit the requirements of the Institute. The amortisation charged on the intangible asset was recognised in management and general expenses in the statement of activities.
15. Other Assets31 December 31 December
2018 2017($’000) ($’000)
Other Assets 906 906
Other Assets relate to receivable due to IITA on Business incubation Platform’s operations, repayable beyond twelve months.
International Institute of Tropical AgricultureNotes to the Financial Statements
for the year ended 31 December, 2018

30 31
16. Accounts payable31 December 31 December
2018 2017($'000) ($'000)
Donors (16.1) 13,781 16,094Employees (16.2) 8,992 8,468CGIAR Centers 133 359Other payables (16.3) 2,741 2,080
25,647 27,001
Terms and conditions of the above financial liabilities:Trade and other payables are non-interest bearing and are normaly settled on demandFor explanations on the Institute’s liquidity risk management processes, refer to Note 23.
16.1 Donors31 December 31 December
2018 2017($'000) ($'000)
Payables to donors as at December 31 consist of: CRP Windows 1 & 2 408 49CRP Window 3 10,090 8,381Bilateral 2,315 2,818Non-CRP 968 4,825Challenge Programs – 21
13,781 16,094
16.2 Accounts Payables - EmployeesAccounts Payable to employees as at December 31 consist of:
31 December 31 December 2018 2017
($'000) ($'000)Vacation benefits 1,700 1,749Pension Payable 255 138Medical Benefits – 117Staff Remuneration 6,821 6,464
8,776 8,468
Staff remuneration consist of amounts due to IRS staff who receive their salaries through their IITA personal accounts awaiting instructions to transfer to their respective personal accounts.
16.3 Other PayablesOther accounts payable as at December 31 consist of:
31 December 31 December 2018 2017
($'000) ($'000)Financial liabilitiesAccrued Liabilities 40 994Vendors 2,701 947Stale cheques – 42
2,741 1,983Non-Financial liabilitiesInvestment RecoveryWithholding tax payable 4 13Payroll taxes 212 84
216 97

30 31
17.Employeebenefitliability31 December 31 December
2018 2017 ($'000) ($'000)
Repartriation benefit (17.1) 1,174 1,218Severance benefit 660 513
1,834 1,731
IITA provides repatriation benefits to its internationally recruited staff. These benefits are payable on the return of the employee to his/ her country of origin.
The following tables summarise the components of net benefit expense recognised in the statement of activities and other comprehensive income.
31 December 2018 ($'000)
Current service cost 237Interest cost 36Defined benefit expenses 273
31 December 2017
($'000)Current service cost 136Interest cost 37Defined benefit expenses 173
Re-measurement losses recognised in other comprehensive income: ($'000)
31 December 2018 (186)31 December 2017 90
The factor below contributed to the re-measurement losses on the repartriation benefit:
Changes in assumptions
31 December 2018 (186)31 December 2017 (90)
Changes in the present value obligation reported in the statement of financial position is as follows:
31 December 31 December 2018 2017
($'000) ($'000)Present Value of obligation at the beginning 1,218 1,378Recognised in statement of activities:Interest Cost 36 37Current service cost 237 136Benefit paid (131) (243)Recognised in other comprehensive income:Re-measurement gains (186) (90)Present value of obligation at the end 1,174 1,218

32 33
International Institute of Tropical AgricultureNotes to the Financial Statements
for the year ended 31 December, 2018
The key economic assumptions (per annum) used in determining gratuity plan benefit obligations for the repatriation benefit plan are shown below:
31 December 2018 31 December 2017 % % Discount rate 2.95 2.65 Ticket fare growth rate 5 5
Repatriation benefit payable in the future was discounted using the interest rate on US treasury bills. Factors considered in the discounting include; contract tenure of the employees and ticket prices.
A quantitative sensitivity analysis for significant assumption on the repatriation benefit as at 31 December 2018 is as shown below:
Discount rate 1% Increase 1% Decrease
$'000 $'000 Impactonthedefinedbenefitobligation (12) 12
Ticket fare 1% Increase 1% Decrease
$'000 $'000 Impactonthedefinedbenefitobligation (70) 73
Sensitivity analysis has been performed using automated actural methods currently in use.
17.Employeebenefitliability-Continued A quantitative sensitivity analysis for significant assumption on the repatriation benefit as at
31 December 2018 is as shown below: Discount rate 1% Increase 1% Decrease $'000 $'000 Impactonthedefinedbenefitobligation (12) 12
Ticket fare 1% Increase 1% Decrease
$'000 $'000 Impactonthedefinedbenefitobligation (104) 104
The sensitivity analyses above have been determined based on a method that extrapolates the impact on defined benefit obligation as a result of reasonable changes in key assumption occurring at the end of the reporting period. The sensitivity analyses is based on a change in a significant assumption, keeping all other assumptions constant. The sensitivity analyses may not be representative of an actual change in the defined benefit obligation as it is unlikely that changes in assumptions would occur in isolation of one another.
The Institute is committed towards ensuring that all obligations arising from the post employment benefit in the foreseeable future are settled.
18. Deferred income from donors31 December 2018 31 December 2017
$'000 $'000 At 1 January 2,531 2,673 Deferred during the year 835 345 Released to the statement of activities (1,140) (487) At 31 December 2,226 2,531

32 33
International Institute of Tropical AgricultureNotes to the Financial Statements
for the year ended 31 December, 2018
31 December 2018 31 December 2017 $'000 $'000
Current 835 345Non-current 1,391 2,186Others 2,226 2,531
19. Net Assets Net assets are the residual interest in the Institute’s assets remaining after liabilities are
deducted. These are classified as follows:(a) Undesignated net assets That part of net assets not designated by Institute’s management for specific purposes.
(b) Designated net assets That part of net assets designated by Institute’s management for specific purposes.
- Designation for future acquisition/replacement of property, plant and equipment and intangible assets
- Designation of net investment in property and equipment Portion of the unrestricted net assets designated to reflect net investment in property, plant and
equipment and intangible assets.
The following is a summary of net assets for the year ended 31 December: 31 December 2018 31 December 2017
$'000 $'000 Total undesignated 6,786 6,367
Designated: Acquisition and replacement of property and equipment (622) (1,070) Institutional stability and research for development programs 1,000 1,000 Net investment in intangible assets 315 26 Net investment in property, plant and equipment 28,996 29,733 Total designated 29,689 29,689 Total net assets 36,475 -36,056

34 35
20. Fair value measurement Set out below is a comparison by class of the carrying amounts and fair values of
IITA’s financial instruments, other than those with carrying amounts that are reasonable approximations of fair values:
Carrying amount Fair value 2018 2017 2018 2017$'000 $'000 $'000 $'000
Financial assets Accountsreceivable–Employeesstaffloans 479 1,138 449 684
"The management assessed that cash and short-term deposits, accounts receivable (CGIAR Centers and others), accounts payable (CGIAR Centers and others) approximate their carrying amounts largely due to the short-term maturities of these instruments.The fair value of loans receivable from employees is included at the amount at which the instrument could be exchanged in a current transaction between willing parties, other than in a forced or liquidation sale. The following method and assumptions were used to estimate the fair values:
The fair value of the employee loans was determined using the Discounted Cash Flow (DCF) model using discount rate that reflects the issuer's borrowing rate as at the end of the reporting period. The own non-performance risk as at 31 December 2018 was assessed to be insignificant.
The following table provides the fair value measurement hierarchy of the Institute's financial assets and liabilities:
Quantitative disclosures fair value measurement hierarchy for assets as at 31 December 2018 and 31 December 2017:
Fair value measurement using:
$'000 $'000 $'000 $'000 Financial assets for which fair values are disclosed: Accounts receivable – Employees 449 – 449 –
31 December 2017 Financial assets for which fair values are disclosed: Accounts receivable – Employees 684 – 684 –
During the reporting period ended 31 December 2018 and 31 December 2017, there were no transfers between Level 1 and Level 2.
21 Related party disclosures
Compensation of key management personnel 2018 2017$'000 $'000
Short-term employee benefits 5,503 5,327 Repatriation benefits 127 150 Pension benefits 1,078 1,065
6,708 6,542 The amounts disclosed in the table are the amounts recognised as an expense during the reporting period for key management personnel.
Quoted prices in Significant Significant
active observable unobservablemarkets inputs inputs
31 December 2018 Total (Level 1) (Level 2) (Level 3)
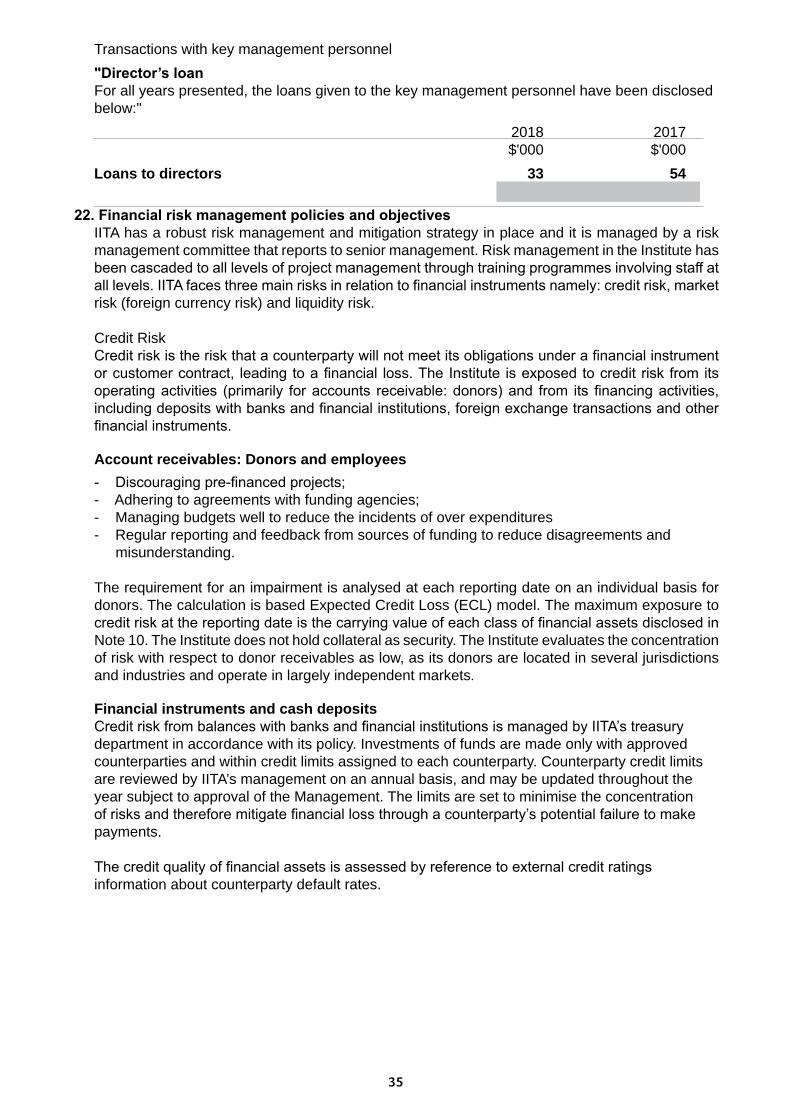
34 35
Transactions with key management personnel "Director’sloan For all years presented, the loans given to the key management personnel have been disclosed
below:" 2018 2017 $'000 $'000
Loans to directors 33 54
22.FinancialriskmanagementpoliciesandobjectivesIITA has a robust risk management and mitigation strategy in place and it is managed by a risk management committee that reports to senior management. Risk management in the Institute has been cascaded to all levels of project management through training programmes involving staff at all levels. IITA faces three main risks in relation to financial instruments namely: credit risk, market risk (foreign currency risk) and liquidity risk.
Credit Risk Credit risk is the risk that a counterparty will not meet its obligations under a financial instrument or customer contract, leading to a financial loss. The Institute is exposed to credit risk from its operating activities (primarily for accounts receivable: donors) and from its financing activities, including deposits with banks and financial institutions, foreign exchange transactions and other financial instruments.
Account receivables: Donors and employees - Discouraging pre-financed projects;
- Adhering to agreements with funding agencies; - Managing budgets well to reduce the incidents of over expenditures - Regular reporting and feedback from sources of funding to reduce disagreements and
misunderstanding.
The requirement for an impairment is analysed at each reporting date on an individual basis for donors. The calculation is based Expected Credit Loss (ECL) model. The maximum exposure to credit risk at the reporting date is the carrying value of each class of financial assets disclosed in Note 10. The Institute does not hold collateral as security. The Institute evaluates the concentration of risk with respect to donor receivables as low, as its donors are located in several jurisdictions and industries and operate in largely independent markets.
Financial instruments and cash deposits Credit risk from balances with banks and financial institutions is managed by IITA’s treasury
department in accordance with its policy. Investments of funds are made only with approved counterparties and within credit limits assigned to each counterparty. Counterparty credit limits are reviewed by IITA’s management on an annual basis, and may be updated throughout the year subject to approval of the Management. The limits are set to minimise the concentration of risks and therefore mitigate financial loss through a counterparty’s potential failure to make payments.
The credit quality of financial assets is assessed by reference to external credit ratings information about counterparty default rates.

36 37
31 December 31 December2017 2017
$'000 $'000 Cash and short-term deposits A 5,589 A+ 5,938 – B 242 41 B– 170 140 B+ 309 1,541 BBB– – 82 BB+ 181 305 CC 3 – Unrated 233 415 7,076 8,112
Cash on hand has been excluded from this rating. Ratings for the banks were obtained from the Fitch ratings
Credit rating keys:
“A: A financial institution of good financial condition and strong capacity to meet its obligations as and when they fall due. Adverse changes in the environment (macro-economic, political and regulatory) will result in a medium increase in risk attributable to an exposure to this financial institution. However, financial condition and ability to meets its obligations as and when they fall due should remain largely unchanged.”
“AA: A financial institution of very good financial condition and a strong capacity to meet its obligations as and when they fall due. However, financial condition and ability to meet obligations as and when they fall due should remain strong.”
“B: A financial institution where financial condition is weak but obligations are still being met as and when they fall due as more than one weakness and may require external support ,which, may not be assured. Adverse changes in the environment (macro-economic, political and regulatory) will increase risk significantly.”
“BB: Financial condition is satisfactory and ability to meet obligations as and when they fall due exist. Adverse changes in the environment (macro-economic, political and regulatory) will increase risk significantly.”
“BBB: A financial institution of satisfactory financial condition and adequate financial capacity to meet its obligations as and when they fall due. It may have one major weakness which, if addressed, should not impair its ability to meets obligations as and when they fall due. Adverse changes in the environment (macro-economic, political and regulatory) will result in a medium increase in risk attributable to an exposure to this financial institution.”
“A + (plus) or – (minus) may be added to a rating. A plus added to a rating indicates that the rating may be raised. A minus means that the rating may be lowered. When no plus or minus is added to the rating, this means that the rating is unlikely to change. A positive or negative added to a rating is therefore a reflection of the rating outlook.”
Market risk Market risk is the risk that the fair value of future cash flows of a financial instrument will fluctuate because of changes in market prices. Market prices comprise three types of risk: interest rate risk, currency risk and other price risk such as equity price risk and commodity price risk. IITA is only exposed to foreign currency risk.

36 37
Foreign currency risk Foreign currency risk is the risk that the fair value or future cash flows of an exposure will fluctuate because of changes in foreign exchange rates. IITA operates in 13 field stations in Africa and Europe. The main operating and reporting currency is the US. dollars (US$). The bulk of its funding from international cooperating partners is received in US. dollars (US$). Each of the field stations where IITA operates has its unique economic challenges. Most of the stations in Africa are operating in high inflation environment with volatile exchange rates as a result of this, IITA is exposed to foreign currency risks. Through its normal operations, IITA is exposed to nineteen (19) currencies. To mitigate against volatility in foreign exchange fluctuations, IITA keeps the bulk of its funds in US. dollars (US$) and only releases smaller amounts in tranches to meet operational needs. The Institute’s exposure to foreign currency changes for all other currencies are not material.
Liquidity riskThis is the risk that the Institute will not have enough funds to meet its obligation to pay implementing partners and suppliers of goods and services. IITA hedges against this by managing a tight budget processes and ensuring that only planned activities are carried out.
The table below summarises the maturity profile of the Institute’s financial liabilities based on contractual undiscounted payments:
Year ended 31 December 2018
On demand
Less than 3 months
3 to 12 months
1 to 5years
Total
$'000 $'000 $'000 $'000 $'000 Accounts payableCGIAR Centers 133 – – – 133 Other payables 2,744 – – – 2,744
Year ended 31 December 2017
On demand
Less than 3 months
3 to 12 months
1 to 5years
Total
$'000 $'000 $'000 $'000 $'000 Accounts payableCGIAR Centers 359 – – – 359 Other payables 1,983 – – – 1,983
23.Commitments and contingencies At 31 December 2018, the Institute had a commitment of $205,000 ( 2016: 902,000, 31 December
2017) to other parties for the construction of two buildings in Bukavu, Congo. However all contingencies which are relevant in assessing the Institute's state of affairs have been taken into consideration in the preparation of these financial statements.
24.Events after the reporting period No events or transactions have occurred since the balance sheet date, which would have a
material effect upon the financial statements at that date or which need to be mentioned in the financial statements in order to make them not misleading as to the financial position or results of operations.

38 39
Expressed in US$ Thousands
2018 PYFunds Accounts Advance CY Grant
Available Receivable Payments Grant 2017UnrestrictedBMZ, Germany – – – – 377Nigeria 175 73 – 248 230Total Unrestricted 175 73 – 248 607
International Institute of Tropical AgricultureStatement of Grant Revenue
for the Year Ended 31 December, 2018
Exhibit I. CGIAR Exhibit I. Unrestricted Grants

38 39
International Institute of Tropical AgricultureStatement of Grant Revenue
for the Year Ended 31 December, 2018
Exhibit IIExhibit II. CGIAR Funds: Windows 1&2
Expressed in US$ Thousands
2018 Funds Accounts Advance CY
Available Receivable Payments GrantCGIAR Funds: Windows 1&223: Policies, Institutions & Markets 166 10 – 176 125 14: Maize agri–food systems 1,209 552 – 1,761 2,06114: Maize agri–food systems 1/ – – – – 2816: Roots, Tubers & Bananas agri–food 2,749 500 – 3,249 3,200
systems16: Roots, Tubers & Bananas agri–food 672 913 – 1,585 1,717
systems 1/
18: Grain Legumes & Dryland Cereals 356 585 – 941 –agri–food systems
21: Agriculture for Nutrition & Health 1,457 200 – 1,657 1,60722: Climate Change, agriculture and 400 35 – 435 454
food security33: Genebank platform (routine) (405) 1,052 – 647 64733: Genebank platform (non–routine) 2,216 – (408) 1,808 2,13432: Big Data in Agriculture 132 29 – 161 113
Total CRP Windows 1 & 2 - Exhibit V 8,952 3,876 (408) 12,420 12,086
1/ W1&2 funds provided by CRP Lead Center based on sub-agreement, outside Program Participant Agreement (PPA)
PY Grant2017
Exhibit I. CGIAR Exhibit I. Unrestricted Grants

40 41
International Institute of Tropical AgricultureStatement of Grant Revenue
for the Year Ended 31 December, 2018
Expressed in US$ Thousands
2018 PY Funds Accounts Advance CY Grant
Available Receivable Payments Grant 2017
CRP Window 3 Austria 260 44 – 304 574Belgium 1,082 – (406) 676 1,746Bill & Melinda Gates Foundation 20,037 – (2,534) 17,503 16,201CIAT – – – – 4CIMMYT 2,026 39 – 2,065 2,103CIP 1,036 – (277) 759 567CIRAD 311 – (157) 154 –Comm. of the European Communities (913) 913 – – –Cornell University 258 1,337 – 1,595 –ICRISAT 1,209 6 – 1,215 1,817ILRI (939) 1,406 – 467 742International Fund for Agric. Dev. (IFAD) 640 – (18) 622 235Japan 61 66 – 127 155United States Agency for Int’l Dev. 21,360 – (6,696) 14,664 22,293World Bank 25 – (2) 23 –Closed Projects 2 – – 2 (1)
Total CRP Window 3 - Exhibit VI 46,455 3,811 (10,090) 40,176 46,436
Exhibit III. CRP Window 3Exhibit III. CGIAR
Exhibit I. Unrestricted Grants

40 41
Expressed in US$ Thousands
2018 PY Funds Accounts Advance CY Grant
Available Receivable Payments Grant 2017Bilateral / Challenge Programs AGRA (86) 86 – – 285Bill & Melinda Gates Foundation (37) 37 – – 9Catholic Relief Services (CRS) (17) 17 – – –CIMMYT 502 50 – 552 1,044Comm. of the European Communities 264 – (40) 224 56Common Fund (410) 410 – – –Cornell University 178 345 – 523 1,468Deloitte Consulting LLP 264 313 – 577 792Food and Agriculture Organization (64) 104 – 40 143GIZ 1,258 932 – 2,191 1,967Global Crop Diversity Trust (GCDT) 153 30 – 183 778ICRISAT 44 – (44) – –Japan 503 – (86) 417 590Netherlands 84 308 – 392 1,200Nigeria (748) 853 – 105 168Norway 3,367 – (1,429) 1,938 –Sweden (1) 87 – 86 27United States Agency for Int’l Dev. (38) 44 – 6 10United States Dept. of Agriculture 244 1,241 – 1,485 1,114Wageningen University 3,260 – (716) 2,544 5,109Miscellaneous Projects 5,523 1,697 – 7,220 8,403Closed Projects (110) 118 – 8 (16)Total Bilateral - Exhibit VII 14,133 6,672 (2,315) 18,491 23,147
Total Challenge Programs - Exhibit VIII 726 665 – 1,391 1,396
TOTAL 14,859 7,337 (2,315) 19,882 24,543
Total Non-CRP Activities - Exhibit IX 7,055 7,493 (969) 13,579 8,639
International Institute of Tropical AgricultureStatement of Grant Revenue
for the Year Ended 31 December, 2018
ExhibitIV.BilateralProjectsandChallengeProgramsExhibit IV
Exhibit II. CGIAR Funds: Windows 1&2Exhibit III. CGIAR
Exhibit I. Unrestricted Grants

42 43
Exhibit IVExhibit V. CRP Windows 1&2 Grants and Expenditures
Exhi
bit V
.
Inte
rnat
iona
l Ins
titut
e of
Tro
pica
l Agr
icul
ture
Stat
emen
t of P
ledg
es a
nd E
xpen
ditu
re31
Dec
embe
r, 20
18
Exp
ress
ed in
US$
Tho
usan
ds --
------
--- ---
------
----E
xpen
ses-
------
------
----
G
rant
P
rior
Cur
rent
CG
IAR
Fun
ds: W
indo
ws
1 &
2 (I
ITA
)G
rant
per
iod
ple
dged
y
ears
y
ear
Tot
al 2
3:
Polic
ies,
inst
itutio
ns, a
nd m
arke
ts
01/0
1/17
–31/
12/2
2 30
1 12
517
630
1 1
4:
Mai
ze a
gri-f
ood
syst
ems
01
/01/
17–3
1/12
/22
3,82
2 2,
061
1,76
1 3,
822
16:
R
oots
, tub
ers
and
bana
nas
agri-
food
sys
tem
s
01/0
1/17
–31/
12/2
2 6,
449
3200
3,
249
6,44
9 1
6:
Roo
ts, t
uber
s an
d ba
nana
s ag
ri-fo
od s
yste
ms
1/
01/0
1/17
–31/
12/2
2 3,
302
1,71
7 1,
585
3,30
218
: G
rain
Leg
umes
& D
ryla
nd C
erea
ls a
gri-f
ood
syst
ems
01/0
1/18
–31/
12/2
2 94
1 –
941
941
21:
Ag
ricul
ture
for n
utrit
ion
and
heal
th
01/0
1/17
–31/
12/2
2 3,
264
1,60
7 1,
657
3,26
4 2
2:
Clim
ate
chan
ge, a
gric
ultu
re a
nd fo
od s
ecur
ity
2/
01/0
1/17
–31/
12/2
2 88
9 45
443
588
9 3
3:
Gen
eban
k pl
atfo
rm (r
outin
e)
01/0
1/17
–31/
12/2
2 1,
957
647
1,31
0 1,
957
33:
G
eneb
ank
plat
form
(non
-rout
ine)
01
/01/
17–3
1/12
/22
3,27
9 2,
134
1,14
5 3,
279
32:
Bi
g D
ata
in a
gric
ultu
re
01
/01/
17–3
1/12
/22
274
113
161
274
Tota
l 24
,478
12
,058
12
,420
24
,478
1/ W
1&2
fund
s pr
ovid
ed b
y C
RP
Lead
Cen
ter b
ased
on
sub-
agre
emen
t, ou
tsid
e Pr
ogra
m P
artic
ipan
t Agr
eem
ent (
PPA)
2/ W
1&2
fund
s pr
ovid
ed b
y C
RP
Lead
Cen
ter o
n Fl
agsh
ips
1 &
2, v
ia P
rogr
am P
artic
ipan
t Agr
eem
ent P
PA #
C-0
76-1
7
Exhibit I. Unrestricted Grants

42 43
Exp
ress
ed in
US$
Tho
usan
ds --
------
--- ---
------
----E
xpen
ses-
------
------
----
Don
orand
Project
Gra
nt
Prio
r C
urre
ntC
GIA
R F
unds
: Win
dow
3G
rant
per
iod
pled
ged
year
s ye
ar
Tota
l
Exhi
bit V
I.
Inte
rnat
iona
l Ins
titut
e of
Tro
pica
l Agr
icul
ture
Stat
emen
t of P
ledg
es a
nd E
xpen
ditu
re31
Dec
embe
r, 20
18
Exhibit VI. CRP Window 3 Grants and Expenditures
Aus
tria
ADA/
IITA
- Pro
duct
ion
and
use
of B
ioch
ar, C
ompo
st a
nd L
ime
01/0
9/15
‒30/
11/1
8 59
5 43
7 15
8 59
5AD
A/IIT
A - H
ealth
y se
edlin
g sy
sts
for s
afer
, pro
duct
ive
veg.
in E
A
01
/10/
15–3
0/09
/18
581
434
146
580
Tota
l
1,17
6 87
1 30
4 1,
175
Belg
ium
DG
DC
/IITA
- Im
prov
ing
Agric
ultu
re-b
ased
Liv
elih
ood
01/0
1/14
–31/
12/2
0 9,
520
6,77
1 67
6 7,
447
Tota
l
9,52
0 6,
771
676
7,44
7Bi
lls &
Mel
inda
Gat
es F
ound
atio
nBM
GF/
IITA
- YIIF
SWA
Pilo
ting
14/0
9/11
–28/
02/1
7 15
,262
15
,241
21
15
,262
BMG
F/IIT
A - G
rant
No
- OPP
1022
738
5CP:
Cas
sava
01
/06/
12–3
1/03
/17
6,22
2 6,
185
1 6,
186
BMG
F/IIT
A - C
OM
PRO
II (O
PPG
D 1
398)
05
/04/
12–3
1/05
/17
7,63
8 7,
630
8 7,
638
BMG
F/IIT
A - C
ontro
l of B
ater
ial W
ilt D
isea
se
23/1
0/13
–31/
12/1
8 2,
695
2,46
7 21
7 2,
684
BMG
F/IIT
A - I
mpr
ovem
ent o
f Ban
ana
for S
mal
lhol
der F
arm
ers
01/1
0/14
–30/
09/1
9 13
,874
9,
214
3,65
0 12
,864
BMG
F/IIT
A - A
frica
Yam
Enh
anci
ng Y
am B
reed
ing
01/1
0/14
–30/
04/2
0 13
,500
9,
066
2,44
2 11
,508
BMG
F/IIT
A - C
assa
va M
onito
ring
Surv
ey fo
r Nig
eria
(CM
S)
10/0
4/15
–30/
06/1
8 89
7 85
6 32
88
8BM
GF/
IITA
- AC
AI:A
frica
n C
assa
va A
gron
omy
Initi
ativ
e (O
PP11
3064
9)
28/0
9/15
–31/
12/2
0 16
,394
4,
889
2,96
8 7,
857
BMG
F/IIT
A - l
ncre
asin
g Pe
rform
ance
of C
owp.
Bree
dgW
/A(O
PP11
2833
9)
14/1
0/15
–30/
10/1
9 2,
000
1,20
0 58
0 1,
780
BMG
F/IIT
A - A
flasa
fe C
omm
erci
aliz
atio
n &D
istri
butio
n (O
PP11
3335
6)
03/1
1/15
–30/
11/2
0 14
,000
3,
124
2,85
7 5,
981
BMG
F/IIT
A - S
ust’b
le W
eed
Mgm
t Tec
h. fo
r Cas
sava
Sys
t. in
Nig
. 01
/09/
13–3
1/12
/18
7,65
6 6,
230
1,13
3 7,
363
BMG
F/IIT
A - Y
IIFSW
A Ph
ase
II 11
/08/
16–3
1/12
/21
11,9
81
772
2,34
8 3,
120
BMG
F/IIT
A –
TAAT
Cle
arin
g H
ouse
(OPP
1179
223)
05
/10/
17–1
5/10
/18
1,13
9 43
1,
246
1,28
9To
tal
11
3,25
8 66
,917
17
,503
84
,420
CIM
MYT
CIM
MYT
/IITA
- St
ress
Tol
eran
t Mai
ze fo
r Afri
ca (S
TMA)
09
/03/
16–2
9/02
/20
7,00
0 3,
232
2,06
5 5,
297
Tota
l
7,00
0 3,
232
2,06
5 5,
297
Exhibit I. Unrestricted Grants

44 45
Exp
ress
ed in
US$
Tho
usan
ds --
------
--- ---
------
----E
xpen
ses-
------
------
----
Don
orand
Project
Gra
nt
Prio
r C
urre
ntC
GIA
R F
unds
: Win
dow
3G
rant
per
iod
pled
ged
year
s ye
ar
Tota
l
Inte
rnat
iona
l Ins
titut
e of
Tro
pica
l Agr
icul
ture
Stat
emen
t of P
ledg
es a
nd E
xpen
ditu
re31
Dec
embe
r, 20
18
CIP
CIP
/IITA
- Bu
ilding
Eco
nom
ically
Sus
taina
ble, I
nteg
rd S
eed
Syst
for C
assa
va in
Nige
ria
05/1
1/15
–30/
11/1
9 2,
220
1,03
9 75
9 1,
798
CIP
/IITA
- C
C3.
1 Pe
st/d
isea
se m
anag
emen
t - (T
ype
2 an
d Ty
pe 3
) 01
/01/
17–3
1/12
/22
228
– –
–To
tal
2,
448
1,03
9 75
9 1,
798
CIR
AD
CIR
AD/II
TA -
Bree
ding
RTB
pro
duct
s fo
r end
use
r pre
fere
nces
(RTB
food
s)
10/1
1/17
–-31
/10/
22
1,08
2 –
154
154
Tota
l
1,08
2 –
154
154
CO
RN
ELL
UN
IVER
SITY
CO
RN
ELL/
IITA
– N
ext G
ener
atio
n C
assa
va B
reed
ing
(Pha
se II
) 01
/04/
18–3
1/12
/22
1,85
6 –
1,59
5 1,
595
Tota
l
1,85
6 –
1,59
5 1,
595
Inte
rnat
iona
l Fun
d fo
r Agr
icul
tura
l Dev
elop
men
t (IF
AD)
IFAD
/IITA
- En
hanc
em’t
Com
petit
vene
ss o
f Hig
h Q
ualit
y_C
assa
va (H
QC
F)
12/0
3/14
–12/
03/1
7 2,
500
1,72
9 7
1,73
6IF
AD/II
TA -
Yout
h Ag
ribus
ines
s D
evel
opm
ent I
nitia
tive
13/0
3/14
–15/
03/1
7 42
0 42
1 (1
) 42
0IF
AD/II
TA -
Figh
t Cas
sava
Bro
wn
Stre
ak D
isea
se &
CM
D
05/0
4/17
–30/
06/2
0 2,
000
342
616
958
Tota
l
4,92
0 24
92
622
3,11
4IC
RIS
ATIC
RIS
AT/II
TA -
Impr
ovin
g th
e Li
velih
oods
of S
mal
lhol
der P
hase
III
23/0
4/15
–30/
04/1
9 5,
380
3,69
9 1,
215
4,91
4To
tal
5,
380
3,69
9 1,
215
4,91
4In
tern
atio
nal L
ives
tock
Res
earc
h In
stitu
teIL
RI/I
ITA
- Im
prov
d pr
oduc
tvty
thro
ugh
crop
-live
stoc
k in
DR
C &
Bur
undi
01
/03/
15–3
1/08
/19
2,24
7 1,
650
467
2,11
7To
tal
2,
247
1,65
0 46
7 2,
117
Japa
nJa
pan/
IITA
- Yam
for F
ood
& W
ealth
in A
frica
01
/04/
10–3
1/03
/19
518
506
8 51
4Ja
pan/
IITA
- Im
prov
ing
Wat
er &
Nut
rient
Use
Effi
cien
cy
01/0
4/10
–31/
03/1
9 73
1 61
1 11
9 73
0To
tal
1,
249
1,11
7 12
7 1,
244
Exhi
bit V
I.

44 45
Exp
ress
ed in
US$
Tho
usan
ds --
------
--- ---
------
----E
xpen
ses-
------
------
----
Don
orand
Project
Gra
nt
Prio
r C
urre
ntC
GIA
R F
unds
: Win
dow
3G
rant
per
iod
pled
ged
year
s ye
ar
Tota
l
Inte
rnat
iona
l Ins
titut
e of
Tro
pica
l Agr
icul
ture
Stat
emen
t of P
ledg
es a
nd E
xpen
ditu
re31
Dec
embe
r, 20
18
Exhi
bit V
I. B
ilate
ral G
rant
s Pl
edge
s an
d
Wor
ld B
ank
WB/
IITA
– Te
chni
cal A
naly
sis
of F
easi
bilit
y, O
ppor
tuni
ties
05/0
9/18
–31/
12/2
018
50
- 2
3
23To
tal
50
-
2
3
23U
nite
d St
ates
age
ncy
for
Inte
rnat
iona
l Dev
elop
men
t (U
SAID
)C
RP/
IITA
- Tra
nsfo
rmin
g Ke
y Pr
od. S
yste
ms:
W/A
Sud
ano
Sahe
l 01
/10/
11–3
0/09
/18
21,8
87
19,0
30
1,88
3 20
,913
CR
P/IIT
A - T
rans
form
ing
Key
Prod
. Sys
tem
s: M
aize
Mix
ed E
/SA
01/1
0/11
–30/
09/1
8 31
,704
26
510
2,70
0 29
,210
CG
IAR
/USA
ID -
SIM
LEZA
01
/10/
11–3
0/09
/18
1,79
9 1,
101
9 1,
110
CG
IAR
/USA
ID -
Zam
bia
Dis
ease
s R
esis
tant
Cas
sava
01
/05/
11–3
0/09
/18
1,11
5 79
8 20
81
8C
GIA
R/U
SAID
- Ba
cter
ial W
ilt R
esis
tant
Ban
ana
01/1
0/10
–30/
09/1
9 1,
950
1,08
1 45
9 1,
540
CG
IAR
/USA
ID -
Aflat
oxin
Pol
icy
& Pr
ogra
m fo
r E/A
Reg
ion
(APP
EAR
) 01
/07/
13–3
0/06
/17
4,65
5 4,
604
51
4,65
5C
GIA
R/U
SAID
- Ed
ucat
ion
& R
esea
rch
Uga
nda
01/1
0/13
–30/
09/1
8 2,
037
1,04
2 35
0 1,
392
CG
IAR
/USA
ID -
Afric
aRIS
ING
Glo
bal C
limat
e C
hang
e 01
/10/
14–3
0/09
/18
400
399
– 39
9C
GIA
R/U
SAID
- R
esee
ding
Mal
awi’s
S/h
olde
r Agr
ic. -
AFL
ASAF
E 01
/10/
14–3
0/06
/19
2,04
9 1,
660
389
2,04
9C
GIA
R/U
SAID
- R
esee
ding
Mal
awi’s
S/h
olde
r Agr
ic. -
LEG
UM
ES
01/1
0/14
–30/
06/1
9 2,
544
1,86
5 53
9 2,
404
CG
IAR
/USA
ID -
Enha
ncin
g Pa
rtner
ship
am
ong
Afric
aRIS
ING
01
/10/
14–3
0/09
/20
9,07
5 6,
154
1,20
5 7,
359
CG
IAR
/USA
ID -
Taki
ng C
owpe
as to
Sca
le
01/1
0/14
–31/
12/1
8 5,
841
5,77
2 69
5,
841
CG
IAR
/USA
ID -
Cas
sava
Viru
s D
isea
se S
urve
llanc
e in
DR
C
01/0
3/15
–30/
09/1
9 83
0 24
0 13
25
3C
GIA
R/U
SAID
- Fe
ed th
e Fu
ture
Moz
ambi
que
01/1
0/15
–30/
09/2
0 8,
810
6,61
7 2,
193
8,81
0C
GIA
R/U
SAID
- R
eviv
ing
the
plan
tain
bre
edin
g pr
ogra
m
01/1
0/15
–30/
09/1
9 2,
800
1,91
3 83
8 2,
751
CG
IAR
/USA
ID -
Gen
etic
Impr
ovem
ent i
n C
assa
va
01/1
0/15
–30/
09/1
9 2,
150
1,45
2 65
3 2,
105
CG
IAR
/USA
ID -
Gen
etic
Impr
ovem
ent i
n C
owpe
a 01
/10/
15–3
0/09
/19
1,50
0 99
0 49
9 1,
489
CG
IAR
/USA
ID -
Gen
etic
Impr
ovem
ent i
n So
ybea
n 01
/10/
15–3
0/09
/19
1,20
0 79
3 34
5 1,
138
CG
IAR
/USA
ID -
Aflas
afe
Tech
nica
l Tra
nsfe
r and
Com
mer
cial
izat
ion
(ATT
C)
11/0
3/15
–30/
11/2
0 14
,000
2,
565
1,13
8 3,
703
USA
ID/II
TA –
Act
ion
to c
ontro
l CBS
D in
DR
C
01/1
1/16
–30/
09/2
0 2,
844
891
1,18
7 2,
078
USA
ID/II
TA –
AFL
ASAF
E M
ozam
biqu
e un
der S
MEA
R
04/0
4/16
–10/
02/1
8 2,
476
699
124
823
Tota
l
121,
666
86,1
76
14,6
64
100,
840
ClosedProjects
10,568
6,624
2
6,626
TotalW
indo
w3Projects
282,420
180,588
40,176
220,764

46 47
Exp
ress
ed in
US$
Tho
usan
ds --
------
--- ---
------
----E
xpen
ses-
------
------
----
Don
orand
Project
Gra
nt
Prio
r C
urre
ntB
ilate
ral F
unds
Gra
nt p
erio
d pl
edge
d ye
ars
year
To
tal
Exhi
bit V
II. B
ilate
ral G
rant
s Pl
edge
s an
d Ex
pend
iture
Inte
rnat
iona
l Ins
titut
e of
Tro
pica
l Agr
icul
ture
Stat
emen
t of P
ledg
es a
nd E
xpen
ditu
re31
Dec
embe
r, 20
18
BM
Z/G
IZG
IZ/II
TA -
Trad
e-off
& S
yner
gies
01
/05/
1331
/12/
18
1,50
5 1,
485
19
1,50
4G
IZ/II
TA -
Rap
id F
unct
iona
l Val
idat
ion
(Cas
sava
VIG
S)
01/0
4/15
–30/
09/1
8 1,
282
1,10
1 26
0 1,
361
GIZ
/IITA
- Pr
omot
ing
Cas
sava
Com
mer
cial
izat
n in
Mal
awi
01/1
2/15
–28/
02/1
9 65
6 48
322
070
3G
IZ/II
TA -
Cam
eroo
n Co
coa-
Eco+
- Su
stai
nabl
e Co
coa
Inte
nsific
atio
n 0
1/12
/15–
30/0
6/18
1,
530
1,15
9 35
3 1,
512
GIZ
/IITA
- Fa
st-Tr
ackin
g ad
apta
ble P
refe
red
Varie
ties f
or In
dustr
ial U
se
01/
01/1
6–31
/12/
19
112
9210
102
GIZ
/IITA
- Im
prov
ing
Food
Sec
urity
in A
frica
01/0
7/16
–30/
06/1
8 18
3 10
280
182
GIZ
/IITA
- C
limat
e Sm
art C
offee
and
Coc
oa
01/0
1/17
–31/
12/1
9 1,
250
503
484
987
GIZ
/IITA
- M
inim
izin
g Afl
atox
in R
isk
& Ex
posu
re
01/
07/1
7–30
/06/
19
236
90
98
188
GIZ
/IITA
- St
reng
then
ing
Live
lihoo
d St
rate
gies
_DR
C
01/
01/1
8–31
/12/
20
1,41
5 –
519
519
GIZ
/IITA
- M
arke
t Beh
avio
ur &
Sal
es C
hann
el
01/
12/1
7–30
/11/
18
111
–13
313
3G
IZ/II
TA -
Con
tract
No:
812
1944
4 –
Intro
duci
ng N
atur
al E
nem
ies
01/
01/1
8–31
/12/
19
123
–15
158,
403
5,01
5 2,
191
7,20
6C
IMM
YTC
IMM
YT/II
TA -
Tran
sform
atn
of a
gron
omic
rese
arch
& d
elive
ry se
rvice
s 01
/12/
14–3
1/11
/18
2,66
9 2,
146
465
2,61
1C
IMM
YT/II
TA -
Ensu
ring
Prev
entio
n of
MC
MV
Spre
ad to
W/A
17
/06/
16–2
2/06
/19
291
155
8724
22,
960
2,30
1 55
2 2,
853
Cor
nell
Uni
vers
ityC
orne
ll/IIT
A C
OFF
MAN
Sub
-agr
eem
ent
28/0
9/12
–31/
03/1
8 5,
659
5,13
6 52
3 5,
659
5,65
9 5,
136
52
3 5,
659
Del
oitte
Con
sulti
ng L
LPD
ELO
ITE/
IITA
- AG
RES
ULT
S A
flasa
fe01
/10/
13–3
0/09
/19
5,96
2 3,
432
577
4,00
95,
962
3,43
2
577
4,
009
Com
mis
sion
Of t
he E
urop
ean
Com
mun
ities
EU/II
TA -
Myc
oKey
: Int
egra
ted
& In
nova
tive
Key
Actio
ns
01/0
4/16
–31/
03/2
0 91
42
2163
EU/II
TA -
Mic
robi
al U
ptak
es fo
r Sus
tain
able
Mgt
01
/06/
17–3
1/05
/21
516
2716
519
2EU
/IITA
- Co
ordin
atn
of In
t’n R
esea
rch
Coop
erat
ion o
n so
il (CI
RCAS
A)
01/1
1/17
–31/
10/2
0 15
1 –
3838
EU/II
TA -
Supp
ort t
o im
plem
enta
tn o
f EU–
AU R
esea
ch (L
EAP4
FNSS
A)
01/0
1/19
–31/
12/2
2 11
7–
––
875
6922
429
3

46 47
Exhi
bit V
II
Inte
rnat
iona
l Ins
titut
e of
Tro
pica
l Agr
icul
ture
Stat
emen
t of P
ledg
es a
nd 6
xpen
ditu
re31
Dec
embe
r, 20
18
Food
and
Agr
icul
ture
Org
aniz
atio
nFA
O/II
TA -
Asse
ssng
impa
cts
of im
prov
ed c
assa
va v
arie
ties
in N
iger
ia
10/0
6/15
–31/
05/1
8 21
0 20
82
210
FAO
/IITA
Ges
tion
Dura
ble
Des
Fore
ts le
s Co
mm
unes
du
Cam
eroo
n 11
/07/
16–3
1/03
/18
49
454
49FA
O B
enin
/IITA
- Ap
pui à
la lu
tte c
ontre
la c
heni
lle lé
gion
naire
au
Béni
n 28
/05/
18–3
0/08
/18
20
–11
11FA
O/II
TA -
Clim
ate
Smar
t Agr
ic.Te
chn.
4impr
ovd
Rura
l L/lih
oods
in B
orno
03
/07/
18–3
0/04
/19
51
–23
2333
025
340
293
Glo
bal C
rop
Div
ersi
ty T
rust
(GC
DT)
GC
DT/
IITA
- Util
izat
ion
of W
ild R
elat
ives
in B
reed
ing
of C
owpe
a 01
/05/
16–3
1/12
/18
440
230
174
404
GC
DT/
IITA
- See
d Q
ualit
y M
anag
emen
t (SQ
M)
01/1
0/18
–31/
12/2
2 10
1 –
99
541
230
183
413
Japa
nJa
pan/
IITA
- Int
rodu
ctio
n of
New
Cow
pea
01/0
4/13
–31/
03/1
8 1,
518
1,43
0 88
1,
518
Japa
n/IIT
A - E
DIT
S
01/1
1/16
–31/
03/2
1 98
59
3998
Japa
n/IIT
A - I
ncre
asing
Pro
ducti
vity &
Utili
zatio
n of
Foo
d Ya
m in
Afri
ca
01/1
0/16
–30/
09/2
1 61
0 22
616
839
4Ja
pan/
IITA
- Dev
of S
impl
e As
say
Tech
nq fo
r Cow
pea
(Pha
se 3
) 01
/06/
18–3
1/05
/21
232
–12
212
22,
458
1,71
5 41
7 2,
132
Net
herla
nds
DG
IS-D
utch
- Po
licy
Actio
n 01
/10/
13–3
0/06
/18
5,08
7 4,
696
391
5,08
7W
OTR
O/II
TA -
Mat
chin
g gr
ain
qual
ity a
ttrib
utes
to re
qmt o
f soy
bean
01
/10/
15–3
1/03
/19
39
51
65,
126
4,70
1 39
2 5,
093
Nig
eria
Ond
o St
ate
CM
D P
re E
mpt
ive
07/1
1/08
–Con
tinuo
us
324
321
332
4FM
ARD
/IITA
- M
aize
& L
egum
es
01/0
8/12
–31/
12/1
8 86
9 83
138
869
FMAR
D/II
TA -
Nat
ionw
ide
Cas
sava
Pes
ts a
nd D
isea
ses
Surv
ey 0
8/12
/14–
07/1
2/15
25
9 23
45
239
Uni
v. o
f Gre
enw
ich/
IITA
- Cas
sava
add
ing
Valu
e fo
r Afri
ca II
01
/09/
14–3
1/01
/18
204
8627
113
NG
N G
ovt/I
ITA
- Hom
e G
row
n Sc
hool
Fee
ding
(HG
SF)
13/1
1/18
–12/
11/1
9 46
–
(7)
(7)
Oyo
Sta
te G
ovt/I
ITA
- Dev
. Oyo
Sta
te A
gric
. Pol
icy
Fram
ewor
k 01
/05/
18–3
1/01
/19
55
–39
391,
757
1,47
2 10
5 1,
577
Exp
ress
ed in
US$
Tho
usan
ds --
------
--- ---
------
----E
xpen
ses-
------
------
----
Don
orand
Project
Gra
nt
Prio
r C
urre
ntB
ilate
ral F
unds
Gra
nt p
erio
d pl
edge
d ye
ars
year
To
tal

48 49
Exp
ress
ed in
US$
Tho
usan
ds --
------
--- ---
------
----E
xpen
ses-
------
------
----
Don
orand
Project
Gra
nt
Prio
r C
urre
ntB
ilate
ral F
unds
Gra
nt p
erio
d pl
edge
d ye
ars
year
To
tal
Exhi
bit V
II
Inte
rnat
iona
l Ins
titut
e of
Tro
pica
l Agr
icul
ture
Stat
emen
t of P
ledg
es a
nd E
xpen
ditu
re31
Dec
embe
r, 20
18
Food
and
Agr
icul
ture
Org
aniz
atio
nFA
O/II
TA -
Asse
ssng
impa
cts
of im
prov
ed c
assa
va v
arie
ties
in N
iger
ia
10/0
6/15
–31/
05/1
8 21
0 20
82
210
FAO
/IITA
Ges
tion
Dura
ble
Des
Fore
ts le
s Co
mm
unes
du
Cam
eroo
n 11
/07/
16–3
1/03
/18
49
454
49FA
O B
enin
/IITA
- Ap
pui à
la lu
tte c
ontre
la c
heni
lle lé
gion
naire
au
Béni
n 28
/05/
18–3
0/08
/18
20
–11
11FA
O/II
TA -
Clim
ate
Smar
t Agr
ic.Te
chn.
4impr
ovd
Rura
l L/lih
oods
in B
orno
03
/07/
18–3
0/04
/19
51
–23
2333
025
340
293
Glo
bal C
rop
Div
ersi
ty T
rust
(GC
DT)
GC
DT/
IITA
- Util
izat
ion
of W
ild R
elat
ives
in B
reed
ing
of C
owpe
a 01
/05/
16–3
1/12
/18
440
230
174
404
GC
DT/
IITA
- See
d Q
ualit
y M
anag
emen
t (SQ
M)
01/1
0/18
–31/
12/2
2 10
1 –
99
541
230
183
413
Japa
nJa
pan/
IITA
- Int
rodu
ctio
n of
New
Cow
pea
01/0
4/13
–31/
03/1
8 1,
518
1,43
0 88
1,
518
Japa
n/IIT
A - E
DIT
S
01/1
1/16
–31/
03/2
1 98
59
3998
Japa
n/IIT
A - I
ncre
asing
Pro
ducti
vity &
Utili
zatio
n of
Foo
d Ya
m in
Afri
ca
01/1
0/16
–30/
09/2
1 61
0 22
616
839
4Ja
pan/
IITA
- Dev
of S
impl
e As
say
Tech
nq fo
r Cow
pea
(Pha
se 3
) 01
/06/
18–3
1/05
/21
232
–12
212
22,
458
1,71
5 41
7 2,
132
Net
herla
nds
DG
IS-D
utch
- Po
licy
Actio
n 01
/10/
13–3
0/06
/18
5,08
7 4,
696
391
5,08
7W
OTR
O/II
TA -
Mat
chin
g gr
ain
qual
ity a
ttrib
utes
to re
qmt o
f soy
bean
01
/10/
15–3
1/03
/19
39
51
65,
126
4,70
1 39
2 5,
093

48 49
Exhi
bit V
II
Inte
rnat
iona
l Ins
titut
e of
Tro
pica
l Agr
icul
ture
Stat
emen
t of P
ledg
es a
nd E
xpen
ditu
re31
Dec
embe
r, 20
18
Exp
ress
ed in
US$
Tho
usan
ds --
------
--- ---
------
----E
xpen
ses-
------
------
----
Don
orand
Project
Gra
nt
Prio
r C
urre
ntB
ilate
ral F
unds
Gra
nt p
erio
d pl
edge
d ye
ars
year
To
tal
Nig
eria
Ond
o St
ate
CM
D P
re E
mpt
ive
07/1
1/08
–Con
tinuo
us
324
321
332
4FM
ARD
/IITA
- M
aize
& L
egum
es
01/0
8/12
–31/
12/1
8 86
9 83
138
869
FMAR
D/II
TA -
Nat
ionw
ide
Cas
sava
Pes
ts a
nd D
isea
ses
Surv
ey 0
8/12
/14–
07/1
2/15
25
9 23
45
239
Uni
v. o
f Gre
enw
ich/
IITA
- Cas
sava
add
ing
Valu
e fo
r Afri
ca II
01
/09/
14–3
1/01
/18
204
8627
113
NG
N G
ovt/I
ITA
- Hom
e G
row
n Sc
hool
Fee
ding
(HG
SF)
13/1
1/18
–12/
11/1
9 46
–
(7)
(7)
Oyo
Sta
te G
ovt/I
ITA
- Dev
. Oyo
Sta
te A
gric
. Pol
icy
Fram
ewor
k 01
/05/
18–3
1/01
/19
55
–39
391,
757
1,47
2 10
5 1,
577
Nor
weg
ian
Age
ncy
for D
evel
opm
ent C
oope
ratio
n (N
OR
AD
)N
OR
AD/II
TA -
Sust
aina
ble
Prod
uctio
n of
Coc
oa in
W/A
01
/11/
17–3
1/05
/22
11,9
61
– 1,
938
1,93
811
,961
–
1,93
8 1,
938
NorwegianMinistryofForeign
Affa
irsMF
A/IIT
A - C
limate
Sma
rt Agr
ic.Te
chno
logs 4
impr
ovd R
ural
L/liho
ods i
n Nige
r 03
/12/
18–0
2/12
/23
9,39
6 –
––
MFA
/IITA
- Cl
imate
Sma
rt Agr
ic.Te
chno
logs 4
impr
ovd R
ural
L/liho
ods i
n Mali
03/
12/1
8–02
/12/
23
9,39
6 –
––
18,7
92–
––
Swed
enLU
ND
/IITA
- C
hem
ical
eco
logy
of B
emis
ia ta
baci
07
/05/
15–3
1/12
/19
146
7386
159
146
7386
159
Uni
ted
Stat
es A
genc
y fo
rInt
erna
tiona
l Dev
elop
men
tU
SAID
/CIM
MYT
/IITA
- Su
ppor
t to
Col
labo
rativ
e
01/0
9/13
–31/
12/1
8 58
52
658
USA
ID M
oz./I
ITA
- Afla
toxi
n M
itiga
tion
usin
g Bi
o–co
ntro
l 11
/02/
13–3
1/12
/18
2,47
6 1,
358
– 1,
358
2,53
4 1,
410
6 1,
416
Uni
ted
Stat
es D
epar
tmen
t of A
gric
ultu
re (U
SDA
)U
SDA-
IITA
- Bre
edin
g of
Afla
toxi
n G
enet
ic R
esis
tanc
e In
Mai
ze
15/0
1/15
–06/
02/1
7 19
0 23
6 3
239
USD
A-IIT
A - G
enom
ics-G
uided
RNA
I Solu
tn. 4
Whit
efly M
gt in
Cas
sava
01/
02/1
5–31
/01/
20
806
456
358
814
USD
A-IIT
A - A
gree
men
t No.
58-
3148
-6-0
63
23/0
4/12
–31/
12/2
1 50
3 54
1(5
5)
486
USD
A-IIT
A - A
flato
xin
cont
rol T
echn
ical
Ass
ista
nce
in A
frica
23
/04/
12–3
1/12
/21
1,80
0 88
6 39
3 1,
279
USD
A/IIT
A - S
treng
then
ing
Cap
acity
to Im
plem
ent P
riorit
y Ac
tions
0
9/05
/17–
31/0
7/20
1,
029
331
405
736
USD
A/IIT
A - D
ev. P
rom
otn
& C
omm
erci
aliz
atio
n of
bio
logi
cal
01/
01/1
8–01
/08/
20
711
–69
69U
SDA-
IITA
- Afla
toxi
n M
itiga
tion
(FX1
8TA–
1096
0C00
6 &
C01
1 30
/04/
/18–
31/1
2/21
78
9 –
312
312
5,82
8 2,
450
1,48
5 3,
935

50 51
Exp
ress
ed in
US$
Tho
usan
ds --
------
--- ---
------
----E
xpen
ses-
------
------
----
Don
orand
Project
Gra
nt
Prio
r C
urre
ntB
ilate
ral F
unds
Gra
nt p
erio
d pl
edge
d ye
ars
year
To
tal
Exhi
bit V
II
Inte
rnat
iona
l Ins
titut
e of
Tro
pica
l Agr
icul
ture
Stat
emen
t of P
ledg
es a
nd E
xpen
ditu
re31
Dec
embe
r, 20
18
Wag
enin
gen
Uni
vers
ity (W
U)
WU
/IITA
- N
2 Af
rica
Phas
e II
(OPP
1020
032)
01
/01/
14–3
0/06
/19
22,6
57
18,4
86
2,37
8 20
,864
ZOA
Uga
nda/
IITA
- Putt
ing N
itroge
n Fixa
tion t
o Wor
k for
S/H
older
Far
mers
01/0
8/15
–01/
11/1
8 16
16
–16
WU
/IITA
- Su
stai
ning
Foo
d Su
pplie
s &
Impr
ovg.
Hea
lth
01/0
9/16
–31/
08/2
0 11
438
7611
4W
U/II
TA -
Scal
ing
of B
ioco
ntro
l of A
flato
xin
18/0
8/17
–15/
08/1
9 72
(1
3)
72
59W
VI/II
TA -
Food
Pric
es C
row
d So
urci
ng in
Afri
ca (F
PCA)
02
/07/
18–3
0/06
/19
142
–
1818
23,0
01
18,5
27
2,54
4 21
,071
Miscellaneou
sProjects
AIM
DP/
IITA
- Agr
icul
tura
l Inv
estm
ent &
Mar
ket D
evel
opm
ent
04/0
3/14
–31/
12/1
8 1,
429
1,05
6 58
1,
114
AWF/
IITA
- Cen
tral A
frica
For
est E
cosy
stem
s C
onse
rvat
ion
01/0
6/14
–29/
09/1
8 1,
124
974
2399
7D
DPS
C/II
TA -
VIR
CA
Sub-
Agre
emen
t: Vi
rus
Res
ista
nt C
assa
va 3
0/09
/13-
30/0
9/19
1,
479
1,01
7 33
2 1,
349
ISTR
C 5
thTr
ienn
ial S
ympo
sium
01
/01/
00–C
ontin
uous
10
7 36
137
ISTR
C A
frica
n Jo
urna
l of R
oot &
Tub
er C
rop
07/0
3/96
–Con
tinuo
us
47
37–
37N
OR
HED
/IITA
- C
ontro
lling
Dis
ease
s in
S/P
otat
o &
Ense
t 01
/11/
13–3
1/10
/18
523
205
8428
9M
ERID
IAN
/IITA
- Pa
rtner
ship
for A
flato
xin
cont
rol i
n Af
rica
12
/01/
11–3
0/06
/16
3,28
4 3,
282
2 3,
284
Min
istry
of A
gric
Tan
zani
a/IIT
A - C
omm
unity
Act
ion
01/0
3/13
–31/
12/1
6 24
3 32
02
322
NES
TEC
LTD
/IITA
- Afl
atox
in C
ontro
l in
Mai
ze
21/0
4/11
–31/
12/1
7 20
0 19
9 1
200
Uni
v. o
f Cal
iforn
ia/II
TA -
Feed
the
Futu
re In
nova
tion
12
/09/
11–1
1/09
/19
347
310
3334
3U
niv.
of I
llinoi
s/IIT
A - U
SAID
Soy
bean
Inno
vatio
n La
bora
tory
04
/11/
13–3
0/09
/18
548
473
7354
6Un
iv. o
f Illin
ois/
IITA
- Pan
-Afri
can
Soyb
ean
Tria
l in M
alaw
i (PA
SVTP
) 2
0/12
/17–
01/1
2/18
44
–
3939
WAC
CI/I
ITA
- MO
U o
n Tr
aini
ng P
rogr
am
01/0
4/10
–29/
02/2
0 35
1 29
952
351
ZOA
Uga
nda/
IITA
- Res
earc
h C
ompo
nent
01
/08/
13–3
0/11
/16
67
70(3
)67
EMBR
APA/
IITA
- Enh
ancin
g so
ybea
n pr
oduc
tivity
thro
ugh
rapid
diag
nosti
cs
27/1
1/14
–31/
05/1
7 86
85
186
DAPP
/IITA
-Sca
ling
out I
nteg
rate
d So
il Fer
tility
Mgt
. Tec
hnolo
gy in
Zam
bia 1
6/02
/15–
16/0
2/18
30
4 33
913
352
MAF
SC, T
anza
nia/
IITA
- Fas
t-tra
ckin
g Ac
cess
to Im
prov
ed R
oot C
rops
01
/01/
15–3
1/12
/18
1,46
9 1,
154
197
1,35
1Q
UT/
IITA
- VIR
US
RES
ISTA
NT
BAN
ANA
FOR
AFR
ICA
17/0
2/15
–31/
04/1
9 1,
514
909
302
1,21
1U
C R
iver
side
/IITA
- Im
prov
ing
Trop
ical
Leg
ume
(TL
I)
01/0
6/14
–Con
tinuo
us
30
4414
58CR
I–Gh
ana/
IITA
- Com
mun
ity a
ction
in im
prov
ing q
uality
seed
yam
(CAY
) 21
/11/
14–3
1/07
/18
657
470
4951
9

50 51
Exhi
bit V
II
Inte
rnat
iona
l Ins
titut
e of
Tro
pica
l Agr
icul
ture
Stat
emen
t of P
ledg
es a
nd E
xpen
ditu
re31
Dec
embe
r, 20
18
Exp
ress
ed in
US$
Tho
usan
ds --
------
--- ---
------
----E
xpen
ses-
------
------
----
Don
orand
Project
Gra
nt
Prio
r C
urre
ntB
ilate
ral F
unds
Gra
nt p
erio
d pl
edge
d ye
ars
year
To
tal
PURD
UE/II
TA -
Tech
nica
l Sup
port
to N
ig. C
apac
ity B
uild
ing
Prog
ram
01
/11/
15–3
0/09
/19
609
223
1724
0M
INAD
ER/II
TA -
Impl
emen
tatio
n of
Diffu
sion
of T
issue
Cul
ture
Pla
ntai
n 01
/01/
15–3
1/12
/16
500
493
149
4CO
RAF–
WEC
ARD/
IITA
- W/A
frica
See
d Pr
ogra
m N
o.AI
D–62
4–A–
12–0
0007
01/
01/1
5–31
/07/
17
435
240
(11)
22
9FA
U/IIT
A - M
etab
olic
engi
neer
ing
to e
nhan
ce y
ield
Roo
t & T
uber
cro
ps
12/0
2/15
–31/
10/1
9 95
5 69
233
9 1,
031
Univ.
of Ib
adan
/IITA
- Su
stain.
Cow
pea
prod
uctio
n fo
r rur
al s/h
older
farm
ers
01/0
6/15
–31/
12/1
8 11
567
4911
6Un
iLaRe
union
/IITA
- Ep
idem
iolog
ical s
urve
illace
of R
alst
onia
sol
anac
earu
m 0
1/04
/15–
30/0
4/18
36
35
–35
CAPE
F/IIT
A - S
uppo
rt to
Cha
mbe
r of A
gricu
lture
in C
assa
va M
ultipl
icatio
n 01
/08/
15–3
1/07
/17
67
49(1
8)31
LIBE
RIA
GOV.
/IITA
- Sm
allho
lder A
gr. P
rodu
ctiv't
y Enh
ance
m’t (
SAPE
C)
03/0
8/15
–31/
12/1
8 2,
472
1,60
9 46
3 2,
072
MAL
,Zam
bia/
IITA
- Mak
ing
cass
ava
a tra
nsfo
rmat
ion
vehi
cle
10/0
8/15
–11/
08/1
7 31
141
2(9
) 40
3SA
BMIL
LER
LTD/
IITA
- Con
duct
in-de
pth
need
Ass
essm
ent o
n So
rghu
m
04/0
9/15
–31/
05/1
6 12
5 11
1(3
6)75
UN
ICT/
IITA
- PhD
Pro
ject
- O
luw
atos
in Z
. Are
gbes
ola
01/0
7/15
–28/
02/1
6 17
18
422
NCSU
/IITA
- Fi
eld D
eploy
able
Nutri
ent-R
ich B
iodeg
rada
ble M
atrix
For
Cro
p 23
/10/
15–3
1/05
/18
103
4366
109
CO/II
TA -
Gra
nt A
ward
Agr
eem
ent F
or G
ende
r Pos
tdoc
. Fel
lows
hip
01/0
1/16
–31/
03/1
8 10
8 11
217
129
CIP/
IITA
- Buil
ding
Nutri
tious
Foo
d Ba
sket
s:Sca
ling
Up B
iofor
tified
Cro
ps
01/0
2/16
–30/
09/1
8 43
2 33
811
745
5Un
iversi
te of
Laus
anne
/IITA
- Imp
rovin
g Myc
orrh
izal F
ungi
to Inc
reas
e Cas
sava
01
/04/
16–3
1/03
/19
523
341
139
480
Univ.
of Q
ueen
sland
/IITA
- BBT
V Mi
tigati
on: C
ommu
nity M
anag
emen
t In N
igeria
01
/04/
16–3
1/12
/20
555
181
9627
7M
osan
to/II
TA -
Map
ping
of C
orn/
Mai
ze P
est A
cros
s N
iger
ia
14/0
4/16
–28/
02/1
7 50
56
662
OSU
/IITA
- Ve
geta
ble
Cro
ps IP
M F
or E
ast A
frica
01
/01/
15–3
0/09
/19
38
37(8
)29
SLU
/ IIT
A - B
ioch
ar In
Ken
ya (P
hase
II)
01/0
7/16
–31/
03/2
0 31
6 16
412
729
1IO
WA
Stat
e Un
iv/IIT
A - B
read
- G
enom
e-En
able
d Pl
atfo
rms
for Y
am
01/0
6/16
–31/
03/1
9 27
3 10
282
184
FSRD
C/IIT
A - A
cqui
sitio
n De
Bou
ture
s Sa
ins
de V
arie
tes A
mel
iore
es
01/0
8/16
–30/
06/1
8 14
3 13
323
156
UC-B
erke
ly/IIT
A - B
read
ABR
DC: D
ev. o
f Gen
omic
Reso
urce
s in
Wat
er Y
am 1
5/05
/16–
30/0
4/19
31
3 15
680
236
PNDP
/IITA
- Red
uctn
de Ja
Deg
rada
tion e
t Res
taura
tion D
u Cou
verl V
egeta
l Dan
s 01
/09/
16–3
1/12
/16
103
9815
113
PROD
ADEK
K/IIT
A - D
evelo
pmen
t Du
Syste
me
Sem
encie
r Au
Prod
adek
k 15
/09/
16–1
5/09
/18
240
128
8221
0Q
UB/
IITA
- Neu
rope
ptid
es A
s Tr
ansg
enic
Nem
atic
ides
02
/11/
16–0
1/05
/19
525
278
341
619
Baye
r/IITA
- Ev
aluati
on of
Flup
yradif
uron
e Aga
inst B
emisi
a Tab
aci W
hitefl
ies in
E/A
01/1
1/16
–30/
04/1
9 80
25
4469
ICAR
T/IIT
A - S
treng
then
ing
Live
lihoo
d St
rate
gies
_DR
C
01/
10/1
6–31
/03/
19
88
3842
80U
G/II
TA -
Clim
ate
Smar
t Coc
oa S
yste
ms_
Gha
na (C
LIM
CO
CO
A) 0
1/06
/16–
30/1
1/20
60
17
1734

52 53
Exp
ress
ed in
US$
Tho
usan
ds --
------
--- ---
------
----E
xpen
ses-
------
------
----
Don
orand
Project
Gra
nt
Prio
r C
urre
ntB
ilate
ral F
unds
Gra
nt p
erio
d pl
edge
d ye
ars
year
To
tal
Exhi
bit V
II
Inte
rnat
iona
l Ins
titut
e of
Tro
pica
l Agr
icul
ture
Stat
emen
t of P
ledg
es a
nd E
xpen
ditu
re31
Dec
embe
r, 20
18
Agril
ife R
esea
rch/
IITA
- Bre
ad P
heno
Hig
h Th
roug
hput
1
5/06
/16–
31/0
5/19
10
8 28
5987
CIP
/IITA
- N
extg
en P
hyto
sani
tatio
n R
apid
Elim
inat
ion
of V
irus
01/
10/1
6–31
/08/
19
649
270
168
438
CIP
/IITA
- Br
oade
ning
of S
calin
g of
BXW
Man
agem
ent
01/
10/1
7–31
/12/
22
86
3180
111
CIP
/IITA
Sca
ling
Tran
sfor
mtio
n of
Wet
Cas
sava
0
1/10
/18–
31/1
2/18
16
1 –
157
157
IAR
/IITA
- G
enet
ic Im
prov
emen
t Cow
pea
4 Lo
w Ph
osph
orus
Tole
ranc
e 0
1/10
/18–
31/0
8/20
50
–
1818
NAR
O/II
TA -
Taki
ng In
tegr
ated
Cro
p M
gt. t
o sc
ale
(Ban
ana)
in E
/A
31/0
8/16
–30/
06/1
8 83
6 50
837
988
7KU
Leu
ven/
IITA
- Eva
luat
ion
of D
roug
ht T
oler
ance
from
Mal
ysia
01
/12/
16–3
0/11
/18
16
–5
5PS
SUB/
IITA
- Bre
ad A
BRAC
- Ad
vanc
ed T
echn
olog
y 0
1/06
/16–
31/0
5/19
26
11
4455
WO
TRO
/IITA
- C
ocoa
Cro
p Im
prov
emen
t Far
ms
31/
03/1
7–31
/03/
21
29
1510
25ic
ipe/
IITA
- Est
ablis
hg th
e St
atus
of P
otat
o Cy
st N
emat
ode
in K
enya
2
4/10
/16–
31/0
3/17
32
38
(10)
28M
EDA
Tanz
ania
/ IITA
- Bu
ildg
an E
cono
mic
ally
Sus
tain
able
See
d 0
1/01
/17–
31/1
2/21
3,
056
643
358
1,00
1SL
U/II
TA -
Biof
ortifi
catio
n of
Cas
sava
1
6/01
/17–
31/1
2/20
23
4 32
11
8 15
0H
RN
S/IIT
A - I
dent
ifyg
Oppo
rtunit
ies 4
Acti
on (A
llianc
e fo
r Res
ilent
Coff
ee)
01/1
0/16
–31/
07/2
0 12
6 90
8317
3N
RI/I
ITA
- Eva
luat
ion
of H
uman
Dec
oy T
rap
in B
enin
& C
amer
oon
01/
02/1
7–31
/01/
19
278
113
228
341
Che
mon
ics/
IITA
- Dev
. of T
ools
for C
CAF
s 1
6/03
/17–
31/1
2/17
15
0 14
46
150
PIR
AM/II
TA -
Supp
ly of
new
Cas
sava
Cul
tivar
s,M
ultip
licat
ion
Fiel
ds
01/1
2/16
–30/
11/1
8 13
2 11
027
137
ISAB
U/II
TA -
D’A
mel
iora
tion
de la
Pro
duct
ivity
2
2/03
/17–
31/1
2/21
1,
328
–22
422
4Au
stra
lia A
war
d-Af
rica/
IITA
- Dev
elop
men
t of v
itro
cons
erva
tion
01/
06/1
7–15
/05/
18
7 4
59
FAO
/IITA
- En
hanc
ing
the
Res
ilienc
e to
Clim
ate
Cha
nge
03/
07/1
7–28
/02/
18
103
8412
96TS
L/IIT
A - C
ollab
orat
ive A
gree
men
t to
Deve
lop &
Test
Tran
sgen
ic Ba
nana
01
/01/
18–1
4/07
/20
10
–3
3C
FFR
C/II
TA -
Gen
etic
and
Tra
it C
hara
cter
izat
ion
21/
06/1
6–20
/06/
19
91
3933
72C
IFO
R/II
TA -
The
maj
or A
gric
ultu
ral V
alue
Cha
in
01/
08/1
7–31
/01/
18
84
5031
81D
CI–
IREL
AND
/IITA
- R
oot &
Tub
er C
rops
for a
2
1/08
/17–
30/0
9/19
1,
124
143
590
733
SWIS
S Fe
d. In
st o
f Tec
hnol
ogy/
IITA
- Int
egra
tion
01/
07/1
7–30
/06/
20
62
1816
34IR
AD/II
TA -
Aser
gillu
s Fl
avus
Stra
in C
hara
cter
izat
ion
15/
11/1
7–25
/02/
18
10
–10
10G
U/II
TA -
Mai
ze-B
ased
Sys
tem
s of
Nig
eria
2
5/08
/17–
31/1
2/18
10
(6
)10
4R
OTH
AMST
ED/II
TA -
GLT
EN A
frica
: Cro
ppin
g sy
stem
div
ersi
ty
01/
07/1
8–30
/06/
21
515
–47
47

52 53
Exp
ress
ed in
US$
Tho
usan
ds --
------
--- ---
------
----E
xpen
ses-
------
------
----
Don
orand
Project
Gra
nt
Prio
r C
urre
ntB
ilate
ral F
unds
Gra
nt p
erio
d pl
edge
d ye
ars
year
To
tal
Exhi
bit V
II
Inte
rnat
iona
l Ins
titut
e of
Tro
pica
l Agr
icul
ture
Stat
emen
t of P
ledg
es a
nd E
xpen
ditu
re31
Dec
embe
r, 20
18
PHOT
OSYN
Q/IIT
A - G
WAS
usin
g co
wpea
min
icore
4 p
hoto
synt
hetic
trai
ts 1
5/03
/18–
31/0
5/18
20
–
1111
AGBI
OM
E IN
C/II
TA -
Mic
robi
al d
iver
sity
col
lect
ion
from
yam
2
3/05
/18–
31/1
2/21
10
1 –
––
AXA/
IITA
- Im
prov
g Fi
nanc
ial In
clusio
n of
S/h
older
Far
mer
s in
North
ern
Nig.
01/
03/1
8–30
/09/
19
86
–48
48C
FEF/
IITA
- Tec
hnic
al a
ssis
tanc
e fo
r stre
ngth
enin
g IN
ERA
08/
01/1
8–31
/03/
19
478
–35
435
4CT
A/IIT
A - B
aseli
ne st
udy:A
ccele
ratg
Inno
vativ
e &
Susta
inable
Cas
sava
Bus
. 0
2/11
/18–
20/0
6/19
13
8 –
55
IFD
C/II
TA -
Surv
ey a
nd M
anag
emen
t of p
otat
o pe
sts
in U
gand
a 07
/11/
18–3
1/12
/19
100
–11
11IR
DP/
IITA
- Bey
ond
clim
ate,
Soi
l Car
bon
sequ
estra
tion
0
1/01
/18–
31/1
2/21
60
–
––
SAR
L R
ubbe
rcam
/IITA
- Pr
oduc
tion
of lo
cal &
hyb
rid p
lant
ains
0
1/06
/18–
31/0
5/19
67
–
1414
UoL
/IITA
- Ev
alua
tg s
afet
y &
nutri
tiona
l qua
lity
of a
nov
el in
sect
0
1/05
/17–
01/0
5/19
20
–
1818
PID
MA/
IITA
- Agr
icul
tura
l Inv
estm
ent &
Mar
ket D
evel
opm
ent
04/
03/1
4–31
/12/
18
1,42
9 –
690
690
35,2
57
19,8
40
7,22
0 27
,060
Clo
sed
Proj
ects
390,
348
354,
734
8 35
4,74
2TotalB
ilateralP
rojects
521,938
421,358
18,491
439,849

54 55
Exhibit VIII. Challenge Programs Pledges & Expenditure
CIA
T/IIT
A - H
P 20
14H
5319
.IIT.
Iden
tifica
tion
of p
VAC
Pla
ntai
n 01
/01/
14‒3
1/12
/18
375
329
30
359
CIA
T/IIT
A - C
-040
-14
Incr
easi
ng F
ood
Secu
rity
& Fa
rmin
g sy
stem
13/
03/1
4‒13
/11/
17
200
203
(3)
200
CIA
T/IIT
A - H
P 53
06 -
Biof
ortifi
catio
n of
Tro
pica
l Mai
ze
01/0
1/14
‒31/
12/1
9 3,
354
2,34
2 49
6 2,
838
CIA
T/IIT
A - H
P 53
07 -
Miti
gatin
g H
idde
n H
unge
r with
Cas
sava
01
/01/
14‒3
1/12
/18
3,90
0 3,
328
541
3,86
9IF
RI/I
ITA
- Con
tract
No.
201
5 x
190.
.IIT
01
/03/
15‒3
0/06
/22
25
25
‒ 25
CIA
T/IIT
A - C
reat
g Le
arng
Com
mun
ity 4
Clim
ateS
mar
t Val
ue C
hain
s 01
/01/
16‒3
0/09
/19
511
259
183
442
IFPR
I/IIT
A - C
ontra
ct A
gree
men
t No:
201
6 X
IIT
01/0
7/16
‒31/
12/1
8 30
0 30
0 ‒
300
IFPR
I/IIT
A - C
ontra
ct A
gree
men
t No:
201
1 X
099I
IT
01/0
1/16
‒31/
12/1
8 32
2 17
8 14
4 32
2ClosedProjects
6,240
5,626
‒5,626
Tota
l Cha
lleng
e Pr
ogra
ms
15,2
27
12,5
90
1,39
1 13
,981
Exp
ress
ed in
US$
Tho
usan
ds --
------
--- ---
------
----E
xpen
ses-
------
------
----
Gra
ntPr
ior
Cur
rent
Cha
lleng
e Pr
ogra
ms
Gra
nt p
erio
d p
ledg
ed
yea
rs
yea
r T
otal
Exhi
bit V
III
Inte
rnat
iona
l Ins
titut
e of
Tro
pica
l Agr
icul
ture
Stat
emen
t of P
ledg
es a
nd E
xpen
ditu
re31
Dec
embe
r, 20
18

54 55
Exhibit VIII. Challenge Programs Pledges & Expenditure
Exhi
bit I
X.
Inte
rnat
iona
l Ins
titut
e of
Tro
pica
l Agr
icul
ture
Stat
emen
t of P
ledg
es a
nd E
xpen
ditu
re31
Dec
embe
r, 20
18
Exp
ress
ed in
US$
Tho
usan
ds --
------
--- ---
------
----E
xpen
ses-
------
------
----
Don
orand
project
Gra
ntPr
ior
Cur
rent
Non
-CR
P Fu
nds
Gra
nt p
erio
d p
ledg
edye
ars
yea
r T
otal
BATN
/IITA
- Im
plem
enta
tion
of C
assa
va E
nter
pris
e 01
/09/
14–3
1/12
/18
275
230
623
6PU
RD
UE/
IITA
- PU
RD
UE
Impr
oved
Cro
p St
orag
e 01
/07/
14–3
1/05
/19
1,34
0 1,
152
138
1,29
0W
ECA/
IITA
- Upg
radi
ng O
ndo
Stat
e Ag
ric V
illage
, Ore
01
/07/
14–3
1/12
/18
777
717
6077
7Af
DB/II
TA -
Nige
ria A
gric.
Tran
sfor
mat
ion
Phas
e 1
(ATA
SP-1
Out
reac
h)
01/0
3/15
–29/
02/1
9 20
,001
8,
316
2,14
6 10
,462
AP L
even
tis /I
ITA
- Sch
ools
For
est a
nd T
ree
Her
itage
Par
k
01/0
1/15
–31/
12/1
8 15
8 15
62
158
IRD
P/IIT
A - S
calin
g O
ut In
tegr
ated
Soi
l Fer
tility
Mgt
Tec
hnol
ogie
s 01
/02/
15–2
8/02
/18
250
232
2025
2C
OR
AF/W
ECAR
D/II
TA -
Dev
elop
ing
Cap
acity
for A
gric
(C4R
4D)
12/0
1/15
–30/
06/1
9 50
0 49
53
498
MIN
BUZA
-CO
T/IIT
A - D
evel
pmt o
f Jat
roph
a-Ba
sed
Biof
uel V
C Ph
ase
II
01/1
0/15
–30/
09/1
9 1,
022
581
371
952
CHEV
RON/
TEXA
CO/II
TA -
Harn
essin
g en
ergy
of y
outh
s in
Nig
er-D
elta
01
/08/
15–3
1/06
/19
587
307
101
408
IFAD
/IITA
- IIT
A Yo
uth
Agrip
rene
ur in
Nig
eria
, Ken
ya &
DRC
(YAD
I 2)
22/0
9/15
–30/
03/1
8 50
0 49
9(3
) 49
6OF
DL/II
TA -
llTA
Assis
ted
Obas
anjo
Farm
Diag
nosti
cs L
abor
ator
y Pro
ject
01/1
0/15
–31/
12/1
9 91
473
50FA
RM
Rad
io In
t’l/II
TA –
Sca
ling
up Im
prov
ed L
egum
e Te
chn.
02
/05/
16–3
1/05
/18
152
149
‒ 14
9O
CP/
IITA
- Dev
elop
ing
Effici
ent &
Affo
rdab
le F
ertil
izer
Pro
duct
s 29
/12/
15–3
1/12
/18
708
609
8 61
7FA
O/II
TA -
Supp
ort f
or p
reve
ntn
& M
gmt o
f Dise
ase
Bana
na(B
BTD)
23
/09/
15–3
0/06
/18
4437
138
WYG
/IITA
- S.
35:A
chie
ving
Equ
itabl
e Be
nefit
s fro
m S
AI
01/0
5/16
–31/
03/2
0 77
2 31
5 16
9 48
4FA
O/II
TA -
Elim
inat
ion
Des
Pop
Et d
es P
estic
ides
Obs
olet
es
13/0
7/16
–31/
05/1
9 61
28(7
)21
Hel
lo T
ract
or/II
TA -
Feed
the
Futu
re P
artn
ersh
ip fo
r Inn
ovat
n.
01/0
6/16
–31/
05/1
8 14
8 82
1597
FAO
/IITA
- El
imin
atio
n de
s Pe
stic
ies
(CiL
SS)
15/0
9/16
–31/
03/1
9 36
6 56
106
162
CAB
I/IIT
A - G
ende
r & L
egum
e Al
lianc
e In
terg
ratg
Mul
ti-m
edia
05
/10/
16–3
1/12
/19
3110
919
AfD
B/IIT
A - S
uppo
rt fo
r Agr
ic R
esea
rch
Dev
. 12
/03/
12–3
1/12
/17
62,2
47
59,9
16
75
59,9
91IF
PRI/I
ITA
- PIM
for e
nabl
ing
agric
ultu
ral i
ncom
es fo
r the
poo
r 01
/01/
12–3
1/12
/22
161
87
19
10
6C
TA/II
TA -
Acce
lera
ting
Yout
h e-
agric
ultu
re
10/0
4/17
–09/
06/1
8 19
6 38
‒
38
WAS
CAL
/IITA
- Ph
D S
tude
nt G
RP
Clim
ate
Cha
nge
09/0
3/20
–29/
02/2
07,
012
2 10
12IF
AD/II
TA -
Yout
h R
esea
rch
– C
ompe
titiv
e Fe
llow
ship
s in
Afri
ca09
/03/
20–3
0/06
/20
2,02
535
524
559
FMAR
D/II
TA -
Cas
sava
See
d D
isse
min
atio
n pr
ojec
t 06
/03/
17-3
1/12
/20
418
112
144
256
GIZ
/IITA
- Po
tent
ial A
naly
sis
of In
nova
tive
01/0
1/17
–31/
12/1
810
552
2880
FH/II
TA -
Tuen
dele
e Pa
moj
a II
Proj
ect
01/0
1/16
–31/
07/2
11,
582
9742
051
7M
SU/II
TA -
Agr
ifood
You
th O
ppor
tuni
ty01
/04/
17–2
1/03
/18
280
152
105
257
PUR
DU
E/IIT
A - I
mpr
ovg
S/ho
lder
Tan
zani
an (P
ICS
Cre
dit E
valu
) 30
/09/
16–3
0/09
/18
8035
4984

56 57
Exhi
bit I
X.
Inte
rnat
iona
l Ins
titut
e of
Tro
pica
l Agr
icul
ture
Stat
emen
t of P
ledg
es a
nd E
xpen
ditu
re31
Dec
embe
r, 20
18
Exp
ress
ed in
US$
Tho
usan
ds --
------
--- ---
------
----E
xpen
ses-
------
------
----
Don
orand
project
Gra
ntPr
ior
Cur
rent
Non
-CR
P Fu
nds
Gra
nt p
erio
d p
ledg
edye
ars
yea
r T
otal
Exhibit IX. Non - CRP Grants Pledges & Expenditure
ADR
A/D
RC
/IITA
- D
evel
opin
g co
mm
unity
-bas
ed d
isse
min
atio
n
01/1
0/16
–31/
07/1
8 47
41
‒
41M
oFA,
Sud
an/II
TA -
Enab
le Y
outh
Sud
an28
/04/
17–2
7/04
/22
1,42
521
841
062
8JR
SBD
F-FA
/IITA
- Th
e Po
linat
or In
form
atio
n01
/04/
17–3
1/12
/19
161
5 6
Prod
ema-
FA/II
TA P
rodu
ctiv
ite e
t de
28/0
8/17
–31/
12/1
91,
503
274
554
828
ANPE
J/IIT
A - D
e de
velo
pom
ent d
e l’e
ntre
pren
a26
/04/
17–3
1/12
/18
427
– 43
043
0IF
AD/II
TA -
Acqu
acul
ture
Ass
essm
ents
and
Val
ue C
hain
03/0
4/17
–30/
06/2
02,
400
586
990
1,57
6O
AU/II
TA -
Nig
. Cou
ntry
Pla
n Ba
selin
e&Va
rieta
l Mon
itorg
Sur
vey
16/0
1/17
–30/
06/1
9 55
0 30
523
854
3R
A/IIT
A - F
easi
bilit
y of
a b
lend
ed fi
nanc
e 15
/11/
16–1
0/02
/18
9 –
3 3
IFPR
I/IIT
A - R
egio
nal S
trate
gic
Anal
ysis
01/0
1/17
–31/
12/2
11,
000
571
402
973
TJC
FML/
IITA
- Fea
sbilit
y St
udy
on P
ropo
sed
land
for C
assa
va21
/02/
17–2
5/04
/18
3 1
1 2
MPJ
ESC
/IITA
- En
able
You
th C
ôte
d’Iv
oire
18/1
0/17
–28/
08/1
938
4–
300
300
AfD
B/IIT
A - P
roje
ct P
our l
’ent
repe
naria
t des
25/0
8/17
–31/
12/1
834
381
295
376
FIR
CA/
IITA
- App
ui d
e l’I
ITA
Dan
s le
cad
re d
e28
/03/
17–2
8/05
/17
32–
9 9
Goo
d N
atur
e/IIT
A - F
eed
the
Futu
re P
artn
erin
g15
/04/
17–3
1/07
/18
768
2836
ILR
I/IIT
A - I
nteg
rate
d G
enot
ypin
g Se
rvic
e01
/01/
17–3
0/06
/18
7958
2987
A.G
. Lev
entis
Fou
ndat
ion/
IITA
- For
est R
eser
ve
01/0
1/18
–31/
12/1
8 50
–
‒ ‒
HPL
US/
IITA
- A4N
H F
UN
DED
BY
HAR
VEST
PLU
S "W
/O P
PA
01/0
1/12
–31/
12/2
2 28
0 28
0 ‒
280
IDH
/IITA
- N
iger
ia C
ocoa
Initi
ativ
e30
/08/
17–3
1/03
/19
229
3715
619
3ID
S/IIT
A - A
gric
ultu
ral P
olic
y R
esea
rch
in A
frica
15
/05/
17–2
8/02
/19
395
2631
MPA
E/IIT
A - A
ssis
tanc
e Te
chni
que
de L
’IITA
Pou
r la
01/0
7/17
–30/
04/1
819
7–
9191
MIN
ADER
/IITA
- EN
ABLE
You
th C
amer
oun
- (P
D-C
VA/A
CV-
DP)
17/
05/1
8–31
/01/
22
3,20
7 –
601
601
AfDB
/IITA
- Te
chno
logi
es fo
r Afri
can
Agric
ultu
ral T
rans
form
atio
n (T
AAT)
02/
02/1
8–31
/12/
21
41,2
23
– 3,
367
3,36
7SL
U/II
TA -
Tow
ards
sus
tain
able
coc
oa p
rodu
ctn
in W
/A
01/0
2/18
–31/
12/2
0 28
9 –
5353
SLU
/IITA
- C
onsu
ltanc
y Ag
reem
ent –
N. M
ahun
gu
15/0
8/17
–31/
12/1
85
–5
5C
EH/II
TA -
INM
S Pr
ojec
t: EA
ST A
FRIC
A D
emon
stra
tion
01/1
0/17
–30/
09/2
1 32
0 –
66
WU
/IITA
- Th
e M
issin
g M
iddl
e: F
ood
syst
em tr
ansf
orm
atio
n pa
thwa
ys
12/0
2/18
–31/
12/2
2 6
– ‒
‒AN
ADAR
KO/II
TA -
Imple
men
tn&O
pera
tion
of R
eset
tlem
ent A
gric.
Prog
ms
04/0
5/18
–04/
05/2
3 7,
209
–60
160
1C
IP/II
TA -
KULI
MA
Prom
otin
g fa
rmin
g in
Mal
awi
15/0
5/18
–31/
07/1
9 31
6 –
1515
AG L
even
tis F
ound
atn/
IITA
- Orn
itholo
gical
Mon
itorin
g Ce
ntre
in S
/W N
ig
01/0
1/18
–31/
12/2
0 18
0 –
6565

56 57
Exhi
bit I
X.
Inte
rnat
iona
l Ins
titut
e of
Tro
pica
l Agr
icul
ture
Stat
emen
t of P
ledg
es a
nd E
xpen
ditu
re31
Dec
embe
r, 20
18
Exp
ress
ed in
US$
Tho
usan
ds --
------
--- ---
------
----E
xpen
ses-
------
------
----
Don
orand
project
Gra
ntPr
ior
Cur
rent
Non
-CR
P Fu
nds
Gra
nt p
erio
d p
ledg
edye
ars
yea
r T
otal
Uni
v. o
f Flo
rida/
IITA
- Col
labo
rativ
e Ag
reem
ent
01/0
1/18
–31/
01/1
9 18
4 –
174
174
SNV/
IITA
- Sub
-Con
tract
Agr
eem
ent
01/0
9/18
–31/
03/1
943
–21
21C
TA/II
TA -
Acce
lerat
ing In
nova
tive&
Susta
inable
Cas
sava
Bus
iness
in C
/A
22/0
5/18
–21/
04/2
0 75
5 –
3333
UPL
/IITA
- Ev
aluatn
of H
oldow
n&Lif
eline
for w
eed c
ontro
l in ca
ssav
a in N
ig
12/0
7/18
–11/
07/1
9 13
–2
2M
ONU
SCO
/IITA
- Ré
inse
rtion
soc
io-é
cono
miq
ue d
es e
x-co
mba
ttant
s
01/0
2/18
–31/
01/1
9 89
–88
88FM
ARD
/IITA
- N
atio
n W
ide
Pest
Sur
vey
for Y
am in
Nig
eria
23
/02/
18–2
2/02
/19
42–
4343
US E
mba
ssy/I
ITA
- Env
ironm
enta
l Edu
catn
thro
ugh
acqu
ainta
nce
natu
re
01/0
9/18
–31/
08/1
9 10
–2
2ID
S/IIT
A - C
halle
nges
&Opp
ortu
nitie
s fo
r Rur
al Y
outh
Em
ploy
men
t 01
/10/
18–0
1/10
/19
116
–40
40G
HENT
Uni
v/IIT
A - V
isual
eva
luat
ion
of s
oils
with
con
trast
ing
text
ure
01/0
1/18
–31/
12/1
8 14
–13
13NC
F/IIT
A - S
uppo
rt to
enha
nce c
onse
rvatio
n init
iative
s of F
ores
t Cen
ter @
IITA
17/1
2/18
–16/
12/1
9 6
––
–PA
SL/II
TA -
ERAD
ICO
AT T
Effi
cacy
eva
luat
ion
for m
aize
&cow
pea
29/0
8/18
–31/
08/1
9 13
–
7 7
AgBI
OME/
IITA
- Eva
luatio
n of m
icrob
ial-b
ased
prod
ucts
in ba
nana
s & pl
antai
ns 0
4/09
/18–
04/0
9/20
71
–8
8M
ARD
/IITA
- R
eviv
ing
Agric
ultu
ral R
esea
rch
for D
ev. i
n D
RC
29
/06/
13–2
8/06
/17
2,97
9 3,
012
(37)
2,
975
UHK/
IITA
- Hab
itat’s
role
in s
truct
urin
g cli
mat
e ch
ange
vul
nera
bility
01
/01/
18–3
1/12
/20
97–
2626
OYSG
/IITA
- IITA
BIP
-Lan
d &So
il suit
abilit
y ass
essm
ent fo
r Opa
ra &
Gamb
ari
01/0
7/18
–31/
03/1
9 97
–8
8KU
Leu
ven/
IITA
- KU
Leu
ven
field
tria
l in
Tanz
ania
01
/01/
18–3
1/12
/19
20
– 3
3IR
D/II
TA -
The
IVth
Inte
rnat
iona
l Cas
sava
Con
fere
nce
16/0
4/18
–31/
12/1
811
–(7
7)(7
7)Ag
Bite
ch/II
TA -
Evalu
ation
trial
s of A
gBiTe
ch’s
Bioc
ontro
l Age
nt: F
awlig
en
20/0
6/18
–19/
10/1
8 8
–8
8NW
O-W
otro/I
ITA -
W/sh
op fo
r call
for p
ropo
sals
on 'S
eed S
ystem
s Dev
elopm
t 24
/07/
18–2
5/07
/18
11–
1010
BAYE
R/IIT
A - E
val. M
onso
on A
ctive
4 po
st-em
erge
ncy w
eed c
ontr’
l in ca
ssav
a 13
/08/
18–1
2/07
/19
12–
22
BASF
SE/
IITA
- OD
YSSE
Y, R
APTO
R/C
OW
PEA/
SELE
CTI
VITY
19
/08/
18–1
8/08
/19
7–
33
ClosedProjects
2,038
2,038
–2,038
TotalN
on-CRP
sProject
170,369
82,060
13,579
95,639
Exhibit IX. Non - CRP Grants Pledges & Expenditure

58
International Institute of Tropical AgricultureCRPExpenditureReportbyNaturalClassification
for the Year Ended 31 December, 2018
Exhibit X
Expressed in US$ Thousands
Exhibit XI. CRP Expenditures Report
W1&2 W3 Bilateral Total
CRP 14: Maize Agri-Food SystemsPersonnel 1,121 2,726 835 4,682Collaborators Costs - CG Centers ‒ 538 ‒ 538Collaborators Costs - Partners 22 1,790 175 1,987Supplies and Services 322 2,173 811 3,306Operational Travel 59 382 141 582Depreciation ‒ 21 3 24Direct Costs 1,524 7,630 1,965 11,119Indirect Costs 237 1,250 199 1,686Total CRP 14 Expenditure 1,761 8,880 2,164 12,805
CRP 16: Roots, Tubers and Bananas Agri-Food Systems (Non-Earmarked)Personnel 2,163 5,435 2,706 10,304Collaborators Costs - CG Centers ‒ 220 59 279Collaborators Costs - Partners 120 5,278 296 5,694Supplies and Services 439 6,714 3,233 10,386Operational Travel 84 937 490 1,511Depreciation 6 123 18 147Direct Costs 2,812 18,707 6,802 28,321Indirect Costs 437 2,312 874 3,623Total 3,249 21,019 7,676 31,944
CRP 16: Roots, Tubers and Bananas Agri-Food Systems (Earmarked)Personnel 442 – – 442Collaborators Costs - CG Centers – – – –Collaborators Costs - Partners 18 – – 18Supplies and Services 699 – – 699Operational Travel 173 – – 173Depreciation 41 – – 41Direct Costs 1,373 – – 1,373Indirect Costs 212 – – 212Total 1,585 – – 1,585
Total CRP 16 Expenditure 4,834 21,019 7,676 33,529
CRP 21: Agriculture for Nutrition and HealthPersonnel 311 1,259 950 2,520Collaborators Costs - CG Centers – – – –Collaborators Costs - Partners – 1,548 29 1,577Supplies and Services 767 788 1,182 2,737Operational Travel 293 148 190 631Depreciation 11 19 3 33Direct Costs 1,382 3,762 2,354 7,498Indirect Costs 230 575 315 1,120Total 1,612 4,337 2,669 8,618

59
International Institute of Tropical AgricultureCRPExpenditureReportbyNaturalClassification
for the Year Ended 31 December, 2018
Exhibit X
Expressed in US$ ThousandsW1&2 W3 Bilateral Total
CRP 21: Agriculture for Nutrition and Health (sub-agreement)Personnel – – – –Collaborators Costs - CG Centers – – – –Collaborators Costs - Partners – – – –Supplies and Services 17 – – 17Operational Travel 27 – – 27Depreciation 1 – – 1Direct Costs 45 – – 45Indirect Costs – – – –Total 45 – – 45Total CRP 21 Expenditure 1,657 4,337 2,669 8,663
CRP 22: Climate Change, Agriculture and Food Security - P6Personnel 45 6 1,228 1,279Collaborators Costs - CG Centers – – 236 236Collaborators Costs - Partners – 97 999 1,096Supplies and Services 120 227 1,423 1,770Operational Travel 16 (3) 202 215Depreciation – – 72 72Direct Costs 181 327 4,160 4,668Indirect Costs 27 46 425 498Total 208 373 4,585 5,166
CRP 22: Climate Change, Agriculture and Food Security - P57Personnel 54 – – 54Collaborators Costs - CG Centers – – – –Collaborators Costs - Partners 44 – – 44Supplies and Services 55 – – 55Operational Travel 2 – – 2Depreciation – – – –Direct Costs 155 – – 155Indirect Costs 23 – – 23Total 178 – – 178
CRP 22: Climate Change, Agriculture and Food Security - P253Personnel 41 – – 41Collaborators Costs - CG Centers – – – –Collaborators Costs - Partners – – – –Supplies and Services – – – –Operational Travel – – – –Depreciation – – – –Direct Costs 41 – – 41Indirect Costs 8 – – 8Total 49 – – 49Total CRP 22 Expenditure 435 373 4,585 5,393

60 61
International Institute of Tropical AgricultureCRPExpenditureReportbyNaturalClassification
for the Year Ended 31 December, 2018
Expressed in US$ ThousandsW1&2 W3 Bilateral Total
CRP 23: Policies, Institutions and MarketsPersonnel 135 – 65 200Collaborators Costs – CG Centers – – – –Collaborators Costs – Partners – – – –Supplies and Services 7 – 9 16Operational Travel 10 – – 10Depreciation – – – –Direct Costs 152 – 74 226Indirect Costs 24 – – 24Total 176 – 74 250
CRP 32: Big Data in AgriculturePersonnel 13 – 2 15Collaborators Costs - CG Centers – – – –Collaborators Costs - Partners – – – –Supplies and Services 103 – 8 111Operational Travel 23 – 5 28Depreciation – – – –Direct Costs 139 – 15 154Indirect Costs 22 – 3 25Total CRP 32 Expenditure 161 – 18 179
CRP 33: Genebank Platform (routine) Personnel 673 – 116 428Collaborators Costs - CG Centers – – – –Collaborators Costs - Partners – – 21 21Supplies and Services 521 – 107 382Operational Travel 58 – 30 32Depreciation – – – –Direct Costs 1,252 – 274 863Indirect Costs 58 – 25 83Total 1,310 – 299 946
CRP 33: Genebank (non-routine)Personnel 203 – – 564Collaborators Costs - CG Centers 51 – – 51Collaborators Costs - Partners 132 – – 132Supplies and Services 497 – – 743Operational Travel 50 – – 106Depreciation 93 – – 93Direct Costs 1,026 – – 1,689Indirect Costs 119 – – 119Total 1,145 – – 1,808
Total CRP 33 Expenditure 2,455 – 299 2,754
Exhibit X

61
International Institute of Tropical AgricultureCRPExpenditureReportbyNaturalClassification
for the Year Ended 31 December, 2018
Expressed in US$ ThousandsW1&2 W3 Bilateral Total
CRP 18: Grain Legumes & Dryland Cereals agri-food systemsPersonnel 83 1,980 1,120 3,183Collaborators Costs - CG Centers – – – –Collaborators Costs - Partners 120 1,056 199 1,375Supplies and Services 380 1,436 608 2,424Operational Travel 128 324 168 620Depreciation 103 43 25 171Direct Costs 814 4,839 2,120 7,773Indirect Costs 127 728 277 1,132Total 941 5,567 2,397 8,905
Total CRP - W1&2, W3 & BilateralPersonnel 5,284 11,406 7,022 23,712Collaborators Costs - CG Centers 51 758 295 1,104Collaborators Costs - Partners 456 9,769 1,719 11,944Supplies and Services 3,927 11,338 7,381 22,646Operational Travel 923 1,788 1,226 3,937Depreciation 255 206 121 582Direct Costs 10,896 35,265 17,764 63,925Indirect Costs 1,524 4,911 2,118 8,553Total 12,420 40,176 19,882 72,478
Exhibit X

62 63
Expressed in US$ Thousands
International Institute of Tropical AgricultureCRP W1&2 Funding Report
for the Year Ended 31 December, 2018
Exhibit XI
Windows 1&2
CRP 14: Maize Agri-Food SystemsOpening Balance (1,081)Cash receipts from Lead Center 2,290Disbursements (1,761)Closing Balance (552)
Windows 1 & 2
CRP 16: Roots, Tubers and Bananas Agri-Food Systems (Earmarked & Non-Earmarked) Opening Balance (1,329)Cash receipts from Lead Center 4,750Disbursements (4,834)Closing Balance (1,413)
Windows 1 & 2
CRP 21: Agriculture for Nutrition and HealthOpening Balance (331)Cash receipts from Lead Center 1,788Disbursements (1,657)Closing Balance (200)
Windows 1 & 2
CRP 22: Climate Change, Agriculture andFoodSecurity(CCAFS)-flagships1&2Opening Balance (71)Cash receipts from Lead Center 471Disbursements (435)Closing Balance (35)
Windows 1 & 2
CRP 23: Policies, Institutions and Markets Opening Balance (30)Cash receipts from Lead Center 196Disbursements (176)Closing Balance (10)
Windows 1 & 2
CRP 32: Big Data in AgricultureOpening Balance (15)Cash receipts from Lead Center 147Disbursements (161)Closing Balance (29)

63
Windows 1 & 2
CRP 33: Genebank PlatformOpening Balance (685)Cash receipts from Lead Center 2,496Disbursements (2,455)Closing Balance (644)
Windows 1 & 2
CRP 18: Grain Legumes & Dryland CerealsAgri-Food systems
Opening Balance (115)Cash receipts from Lead Center 471Disbursements (941)Closing Balance (585)
Exhibit XIInternational Institute of Tropical Agriculture
CRP W1&2 Funding Reportfor the Year Ended 31 December, 2018
Expressed in US$ Thousands

64 i
International Institute of Tropical AgricultureSchedule of Direct and Indirect Cost Rates
for the Year Ended 31 December, 2017
Exhibit XII
Expressed in US$ Thousands
Exhibit XVI. Schedule of Direct and Indirect Costs Rates
2018 2017 Expenses
Research Expenses 62,675 65,776
CGIAR Collaboration Expenses 1,384 6,161
Non-CGIAR Collaboration Expenses 12,780 15,276
General & Administration Expenses 9,275 11,251
Total 86,114 98,464
Partners Management Cost Management cost for partners is limited to 4% on non-CGIAR collaboration partnership payments, and computed as of 31 December were as follows:
General Admin Expenses on Partners Management 511 611
Computation of Indirect Cost Rate 2018 2017
In-house Partner Total In-house Partner Total
Gen & Admin Exps 9,275‒511 511 9,275 11,251‒611 611 11,251 Research Exps 62,675 12,780 62,675 + 12,780 65,776 15,276 65,776 + 15,276
Indirect Cost Rate 13.98% 4.00% 12.29% 16.18% 4.00% 13.88%
Indirect Cost Rate…1/ 15.98% 14.29% 18.18% 15.88%
1/ Includes 2 percent system administrative costs on non-W1&2 and W3 projects.
Note: Partnerships are a growing part of CGIAR business, but do not incur the same level of administrative charge (or overhead) as in-house Research. For clarity, the indirect cost calculation has been done on each of the following: net in-house research costs; management charge on the partners costs has been disclosed; and the overall rate is also shown.

i
Acronyms and Abbreviations
aBi Trust Agribusiness Initiative TrustA4NH Agriculture for Improved Nutrition and HealthAATF African Agricultural Technology FoundationADA Austrian Development AgencyAfDB African Development BankAGRA Alliance for a Green Revolution in Africa ANPEJ L' Agence Nationale pour la Promotion de I'Emploi des Jeunes, Republique du SenegalAWF African Wildlife Foundation BATN British American Tobacco Nigeria FoundationBECOD le Bureau d'Etudes et Conseil en Développement intégré BMZ/GIZ Deutsche Gesellschaft für Internationale ZusammenarbeitBMGF Bill & Melinda Gates FoundationCAPEF Chamber of Agriculture, Fisheries, Livestock and Forestry of Cameroon CARE CARE International in CameroonCCAFS Climate Change, Agriculture and Food SecurityCFC Common Fund for CommoditiesCGIAR Consultative Group on International Agricultural ResearchCFFRC Crops for the Future Research CentreCIAT Centro Internacional de Agricultura TropicalCIFOR Centre for International Forestry ResearchCIMMYT Centro Internacional de Mejoramiento de Maiz y TrigoCIP Centro Internacional de la Papa CORAF/WECARD Consel Ouest et Centre African pour la Recherche et le Development Agricule / West and Central African Council for Agricultural Research and Development COSA Committee on Sustainability AssessmentCSP Cost Sharing PercentageCRI-Ghana Crop Research Institute - GhanaCRP CGIAR Research ProgramCRS Catholic Relief Services CTA Technical Centre for Agriculture and Rural CooperationDAP Australian Government - Direct Aid ProgramDAPP Development Aid from People to People in Zambia DCI - Ireland Development Cooperation Ireland - Department of Foreign Affairs, Ireland (Irish Aid)DDPSC Donald Danforth Plant Science CentreDIOBASS La Plate forme Diobass au KivuDGDC Directorate General for Development Co-operationDGIS Directorate General for International Cooperation of The Netherlands EiB Excellence in BreedingEMBRAPA Empresas Publicas de MedellinEU European UnionFAO Food and Agriculture OrganizationFAU Friedrich-Alexander-University Erlangen-NurembergFH Food for the Hungry InternationalFIRCA Le Fonds Interprofessionel pour la Recherche et le Conseil AgricoleFMARD Federal Ministry of Agriculture and Rural Development, NigeriaGCDT Global Crop Diversity TrustGIZ Deutsche Gesellschaft fur Internationale ZusammenarbeitGU University of GothenburgHPlus HarvestPlusHRNS Hanns R. Neumann Stiftung AfricaHELVETAS HELVETAS Swiss Inter co-operationIDH IDH- the sustainable trade initiativeIDS Institute of Development Studies, University of Dar es SalaamIITA International Institute of Tropical AgricultureIIAM Instituto de Investigacao Agraria de MocambiqueICART International Center for Advanced Research and Training, Bukavu, DRCicipe International Centre of Insect Physiology and EcologyICRAF World Agroforestry Centre - formerly International Center for Research in Agroforestry, ICRAFICRISAT International Crops Research Institute for the Semi-Arid Tropics

ii
IFAD International Fund for Agricultural DevelopmentIFPRI International Food Policy Research InstituteILRI International Livestock Research InstituteIRAD Institute of Agricultural Research for DevelopmentIRDP Institute of Rural Development Planning, Dodoma-TanzaniaISABU Institut des Sciences Agronomiques du Burundi ISTRC International Society for Tropical Root Crops - Africa Branch (ISTRC-AB) ITC International Trade CenterJIRCAS Japan International Research Center for Agricultural ScienceJRSBDF J.R.S. Biodiversity FoundationKU Leuven Katholieke Universiteit, LeuvenLUND Lund UniversityMAFSC Ministry of Agriculture, Food Security and Cooperatives, TanzaniaMARD Ministry of Agriculture and Rural Development, DRC (Ministere de L'Agriculture et du developpement Rural - MINAGRIDER, DRC) MEDA Tanzania MEDA Economic Development AssociatesMoFA Ministry of Agriculture, Upper East Region, GhanaMINADER Ministry of Agriculture And rural Development Yaounde - Ministere De L'agriculture Et Du Developpement RuralMPAE Ministère auprès de la présidence en charge de l’agriculture et de l’élevage, MadagascarMPJESC Ministere de la Promotion de la Jeunesse, de I'Emploi des Jeunes et du Service Civique MSU Michigan State UniversityNESTEC Nestle (NESTLE-SWITZERLAND)NORAD Norwegian Agency for Development CooperationNRI Natural Resources InstitutePIA Program Implementation AgreementPIM Policies, institutions, and markets for enabling agricultural incomes for the poorPIRAM Le Programme Intégré de Réhabilitation de l’Agriculture dans la Province du ManiemaPNDHD PROGRAMME NATIONAL DE DEVELOPPEMENT HUMAIN DURABLE PNDP National Community-Driven Development Programme PPA Program Participant AgreementPRILAKS Primlaks Nigeria LimitedPSMNR Programme for Sustainable Management of Natural ResourcesPSSUB Pennysylvania State UniversityPURDUE PURDUE UniversityQUB Queen’s University BelfastQUT Queensland University of TechnologyRTB Roots, tubers and bananas for Food Security and IncomeSDC Swiss Agency for Development and CooperationSLU Swedish University of Agricultural SciencesSNV Organisation Néerlandais de Développement SWITZ Elephant VertTJCFML TJ Cassava Flour Mills Limited TUA Tokyo University of AgricultureTSL Sainsbury Laboratory UC Riverside University of California - RiversideUNICT University of CataniaUSAID United States Agency for International DevelopmentUSDA United States Department of AgricultureWAAP Liberia Ministry of Agriculture - Republic of LiberiaWACCI West African Centre for Crop ImprovementWASCAL West African Science Service Center on Climate Change and Adapted Land Use, WASCAL GRP Climate Change and Biodiversity WASCO West African Seasoning Company LimitedWCF World Cocoa FoundationWECA Ondo State Wealth Creation AgencyWfWI Women for Women InternationalWU Wageningen UniversityZOA Uganda ZOA Uganda


IITA is a member of CGIAR