ifrs 15 workshop material - rolls-royce · 2 ifrs 15 next steps workshops today • walkthrough of...
TRANSCRIPT

IFRS 15 workshop material
2
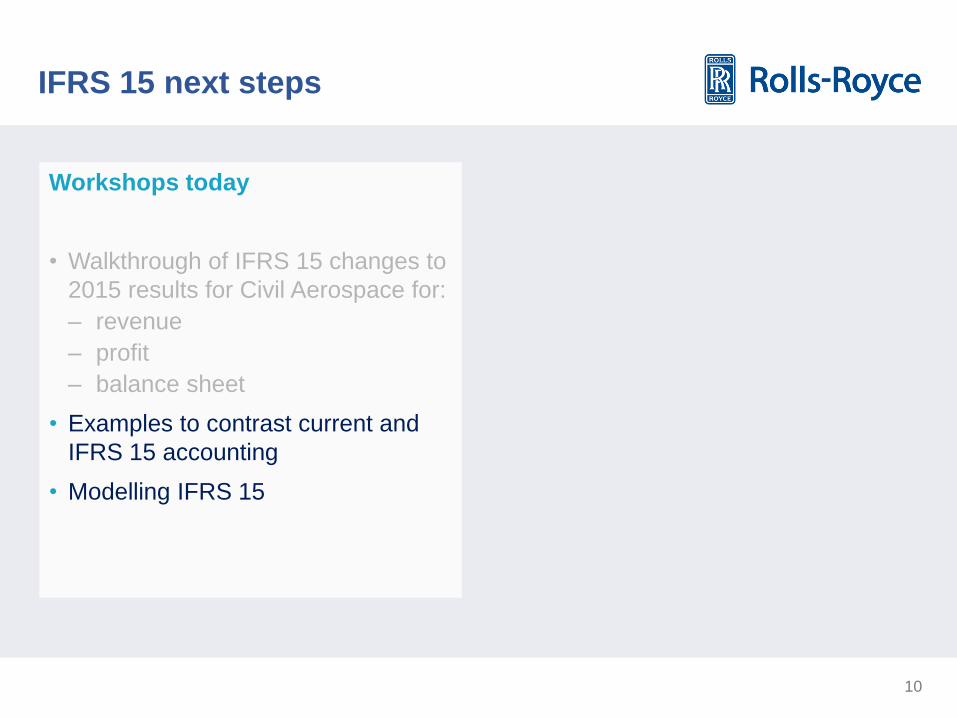
IFRS 15 next steps
Workshops today
• Walkthrough of IFRS 15 changes to
2015 results for Civil Aerospace for:
– revenue
– profit
– balance sheet
• Examples to contrast current and IFRS
15 accounting
• Modelling IFRS 15
3
Highlights
• Significant non-cash adjustments to OE and AM revenue and profit recognition
in the near-term
– Heavily influenced by high production volumes; new engine programmes
and market share gains in aftermarket
• No change over product life cycle to profit achieved
– Same overall profit recognised per engine
• No change to cash flow

4
Scope of impact
Civil Aerospace
Civil Aerospace OE revenue Civil Aerospace AM revenue
Business jet and
V2500 Large Engine OE
Installed OE
Spare
Engin
es
Around 50% of OE
revenues generate
positive cash margin
• Typical range of cash losses on
installed large engines £1-2m
• Targeting cash break even on
XWB-84 by 2020
• Cost reduction activity underway
to reduce the average installed
engine cash loss over the next
few years
Large Engine AM Business/
Regional V2500
TotalCare® &
CorporateCare® Time &
Materials
Around 1/3 of AM
revenues accounted
for on a ‘time &
materials’ basis
• Around 2/3 of aftermarket
revenues affected by IFRS 15
• Over 80% of long term contracts
are pay as you go style contracts
• Pay at shop visit not materially
impacted by IFRS 15
5
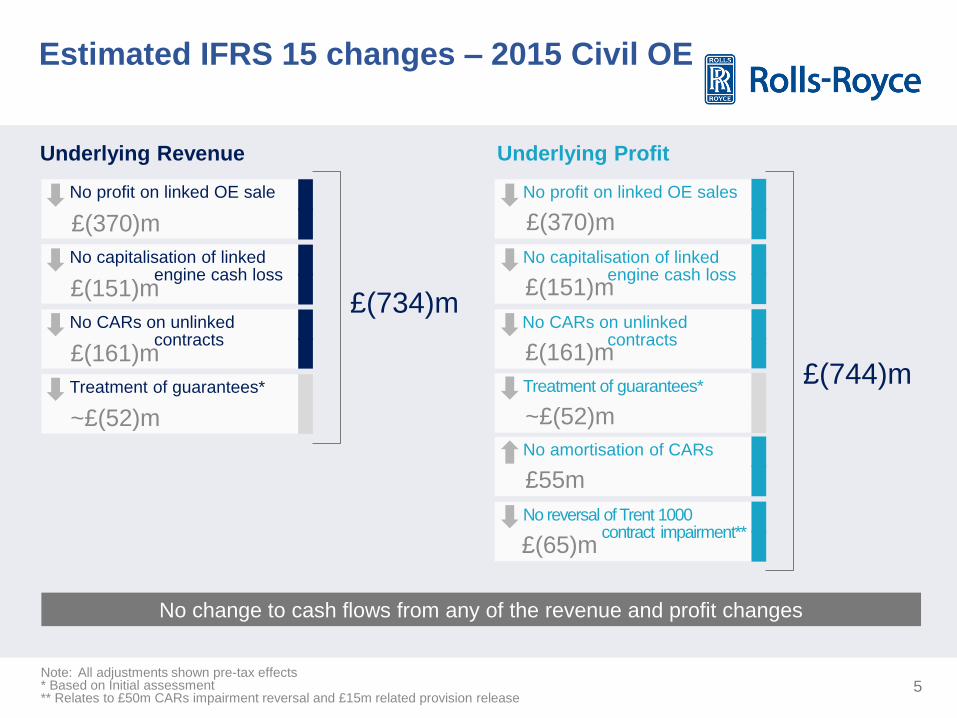
Estimated IFRS 15 changes – 2015 Civil OE
Underlying Revenue Underlying Profit
No profit on linked OE sale
No capitalisation of linked engine cash loss
No CARs on unlinked contracts
Treatment of guarantees*
£(370)m
£(151)m
£(161)m
~£(52)m
No profit on linked OE sales
No capitalisation of linked engine cash loss
No CARs on unlinked contracts
No amortisation of CARs
No reversal of Trent 1000
£(370)m
£(151)m
£(161)m
£55m
£(65)m
Treatment of guarantees*
~£(52)m
£(734)m
£(744)m
No change to cash flows from any of the revenue and profit changes
Note: All adjustments shown pre-tax effects * Based on Initial assessment ** Relates to £50m CARs impairment reversal and £15m related provision release
contract impairment**
6
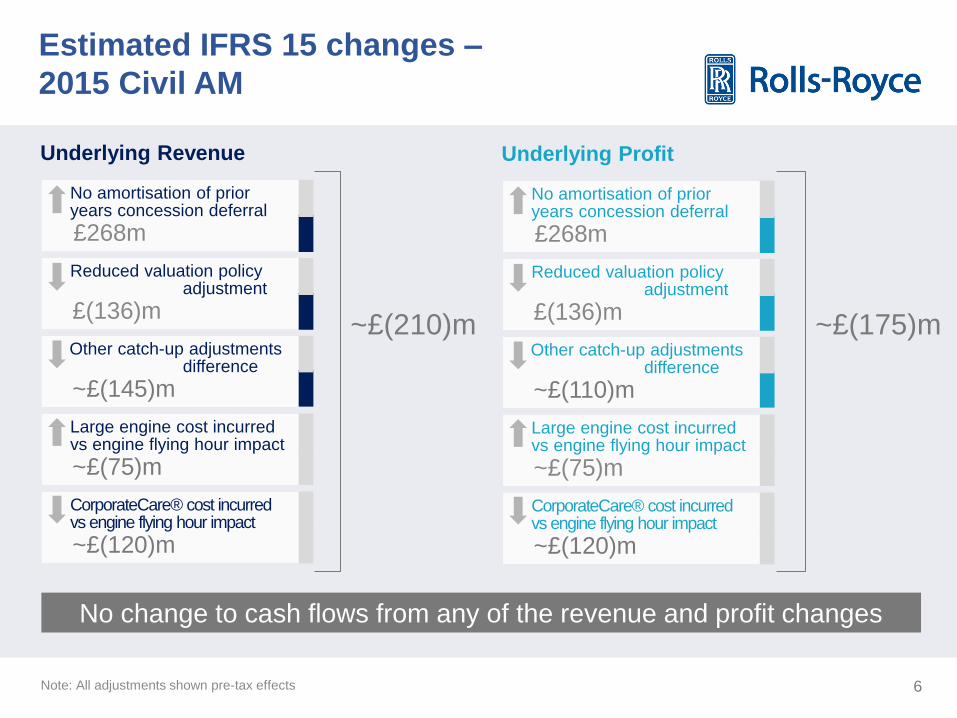
Estimated IFRS 15 changes –
2015 Civil AM
Underlying Profit Underlying Revenue
No amortisation of prior years concession deferral
Reduced valuation policy adjustment
Other catch-up adjustments difference
Large engine cost incurred vs engine flying hour impact
CorporateCare® cost incurred vs engine flying hour impact
£268m
£(136)m
~£(110)m
~£(75)m
~£(120)m
~£(175)m
No amortisation of prior years concession deferral
Reduced valuation policy adjustment
Other catch-up adjustments difference
Large engine cost incurred vs engine flying hour impact
CorporateCare® cost incurred vs engine flying hour impact
£268m
£(136)m
~£(145)m
~£(75)m
~£(120)m
~£(210)m
No change to cash flows from any of the revenue and profit changes
Note: All adjustments shown pre-tax effects

7
Estimated IFRS 15 changes Civil 2015 balance sheet – pre-tax adjustments
Intangible Assets TotalCare® net assets Total Impact
Reversal of the CARs balance
£(0.4)bn
Reversal of cumulative linked contract profit reported ahead of cash
Transition from flying hour to cost basis
~£(2.3)bn
~£(0.8)bn*
~£(3.5)bn*
* based on Initial assessment – more detailed assessment at the date of transition may result in a materially different outcome
OE
AM
IFRS 15 v
current
GAAP
2020 2015 2030 2025
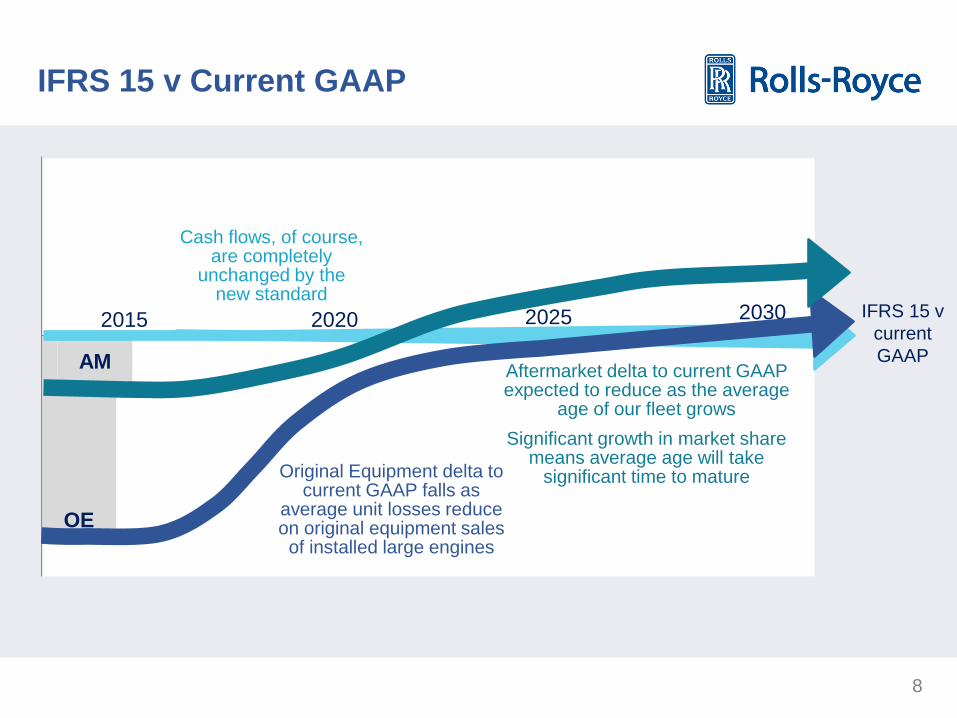
IFRS 15 v Current GAAP
Cash flows, of course, are completely
unchanged by the new standard
Original Equipment delta to current GAAP falls as
average unit losses reduce on original equipment sales of installed large engines
Aftermarket delta to current GAAP expected to reduce as the average
age of our fleet grows
Significant growth in market share means average age will take
significant time to mature
8
Andrew Dickinson Chief Financial Officer – Civil Aerospace
10
IFRS 15 next steps
Workshops today
• Walkthrough of IFRS 15 changes to
2015 results for Civil Aerospace for:
– revenue
– profit
– balance sheet
• Examples to contrast current and
IFRS 15 accounting
• Modelling IFRS 15
11
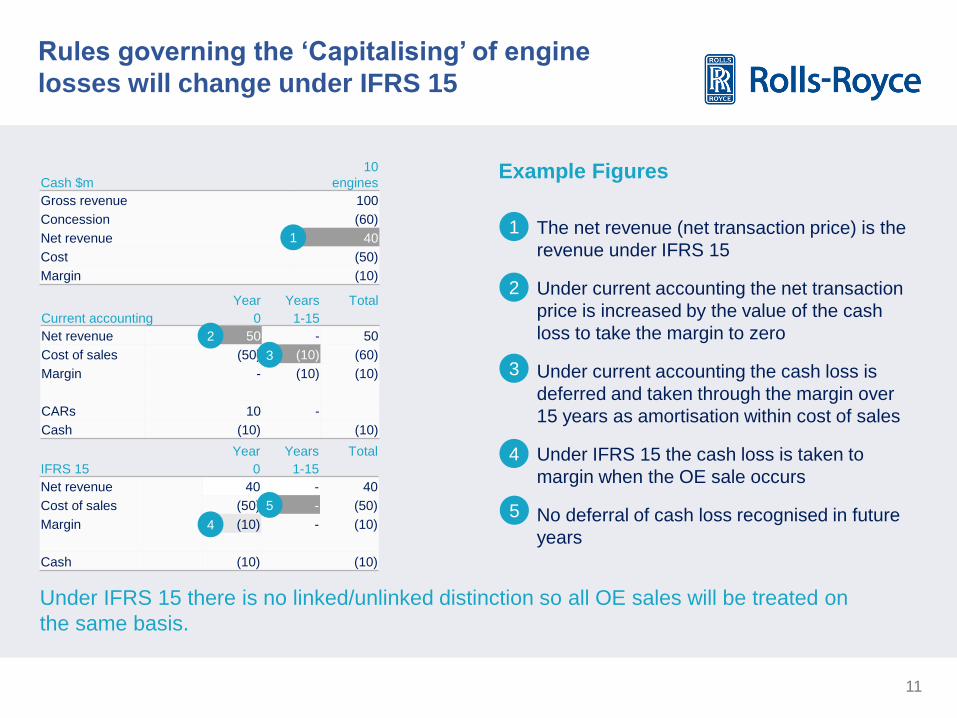
Rules governing the ‘Capitalising’ of engine
losses will change under IFRS 15
Year Years Total
Current accounting 0 1-15
Net revenue 50 - 50
Cost of sales (50) (10) (60)
Margin - (10) (10)
CARs 10 -
Cash (10) (10)
Year Years Total
IFRS 15 0 1-15
Net revenue 40 - 40
Cost of sales (50) - (50)
Margin (10) - (10)
Cash (10) (10)
Example Figures
The net revenue (net transaction price) is the
revenue under IFRS 15
Under current accounting the net transaction
price is increased by the value of the cash
loss to take the margin to zero
Under current accounting the cash loss is
deferred and taken through the margin over
15 years as amortisation within cost of sales
Under IFRS 15 the cash loss is taken to
margin when the OE sale occurs
No deferral of cash loss recognised in future
years
Under IFRS 15 there is no linked/unlinked distinction so all OE sales will be treated on
the same basis.
Cash $m
10
engines
Gross revenue 100
Concession (60)
Net revenue 40
Cost (50)
Margin (10)
1
2
3
1
2
3
4
5
4
5
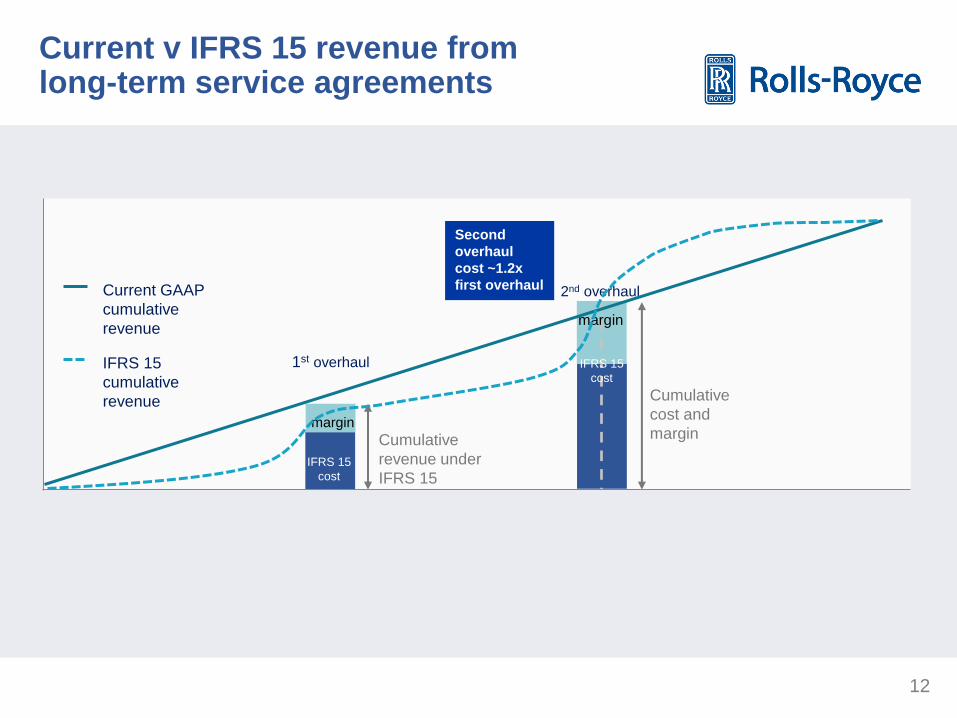
Current v IFRS 15 revenue from long-term service agreements
Current GAAP
cumulative
revenue
1st overhaul
2nd overhaul
Cumulative
revenue under
IFRS 15
Cumulative
cost and
margin
IFRS 15
cumulative
revenue
IFRS 15
cost
margin
margin
IFRS 15
cost
Second
overhaul
cost ~1.2x
first overhaul
12
13
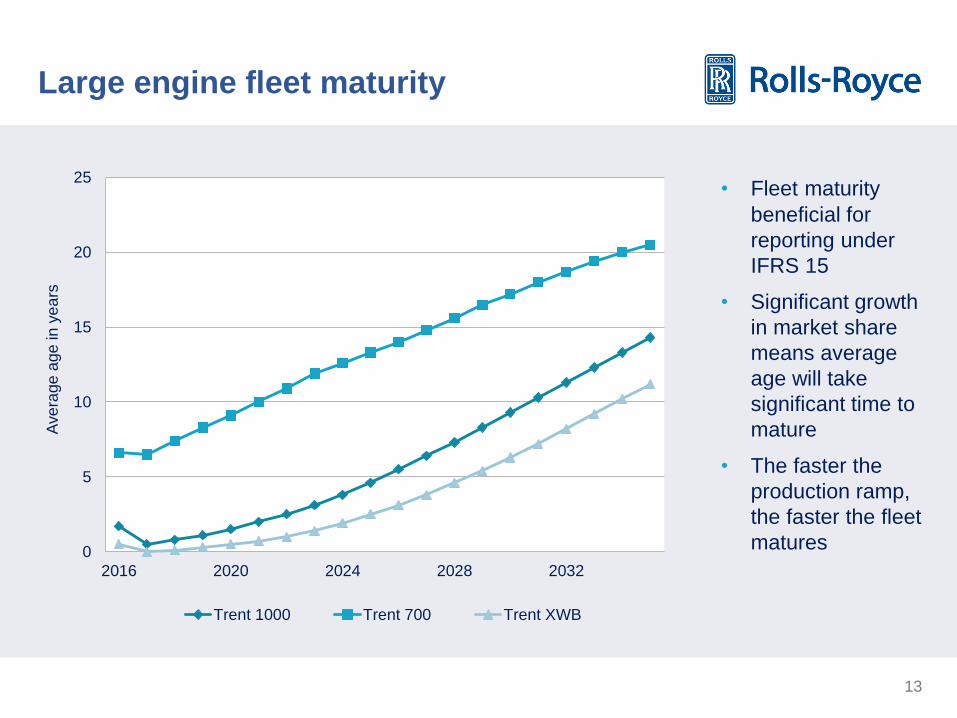
Large engine fleet maturity
0
5
10
15
20
25
2016 2020 2024 2028 2032
Trent 1000 Trent 700 Trent XWB
• Fleet maturity
beneficial for
reporting under
IFRS 15
• Significant growth
in market share
means average
age will take
significant time to
mature
• The faster the
production ramp,
the faster the fleet
matures
Ave
rage
age
in y
ea
rs
14
2015 2020 2024
Age
(Ye
ars
)
An
nu
al G
ross M
arg
in
0
2
4
6
8
10
12
14
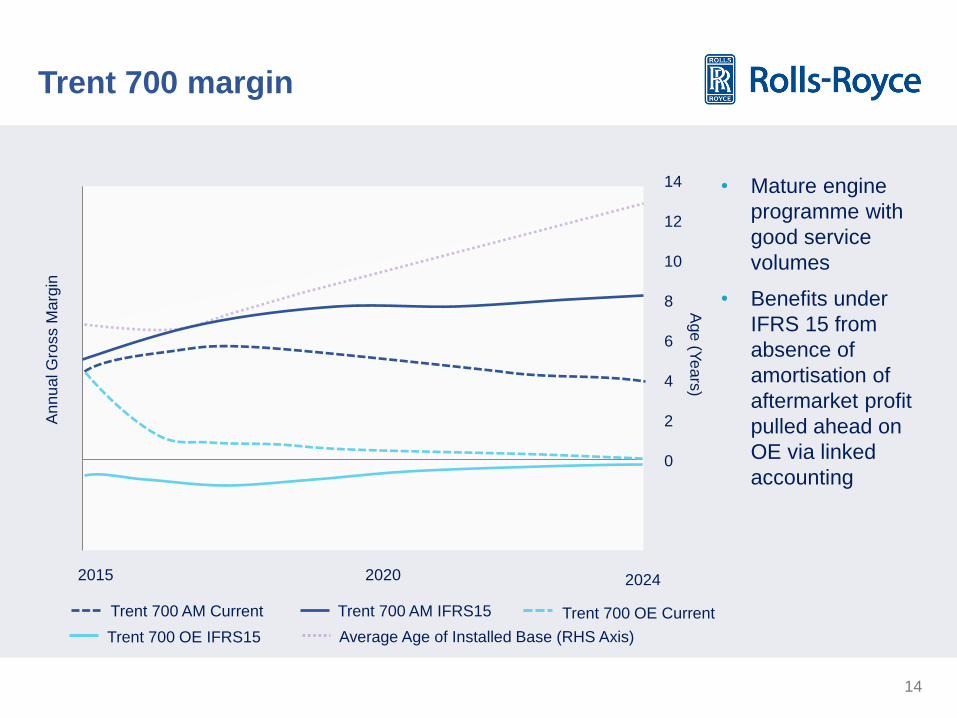
Trent 700 margin
• Mature engine
programme with
good service
volumes
• Benefits under
IFRS 15 from
absence of
amortisation of
aftermarket profit
pulled ahead on
OE via linked
accounting
Trent 700 AM Current Trent 700 AM IFRS15 Trent 700 OE Current
Trent 700 OE IFRS15 Average Age of Installed Base (RHS Axis)
15
2015 2020 2024
Age
(Ye
ars
)
An
nu
al G
ross M
arg
in
0
2
4
6
8
10
12
14
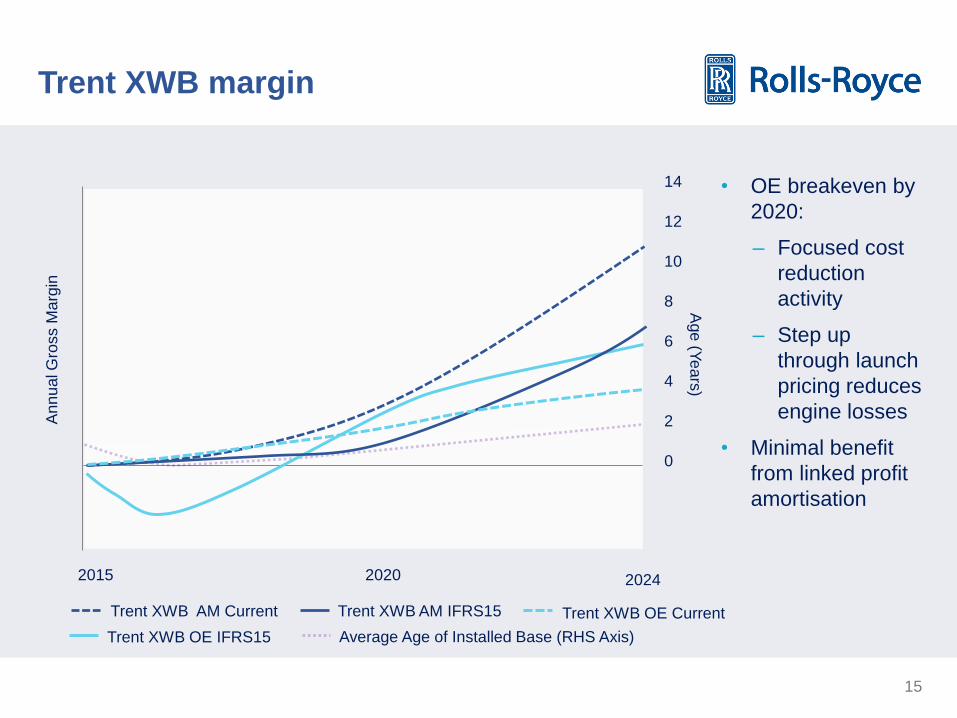
Trent XWB margin
• OE breakeven by
2020:
– Focused cost
reduction
activity
– Step up
through launch
pricing reduces
engine losses
• Minimal benefit
from linked profit
amortisation
Trent XWB AM Current Trent XWB AM IFRS15 Trent XWB OE Current
Trent XWB OE IFRS15 Average Age of Installed Base (RHS Axis)

16
Summary
• Significant non-cash adjustments to OE and AM revenue and profit
recognition in the near-term
– Heavily influenced by high production volumes; new engine
programmes and market share gains in aftermarket
• No change over product life cycle to profit achieved
– Same overall profit recognised per engine
• No change to cash flow
Illustrative examples to contrast accounting for
large engines in Civil Aerospace using current
GAAP and IFRS 15
18
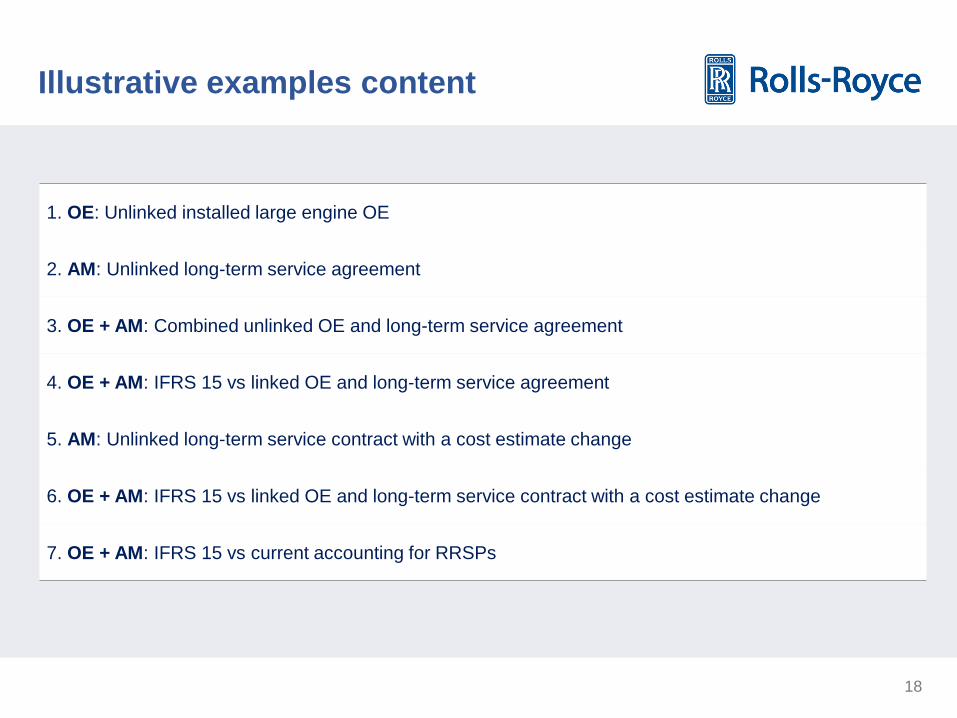
Illustrative examples content
1. OE: Unlinked installed large engine OE
2. AM: Unlinked long-term service agreement
3. OE + AM: Combined unlinked OE and long-term service agreement
4. OE + AM: IFRS 15 vs linked OE and long-term service agreement
5. AM: Unlinked long-term service contract with a cost estimate change
6. OE + AM: IFRS 15 vs linked OE and long-term service contract with a cost estimate change
7. OE + AM: IFRS 15 vs current accounting for RRSPs
19
Context: current treatment
• Under current GAAP, when an engine
is sold it is either accounted for on a
linked or an unlinked basis
• On an unlinked basis engines are
sold and any loss on sale is capitalised
as a Contractual Aftermarket Right
(CAR). This CAR, which reflects the
future profitability of the service
revenues on an engine, is amortised
on a straight line basis over 15 years
and
• Using this method service revenues
are recognised as they are received
and costs are accrued on a flying
hours basis
• On a linked basis OE sales and
TotalCare® agreements are negotiated
as part of one commercial package
• OE margins and TotalCare margins are
combined into a “blended” margin
• Profit is recognised on % complete of
the combined contracts on a revenue
basis
20
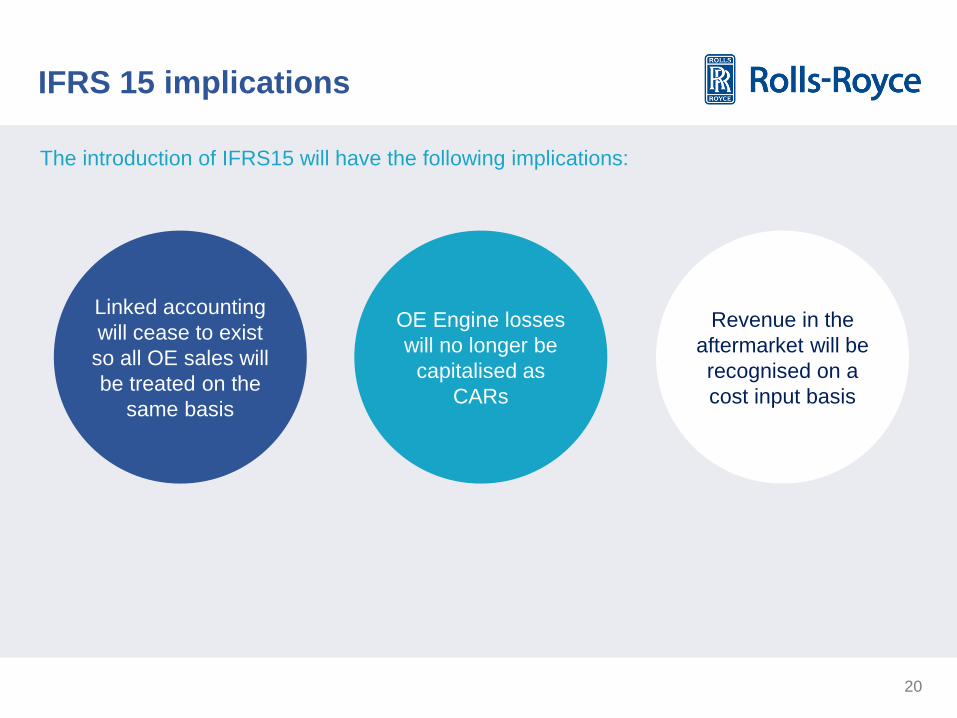
IFRS 15 implications
The introduction of IFRS15 will have the following implications:
Linked accounting
will cease to exist
so all OE sales will
be treated on the
same basis
OE Engine losses
will no longer be
capitalised as
CARs
Revenue in the
aftermarket will be
recognised on a
cost input basis
21
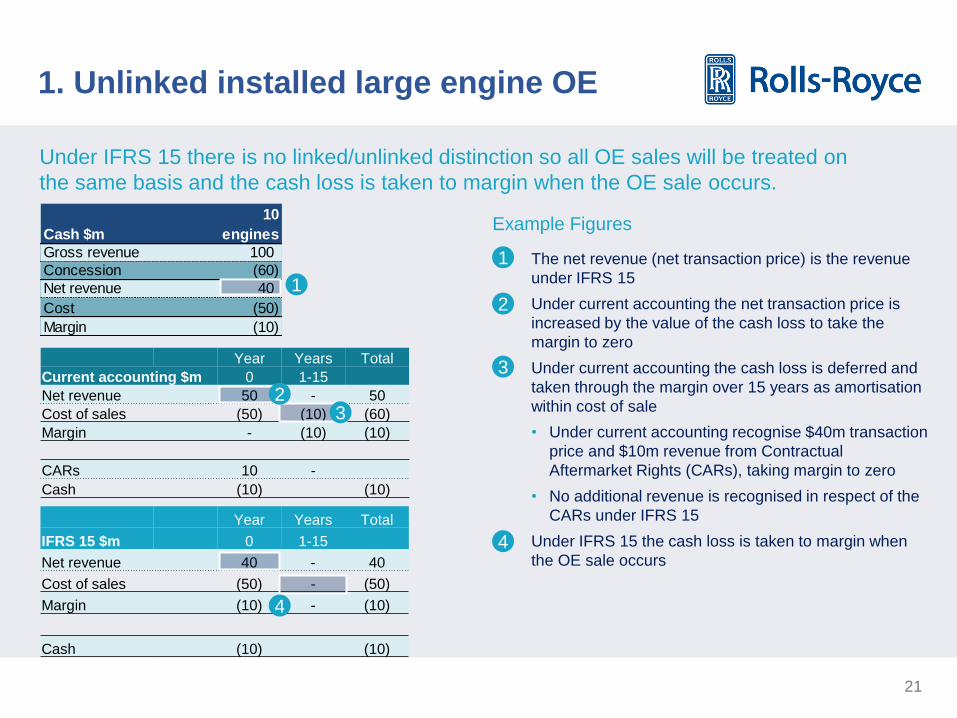
Under IFRS 15 there is no linked/unlinked distinction so all OE sales will be treated on
the same basis and the cash loss is taken to margin when the OE sale occurs.
Cash $m
10
engines
Gross revenue 100
Concession (60)
Net revenue 40
Cost (50)
Margin (10)
Year Years Total
Current accounting $m 0 1-15
Net revenue 50 - 50
Cost of sales (50) (10) (60)
Margin - (10) (10)
CARs 10 -
Cash (10) (10)
Year Years Total
IFRS 15 $m 0 1-15
Net revenue 40 - 40
Cost of sales (50) - (50)
Margin (10) - (10)
Cash (10) (10)
Example Figures
The net revenue (net transaction price) is the revenue
under IFRS 15
Under current accounting the net transaction price is
increased by the value of the cash loss to take the
margin to zero
Under current accounting the cash loss is deferred and
taken through the margin over 15 years as amortisation
within cost of sale
• Under current accounting recognise $40m transaction
price and $10m revenue from Contractual
Aftermarket Rights (CARs), taking margin to zero
• No additional revenue is recognised in respect of the
CARs under IFRS 15
Under IFRS 15 the cash loss is taken to margin when
the OE sale occurs
1. Unlinked installed large engine OE
1
2 1
2 3
3
4
4
22
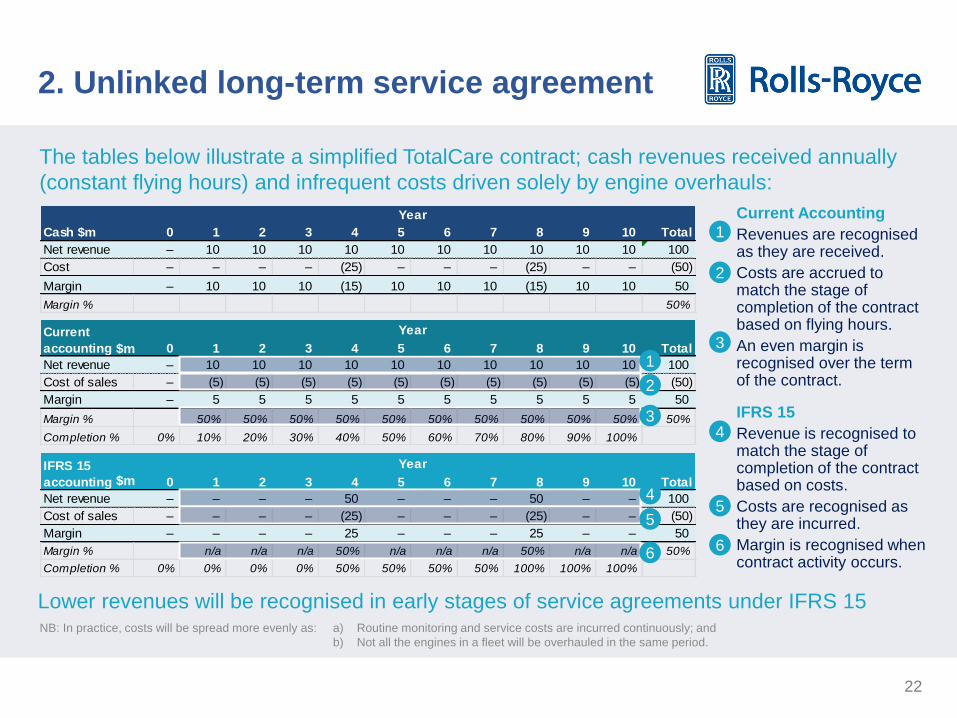
The tables below illustrate a simplified TotalCare contract; cash revenues received annually
(constant flying hours) and infrequent costs driven solely by engine overhauls:
NB: In practice, costs will be spread more evenly as:
Lower revenues will be recognised in early stages of service agreements under IFRS 15
Current Accounting
Revenues are recognised as they are received.
Costs are accrued to match the stage of completion of the contract based on flying hours.
An even margin is recognised over the term of the contract.
IFRS 15
Revenue is recognised to match the stage of completion of the contract based on costs.
Costs are recognised as they are incurred.
Margin is recognised when contract activity occurs.
2. Unlinked long-term service agreement
0 1 2 3 4 5 6 7 8 9 10 Total
Net revenue – – – – 50 – – – 50 – – 100
Cost of sales – – – – (25) – – – (25) – – (50)
Margin – – – – 25 – – – 25 – – 50
Margin % n/a n/a n/a 50% n/a n/a n/a 50% n/a n/a 50%
Completion % 0% 0% 0% 0% 50% 50% 50% 50% 100% 100% 100%
IFRS 15
accounting
Year
0 1 2 3 4 5 6 7 8 9 10 Total
Net revenue – 10 10 10 10 10 10 10 10 10 10 100
Cost of sales – (5) (5) (5) (5) (5) (5) (5) (5) (5) (5) (50)
Margin – 5 5 5 5 5 5 5 5 5 5 50
Margin % 50% 50% 50% 50% 50% 50% 50% 50% 50% 50% 50%
Completion % 0% 10% 20% 30% 40% 50% 60% 70% 80% 90% 100%
Current
accounting
Year
Cash $m 0 1 2 3 4 5 6 7 8 9 10 Total
Net revenue – 10 10 10 10 10 10 10 10 10 10 100
Cost – – – – (25) – – – (25) – – (50)
Margin – 10 10 10 (15) 10 10 10 (15) 10 10 50
Margin % 50%
Year
1
2
3
4
5
6
1
2
4
5
6
3
a) Routine monitoring and service costs are incurred continuously; and
b) Not all the engines in a fleet will be overhauled in the same period.
$m
$m
23
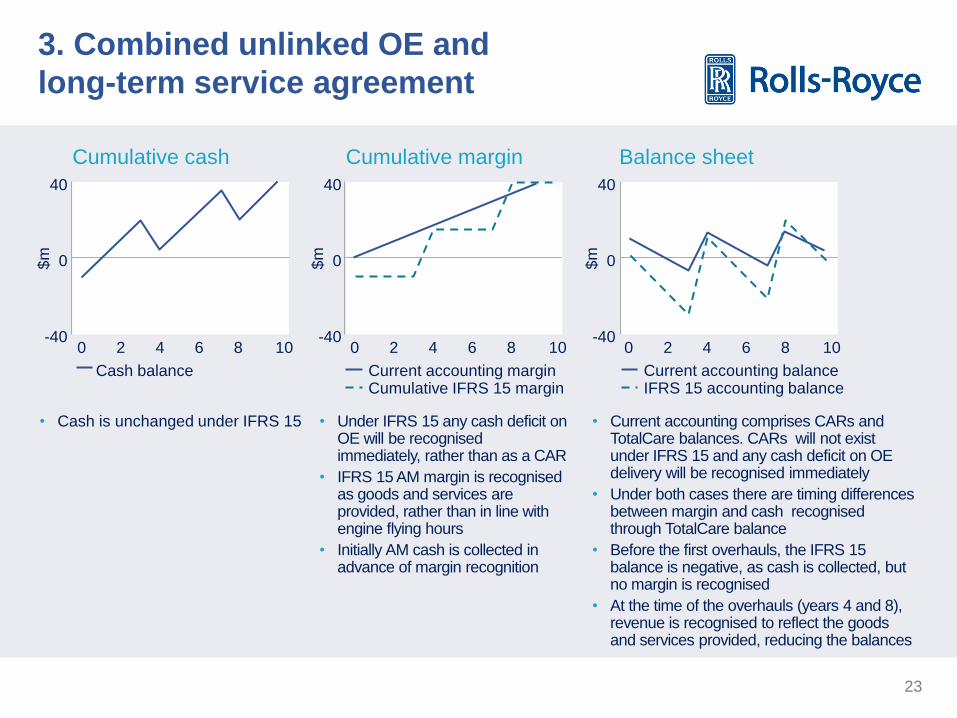
3. Combined unlinked OE and
long-term service agreement
Cumulative cash Cumulative margin Balance sheet
-40
0
40
$m
0 2 4 6 8 10
Cash balance
$m
-40
0
40
0 2 4 6 8 10
Current accounting margin Cumulative IFRS 15 margin
-40
0
40
$m
0 2 4 6 8 10
Current accounting balance IFRS 15 accounting balance
• Cash is unchanged under IFRS 15 • Under IFRS 15 any cash deficit on OE will be recognised immediately, rather than as a CAR
• IFRS 15 AM margin is recognised as goods and services are provided, rather than in line with engine flying hours
• Initially AM cash is collected in advance of margin recognition
• Current accounting comprises CARs and TotalCare balances. CARs will not exist under IFRS 15 and any cash deficit on OE delivery will be recognised immediately
• Under both cases there are timing differences between margin and cash recognised through TotalCare balance
• Before the first overhauls, the IFRS 15 balance is negative, as cash is collected, but no margin is recognised
• At the time of the overhauls (years 4 and 8), revenue is recognised to reflect the goods and services provided, reducing the balances
24
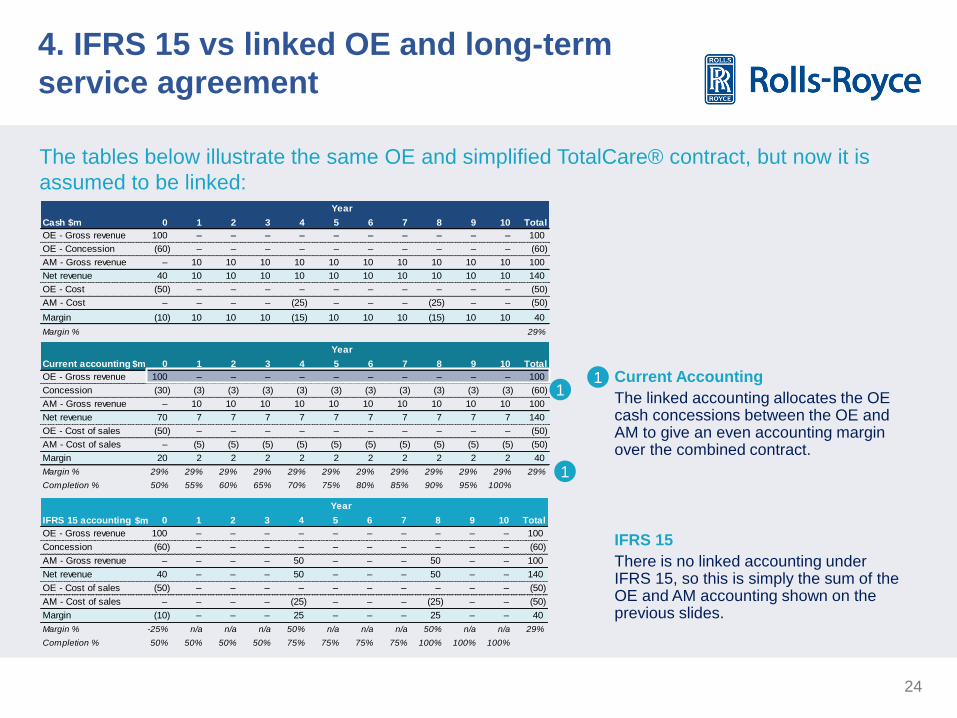
The tables below illustrate the same OE and simplified TotalCare® contract, but now it is
assumed to be linked:
Current Accounting
The linked accounting allocates the OE cash concessions between the OE and AM to give an even accounting margin over the combined contract.
IFRS 15
There is no linked accounting under IFRS 15, so this is simply the sum of the OE and AM accounting shown on the previous slides.
4. IFRS 15 vs linked OE and long-term
service agreement
1 0 1 2 3 4 5 6 7 8 9 10 Total
OE - Gross revenue 100 – – – – – – – – – – 100
Concession (30) (3) (3) (3) (3) (3) (3) (3) (3) (3) (3) (60)
AM - Gross revenue – 10 10 10 10 10 10 10 10 10 10 100
Net revenue 70 7 7 7 7 7 7 7 7 7 7 140
OE - Cost of sales (50) – – – – – – – – – – (50)
AM - Cost of sales – (5) (5) (5) (5) (5) (5) (5) (5) (5) (5) (50)
Margin 20 2 2 2 2 2 2 2 2 2 2 40
Margin % 29% 29% 29% 29% 29% 29% 29% 29% 29% 29% 29% 29%
Completion % 50% 55% 60% 65% 70% 75% 80% 85% 90% 95% 100%
Year
Current accounting
Cash $m 0 1 2 3 4 5 6 7 8 9 10 Total
OE - Gross revenue 100 – – – – – – – – – – 100
OE - Concession (60) – – – – – – – – – – (60)
AM - Gross revenue – 10 10 10 10 10 10 10 10 10 10 100
Net revenue 40 10 10 10 10 10 10 10 10 10 10 140
OE - Cost (50) – – – – – – – – – – (50)
AM - Cost – – – – (25) – – – (25) – – (50)
Margin (10) 10 10 10 (15) 10 10 10 (15) 10 10 40
Margin % 29%
Year
0 1 2 3 4 5 6 7 8 9 10 Total
OE - Gross revenue 100 – – – – – – – – – – 100
Concession (60) – – – – – – – – – – (60)
AM - Gross revenue – – – – 50 – – – 50 – – 100
Net revenue 40 – – – 50 – – – 50 – – 140
OE - Cost of sales (50) – – – – – – – – – – (50)
AM - Cost of sales – – – – (25) – – – (25) – – (50)
Margin (10) – – – 25 – – – 25 – – 40
Margin % -25% n/a n/a n/a 50% n/a n/a n/a 50% n/a n/a 29%
Completion % 50% 50% 50% 50% 75% 75% 75% 75% 100% 100% 100%
IFRS 15 accounting
Year
1
1
$m
$m

25
-40
0
40
$m
0 2 4 6 8 10
Cash balance
$m
-40
0
40
0 2 4 6 8 10
Current accounting margin Cumulative IFRS 15 margin
-40
0
40
$m
0 2 4 6 8 10
Current accounting balance IFRS 15 accounting balance
4. IFRS 15 vs linked OE and
long-term service agreement
Cumulative cash Cumulative margin Balance sheet
• Cash is unchanged under IFRS 15
• Any cash deficit on OE is recognised immediately, rather than recognising a margin on the linked contracts
• IFRS 15 AM margin is recognised as goods and services are provided, rather than in line with engine flying hours
• Initially AM cash is collected in advance of margin recognition
• Balance is difference between cumulative margin and cumulative cash
• No IFRS 15 balance on OE delivery as any cash deficit is recognised immediately
• An IFRS 15 credit balance builds up initially as cash is collected, but no margin recognised until the overhaul
• At the end of the contract they will be the same and the TotalCare balance will be zero
26
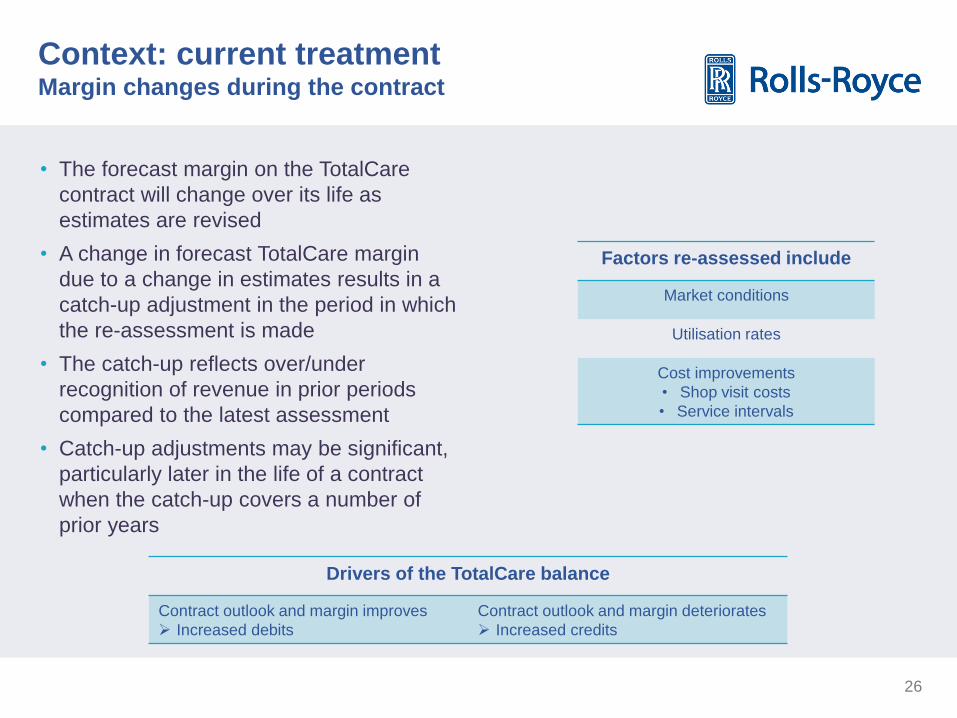
Context: current treatment Margin changes during the contract
• The forecast margin on the TotalCare
contract will change over its life as
estimates are revised
• A change in forecast TotalCare margin
due to a change in estimates results in a
catch-up adjustment in the period in which
the re-assessment is made
• The catch-up reflects over/under
recognition of revenue in prior periods
compared to the latest assessment
• Catch-up adjustments may be significant,
particularly later in the life of a contract
when the catch-up covers a number of
prior years
Drivers of the TotalCare balance
Contract outlook and margin improves
Increased debits
Contract outlook and margin deteriorates
Increased credits
Factors re-assessed include
Market conditions
Utilisation rates
Cost improvements
• Shop visit costs
• Service intervals
27
IFRS 15 0 1 2 3 4 5 6 7 8 9 10 Total
Net revenue – – – – 50 – 6 – 44 – – 100
Cost – – – – (25) – – – (20) – – (45)
Margin – – – – 25 – 6 – 24 – – 55
Margin % n/a n/a n/a 50% n/a 100% n/a 55% n/a n/a 55%
Cum. margin% n/a n/a n/a 50% 50% 55% 55% 55% 55% 55% 55%
Year
Cash $m 0 1 2 3 4 5 6 7 8 9 10 Total
Net revenue – 10 10 10 10 10 10 10 10 10 10 100
Cost – – – – (25) – – – (20) – – (45)
Margin – 10 10 10 (15) 10 10 10 (10) 10 10 55
Margin % 55%
Year
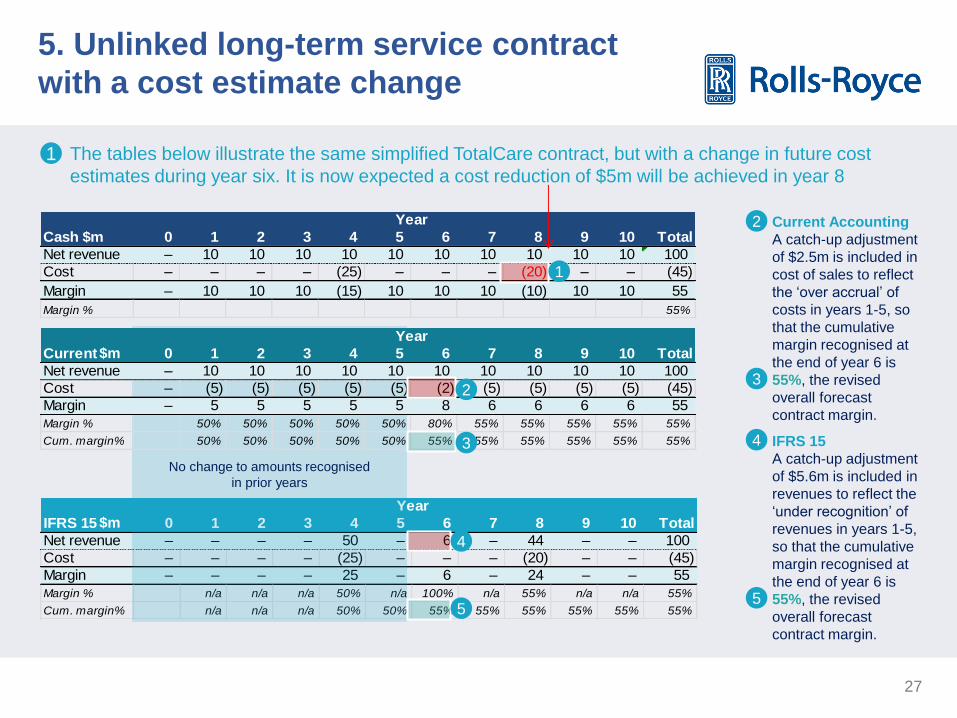
The tables below illustrate the same simplified TotalCare contract, but with a change in future cost
estimates during year six. It is now expected a cost reduction of $5m will be achieved in year 8
Current Accounting
A catch-up adjustment
of $2.5m is included in
cost of sales to reflect
the ‘over accrual’ of
costs in years 1-5, so
that the cumulative
margin recognised at
the end of year 6 is
55%, the revised
overall forecast
contract margin.
IFRS 15
A catch-up adjustment
of $5.6m is included in
revenues to reflect the
‘under recognition’ of
revenues in years 1-5,
so that the cumulative
margin recognised at
the end of year 6 is
55%, the revised
overall forecast
contract margin.
No change to amounts recognised
in prior years
Current 0 1 2 3 4 5 6 7 8 9 10 Total
Net revenue – 10 10 10 10 10 10 10 10 10 10 100
Cost – (5) (5) (5) (5) (5) (2) (5) (5) (5) (5) (45)
Margin – 5 5 5 5 5 8 6 6 6 6 55
Margin % 50% 50% 50% 50% 50% 80% 55% 55% 55% 55% 55%
Cum. margin% 50% 50% 50% 50% 50% 55% 55% 55% 55% 55% 55%
Year
5. Unlinked long-term service contract
with a cost estimate change
1
1
2
3 2
3
4
5
4
5
$m
$m

28
IFRS 15
There is no linked
accounting under IFRS 15,
so this is simply the sum of
the OE and AM accounting
shown on the previous
slides.
Current Accounting
A catch-up adjustment of
$4.4m is included (split
between concession re-
phasing and cost of sales),
so that the cumulative
margin recognised at the
end of year 6 is 32%, the
revised overall forecast
contract margin.
The tables illustrate the
same simplified contract,
but with a change in future
cost estimates during year
six. It is now expected a
cost reduction of $5m will
be achieved in year 8.
0 1 2 3 4 5 6 7 8 9 10 TotalOE - Gross revenue 100 – – – – – – – – – – 100
Concession (30) (3) (3) (3) (3) (3) (2) (3) (3) (3) (3) (60)
AM - Gross revenue – 10 10 10 10 10 10 10 10 10 10 100
Net revenue 70 7 7 7 7 7 8 7 7 7 7 140
OE - Cost of sales (50) – – – – – – – – – – (50)
AM - Cost of sales – (5) (5) (5) (5) (5) (2) (5) (5) (4) (5) (45)
Margin 20 2 2 2 2 2 6 2 2 2 2 45
Margin % 29% 29% 29% 29% 29% 29% 76% 32% 32% 32% 32% 32%
Cum. margin % 29% 29% 29% 29% 29% 29% 32% 32% 32% 32% 32%
Current accounting
Year
No change to amounts recognised
in prior years
Cash $m 0 1 2 3 4 5 6 7 8 9 10 Total
OE - Gross revenue 100 – – – – – – – – – – 100
OE - Concession (60) – – – – – – – – – – (60)
AM - Gross revenue – 10 10 10 10 10 10 10 10 10 10 100
Net revenue 40 10 10 10 10 10 10 10 10 10 10 140
OE - Cost (50) – – – – – – – – – – (50)
AM - Cost – – – – (25) – – – (20) – – (45)
Margin (10) 10 10 10 (15) 10 10 10 (10) 10 10 45
Margin % 32%
Year
0 1 2 3 4 5 6 7 8 9 10 TotalOE - Gross revenue 100 – – – – – – – – – – 100
Concession (60) – – – – – – – – – – (60)
AM - Gross revenue – – – – 50 – 6 – 44 – – 100
Net revenue 40 – – – 50 – 6 – 44 – – 140
OE - Cost of sales (50) – – – – – – – – – – (50)
AM - Cost of sales – – – – (25) – – – (20) – – (45)
Margin (10) – – – 25 – 6 – 24 – – 45
Margin % -25% n/a n/a n/a 50% n/a 100% n/a 55% n/a n/a 32%
Cum. margin % -25% -25% -25% -25% 17% 17% 22% 22% 32% 32% 32%
IFRS 15 accounting
Year
6. IFRS 15 vs linked OE and long-term
service contract with a cost estimate
change
1 1
2
2
3
2
3
* rounding
*
$m
$m

29
7. IFRS 15 vs current accounting for Risk and Revenue Sharing Partners (RRSPs)
Cash $m 0 1 2 3 4 5 6 7 8 9 10 Total
Net revenue – 10 10 10 10 10 10 10 10 10 10 100
Cost – – – – (25) – – – (25) – – (50)
RRSP share – (2) (2) (2) 3 (2) (2) (2) 3 (2) (2) (10)
Margin – 8 8 8 (12) 8 8 8 (12) 8 8 40
Margin % 40%
Year
0 1 2 3 4 5 6 7 8 9 10 Total
Net revenue – 10 10 10 10 10 10 10 10 10 10 100
Cost of sales – (6) (6) (6) (6) (6) (6) (6) (6) (6) (6) (60)
Margin – 4 4 4 4 4 4 4 4 4 4 40
Margin % 40% 40% 40% 40% 40% 40% 40% 40% 40% 40% 40%
Completion % 0% 10% 20% 30% 40% 50% 60% 70% 80% 90% 100%
Current
accounting
Year
0 1 2 3 4 5 6 7 8 9 10 Total
Net revenue – – – – 50 – – – 50 – – 100
Cost of sales – – – – (30) – – – (30) – – (60)
Margin – – – – 20 – – – 20 – – 40
Margin % n/a n/a n/a 40% n/a n/a n/a 40% n/a n/a 40%
Completion % 0% 0% 0% 0% 50% 50% 50% 50% 100% 100% 100%
IFRS 15
accounting
Year
IFRS 15
Recognition of payments to
RRSP matched to periods
when Rolls-Royce performs
activity for the customer.
Revenue and margin is
recognised when contract
activity occurs.
Current Accounting
RRSP payments, like any other
cost, are accrued within CoS to
match the stage of completion of
the contract based on flying
hours.
20% RRSP partner receives a
share of Rolls-Royce revenues
and costs whilst providing free
of charge parts.
(In year of service the RRSP
partner has $5m cost share
but still receives $2m revenue,
so net $3m received by Rolls-
Royce).
Recognition of partner’s share of aftermarket flows will be re-phased to match Rolls-Royce
activity to meet our aftermarket obligations.
$m
$m