ifn-b selectively inhibits il-2 production through crem
TRANSCRIPT
The Journal of Immunology
IFN-b Selectively Inhibits IL-2 Production throughCREM-Mediated Chromatin Remodeling
Dennis C. Otero,* Nancy J. Fares-Frederickson,* Menghong Xiao,* Darren P. Baker,†
and Michael David*,‡
IFN-b is widely used in the treatment of multiple sclerosis, yet the mechanism facilitating its efficacy remains unclear. IL-2
production by activated T cells, including those mediating autoimmunity, and subsequent autocrine stimulation is vital for T cell
expansion and function. In this study, we demonstrate that in mouse and human T cells, IFN-b specifically inhibits the production
of IL-2 upon TCR engagement without affecting other cytokines or activation markers. Rather than disrupting TCR signaling,
IFN-b alters histone modifications in the IL-2 promoter to retain the locus in an inaccessible configuration. This in turn is
mediated through the upregulation of the transcriptional suppressor CREM by IFN-b and consequent recruitment of histone
deacetylases to the IL-2 promoter. In accordance, ablation of CREM expression or inhibition of histone deacetylases activity
eliminates the suppressive effects of IFN-b on IL-2 production. Collectively, these findings provide a molecular basis by which
IFN-b limits T cell responses. The Journal of Immunology, 2015, 194: 000–000.
Type I IFNs (i.e., IFN-a/b) have been approved worldwidefor the treatment of multiple sclerosis (MS), yet themechanism(s) behind their effectiveness has remained
elusive. Treatment with IFN-a/b reduces the frequency of relapsesand slows the progress of disability associated with the disease;nevertheless, some patients fail to respond (1). Thus, a betterunderstanding of the mechanism behind the efficacy of IFN-b isvital to improve treatment strategies. Type I IFNs have beenstudied extensively in the context of viral or bacterial infection aspart of the innate immune response, but it is only recently that theimportance of these cytokines in the adaptive immune responsehas been more fully appreciated (2–5). Type I IFNs exert strongantiproliferative effects on lymphocytes, thus limiting immuneresponses by controlling the number of responding cells and at-tenuating the activity of individual T cells (6, 7). T helperlymphocytes, which play a key role in the development of MS,proliferate in response to Ag by producing IL-2 that subsequentlyacts in an autocrine positive feedback loop. Surprisingly, theeffects of type I IFNs on IL-2 production by activated T cells hasnot been evaluated previously.In this study, we investigate IL-2 production from T cells that
have been exposed to type I IFNs in vitro and in vivo. Our datareveal a novel pathway by which IFN-a/b inhibit gene expressionat the epigenetic level and implicate the involvement of CREM inthis process. We provide a possible mechanism by which IFN-b
functions to control MS and a possible reason for the occurrenceof T cell exhaustion following virus infection.
Materials and MethodsAnimals
STAT12/2 (8), Tyk22/2 (9), STAT52/2 (10), and STAT3fl/fl (11) mice havebeen described previously. Wild type 129SvEv, C57BL/6, and BalbC micewere obtained from The Jackson Laboratory (Bar Harbor, ME). Animalswere between 6 and 12 wk of age at the time of the experiments. All miceused in these experiments were housed in a pathogen-free environment andwere bred and cared for in accordance with University of California, SanDiego Animal Care Facility regulations. Six- to ten-week-old mice wereinfected intravenously with 2 3 106 PFU/mouse wild type (WT) lym-phocytic choriomeningitis virus (LCMV) clone 13 (Cl13). All viruses weregrown, identified, and quantified as described previously (12).
Flow cytometric analysis
For immunostaining, single-cell suspensions were prepared from mousespleen with ∼ 1 3 106 cells suspended in FACS buffer (PBS pH 7.4, 1%FCS, 0.02% NaN3) and stained for 20 min in the dark on ice. Mouse Abs,FITC–anti-CD4 (GK1.5), PE/Cy7–anti-CD8 (53.6.7), and PE–anti-IL2(JE56-5H4), Biotin–anti-CD44 (PGp-1), and PE–anti-CD25 (PC61.5)were obtained from eBioscience (San Diego, CA), as well as PE–anti-human IL-2 (MQ1-l7Hl2), and FITC–anti-human CD3 (OKT3). APC-streptavidin was used as a secondary reagent to detect biotin-labeledmAbs. All samples were analyzed on a FACSCalibur (BD Biosciences)and processed using FlowJo software (Ashland, OR). Intracellular stainingwas completed using the Intracellular Fixation and PermeabilizationBuffer with Brefeldin A (eBioscience) according to the manufacturer’sdirections. Intracellular calcium levels were monitored by flow cytometryafter loading cells with Fluo-4 AM and Fura Red (Invitrogen), and datarepresent the ratio of the signal for each. CD4+ T cells were treated for16 h with IFN-b (Biogen Idec, Cambridge, MA) prior to dye loading andthen washed, and a baseline reading was taken for 30 s. Hamster anti-CD3(eBioscience) was added at 10 mg/ml, and data were collected for 1 minprior to the addition of 25 mg/ml donkey anti-hamster IgG (eBioscience).Readings were continued for a total of 5 min.
T cell stimulation
Splenic T cells or purified CD4+ T cells (Pan T cell isolation kit, CD4+
CD25+ Regulatory T Cell Isolation Kit; Miltenyi Biotec) were treated withthe indicated concentrations of IFN-b (Biogen Idec) for 16 h or as indi-cated prior to stimulation with either 10 mg/ml anti-CD3 and 2 mg/mlanti-CD28 (eBioscience) or 5 ng/ml PMA and 500 ng/ml Ionomycin(Sigma-Aldrich) for 3 or 6 h. Cells were analyzed for IL-2 protein byintracellular stain or RNA by reverse transcription and quantitative PCR.
*Division of Biological Sciences, University of California San Diego, La Jolla, CA92093; †Biogen Idec, Cambridge, MA 02142; and ‡UC San Diego Moores CancerCenter, University of California San Diego, La Jolla, CA 92093
Received for publication December 24, 2014. Accepted for publication March 24,2015.
This work was supported by National Institutes of Health–National Institute of Al-lergy and Infectious Diseases Grant AI71223 and by National Multiple SclerosisSociety Grant 54109A (to M.D.).
Address correspondence and reprint requests to Dr. Michael David, Division ofBiological Sciences, University of California San Diego, Bonner Hall 3138, 9500Gilman Drive, La Jolla, CA 92093-0322. E-mail address: [email protected]
Abbreviations used in this article: Cl13, clone 13; ISG15, IFN-stimulated gene 15;LCMV, lymphocytic choriomeningitis virus; MS, multiple sclerosis; siRNA, smallinterfering RNA; Treg, regulatory T cell; WT, wild type.
Copyright� 2015 by The American Association of Immunologists, Inc. 0022-1767/15/$25.00
www.jimmunol.org/cgi/doi/10.4049/jimmunol.1403181
Published April 17, 2015, doi:10.4049/jimmunol.1403181

Mouse IL-2 Ready-Set-Go Kit (eBioscience) was used to measure IL-2released into the conditioned T cell culture medium. Human PBLs werestimulated with Dynabeads Human T cell activator CD3/CD28 (Invi-trogen). Trichostatin A (Sigma-Aldrich) was added to cultures 1 h prior tostimulation with anti-CD3/CD28. For in vivo stimulations, OTII TCRtransgenic mice were injected i.v. with 100 mg Ova323–336 peptide(Anaspec) 24 h after injection with 10,000 U IFN-b (Biogen Idec). SplenicT cells were removed 4 h after peptide injection and were subjected tointracellular staining for IL-2 and analyzed by flow cytometry.
Quantitative PCR
DNase-treated RNA was isolated from activated T cells with the RNeasymethod (Qiagen). cDNA was prepared with the High-Capacity cDNAReverse Transcription Kit (Applied Biosystems), and quantitative PCR wasperformed using Taqman primers for mouse and human IL-2, mouse IL-4,and mouse IFN-g (Applied Biosystems). Analysis was performed witha Step One Plus real time PCR system (Applied Biosystems). mRNAabundance was determined by relative quantification and normalized toGAPDH.
Western blot
Splenic T cells were treated as above but then stimulated with 10 mg/mlanti-CD3 for 2, 5, 20, and 60 min. Cells were lysed and subjected to SDS-PAGE and Western blot. Blots were probed for phospho-p44/42, Phospho-cJun, Phospho-p38, total p38, and total cFos (Cell Signaling).
Chromatin accessibility by real-time PCR assay
Chromatin accessibility by real-time PCR assay was performed as de-scribed (13). Briefly, 1 3 107 cells per sample were stimulated for 2 h with10 mg/ml anti-CD3 and 2 mg/ml anti-CD28 following 16 h pretreatmentwith 1000 U/ml IFN-b (Biogen Idec). Nuclei were isolated and subse-quently digested with micrococcal nuclease and then, after DNA purifi-cation, real-time PCR was used to determine relative amounts of specificsequences within the IL-2 promoter. Primer sequences were used aspublished: set B forward: 59-CACAGGTAGACTCTTTGAAAATATGT-GTAA-39; reverse: 59-CATGGGAGGCAATTTATACTGTTAATG-39; set Cforward: 59-CCTAAATCCATTCAGTCAGTGTATGG-39; reverse: 59-TGT-GTGGCAGAAAGCATTACCT-39; set D forward: 59-CTTTTGTGTCTCC-ACCCCAAA-39; reverse: 59-CACACTTAGGTGGCAGTTTTAATTCAT-39;set F forward: 59-CATGCAGAGTTTTTTGTTGTTTTCTAG-39; reverse: 59-GCCTAAAGTCTCTCACAAAGAACAGA-39. Change in accessibility forindividual primer sets was calculated as 1 2 (Stimulated/Unstimulated).
Chromatin immunoprecipitation
Chromatin immunoprecipitations were performed using the EpiTect ChIPOneDay Kit (Qiagen) as described using anti-histone H3 (acetyl K14) andanti-Histone H4 (acetyl K8; Abcam). Immunoprecipitations were analyzedwith quantitative PCR using primer B as in the Chromatin accessibility byreal-time PCR assay.
Small interfering RNA knockdown
Purified CD4+ T cells were transfected by electroporation with either25 nM CREM small interfering RNA (siRNA) or control siRNA (ThermoScientific Darmacon) and rested for 4 h prior to treatment with IFN-b.After 16 h, cells were stimulated with anti-CD3/CD28 for 3 h, RNA wasisolated, and quantitative PCR was used to determine IL-2 message levels.Percent inhibition was calculated as [(Stimulated – Inhibited)/Stimulated)]3100. Student t test was used to determine significance.
ResultsIFN-b inhibits activation-induced IL-2 production in T cells
Signaling through the TCR in conjunction with costimulationthrough CD28 results in the activation of T cells. One of the earliesthighly induced genes following T cell activation is IL-2, which actsin an autocrine fashion to promote the proliferative expansion ofAg-specific cells (14). As IFN-b is a strong inhibitor of T cellproliferation, we chose to investigate the effects of IFN-b on IL-2production in T cells. Upon stimulation with agonistic anti-CD3and anti-CD28 Abs, splenic T cells of WT 129SveV mice produceIL-2 within 5 h, as detected by intracellular flow cytometrystaining (Fig. 1A, second panel). However, upon pretreatmentwith IFN-b, the number of IL-2–producing cells is significantly
reduced (Fig. 1A, third panel), an effect specific to IFN-a/b, as thetype II IFN, IFN-g, had no effect on IL-2 production (Fig. 1A,right panel). In addition, IL-2 production was inhibited in CD4+
(Fig. 1A, top row) and CD8+ (Fig. 1A, bottom row) T cells, al-though the latter do not produce significant amounts of IL-2 uponstimulation. The effect was not unique to anti-CD3/CD28 stimu-lation, as IFN-b also inhibited the production of IL-2 when T cellswhere stimulated with the mitogens PMA and ionomycin(Fig. 1B) or Con A (not shown). Inhibition of IL-2 release by IFNin a dose-dependent manner into the culture media of splenicT cells stimulated with anti-CD3/CD28, PMA/ionomycin, or ConA was further corroborated by measuring the IL-2 concentrationwith ELISA analysis of the conditioned medium (Fig. 1C and datanot shown). Additional experiments revealed that IFN-b–mediatedinhibition of IL-2 production occurred on the transcriptional level,as IL-2 mRNAwas also reduced because of IFN-b exposure priorto stimulation (Fig. 1D). Strikingly, the inhibitory effect of IFN-bwas restricted to IL-2, as neither IL-4 (Fig. 1D) nor IFN-g (notshown) mRNA, nor expression of the cell surface activationmarkers CD25 and CD44 (Fig. 1E), were subdued by IFN-bpretreatment.Activated T cells often exhibit significant differences in their
response to type I IFNs as compared with naive T cells (15). Wetherefore investigated next whether IFN-b could inhibit IL-2production in already activated T cells. CD4+ T cells were stim-ulated for 3 d with anti-CD3/CD28 (Fig. 2A, right panels) andthen incubated overnight with (Fig. 2A, bottom panels) or without(Fig. 2A, top panels) 1000 U/ml IFN-b. Subsequently, cells werestimulated with PMA/ionomycin for 5 h. IFN-b significantly re-duced the number of IL-2–producing cells that were naive at thetime of stimulation (Fig. 2A, middle plots), but failed to inhibit IL-2production if the cells were preactivated for 3 d with anti-CD3/CD28 (Fig. 2A, right panels). This finding indicates that once IL-2transcription is activated, it can no longer be suppressed by IFN-b.As ongoing IL-2 production in already activated T cells was
resistant to suppression by IFN-b, we wanted to determine thewindow of opportunity for IFN-b to inhibit IL-2 productionthrough pretreatment of T cells with IFN-b prior to stimulation.To this end, splenic T cells were stimulated with anti-CD3/CD28after 12, 6, or 3 h of IFN-b exposure, respectively. In addition,IFN-b was added at the time of stimulation (0 h), or 3, 6, and 12 hafter TCR engagement. Cultures were maintained for an addi-tional 36 h, and IL-2 was measured in the conditioned medium byELISA. As shown in Fig. 2B, the addition of IFN-b simulta-neously or after TCR stimulation had little effect on IL-2 pro-duction; however, when T cells were pretreated with IFN-b for aslittle as 3 h prior to stimulation, a dramatic decrease in the amountof IL-2 was registered. This result strongly suggested that newgene expression and protein synthesis were required for inhibitionof IL-2 production by IFN-b. Unfortunately, experiments usingcycloheximide were inconclusive because of the sensitivity ofprimary T cells to the agent (data not shown).
IFN-b inhibits IL-2 production independent of regulatoryT cells and occurs in human PBLs
As all previous experiments were conducted with either totalsplenic T cell populations or the purified CD4+ subset, the pos-sibility existed that regulatory T cells (Tregs) were required forIFN-b to inhibit IL-2 production. Indeed, it was shown recentlythat IFN is required for maintaining Foxp3 expression in Tregsduring infection (16). Therefore, we decided to eliminate Tregsfrom the CD4+ T cell cultures prior to IFN-b exposure. AlthoughTregs alone had, as expected, an intrinsic inhibitory effect on IL-2production by CD4+ cells (Fig. 3A, compare black bars), IFN-b
2 INHIBITION OF IL-2 PRODUCTION BY IFN-b

was nevertheless still capable of significantly inhibiting IL-2production, even in the absence of Tregs (Fig. 3A, compare graybars). We therefore concluded that IFN-b acts on the respondingeffector T cells directly to inhibit IL-2 production independent ofTregs.
To address whether the inhibitory effect of IFN-b on IL-2production could also be seen in human cells, we used humanPBMCs to analyze IL-2 production by flow cytometry and IL-2mRNA expression in response to anti-CD3/CD28 in the absenceor presence of human IFN-b. Similar to their murine counterparts,
FIGURE 1. Specific inhibition of IL-2 expression by IFN-b. (A) Splenocytes from WT 129/SvEv mice were treated with or without IFN-b or IFN-g for
16 h and then stimulated with 10 mg/ml immobilized anti-CD3 and 2 mg/ml anti-CD28 for 5 h followed by intracellular staining for IL-2. Upper plots were
gated on live CD4+ cells, and lower plots were gated on live CD8+ cells; they are representative of at least five experiments. (B) Splenocytes from WT 129/
SvEv mice were treated for 16 h with IFN-b and stimulated with PMA/ionomycin for 5 h followed by intracellular stain for IL-2. Plots are gated on live
CD4+ cells. (C) Splenocytes were stimulated with the indicated mitogens and cultured for 48 h in the presence of increasing doses of IFN-b. IL-2 in the
conditioned medium was quantified by ELISA (n = 3). (D) CD4+ splenocytes were treated for 16 h with IFN-b prior to stimulation with anti-CD3/anti-
CD28. Six hours later, RNAwas purified and quantitative PCR was used to measure IL-2 and IL-4 mRNA levels (n = 3). (E) CD4+ splenocytes were treated
as in (C), stained for CD25 and CD44 expression and analyzed by flow cytometry.
The Journal of Immunology 3

human T cells were inhibited in their ability to synthesize IL-2when previously exposed to IFN-b (Fig. 3B, 3C). Thus, IFN-bacts directly on human and murine T cells to inhibit activation-induced IL-2 production.
IFN-b2mediated inhibition of IL-2 expression requiressignaling through the type I IFNR but does not alter TCRsignaling
To determine whether the inhibitory effect of IFN-b on IL-2production required known components of the canonical type IIFN signaling pathway, we used STAT1-deficient mice that dis-play severely impaired IFN responses. The role of STAT1 inmurine T cells is well documented (2, 3, 8, 17), and we previouslyreported that the absence of STAT1 in T cells results in an un-expected mitogenic response to IFN (18). This report is corrob-orated in Fig. 4A, (left panels), wherein IFN-b inhibited IL-2production in WT T cells, but strikingly caused a significant in-crease in IL-2–producing cells (Fig. 4A, middle panels) and thetotal amount of IL-2 produced in the absence of STAT1 (data notshown). Furthermore, IL-2 production was unaffected by IFN-bpretreatment of Tyk22/2 T cells, whereas IL-2 release fromT cells isolated from CreLck/STAT3loxp and STAT5-deficient micewas still inhibited by IFN-b pretreatment (Fig. 4A, right panels).IL-2 induction requires engagement of the TCR along with
stimulation through the coreceptor CD28, which together activatemultiple downstream signaling pathways including the MAPKs,
NF-kB, PLCg, and increases in cytoplasmic free calcium (19, 20).Because IFN-b inhibited IL-2 production even in response tostimulation with PMA and ionomycin, we concluded that TCRproximal signaling events are likely not compromised by IFN-b.Indeed, phosphorylation of p42/44 MAPKs, the stress-activatedprotein kinase p38, and JNK is not affected by IFN-b pretreat-ment (Fig. 4B), nor is there a reduction in cFos levels (Fig. 4B) oran impairment of NF-kB signaling (data not shown) after IFN-btreatment. In concurrence, there were also no differences in theincrease of cytoplasmic free calcium after TCR stimulation in thepresence of IFN-b (Fig. 4C). Furthermore, the use of various lu-ciferase reporter constructs representing the major enhancer ele-ments within the IL-2 promoter (e.g., NF-kB, NFAT, AP-1) (21)did not indicate any interference of IFN-b on this level (data notshown). Thus, IFN-b does not attenuate IL-2 production throughinterference with TCR signaling or activation of the major tran-scription factors that control IL-2 transcription. These facts arealso in line with the observation that IFN-b selectively targets IL-2without affecting the induction of other cytokines or activationmarkers.
IFN-b induces changes in chromatin remodeling of the IL-2locus through induction of Crem
Gene expression depends on changes in the chromatin structure atthe specific gene locus which, in turn, is regulated by posttrans-lational modifications of histones or the DNA itself, or both,
FIGURE 2. Inhibition of IL-2 expression
requires pretreatment with IFN-b. (A) Purified
CD4+ splenic T cells were treated with IFN-b
for 16 h (lower plots) before (middle plots) or
after (right plots) 3 d in culture with anti-CD3
and anti-CD28 and then restimulated with
PMA/ionomycin for 5 h followed by intracel-
lular stain for IL-2. (B) Splenocytes were cul-
tured for a total of 4 d following stimula-
tion with anti-CD3 and anti-CD28. IFN-b was
added up to 12 h before or 12 h after stimula-
tion. The amount of IL-2 in the conditioned
medium was measured with ELISA (n = 3).
4 INHIBITION OF IL-2 PRODUCTION BY IFN-b

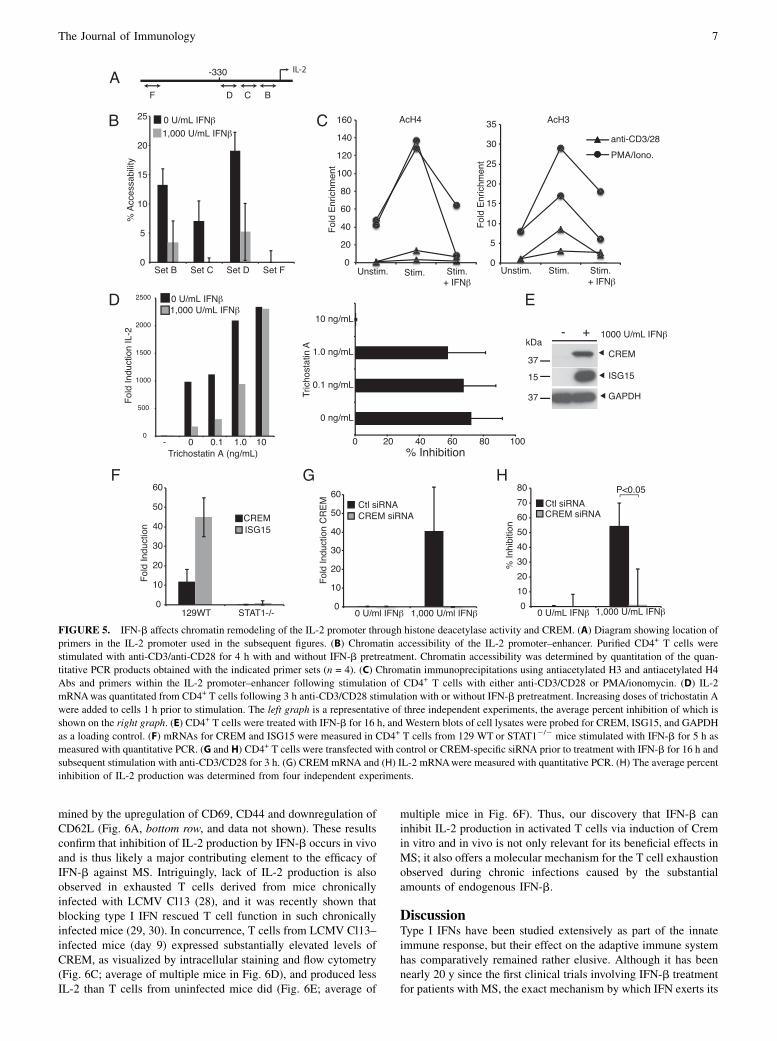
primarily through acetylation, methylation, or both. These epi-genetic changes result in the accessibility of the gene only to site-specific transcription factors and the basal transcription machinery.To determine whether IFN-b pretreatment would influence thechanges in chromatin structure elicited in the IL-2 locus after TCRstimulation of CD4+ T cells, we used a chromatin accessibilityassay using micrococcal DNase treatment of nuclei from anti-CD3/CD28–stimulated cells with and without IFN-b pretreatment.Changes in the amount of recovered DNA reflect whether a par-ticular locus is in a closed formation or is open to DNase digestion(22). Purified CD4+ T cells were stimulated with anti-CD3/CD28for 4 h with or without prior exposure to IFN-b. We used severalprimer sets within the 300 bp IL-2 promoter (Fig. 5A, sets B, C,and D) to determine its accessibility and a control primer setdistant from the IL-2 locus (Fig. 5A, set F) as a control.We observed that with IFN-b treatment alone, the promoter
presented in the same closed configuration as in unstimulatedcells, whereas anti-CD3/CD28 treatment led to a substantial in-crease in the accessibility of the IL-2 locus. Notably, IFN-b pre-treatment significantly reduced the anti-CD3/CD28 inducedchange in the accessibility of the IL-2 locus (Fig. 5B). Becausechanges in chromatin structure are regulated by histone mod-ifications, we next determined the acetylation status of histoneswithin the IL-2 promoter. As shown in Fig. 5C, chromatin im-munoprecipitation using Abs specific for acetylated histone 3 or
acetylated histone 4 revealed a clear increase of these posttrans-lational modifications within the IL-2 promoter after TCR en-gagement or PMA/ionomycin stimulation. In accordance with thechromatin accessibility studies, pretreatment of the cells withIFN-b negated the TCR-induced histone modifications (Fig. 5C).These findings suggested that IFN was either preventing acetyla-tion of the histones within the IL-2 promoter or promoting theirdeacetylation via recruitment of histone deacetylases. To distin-guish these possibilities, we chose to use the histone deacetylaseinhibitor trichostatin A to test its influence on the inhibitory effectof IFN on IL-2 production. Indeed, we found that with increasingdoses of trichostatin A, the amount of IL-2 produced after TCRengagement increased (Fig. 5D, left panel). More importantly, athigher concentrations trichostatin A completely abrogated theinhibitory effect of IFN-b on IL-2 production (Fig. 5D, rightpanel; average of four separate experiments). The cumulative in-terpretation of these studies infers that IFN-b is selectivelyrecruiting histone deacetylases to the IL-2 locus to maintain it ina closed, transcriptionally inactive configuration.Histone acetylation is an important regulator of gene expression
following TCR stimulation, and several negative regulatory factorshave been shown to recruit deacetylases to the IL-2 locus. Thesefactors include the zinc finger transcription factors Aiolos andIkaros, as well as Blimp and CREM, all of which act in a negativefeedback loop to silence IL-2 expression (23–27). Our inves-
FIGURE 3. IFN-b inhibition of
IL-2 expression is independent of
Tres and is reproduced in human
peripheral blood leukocytes. (A)
CD4+ T cells were depleted of
CD25+ Tregs and then treated for
16 h with IFN-b, followed by stim-
ulation with anti-CD3/anti-CD28
for 4 h in the presence or absence
of CD25+ Tregs. IL-2 mRNA was
measured with quantitative PCR
(n = 3). (B) Human PBLs were
stimulated with anti-CD3/anti-CD28
Dynabeads with and without IFN-b
pretreatment, and RNA was col-
lected after 3 h stimulation and
analyzed for IL-2 message by quan-
titative PCR (n = 3). (C) Human
PBLs were stimulated as in (B), ex-
cept that cells were stained for in-
tracellular IL-2 after 5 h (represen-
tative of five experiments).
The Journal of Immunology 5

tigations did not reveal any involvement of Aiolos, Ikaros, orBlimp in the inhibitory effects of IFN-b on IL-2 production (datanot shown). However, analysis of microarray data from anti-CD3/CD28–stimulated CD4+ T cells with and without prior IFN-bexposure revealed that CREM was significantly upregulated inthese T cells by IFN-b. This finding was confirmed by Westernblot analysis, where there was a dramatic induction of CREMprotein expression in response to 16 h IFN-b treatment (Fig. 5E).Analysis with quantitative PCR (Fig. 5F) revealed a STAT1-dependent induction of CREM mRNA within 5 h, similar to thatof IFN-stimulated gene 15 (ISG15).To determine whether the IFN-b–induced CREM was indeed
responsible for the inhibition of IL-2 production by IFN-b, weused CREM-specific siRNA to abrogate its expression in CD4+
T cells that were subsequently incubated with and without IFN-bprior to stimulation with anti-CD3/CD28. As shown in Fig. 5H,the control siRNA had no influence on the inhibitory effect ofIFN-b on IL-2 production. In striking contrast, ablation of CREMexpression (Fig. 5G) completely eliminated the suppressive effects
of IFN-b (Fig. 5H) as determined by intracellular staining forIL-2. Therefore, upregulation of CREM and the subsequent re-cruitment of histone deacetylases to the IL-2 locus are responsiblefor inhibition of IL-2 expression in T cells by IFN-b.
Inhibition of IL-2 production in T cells from mice treated withIFN-b or infected with LCMV Cl13
To determine whether inhibition of IL-2 production also occursin vivo, OTII TCR transgenic mice were injected with 10,000 UIFN-b 24 h prior to challenge with Ova323–339 peptide to triggerT cell activation. A significant number of IL-2–producing T cellscould be found in the spleens of OTII mice 4 h after injection withOva323–339 peptide, whereas few such IL-2–producing T cellswere found in the spleens of IFN-b–treated mice (Fig. 6A,middle row; averages shown in Fig. 6B). Importantly, there waslittle difference in the number of Ova323–339–specific T cells inthe spleens of IFN-treated mice compared with untreated mice(Fig. 6A, top row), nor was there a difference in the number ofactivated T cells in IFN-treated versus untreated mice, as deter-
FIGURE 4. Inhibition of IL-2 by IFN-b in naive T cells is dependent on STAT1, but does not affect proximal signaling through the TCR. (A) Splenocytes
from WT and STAT12/2, Tyk22/2, STAT32/2, and STAT52/2 mice were treated with IFN-b for 16 h and then stimulated with PMA/ionomycin for 5 h
followed by intracellular IL-2 stain. Plots are gated on CD4+ cells. Representative of three to five mice each. (B) Splenic T cells were treated for 16 h with
IFN-b and then stimulated with anti-CD3/CD28 for the indicated time. Western blots of whole cell lysates were performed and probed for the indicated
phosphorylated proteins. (C) Splenic T cells, treated for 16 h with IFN-b and then loaded with Fluo-4 and Fura Red, were run on flow cytometer for 30 s to
establish baseline, and then stimulated with anti-CD3. After 1 min, a crosslinking Ab was added to cells to induce calcium flux (representative of at least
five experiments).
6 INHIBITION OF IL-2 PRODUCTION BY IFN-b
mined by the upregulation of CD69, CD44 and downregulation ofCD62L (Fig. 6A, bottom row, and data not shown). These resultsconfirm that inhibition of IL-2 production by IFN-b occurs in vivoand is thus likely a major contributing element to the efficacy ofIFN-b against MS. Intriguingly, lack of IL-2 production is alsoobserved in exhausted T cells derived from mice chronicallyinfected with LCMV Cl13 (28), and it was recently shown thatblocking type I IFN rescued T cell function in such chronicallyinfected mice (29, 30). In concurrence, T cells from LCMV Cl13–infected mice (day 9) expressed substantially elevated levels ofCREM, as visualized by intracellular staining and flow cytometry(Fig. 6C; average of multiple mice in Fig. 6D), and produced lessIL-2 than T cells from uninfected mice did (Fig. 6E; average of
multiple mice in Fig. 6F). Thus, our discovery that IFN-b caninhibit IL-2 production in activated T cells via induction of Cremin vitro and in vivo is not only relevant for its beneficial effects inMS; it also offers a molecular mechanism for the T cell exhaustionobserved during chronic infections caused by the substantialamounts of endogenous IFN-b.
DiscussionType I IFNs have been studied extensively as part of the innateimmune response, but their effect on the adaptive immune systemhas comparatively remained rather elusive. Although it has beennearly 20 y since the first clinical trials involving IFN-b treatmentfor patients with MS, the exact mechanism by which IFN exerts its
FIGURE 5. IFN-b affects chromatin remodeling of the IL-2 promoter through histone deacetylase activity and CREM. (A) Diagram showing location of
primers in the IL-2 promoter used in the subsequent figures. (B) Chromatin accessibility of the IL-2 promoter–enhancer. Purified CD4+ T cells were
stimulated with anti-CD3/anti-CD28 for 4 h with and without IFN-b pretreatment. Chromatin accessibility was determined by quantitation of the quan-
titative PCR products obtained with the indicated primer sets (n = 4). (C) Chromatin immunoprecipitations using antiacetylated H3 and antiacetylated H4
Abs and primers within the IL-2 promoter–enhancer following stimulation of CD4+ T cells with either anti-CD3/CD28 or PMA/ionomycin. (D) IL-2
mRNAwas quantitated from CD4+ T cells following 3 h anti-CD3/CD28 stimulation with or without IFN-b pretreatment. Increasing doses of trichostatin A
were added to cells 1 h prior to stimulation. The left graph is a representative of three independent experiments, the average percent inhibition of which is
shown on the right graph. (E) CD4+ T cells were treated with IFN-b for 16 h, and Western blots of cell lysates were probed for CREM, ISG15, and GAPDH
as a loading control. (F) mRNAs for CREM and ISG15 were measured in CD4+ T cells from 129 WT or STAT12/2 mice stimulated with IFN-b for 5 h as
measured with quantitative PCR. (G and H) CD4+ T cells were transfected with control or CREM-specific siRNA prior to treatment with IFN-b for 16 h and
subsequent stimulation with anti-CD3/CD28 for 3 h. (G) CREMmRNA and (H) IL-2 mRNAwere measured with quantitative PCR. (H) The average percent
inhibition of IL-2 production was determined from four independent experiments.
The Journal of Immunology 7

efficacy has not been resolved. In this study, we provide clearevidence that IFN-b is acting on T cells specifically to inhibit theproduction of IL-2, a cytokine that is vitally important for ex-pansion of Ag-specific T cells. It is reasonable to conclude thatinhibition of IL-2 production is one, if not the key, mechanism bywhich IFN-b limits the number of T cells being activated andresponding to myelin basic protein. The summary of our dataunequivocally demonstrates that IFN-b induction of CREM isrequired for the recruitment of histone deacetylases to the IL-2locus and the subsequent transcriptional silencing of the IL-2gene. Highly intriguing is the selectivity of this process, as wedid not observe any suppression of other cytokines or cell surfaceactivation markers by IFN-b. Theoretically, this finding could beof prognostic benefit in the treatment selection for individual
patients with MS, as it is well established that not all patientsrespond to IFN therapy. As such, if IL-2 production by isolatedT cells from a specific patient is refractory to inhibition by IFN-bin vitro, alternative treatments could be considered at a muchearlier time point.Beyond their contribution to a better understanding of the
mechanism underlying the efficacy of IFN-b in the treatment ofautoimmune disorders, our findings also support the notion thatIFN-b produced during infectious processes acts in a negativefeedback loop that limits the expansion of the responding T cells.In support of this conclusion, we observed an increase in CREMlevels in T cells from mice chronically infected with LCMV Cl13(Fig. 6C), with an accompanying reduction in the IL-2 productionfrom these animals (Fig. 6E). Because LCMV Cl13 induces
FIGURE 6. Inhibition of IL-2
production in T cells from mice
injected with IFN-b or infected with
LCMV Cl13. (A) OTII TCR trans-
genic mice were injected with 100 mg
Ova323–339 24 h after i.v. injection of
10,000 U IFN-b. Splenic T cells were
collected 4 h after peptide injection
and subjected to intracellular stain for
IL-2. Cells were also analyzed for
surface expression of Va2/Vb5 TCR
chains and the activation marker
CD69. (B) The average number of IL-
2–positive OTII T cells from three
independent experiments. (C) Single-
cell suspensions from spleens of day
9 LCMV Cl13–infected mice were
subjected to intracellular stain for
CREM. CD4+ cells are shown. (D)
The percent CREM-positive CD4
T cells from five uninfected and
seven LCMV Cl13–infected mice
stained as in (B). (E) Single-cell
suspensions from spleens of day 9
LCMV Cl13–infected mice were
stimulated with anti-CD3/CD28 beads
for 5 h and then stained intracellularly
for IL-2. (F) The percent of IL-2–
positive CD4 T cells from four mice
each uninfected and LCMV Cl13–
infected mice stained as in (D).
8 INHIBITION OF IL-2 PRODUCTION BY IFN-b

a significant amount of IFN in the early stages of the infection, wecan extrapolate that IFN-induced CREM is responsible for thereduced IL-2 production in T cells from chronically infected mice(28). This effect—often referred to as T cell exhaustion—has aprofound effect on adaptive immune responses and could be re-sponsible for the increased incidence of opportunistic infectionsfollowing virus exposure.Interestingly, by simply blocking IFN signaling in LCMV Cl13–
infected mice, one can prevent or revert T cell exhaustion andinduce clearance of the virus (29, 30). We propose that this occursby restoring IL-2 production in Ag-specific T cells that wouldotherwise be inhibited by IFN produced during the innate responseto the virus. This model also emphasizes a possible link betweenchronic viral infection and human autoimmune diseases, becausereduced T cell responses, increased systemic IFN levels, and el-evated CREM expression have all been noted in patients systemiclupus erythematosus (31–33), although no direct connection be-tween high IFN levels and CREM expression in patients withlupus has been suggested until now. Thus, although type I IFN isused to treat one form of autoimmune disease (i.e., MS) and is alsoinvolved in the pathogenesis of another (i.e., systemic lupuserythematosus), both may involve the same mechanism—namely,CREM-mediated inhibition of T cell responses as a consequenceof type I IFN exposure.
AcknowledgmentsWe thank Dr. E. Zuniga and Dr. R. Rickert for helpful discussions and ad-
vice and Monica Macal (Zuniga Laboratory) for providing spleens from
LCMV-infected mice.
DisclosuresThe authors have no financial conflicts of interest.
References1. Kieseier, B. C. 2011. The mechanism of action of interferon-b in relapsing
multiple sclerosis. CNS Drugs 25: 491–502.2. Moro, H., D. C. Otero, Y. Tanabe, and M. David. 2011. T cell-intrinsic
and -extrinsic contributions of the IFNAR/STAT1-axis to thymocyte survival.PLoS ONE 6: e24972. Available at: http://journals.plos.org/plosone/article?id=10.1371/journal.pone.0024972.
3. Otero, D. C., D. P. Baker, and M. David. 2013. IRF7-dependent IFN-b pro-duction in response to RANKL promotes medullary thymic epithelial cell de-velopment. J. Immunol. 190: 3289–3298.
4. Le Bon, A., and D. F. Tough. 2002. Links between innate and adaptive immunityvia type I interferon. Curr. Opin. Immunol. 14: 432–436.
5. Gonzalez-Navajas, J. M., J. Lee, M. David, and E. Raz. 2012. Immunomodu-latory functions of type I interferons. Nat. Rev. Immunol. 12: 125–135.
6. Abril, E., L. M. Real, A. Serrano, P. Jimenez, A. Garcıa, J. Canton, I. Trigo,F. Garrido, and F. Ruiz-Cabello. 1998. Unresponsiveness to interferon associatedwith STAT1 protein deficiency in a gastric adenocarcinoma cell line. CancerImmunol. Immunother. 47: 113–120.
7. Erickson, S., O. Sangfelt, J. Castro, M. Heyman, S. Einhorn, and D. Grander.1999. Interferon-alpha inhibits proliferation in human T lymphocytes by abro-gation of interleukin 2-induced changes in cell cycle-regulatory proteins. CellGrowth Differ. 10: 575–582.
8. Meraz, M. A., J. M. White, K. C. Sheehan, E. A. Bach, S. J. Rodig, A. S. Dighe,D. H. Kaplan, J. K. Riley, A. C. Greenlund, D. Campbell, et al. 1996. Targeteddisruption of the Stat1 gene in mice reveals unexpected physiologic specificity inthe JAK-STAT signaling pathway. Cell 84: 431–442.
9. Shimoda, K., K. Kato, K. Aoki, T. Matsuda, A. Miyamoto, M. Shibamori,M. Yamashita, A. Numata, K. Takase, S. Kobayashi, et al. 2000. Tyk2 plays
a restricted role in IFN alpha signaling, although it is required for IL-12-mediated T cell function. Immunity 13: 561–571.
10. Teglund, S., C. McKay, E. Schuetz, J. M. van Deursen, D. Stravopodis, D. Wang,M. Brown, S. Bodner, G. Grosveld, and J. N. Ihle. 1998. Stat5a and Stat5bproteins have essential and nonessential, or redundant, roles in cytokineresponses. Cell 93: 841–850.
11. Alonzi, T., D. Maritano, B. Gorgoni, G. Rizzuto, C. Libert, and V. Poli. 2001.Essential role of STAT3 in the control of the acute-phase response as revealed byinducible gene inactivation [correction of activation] in the liver. Mol. Cell. Biol.21: 1621–1632.
12. de la Torre, J. C., and M. B. Oldstone. 1992. Selective disruption of growthhormone transcription machinery by viral infection. Proc. Natl. Acad. Sci. USA89: 9939–9943.
13. Su, L., R. J. Creusot, E. M. Gallo, S. M. Chan, P. J. Utz, C. G. Fathman, andJ. Ermann. 2004. Murine CD4+CD25+ regulatory T cells fail to undergo chro-matin remodeling across the proximal promoter region of the IL-2 gene. J.Immunol. 173: 4994–5001.
14. Malek, T. R. 2008. The biology of interleukin-2. Annu. Rev. Immunol. 26: 453–479.
15. Dondi, E., L. Rogge, G. Lutfalla, G. Uze, and S. Pellegrini. 2003. Down-modulation of responses to type I IFN upon T cell activation. J. Immunol.170: 749–756.
16. Lee, S. E., X. Li, J. C. Kim, J. Lee, J. M. Gonzalez-Navajas, S. H. Hong,I. K. Park, J. H. Rhee, and E. Raz. 2012. Type I interferons maintain Foxp3expression and T-regulatory cell functions under inflammatory conditions inmice. Gastroenterology 143: 145–154.
17. Nishibori, T., Y. Tanabe, L. Su, and M. David. 2004. Impaired development ofCD4+ CD25+ regulatory T cells in the absence of STAT1: increased suscepti-bility to autoimmune disease. J. Exp. Med. 199: 25–34.
18. Tanabe, Y., T. Nishibori, L. Su, R. M. Arduini, D. P. Baker, and M. David. 2005.Cutting edge: role of STAT1, STAT3, and STAT5 in IFN-alpha beta responses inT lymphocytes. J. Immunol. 174: 609–613.
19. Ghosh, P., T. H. Tan, N. R. Rice, A. Sica, and H. A. Young. 1993. The interleukin2 CD28-responsive complex contains at least three members of the NF kappa Bfamily: c-Rel, p50, and p65. Proc. Natl. Acad. Sci. USA 90: 1696–1700.
20. Acuto, O., V. Di Bartolo, and F. Michel. 2008. Tailoring T-cell receptor signalsby proximal negative feedback mechanisms. Nat. Rev. Immunol. 8: 699–712.
21. Rooney, J. W., Y. L. Sun, L. H. Glimcher, and T. Hoey. 1995. Novel NFAT sitesthat mediate activation of the interleukin-2 promoter in response to T-cell re-ceptor stimulation. Mol. Cell. Biol. 15: 6299–6310.
22. Rao, S., E. Procko, and M. F. Shannon. 2001. Chromatin remodeling, measuredby a novel real-time polymerase chain reaction assay, across the proximal pro-moter region of the IL-2 gene. J. Immunol. 167: 4494–4503.
23. Bandyopadhyay, S., M. Dure, M. Paroder, N. Soto-Nieves, I. Puga, andF. Macian. 2007. Interleukin 2 gene transcription is regulated by Ikaros-inducedchanges in histone acetylation in anergic T cells. Blood 109: 2878–2886.
24. Quintana, F. J., H. Jin, E. J. Burns, M. Nadeau, A. Yeste, D. Kumar,M. Rangachari, C. Zhu, S. Xiao, J. Seavitt, et al. 2012. Aiolos promotes TH17differentiation by directly silencing Il2 expression. Nat. Immunol. 13: 770–777.
25. Martins, G. A., L. Cimmino, J. Liao, E. Magnusdottir, and K. Calame. 2008.Blimp-1 directly represses Il2 and the Il2 activator Fos, attenuating T cell pro-liferation and survival. J. Exp. Med. 205: 1959–1965.
26. Powell, J. D., C. G. Lerner, G. R. Ewoldt, and R. H. Schwartz. 1999. The -180site of the IL-2 promoter is the target of CREB/CREM binding in T cell anergy.J. Immunol. 163: 6631–6639.
27. Hedrich, C. M., T. Rauen, and G. C. Tsokos. 2011. cAMP-responsive elementmodulator (CREM)a protein signaling mediates epigenetic remodeling of thehuman interleukin-2 gene: implications in systemic lupus erythematosus. J. Biol.Chem. 286: 43429–43436.
28. Brooks, D. G., L. Teyton, M. B. Oldstone, and D. B. McGavern. 2005. Intrinsicfunctional dysregulation of CD4 T cells occurs rapidly following persistent viralinfection. J. Virol. 79: 10514–10527.
29. Teijaro, J. R., C. Ng, A. M. Lee, B. M. Sullivan, K. C. Sheehan, M. Welch,R. D. Schreiber, J. C. de la Torre, and M. B. Oldstone. 2013. Persistent LCMV in-fection is controlled by blockade of type I interferon signaling. Science 340: 207–211.
30. Wilson, E. B., D. H. Yamada, H. Elsaesser, J. Herskovitz, J. Deng, G. Cheng,B. J. Aronow, C. L. Karp, and D. G. Brooks. 2013. Blockade of chronic type Iinterferon signaling to control persistent LCMV infection. Science 340: 202–207.
31. Tenbrock, K., and G. C. Tsokos. 2004. Transcriptional regulation of interleukin 2in SLE T cells. Int. Rev. Immunol. 23: 333–345.
32. Solomou, E. E., Y. T. Juang, M. F. Gourley, G. M. Kammer, and G. C. Tsokos.2001. Molecular basis of deficient IL-2 production in T cells from patients withsystemic lupus erythematosus. J. Immunol. 166: 4216–4222.
33. Pascual, V., L. Farkas, and J. Banchereau. 2006. Systemic lupus erythematosus:all roads lead to type I interferons. Curr. Opin. Immunol. 18: 676–682.
The Journal of Immunology 9