ielts 1 full pdf with cover
TRANSCRIPT

8/6/2019 Ielts 1 Full PDF With Cover
http://slidepdf.com/reader/full/ielts-1-full-pdf-with-cover 1/12
PW E nglish.comonline English with Paul Winterbottom (MA Oxford University)
IELTSWriting
CourseWeek 1 Course Material
Use this material together with the webpage for the week.
© 2009 pwenglish.com

8/6/2019 Ielts 1 Full PDF With Cover
http://slidepdf.com/reader/full/ielts-1-full-pdf-with-cover 2/12
IELTS Writing Course
©2009 pwenglish.com Page 1
A: Question and Dictation
Audio 1: look at the question below and then do the dictation from the webpage.
Check your answer very carefully!

8/6/2019 Ielts 1 Full PDF With Cover
http://slidepdf.com/reader/full/ielts-1-full-pdf-with-cover 3/12
IELTS Writing Course
©2009 pwenglish.com Page 2
Model answer
Check your answer carefully. If you have made mistakes–
do it again -until you can do it with no mistakes. This is important. You will NOTICE all the skills required to write well.
The top bar chart shows the number of Japanese tourists travelling abroad between 1985 and
1995, and the bottom line graph shows the percentage of these tourists who visited Australia
during the period from 1985 to 1994.
Overall, the key points to note are that during this period the number of Japanese tourists
travelling abroad increased by more than 200% from just under 5 million to over 15 million, and
the percentage of these who visited Australia rose from 2% to 6%. This means that the number
of Japanese tourists visiting Australia increased dramatically, by more than 600%, between
1985 and 1995.
Looking at the charts in more detail we can see that the number of tourists travelling abroad
rose steadily during this period, and only fell slightly once, between 1990 and 1991.
Australia’s share of Japan’s tourist market also rose steadily, but fell on two occasions, between
1988 and 1989, when it fell sharply from approximately 4.8% to 4.2%, and between 1993 and
1994, when it declined by a small amount, from approximately 6.2% to 6%. It is noteworthy
that these declines did not coincide with the decline in the overall number of tourists, so they
do not appear to be related.
(203 words)

8/6/2019 Ielts 1 Full PDF With Cover
http://slidepdf.com/reader/full/ielts-1-full-pdf-with-cover 4/12
IELTS Writing Course
©2009 pwenglish.com Page 3
B: Organising and planning a question 1 answer
1 Organisation of the answer:
Audio 2: listen to the audio on the webpage and look at the summary below:
IELTS question 1 answer will have 4 or sometimes 5 paragraphs.
A total of more than 150 words.
Organisation of IELTS Question 1 answer by paragraph:
Paragraph 1 Introduction: what do the charts etc show?
Paragraph 2 Overall view / key point (s)
Paragraph 3 Detailed point
Paragraph 4 Detailed point
Paragraph 5 (not always) Summary / conclusion
Quick check 1: organisation of answer
Listen to audio on the webpage – answer in the gaps or stop audio and write answer.
8/6/2019 Ielts 1 Full PDF With Cover
http://slidepdf.com/reader/full/ielts-1-full-pdf-with-cover 5/12
IELTS Writing Course
©2009 pwenglish.com Page 4
C: Finding the main points
Audio 3: listen to the audio on the webpage and look at the charts below:
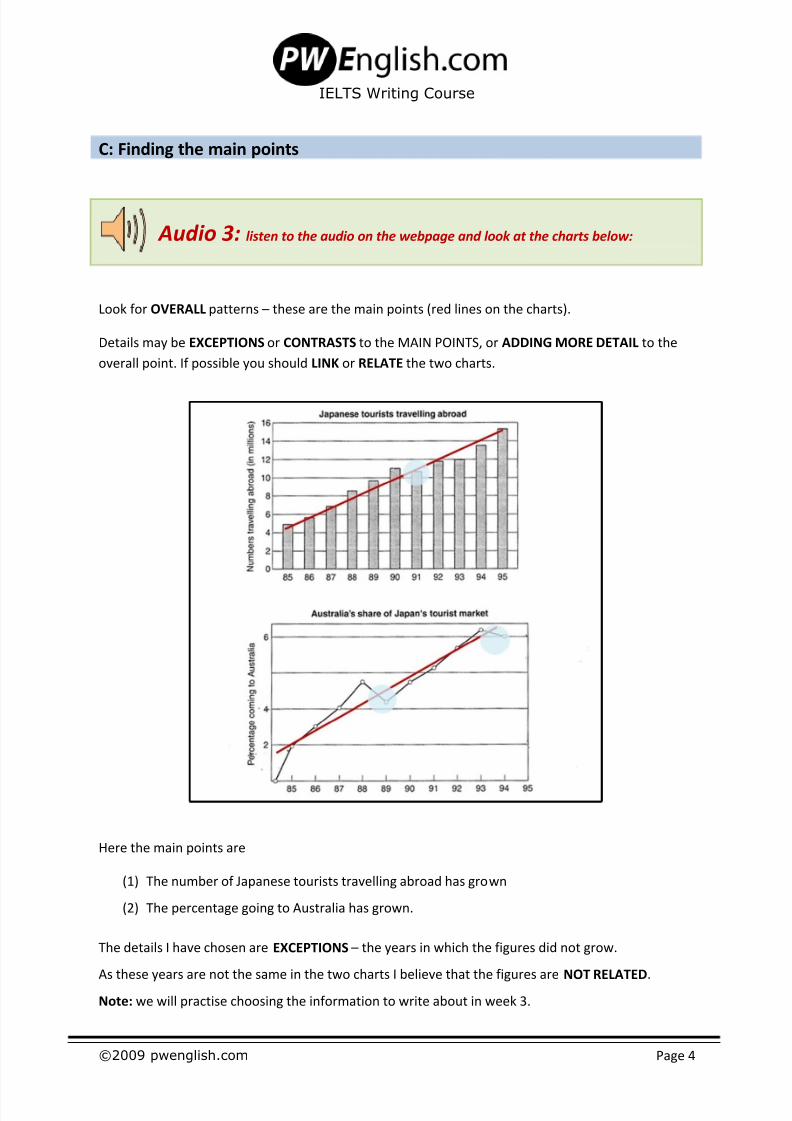
Look for OVERALL patterns – these are the main points (red lines on the charts).
Details may be EXCEPTIONS or CONTRASTS to the MAIN POINTS, or ADDING MORE DETAIL to the
overall point. If possible you should LINK or RELATE the two charts.
Here the main points are
(1) The number of Japanese tourists travelling abroad has grown
(2) The percentage going to Australia has grown.
The details I have chosen are EXCEPTIONS – the years in which the figures did not grow.
As these years are not the same in the two charts I believe that the figures are NOT RELATED.
Note: we will practise choosing the information to write about in week 3.

8/6/2019 Ielts 1 Full PDF With Cover
http://slidepdf.com/reader/full/ielts-1-full-pdf-with-cover 6/12
IELTS Writing Course
©2009 pwenglish.com Page 5
D: Analysis (1): introducing your ideas
Audio 4: listen and look at the phrases in yellow below .
(1) The top bar chart shows the number of Japanese tourists travelling abroad between 1985
and 1995, and the bottom line graph shows the percentage of these tourists who visited
Australia during the period from 1985 to 1994.
(2) Overall, the key points to note are that during this period the number of Japanese tourists
travelling abroad increased by more than 200% from just under 5 million to over 15 million,
and the percentage of these who visited Australia rose from 2% to 6%. This means that the
number of Japanese tourists visiting Australia increased dramatically, by more than 600%,
between 1985 and 1995.
(3) Looking at the charts in more detail we can see that the number of tourists travelling abroad
rose steadily during this period, and only fell slightly once, between 1990 and 1991.
(4) Australia’s share of Japan’s tourist market also rose steadily, but fell on two occasions,
between 1988 and 1989, when it fell sharply from approximately 4.8% to 4.2%, and
between 1993 and 1994, when it declined by a small amount, from approximately 6.2% to
6%. It is noteworthy that these declines did not coincide with the decline in the overall
number of tourists, so they do not appear to be related.

8/6/2019 Ielts 1 Full PDF With Cover
http://slidepdf.com/reader/full/ielts-1-full-pdf-with-cover 7/12
IELTS Writing Course
©2009 pwenglish.com Page 6
Summary of introductory phrases:
Linking phrase: Notes / alternatives:
The top bar chart shows (something)bar chart / pie chart / line graph /
diagram / map / flow chart
The bottom line graph shows (something)
Overall the key points to note are that ( +clause) point is / the most significant points
This means that ( +clause) USEFUL LOGICAL CONNECTOR
Looking at the charts in more detail we can see that (+
clause)chart / PASSIVE: it can be seen that
It is noteworthy that (+clause) draw attention to a detail
NB: “clause” means a phrase containing a VERB and its SUBJECT: always check this in your writing.
Quick check 2: linking phrases
Listen to the audio on the webpage – answer in the gaps – or stop the audio and write.

8/6/2019 Ielts 1 Full PDF With Cover
http://slidepdf.com/reader/full/ielts-1-full-pdf-with-cover 8/12
IELTS Writing Course
©2009 pwenglish.com Page 7
E: Analysis (2): using dates and numbers
Audio 5: listen to the audio on the webpage and look at the phrases in blue and and
green.
(1) The top bar chart shows the number of Japanese tourists travelling abroad between 1985
and 1995, and the bottom line graph shows the percentage of these tourists who visited
Australia during the period from 1985 to 1994.
(2) Overall, the key points to note are that during this period the number of Japanese tourists
travelling abroad increased by more than 200% from just under 5 million to over 15 million,
and the percentage of these who visited Australia rose from 2% to 6%. This means that the
number of Japanese tourists visiting Australia increased dramatically, by more than 600%,
between 1985 and 1995.
(3) Looking at the charts in more detail we can see that the number of tourists travelling
abroad rose steadily during this period, and only fell slightly once, between 1990 and 1991.
(4) Australia’s share of Japan’s tourist market also rose steadily, but fell on two occasions,
between 1988 and 1989, when it fell sharply from approximately 4.8% to 4.2%, and
between 1993 and 1994, when it declined by a small amount, from approximately 6.2% to
6%. It is noteworthy that these declines did not coincide with the decline in the overall
number of tourists, so they do not appear to be related.
8/6/2019 Ielts 1 Full PDF With Cover
http://slidepdf.com/reader/full/ielts-1-full-pdf-with-cover 9/12
IELTS Writing Course
©2009 pwenglish.com Page 8
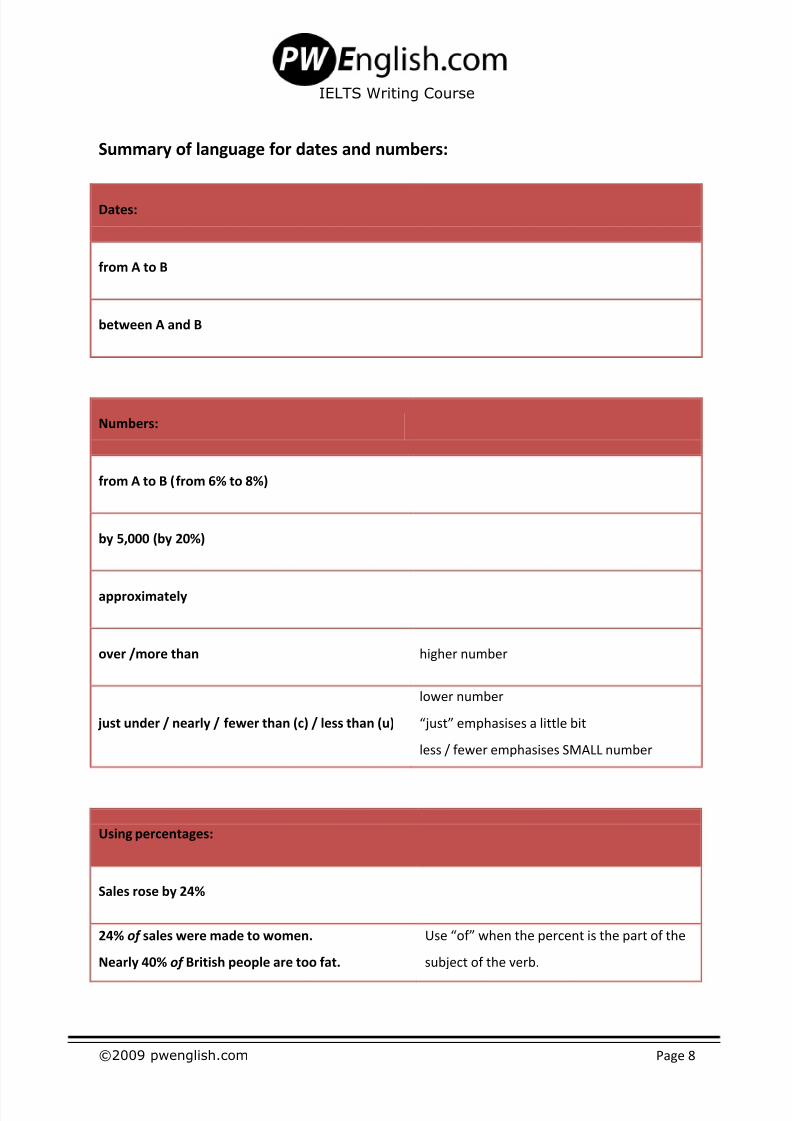
Summary of language for dates and numbers:
Dates:
from A to B
between A and B
Numbers:
from A to B (from 6% to 8%)
by 5,000 (by 20%)
approximately
over /more than higher number
just under / nearly / fewer than (c) / less than (u)
lower number
“just” emphasises a little bit
less / fewer emphasises SMALL number
Using percentages:
Sales rose by 24%
24% of sales were made to women.
Nearly 40% of British people are too fat.
Use “of” when the percent is the part of the
subject of the verb.

8/6/2019 Ielts 1 Full PDF With Cover
http://slidepdf.com/reader/full/ielts-1-full-pdf-with-cover 10/12
IELTS Writing Course
©2009 pwenglish.com Page 9
Quick check 3: dates and times
Listen to the audio on the webpage – answer in the gaps – or stop the audio and write.
F: Language Analysis (3): language of change
Audio 6: listen - look at the words in blue, and the table on the next page.
(1) The top bar chart shows the number of Japanese tourists travelling abroad between
1985 and 1995, and the bottom line graph shows the percentage of these tourists who
visited Australia during the period from 1985 to 1994.
(2) Overall, the key points to note are that during this period the number of Japanese
tourists travelling abroad increased by more than 200% from just under 5 million to
just over 15 million, and the percentage of these who visited Australia rose from 2% to
6%. This means that the number of Japanese tourists visiting Australia increased
dramatically, by more than 600%, between 1985 and 1995.
(3) Looking at the charts in more detail we can see that the number of tourists travelling
abroad rose steadily during this period, and only fell slightly once, between 1990 and
1991.
(4) Australia’s share of Japan’s tourist market also rose steadily, but fell on two occasions,
between 1988 and 1989, when it fell sharply from approximately 4.8% to 4.2%, and
between 1993 and 1994, when it declined by a small amount, from approximately 6.2%
to 6%. It is noteworthy that these declines did not coincide with the decline in the
overall number of tourists, so they do not appear to be related

8/6/2019 Ielts 1 Full PDF With Cover
http://slidepdf.com/reader/full/ielts-1-full-pdf-with-cover 11/12
IELTS Writing Course
©2009 pwenglish.com Page 10
Summary of key language for change
Verb
to increase (rise) increased by 20%
increased from 15% to 18%
dramatically / sharply
slightly
to decline (decrease / fall) declined by 10,000
declined from 11m to 7m
dramatically / sharply
slightly
Noun
an increase (a rise) an increase of 6%
an increase in the number of
tourists of 5 million
dramatic / sharp
slight
a decline (a decrease / a fall) a decline of £20ma decline from 11m to 7m
a decline in the number of
visitors of 2 million.
dramatic / sharpslight
Verb pattern:
The number of visitors declined from 11 million to 7 million.
Noun pattern:
There was a decline in the number of visitors from 11 million to 7 million.
Quick check 4: vocabulary for changes
Listen to the audio on the webpage – answer in the gaps – or stop the audio and write.
Quick check 5: verb to noun sentences for changes
Listen to the audio on the webpage – answer in the gaps – or stop the audio and write.
Quick check 6: noun to verb sentences for changes
Listen to the audio on the webpage – answer in the gaps – or stop the audio and write.

8/6/2019 Ielts 1 Full PDF With Cover
http://slidepdf.com/reader/full/ielts-1-full-pdf-with-cover 12/12
IELTS Writing Course
©2009 pwenglish.com Page 11
G: Text completion
Write one or more words in the gap. The number of lines shows the number of words. Check your
answer carefully with the text on page 1.
The top ________ chart shows the number of Japanese tourists ________ ________ between 1985
and 1995, and the bottom ________ graph shows the percentage of these tourists who visited
Australia during the ________ from 1985 to 1994.
________, the key ________ ________ ________ are that during this period the number of
Japanese tourists travelling abroad ________ ________ more than 200% from ________ under 5
million to ________ 15 million, and the percentage of these who visited Australia rose ________ 2%
________ 6%. This means that the number of Japanese tourists visiting Australia increased
________, by ________ than 600%, ________ 1985 and 1995.
________ at the charts in more ________ we can see that the number of tourists travelling abroad
________ steadily during this period, and only ________ slightly once, between 1990 and 1991.
Australia’s share of Japan’s tourist market also rose steadily, but fell on two ________, between
1988 and 1989, when it fell s________ from __________ 4.8% to 4.2%, and ________ 1993 and
1994, when it ________ by a small amount, from approximately 6.2% to 6%. ________ ________
noteworthy that these declines did not coincide ________ the decline ________ the overall number
of tourists, so they do ________ appear ________ ________ related.