ieej: march 2011 iraqi oil potential and middle east ...eneken.ieej.or.jp/data/3749.pdf · iraqi...
TRANSCRIPT

Iraqi Oil Potential and Middle East Turmoil: Implications for Oil Markets and OPEC
Amy Myers JaffeWallace S. Wilson Fellow for Energy
StudiesJames A. Baker III
Institute for Public Policy,Rice University
February 28, 2011
IEEJ Oil Seminar, Tokyo
IEEJ: March 2011

IEA 2010 Base Case Reference Scenario: Increase in World Oil Supply, 2009‐2030
• The IEA forecast does not include a full assessment of the potential of shale oil resources in the United States and elsewhere.
IEEJ: March 2011

Iraqi Oil Potential is high
Iraq potential by 2017: High estimate is 7.2 million b/d but historical range more like 3.6 million b/d
0.00
1.00
2.00
3.00
4.00
5.00
6.00
2010E 2011E 2012E 2013E 2014E 2015E 2016E 2017E
MBD
TSA's Kurdistan INOC
Source for all charts: Credit Suisse
IEEJ: March 2011

Infrastructure development, not oil field potential, will likely be the
constraining factor in Iraq
• Despite optimistic news reports, foreign oil companies still at early stage of mobilization
• Political decentralization inside Iraq still a barrier to rapid implementation of project development, especially infrastructuredevelopment; permitting process and other approvals cumbersome at variety of local and regional levels
• Oil investment policy compromises with the Kurds making progressbut still not resolved
• Power sharing means that all federal decision making is extremely slow
• Citizens frustrated by lack of progress on the ground regarding basic services, leading to social protests and demonstrations
IEEJ: March 2011
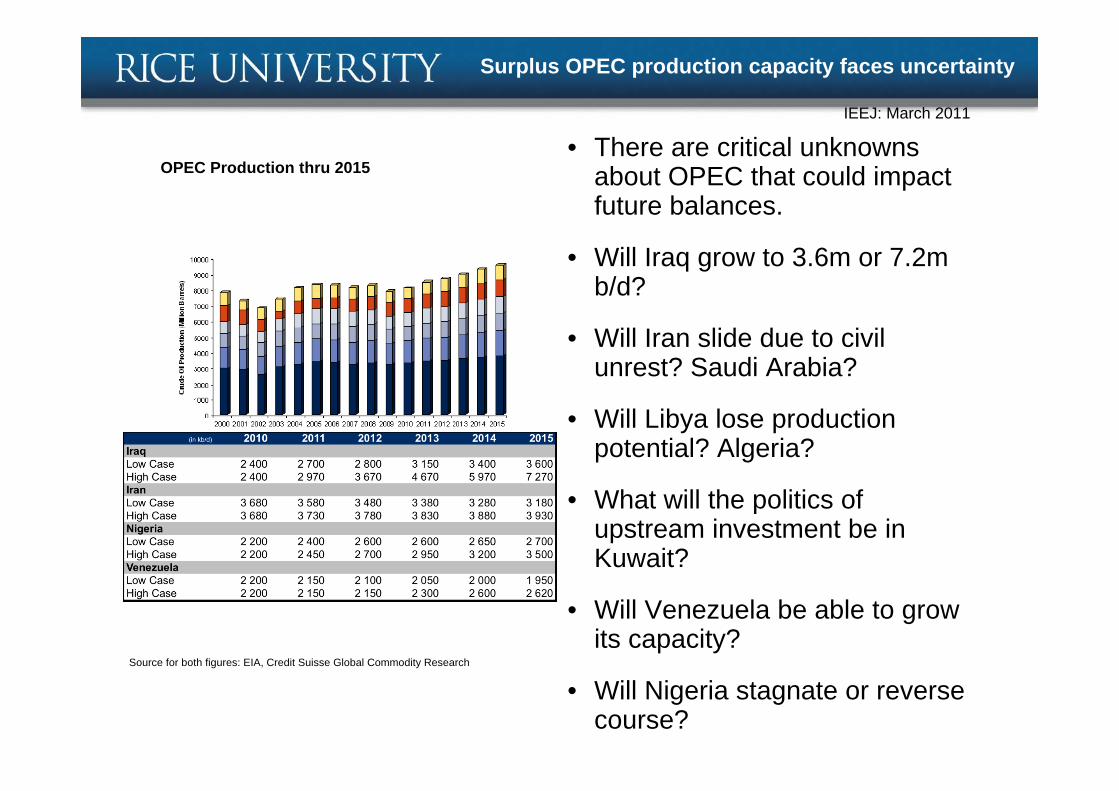
Surplus OPEC production capacity faces uncertainty
• There are critical unknowns about OPEC that could impact future balances.
• Will Iraq grow to 3.6m or 7.2m b/d?
• Will Iran slide due to civil unrest? Saudi Arabia?
• Will Libya lose production potential? Algeria?
• What will the politics of upstream investment be in Kuwait?
• Will Venezuela be able to grow its capacity?
• Will Nigeria stagnate or reverse course?
OPEC Production thru 2015
Source for both figures: EIA, Credit Suisse Global Commodity Research
IEEJ: March 2011
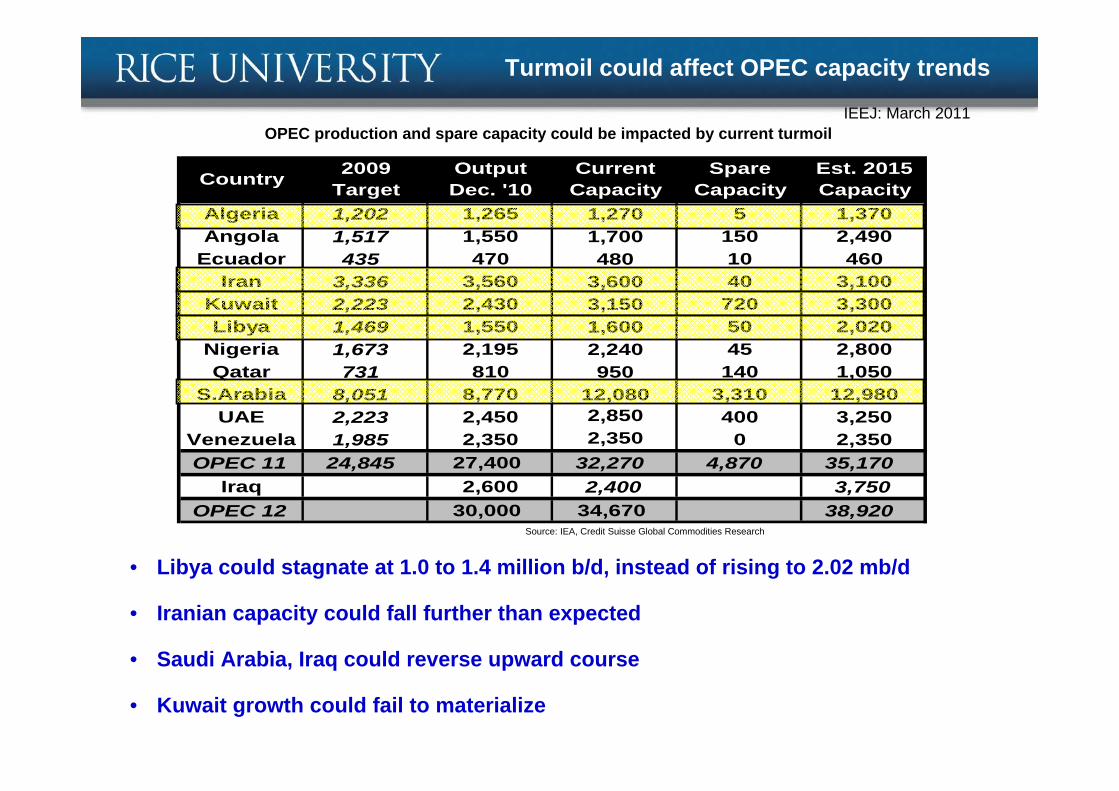
Turmoil could affect OPEC capacity trends
• Libya could stagnate at 1.0 to 1.4 million b/d, instead of rising to 2.02 mb/d
• Iranian capacity could fall further than expected
• Saudi Arabia, Iraq could reverse upward course
• Kuwait growth could fail to materialize
OPEC production and spare capacity could be impacted by current turmoil
Source: IEA, Credit Suisse Global Commodities Research
Algeria 1,202 1,265 1,270 5 1,370 Angola 1,517 1,550 1,700 150 2,490
Ecuador 435 470 480 10 460 Iran 3,336 3,560 3,600 40 3,100
Kuwait 2,223 2,430 3,150 720 3,300 Libya 1,469 1,550 1,600 50 2,020
Nigeria 1,673 2,195 2,240 45 2,800 Qatar 731 810 950 140 1,050
S.Arabia 8,051 8,770 12,080 3,310 12,980 UAE 2,223 2,450 2,850 400 3,250
Venezuela 1,985 2,350 2,350 0 2,350 OPEC 11 24,845 27,400 32,270 4,870 35,170
Iraq 2,600 2,400 3,750 OPEC 12 30,000 34,670 38,920
Output Dec. '10
Current Capacity
Spare Capacity
Est. 2015 CapacityCountry 2009
Target
IEEJ: March 2011

From Tunisia to Egypt and beyond, Tail Risk Issues are Related to Domestic Unrest
Post-Egypt, oil market faces new concerns related to the nature of domestic societies, economies, political leadership and “legitimacy” in key oil producing countries
• Contagion: – In an age of cyber communications, no one is totally “safe”– Many oil producing countries have experienced similar kinds of demonstrations
and social unrest both recently and in the recent past– Saudi Arabia’s leading rulers are old and in failing health
Over 21 million b/d of Middle East liquids production could be at stake• -- Algeria: Median age 27.1 years, 10% unemployment, 2.1-m b/d
– Libya: Median age 24.2 years, 30% unemployment, 1.5-m b/d – Syria: Median age 21.5 years, 8% unemployment, 0.4-m b/d – Yemen: Median age 17.9 years, 35% unemployment, 0.4-m b/d– KSA: Median age 24.9 years, 11% unemployment, 9.5-m b/d – Iran: Median Age 26.3 years, 15% unemployment, 4.5-m b/d– Iraq: Median Age 20.6 years, 15% unemployment, 2.8-m b/d
Mideast turmoil driving oil prices now, especially long oil price
IEEJ: March 2011

Contagion fears are not unfounded: Protests not limited to countries in the headlines
• Confrontation between Shi’ite pilgrims to Medina in Medina led to major protests in the city of Qatif in Saudi Arabia’s Eastern Province in 2009; coincided with Shi’ite disappointment that no Shi’ite was appointed to the King’s cabinet or as representative in the council of senior religious scholars; small protest in late February, prisoner release
• Kuwait Prime Minister Sheikh Nasser al-Mohammed al-Sabah, the Emir’s nephew, faced impeachment hearings in late 2010 following the Kuwaiti government’s use of force to break up a protest organized by academics and parliamentarians to protest alleged constitutional violations by the Kuwaiti government
• Ongoing Algerian protests linked to hike in food prices, unemployment, housing shortages and corruption scandals, the latter of which are seen as manifestations of struggle for power in the FLN and also between Boutefliqaand other factions of the Algerian military; long-standing oil minister Khelilwas a casualty of ongoing struggle inside the government
• Iranian government, remembering the role of the oil industry in the fall of the Shah, have put more members of the Iranian Revolutionary Guard Corps into the oil sector
IEEJ: March 2011

Mideast turmoil is impacting financial flows, shifting them from US to London
Source: the BLOOMBERG PROFESSIONAL™ service, Credit Suisse Global Commodities Research Source: the BLOOMBERG PROFESSIONAL™ service, Credit Suisse Global Commodities Research
Brent Forward CurvesWTI Forward Curves
Libyan oil went mainly to Europe
Mideast turmoil –from possible Suez disruption to threat to Algerian exports–would impact Europe first.
Threat of possible future position limit regulations in US makes Brent futures a more attractive market to put on long oil positions now. Open interest in forward Brent contracts on the rise.
US West Texas Intermediate market experiencing local distortions due to Pad-2 surplus and pipeline bottleneck, making WTI a less useful marker for international prices trends. Contagion premium is playing out in Brent market.
86
88
90
92
94
96
98
100
102
104
Mar
-11
Sep
-11
Mar
-12
Sep
-12
Mar
-13
Sep
-13
Mar
-14
Sep
-14
Mar
-15
Sep
-15
Mar
-16
Sep
-16
Mar
-17
Sep
-17
Mar
-18
Sep
-18
Mar
-19
Sep
-19
1/24/2011 1/31/2011 2/4/2011
96
97
98
99
100
101
102
103
104
105
Mar
-11
Sep
-11
Mar
-12
Sep
-12
Mar
-13
Sep
-13
Mar
-14
Sep
-14
Mar
-15
Sep
-15
Mar
-16
Sep
-16
Mar
-17
Sep
-17
Mar
-18
Sep
-18
Mar
-19
Sep
-19
1/24/2011 1/31/2011 2/4/2011
IEEJ: March 2011

Cautionary Factors: $147 harder to reach now than in 2008, barring major oil disruption event
• OPEC spare capacity is much higher• Larger availability of drilling rigs• Governments more focused on energy efficiency and
security policy, INCLUDING CHINA• Financial players dealing in oil but with far less leverage
than 2007-2008 • China not hoarding ahead of Olympics• New natural gas (shale) and oil (shale and pre-salt) plays
are becoming known to the market as growing recoverable reserve opportunities
• Majors have increased E& P spending• Substitution among fuels, especially in transport sector, is
growing
IEEJ: March 2011

Still, long term factors point to sustained high oil prices
• Turmoil in Middle East likely to be sustained and may disrupt investment spending
• US Offshore regulatory uncertainty is taking a bite• NOCs control an increasing share of investment spending
and continue to exhibit inefficiency• Bureaucratic and other geopolitical barriers blocking
adequate investment in conventional resources in major countries such as Mexico, Iran, Russia, Kuwait, and Nigeria
• Saudi succession issues will remain a challenge to the kingdom’s decision-making process
IEEJ: March 2011

When it comes to supply, the price shock has also been impactful – If you drill enough holes….
Non-OPEC Supply Surge has been rising since 2008
4445464748495051525354
Jan-
02Ju
n-02
Nov
-02
Apr-0
3S
ep-0
3Fe
b-04
Jul-0
4D
ec-0
4M
ay-0
5O
ct-0
5M
ar-0
6Au
g-06
Jan-
07Ju
n-07
Nov
-07
Apr
-08
Sep-
08Fe
b-09
Jul-0
9D
ec-0
9M
ay-1
0
MM
BD
IEEJ: March 2011

The Macondo blowout could have significant impact on GOM production
<1,000’ WD1,000’ – 5,000’ WD
>5,000’ WD
<1,000’ WDMiocene /
Plio-Pleistocene
LowerTertiary
Base forecastProduction down 10%
Production down 15%
Source: PFC Energy Modeling
IEEJ: March 2011

GOM Spending Is Small Part of a Global Industry
Projected spending could turn out to be larger if oil prices remain high and Middle East sources and investment are disrupted. Source: PFC Energy Upstream Spending Model
GOM28212%
Other N.America
271%
L.America353 15%
Europe264 12%
Africa411 18%
F.S.U.204 9%
M.East179 8%
Asia.Pac564 25%
Offshore CAPEX Forecast 2011-2020$2,284 billion
IEEJ: March 2011

Robust supply normally follows high prices
OPEC Spare Capacity Previously Expected to Slip Significant New Offshore Projects Post 2014
Iraq – Lots of Potential Russia – Productivity Improvements
0.00
1.00
2.00
3.00
4.00
5.00
6.00
2010E 2011E 2012E 2013E 2014E 2015E 2016E 2017E
MBD
TSA's Kurdistan INOC
6.0
7.0
8.0
9.0
10.0
11.0
12.0
2004
2005
2006
2007
2008
2009
2010
E
2011
E
2012
E
2013
E
2014
E
2015
E
2016
E
2017
E
Russia Potential Risked No Tax Reform?
(MMBD)
-1.02.03.04.05.06.07.08.0
2003
2005
2007
2009
2011
E
2013
E
2015
E
Spare Cap CS Base Case
(M MB D)
0
2, 00 0
4, 00 0
6, 00 0
8, 00 0
1 0, 00 0
1 2, 00 0
1 4, 00 0
1 6, 00 0
2 ,00 9 20 10 E 20 11 E 20 12 E 20 13 E 20 14 E 20 15 E 20 16 E 20 17 E
U S Gu lf of Me xico Brazil Oth er no n-OPE C off sh ore OPEC O ffsho re
Source for all charts: Credit Suisse
IEEJ: March 2011

Brazil – Not just the Presalt
Players in Brazil have Ambitious Longer Term Goals
Project delays, like in GoM, may slow production
Source for all charts: Credit Suisse
IEEJ: March 2011

Large Potential for Unconventional Oil
– Investment focus likely to shift to unconventional oil if pricesremain high.
Much Unconventional Oil Outside Middle East
CountryTotal Technically Recoverable Unconventional Oil (billion
bbl)
USA 801.7
Canada 500.0
Other South America 525.9
Russia 160.3
Caspian 124.3
World 2129.5
Source: World Energy Council
IEEJ: March 2011

Large Potential for Unconventional Oil
Shale oil will be important in the long run: Might be hastened and expanded if current trends prevail.
Base Case Baker Institute Forecast U.S. Oil Shale Production
YearUnconventional Production (million
b/d) Total Production (million b/d)Percent of Total
Production
2035 0.01 3.6 0.2%
2040 1.2 4.6 26.1
2045 3.8 7.3 52.1
2050 7.3 10.9 67.0
Note: Production from oil shale primarily comes online around 2035 (according to the model). The figures in the table do not include shale oil from the Bakken formation, for example, which approach about 900 thousand bbl/d then slowly decline after 2020.Source: Hartley and Medlock, Rice World Energy Model, 2010
IEEJ: March 2011

Change of Long Term Perceptions Only Began in 2006 as Terror Premium Emerged
– Long Price of WTI largely traded in the $20 range throughout the1990s; Then in In 2006, new upward trend emerges.
$61.97$40.16$26.65$23.00$21.09$22.25$18.64$16.45$18.91$18.91$17.49$18.67$0.00
$10.00
$20.00
$30.00
$40.00
$50.00
$60.00
$70.00
Jan-
95
Jan-
96
Jan-
97
Jan-
98
Jan-
99
Jan-
00
Jan-
01
Jan-
02
Jan-
03
Jan-
04
Jan-
05
Jan-
06
Jan-
07
Jan-
08
WTI
Cus
hing
Spo
t Pric
e, $
/bbl
nom
inal
IEEJ: March 2011

The changing oil price landscape
The Long Oil Price Didn’t Move Until 2006
$90.50$91.00$91.50$92.00$92.50$93.00$93.50$94.00$94.50$95.00$95.50
Jan‐15
Aug‐15
Mar‐16
Oct‐16
May‐17
Dec‐17
Jul‐18
Feb‐19
Sep‐19
Forward OilPrice
Current Long Oil Price
$15
$35
$55
$75
Jan-
01M
ay-0
1Se
p-01
Jan-
02M
ay-0
2Se
p-02
Jan-
03M
ay-0
3Se
p-03
Jan-
04M
ay-0
4Se
p-04
Jan-
05M
ay-0
5Se
p-05
Jan-
06M
ay-0
6Se
p-06
Jan-
07M
ay-0
7Se
p-07
Jan-
08M
ay-0
8Se
p-08
12/1/2006 2005 2004 2003 2002 2001 2000
Why did the long oil price move upwards?– Pessimism about NOC investment in new capacity– Access restrictions for/lack of spending by IOCs– Terror Premium created permanent change in attitudes about price floors– F&D cost inflation– China demand “story”
In late 2010-early 2011, pre-Egypt, long oil price was already rising:
IEEJ: March 2011
Contact: [email protected]