ieee transactions on software engineering,...
TRANSCRIPT
The Class Blueprint: Visually Supportingthe Understanding of Classes
Stephane Ducasse and Michele Lanza, Member, IEEE
Abstract—Understanding source code is an important task in the maintenance of software systems. Legacy systems are not only
limited to procedural languages, but are also written in object-oriented languages. In such a context, understanding classes is a key
activity as they are the cornerstone of the object-oriented paradigm and the primary abstraction from which applications are built. Such
an understanding is however difficult to obtain because of reasons such as the presence of late binding and inheritance. A first level of
class understanding consists of the understanding of its overall structure, the control flow among its methods, and the accesses on its
attributes. We propose a novel visualization of classes called class blueprint that is based on a semantically enriched visualization of
the internal structure of classes. This visualization allows a software engineer to build a first mental model of a class that he validates
via opportunistic code-reading. Furthermore, we have identified visual patterns that represent recurrent situations and as such convey
additional information to the viewer. The contributions of this article are the class blueprint, a novel visualization of the internal structure
of classes, the identification of visual patterns, and the definition of a vocabulary based on these visual patterns. We have performed
several case studies of which one is presented in depth, and validated the usefulness of the approach in a controlled experiment.
Index Terms—Object-oriented programming, software visualization, reverse engineering, visual patterns, smalltalk.
�
1 INTRODUCTION
IT has been measured that, in the maintenance phase,software professionals spend at least half of their time
analyzing software to understand it [1] and that codereading is a viable verification and testing strategy [2], [3].Sommerville [4] and Davis [5] estimate that the main-tenance of a software system accounts for 50 to 75 percent ofits overall cost. These findings show that understandingsource code is an important task in the maintenance ofsoftware systems.
Legacy systems are not only limited to procedural
languages, but are also written in object-oriented languages.
Contrary to what one may think, the object-oriented
programming paradigm has exacerbated this problem,
since in object-oriented systems the domain model of the
application is distributed across the whole system and the
behavior is distributed accross inheritance hierarchies with
late-binding [6], [7], [8].Reading object-oriented code is more difficult than
reading procedural code [9]: In addition to the difficulties
introduced by the technical aspects of object-oriented
languages such as inheritance and polymorphism [6], the
reading order of a class’ source code is not relevant as it was
in most of the procedural languages where the order of the
procedures was important and the use of forward declara-
tions required. This lack of reading order is emphasized in
languages such as Smalltalk, a language based upon apowerful integrated development environment (IDE) inwhich the concept of source files is used only for externalcode storage, but seldom for code editing. Moreover, evenfor file-based languages like Java, IDEs such as Eclipse1 areliterally eclipsing the importance of source files and puttingforward a code browsing practice as in Smalltalk.
Understanding classes is of key importance as they arethe cornerstone of the object-oriented paradigm and theprimary abstraction from which applications are built.Therefore, there is a definitive need to support theunderstanding of classes and their internal structure. Inthe past, work has been done to support the under-standing of object-oriented applications [10], [11], [12].Some other work focused on analyzing the impact ofgraphical notation to support program understandingbased on control-flow [3]. Such approaches are powerfulfor supporting the identification of design patterns, buttoo generic and not fine-grained enough for the specificpurpose of class understanding.
In this article, we present an approach to ease theunderstanding of classes by visualizing a semanticallyaugmented call and access-graph of the methods andattributes of classes. Our approach only takes into accountthe internal static structure of a class and focuses on the waymethods call each other and access attributes, and the waythe classes use inheritance, i.e., we leave out the runtimebehavior of a system.
We have coined the term class blueprint, a visualization ofa semantically augmented call-graph and its specificsemantics-based layout. The objective of our visualizationis to help a programmer to develop a mental model of theclasses he browses and to offer support for reconstructingthe logical flow of method calls. Our approach targets the
IEEE TRANSACTIONS ON SOFTWARE ENGINEERING, VOL. 31, NO. 1, JANUARY 2005 1
. S. Ducasse is with the Software Composition Group, Institute of AppliedMathematics and Computer Science, University of Bern, Neunrueckstrasse10, 3012 Bern, Switzerland. E-mail: [email protected].
. M. Lanza is with the Faculty of Informatics, University of Lugano, Via G.Buffi 13, 6900 Lugano, Switzerland. E-mail: [email protected].
Manuscript received 1 June 2004; revised 8 Oct. 2004; accepted 22 Dec. 2004;published online 20 Jan. 2005.Recommended for acceptance by J. Knight.For information on obtaining reprints of this article, please send e-mail to:[email protected], and reference IEEECS Log Number TSE-0103-0604. 1. See http://www.eclipse.org/ for more information.
0098-5589/05/$20.00 � 2005 IEEE Published by the IEEE Computer Society

understanding of a class in terms of its call-graph andinternal structure. Our approach does not magicallyprovide a detailed understanding of a class’ functionality,which can however be obtained by reading the pertinentsource code as needed, i.e., our tool points the user to thecorresponding source code that needs to be read. Besidesthe presentation of the technical aspects that the classblueprint implies, we establish a vocabulary that wedeveloped based on the insights we obtained during severalcase studies. This vocabulary identifies the most commonand specific visual patterns, i.e., recurrent graphical situa-tions we encountered during the validation of this work.We believe that this vocabulary can be the basis of alanguage (in a similar vein to the use of design patterns)that software engineers can use when communicating witheach other. The results presented in this article are languageindependent as we base our work on FAMIX [13], alanguage independent metamodel for object-orientedsource code representation. Most of our experiences havebeen conducted on applications developed in Smalltalk,although we applied our approach on case studies writtenin C++ and Java as well.
The contributions of this article2 are the following: thedefinition of the class blueprint, a semantically augmentedvisualization of the internal structure of classes, theidentification of visual patterns that represent recurringsituations, and the definition of a vocabulary based on thesevisual patterns.
2 THE CHALLENGE OF SUPPORTING CLASS
UNDERSTANDING
As our overall objective is to help software engineers tobuild a mental image of a class, we restrict ourselves tomethods, method invocations, attributes, and attributeaccesses. According to the program cognition modelvocabulary proposed by Littman et al. [15], we support anapproach of understanding that is opportunistic in the sensethat it is not based on a systematic line-by-line understandingbut as needed, i.e., the viewer chooses what he wants to lookat. Moreover, to locate our approch in the general context ofcognitive models [15], [16], our approach is intended tosupport the implementation plans at the language level, i.e.,working at code chunks, here, classes and methods.
Mayrhauser and Vans mention that the cognitionprocesses work at all levels of abstraction simultaneouslyas programmers build a mental model of the code [16]. Ourapproach is based on the visual identification of hotspots atthe class level or hierarchy level which then are verifiedwith opportunistic code reading. In this sense, our claim isnot that graphical visualization is better than text readingeven if we believe that our approach eases the process [17].Our approach creates a synergistic context between the twoin which the class blueprint view reveals the way classes arebuilt, and helps to raise hypotheses or questions that arethen verified by reading some piece of code.
2.1 Class Understanding
Classes are difficult to understand because of the followingreasons:
1. Contrary to procedural languages, the methoddefinition order in a file is not important [9]. Thereis no simple and apparent top-down call decom-position. This problem is emphasized in the contextof integrated development environments (IDE),which disconnect the method definitions from theirphysical storage medium.
2. Classes are organized in inheritance hierarchies inwhich at each level behavior can be added, over-ridden, or extended. Understanding how a subclassfits within the context of its parent is complexbecause late-binding provides a powerful instru-ment to build template and hook methods that allowchildren behavior to be called in the context of theirancestors. The presence of late-binding leads to“yoyo effects” when one is trying to follow the call-flow [6], [8].
In our approach, we display methods, attributes, methodinvocations, and attribute accesses. We only consider thecall-flow and not the control-flow of the methods. Further-more, since classes do not stand alone, but exist withininheritance hierarchies, our approach supports the under-standing of a class within an inheritance tree. Working at acall-flow level also supports the late-binding property ofobject-oriented programming in which a subclass can definemethods that are called by superclass methods in replace-ment of their own methods.
For the visualization itself, the solution we propose takesinto account the physical limits of a screen, i.e., a classblueprint must fit in one or exceptionally two screens ofnormal size. Bertin [18] assessed that one of the goodpractices in information visualization is to offer the viewervisualizations that can be grasped at one glance (e.g.,without the need for scrolling or moving around). Further-more, the colors used in our visualizations also followvisual guidelines suggested by Bertin [18], Tufte [19], andWare [20], e.g., we take into account that the human brain iscapable of processing less than a dozen distinct colors.
The work presented in this article emerged fromindustrial code reverse engineering projects and is theresult of several refinements to maximize the ease ofunderstanding. In addition to the industrial case studieson which we are not allowed to report, we performed casestudies on open-source software: 1) Squeak, an open sourcemultimedia Smalltalk which has been developed over thelast years (1,800 classes) [21], 2) Duploc, a code duplicationdetection tool (160 classes), and 3) Moose, our ownreengineering environment (200 classes).
In this paper, we use as a case study the Jun framework:Jun is a freely available 3D graphic multimedia library thatsupports topology and geometry. We analyzed version 398,which consists of more than 700 classes, 15,000 methods,and 2,000 attributes. The interesting aspect of Jun is itsvariety: It models a wide spectrum of domains includingdifferent format readers and writers, different compositestructures (HTML, VRML), various complex rendering
2 IEEE TRANSACTIONS ON SOFTWARE ENGINEERING, VOL. 31, NO. 1, JANUARY 2005
2. An early version of this work has been published in the ACMOOPSLA 2001 Proceedings [14]; in the present work, we refined ourapproach, validated it with new case studies, and completely revised thepattern language.

algorithms, even a Prolog interpreter, and a Lisp compiler
and interpreter. Jun is a mature and professionally devel-
oped system.3
3 THE CLASS BLUEPRINT
A class blueprint is a semantically augmented visualization
of the internal structure of a class, displaying an enriched
call-graph with a semantics-based layout. It is augmented in
various aspects:
. A class blueprint is structured according to layersthat group the methods and attributes.
. The nodes representing a class’ methods andattributes are colored according to semantic infor-mation, e.g., whether a method is abstract, over-riding other methods, returning constant values, etc.
. The nodes vary in size depending on source codemetrics information.
3.1 The Layered Structure of a Class Blueprint
A class blueprint decomposes a class into layers and assigns
its attributes and methods to each layer based on the
heuristics described below. The following rules are system-
atically applied to produce the Class Blueprint visualiza-
tion. In Fig. 1a, we see an empty template of a class
blueprint.
The layers support a call-graph notion in the sense that a
method node on the left connected with another node on
the right is either invoking or accessing the node on the
right that represents a method or an attribute. From left to
right we identify the following layers: initialization layer,
external interface layer, internal implementation layer, accessor
layer, and attribute layer. The first three layers and the
methods contained therein are placed from left to right
according to the method invocation sequence, i.e., if method
m1 invokes method m2, m2 is placed to the right of m1 and
connected with an edge.
For each layer we present the conditions that methods
must fulfill in order to belong to a certain layer. The layers
have been chosen according to a notion of time-flow and a
notion of encapsulation. The time-flow is the execution of
the methods, which visually is expressed in a layering from
left to right, i.e., the external, public, part of the class is
displayed on the left, while the internal (later executed) part
is displayed on the right. Note that this choice is supported
by the reading order of western cultures which goes from
left to right. The notion of encapsulation is visualized by
separating state (to the right) from behavior (to the left), and
distinguishing the public (to the left) from the private part
(to the right) of the class’ behavior. Added to this only the
actual source code elements are visualized, i.e., we do not
represent artificial elements resulting from a combination/
abstraction of source code elements.
DUCASSE AND LANZA: THE CLASS BLUEPRINT: VISUALLY SUPPORTING THE UNDERSTANDING OF CLASSES 3
3. See http://www.srainc.com/Jun/ for more information.
Fig. 1. (a) A class blueprint decomposes a class into layers. (b) A graphical representation of methods and attributes using metrics: The metrics are
mapped on the width and the height of a node. (c) The methods and attributes are positioned according to the layer they have been assigned to.
(d) The caller has outgoing edges at the bottom, while the callee has ingoing edges at the top.

A class blueprint contains the following layers:
1. Initialization Layer. The methods contained in thisfirst layer are responsible for creating an object andinitializing the values of the attributes of the object.A method belongs to this layer if one of thefollowing conditions holds:
. The method name contains the substring “in-itialize” or “init.”
. The method is a constructor.
. For Smalltalk code, where methods can beclustered in method protocols, if the methodsare placed within protocols whose name con-tains the substring “initialize.”
In this layer, there should also be the static
initializers for Java, however, we do not take them
into account, as they are not covered by our FAMIX
metamodel [13].2. External Interface Layer. The methods contained in
this layer represent the interface of a class to theoutside world. A method belongs to this layer if onethe following conditions holds:
. It is invoked by methods of the initializationlayer.
. In languages like Java and C++ which supportmodifiers (e.g., public, protected, private), it isdeclared as public or protected.
. It is not invoked by other methods within thesame class, e.g., it is a method invoked fromoutside of the class by methods of collaboratorclasses or subclasses. Should the method beinvoked both inside and outside the class, it isplaced within the implementation layer.
We do not include accessor methods to this layer,
but to a dedicated layer as we show later on. We
consider the methods of this layer to be the entry
points to the functionality provided by the class.3. Internal Implementation Layer. The methods con-
tained in this layer represent the core of a class andare not supposed to be visible to the outside world.A method belongs to this layer if one of thefollowing conditions holds:
. In languages like Java and C++ if it is declaredas private.
. The method is invoked by at least one methoddefined in the same class.
4. Accessor Layer. This layer is composed of accessormethods, i.e., methods whose sole task is to get andset the values of attributes.
5. Attribute Layer. The attribute layer contains allattributes of the class. The attributes are connected tothe methods in the other layers by means of accessrelationships.
3.2 Representing Methods and Attributes
We represent methods and attributes using colored boxes
(nodes) of various size and position them within the layers
presented previously. We map metrics information on the
size of the method and attribute nodes and map semanticinformation on their colors.
Mapping metrics information on size. The width andheight of the nodes reflect metric measurements of therepresented entities, as illustrated in Fig. 1b. This approachhas been developed in the context of our previous researchon polymetric views [22].
Method nodes. In the context of a class blueprint, themetrics used for the method nodes are lines of code for theheight and the number of invocations for the width.
Attribute nodes. The metrics used for the attribute nodesare the number of direct accesses from methods within theclass for the width and the number of direct accesses fromoutside of the class for the height. The choice of thesemeasures allows one to identify how attributes are accessed.
Representing the call direction. In Fig. 1d, we see howwe distinguish a caller from a callee: The caller has outgoingedges at the bottom, while the callee has ingoing edges atthe top. Furthermore, the blueprint layout algorithm placesthe callee to the right of a caller.
Mapping semantic information on color. The call-graphis augmented not only by the size of its nodes but also bytheir color. In a class blueprint, the colors of nodes andedges represent semantic information extracted from thesource code analysis. The colors play therefore an importantrole in conveying added information, as Bertin [18] andTufte [19] have extensively discussed. Table 1 presents thesemantic information we add to a class blueprint and theassociated colors.
Certain semantic information such as whether a methodis delegating to another object is computed by analyzing themethod abstract syntax tree (AST) and by identifyingcertain patterns based on exact matches. For example, wequalify as delegating, a method invoking exactly the samemethod on an attribute (pattern 2) or a method invocation(pattern 1). In addition to those patterns, we consider alsothe case when the method is returning a value using ^ inSmalltalk (patterns 3 and 4). Note that such an analysis islanguage dependent but does not pose any problem inpractice.
Pattern 1: delegating to invocation result.
methodX
self yyy methodX
Pattern 2: delegating to an attribute.
methodX
instVarY methodX
Pattern 3: delegating to an attribute with return.
methodX
^ self yyy methodX
Pattern 4: delegating to invocation result with return.
methodX
^ instVarY methodX
Pattern 5: Abstract method.
methodX
self subclassResponsibility
4 IEEE TRANSACTIONS ON SOFTWARE ENGINEERING, VOL. 31, NO. 1, JANUARY 2005

The fact that a method is abstract is also extracted fromthe analysis of the method AST as in Smalltalk the only wayto specify that a method is abstract is to invoke the methodsubclassResponsibility (see Pattern 5). For Java and C++,specific explicit language constructs make the analysissimpler.
Note that the color associations shown in Table 1 are notmutually exclusive. Therefore, a node could have more thanone color assigned to it. In such a case, the color determinedby the source code analysis takes precedence over the colorgiven by the layer a certain node belongs to, as thisinformation conveys usually more semantics.
3.3 The Layout Algorithm of a Class Blueprint
The algorithm used to layout the nodes in a class blueprint
first assigns the nodes to their layers and then sequentially
lays out the layers. Within each of the first three layers,
nodes are placed using a horizontal tree layout algorithm: If
method m1 invokes method m2, m2 is placed to the right of
m1 and both are connected by an edge which represents the
invocation relationship. In case a method m1 accesses an
attribute a1, the edge connecting m1 and a1 represents an
access relationship, as is denoted by the color of the edge. In
the last two layers, the nodes are placed using a vertical line
layout, i.e., the nodes are placed vertically below each other.
Although the layout algorithm can be considered simple, it
shows acceptable results in terms of visual quality and is
further supported by the fact that the user can interact with
the visualization in case he wants to focus on a certain part
of it. The complex structure of a method invocation graph
allows for cycles because of recursive calls; therefore, the
tree layout algorithm used as part of the overall blueprint
layout is not only cycle-resistant, but even able to display
the cycles as shown in Fig. 1d.In Fig. 1c, we see a template blueprint. We see that there
are two initialization methods and three interface methods.We also see that three of its accessors are not invoked and,
therefore, unused and that one of the attributes is not
accessed by the methods of this class. The next section
presents two real class blueprints in detail.
4 DETAILING CLASS BLUEPRINTS
To show how the class blueprint visualization allows one to
represent a condensed view of a class’ methods, call flow,
and attribute accesses, we describe in detail two classes
implementing two different domain entities of the Jun
framework: The first one defines the concept of a 3D graph
for OpenGL mapping and the second is a rendering
algorithm. We present the blueprints and some piece of
code to show how the graphical representation is extracted
from the source code and how the graphical representation
reflects the code it represents, building a trustable model.
To help the reader to understand the first blueprint, we also
show on the right of the figure a blueprint without metrics
in which the method names are shown on the boxes that
represent them. The left part of Fig. 2 shows the blueprint of
the class JunOpenGL3dGraphAbstract which we describe
hereafter. As the named blueprint on the right in Fig. 2
shows, this kind of representation does not scale well in
practice.The code shown is Smalltalk code, however being fluent
in Smalltalk is not important as we are only concerned with
method invocations and attribute accesses.4 Note that some
of the figures may contain several visual patterns whose
discussion does not always precede the figures. However,
the captions of the figures make use of the complete visual
pattern vocabulary presented in this paper.
DUCASSE AND LANZA: THE CLASS BLUEPRINT: VISUALLY SUPPORTING THE UNDERSTANDING OF CLASSES 5
TABLE 1In a Class Blueprint, Semantic Information is Mapped on the Colors of the Nodes and Edges
4. In Smalltalk, attributes as local variables are read simply by using theattribute name in an expression. They are written using the := construct. In afirst approximation, messages follow the pattern receiver methodName1:arg1 name2: arg2 which is equivalent to the C++ syntax receiver.method-Name1name2(arg1, arg2). Hence, bidiagNorm := self bidiagonalize: super-Diag assigns in the variable bidiagNorm the result of the methodbidiagonalize.

4.1 Example 1: An Abstract Class
The class blueprint shown in Fig. 2 has the followingstructure:
. One initialization layer method. This method calledinitialize is positioned on the left. As shown, itextends (invokes) a superclass method with thesame name; hence, the node color is orange. Itaccesses directly two attributes as the cyan lineshows it. The code of the method initialize is thefollowing one:
initialize
super initialize.
displayObject := nil.
displayColor := nil
. Several external interface layer methods. Note thatmany of them have a yellow color, i.e., they delegatethe functionality. The following method asPointAr-ray is a delegating method.
asPointArray
^ self displayObject asPointArray
The reader may be intrigued by the fact that thereare yellow nodes (hence, delegating methods) with-out any edges: they do not invoke any methodswithin this class nor do they access any attribute.This is the case of the lispCons method whose codeis shown hereafter. Such methods delegate calls tothem to the metaclass. This happens because ofSmalltalk semantics that specify that any class is aninstance of its metaclass. It is good practice to factorconstants at the metaclass level as in the presentcase. A similar situation would occur in Java when amethod delegates to a static variable. We decidednot to introduce a specific analysis to cope with thisSmalltalk specific point to let our approach be asgeneral as possible.
lispCons
^ self class lispCons
The five gray nodes in the interface layer are
methods returning constant values as illustrated by
the following method isArc. This method illustrates a
typical practice to share a default behavior among
the hierarchy of classes.
isArc
^ false
. A small internal implementation layer with two
sublayers. Here, we show that the blueprint
granularity resides at the method level, as the
visualization does not specifically represent control
flow constructs. The method displayObject per-
forms a lazy initialization, i.e., it initializes the
attributes only when the attributes are accessedand acts as an abstract template method by calling
the method createDisplayObject which is abstract
and, thus, represented as a cyan node. The method
createDisplayObject should then be redefined in
the subclasses.
displayObject
displayObject isNil ifTrue: [ displayObject := self
createDisplayObject ].
^ displayObject
createDisplayObject
^ self subclassResponsibility
. Two accessors. There is a read-accessor, color,displayed as the red accessor node and a write-accessor, setValue: displayed as the rightmost orangeaccessor node.
6 IEEE TRANSACTIONS ON SOFTWARE ENGINEERING, VOL. 31, NO. 1, JANUARY 2005
Fig. 2. Left: An actual class blueprint visualization of the class JunOpenGL3dGraphAbstract, a class which represents 3D-graphs in OpenGL.Right: The same class displayed with method names for illustrating how the methods call each other.

. Two attributes. Note that the read-accessor readsone attribute, while the write-accessor writes theother one. However, no method uses the write-accessor. The attributes are also directly accessed:The initialize method accesses both, while two othermethods do also directly access the attributes whichis an inconsistent coding practice.
4.2 Example 2: An Algorithm
The second class blueprint presented in Fig. 4a displays theclass JunSVD implementing the algorithm of the samename. Looking at the blueprint we get the followinginformation.
. No initialization layer method. The left layer isempty.
. Three external interface layer methods. Two ofthem access directly the attributes of the class. Wealso see that the second external interface layermethod is actually an entry point to all the methodsin the internal implementation layer.
. An internal implementation layer composed of
nine methods in five sublayers. The class is actually
written in a clearly structured way. Therefore, the
class blueprint can also be used to infer a reading
order of the methods contained in this class. The
blueprint shows us that the node Awhich represents
the method compute (shown hereafter) invokes themethods bidiagonalize:, epsilon, and diagonalize:
with:
compute
| superDiag bidiagNorm eps |
m := matrix rowSize.
n := matrix columnSize.
u := (matrix species unit: m) asDouble.
v := (matrix species unit: n) asDouble.
sig := Array new: n.
superDiag := Array new: n.
bidiagNorm := self bidiagonalize: superDiag.
eps := self epsilon* bidiagNorm.
self diagonalize: superDiag with: eps.
. Three read accessor methods. Although three read-
accessors have been defined, they are not used bymethods of this class because they do not have any
ingoing edges that would exemplify their use.. Six attributes. All the attributes in this class are
accessed by several methods, i.e., all the state of the
class is accessed by the methods. The blueprint also
reveals that the attributes are heavily accessed. The
nodes marked as A, B, and C consistently access all
the attributes matrix, n, m, sig, v, and u. To under-
stand how this particular behavior is possible, weshow the code of the method generalizedInverse (C).
After reading the code, we understand easily that
this particular behavior for a class is normal for an
algorithm and we mentally acknowledge that the
other methods are built in a similar fashion.
generalizedInverse
| sp |
sp := matrix species new: n by: m.
sp doIJ: [:each :i :j | sp row: i column: j put:
((i = j and: [(sig at: j) isZero not])
ifTrue: [(sig at: j) reciprocal]
ifFalse: [0.0d])].
^ (v product: sp) product: u transpose
This example shows that the blueprint visualization
conveys information which is otherwise hard to notice: All
attributes are accessed by the class’ methods. This is an
example of how the approach supports opportunistic code
reading: First, the reader is intrigued by the regularity of the
accesses, then he reads one method and understands that
the methods implement algorithms. He can now extrapolate
this knowledge to the other methods of the class.
4.3 Class Blueprints and Inheritance
Understanding classes in the presence of inheritance isdifficult as the flow of the program is not local to a singleclass but distributed over hierarchies, as mentioned by Wild[6] and Lange [11]. In the context of inheritance, wevisualize every class blueprint separately and put thesubclasses below the superclasses according to a simpletree layout.
In Fig. 3a, we see a concrete inheritance hierarchy of classblueprints. The superclass defines some behavior that isthen specialized by each of the three subclasses namedJunColorChoiceHSB, JunColorChoiceSBH, JunColorChoi-ceHBS. The blueprint of this hierarchy reveals that thesubclasses have been developed to satisfy the implementa-tion needs of the superclass: They do not define any extrabehavior, it is the superclass that must be analyzed tounderstand the whole hierarchy.
We see that the root class defines several abstractmethods (denoted by the cyan color) that represent colorcomponents such as brightness, hue, and color and whichare overridden (denoted by the brown color) in the threesmall subclasses. As there is the same number of brownnodes than cyan one, there is a good chance that thesubclasses are concrete classes.
The method named color (A) is a template method thatcalls three abstract methods as confirmed by the definitionof the method color hereafter.
color
^ ColorValue hue: self hue saturation:
self saturation brightness: self brightness
We see that the methods xy: (B), and xy (C) play a centralrole in the design of the class as they are both called byseveral of the methods of each subclass, as confirmed by thefollowing method of the class JunColorChoiceSBH:
JunColorChoiceSBH brightness: value
((value isKindOf: Number) and: [0.0 <= value and:
[value <= 1.0]])
ifTrue: [self xy: self xy x @ 1 - value]
This example shows again that the blueprint visualiza-tion conveys information which is otherwise hard to notice,
DUCASSE AND LANZA: THE CLASS BLUEPRINT: VISUALLY SUPPORTING THE UNDERSTANDING OF CLASSES 7

for example, the fact that all the subclasses of the rootclasses implement only methods which override methods inthe superclass, or it helps to detect the template methoddesign pattern present in the root class.
These examples show how the blueprints help a softwareengineer to 1) build a mental image of the class in terms of
method invocations and state access, 2) understand theclass/subclass roles, and 3) identify key methods.
Blueprints act as revealers in the sense that they raisequestions, support hypotheses, or clearly show importantinformation. When questions are raised, code reading helpsconfirming the information provided by the visualization.
8 IEEE TRANSACTIONS ON SOFTWARE ENGINEERING, VOL. 31, NO. 1, JANUARY 2005
Fig. 3. (a) A class blueprint visualization of an inheritance hierarchy with the class JunColorChoice as root class. The root class contains an Interface
visual pattern, while each of the subclasses is a pure Overrider. Furthermore, each subclass is a pure Siamese Twin. (b) A class blueprint
visualization of an inheritance hierarchy with the class JunPrologEntity as root class.
Fig. 4. (a) A blueprint visualization of the class JunSVD. This class blueprint shows visual patterns of the type Single Entry, Structured Flow, and AllState. (b) The blueprint of the class JunSourceCodeSaver contains a Large Implementation, a Single Entry, and a Structured Flow visual pattern atthe bottom. (c) The root class is a combination of a nearly pure Interface and a Constant Definer visual pattern, while the subclass (JunAngle) is acombination of a Wide Interface and a Funnel visual pattern. (d) The class blueprint of the class JunJfifColorComponent: It contains a Data Storageand a Three Layers visual pattern. (e) The class blueprint of the class JunBmpImageStream with two Single Entry visual patterns.

Code reading is not always necessary, but used sparinglyon identified methods. There is a definitive synergybetween the visual images generated by the blueprint andthe code reading. Class blueprints allow one to characterizeclasses but also represent an important communicationmeans, as we present in the coming sections.
5 A PATTERN VOCABULARY BASED ON THE
CLASS BLUEPRINT
While the approach is already an excellent vehicle tosupport the understanding of classes, it also provides thebasis to develop a visual vocabulary that enables program-mers to communicate recurrent situations they encounter.Indeed, recurrent situations in the code produce similarvisual patterns in terms of node colors and flow structure.These visual patterns stem from the experiences weobtained while applying our approach on industrial casestudies. We subdivide the discussion of the visual patternsin two separate sections depending on the context in whicha blueprint is presented:
1. Single class perspective, where we look at a singleblueprint without considering surrounding sub orsuperclasses (Section 6).
2. Inheritance perspective, where we extend thecontext to the inheritance hierarchy where the classresides (Section 7).
We use the term pure class blueprint when it is composedof only one and exclusively one visual pattern.
Even if some of the visual patterns could be automati-cally identified by our tool, the identification of visualpatterns is mainly based on a human interpretation of ablueprint. There are advantages and disadvantages toletting a software engineer identify visual patterns: Theadvantages are that the human mind can deal withnonregular information and still extract useful pieces,which is important in a reengineering context. The dis-advantages are that the software engineer needs expertise inanalyzing a class blueprint and that he may wronglyinterpret the visual patterns. However, this is not a greatproblem as the code mapping is simple and the engineercan quickly look at the code to confirm his hypothesis. Inthe future, we want to evaluate how to automate theidentification of nonregular and trivial visual patterns andwhether this is worth the effort.
6 SINGLE CLASS VISUAL PATTERNS
In this part, we present the visual patterns that blueprintscontain without considering surrounding sub and super-classes. One class blueprint may contain several visualpatterns. The visual patterns in this section are groupedaccording to the following criteria: size, distribution layer,semantics, call-flow, and state usage. This grouping is notstrict and is mainly used to ease the reading of the paper.
6.1 Size-Based Visual Patterns
Four simple visual patterns describe classes regarding theirsize: Single, Micro, Large Implementation, and Giant.
Single. This visual pattern is composed of one node. Itdescribes classes that only consist of one method (see theroot class of the hierarchy in Fig. 3b). This happens in thefollowing cases:
1. The class in question represents dead code or has notbeen completely implemented yet.
2. It is the result of code sharing among hierarchies. Itoften represents methods defining single defaultvalues or testing methods in the form of isSome-thing() as shown by the following method definition.See the discussion of the Single Constant Definervisual pattern for more details. The single method ofthe root class in Fig. 3b has the following definition:
JunPrologEntity >> isJunPrologEntity
^ true
When the method is not a method simply defining aconstant but has a certain complexity, it is worth tolook at it as it represents common behavior sharedamong several classes and often used to distinguishbetween several kinds of classes.
3. This may occur when classes are subclasses of largeclasses of which they specialize only a limiteddefault behavior or constant definitions.
Micro. This visual pattern is composed of only a coupleof nodes. It describes a small class that is composed of onlya couple of methods (see bottom class to the left of Fig. 3b).This often occurs in subclasses that specialize behavior.
Giant. A really large number of nodes and invocationscomposes the entire blueprint. This visual pattern describesa huge class that is composed of hundreds of methods.Normally, the blueprint layout algorithm is not efficientenough to support the understanding of such classes,although visual patterns are still recognizable. Such classescan have a complex initialization structure producing verylong methods. Due to space restrictions, we omit anexample figure for this blueprint. Usually, classes revealinga Giant visual pattern are classes having too muchresponsibilities and requiring further inspection.
Large Implementation. This visual pattern is character-ized by implementation layers containing many nodes oftenstructured in several sublayers. The overall percentage innodes number and screen space of the implementation layerdominates all the other layers. It describes classes that havea large implementation decomposed in several methodswith numberous invocations between those methods. InFig. 4b, we see that the class JunSourceCodeSaver has asmall public interface and a large internal implementationlayer with large methods and six internal implementationsublayers. The role of this class is to save the code of theapplication in a proprietary format.
6.2 Layer Distribution-Based Visual Patterns
Three visual patterns Three Layers, Wide Interface, andInterface are based on the distribution of methods in theblueprint layers.
Three Layers. Graphically, this visual pattern is com-posed of three to four colored bands with few nodes: One ortwo white bands for the interface layer, one red for theaccessor, and one blue for attributes. This visual pattern
DUCASSE AND LANZA: THE CLASS BLUEPRINT: VISUALLY SUPPORTING THE UNDERSTANDING OF CLASSES 9

describes classes that have few methods, some accessors,and some attributes. Usually these classes are small andimplement primitive behavior and access to data. In Fig. 3b,we see that the class annotated as A belongs to this category.
Interface. Graphically the visual pattern presents onepredominant interface layer. It occurs when a class acts asan interface, which is frequent for abstract superclasses. Italso occurs when the class acts as a pool of constants. InSmalltalk, there is no construct for defining constant values,therefore class methods are often used to return constantvalues. Such classes can also contain a Constant Definervisual pattern as shown by the top class blueprint in Fig. 4c.
Wide Interface. Graphically this visual pattern iscomposed of a large interface layer compared to the otherlayers. A Wide Interface blueprint is one that offers manyentry points to its functionality proportionally to itsimplementation layer (see bottom class in Fig. 4c and to acertain extent Fig. 2). Examples of such classes are GUIclasses with many buttons on the user interface whichimplement a method for every button the user can press.
6.3 Semantics-Based Visual Patterns
In a class blueprint, we map semantic information to nodeand edge colors. We identify the visual patterns Delegate,Data Storage, Constant Definer, Accessor User, Direct Access,and Access Mixture by looking at which colors are present ina blueprint and where the nodes with those colors arelocated.
Delegate. Graphically this visual pattern is composed ofyellow nodes often found in the interface layer. Delegatedescribes a class that defines delegating methods, i.e., itforwards invocations to attributes or to accessor invoca-tions. A Delegate can be an indication for design patternssuch as Facade orWrapper. The class annotated as B in Fig. 3band the class in Fig. 2 present both a Delegate visual pattern.
Data Storage. This pattern presents mainly two layers,one red of accessors and one blue of attributes. It mayhappen to have one extra method to initialize the attributes.The Data Storage visual pattern describes a class whichmainly defines accessors to attributes. Such a class usuallydoes not implement any complex behavior, but is merelyused for data storage and retrieval. The implementationlayer is often empty. Looking for duplicated logic in theclients of such classes is usually a good way to reduceduplicated code and to enforce the Law of Demeter [23],[24]. Fig. 4d shows a class presenting some aspects of theData Storage visual pattern, but is not limited to this. Thisclass could also be categorized as a Three Layers even if thenumber of accessors is important compared to the othermethods defined. Not being able to exactly categorize theclass is not a problem as the key point is that the reengineernow knows that the class seems to act as a data repositorywith some extra behavior. Reading briefly the methodnextSample (the biggest method node in this blueprint),confirms this hypothesis as this method generates newcolors using the attributes of the object.
Constant Definer. This pattern is composed of graynodes often residing in the interface layer. It describes aclass that defines methods returning constant values suchas integers, Booleans, or strings. Pure Constant Definerblueprints are rare as a class is seldom limited to define
constants. The root class in Fig. 4c and the one in Fig. 2 bothcontain a Constant Definer pattern.
Accessor User / Direct Access / Access Mixture. Thesethree visual patterns are linked to the consistency withwhich edges arrive to attributes and accessors. These threevisual patterns are mutually exclusive and describe the useof accessors in classes. In the case of Accessor User, twoaccessors (the getter and the setter) have been consistentlydefined for every attribute in the class and the attributesare not accessed directly. In the case of Direct Access, noaccessors at all have been defined, and the attributes arealways accessed directly. In the case of Access Mixture,there is an inconsistent definition and use of the accessors.These visual patterns reveal the programming styles andwhether they are followed. It is an important informationwhen lazy initialization has to be introduced in the class asall the accesses to the state should be done via a singlemethod implementing the lazy schema. In Fig. 3b, the classblueprint A shows an Accessor User visual pattern, i.e., forevery attribute there are two accessors and the attributesare only accessed via the accessors. In Fig. 3b, the class C isan example of a Direct Access visual pattern, while withinthe same hierarchy the class blueprint E shows a AccessMixture visual pattern, indicating a possible lack of codingconventions.
6.4 Call-Flow-Based Visual Patterns
Based on the call-flow between the methods, we identify thefollowing visual patterns: Single Entry, Method Clumps, andFunnel.
Single Entry. Graphically, this pattern is composed of aminimal, often limited to one node, interface layer butconnected to all the nodes of the larger implementationlayers. Single Entry describes a class which has very few oronly one method in the external interface layer acting asentry point to the functionality of the class. It then has alarge implementation layer with several levels of calls. Suchclasses are designed to deliver only little yet complexfunctionality. Classes that implement a specific algorithm(e.g., parsers) show this visual pattern. Fig. 4e shows twoSingle Entry visual patterns in one class blueprint. The twodistinctive entry points are the root nodes of two separatemethod invocation trees. We deduce that the class providesfor two separate functionalities, which are probably com-plementary (they access the same attributes).
Structured Flow. This pattern presents a cluster ofmethods structured in a deep and often narrow invocationtree. This pattern reveals that the developer has decom-posed an implementation into methods that invoke eachother and possibly reuse some parts. It supports the readingof the methods. A typical example is the decomposition of acomplex algorithm into pieces. The bottom of the classblueprint in Fig. 4b shows a well pronounced StructuredFlow visual pattern.
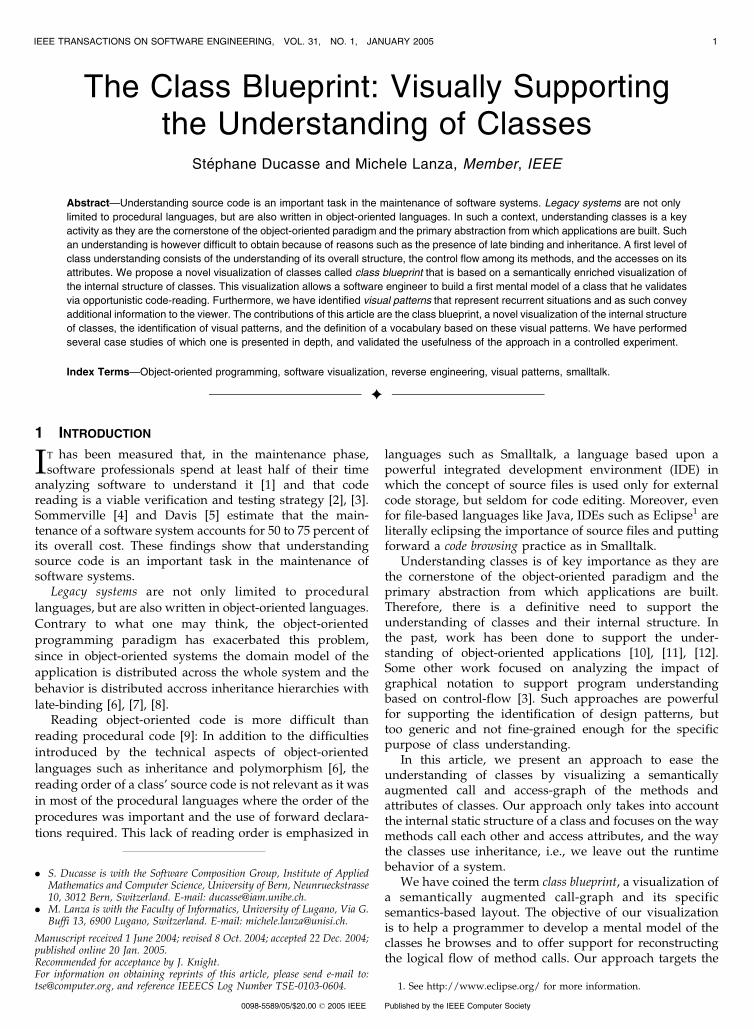
Method Clumps. This pattern is composed of one large orhuge node surrounded by some tiny nodes. It containsclusters of methods, each with one very large method that iscalling many small methods. The large method is notstructured following a functional decomposition. Fig. 5ashows two Method Clumps patterns, the large nodesrepresent methods having more than 100 lines of code.
10 IEEE TRANSACTIONS ON SOFTWARE ENGINEERING, VOL. 31, NO. 1, JANUARY 2005
They are the direct translation of the GNU diff algorithmwritten in C. To give an idea of the disproportionalitybetween those methods and the small ones, note that theaverage number of lines of a Smalltalk method is seven [25].
Funnel. This pattern is composed of an inverse (right-to-left) tree of nodes whose root is on the right, forming afunnel. Funnel describes a group of methods that allconverge toward a final functionality. It often occurs whena complex data structure is used that can be accessed byvarious interfaces. Identifying the final functionality is oftenthe key to understanding how data abstraction is used inthe class. Fig. 5b and the bottom blueprint in Fig. 4c presentFunnel patterns.
6.5 State Usage-Based Visual Patterns
The way the attributes of a class are accessed by themethods creates visual patterns that provide importantsemantic information about the class. Three highly identifi-able and recurrent blueprints occur: Sharing Entries,Splittable State, and All State.
Sharing Entries. The attribute nodes are accesseduniformly by groups of method nodes. This patternrepresents the fact that multiple methods access the samestate, and reveals a certain cohesion of the class regardingits state management. An example of such a pattern is seenin Fig. 5b where nearly all methods access the third attributefrom the top. Fig. 4e presents Sharing Entries patterns as thetwo groups of method forming the Single Entry patternaccess the same state.
Splittable State. This pattern presents two, rarely more,clearly separated groups of method nodes accessing twodistincts set of attribute (blue) nodes. It occurs when a classis composed of several groups of methods each accessing
only a subset of the class state. Classes presenting this
visual pattern are showing a low cohesion and may be split
if necessary. This pattern occurs with classes such as user
interface classes, whose main purpose is to group together
indepent classes. Splittable State is rare, we included it in
this section because it complements the other two blue-
prints presented here. We could not find one in the Jun case
study, therefore omit a figure.All State. This pattern presents groups of method nodes
that have edges arriving to all the attribute nodes (blue). It is
semantically orthogonal to the other two and describes the
fact that a group of methods accesses all the attributes of a
class. When the class presents a Single Entry it often
presents also the All State blueprint. The inverse is not true.
Fig. 4e shows an example where we see that all the
attributes in the class are accessed by the two methods
annotated as A. This remarkable behavior is also exhibited
by the Fig. 4a and the bottom blueprints in Fig. 5d.
7 VISUAL PATTERNS IN THE CONTEXT OF
INHERITANCE
The blueprints support class understanding within the
context of their inheritance hierarchy. Within hierarchies
some specific and recurrent visual patterns occur as well.Micro Specializer. This pattern shows a small class
blueprint composed of a couple of short methods, i.e.
mostly small brown or orange nodes. It denotes a small
class that defines overriding and/or extending methods.
Such classes are mainly used to specialize well identified
behavior and they benefit from the structure and behavior
DUCASSE AND LANZA: THE CLASS BLUEPRINT: VISUALLY SUPPORTING THE UNDERSTANDING OF CLASSES 11
Fig. 5. (a) The Method Clumps visual pattern of the class JunGNUDiff. (b) A Funnel class blueprint of the class JunMovieHandle. (c) A nearly pure
Template class blueprint of the root class JunParametricSection. The two subclasses are both heavyOverrider blueprints. (d) A nearly pure Interface
class blueprint of the root class JunGeometry. The first subclass is a nearly pure Template blueprint, while the two leaf classes are combinations of
the Overrider, and All State blueprint. Moreover they are Siamese Twin blueprints compared with each other.

of their superclasses. In Fig. 3b, we see some examples ofthe Micro Specializer blueprint.
Siamese Twin. This pattern is based on the similaritybetween two or more blueprints of sibling classes, in termsof methods, attributes, method invocations, and attributeaccesses. This happens when the programmer forgot torefactor the common functionality into the superclass of thesiamese twins or when the superclass implements complexlogic that should be extended in a similar way in thesubclasses. The three subclasses in Fig. 3a are siamesetwins, especially the one on the left and the one on the rightoverride exactly the same methods. The bottom blueprintsin Fig. 5d present two large Siamese Twin patterns.
Island. This pattern presents a class blueprint without
any edge going out or coming from other class blueprints.
Island reveals classes that do not communicate with their
superclasses, sibling classes, or subclasses. The commu-
nication between the class and its superclass is only
performed via the template methods of the superclass.
Note that such a class can also define new methods and
new attributes. In Fig. 4c, we see that the subclass neither
invokes methods nor accesses attributes of its superclass.
Furthermore we see that the subclass neither overrides nor
extends any methods of the superclass, since this would be
visible as brown or orange method nodes: Indeed, the
subclass does not communicate with its superclass.
Adder / Extender / Overrider. This pattern presents class
blueprints that are mainly white (adding), orange (extend-
ing), or brown (overriding). These patterns present the way
classes add, extend, or override inherited behavior. The
weight of these patterns, i.e., the number of methods in one
of these three colors compared with the total number of
methods, is an indication of the way the class fits within its
inheritance hierarchy. The rightmost subclass in Fig. 3b is a
pure adder as it is completely white, while all the other
subclasses denote heavy Overrider patterns, i.e., they contain
many overridding methods. None of these classes is
extending superclass behavior. We also see that, in Fig. 5c,
the two subclasses are combinations of Overrider and Adder
blueprints, denoted by the presence of several brown and
white method nodes.Template. This pattern shows a blueprint with a possibly
small implementation layer and several cyan nodes, i.e.,abstract methods. It reveals that a class is not limited to aninterface and that it defines some abstract methods. Theseclasses are often mature classes. The class at the top of thehierarchy in Fig. 3a is a good example of mature design: theclass defines some template methods and abstract hookmethods specializing the behavior inherited from its super-class. Fig. 5c and Fig. 2 both show a Template pattern.
8 USER VALIDATION
The effectiveness of the choice of the layers, the colors, etc.,although questionable, has been refined in several occasionsduring the last four years. In this section we give a shortsummary of personal experiences and feedback weobtained from other users.
8.1 Our Personal Experiences
Apart from industrial case studies on which we are notallowed to report, we applied the class blueprints on fourcase studies:
1. Squeak, an open-source Smalltalk environment(1,800 classes),
2. Moose, our reengineering environment (200 classes),3. Duploc, a tool for the detection of duplicated code
(160 classes, described in [14]), and4. Jun, a graphical framework (700 classes, described in
this article).
All the experiments we ran were limited in time. At themaximum, we allocated three days to apply the blueprintvisualizations on the complete code. During this time, wesystematically visualized all classes (in hierarchies or one byone) and read the actual source code from time to timewhen needed. While using the visualizations, we identifiedvisual patterns and then checked our hypotheses by meansof code reading. Obtaining an understanding of such largeamounts of source code in such a short time would havebeen difficult at the least.
8.2 Users Experiment
Having a scientific validation of our approach by compar-ing it with other approaches is difficult because most of thetools described in literature are not available anymore or donot cover class understanding. However, we run anexperiment to evaluate if and how other users could usethe class blueprint visualizations to understand classes. Weasked 11 researchers and students in software engineeringto use our tool to understand the maximum number ofclasses in the JUN framework (it was unknown to all ofthem) in a limited amount of time. Nearly all participantswere fluent Smalltalk programmers using the VisualWorksenvironment which already proposes some advancedtextual query and navigation facilities. None of them hadever experienced the class blueprint visualizations before,but most had read an earlier version of this article the daybefore the experiment.
Setup. We gave a demonstration of CodeCrawler duringtwenty minutes explaining how to produce a class blueprintvisualization of classes. They had one hour to visualize andunderstand a list of classes of Jun of different sizes andlocation in hierarchies. We asked them to report about thestructure of the classes, their overall quality, their interac-tions with superclasses/subclasses, and seek for any hintsabout the use of design patterns and programming idioms.After the experiment, we asked them to answer thequestions listed in Table 2. On average, they had the timeto understand six classes on a completely unknown system.
Having an empirical validation of a visualizationtechnique is difficult because of many factors, such as thelevel of expertise of the subjects, their aptitude to thinkvisually, their motivation to participate, the quality of thetool providing the visualization, and the quality of thesample. However, this experience5 shows that the userseven in the limited amount of time found class blueprints
12 IEEE TRANSACTIONS ON SOFTWARE ENGINEERING, VOL. 31, NO. 1, JANUARY 2005
5. Other experiments were performed in classes at the Universities ofAntwerp and Louvain-La-Neuve.

useful or very useful. The answers regarding the colors isnormal as the color mapping has to be learned and their isno special way to remember it. For the choice of the layers,the situation is better as their order conveys the sequenceinvocation. The answers related to the visual patterns wereto be expected as we did not ask them to learn the languagepresented in this article. Therefore, we did not expect thatthey could recognize them. We knew that our approach wastargeting expert developers, but the experience showed thateven novices found it useful, although they profit less.
9 TOOL SUPPORT: CODECRAWLER AND MOOSE
CodeCrawler is the tool implementing the class blueprints.It supports reverse engineering through the combinationof metrics and software visualization [22], [26]. Code-Crawler has been repeatedly run on several large scaleindustrial case studies. It is built on top of Moose, areengineering environment written in Smalltalk [27].Moose implements the FAMIX metamodel [13], whichprovides for a language independent representation ofobject-oriented source code and contains the requiredinformation for the reengineering and reverse engineeringtasks such as code refactorings. The core FAMIX meta-model comprises the main object-oriented concepts—Class, Method, Attribute and Inheritance—plus thenecessary associations between them—Invocation andAccess [13]. The complete FAMIX metamodel includesmany more aspects of the object-oriented paradigm, andcontains source code entities like formal parameters, localvariables, functions, etc.
CodeCrawler supports the synergy between opportunis-tic reading of the code and the visualization of classes in thefollowing ways:
. Interactivity. The blueprint visualizations do notmerely represent source code, as in the case of staticvisualizations (i.e., static pictures that cannot bemanipulated), but they support direction manipula-tion. When the proposed layout does not suit the
viewer’s wishes, he can select, move, or highlightconnected, recursively connected, or unconnectednodes.
. Code Proximity. At any moment the reengineer canaccess the code by clicking on any node and seeingthe corresponding definition at the level of amethod, at the level of the class, and using codebrowsers presenting superclasses and subclasses.Moreover, can activate a floating window showingthe code of the node over which the mouse pointer ispassing.
10 RELATED WORK
Among the various approaches to support reverse en-
gineering that have been proposed in the literature,
graphical representations of software have long been
accepted as comprehension aids [28], [29].Many tools make use of static information to visualize
software, such as Rigi [30], Hy+ [31], [12], SeeSoft [32], Dali
[33], ShrimpViews [34], TANGO [35], as well as commercial
tools like Imagix (see http://www.imagix.com) to name but
a few of the more prominent examples. However, most
publications and tools that address the problem of large-
scale static software visualization treat classes as the
smallest unit in their visualizations. There are some tools,
for instance, the FIELD programming environment [36] or
Hy+ [31], [12] which have visualized the internals of classes,
but usually they limited themselves to showing method
names, attributes, etc., and using simple graphs without
added semantic information. GraphTrace proposes to
visualize concurrent animated views to understand the
way a system behaves [10]. ObjectExplorer [11] uses both
dynamic and static information that a software engineer can
query and visualize via simple graphs to understand and
verify his hypotheses. Using basic graph visualizations to
represent various relationships, Mendelzon and Sametinger
[12] show that they can express metrics, constraints
verification, and design pattern identification.
DUCASSE AND LANZA: THE CLASS BLUEPRINT: VISUALLY SUPPORTING THE UNDERSTANDING OF CLASSES 13
TABLE 2Questions and Answers for the User Experiment

Substantial research has also been conducted on runtime
information visualization. Various tools and approaches
make use of dynamic (trace-based) information such as
Program Explorer [11], Jinsight and its ancestors [37], and
Graphtrace [10] or [38]. Various approaches have been
discussed like in [39] where interactions in program
executions are being visualized, to name but a few. Vion
and Dury [40] use 3D to represent the runtime of objects in
distributed and concurrent systems.
Nassi and Shneiderman proposed flowcharts to repre-
sent in a more dense manner the code of procedures [41].
Warnier/Orr-diagrams allow us to describe the organiza-
tion of data and procedures [42]. Both approaches only deal
with procedural code and control-flow. Cross et al. defined
and validated the effectiveness of Control Structure Dia-
grams (CSD) [43], [3], which depict the control-structure
and module-level organization of a program. Even if CSD
has been adapted from Ada to Java, it still does not take into
account the fact that a class exists within an hierarchy and
in presence of late-binding.We provide a visualization of the internal structure of
classes in terms of their implementations and in the contextof their inheritance relationships with other classes. In thissense, our approach proposes a new dimension in theunderstanding of object-oriented systems.
11 CONCLUSION
In object-oriented programming, classes are the primaryabstractions with which applications are built. We supportthe software engineer in understanding the internalstructure of classes and how class behavior is developedin the context of the inheritance hierarchy in which it isdefined. Our approach is based on the synergy between theclass blueprint visualization and opportunistic code reading[15]: The visualization helps in building hypotheses andraising questions that are verified by opportunistic codereading. As such, it supports understanding at multiplelevels of abstraction [16].
Benefits. The main benefits of our approach are thefollowing:
. Reduction of complexity. Using class blueprints we canmake assumptions about a class without having toread the whole source code. This “taste” of the class,which conveys the purpose of a class, appears in twocontexts: the class in isolation and the class within itsinheritance hierarchy.
. Identification of key methods. The class blueprint, bycondensing the class, stresses some of its aspects.Based on the resulting signs shown by the blueprint,the reengineer builds hypotheses and gains insightson the structure and internal implementation of aclass. The blueprint helps to select the relevantmethods whose reading validates or invalidates thehypotheses of the reengineer.
. A common vocabulary. The recurrent visual patternscreated by the blueprints define a common vocabu-lary for the class. This vocabulary supports thecommunication between reengineers during a
reverse engineering process, in a similar manner todesign patterns.
. Programming style detection. After the display ofseveral blueprints, the observer starts to identifycommon visual patterns in different blueprints.These patterns reflect the programming style of thedeveloper, i.e., in some case studies, we are able torecognize which developer wrote the blueprintedclasses.
Limits. Our approach is limited in the following ways:
. Scalability. In very large classes with hundreds ofmethods and dozens of attributes, the patterns arestill visible, but the complexity of the methodinvocations and the attribute accesses make ablueprint difficult to interpret. Very large classeswith dense invocations between methods decreasethe benefits of using the class blueprint visualiza-tion. In such a case, the viewer should start to slicethe call-flow using direct manipulation to select thepart of the class he is interested in.
. Functionality. The blueprint of a class can give the
viewer a “taste” of the class at one glance. However,
it does not show the actual functionality the class
provides. The approach proposed here is thus
complementary to other approaches used to under-
stand classes.. Collaboration. We do not address collaboration
aspects between classes for the time being. This isdue to the extra level of complexity which isintroduced by polymorphism (i.e., a class collabo-rates with a complete inheritance tree). There areapproaches that rely on mural techniques to displaylarge sequences of method calls [39], or that useruntime information to limit the scope of thecollaboration [11], [38]. In addition, a visualizationof collaborating classes should focus on interclasscommunication, while our approach representsinformation internal to classes and inheritancehierarchies, it is therefore currently not targeted atvisualizing collaboration.
. Static Analysis. The approach presented here doesnot make use of dynamic information. This meanswe are ignoring runtime information about whichmethods get actually invoked in a class. This isrelevant in the context of polymorphism andswitches within the code. In this sense the classblueprint can be seen as a visualization of everypossible combination of method invocations andattribute accesses.
Future work. In the future, we plan to extend ourapproach in the following ways:
. Collaboration. In the future, we also plan to extendour approach to classes that are not within the sameinheritance hierarchy, but that collaborate with eachother.
. Cognitive Science. The visualization algorithm pre-sented here and the methodology coming with it areboth ad hoc and build empirically on several years ofexperimentation. Although provably useful, it shows
14 IEEE TRANSACTIONS ON SOFTWARE ENGINEERING, VOL. 31, NO. 1, JANUARY 2005

little connection with research from the field ofcognitive science. We would like to understandmore deeply how our approach fits within aninformation visualization context and fully take intoaccount more general approaches such as the onesproposed by Ware [20], Bertin [18], and Tufte [19],[44].
. Empirical validation. We would like to extend ourempirical usability analysis and qualitative valida-tion of our approach. We plan to integrate ourapproach to a commercial integrated developmentenvironment and ask professional developers toparticipate in this usability analysis.
. Language specific blueprints. The proposed approachhas been developed to be applicable to any class-based object-oriented language. We have visualizedC++ and Java classes as blueprints. A first findingwas that the mapping between the language to theblueprint layers still influences the blueprint. Weplan to identify the variation points by applying thevisualizations to a number of other object-orientedlanguages.
ACKNOWLEDGMENTS
The authors would like to thank Gabriela Arevalo, Oscar
Nierstrasz, and the IEEE Transactions on Software Engineering
reviewers for their valuable feedback. They thank every-
body that participated in the controlled experiment. They
gratefully acknowledge the financial support of the Swiss
National Science Foundation for the projects “Tools and
Techniques for Decomposing and Composing Software”
(SNF Project No. 2000-067855.02) and “Recast: Evolution of
Object-Oriented Applications” (SNF Project No. 2000-
061655.00/1).
REFERENCES
[1] T.A. Corbi, “Program Understanding: Challenge for the 1990’s,”IBM Systems J., vol. 28, no. 2, pp. 294-306, 1989.
[2] V. Basili, “Evolving and Packaging Reading Technologies,”J. Systems and Software, vol. 38, no. 1, pp. 3-12, 1997.
[3] D. Hendrix, J.H. Cross II, and S. Maghsoodloo, “The Effectivenessof Control Structure Diagrams in Source Code ComprehensionActivities,” IEEE Trans. Software Eng., vol. 28, no. 5, pp. 463-477,May 2002.
[4] I. Sommerville, Software Engineering, sixth ed. Addison Wesley,2000.
[5] A.M. Davis, 201 Principles of Software Development. McGraw-Hill,1995.
[6] N. Wilde and R. Huitt, “Maintenance Support for Object-OrientedPrograms,” IEEE Trans. Software Eng., vol. 18, no. 12, pp. 1038-1044, Dec. 1992.
[7] E. Casais and A. Taivalsaari, “Object-Oriented Software EvolutionAnd Re-Engineering (Special Issue),” Theory and Practice of ObjectSystems (TAPOS), vol. 3, no. 4, pp. 233-301, 1997.
[8] A. Dunsmore, M. Roper, and M. Wood, “Object-OrientedInspection In The Face Of Delocalisation,” Proc. ICSE 2000 22ndInt’l Conf. Software Eng., pp. 467-476, 2000.
[9] U. Dekel, “Applications of Concept Lattices To Code InspectionAnd Review,” technical report, Dept. of Computer Science,Technion, 2002.
[10] M.F. Kleyn and P.C. Gingrich, “Graphtrace—UnderstandingObject-Oriented Systems Using Concurrently Animated Views,”Proc. ACM Conf. Object-Oriented Programming Systems, Languages,and Applications, pp. 191-205, Nov. 1988.
[11] D.B. Lange and Y. Nakamura, “Interactive Visualization of DesignPatterns Can Help in Framework Understanding,” Proc. ACMConf. Object-Oriented Programming Systems, Languages, and Applica-tions, pp. 342-357, 1995.
[12] A. Mendelzon and J. Sametinger, “Reverse Engineering byVisualizing and Querying,” Software—Concepts and Tools, vol. 16,pp. 170-182, 1995.
[13] S. Demeyer, S. Tichelaar, and S. Ducasse, “FAMIX 2.1—TheFAMOOS Information Exchange Model,” technical report, Univ.of Bern, 2001.
[14] M. Lanza and S. Ducasse, “A Categorization of Classes Based onthe Visualization of Their Internal Structure: The Class Blueprint,”Proc. ACM Conf. Object-Oriented Programming Systems, Languages,and Applications, pp. 300-311, 2001.
[15] D. Littman, J. Pinto, S. Letovsky, and E. Soloway, “Mental Modelsand Software Maintenance,” Proc. First Workshop Empirical Studiesof Programmers, Soloway and Iyengar, eds., pp. 80-98, 1996.
[16] A. vonMayrhauser and A. Vans, “Identification of DynamicComprehension Processes During Large Scale Maintenance,”IEEE Trans. Software Eng., vol. 22, no. 6, pp. 424-437, June 1996.
[17] M. Petre, “Why Looking Isn’t Always Seeing: Readership Skillsand Graphical Programming,” Comm. ACM, vol. 38, no. 6, pp. 33-44, June 1995.
[18] J. Bertin, Graphische Semiologie. Walter de Gruyter, 1974.[19] E.R. Tufte, Envisioning Information. Graphics Press, 1990.[20] C. Ware, Information Visualization. Morgan Kaufmann, 2000.[21] D. Ingalls, T. Kaehler, J. Maloney, S. Wallace, and A. Kay, “Back to
the Future: The Story of Squeak, a Practical Smalltalk Written inItself,” Proc. ACM Conf. Object-Oriented Programming Systems,Languages, and Applications, pp. 318-326, Nov. 1997.
[22] M. Lanza and S. Ducasse, “Polymetric Views—A LightweightVisual Approach to Reverse Engineering,” IEEE Trans. SoftwareEng., vol. 29, no. 9, pp. 782-795, Sept. 2003.
[23] K.J. Lieberherr and A.J. Riel, “Contributions to Teaching ObjectOriented Design and Programming,” Proc. ACM Conf. Object-Oriented Programming Systems, Languages, and Applications, vol. 24,pp. 11-22, Oct. 1989.
[24] S. Demeyer, S. Ducasse, and O. Nierstrasz, Object-OrientedReengineering Patterns. Morgan Kaufmann, 2002.
[25] E.J. Klimas, S. Skublics, and D.A. Thomas, Smalltalk with Style.Prentice-Hall, 1996.
[26] M. Lanza, “Codecrawler—Lessons Learned in Building a SoftwareVisualization Tool,” Proc. Conf. Software Maintenance and Reeng.,pp. 409-418, 2003.
[27] S. Ducasse, M. Lanza, and S. Tichelaar, “Moose: An ExtensibleLanguage-Independent Environment for Reengineering Object-Oriented Systems,” Proc. Second Int’l Symp. Constructing SoftwareEng. Tools (CoSET 2000), June 2000.
[28] B.A. Price, R.M. Baecker, and I.S. Small, “A Principled Taxonomyof Software Visualization,” J. Visual Languages and Computing,vol. 4, no. 3, pp. 211-266, 1993.
[29] Software Visualization—Programming as a Multimedia Experience, J.T.Stasko, et al., eds., The MIT Press, 1998.
[30] S.R. Tilley, K. Wong, M.-A.D. Storey, and H.A. Muller, “Program-mable Reverse Enginnering,” Int’l J. Software Eng. and KnowledgeEng., vol. 4, no. 4, pp. 501-520, 1994.
[31] M.P. Consens and A.O. Mendelzon, “Hy+: A Hygraph-BasedQuery and Visualisation System,” Proc. 1993 ACM SIGMOD Int’lConf. Management Data, SIGMOD Record, vol. 22, no. 2, pp. 511-516, 1993.
[32] S.G. Eick, J.L. Steffen, and S.E. EricJr, “SeeSoft—A Tool forVisualizing Line Oriented Software Statistics,” IEEE Trans. Soft-ware Eng., vol. 18, no. 11, pp. 957-968, Nov. 1992.
[33] R. Kazman and S.J. Carriere, “Playing Detective: ReconstructingSoftware Architecture from Available Evidence,” Automated Soft-ware Eng., Apr. 1999.
[34] M.-A.D. Storey and H.A. Muller, “Manipulating and Document-ing Software Structures Using Shrimp Views,” Proc. 1995 Int’lConf. Software Maintenance, 1995.
[35] J.T. Stasko, “Tango: A Framework and System for AlgorithmAnimation,” Computer, vol. 23, no. 9, pp. 27-39, Sept. 1990.
[36] S.P. Reiss, “Interacting with the Field Environment,” Software—Practice and Experience, vol. 20, pp. 89-115, 1990.
[37] W.D. Pauw, R. Helm, D. Kimelman, and J. Vlissides, “Visualizingthe Behavior of Object-Oriented Systems,” Proc. ACM Conf. Object-Oriented Programming Systems, Languages, and Applications, pp. 326-337, Oct. 1993.
DUCASSE AND LANZA: THE CLASS BLUEPRINT: VISUALLY SUPPORTING THE UNDERSTANDING OF CLASSES 15
[38] T. Richner and S. Ducasse, “Recovering High-Level Views ofObject-Oriented Applications from Static and Dynamic Informa-tion,” Proc. Int’l Conf. Software Maintenance, H. Yang and L. White,eds., pp. 13-22, Sept. 1999.
[39] D.J. Jerding, J.T. Stansko, and T. Ball, “Visualizing Interactions inProgram Executions,” Proc. Int’l Conf. Software Eng., pp. 360-370,1997.
[40] J.-Y. Vion-Dury and M. Santana, “Virtual Images: InteractiveVisualization of Distributed Object-Oriented Systems,” Proc. ACMConf. Object-Oriented Programming Systems, Languages, and Applica-tions, pp. 65-84, 1994.
[41] I. Nassi and B. Shneiderman, “Flowchart Techniques for Struc-tured Programming,” SIGPLAN Notices, vol. 8, no. 8, Aug. 1973.
[42] D.A. Higgins and N. Zvegintzov, Data Structured SoftwareMaintenance: The Warnier/Orr Approach. Dorset House, Jan. 1987.
[43] J.H. CrossII, S. Maghsoodloo, and D. Hendrix, “Control StructureDiagrams: Overview and Evaluation,” J. Empirical Software Eng.,vol. 3, no. 2, pp. 131-158, 1998.
[44] E.R. Tufte, The Visual Display of Quantitative Information, second ed.Graphics Press, 2001.
Stephane Ducasse obtained the PhD degree atthe University of Nice-Sophia Antipolis and thehabilitation at the University of Paris 6. His fieldsof interests are design of reflective systems,object-oriented languages design, compositionof software components, design and implemen-tation of applications, and reengineering ofobject-oriented applications. He is one of themain developers of the Moose reengineeringenvironment. He enjoys programming in Small-
talk and is the president of the European Smalltalk User Group. He is thecoauthor of more than 30 articles and several books in French andEnglish: La Programmation: Une Approche Fonctionnelle et Recursiveen Scheme (Eyrolles 96), Squeak (Eyrolles 2001), Object-OrientedReengineering Patterns (MKP 2002).
Michele Lanza received the PhD degree incomputer science in 2003 at the University ofBern in Switzerland. He was a recipient of theErnst-Denert Software Engineering Award of theGerman Computer Society in 2003 for his workon object-oriented reverse engineering. Heworked as senior researcher at the Institute ofInformatics of the University of Zurich and in2004 became assistant professor of the facultyof informatics at the University of Lugano in
Switzerland. His main research interests lie in software engineering,reverse engineering and reengineering, software evolution, and in-formation and software visualization. He is a dedicated smalltalker since1997. He is the creator of CodeCrawler, an information visualization tooland one of the main developers of Moose, a language independentreengineering tool environment. He is a member of the ACM and IEEE.
. For more information on this or any other computing topic,please visit our Digital Library at www.computer.org/publications/dlib.
16 IEEE TRANSACTIONS ON SOFTWARE ENGINEERING, VOL. 31, NO. 1, JANUARY 2005