ieee transactions on geoscience and...
TRANSCRIPT
This article has been accepted for inclusion in a future issue of this journal. Content is final as presented, with the exception of pagination.
IEEE TRANSACTIONS ON GEOSCIENCE AND REMOTE SENSING 1
Discriminative-Dictionary-Learning-BasedMultilevel Point-Cluster Features for ALS
Point-Cloud ClassificationZhenxin Zhang, Liqiang Zhang, Xiaohua Tong, Bo Guo, Liang Zhang, and Xiaoyue Xing
Abstract—Efficient presentation and recognition of on-groundobjects from airborne laser scanning (ALS) point clouds are achallenging task. In this paper, we propose an approach thatcombines a discriminative-dictionary-learning-based sparse cod-ing and latent Dirichlet allocation (LDA) to generate multilevelpoint-cluster features for ALS point-cloud classification. Ourmethod takes advantage of the labels of training data and eachdictionary item to enforce discriminability in sparse coding duringthe dictionary learning process and more accurately further rep-resent point-cluster features. The multipath AdaBoost classifierswith the hierarchical point-cluster features are trained, and weapply them to the classification of unknown points by the heri-tance of the recognition results under different paths. Experimentsare performed on different ALS point clouds; the experimentalresults have shown that the extracted point-cluster features com-bined with the multipath classifiers can significantly enhance theclassification accuracy, and they have demonstrated the superiorperformance of our method over other techniques in point-cloudclassification.
Index Terms—Airborne laser scanning (ALS) point clouds, clas-sification, discriminative dictionary learning, point clusters, sparsecoding.
I. INTRODUCTION
H IGHLY dense point clouds acquired by airborne laserscanning (ALS) have become a very important way for
understanding a ground scene. In this context, efficient clas-sification of ALS point clouds is one of the most challengingtasks in photogrammetry and remote sensing fields due to theirlarge varieties, the complex geometry, and visual appearance
Manuscript received December 28, 2015; revised April 21, 2016 and June 12,2016; accepted August 2, 2016. This work was supported in part by theNational Natural Science Foundation of China under Grant 41371324, Grant41325005, and Grant 41501499 and the Shenzhen Scientific Research andDevelopment Funding Program (JCYJ20150625102531697). (Correspondingauthor: Liqiang Zhang.)
Z. Zhang, L. Zhang, L. Zhang, and X. Xing are with the State Key Laboratoryof Remote Sensing Science, School of Geography, Beijing Normal University,Beijing 100875, China (e-mail: [email protected]; [email protected];[email protected]; [email protected]).
X. Tong is with the School of Surveying and Geo-informatics, TongjiUniversity, Shanghai 200092, China (e-mail: [email protected]).
B. Guo is with the Key Laboratory for Geo-Environment Monitoring ofCoastal Zone of the National Administration of Surveying, Mapping andGeoInformation and Shenzhen Key Laboratory of Spatial Smart Sensing,Shenzhen University, Shenzhen 518060, China (e-mail: [email protected]).
Color versions of one or more of the figures in this paper are available onlineat http://ieeexplore.ieee.org.
Digital Object Identifier 10.1109/TGRS.2016.2599163
[1]. For example, the point density of the ALS point cloud inan urban environment is not uniform because of the varyingdistance between the objects and the scanner. Even worse, se-vere occlusion between objects yields incomplete point cloudsand clutter background. Clearly, extraction of discriminativeand robust object representations from the point clouds withnoise and clutters is very critical to achieve high classificationprecision. However, designing features for recognizing visualobjects is time-consuming and requires a deep understandingof domain knowledge [2], [3]. The often used image featuredescriptors such as histograms of oriented gradients (HOGs)[4] and scale-invariant feature transformation (SIFT) [5] areusually high dimensional. For a large scene, these descriptorsare hard to be directly applied in the classifiers due to intensivecomputation and sensitivity to noise.
Currently, the feature representations for ALS point cloudsare generally divided into the point-based [6], voxel-based[7]–[11], and object-based levels [12], [13]. Except for thefeatures, classifiers also affect the classification performance.As noted in [14], the performance of the classifiers is dependenton the data. In this paper, we focus on obtaining discriminativecluster-based features to characterize the shape of objects in theALS point clouds of urban environments, and then we utilizethe multipath AdaBoost classifiers to enhance the classificationresults.
Sparse-representation-based and dictionary-learning-basedmethods have been successfully applied to image classification.For example, inspired by the idea behind the learning vectorquantization [15], a dictionary learning algorithm is presentedfor the classification of hyperspectral images. The dictionary isoptimized by minimizing the hinge loss of residual differencebetween competing classes [16]. Instead of vector quantization,image representation is computed based on the sparse codesof local descriptors such as HOG and SIFT. Sparse codingapproximates an input signal (e.g., point clouds) by a linearcombination of the bases in a dictionary. To find an appropriateset of bases, i.e., a dictionary, many efforts are devoted todictionary learning. Learning the dictionary from the trainingsamples for discriminative sparse coding can achieve impres-sive classification results [1], [17]–[20]. Some methods, such asthe learned iterative shrinkage–thresholding algorithm [21] andthe label consistent K-SVD (LC-KSVD) algorithm [22], havebeen developed to provide efficient optimization algorithms forsparse coding. However, the complexity of these algorithmsgrows dramatically when the number of categories is large;
0196-2892 © 2016 IEEE. Personal use is permitted, but republication/redistribution requires IEEE permission.See http://www.ieee.org/publications_standards/publications/rights/index.html for more information.
This article has been accepted for inclusion in a future issue of this journal. Content is final as presented, with the exception of pagination.
2 IEEE TRANSACTIONS ON GEOSCIENCE AND REMOTE SENSING
thus, determination of sparse codes from large dictionaries iscomputationally expensive [22].
As noted in [23], utilizing the hierarchy to guide the modellearning can bring improvement in classification efficiency andaccuracy. In hierarchical data structures, determination of localneighborhoods has been conducted either with respect to theabsolute size [24] or with respect to the scale parameter [25].In order to capture the richness of data, a multiscale andhierarchical framework was presented to recognize terrestriallaser scanning (TLS) point clouds of cluttered urban scenes [7].In this framework, the TLS point cloud is first resampled intodifferent scales. Then, the resampled data set of each scale isaggregated into several HPCs. The point-cluster-based featureat each level is obtained by the LDA integrated with the bagof words (BoW). We know the BoW discards the spatial orderof the local descriptors; thus, it limits the descriptive powerto the original data. Another methodology that has been usedin image classification is the super-pixel approach [26], [27],which aggregates the local neighboring points that have similarcolors and texture statistics.
Brodu and Lague [28] classified TLS point clouds usinga multiscale local dimensionality feature. The feature allowsthe best separation of different classes. By combining variousscales, the method performs better than a single scale analysisand is robust to missing TLS data. Xu et al. [29] employedthree types of entities, including single points, planar segments,and segments obtained by mean-shift segmentation, to classifythe point clouds. In the above two methods, different scalesare used for obtaining the context of the point cloud and theshape of the objects. In [30], the heterogeneous features ofurban objects are extracted from spectral images and LiDARdata. Then, the features and multiple-kernel learning classifierbased on two levels are utilized to classify urban scenes.A rule-based hierarchical semantic classification scheme thatutilizes spectral information, geometry, and topology-relatedfeatures was developed in [31]. Because multilevel structuresare capable of representing the semantic intercorrelation orvisual similarity among categories [23], hierarchical dictionarylearning models are employed to enhance the classificationperformance [32]–[34]. To avoid losing all information aboutthe spatial layout of the features, Zhou et al. [35] incorporateda multiresolution representation into a bag-of-features model.They partitioned an image into multiple resolutions and ex-tracted local features from each of the multiresolution imageswith dense regions. Then, the representations of different-resolution channels were combined to reach a final decisionusing a support-vector-machine (SVM) classifier. Multilayersparse coding networks [36]–[38] have been proposed to buildfeature hierarchies layer by layer using sparse codes and spatialpooling. Each layer in these networks contains a coding stepand a pooling step. A dictionary is learned at each codingstep which serves as a codebook for obtaining sparse codesfrom image patches or pooled features. Spatial pooling schemesgroup the sparse codes from adjacent blocks into commonentities. The pooled sparse codes from one layer serve as theinput to the next layer.
In this paper, we aim to investigate the shape features ofobjects and apply them to ALS point-cloud classification, i.e.,
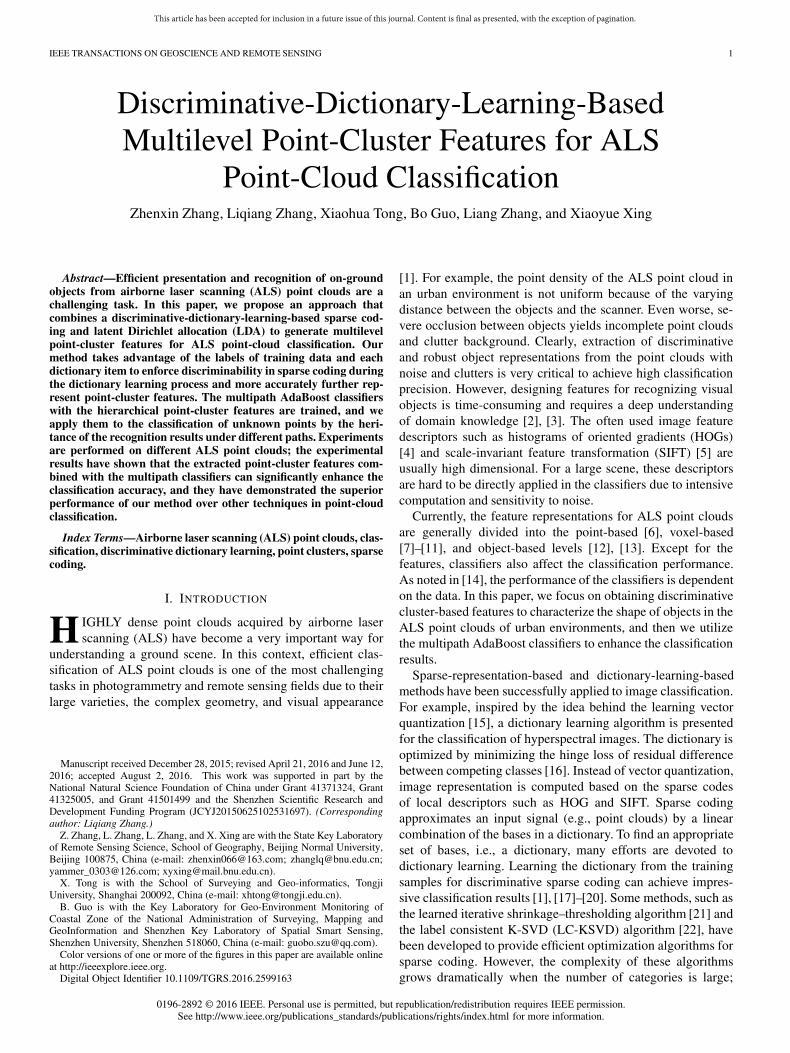
Fig. 1. Process for classifying ALS point clouds.
the input is the ALS point cloud of an urban environment,and the output is the classification result of each object class(such as buildings and trees). Point-based features can representthe information of relatively small regions. Conversely, thefeatures derived from large regions (e.g., cluster-based features)can capture more specific information. If we construct goodfeatures for each 3-D point, and extract discriminative fea-tures of the point clusters from the point-based features, therecognition ability to ALS point clouds can be significantlyenhanced. Based on the above observations, we proposed amethod for constructing the features of the hierarchical pointclusters (HPCs).
In this method, a discriminative-dictionary-learning-basedsparse coding combined with LDA (DDL-SCLDA) is employedto derive the point-cluster-based features at each level from thepoint-based features. As illustrated in Fig. 1, in the trainingphase, the proposed method first aggregates the input ALS pointcloud into multilevel point-cluster sets. Then, the discriminativedictionary learning model is built to learn a discriminativedictionary of the point-based features. In addition to usingclass labels of the point-based features in the training data, weassociate label information with each dictionary item to enforcediscriminability in sparse coding during the dictionary learn-ing process. The optimal solution is efficiently solved by theK-SVD algorithm [41] to obtain the discriminative dictionary.The discriminative-dictionary learning-based sparse coding isintegrated into the LDA to describe the point-cluster featuresof different levels. Finally, we exploit the hierarchical point-cluster features to train multipath AdaBoost classifiers, and theunknown points are classified by the heritance of recognitionresults under different paths.
This article has been accepted for inclusion in a future issue of this journal. Content is final as presented, with the exception of pagination.
ZHANG et al.: DISCRIMINATIVE-DICTIONARY-LEARNING-BASED MULTILEVEL POINT-CLUSTER FEATURES 3
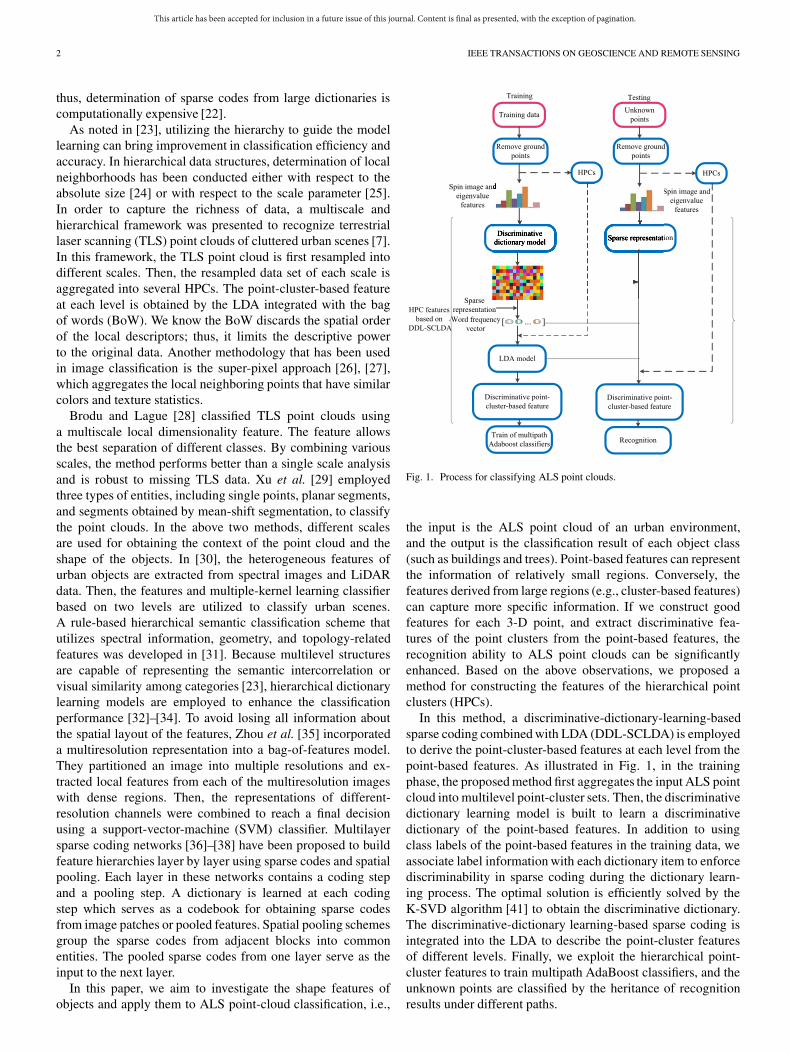
Fig. 2. Three-level point clusters.
The main contributions of this paper are summarized asfollows.
1) A discriminative dictionary learning model with thelabel consistency constraint is introduced to represent thepoint-based features.
2) The DDL-SCLDA is proposed to construct the featuresof the point clusters from the point-based features.
3) The point-cluster features of different levels are used totrain the multipath AdaBoost classifiers, and the finalclassification results of unknown points are obtainedby means of the hierarchical category heritance underdifferent paths.
II. METHODOLOGY
Here, we will first create hierarchical point-cluster sets fromthe input ALS point cloud. Afterward, we obtain the point-based features through discriminative dictionary learning. Next,construct the feature of each point cluster by using the DDL-SCLDA. Finally, the point-cloud classification is generated byemploying the multipath AdaBoost classifiers on the point-cluster-based features of the HPCs.
A. Generation of HPCs
The process for generating HPCs consists of the followingsteps.
1) The terrain points and the isolated points are first re-moved using the method described in [43]. The removalof the terrain points helps to determine the connectivityof objects.
2) Considering that the nonterrain points are often unor-ganized and lack inherent structure, we utilize an undi-rected graph to organize them. Therefore, we search thek1 closest points of each point and connect the pointwith its k1 closest points by edges. In this way, anundirected graph G(V,E) is generated, where V is thepoint set, and V is the set of the corresponding edges.The Euclidean distance between two connected points istaken as the weight of the edge. After G is generated, allof the connected components of G can be found.
3) Because objects are often close together in clutteredurban scenes, a connected component can contain morethan one object. In a connected component, a local maxi-mum point may represent the top of an object. To furtherbreak the connected component into smaller pieces sothat single objects can be isolated, a moving window
algorithm is applied to search the local maximum pointsin a 2-D raster image, which represents the heights ofthe points in the connected component. The raster valueis the maximum height of the points in each raster. Whenthe local maximum points are found, the graph cut [44] isemployed to segment the connected component, and thelocal maximum points are taken as seeds. After the graphcut is performed, the connected component is dividedinto several point clusters.
4) Each of the point clusters acquired by the steps 2 and3 may still contain more than one object. To achievediscriminative cluster features, a cluster should containonly one single object (or a part of it). Furthermore,the distribution of points on the object surface shouldbe as even as possible. Motivated by the fact that thenormalized cut [45] can aggregate the points with uni-form distribution into one cluster, it has been employedhere to partition a large point cluster into two newclusters under the condition that the number of pointsin the cluster is larger than a predefined threshold δm.To ensure that a point cluster contains enough spatialor shape information, we define δm at different levelsδm = ηex, where η is a parameter, and x is an integerrelated with the level number. Thus, the input point cloudis segmented into multilevel point-cluster sets.
The point clusters with the smallest size, i.e., x = 2, are thelowest level, namely, the nth level. In the jth (j < n) level,x = n+ 2− j. Fig. 2 shows an example of the HPCs with threelevels.
B. Discriminative Dictionary Learning
Since the input point cloud has been split into multilevels,the point-based features are correspondingly extracted in eachlevel. The set of points that are the k closest neighborhoodsof a point p is defined as the support region of p [7]. In thispaper, we extract the feature of p in its three support regionswith different sizes. In each support region, we compute thespin image descriptor [39] and eigenvalues [40] of p. A spinimage can capture the majority of local shape informationpresented in a 3-D scene. It is a 2-D parameter space histogram.Each 3-D point can be projected onto a 2-D space with thex-axis and y-axis. We take the normal vector of a point as therotation axis and set the size to 3 × 4 bins. Therefore, the spinimage of p has 12 values. The 12 values of the spin imageand the six values of the eigenvalues are combined into an18-dimensional vector. The 54-dimensional vector obtained

This article has been accepted for inclusion in a future issue of this journal. Content is final as presented, with the exception of pagination.
4 IEEE TRANSACTIONS ON GEOSCIENCE AND REMOTE SENSING
from the three support regions is taken as the feature of p.Next, we will focus on constructing a discriminative dictionarylearning model for deriving the features of the point clusters.
As the supervised learning approach has been shown ben-eficial to dictionary learning [18], we propose a supervisedformulation for extracting discriminative dictionary to encodethe point-based features. Assume the features of the trainingsamples X = [x1,x2, . . . ,xn] and xi denotes the feature ofthe ith point. Given the dictionary D, we aim to leverage thesupervised information (i.e., labels) of the input feature to learna discriminative dictionary. Each dictionary item is obtainedto represent a subset of the training data from a single class,and then the dictionary item is associated with a particularlabel. Hence, there is an explicit correspondence between thedictionary items and the labels in our approach.
Next, we will construct a discriminative dictionary learningmodel. The model integrates a label consistency regularizationterm into the objective function. It is optimized by the K-SVDalgorithm [41], and sparse representation of each point featureis obtained by using feature sign method [42] under the aboveoptimized discriminative dictionary.
1) Discriminative Dictionary Learning Model: Similar to[22], we also apply the discriminative dictionary learningmethod to get a discriminative dictionary.
Assume U=[u1,u2, . . . ,uq] is the sparse representationof the input point features X. The classification performancedepends on the discriminability of the input sparse codes U,which is closely related with the saliency of the dictionary D,where D=[d1,d2, . . . ,dK ]. For obtaining a discriminativeD, an objective function for extracting the dictionary isdefined as
〈D,A,U〉 = argminD,A,U
{‖X−DU‖2F + α‖Q−AU‖2F
}s.t. ∀ i, ‖ui‖0 ≤ T
(1)
where A is a linear transformation matrix. α is a weight thatcontrols the relative contribution between the reconstructionand label consistency regularization. T is a sparsity constraintfactor (for each decomposed signal ui, the number of thenonzero items is less than T ). Q = [q1, . . . ,qN ] ∈ RK×N
are the “discriminative” sparse codes of the input featuresX for classification. qi = [q1i , . . . , q
Ki ]
t= [0 . . . 1, 1, . . . , 0]t ∈
RK is a “discriminative” sparse code corresponding to an inputsignal xi if the nonzero values of qi occur at those indexeswhere the input signal xi and the dictionary item dk sharethe same label. For example, if D = [d1, . . . ,d5], and X =[x1, . . . ,x6], where x1, x2, and d2 are from class 1, x3, x4,d1, and d3 are from class 2, and x5, x6, d4, and d5 are fromclass 3, Q can be defined as
Q =
⎡⎢⎢⎢⎢⎣0 0 1 1 0 01 1 0 0 0 00 0 1 1 0 00 0 0 0 1 10 0 0 0 1 1
⎤⎥⎥⎥⎥⎦ .
We perform a linear transformation g(u,A) = Au, whichmakes the original sparse code u the most discriminative inthe sparse feature space RK . The term ‖Q−AU‖22 representsthe discriminative sparse code error, which enforces the trans-formed sparse codes AU approximate the discriminative sparsecodes Q. It forces the features from the same class to havevery similar sparse representations such as encouraging labelconsistency in the resulting sparse codes.
2) Initialization of the Discriminative Dictionary LearningModel: The parameters D(0) and A(0) are initialized for thediscriminative dictionary learning model. For D(0), we useseveral iterations of K-SVD [41] within each class, and thencombine all the outputs (i.e., dictionary items learning fromeach class) of each K-SVD. The label of each dictionary itemdk is then initialized based on the corresponding class andremains fixed during the dictionary learning process. Wordsare uniformly allocated to each class with the number of theelements proportional to the dictionary size.
We employ the multivariate ridge regression model [46] toinitialize A(0), under the condition of the quadratic loss andFrobenius norm regularization. The model is as follows:
A = argminA
{‖Q−AU‖2F + β‖A‖2F
}(2)
which obtains the following solution:
A = QUt(UUt + βI)−1. (3)
Given the initialized D(0), we apply the K-SVD algorithm tocompute the sparse codes U of the training feature X. Then, Uis used to compute the initial A(0).
3) Optimization: We use the K-SVD algorithm to find theoptimal solution for all parameters simultaneously. Equation (4)can be rewritten as
〈D,A,U〉 = argminD,A,U
∥∥∥∥( X√αQ
)−(
D√αA
)U
∥∥∥∥2
F
s.t. ∀ i, ‖ui‖0 ≤ T.
(4)
Let Xnew = (Xt,√αQt)
t and Dnew = (Dt,√αAt)
t. Thematrix Dnew is L2 normalized columnwise. The optimizationof (4) is equivalent to solving the following problems:
〈Dnew,U〉 = argminDnew,U
{‖Xnew −DnewU‖2F
}s.t. ∀ i, ‖ui‖0 ≤ T.
(5)
This is the standard problem that K-SVD [41] solves. Fol-lowing K-SVD, dk and its corresponding coefficients, the kthrow in U, which is denoted uk
R, are updated at a time. LetEk = (X−
∑j =k dju
jR), and uk
R and Ek denote the result ofdiscarding the zero entries in uk
R and Ek, respectively. dk andukR can be computed by
⟨dk, u
kR
⟩= argmin
dk,ukR
{∥∥∥Ek − dkukR
∥∥∥2F
}. (6)
This article has been accepted for inclusion in a future issue of this journal. Content is final as presented, with the exception of pagination.
ZHANG et al.: DISCRIMINATIVE-DICTIONARY-LEARNING-BASED MULTILEVEL POINT-CLUSTER FEATURES 5
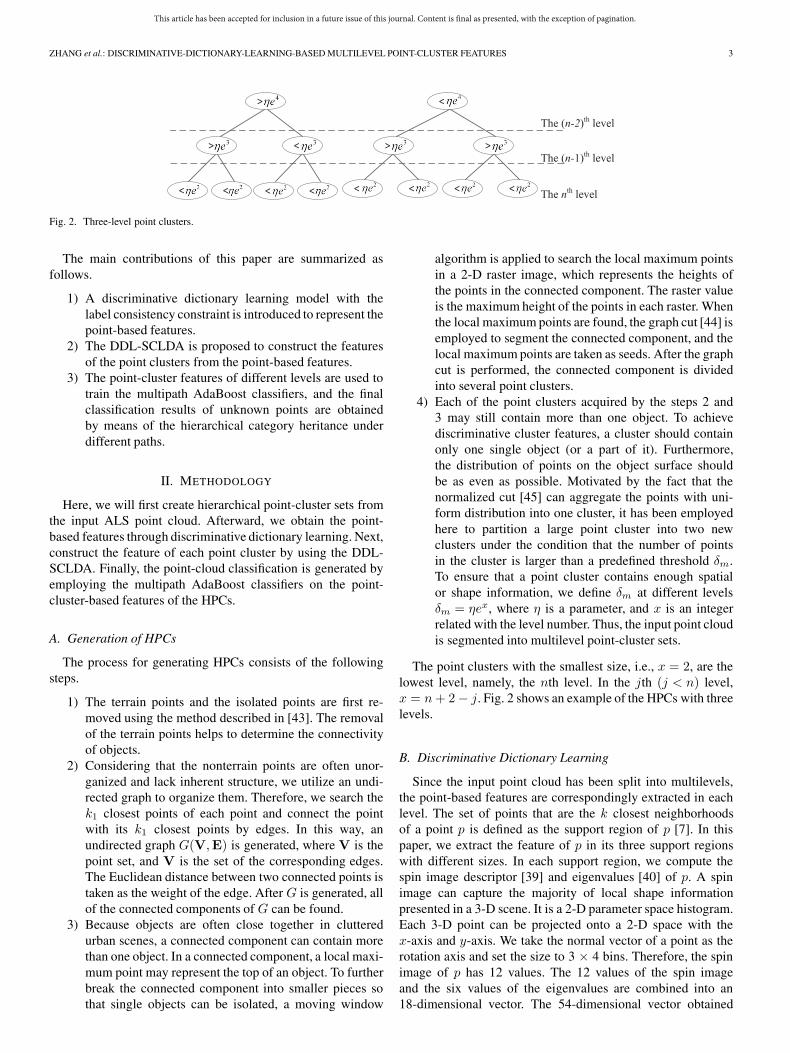
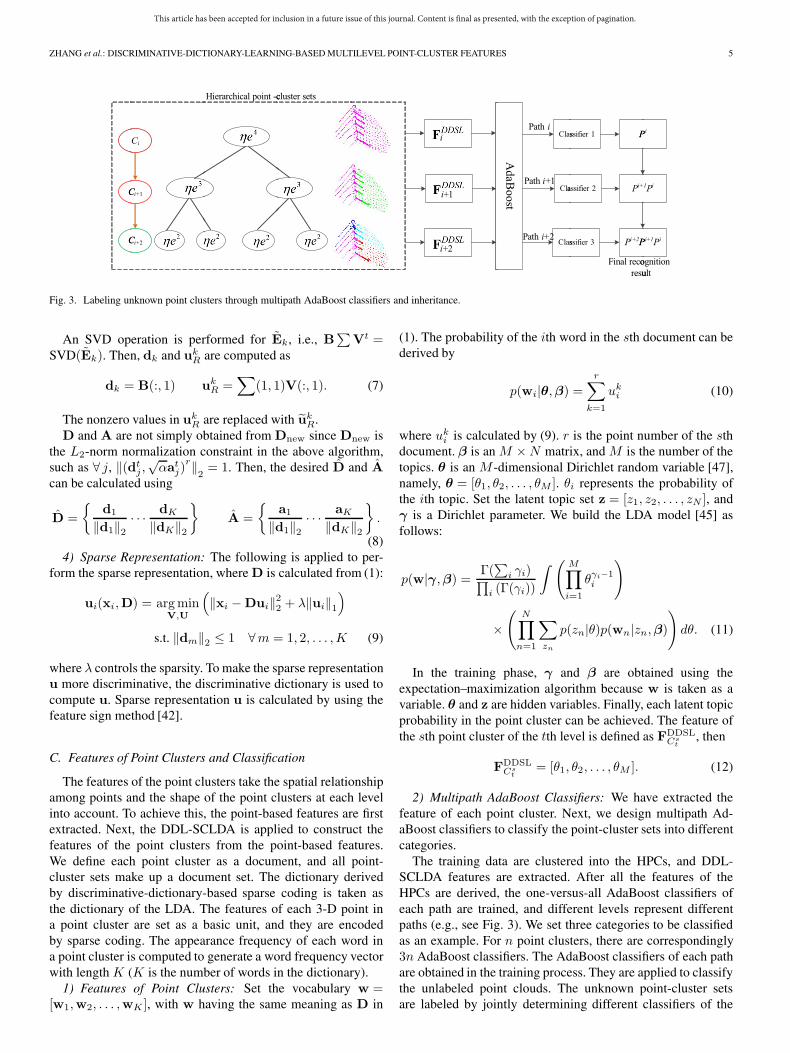
Fig. 3. Labeling unknown point clusters through multipath AdaBoost classifiers and inheritance.
An SVD operation is performed for Ek, i.e., B∑
Vt =SVD(Ek). Then, dk and uk
R are computed as
dk = B(:, 1) ukR =
∑(1, 1)V(:, 1). (7)
The nonzero values in ukR are replaced with uk
R.D and A are not simply obtained from Dnew since Dnew is
the L2-norm normalization constraint in the above algorithm,such as ∀ j, ‖(dt
j ,√αatj)
r‖2= 1. Then, the desired D and A
can be calculated using
D =
{d1
‖d1‖2· · · dK
‖dK‖2
}A =
{a1
‖d1‖2· · · aK
‖dK‖2
}.
(8)4) Sparse Representation: The following is applied to per-
form the sparse representation, where D is calculated from (1):
ui(xi,D) = argminV,U
(‖xi −Dui‖22 + λ‖ui‖1
)s.t. ‖dm‖2 ≤ 1 ∀m = 1, 2, . . . ,K (9)
where λ controls the sparsity. To make the sparse representationu more discriminative, the discriminative dictionary is used tocompute u. Sparse representation u is calculated by using thefeature sign method [42].
C. Features of Point Clusters and Classification
The features of the point clusters take the spatial relationshipamong points and the shape of the point clusters at each levelinto account. To achieve this, the point-based features are firstextracted. Next, the DDL-SCLDA is applied to construct thefeatures of the point clusters from the point-based features.We define each point cluster as a document, and all point-cluster sets make up a document set. The dictionary derivedby discriminative-dictionary-based sparse coding is taken asthe dictionary of the LDA. The features of each 3-D point ina point cluster are set as a basic unit, and they are encodedby sparse coding. The appearance frequency of each word ina point cluster is computed to generate a word frequency vectorwith length K (K is the number of words in the dictionary).
1) Features of Point Clusters: Set the vocabulary w =[w1,w2, . . . ,wK ], with w having the same meaning as D in
(1). The probability of the ith word in the sth document can bederived by
p(wi|θ,β) =r∑
k=1
uki (10)
where uki is calculated by (9). r is the point number of the sth
document. β is an M ×N matrix, and M is the number of thetopics. θ is an M -dimensional Dirichlet random variable [47],namely, θ = [θ1, θ2, . . . , θM ]. θi represents the probability ofthe ith topic. Set the latent topic set z = [z1, z2, . . . , zN ], andγ is a Dirichlet parameter. We build the LDA model [45] asfollows:
p(w|γ,β) = Γ(∑
i γi)∏i (Γ(γi))
∫ (M∏i=1
θγi−1i
)
×(
N∏n=1
∑zn
p(zn|θ)p(wn|zn,β))dθ. (11)
In the training phase, γ and β are obtained using theexpectation–maximization algorithm because w is taken as avariable. θ and z are hidden variables. Finally, each latent topicprobability in the point cluster can be achieved. The feature ofthe sth point cluster of the tth level is defined as FDDSL
Cst
, then
FDDSLCs
t= [θ1, θ2, . . . , θM ]. (12)
2) Multipath AdaBoost Classifiers: We have extracted thefeature of each point cluster. Next, we design multipath Ad-aBoost classifiers to classify the point-cluster sets into differentcategories.
The training data are clustered into the HPCs, and DDL-SCLDA features are extracted. After all the features of theHPCs are derived, the one-versus-all AdaBoost classifiers ofeach path are trained, and different levels represent differentpaths (e.g., see Fig. 3). We set three categories to be classifiedas an example. For n point clusters, there are correspondingly3n AdaBoost classifiers. The AdaBoost classifiers of each pathare obtained in the training process. They are applied to classifythe unlabeled point clouds. The unknown point-cluster setsare labeled by jointly determining different classifiers of the
This article has been accepted for inclusion in a future issue of this journal. Content is final as presented, with the exception of pagination.
6 IEEE TRANSACTIONS ON GEOSCIENCE AND REMOTE SENSING
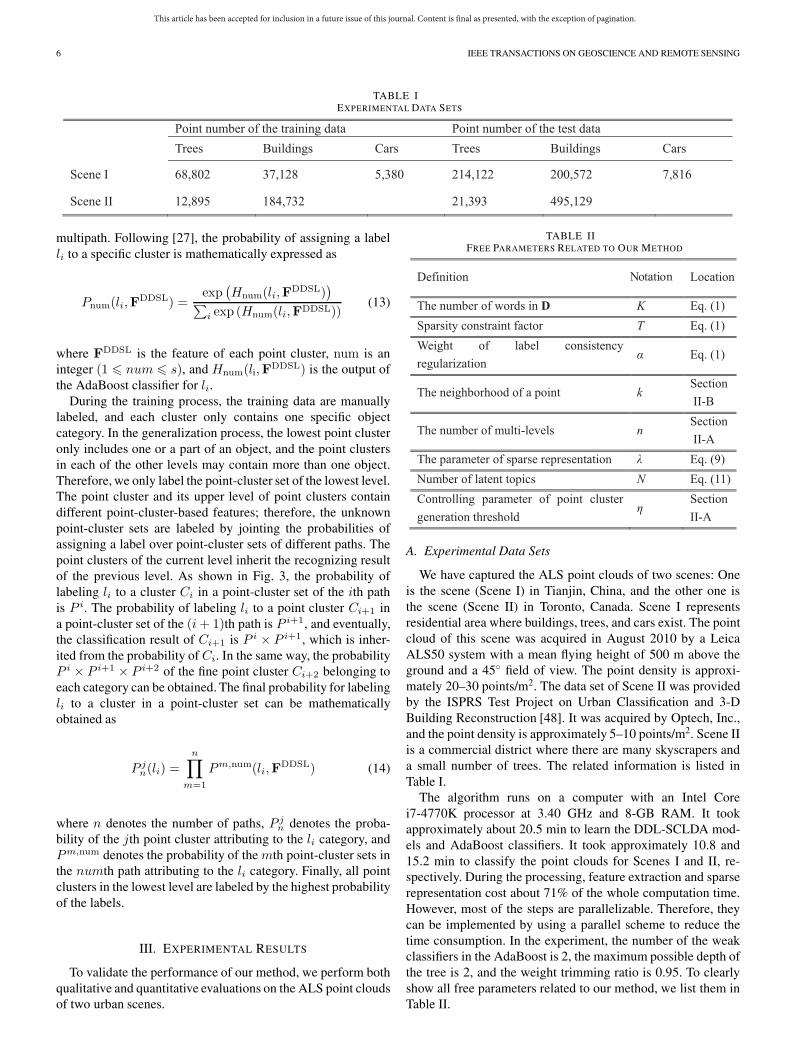
TABLE IEXPERIMENTAL DATA SETS
multipath. Following [27], the probability of assigning a labelli to a specific cluster is mathematically expressed as
Pnum(li,FDDSL) =
exp(Hnum(li,F
DDSL))∑
i exp (Hnum(li,FDDSL))(13)
where FDDSL is the feature of each point cluster, num is aninteger (1 � num � s), and Hnum(li,F
DDSL) is the output ofthe AdaBoost classifier for li.
During the training process, the training data are manuallylabeled, and each cluster only contains one specific objectcategory. In the generalization process, the lowest point clusteronly includes one or a part of an object, and the point clustersin each of the other levels may contain more than one object.Therefore, we only label the point-cluster set of the lowest level.The point cluster and its upper level of point clusters containdifferent point-cluster-based features; therefore, the unknownpoint-cluster sets are labeled by jointing the probabilities ofassigning a label over point-cluster sets of different paths. Thepoint clusters of the current level inherit the recognizing resultof the previous level. As shown in Fig. 3, the probability oflabeling li to a cluster Ci in a point-cluster set of the ith pathis P i. The probability of labeling li to a point cluster Ci+1 ina point-cluster set of the (i+ 1)th path is P i+1, and eventually,the classification result of Ci+1 is P i × P i+1, which is inher-ited from the probability of Ci. In the same way, the probabilityP i × P i+1 × P i+2 of the fine point cluster Ci+2 belonging toeach category can be obtained. The final probability for labelingli to a cluster in a point-cluster set can be mathematicallyobtained as
P jn(li) =
n∏m=1
Pm,num(li,FDDSL) (14)
where n denotes the number of paths, P jn denotes the proba-
bility of the jth point cluster attributing to the li category, andPm,num denotes the probability of the mth point-cluster sets inthe numth path attributing to the li category. Finally, all pointclusters in the lowest level are labeled by the highest probabilityof the labels.
III. EXPERIMENTAL RESULTS
To validate the performance of our method, we perform bothqualitative and quantitative evaluations on the ALS point cloudsof two urban scenes.
TABLE IIFREE PARAMETERS RELATED TO OUR METHOD
A. Experimental Data Sets
We have captured the ALS point clouds of two scenes: Oneis the scene (Scene I) in Tianjin, China, and the other one isthe scene (Scene II) in Toronto, Canada. Scene I representsresidential area where buildings, trees, and cars exist. The pointcloud of this scene was acquired in August 2010 by a LeicaALS50 system with a mean flying height of 500 m above theground and a 45◦ field of view. The point density is approxi-mately 20–30 points/m2. The data set of Scene II was providedby the ISPRS Test Project on Urban Classification and 3-DBuilding Reconstruction [48]. It was acquired by Optech, Inc.,and the point density is approximately 5–10 points/m2. Scene IIis a commercial district where there are many skyscrapers anda small number of trees. The related information is listed inTable I.
The algorithm runs on a computer with an Intel Corei7-4770K processor at 3.40 GHz and 8-GB RAM. It tookapproximately about 20.5 min to learn the DDL-SCLDA mod-els and AdaBoost classifiers. It took approximately 10.8 and15.2 min to classify the point clouds for Scenes I and II, re-spectively. During the processing, feature extraction and sparserepresentation cost about 71% of the whole computation time.However, most of the steps are parallelizable. Therefore, theycan be implemented by using a parallel scheme to reduce thetime consumption. In the experiment, the number of the weakclassifiers in the AdaBoost is 2, the maximum possible depth ofthe tree is 2, and the weight trimming ratio is 0.95. To clearlyshow all free parameters related to our method, we list them inTable II.
This article has been accepted for inclusion in a future issue of this journal. Content is final as presented, with the exception of pagination.
ZHANG et al.: DISCRIMINATIVE-DICTIONARY-LEARNING-BASED MULTILEVEL POINT-CLUSTER FEATURES 7
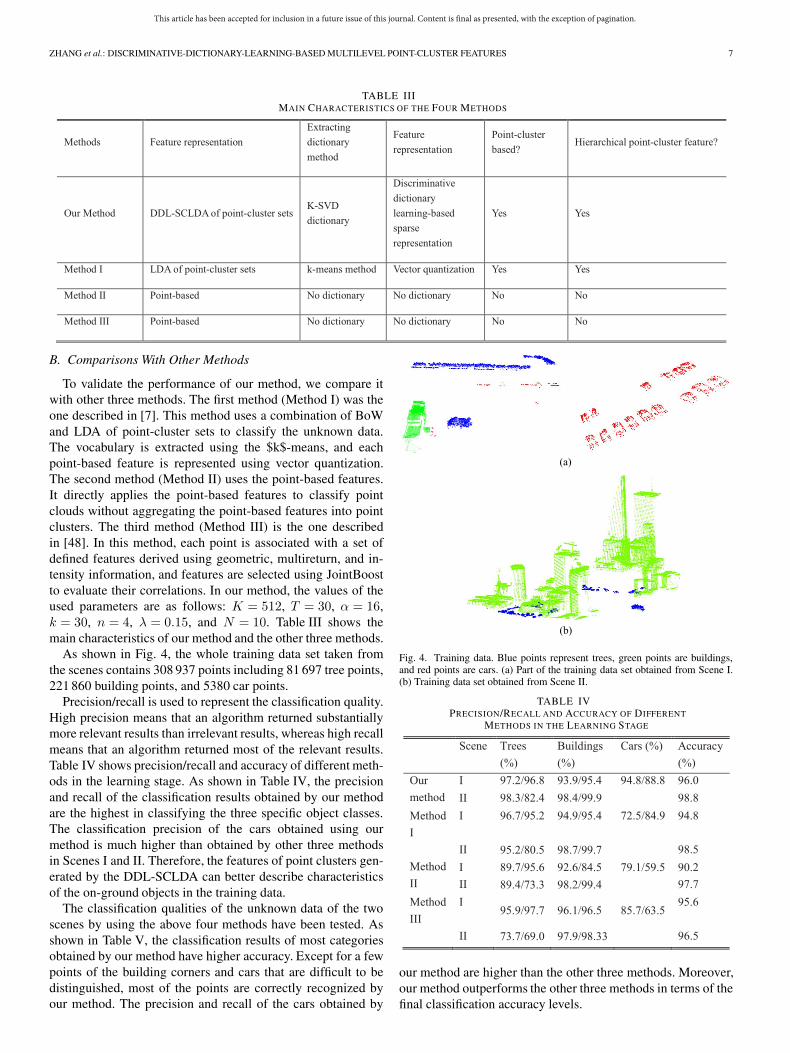
TABLE IIIMAIN CHARACTERISTICS OF THE FOUR METHODS
B. Comparisons With Other Methods
To validate the performance of our method, we compare itwith other three methods. The first method (Method I) was theone described in [7]. This method uses a combination of BoWand LDA of point-cluster sets to classify the unknown data.The vocabulary is extracted using the $k$-means, and eachpoint-based feature is represented using vector quantization.The second method (Method II) uses the point-based features.It directly applies the point-based features to classify pointclouds without aggregating the point-based features into pointclusters. The third method (Method III) is the one describedin [48]. In this method, each point is associated with a set ofdefined features derived using geometric, multireturn, and in-tensity information, and features are selected using JointBoostto evaluate their correlations. In our method, the values of theused parameters are as follows: K = 512, T = 30, α = 16,k = 30, n = 4, λ = 0.15, and N = 10. Table III shows themain characteristics of our method and the other three methods.
As shown in Fig. 4, the whole training data set taken fromthe scenes contains 308 937 points including 81 697 tree points,221 860 building points, and 5380 car points.
Precision/recall is used to represent the classification quality.High precision means that an algorithm returned substantiallymore relevant results than irrelevant results, whereas high recallmeans that an algorithm returned most of the relevant results.Table IV shows precision/recall and accuracy of different meth-ods in the learning stage. As shown in Table IV, the precisionand recall of the classification results obtained by our methodare the highest in classifying the three specific object classes.The classification precision of the cars obtained using ourmethod is much higher than obtained by other three methodsin Scenes I and II. Therefore, the features of point clusters gen-erated by the DDL-SCLDA can better describe characteristicsof the on-ground objects in the training data.
The classification qualities of the unknown data of the twoscenes by using the above four methods have been tested. Asshown in Table V, the classification results of most categoriesobtained by our method have higher accuracy. Except for a fewpoints of the building corners and cars that are difficult to bedistinguished, most of the points are correctly recognized byour method. The precision and recall of the cars obtained by
Fig. 4. Training data. Blue points represent trees, green points are buildings,and red points are cars. (a) Part of the training data set obtained from Scene I.(b) Training data set obtained from Scene II.
TABLE IVPRECISION/RECALL AND ACCURACY OF DIFFERENT
METHODS IN THE LEARNING STAGE
our method are higher than the other three methods. Moreover,our method outperforms the other three methods in terms of thefinal classification accuracy levels.
This article has been accepted for inclusion in a future issue of this journal. Content is final as presented, with the exception of pagination.
8 IEEE TRANSACTIONS ON GEOSCIENCE AND REMOTE SENSING
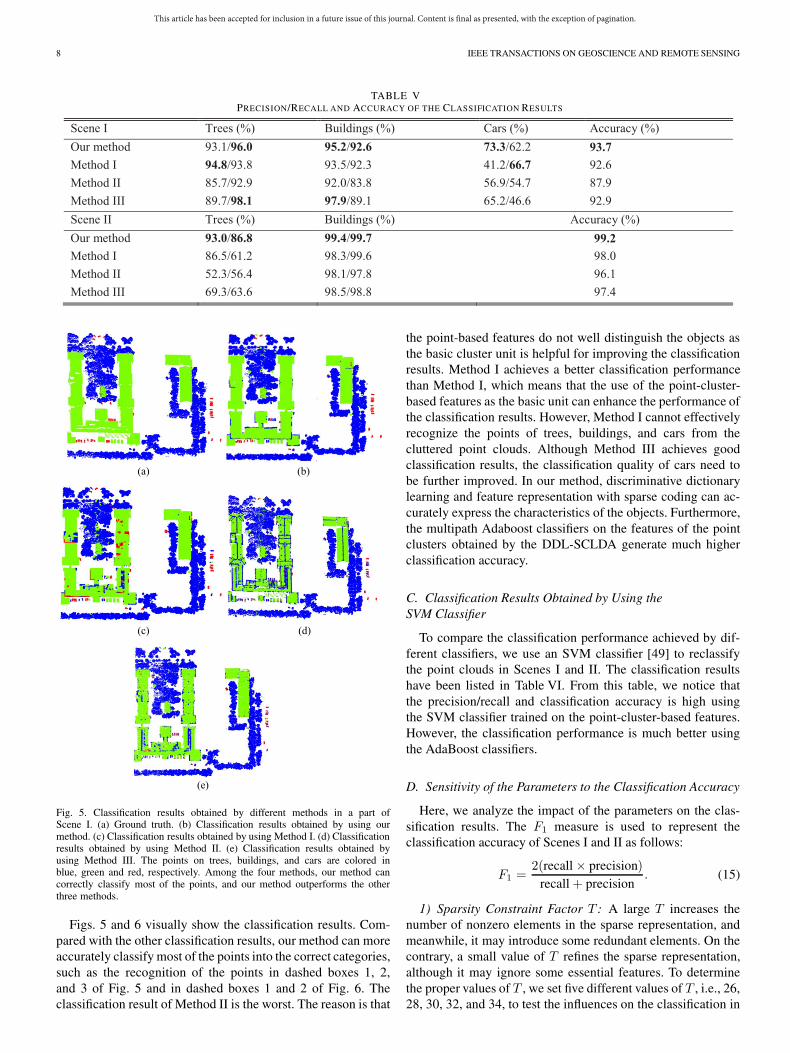
TABLE VPRECISION/RECALL AND ACCURACY OF THE CLASSIFICATION RESULTS
Fig. 5. Classification results obtained by different methods in a part ofScene I. (a) Ground truth. (b) Classification results obtained by using ourmethod. (c) Classification results obtained by using Method I. (d) Classificationresults obtained by using Method II. (e) Classification results obtained byusing Method III. The points on trees, buildings, and cars are colored inblue, green and red, respectively. Among the four methods, our method cancorrectly classify most of the points, and our method outperforms the otherthree methods.
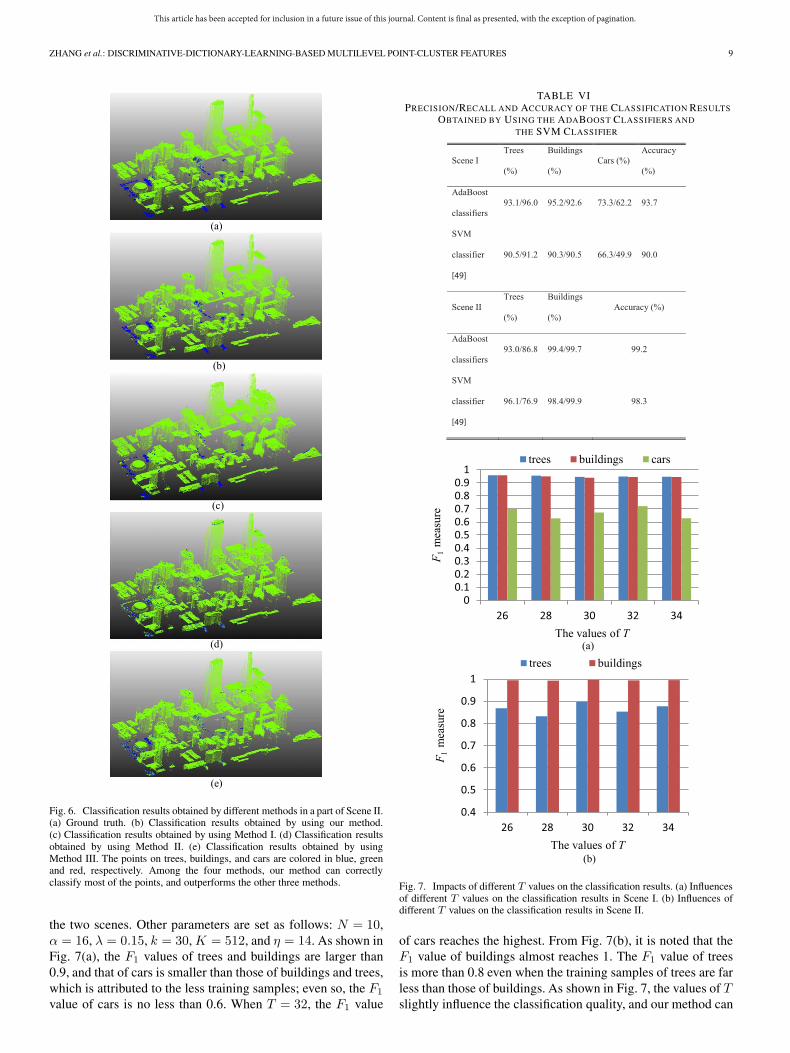
Figs. 5 and 6 visually show the classification results. Com-pared with the other classification results, our method can moreaccurately classify most of the points into the correct categories,such as the recognition of the points in dashed boxes 1, 2,and 3 of Fig. 5 and in dashed boxes 1 and 2 of Fig. 6. Theclassification result of Method II is the worst. The reason is that
the point-based features do not well distinguish the objects asthe basic cluster unit is helpful for improving the classificationresults. Method I achieves a better classification performancethan Method I, which means that the use of the point-cluster-based features as the basic unit can enhance the performance ofthe classification results. However, Method I cannot effectivelyrecognize the points of trees, buildings, and cars from thecluttered point clouds. Although Method III achieves goodclassification results, the classification quality of cars need tobe further improved. In our method, discriminative dictionarylearning and feature representation with sparse coding can ac-curately express the characteristics of the objects. Furthermore,the multipath Adaboost classifiers on the features of the pointclusters obtained by the DDL-SCLDA generate much higherclassification accuracy.
C. Classification Results Obtained by Using theSVM Classifier
To compare the classification performance achieved by dif-ferent classifiers, we use an SVM classifier [49] to reclassifythe point clouds in Scenes I and II. The classification resultshave been listed in Table VI. From this table, we notice thatthe precision/recall and classification accuracy is high usingthe SVM classifier trained on the point-cluster-based features.However, the classification performance is much better usingthe AdaBoost classifiers.
D. Sensitivity of the Parameters to the Classification Accuracy
Here, we analyze the impact of the parameters on the clas-sification results. The F1 measure is used to represent theclassification accuracy of Scenes I and II as follows:
F1 =2(recall × precision)
recall + precision. (15)
1) Sparsity Constraint Factor T : A large T increases thenumber of nonzero elements in the sparse representation, andmeanwhile, it may introduce some redundant elements. On thecontrary, a small value of T refines the sparse representation,although it may ignore some essential features. To determinethe proper values of T , we set five different values of T , i.e., 26,28, 30, 32, and 34, to test the influences on the classification in
This article has been accepted for inclusion in a future issue of this journal. Content is final as presented, with the exception of pagination.
ZHANG et al.: DISCRIMINATIVE-DICTIONARY-LEARNING-BASED MULTILEVEL POINT-CLUSTER FEATURES 9
Fig. 6. Classification results obtained by different methods in a part of Scene II.(a) Ground truth. (b) Classification results obtained by using our method.(c) Classification results obtained by using Method I. (d) Classification resultsobtained by using Method II. (e) Classification results obtained by usingMethod III. The points on trees, buildings, and cars are colored in blue, greenand red, respectively. Among the four methods, our method can correctlyclassify most of the points, and outperforms the other three methods.
the two scenes. Other parameters are set as follows: N = 10,α = 16, λ = 0.15, k = 30, K = 512, and η = 14. As shown inFig. 7(a), the F1 values of trees and buildings are larger than0.9, and that of cars is smaller than those of buildings and trees,which is attributed to the less training samples; even so, the F1
value of cars is no less than 0.6. When T = 32, the F1 value
TABLE VIPRECISION/RECALL AND ACCURACY OF THE CLASSIFICATION RESULTS
OBTAINED BY USING THE ADABOOST CLASSIFIERS AND
THE SVM CLASSIFIER
Fig. 7. Impacts of different T values on the classification results. (a) Influencesof different T values on the classification results in Scene I. (b) Influences ofdifferent T values on the classification results in Scene II.
of cars reaches the highest. From Fig. 7(b), it is noted that theF1 value of buildings almost reaches 1. The F1 value of treesis more than 0.8 even when the training samples of trees are farless than those of buildings. As shown in Fig. 7, the values of Tslightly influence the classification quality, and our method can
This article has been accepted for inclusion in a future issue of this journal. Content is final as presented, with the exception of pagination.
10 IEEE TRANSACTIONS ON GEOSCIENCE AND REMOTE SENSING
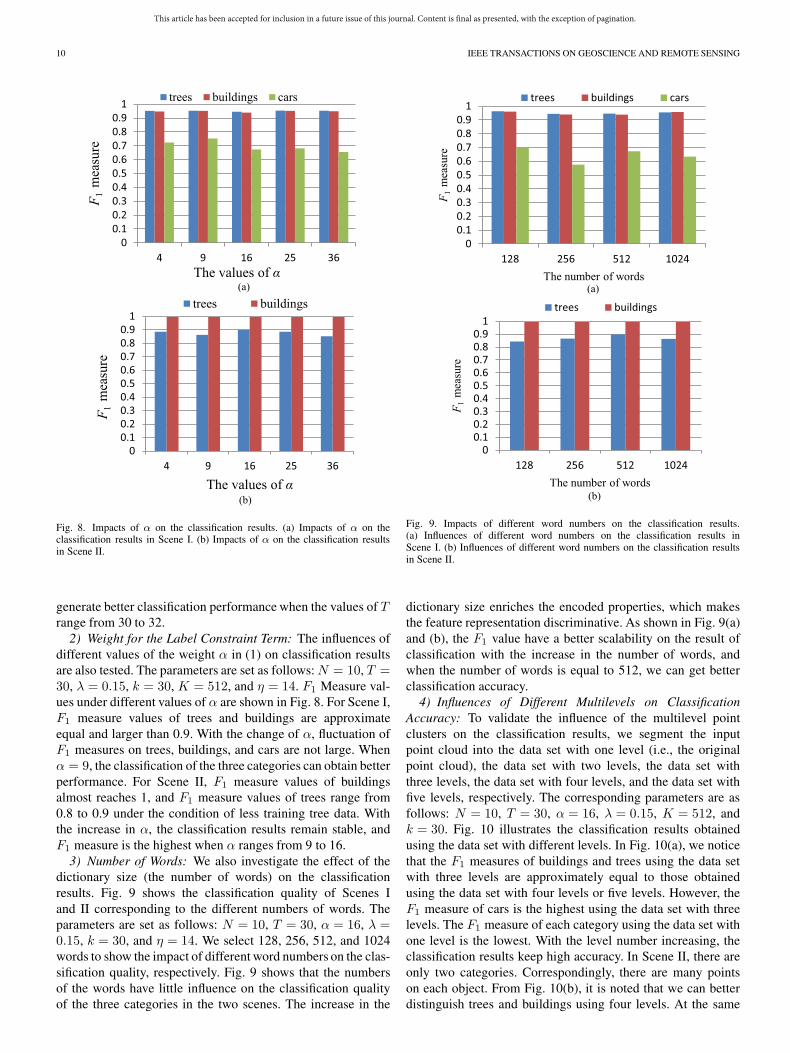
Fig. 8. Impacts of α on the classification results. (a) Impacts of α on theclassification results in Scene I. (b) Impacts of α on the classification resultsin Scene II.
generate better classification performance when the values of Trange from 30 to 32.
2) Weight for the Label Constraint Term: The influences ofdifferent values of the weight α in (1) on classification resultsare also tested. The parameters are set as follows: N = 10, T =30, λ = 0.15, k = 30, K = 512, and η = 14. F1 Measure val-ues under different values of α are shown in Fig. 8. For Scene I,F1 measure values of trees and buildings are approximateequal and larger than 0.9. With the change of α, fluctuation ofF1 measures on trees, buildings, and cars are not large. Whenα = 9, the classification of the three categories can obtain betterperformance. For Scene II, F1 measure values of buildingsalmost reaches 1, and F1 measure values of trees range from0.8 to 0.9 under the condition of less training tree data. Withthe increase in α, the classification results remain stable, andF1 measure is the highest when α ranges from 9 to 16.
3) Number of Words: We also investigate the effect of thedictionary size (the number of words) on the classificationresults. Fig. 9 shows the classification quality of Scenes Iand II corresponding to the different numbers of words. Theparameters are set as follows: N = 10, T = 30, α = 16, λ =0.15, k = 30, and η = 14. We select 128, 256, 512, and 1024words to show the impact of different word numbers on the clas-sification quality, respectively. Fig. 9 shows that the numbersof the words have little influence on the classification qualityof the three categories in the two scenes. The increase in the
Fig. 9. Impacts of different word numbers on the classification results.(a) Influences of different word numbers on the classification results inScene I. (b) Influences of different word numbers on the classification resultsin Scene II.
dictionary size enriches the encoded properties, which makesthe feature representation discriminative. As shown in Fig. 9(a)and (b), the F1 value have a better scalability on the result ofclassification with the increase in the number of words, andwhen the number of words is equal to 512, we can get betterclassification accuracy.
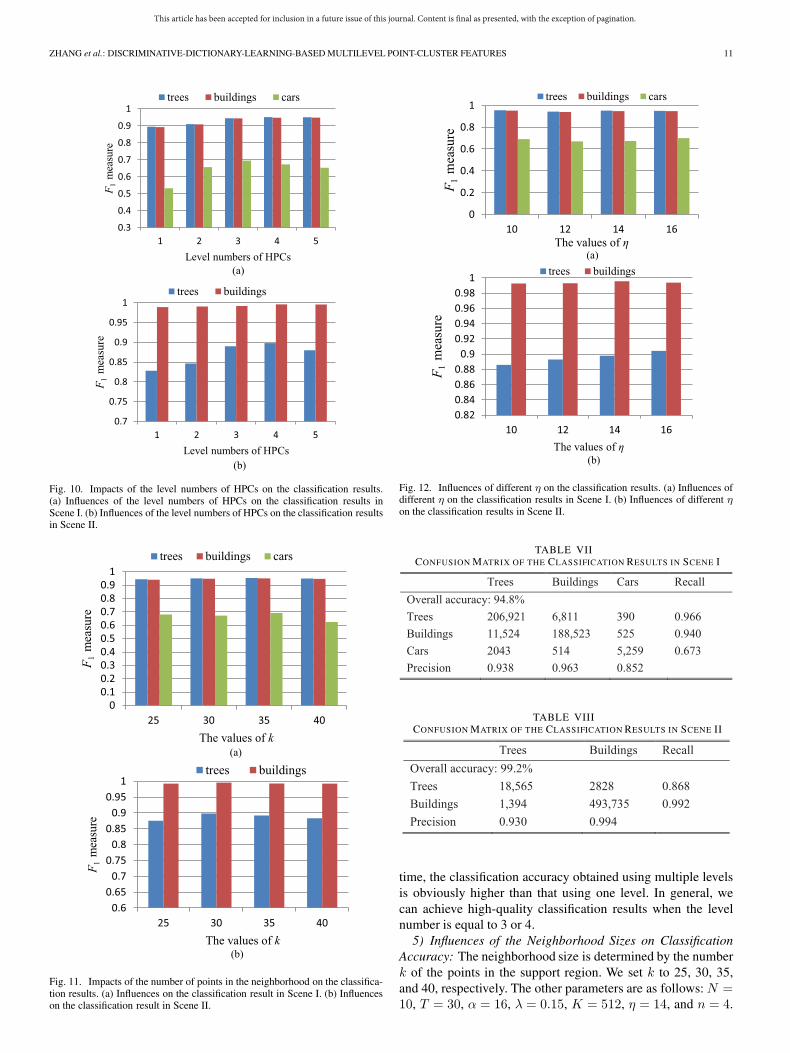
4) Influences of Different Multilevels on ClassificationAccuracy: To validate the influence of the multilevel pointclusters on the classification results, we segment the inputpoint cloud into the data set with one level (i.e., the originalpoint cloud), the data set with two levels, the data set withthree levels, the data set with four levels, and the data set withfive levels, respectively. The corresponding parameters are asfollows: N = 10, T = 30, α = 16, λ = 0.15, K = 512, andk = 30. Fig. 10 illustrates the classification results obtainedusing the data set with different levels. In Fig. 10(a), we noticethat the F1 measures of buildings and trees using the data setwith three levels are approximately equal to those obtainedusing the data set with four levels or five levels. However, theF1 measure of cars is the highest using the data set with threelevels. The F1 measure of each category using the data set withone level is the lowest. With the level number increasing, theclassification results keep high accuracy. In Scene II, there areonly two categories. Correspondingly, there are many pointson each object. From Fig. 10(b), it is noted that we can betterdistinguish trees and buildings using four levels. At the same
This article has been accepted for inclusion in a future issue of this journal. Content is final as presented, with the exception of pagination.
ZHANG et al.: DISCRIMINATIVE-DICTIONARY-LEARNING-BASED MULTILEVEL POINT-CLUSTER FEATURES 11
Fig. 10. Impacts of the level numbers of HPCs on the classification results.(a) Influences of the level numbers of HPCs on the classification results inScene I. (b) Influences of the level numbers of HPCs on the classification resultsin Scene II.
Fig. 11. Impacts of the number of points in the neighborhood on the classifica-tion results. (a) Influences on the classification result in Scene I. (b) Influenceson the classification result in Scene II.
Fig. 12. Influences of different η on the classification results. (a) Influences ofdifferent η on the classification results in Scene I. (b) Influences of different ηon the classification results in Scene II.
TABLE VIICONFUSION MATRIX OF THE CLASSIFICATION RESULTS IN SCENE I
TABLE VIIICONFUSION MATRIX OF THE CLASSIFICATION RESULTS IN SCENE II
time, the classification accuracy obtained using multiple levelsis obviously higher than that using one level. In general, wecan achieve high-quality classification results when the levelnumber is equal to 3 or 4.
5) Influences of the Neighborhood Sizes on ClassificationAccuracy: The neighborhood size is determined by the numberk of the points in the support region. We set k to 25, 30, 35,and 40, respectively. The other parameters are as follows: N =10, T = 30, α = 16, λ = 0.15, K = 512, η = 14, and n = 4.

This article has been accepted for inclusion in a future issue of this journal. Content is final as presented, with the exception of pagination.
12 IEEE TRANSACTIONS ON GEOSCIENCE AND REMOTE SENSING
Fig. 13. Typical misclassification errors. (a) Points of the concave exits on the buildings are misclassified as trees. (b) Points on the building edge are misclassifiedas trees. (c) Tree points are misclassified as cars. (d) Tree points are misclassified as buildings. (e) Car points are misclassified as trees and buildings.
Fig. 11 illustrates the classification results under different val-ues of k. As shown in Fig. 10(a), for the four different valuesof k, F1 measures of trees and buildings all are above 0.9 andremain stable. F1 measure of cars is larger than 0.6, and it isabout equal to 0.7 as k = 35. In Fig. 10(b), we observe thatF1 measures of buildings almost reach 1, and those of trees aremore than 0.87. We find the classification results have higheraccuracy when k is between 30 and 35, as shown in Fig. 11(a)and (b).
6) Point-Cluster Generation Threshold: We test the influ-ences of different point-cluster generation thresholds δm on theclassification results. δm is controlled by η in δm = ηex. Letη = 10, 12, 14, and 16, respectively, and the other parametersare as follows: N = 10, T = 30, α = 16, λ = 0.15, K = 512,k = 30, and n = 4. As shown in Fig. 12, we notice that differentvalues of δm keep high and stable classification performances,and have little influences on classification accuracy.
E. Error Analysis
We analyze the classification results of Scenes I and II underthe condition that K = 512words, 30 topics, λ = 0.15, η = 14,and α = 16. Tables VII and VIII list the confusion matrices ofthe two scenes. Some concave exits exist on some buildings;thus, the points on the inner side of exits are easily misclassifiedinto trees [see the dashed box in Fig. 13(a)] as they are similarto trees in shapes. The points on the prominent eaves are oftenwrongly classified into car points [the dashed box in Fig. 13(b)].For the error analysis of tree classification, on the one hand,the generated point cluster of the single tree crown [the dashedbox in Fig. 13(c)] may be wrongly classified into cars as itsspatial distribution is similar to the point cluster of cars; on theother hand, the tree points are misclassified into building roofs
as some point clusters are nearly flat [see the dashed box inFig. 13(d)]. Due to the inhomogeneity of the input point cloud,the points on some cars are presented in a clump as shown inthe dashed box 1 in Fig. 13(e), which are misclassified into treepoints. Some points on cars are scattered so that the recognitionof the points is often wrong, such as the points in the dashedbox 2 in Fig. 13(e).
IV. CONCLUSION
In this paper, a discriminative feature based on multilevelpoint clusters has been presented. At the first step, the inputALS point cloud is segmented into a set of point clusters, andthen the point clusters are divided into different levels. After-ward, a dictionary learning approach is introduced to presentthe point-based features. At the second step, the feature ofeach point cluster is constructed from the point-based featuresby the DDL-SCLDA. Finally, the points in the ALS pointcloud belonging to the specific categories are recognized byemploying the multipath AdaBoost classifiers on the point-cluster-based features. We have performed the experiments ondifferent complex ALS point clouds. The experimental resultsshow that our presented method outperforms other state-of-the-art methods such as those in [7] and [50]. Meanwhile, thesetting of the parameters in our method has little influences onthe classification performance, which means that the method isrobust to recognizing different point clouds.
In future work, we will improve the efficiency of our method.Moreover, inspired by [38], we plan to combine dictionarylearning through several pathways, utilizing multiple pointclusters [51] and encoding each point cluster through multiplepaths, to learn features through multiple paths to further en-hance the classification accuracy.
This article has been accepted for inclusion in a future issue of this journal. Content is final as presented, with the exception of pagination.
ZHANG et al.: DISCRIMINATIVE-DICTIONARY-LEARNING-BASED MULTILEVEL POINT-CLUSTER FEATURES 13
REFERENCES
[1] A. Fawzi, M. Davies, and P. Frossard, “Dictionary learning for fast classi-fication based on soft-thresholding,” Int. J. Comput. Vis., vol. 114, no. 2,pp. 306–321, Sep. 2015.
[2] H. V. Nguyen, H. T. Ho, V. M. Patel, and R. Chellappa, “Joint hierarchicaldomain adaptation and feature learning,” IEEE Trans. Image Process.,vol. 24, no. 12, pp. 5479–5491, Dec. 2015.
[3] S. Mei, M. He, Y. Zhang, Z. Wang, and D. Feng, “Improvingspatial–spectral endmember extraction in the presence of anomalousground objects,” IEEE Trans. Geosci. Remote Sens., vol. 49, no. 11,pp. 4210–4222, Nov. 2011.
[4] N. Dalal and B. Triggs, “Histograms of oriented gradients for humandetection,” in Proc. IEEE Conf. Comput. Vis. Pattern Recognit., Jun. 2005,vol. 1, pp. 886–893.
[5] D. G. Lowe, “Distinctive image features from scale-invariant keypoints,”Int. J. Comput. Vis., vol. 60, no. 2, pp. 91–110, Nov. 2004.
[6] J. Niemeyer, C. Mallet, F. Rottensteiner, and U. Soergel, “Conditionalrandom field for the classification of lidar point clouds,” Int. Arch.Photogramm., Remote Sens. Spatial Inf. Sci., vol. 38, (Part 4/W19)(on CD-ROM), Aug. 2012.
[7] Z. Wang et al., “A multiscale and hierarchical feature extrac-tion method for terrestrial laser scanning point cloud classification,”IEEE Trans. Geosci. Remote Sens., vol. 53, no. 5, pp. 2409–2425,May 2015.
[8] E. H. Lim and D. Suter, “Multi-scale conditional random fields for over-segmented irregular 3D point clouds classification,” in Proc. IEEE Comp.Soc. Conf. Comput. Vis. Pattern Recognit. Workshops, Anchorage, AK,USA, 2008, pp. 1–7.
[9] E. H. Lim and D. Suter, “3D terrestrial LIDAR classifications with super-voxels and multi-scale conditional random fields,” Comput. Aided Des.,vol. 41, no. 10, pp. 701–710, Oct. 2009.
[10] A. K. Aijazi, P. Checchin, and L. Trassoudaine, “Segmentation basedclassification of 3D urban point clouds: A super-voxel based ap-proach with evaluation,” Remote Sens., vol. 5, no. 4, pp. 1624–1650,Mar. 2013.
[11] L. Truong-Hong, D. F. Laefer, T. Hinks, and H. Carr, “Combining an anglecriterion with voxelization and the flying voxel method in reconstructingbuilding models from LiDAR data,” Comput.-Aided Civil Infrastruct.Eng., vol. 28, no. 2, pp. 112–129, Feb. 2013.
[12] H. B. Kim and G. Sohn, “Random forests-based multiple classifier sys-tem for power-line scene classification,” Int. Arch. Photogramm., RemoteSens. Spatial Inf. Sci., vol. 38, (Part 5/W12) (on CD-ROM), 2011.
[13] M. Lehtomaki et al., “Object classification and recognition from mobilelaser scanning point clouds in a road environment,” IEEE Trans. Geosci.Rem. Sens., vol. 54, no. 2, pp. 1226–1239, Oct. 2015, doi: 10.1109/TGRS.2015.2476502.
[14] S. K. Lodha, D. M. Fitzpatrick, and D. P. Helmbold, “Aerial lidar dataclassification using adaboost,” in Proc. Int. Conf. 3-D Digital ImagingModel., Montreal, QC, Canada, 2007, pp. 435–442.
[15] T. Kohonen, “Improved versions of learning vector quantization,” in Proc.IJCNN, 1990, vol. 1, pp. 545–550.
[16] Z. Wang, N. Nasrabadi, and T. Huang, “Spatial–spectral classification ofhyperspectral images using discriminative dictionary designed by learningvector quantization,” IEEE Trans. Geosci. Remote. Sens., vol. 52, no. 8,pp. 4808–4822, Aug. 2013.
[17] J. Yang, K. Yu, and T. Huang, “Supervised translation-invariant sparsecoding,” in Proc. Int. Conf. Comput. Vis. Pattern Recognit., Jun. 2010,pp. 3517–3524.
[18] J. Mairal, F. Bach, and J. Ponce, “Task-driven dictionary learning,”IEEE Trans. Pattern Anal. Mach. Intell., vol. 34, no. 4, pp. 791–804,Apr. 2012.
[19] N. Zhou, Y. Shen, J. Peng, and J. Fan, “Learning inter-related visualdictionary for object recognition,” in Proc. Int. Conf. Comput. Vis. PatternRecognit., Jun. 2012, pp. 3490–3497.
[20] M. Yang, L. Zhang, X. Feng, and D. Zhang, “Sparse representation basedFisher discrimination dictionary learning for image classification,” Int. J.Comput. Vis., vol. 109, no. 3, pp. 209–232, 2014.
[21] G. Karol and Y. LeCun, “Learning fast approximations of sparse coding,”in Proc. Int. Conf. Mach. Learn., 2010, pp. 1–8.
[22] Z. Jiang, Z. Lin, and L. S. Davis, “Label consistent K-SVD: Learninga discriminative dictionary for recognition,” IEEE Trans. Pattern Anal.Mach. Intell., vol. 35, no. 11, pp. 2651–2664, Nov. 2013.
[23] L. Shen, G. Sun, Q. Huang, Z. Lin, and E. Wu, “Multi-level discrimi-native dictionary learning with application to large scale image classi-fication,” IEEE Trans. Image Process., vol. 24, no. 10, pp. 3109–3123,Oct. 2015.
[24] M. Weinmann, B. Jutzi, and C. Mallet, “Feature relevance assessmentfor the semantic interpretation of 3D point cloud data,” in Proc. ISPRSAnn. Photogramm., Remote Sens., Spatial Inf. Sci., 2013, vol. II-5/W2,pp. 1–6.
[25] M. Weinmann, S. Urban, S. Hinz, B. Jutzi, and C. Mallet, “Distinctive 2Dand 3D features for automated large-scale scene analysis in urban areas,”Comput Graph., vol. 49, pp. 47–57, Jun. 2015.
[26] B. C. Russell, W. T. Freeman, A. A. Efros, J. Sivic, and A. Zisserman,“Using multiple segmentations to discover objects and their extent inimage collections,” in Proc. IEEE Comp. Soc. Conf. Comput. Vis. PatternRecognit., New York, NY, USA, 2006, pp. 1605–1614.
[27] J. Xiao and L. Quan, “Multiple view semantic segmentation for streetview images,” in Proc. IEEE Int. Conf. Comput. Vis., Kyoto, Japan, 2009,pp. 686–693.
[28] N. Brodu and D. Lague, “3D terrestrial lidar data classification of com-plex natural scenes using a multi-scale dimensionality criterion: Applica-tions in geomorphology,” ISPRS J. Photogramm. Remote Sens., vol. 68,pp. 121–134, Mar. 2012.
[29] S. Xu, G. Vosselman, and S. Elberink, “Multiple-entity based clas-sification of airborne laser scanning data in urban areas,” ISPRS J.Photogramm. Remote Sens., vol. 88, pp. 1–15, Feb. 2014.
[30] Y. Gu, Q. Wang, X. Jia, and J. A. Benediktsson, “A novel MKLmodel of integrating LiDAR data and MSI for urban area classification,”IEEE Trans. Geosci. Remote Sens., vol. 53, no. 10, pp. 5312–5326,Oct. 2015.
[31] J. Rau, J. Jhan, and Y. Hsu, “Oblique aerial images for land cover andpoint cloud classification in an urban environment,” IEEE Trans. Geosci.Remote Sens., vol. 53, no. 3, pp. 1304–1319, Mar. 2015.
[32] S. Bengio, J. Weston, and D. Grangier, “Label embedding trees forlarge multiclass task,” in Proc. Adv. Neural Inf. Process. Syst., 2010,pp. 163–171.
[33] T. Gao and D. Koller, “Discriminative learning of relaxed hierarchy forlarge-scale visual recognition,” in Proc. IEEE Int. Conf. Comput. Vis.,Nov. 2011, pp. 2072–2079.
[34] R. Salakhutdinov, A. Torralba, and J. Tenenbaum, “Learning to sharevisual appearance for multiclass object detection,” in Proc. Int. Conf.Comput. Vis. Pattern Recognit., Jun. 2011, pp. 1481–1488.
[35] L. Zhou, Z. Zhou, and D. Hu, “Scene classification using amulti-resolution bag-of-features model,” Pattern Recognit., vol. 46,pp. 424–433, Jan. 2013.
[36] L. Bo, X. Ren, and D. Fox, “Hierarchical matching pursuit for imageclassification: Architecture and fast algorithms,” in Proc. Adv. Neural Inf.Process. Syst., Dec. 2011, pp. 2115–2123.
[37] K. Yu, Y. Lin, and J. Lafferty, “Learning image representations from thepixel level via hierarchical sparse coding,” in Proc. Int. Conf. Comput. Vis.Pattern Recognit., Jun. 2013, pp. 1713–1720.
[38] L. Bo, X. Ren, and D. Fox, “Multipath sparse coding using hierarchicalmatching pursuit,” in Proc. Int. Conf. Comput. Vis. Pattern Recognit.,Jun. 2013, pp. 660–667.
[39] A. E. Johnson and M. Hebert, “Using spin images for efficient objectrecognition in cluttered 3D scenes,” IEEE Trans. Pattern Anal. Mach.Intell., vol. 21, no. 5, pp. 433–449, May 1999.
[40] H. Gross and U. Thoennessen, “Extraction of lines from laser pointclouds,” in Proc. Photogramm. Image Anal., Bonn, Germany, 2006,pp. 87–91.
[41] M. Aharon, M. Elad, and A. Bruckstein, “K-SVD: An algorithm for de-signing overcomplete dictionaries for sparse representation,” IEEE Trans.Signal Process., vol. 54, no. 1, pp. 4311–4322, Nov. 2006.
[42] H. Lee, A. Battle, R. Raina, and A. Y. Ng, “Efficient sparse codingalgorithms,” Proc. Adv. Neural Inf. Process. Syst., 2007, pp. 801–808.
[43] D. Chen, L. Zhang, Z. Wang, and H. Deng, “A mathematical morphology-based multi-level filter of LiDAR data for generating DTMs,” Sci. Chin.Inf. Sci., vol. 56, no. 10, pp. 1–14, Oct. 2013.
[44] Y. Boykov, O. Veksler, and R. Zabih, “Fast approximate energy minimiza-tion via graph cuts,” IEEE Trans. Pattern Anal. Mach. Intell., vol. 23,no. 11, pp. 1222–1239, Nov. 2001.
[45] J. Shi and J. Malik, “Normalized cuts and image segmentation,”IEEE Trans. Pattern Anal. Mach. Intell., vol. 22, no. 8, pp. 888–905,Aug. 2000.
[46] G. Golub, P. Hansen, and D. O’leary, “Tikhonov regularization and totalleast squares,” SIAM J. Matrix Anal. Appl., vol. 21, no. 1, pp. 185–194,1999.
[47] D. M. Blei, A. Y. Ng, and M. I. Jordan, “Latent Dirichlet allocation,”J. Mach. Learn. Res., vol. 3, pp. 993–1022, 2003.
[48] M. Cramer, “The DGPF test on digital aerial camera evaluation—Overview and test design,” Photogramm.-Fernerkundung-Geoinf., vol. 2,pp. 73–82, Jan. 2010.
This article has been accepted for inclusion in a future issue of this journal. Content is final as presented, with the exception of pagination.
14 IEEE TRANSACTIONS ON GEOSCIENCE AND REMOTE SENSING
[49] J. Yang, K. Yu, Y. Gong, and T. Huang, “Linear spatial pyramid match-ing using sparse coding for image classification,” in Proc. IEEE CVPR,Jun. 2009, pp. 1794–1801.
[50] B. Guo, X. Huang, F. Zhang, and G. Sohn, “Classification of airborne laserscanning data using JointBoost,” ISPRS J. Photogramm. Remote Sens.,vol. 100, pp. 71–83, Feb. 2015.
[51] Z. Zhang et al., “A multi-level point cluster-based discriminative featurefor ALS point cloud classification,” IEEE Trans. Geosci. Remote. Sens.,vol. 54, no. 6, pp. 3309–3321, Jun. 2016.
Zhenxin Zhang is currently working toward thePh.D. degree in geoinformatics with the State KeyLaboratory of Remote Sensing Science, Schoolof Geography, Beijing Normal University, Beijing,China.
His research interests include light detectionand ranging data processing, quality analysis ofgeographic information systems, and algorithmdevelopment.
Liqiang Zhang received the Ph.D. degree in geoin-formatics from the Institute of Remote Sensing Ap-plications, Chinese Academy of Sciences, Beijing,China, in 2004.
He is currently a Professor with the State KeyLaboratory of Remote Sensing Science, Schoolof Geography, Beijing Normal University, Beijing,China. His research interests include remote sens-ing image processing, 3-D urban reconstruction, andspatial object recognition.
Xiaohua Tong received the Ph.D. degree fromTongji University, Shanghai, China, in 1999.
Between 2001 and 2003, he worked as a Postdoc-toral Researcher with the State Key Laboratory ofInformation Engineering in Surveying, Mapping andRemote Sensing, Wuhan University, Wuhan, China.In 2006, he was a Research Fellow with The HongKong Polytechnic University, Hong Kong. Between2008 and 2009, he was a Visiting Scholar with theUniversity of California, Santa Barbara, CA, USA.He is currently with the School of Surveying and
Geo-informatics, Tongji University. He is a Chang-Jiang Scholar Chair Profes-sor appointed by the Ministry of Education, China. He is the author of more than40 publications in international journals. His current research interests includeremote sensing, geographic information systems, trust in spatial data, imageprocessing for high resolution, and hyperspectral images.
Dr. Tong serves as the Vice Chair of the Commission on Spatial Data Qualityof the International Cartographical Association and the Co-Chair of the ISPRSWorking Group (WG II/4) on Spatial Statistics and Uncertainty Modeling. Hereceived the State Natural Science Award (Second Place) from the State Councilof the Peoples’ Republic of China in 2007 and the National Natural ScienceFunds for Distinguished Young Scholar in 2013.
Bo Guo received the Ph.D. degree from WuhanUniversity, Wuhan, China, in 2014.
He is currently a Postdoctoral Researcher with theKey Laboratory for Geo-Environment Monitoring ofCoastal Zone of the National Administration of Sur-veying, Mapping and GeoInformation and ShenzhenKey Laboratory of Spatial Smart Sensing and Ser-vices, Shenzhen University, Shenzhen, China. Hisresearch interests include applications of laser scan-ning point cloud on photogrammetry and computervision.
Liang Zhang is currently working toward the Ph.D.degree with the State Key Laboratory of RemoteSensing Science, School of Geography, BeijingNormal University, Beijing, China.
His research interests include remote sensing im-agery processing and 3-D urban modelling.
Xiaoyue Xing is currently working toward the Bach-elor’s degree with the State Key Laboratory of Re-mote Sensing Science, School of Geography, BeijingNormal University, Beijing, China.
Her research interests include terrestrial laserscanning point-cloud processing.