ied d ad e2'7 085 - defense technical information center · 'din"clasr1131 f ied d...
TRANSCRIPT

- '- '''• -I Ik: u
'DiN"CLASr1131 F IED D
AD E2'7 085
ED:! S.RVICES TECHNICAL INFORMATION AGENCYARLINGTON HALL STATIONARLINGTON 12, VIRGINIA
Ti 1[CLAS"SIEHED

NOTICE: When government or other dravings., speci-fications or other data are used for any purWseother zhan in connection with a definitely relatedgovernment procurement operation, the U. S.Government thereby incurs no responsibility, nor anyobligation whatsoever; and the fact that the Govern-ment may have formmilated., furnished, or in any waysupplied the said drawings, specifi cat, ions, or otherdata is not to be regarded by implication or other-wise as in any manner licensing the holder or any
other person or corporation, or conveying any rightsor permission to manufacture, use or sell anypatented invention that may in any way be relatedthereto.
T H E/j
ANTENNALABORATORY
RESEARCH ACTIVITIES' in ---
,utonzait C(oenrol/ Antenina Ecbo Area SudiesMicrow'ae Circuits Astronautics E M Field Theory-Tr,.rin, In,, ,oi.,, Iio,, R,,aor, !jystepn Analy'.1" (re Propagaition Submilmiwter Applications
C/:)
(• 1 Final Engineering Report, Vol. I"December 1959 to 30 November 1960 JUN 6 19ph
SCgs- Study of Unique Detection Techniques
Contract AF 33(616)-6849
J Task Number 62821
S1040-1 1 December 1960
Department of ELECTRICAL ENGINEERING
!THE OHIO STATE UNIVERSITY
'D RESEARCH FOUNDATIONI Columbus Ohio

I
F REPORT 1040-1
REPORT
by
THE OHIO STATE UNIVERSITY RESEARCH FOUNDATION
COLUMBUS 12, OHIO
Cooperator Air Research and Development CommandWright Air Development DivisionWright-Patterson Air Force Base, Ohio
L- Contract AF 33(616)-6849
lTask Number 62821
Investigation of Study of Unique Detection Techniques.--
V Subject of Report Final Engineering Report, Vol.. I1 December 1959 to 30 November 1960
Submitted by Antenna LaboratoryDepartment of Electiical Engineering
Date 1 December 1960
1040-1
L

ABSTRACT
Detectors of "action at a distance" phenomena are consideredwith special attention given to biologic detectors. Emphasis is onsensitivity and representative detectors are compared in terms ofquantum efficiency. Two experimental detectors are described andother detection schemes are suggested. Superregeneration isextended to the D.C. care where it is compared with the behaviorof nerve membrane. It is concluded that detectors based on quantum.mechanical principles offer the ultimate in sensitivity and frequencyrange while detectors baaed on neurophysiological schemes offer theultimate in small size and high gain.
1040-1 ii
I"I
TABLE OF CONTENTS
Page
1. INTRODUCTION 1
II. THEORETICAL LIMITS OF DETECTABILITY 8
III. EXPERIMENTAL DETECTORS 8
A. Microwave/Optical Detector 8B. Microwave/Mechanical Detector 14
IV. OTHER SUGGESTED DETECTION SCHEMES 16
A. Gravitational Dipole 16B. Thermoluminescent X- and y-
Radiation.. Detector 17
C. Microwave String Galvanometer 18D. Secondary Emission Amplifier 18E. Detectors based on Physiological Methods 18
F. Superregeneration 22G. Simplification For Pulsed Radars 25
V. CONCLUSIONS AND RECOMMENDATIONS 26
VI. A MACROSCOPIC ANALYSIS OF THE FARADAY-ROTATION MICROWAVE DETECTOR by DR.W.S.C. CHANG 27
VII. BIBLIOGRAPHY AND REFERENCES 35
VIII. ACKNOWLEDGEMENTS 38
1040-1. iii

STUDY OF UNIQUE DETECTION TECHNIQUES
I. INTRODUCTION
Detection is defined as the finding out, or discovery, of whatwas concealed. In this study the purpose is to investigate newdetectors or detection techniques for surveillance applications.
Because surveillance generally implies detection- some distance,this study has been restricted to those emanations involving the"1action at a distance" principle. These include:
Emanations Quantities to be detected
Electromagnetic Radiation intensityGravitational Radiation Spectral compositionAcoustic Waves Spatial compositionParticle or Vapor Emission Polarization
Velocity rangeChemical composition
Detectors Detection methods
Electrical Continuous /discontinuousChemical Active/passiveBiologicalMechanical
- Some of the emanations listed may be interdependent. Forexample it is possible, in theory at least, to detect the presence ofcontaminating particles in the atmosphere by their selectiveabsorption of electromagnetic radiation. On the other hand, thedependence of gravitational radiation on electromagnetic radiation isunknown. The only known gravitational fields have insignificant time-varying components, but there is a faint possibility that gravitationalwaves can be generated in much the same way as electromagneticwaves provided that gravitational fields propagate at a finite velocity.*".
Acoustic waves are those waves which propagate in elastic media,including such disturbances as sound waves, seismic waves, and bombblast disturbances. It is possible to detect these waves by electro-
magnetic means through the changes in ionization potential despite the
"See Sec. IIIA.
1040-1 1

fact that the better detectors use mechanical motion as an intermediatestep in the detection of these waves.
In considering the quantities to be detected, the intensity is ofparamount importance thus, in this study it is taken as the primarycriterion of successful detectors. That is, whether a detector is ofany value or not depends primarily on the revelation of the hiddenemanation. The ability of the detector to make spatial and temporalcorrelations is of only secondary importance. Because of thefundamental nature of electromagnetic radiation and also the recentsuccesses in devising sensitive detectors for it, an effort is made tostudy the theoretical limit of detectability in the electromagneticspectrum in terms of the quantum nature of radiation. Theclassification of the types of detectors listed is also quite arbitrary.For example the diode is considered as an electrical detector ofelectromagnetic fields, yet the force on the electrons in the spacebetween anode and cathode is mechanical. Perhaps a better examplewould be the nerve tissue which normally is considered as a basicelement of biological detectors. Here a thin membrane, sele~tivelypermeable to the ions of the solutions in which it is immersed, main-tains a polarizing voltage which depends on the relative ion concentra-tions on either side. To initiate a local response (i.e. , nerve impulse)the ionic concentration at a single point is altered in such a way thatthe membrane abruptly switches polarization direction from (-) to(+) on the interior of the membrane, so that the disturbance travelsalong the nerve fiber. Although this scheme is common to allanimals in nature, it cannot properly be called either a mechanical,a chemical, or an electrical detector even though all of these stimulican trigger the local response through a change in the ionic concentra.-tion. In this way all of the senses except vision can be explained ---for vision an additional photochemical reaction is involved with asensitivity so high that the quantum detection probability at the retinaapproaches one in five.(1)
After many different methods of detection are examined, itbecomes apparent that a given detection system such as a sonar systemor a microwave radiometer involves long chains of detectors, butonly a small number of general detection methods. For example, the
scintillation counter detects single primary events by converting thernto light flashes; a second detector converts the light flashes to pulsesof free electrons; these electrons are detected by a secondaryemission multiplier used as an amplifier, the resulting currentpulses are then detected by a galvanometer, counter, oscilloscope,or pillse analyzer; each of which contain chains of detectors and each
1040-1 2
ISof which is only a link in the chain between the original stimulus and
the human who is trying to detect it. These detection methods arebased on only two classifications: (1) whether the- input/outputfunction is continuous or intermittent, and (4) whether or not anauxiliary source of energy is required.
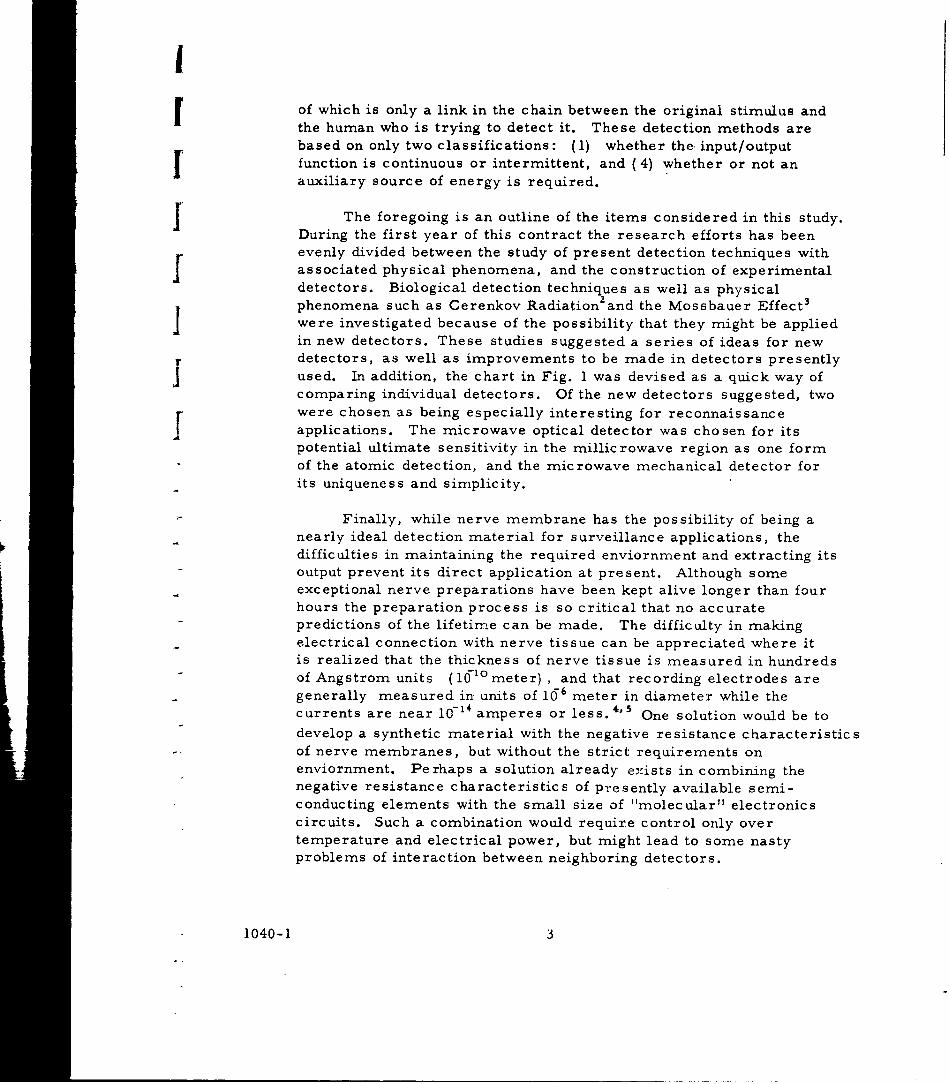
SThe foregoing is an outline of the items considered in this study.During the first year of this contract the research efforts has beenevenly divided between the study of present detection techniques withassociated physical phenomena, and the construction of experimentaldetectors. Biological detection techniques as well as physicalphenomena such as Cerenkov Radiation2and the Mossbauer Effect 3
I were investigated because of the possibility that they might be appliedin new detectors. These studies suggested a series of ideas for newdetectors, as well as improvements to be made in detectors presentlyused. In addition, the chart in Fig. 1 was devised as a quick way ofcomparing individual detectors. Of the new detectors suggested, twowere chosen as being especially interesting for reconnaissanceapplications. The microwave optical detector was chosen for itspotential ultimate sensitivity in the millicrowave region as one formof the atomic detection, and the microwave mechanical detector forits uniqueness and simplicity.
Finally, while nerve membrane has the possibility of being anearly ideal detection material for surveillance applications, thedifficulties in maintaining the required enviornment and extracting itsoutput prevent its direct application at present. Although someexceptional nerve preparations have been kept alive longer than fourhours the preparation process is so critical that no accuratepredictions of the lifetime can be made. The difficulty in makingelectrical connection with nerve tissue can be appreciated where itis realized that the thickness of nerve tissue is measured in hundredsof Angstrom units (10-ometer) , and that recording electrodes aregenerally measured in units of 106 meter in diameter while thecurrents are near 10-14 amperes or less. 4,5 One solution would be todevelop a synthetic material with the negative resistance characteristicsof nerve membranes, but without the strict requirements onenviornment. Perhaps a solution already exists in combining thenegative resistance characteristics of presently available semi-conducting elements with the small size of "molecular" electronicscircuits. Such a combination would require control only overtemperature and electrical power, but might lead to some nastyproblems of interaction between neighboring detectors.
1040-1 3

10
I0
W 5
-O10 4
3 0 0
-10 Noise Power-20 Unit Bond Width10 kTB (T =300° K)
-30
CA
-100
-10
30-
10
LightPowe n Communications + hInfr-red ltro-violet X-Roy Gamma +
" Audio • Mlicrowave, -- "-Cosmic Rays
-0 5 0 15 20 2510 I0 10 10 !0 10
Frequency (cps)
Fig. 1. Frequency vs. Minirnurn Detectable Energy For Detectors ofE-M Radiation.
1040-1 4
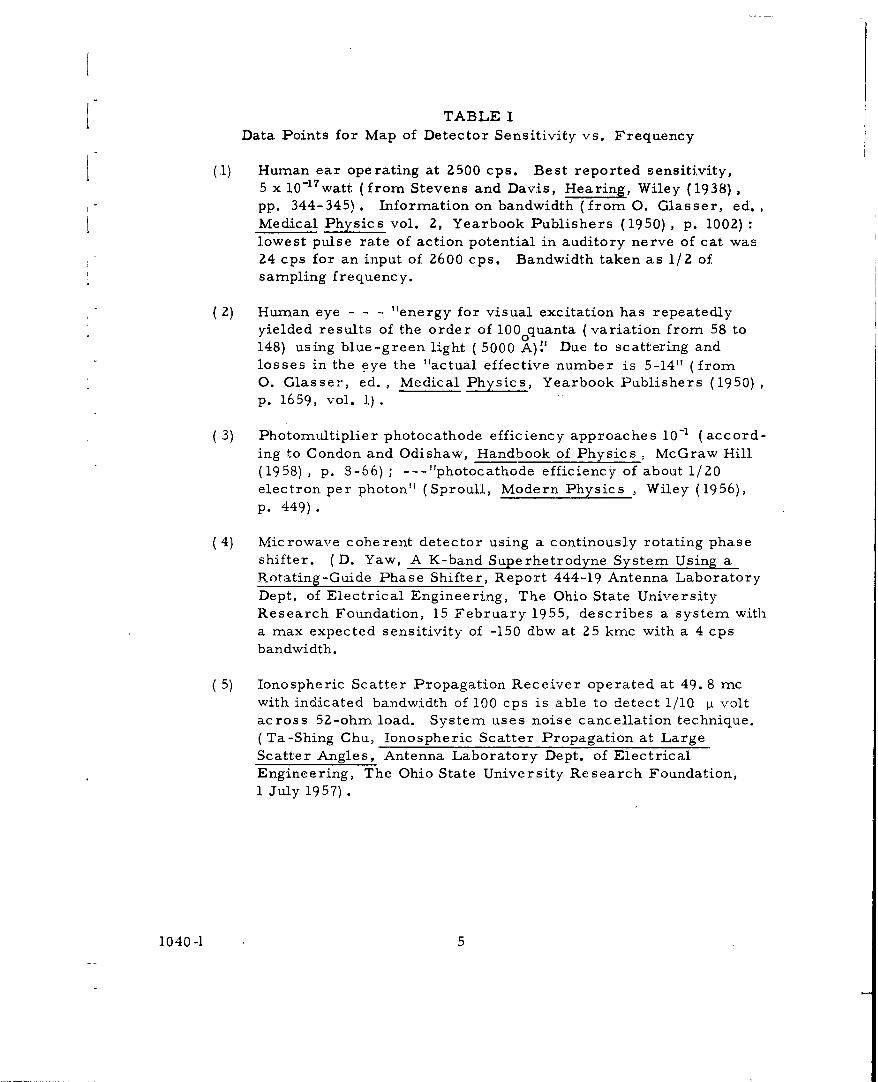
TABLE IData Points for Map of Detector Sensitivity vs. Frequency
(1) Human ear operating at 2500 cps. Best reported sensitivity,5 x 10l 1 7 watt (from Stevens and Davis, Hearing, Wiley (1938),
pp. 344-345). Information on bandwidth (from 0. Glasser, ed.,Medical Physics vol. 2, Yearbook Publishers (1950), p. 1002):lowest pulse rate of action potential in auditory nerve of cat was24 cps for an input of 2600 cps. Bandwidth taken as 1/2 ofsampling frequency.
(2) Human eye - - - "energy for visual excitation has repeatedlyyielded results of the order of 100 quanta (variation from 58 to148) using blue-green light ( 5000 A)'.' Due to scattering andlosses in the eye the "actual effective number is 5-14" (from0. Glasser, ed. , Medical Physics, Yearbook Publishers (1950)p. 1659, vol. 1)
(3) Photomultiplier photocathode efficiency approaches 10-1 (accord-
ing to Condon and Odishaw, Handbook of Physics, McGraw Hill(1958) , p. S-66) ; --- "photocathode efficiency of about 1/20electron per photon" (Sproull, Modern Physics , Wiley (1956),
p. 449).
(4) Microwave coherent detector using a continously rotating phaseshifter. (D. Yaw, A K-band Superhetrodyne System Using a
Rotating-Guide Phase Shifter, Report 444-19 Antenna LaboratoryDept. of Electrical Engineering, The Ohio State University
Research Foundation, 15 February 1955, describes a system witha max expected sensitivity of -150 dbw at 25 kmc with a 4 cpsbandwidth.
(5) Ionospheric Scatter Propagation Receiver operated at 49. 8 mcwith indicated bandwidth of 100 cps is able to detect 1/10 ýt voltacross 52-ohm load. System uses noise cancellation technique.(Ta-Shing Chu, Ionospheric Scatter Propagation at LargeScatter Angles, Antenna Laboratory Dept. of ElectricalEngineering, The Ohio State University Research Foundation,
1 July 1957).
1040-1 5

(6) Chopper-stabilized DC amplifier -- Hewlett-Packard Model425A can detect better than 1 ýtV across 1 megohm atfrequencies below 0. 2 cps using optical chopping system.
(7),(8),( 9) Obtained from reference (4) . (7) is for 1N26 crystalrectifier operated at 25 kmc followed by a 1000-cps amplifierwith a 4-cps bandwidth. Sensitivity of -100 dbw is reported.
(8) Barretter operating at 10 kmc followed by 1000-cpsamplifier whose bandwidth is 4 cps giving a 90 dbw sensitivityusing Type 614 bolometer. (9) Synchronous detection using ahybrid tee and a narrow-band audio amplifier with a 4-cpsband-pass gave -144 dbw.
(10) Golay detector sensitivity 6 x 10-11 watts RMS Equivalent Noise
Input. Time constant 1.6 sec, flat from microwave to ultra-violet (advertisment from Proc. IRE 47, 9 p. 64A, September1959 for Eppley Laboratories Inc. , Newport R. I.)
(11) PbTe detector of 4. 3 microns, 7 x 10' 2watts. S/N ratio unity( ?) operated at 77 0 K. 1-cps bandwidth at 800 cps (advertismentin Proc. IRE 47, 9 p. 53A September 1959 for Honeywell
Military Products Group Hopkins, Minnesota)
(12) J. Taylor and W. Parrish, "Aborption and Counting EfficiencyData for X-ray Detectors," Rev. Sci. Inst. vol. 26 #24 p.367-373 April 1955, present data on relative efficiency of G-Mproportional, and scintillation counters showing that
scintillation counters are best detectors of X-rays with 90%to 99% efficiency.
(13) M. Uenohara and W. M. Sharpless, "An Extremely Low-Noise6-Kmc Parametric Amplifier Using Point-Contact Diodes,"Proc. IRE, 47 p. 2114-2115: The device noise figure measured
at 900 K for double-sideband operation was 0. 3 db, whichrepresents an excess noise figure of 210 K.
(14) Arams and Okwit, "'Packaged Tunable L-band Maser System"Proc. IRE 48 p. 866-874: ruby maser operated at 1. 50 K-- system noise factor of 0. 5 db corresponds to 350 K.
1040-1 6

(15) DeGrasse, R. W., and Scovil, H.E.D., "Noise Temperature"Measurement on a Traveling Wave Maser, " Appl. Phys. 31,p. 443;' average system noise temperature over 37 measure-ments in 30 minutes was 10. 70 K at 5. 815 Kmc.
(16) Lelevie, Bogljub, "Criteric For Choice of a SuperconductingBolometer" p.1234, Appl. Phys. 31, July 1960: "--possibleto measure down to 0PS watt using superconducting bolometercontrolled to 10-5 degree.
1040-1 7

II. Theoretical Limits of Detectability
In the graph shown in Fig. 1 an attempt is made to assess thesensitivity of presently known detectors in terms of a theoreticalstandard. By comparing the minimum detectable energy per unitbandwidth per second with the power represented by one quantum persecond per unit bandwidth, a measure of the quantum efficiency maybe obtained. The addition of a frequency scale for the abcissaprovides a two-dimensional map on which each detector can be plottedas a point or z s a line. From this map it can be seen that fewdetectors approach the limiting sensitivity of one quantum /second;and of those that do, only the maser and the parametric amplifierprovide any great improvement in energy sensitivity over previous
detectors. In the range between 10 10 and 10 14 cps there is anobvious gap for which there are now no sensitive detectors, althoughthe recent application of an avalanche diode cooled to liquid nitrogentemperatures has been reported as a possible detector of individualinfrared photos. 6 Potentically, those detectors such as the maser,and the atomic devices which utilize quantum- mechanical techniques,can fill this gap. In general, this class of detectors 7 appears to bethe ultimate as far as sensitivity is concerned. One reason for thisis that these detectors depend on discrete quantum-mechanical inter-actions, while electronic detectors involve macroscopic interactionsbetween large numbers of quanta and large numbers of electrons.
III. Experimental Detectors
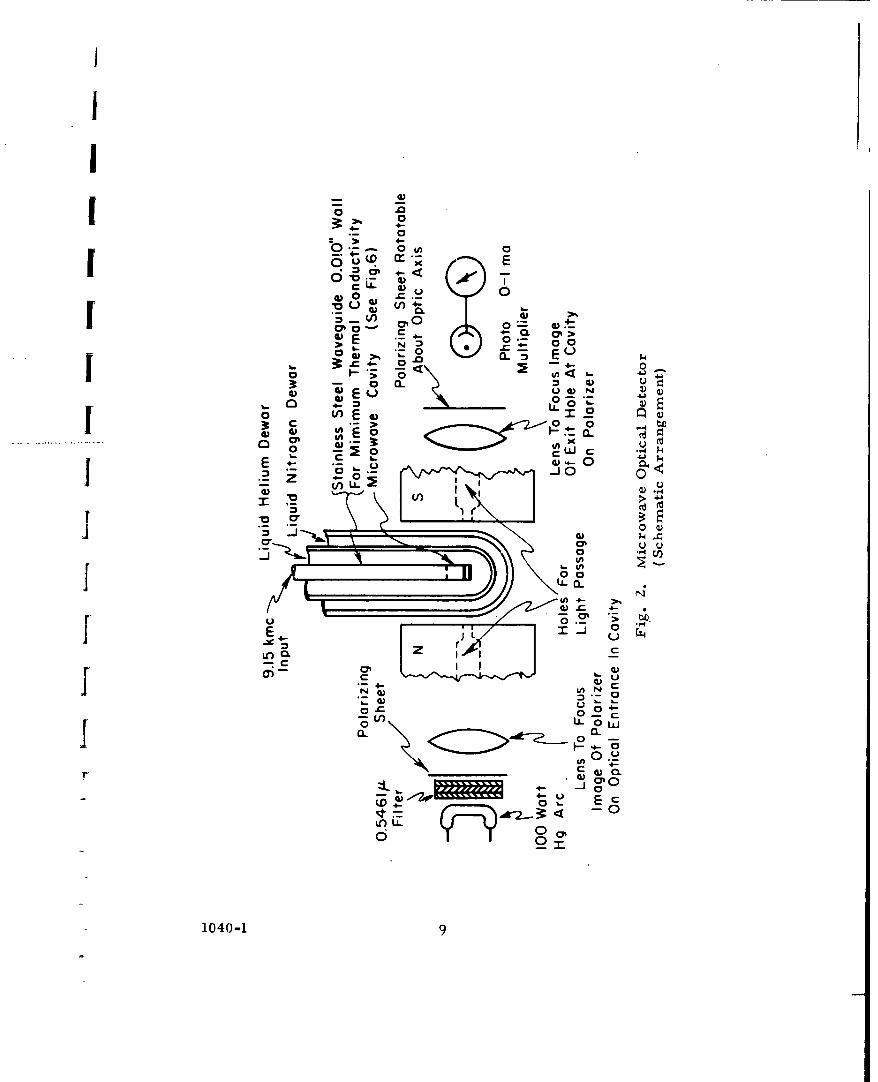
A. Microwave/Optical Detector
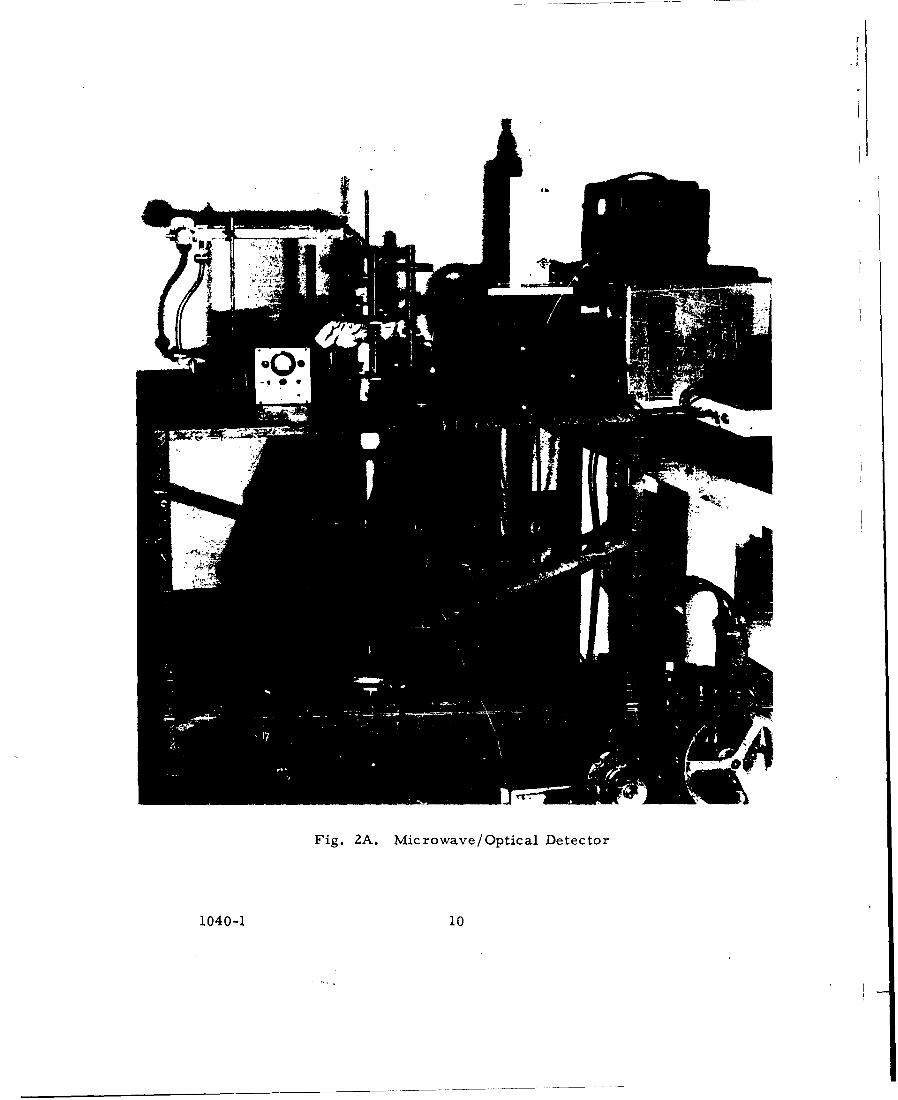
The schematic arrangement of this detector is shown inFig. 2 and a photograph of the apparatus is shown in Fig. 2 A.
It was adapted from the .nethod used by Daniels 8,910 and his coworkersat The University of British Columbia for the measurement of thespin lattice relaxation time in neodymium ethylsulphate. The physicalprinciple involves the change in Faraday rotation for light withchanges in the average magnetic moment of the crystal. The averagemagnetic moment, in turn, depends on the density of paramagneticion in the crystal, the external magnetic field intensity, the spintemperature, and the microwave energy absorbed by the crystalthrough paramagnetic resonance. This device is of interest primarilybecause it is fundamentally an atomic detector different from anydetector previously studied.
1040-1 8
.0
o.0 ao:, 05t(D E
76~ 0~. 01 t.4- CL 1
E 0. 00
0 C
--0Jd U J
w 0
ý: V
U4- u
00
1040-1 94
.. IA Dr
Fig. 2A. Microwave/ Optical Detector
1040-1 10

Like all the quantum electron devices proposed, it has thepotential of being a very sensitive detector'in the millimicrowaveregion. Furthermore, the understanding of such a detector may leadto other types of atomic detectors which will approach the sensitivity ofonequantum/second in Fig. 1. No macroscopic device will be able toreach such a high sensitivity because they depend upon the averageproperties of a uniform number of quanta. An analysis of this
detector is presented in Appendix I.
This detector (Fig. 2) can be considered as the combination ofan optical polarizing microscope and on electron paramagneticresonance spectrometer linked together by the crystal. The polarizingmicroscope or polarimeter consists of a mercury arc lamp with agreen line filter ( 0. 546 i) as the source, and a photomu1tiDlier as
the detector. Two polaroid discs are used as the polarizing material.The two lenses serve to focus between the polarizing planes and theoptically active crystal. The paramagnetic spectrometer consists ofan external magnetic field (up to 0. 8 weber/m 2 ) surrounding a doubledewar flask containing liquid nitrogen and liquid helium respectively,with the flask in turn enclosing a microwave cavity Wurj-d to 9.16 Kmc(see Fig. 6). A single crystal of the paramagnetic salt (.neodymiumethylsulphatb)is glued to the end of the cavity at the point of HP.F max
with its optic axis parallel to the Hdc. This assembly is then placedso that the crystal lies in the optical path of the polarimeter with theLight passing through holes in the magnet and cavity and through theunsilvered portions of the dewars.
In operation the current through the magnet is adjusted forminimum microwave reflection from the cavity (i.e. , paramagneticresonance) using the circuits of Figs. 3 and 5. (For a frequency -modulated system, a display similar to Fig. 4B can be obtained withan oscilloscope). This condition provides paramagnetic absorption of-he microwave radiation by the crystal, and the detector output can.:hen be determined by the microwave power vs. polarization anglecharacteristic, or by the change in photocurrent vs. small microwavesignals using fixed polarizers as analyzed in Appendix I.
No data on sensitivity have been obtained at this time; thepolarimeter is under construction. Furthermore, no large perfecti3ingle crystals are available, although many small crystals have beengrown. It is expected that this problem will be solved with theestablishment of more refined crystal-growning techniques. In orderi:o test for paramagnetic resonance, a small imperfect 100%
1040-1 11

*-Absorption Wavemeter
Matched F O- 50db Power ReflectedMatced Attenuator O bo From CavityAttenu or[4 30db Isolator
Klystron 0rýKlyston /Directional
S • Coupler7
20db ' BolometerCrossguide Power Meter ( 9.15 kmc CavityCoupler (55mw) With Crystal
Fig. 3. Microwave Optical Detector(Microwave Circuit)
Reflected Cavity + PoramagneticPower Resonance
.. 5u Watt
01r
I7m A .15 kmc4 7mc -Cavity Resonance(A) (B) (C)
Fig. 4. Paramagnetic Resonance Experiment
1040-1 12

I
Magnetic Coils
Ampi idyne
D C"Amplifier
Fig. 5. Microwave Optizal Detector-Magnet Power Supply
Inductive Iris Parting LineSolder
- Light Hole Top
S.200 And Bottom
IIoI
Stainless Brass Guide k. - Crystal O
Fig. 6. Microwave Optical Detector(Microwave Cavity)
1040-1 13

concentration. crystal of Neodymium ethylsulphate was used. Aftercooling the dewars the microwave circuit was arranged to give thedisplay shown in Fig. 4B. Adjustment of the magnet current betweer2 and5 amperes caused several large changes in both position and
amplitude of the cavity absorption line. There effects are indicatedin Fig. 4C. No saturation could be detected even with power levelsup to 5 x16 5 watt. Both of these effects, the lack of a single sharpabsorption line and failure to saturate, indicate that the paramagneticions in the crystal should be diluted and that the initial crystal mayhave a polycrystalline structure. It is estimated from the weightof the crystal that there are approximately 1057 spins in this crystal.It is expected that these problems will be solved in the near future,and that improvements can be made to establish the followingproperties during the coming year.
(a) The sensitivity and the noise figure of this microwaveoptical detector
(b) The discovery of a better material(c) The exact nature of the interactions between the
microwave fields and the optical fields, so thatthis detector can be generalized to include milli-microwave frequencies and other new schemesof quantum detection.
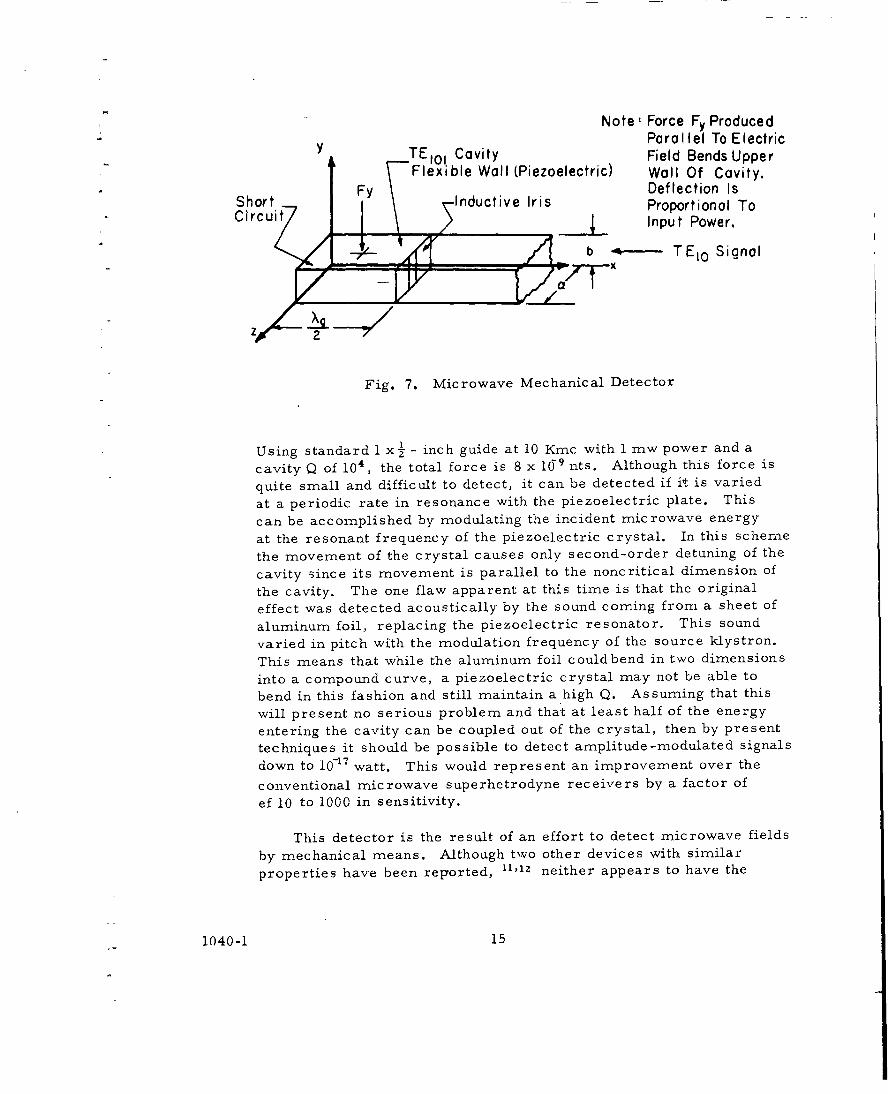
III. B. Microwave/Mechanical Detector
This detector is included more for its uniqueness than for anyadvance in sensitivity. A sketch of this detector is shown in Fig. 7.The microwave energy entering the detector is propagated in theTEm mode so that the E-field is parallel to the b dimension of the
guide. By enclosing the end of the guide in a cavity the electric fieldis multiplied by the Q of the cavity. The Coulomb force due to thiselectric field then distorts the piezo-electric wall of the cavity, and
the voltage between the piezo-electric plates becomes a measure ofthe microwave power. Assuming a rigid cavity the total force onthe cavity face for this type of detector is Eq. (1)
(1) F= QP/2wb
where Q is Q of the microwave cavity (unloaded),
P microwave power entering the cavity,W microwave frequency in rad/sec, andb guide dimension parallel to electric field.
1040-1 14
Note Force Fy ProducedParallel To Electric
S_._TE1o Cavity Field Bends UpperFlexible Wall (Piezoelectric) Wall Of Cavity.
"F_ Deflection IsShort FInductive Iris Proportional To
jici Input Power..,•b -* TE1o Signal
Fig. 7. Microwave Mechanical Detector
Using standard 1 x½ - inch guide at 10 Kmc with 1 mw power and a
cavity Q of 10 4 , the total force is 8 x 10⁹ nts. Although this force is
quite small and difficult to detect, it can be detected if it is varied
at a periodic rate in resonance with the piezoelectric plate. This
can be accomplished by modulating the incident microwave energy
at the resonant frequency of the piezoelectric crystal. In this scheme
the movement of the crystal causes only second-order detuning of the
cavity ,ince its movement is parallel to the noncritical dimension of
the cavity, The one flaw apparent at this time is that the original
effect was detected acoustically by the sound coming from a sheet of
aluminum foil, replacing the piezoelectric resonator. This sound
varied in pitch with the modulation frequency of the source klystron.
This means that while the aluminum foil couldbend in two dimensions
into a compound curve, a piezoelectric crystal may not be able to
bend in this fashion and still maintain a high Q. Assuming that this
will present no serious problem and that at least half of the energy
entering the cavity can be coupled out of the crystal, then by present
techniques it should be possible to detect amplitude-modulated signals
down to 10-17 watt. This would represent an improvement over the
conventional microwave superhetrodyne receivers by a factor of
ef 10 to 1000 in sensitivity.
This detector is the result of an effort to detect microwave fields
by mechanical means. Although two other devices with similar
properties have been reprorted, 11,12 neither appears to have the
1040-1 15
I
ultimate sensitivity and ruggedness of this detector. One objectionis that the microwave field must be modulated at the resonantfrequency of the crystal which might prevent its application in pulse
reception. Finally, this device is interesting because it behaves as anenergy transformer between the microwave field and the piezo-electric field.
IV. Other Suggested Detection Schemes
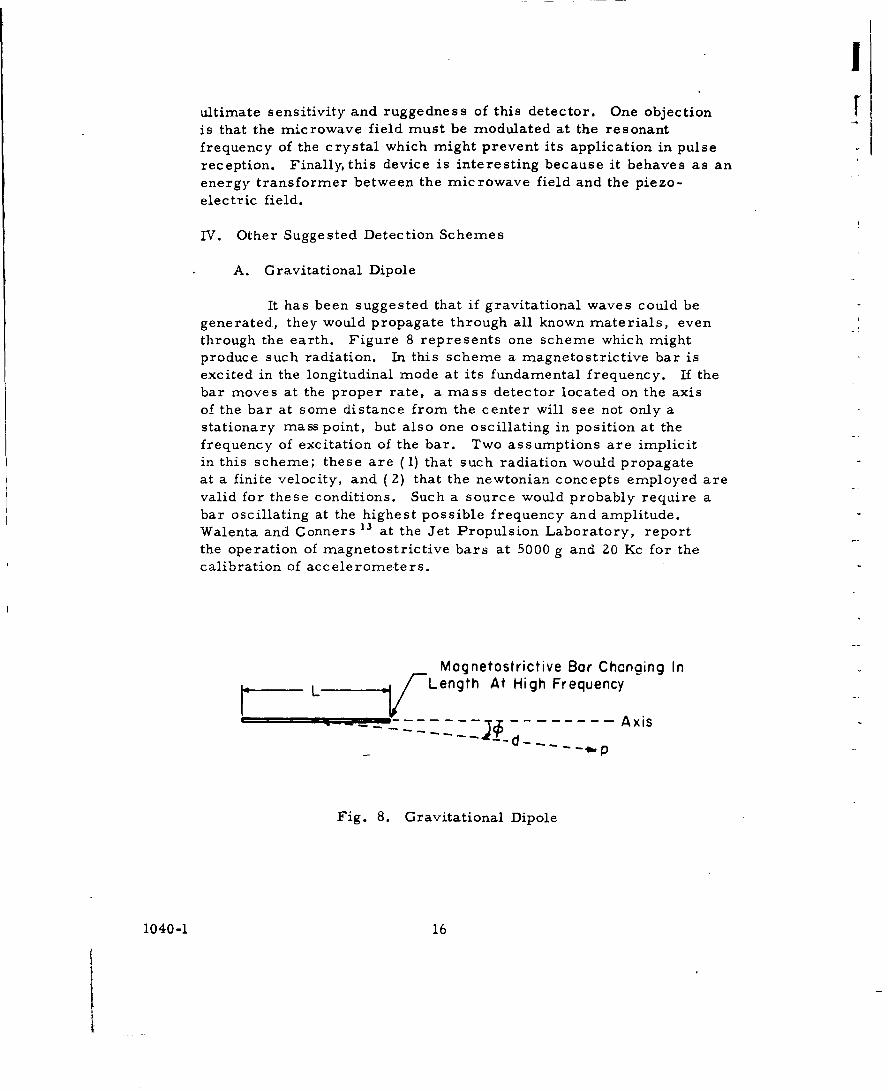
A. Gravitational Dipole
It has been suggested that if gravitational waves could begenerated, they would propagate through all known materials, eventhrough the earth. Figure 8 represents one scheme which mightproduce such radiation. In this scheme a magnetostrictive bar isexcited in the longitudinal mode at its fundamental frequency. If thebar moves at the proper rate, a mass detector located on the axisof the bar at some distance from the center will see not only astationary mass point, but also one oscillating in position at thefrequency of excitation of the bar. Two assumptions are implicitin this scheme; these are (1) that such radiation would propagateat a finite velocity, and (2) that the newtonian concepts employed arevalid for these conditions. Such a source would probably require abar oscillating at the highest possible frequency and amplitude.Walenta and Conners13 at the Jet Propulsion Laboratory, reportthe operation of magnetostrictive bars at 5000 g and 20 Kc for thecalibration of accelerometers.
Magnetostrictive Bar Chcnging In
S L Length At High Frequency
.. .. -Axis
Fig. 8. Gravitational Dipole
1040-1 16
I

I
B. Thermoluminescent X- and Y- Radiation Detector
In Fig. 9 a 'scheme is presented for the periodic measurementof accumulated X- and y - radiation as suggested by Winans andSeldin 15. In this detector the total photons emitted from thethermoluminescent material during the heating phase are proportionalto the integrated X- and y- radiation received in the interval sincethe material was last heated. This detector is of interest because it
Incoming\ High Energy Traps • xAnd ySzLow Energy Traps Photons
fLL F)
rI • Dielectric
100 200 300 400 500
T (0K)0.8°
Second Photo Detector
(a) (b)
Fig. 9. Thermoluminescent Detector of X-rays.
provides a potential method of detecting nuclear explosions in anarea covered only by a satellite. Its advantage over film dosimetersis that it can, be reused repeatedly, and its advantage over moreconventional detectors is that power is required only when readoutis desired. Such a device is now under development at The NavalResearch Laboratory, Washington, D. C. , for use as a personneldosimeter. 16
1040-1 17
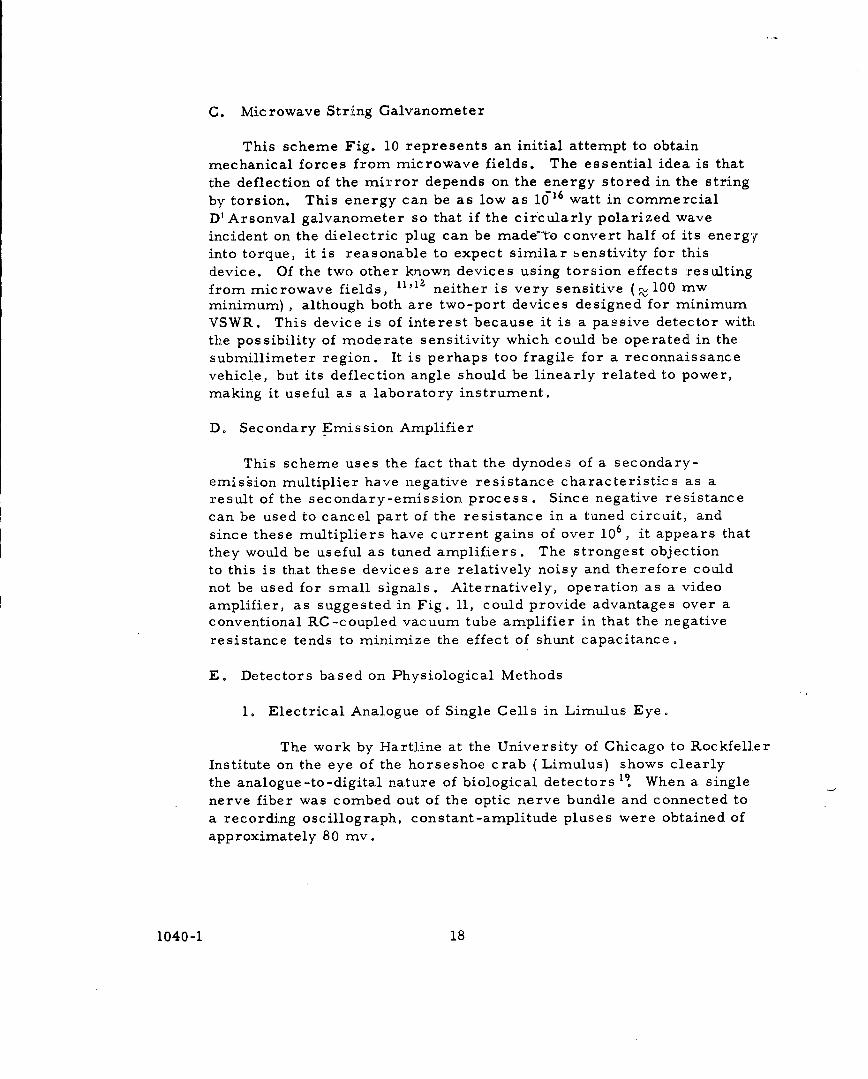
C. Microwave String Galvanometer
This scheme Fig. 10 represents an initial attempt to obtain
mechanical forces from microwave fields. The essential idea is that
the deflection of the mirror depends on the energy stored in the string
by torsion. This energy can be as low as 1016 watt in commercial
D' Arsonval galvanometer so that if the circularly polarized waveincident on the dielectric plug can be made-to convert half of its energyinto torque, it is reasonable to expect similar benstivity for this
device. Of the two other known devices using torsion effects resultingfrom microwave fields, 1"'Z neither is very sensitive (, 100 mwminimum) , although both are two-port devices designed for minimum
VSWR. This device is of interest because it is a passive detector withthe possibility of moderate sensitivity which could be operated in thesubmillimeter region. It is perhaps too fragile for a reconnaissance
vehicle, but its deflection angle should be linearly related to power,making it useful as a laboratory instrument.
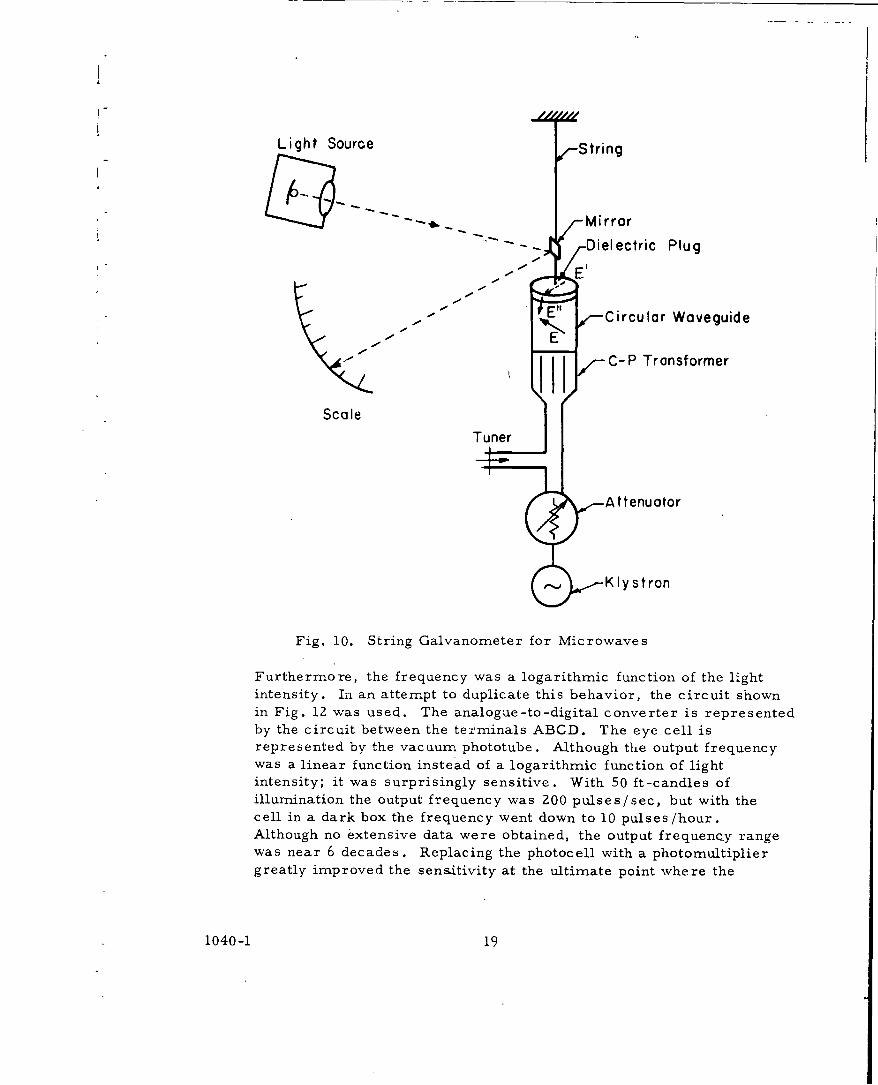
D. Secondary Emission Amplifier
This scheme uses the fact that the dynodes of a secondary-
emission multiplier have negative resistance characteristics as aresult of the secondary-emission process. Since negative resistancecan be used to cancel part of the resistance in a tuned circuit, and
since these multipliers have current gains of over 106, it appears thatthey would be useful as tuned amplifiers. The strongest objectionto this is that these devices are relatively noisy and therefore could
not be used for small signals. Alternatively, operation as a videoamplifier, as suggested in Fig. 11, could provide advantages over aconventional RC-coupled vacuum tube amplifier in that the negative
resistance tends to minimize the effect of shunt capacitance.
E. Detectors based on Physiological Methods
1. Electrical Analogue of Single Cells in Limulus Eye.
The work by Hartline at the University of Chicago to Rockfeller
Institute on the eye of the horseshoe crab (Limulus) shows clearlythe analogue-to-digital nature of biological detectors 19. When a. single
nerve fiber was combed out of the optic nerve bundle and connected toa recording oscillograph, constant-amplitude pluses were obtained ofapproximately 80 mv.
1040-1 18
Light Source String• "~~~~~ " "" --- . -Mirror
Dielectric Plug
.- - - - - -- Circular Waveguide
/--C-P Transformer
ScaleTuner
Attenuator
Klystron
Fig. 10. String Galvanometer for Microwaves
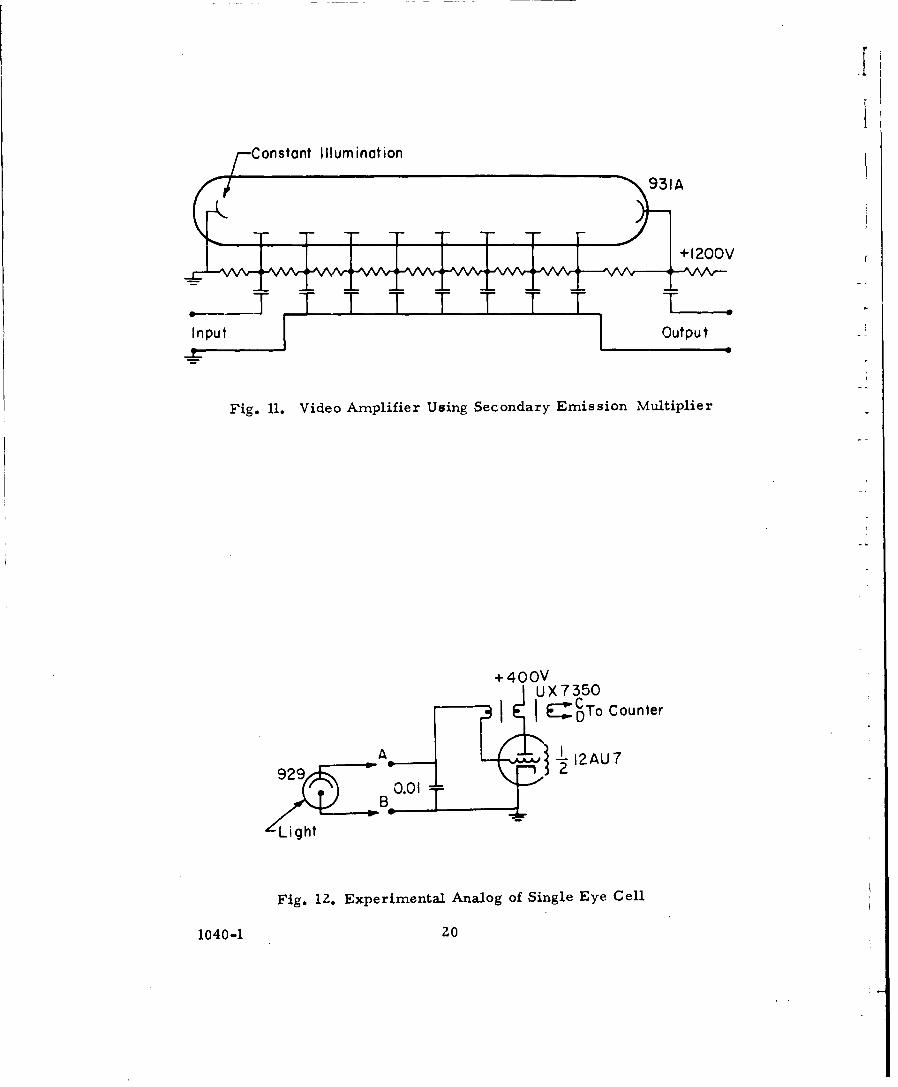
Furthermore, the frequency was a logarithmic function of the lightintensity. In an attempt to duplicate this behavior, the circuit shownin Fig. 12 was used. The analogue-to-digital converter is representedby the circuit between the terminals ABCD. The eye cell isrepresented by the vacuum phototube. Although the output frequencywas a linear function instead of a logarithmic function of light
intensity; it was surprisingly sensitive. With 50 ft-candles ofillumination the output frequency was 200 pulses/sec, but with thecell in a dark box the frequency went down to 10 pulses/hour.Although no extensive data were obtained, the output frequency rangewas near 6 decades. Replacing the photocell with a photomultipliergreatly improved the sensitivity at the ultimate point where the
1040-1 19
Constant Illumination
TTTTTTTT -
' ° I n oo,0o tfO t ut-
Fig. 11. Video Amplifier Using Secondary Emission Multiplier
UX7350
I ECTo Counter
Light
Fig. 12. Experimental Analog of Single Eye Cell
1040-1 20

t
detector could still sense light, but the observer had difficulty inseeing the equipment. As the ultimate sensitivity is limited by thephotocathode quantum efficiency further work on this device isunwarranted. Although this device failed to provide the logarithmicfunction, it does demonstrate a simple type of photon integratorwhich could also detect other forms of radiation by the use of a
different transducer.
t 2. Microwave "Ear"
This scheme, shown in Fig. 13, is based on studies of thehearing mechanism in animals. It is of interest because it allows
the simultaneous detection of signals over a broad band of frequencies(i.e., 200 %bandwidth as opposed to <10%for commercial spectrum
Parabola
MicrowaveDetector's Radiation
Signal WTa-pere e 7
InputI 2 3
To Detectors
Fig. 13. Microwave Spectroscope
21

analyzers) , and because the output is not channeled through the eyesor ears of the observer, but through his skin. In operation, signalspropagating in the TE 1 0 mode enter the tapered waveguide and travelalong it until they reach cutoff. At this point the energy density forthis frequency is a maximum. By placing a large number of sensitivedetectors (such as superregeneration detectors using Esaki diodesalong the guide and terminating their outputs on the skin of the observer,the observer could be made sensitive to microwave radiation. Forreconnaissance purposesthis would mean that he would be able todetect and locate radars with a minimum amount of equipment. Further-more the power requirements would be quite small since the nervesin the skin can detect relatively feeble currents. Through couplingto the skin, the observer is relieved of watching or listening to anartificial indicator. Objections to such a scheme include: (a) themicrowave structure is difficult to build and operate in a single mode;(b) a large number of detectors (100-10, 000) would require a largenumber of connections to the skin so that even if the detectors couldbe constructed on the exterior of the microwave structure, the cablebundle to the observer might be cumbersome; (c) prolonged contactwith the skin could cause irritations; and (d) an extensive learningperiod may be required.
F. Superregeneration
Superregeneration is presented here not so much for the valueof a single system or circuit, but for its over-all merit as a detectionprocess. The superregeneration principle was first described byArmstrong in 1922 23 as a method of periodically switching a negativeresistance into a tuned circuit so that oscillations will grow exponentia'.iywith time from the initial signal amplitude. It is intereSting, forsurveillance purposes, because of its ability to detect weak signals downto the level of the input circuit noise. This circuit noise may now bereduced because of resent developments in masers, parametricamplifier and tunnel diodes.256"',27 Detectors based on this principleare commonly simple devices with extremely high gains, but with 24
poor selectivity, high noise figure, fluctuating gains, and re-radiation,Since all of these effects except the re-radiation are attributable in some"way to the net circuit resistance as a function of time, it should be-,ossible to choose an idealized resistance function to minimize theseobjectionable features .
The fundamental relationship for superregenerative operation is
1040-1
I
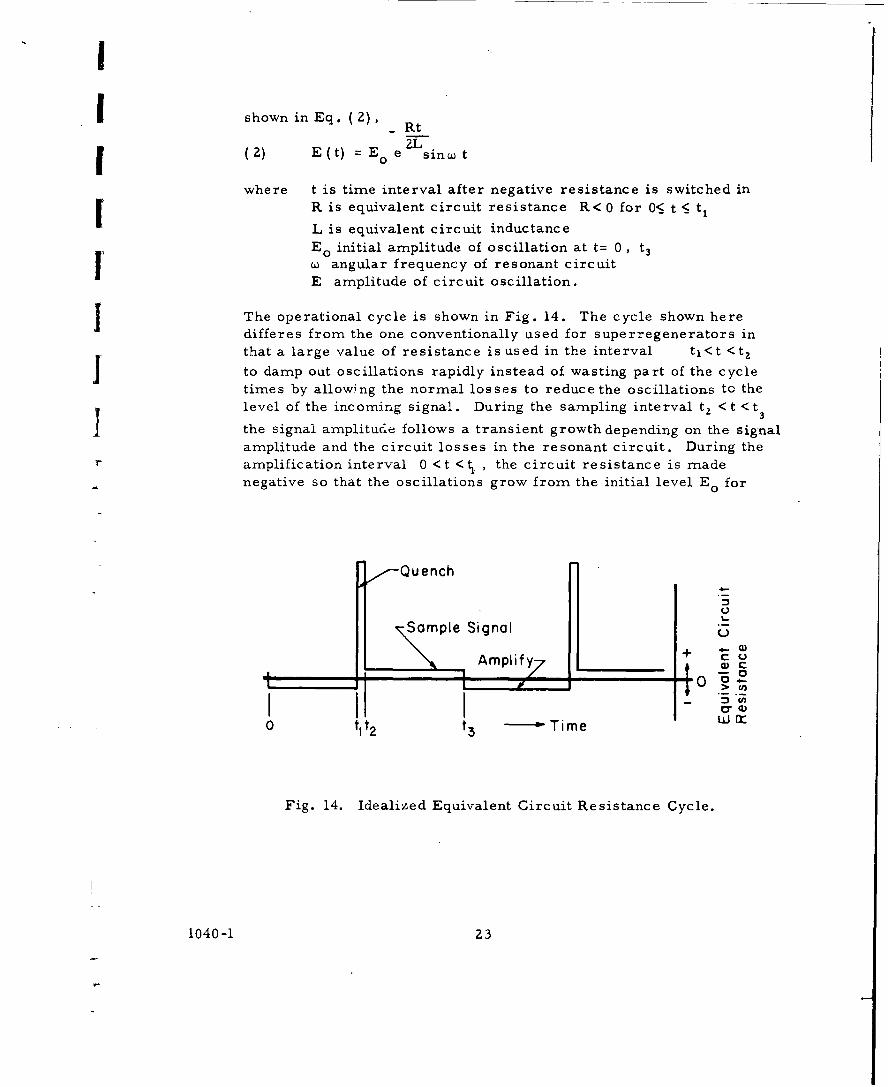
shown in Eq. (2), _ Rt
(2) E(t) = Eo e sine t
where t is time interval after negative resistance is switched inI R is equivalent circuit resistance R< 0 for 0<_ t <_ ti
L is equivalent circuit inductanceEo initial amplitude of oscillation at t= 0, t 3w angular frequency of resonant circuit
E amplitude of circuit oscillation.
j The operational cycle is shown in Fig. 14. The cycle shown heredifferes from the one conventionally used for superregenerators in
that a large value of resistance is used in the interval ti<t <tZto damp out oscillations rapidly instead of wasting part of the cycletimes by allowing the normal losses to reduce the oscillation-s to the
level of the incoming signal. During the sampling interval tZ < t < t3
the signal amplitude follows a transient growth depending on the signalamplitude and the circuit losses in the resonant circuit. During the
r amplification interval 0 <t <t1 , the circuit resistance is made
negative so that the oscillations grow from the initial level Eo for
e Quench
Sample Signal
Amplify7 A W CSI ~0 P
0 tit 2 t Time 0 J)
Fig. 14. Idealized Equivalent Circuit Resistance Cycle.
1040-1 23

either a fixed time (linear mode), or until they reach a fixed
amplitude Em (logarithmic mode) .
For operation in the linear mode the gain is the ratio of the finalamplitude Et to the initial amplitude Eo. To show this Eq. (2) isrewritten as 1 Eq. (3) :
Rt1
3) A= Etl/ =e-L
Operation in this mode requires that the negative resistance be constantin order to provide constant gain. The variation in gain with smallchanges in the negative resistance is shown by differentiating Eq. ( 3):
(4) dA _ (t1 -to) e- R(t- TAde 2L LTdR 72L
and(4a) A , ATAR
A 2L
This shows that the fluctuation in gain for fluctuation in negativeresistance is proportional to the gain. Gains reported vary between
5 0 db and 80 db 25,39, 4 1 so that the requirements on the stability of thenegative resistance are correspondingly exacting. Perhaps one wayaround this is to use two or more synchorized superregenerators in2ascade with reduced gain in each.
Operation in the logarithmic mode means that the time intervaltj - to is a function of the initial amplitude E 0 . Solving Eq. (2) for-:his interval yields:
-5) to t _2L in Em/Eo.R
The variation in time due to variation in R is obtained by differentiating:Eq. (5).
,[6) dt 2 L= + ln Em/Eo
dR R2
Where Eq. (5) and (6) are combined these results:
1040-1 24

(7) &t ZL&R Em/E &Rt Em R
2L In /ES~Rs
Which shows again that circuit stability depends on the negativeresistance stability.
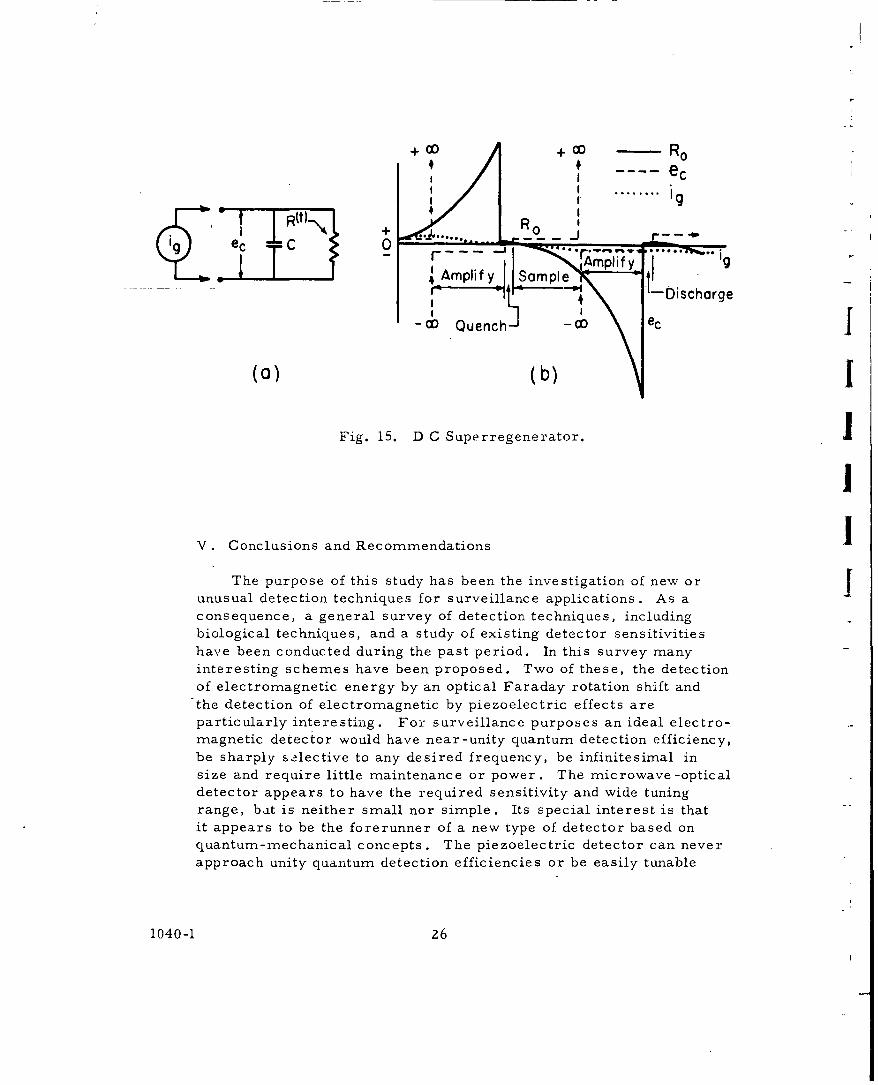
It should be pointed out that superregeneration can still be usedin the degenerate case where the frequency is zero .The factor of 2disappears from the exponent giving Eq. 8 (assuming a long sampleperiod so that RoC "<ts) :
(8) ec = ig Ro e tIRC
although this circuit, Fig. 15A appears indentical with the equivalent
circuit for nerve tissue 4,5 with the ( -R) and (c) formed by the nervemembrane, it has two features not found in biologic systems. Theseare : (1) output polarity depends on input polarity (unidirectionalfor nerve tissue) , and (2) waveshape is exponential while nervepreparations commonly show sharp pulses. Fig. 15 B shows the wave -
forms to be expected with this circuit. If i is the signal current andR describes the net circuit resistance vs. tAme then the peak amplitudeof the capacitor voltage will be related to the initial amplitude by aconstant as in e.-.3.
G. Simplification For Pulsed Radars
It has been observed that the anode current in a c w magnetronis strongly dependent on the phase and amplitude of reflectionsoccurring in its rf output system. For total reflection the variationswere as high as 60%of the total current. Also Hill and Olsen 28 reportthat a smooth-anode coaxial magnetron, operated near 1200 mc, couldbe used to detect signals of -65 dbm to -70 dbm. Therefore it issuggested that the transmitting magnetron in a pulsed radar also beused at reduced power as the local oscillator-mixer combination withthe I.F. frequency equal to the frequency shift in the oscillationfrequency. This I.F. output would appear as fluctuations in the anodecurrent in the magnetron during the receiving interval. Although this
method might be objectionable because of local oscillator noise, itcould eliminate the duplexer, crystal detector, and separate local
oscillator. One additional advantage is that crystal burnout caused byhigh-level signals is avoided.
1.040-1 25
, i ec
R(t)-\ (. * ........ r_, Ii.- -- .,-er o41 Ampli fy Sapl Amlify
I'• "-- ---- • • -Discharge
-0o1 Quench- ec
(a) (b)|
Fig. 15. D C Superregenerator. II
V. Conclusions and Recommendations IThe purpose of this study has been the investigation of new or J
unusual detection techniques for surveillance applications. As aconsequence, a general survey of detection techniques, includingbiological techniques, and a study of existing detector sensitivitieshave been conducted during the past period. In this survey manyinteresting schemes have been proposed. Two of these, the detectionof electromagnetic energy by an optical Faraday rotation shift andthe detection of electromagnetic by piezoelectric effects areparticularly interesting. For surveillance purposes an ideal electro-magnetic detector would have near-unity quantum detection efficiency,be sharply selective to any desired frequency, be infinitesimal insize and require little maintenance or power. The microwave -opticaldetector appears to have the required sensitivity and wide tuningrange, bat is neither small nor simple. Its special interest is thatit appears to be the forerunner of a new type of detector based onquantum-mechanical concepts. The piezoelectric detector can neverapproach unity quantum detection efficiencies or be easily tunable
1040-1 26

IIover wide frequency bands, but it is small, simple and requires little
power. The successful development of these two devices would providesensitive detectors in the millimicrowave region where such detectorsare now lacking. This region is of primary, importance for surveillancepurposes since it contains much of the thermal radiation of man and hi3equipment. It also permits increased antenna directivity per givenphysical size. Also there is reason to believe that the application ofthese frequencies would alleviate the severe attenuation of signalstransmitted from ahypersonic vehicle in an ionized atmosphere. There-fore it is on the basis of these considerations that we propose tocontinue the theoretical analysis and experimental investigation of thesetwo detectors during the next contract period simultaneously with thecontinuing search for new and unique detection techniques.
Appendix VI. A Macroscopic Analysis of the Faraday-Rotation Microwave Detectorby Dr. W.S.C. Chang
The Faraday effect (i. e. , the rotation of the plane of polariza -tion of light passing through a magnetic field) is very large, in genera].,in paramagnetic salts. It can be expressed as follows:
(9) 6= A1 tanh 0H-a + Bi HakT
Swhere Ha is the effective applied magnetic field; T is the temperatureof the spin system; i' is the magnetic moment; k is the Boltzmann' sconstant; and e is the Faraday rotation angle in degrees per millimeterof path length. Figure 16 shows a typical 0 vs. Ha curve for Nd(C 2 H5 S 04) 3 6 H2 0. Notice that this curve is normalized with respect
r to temperature; therefore it is applicable to 4. 2 0 K > T > 1. 40 K. Atthese low temperatures (4. 20 K > T > 1. 40 K) , only the Zeeman levelsof the ground state are populated; therefore this "T" can be replacedby the spin temperature, Ts* of the paramagnetic levels. Moreover,when 1 Ha << k Ts,
(10) do E , A L HadTs Al - Ha
or for Ai tanh L.Ha >> B, HakT
': For an analysis of the spin temperature and the bath temperature,see Reference 45.
1040-1 Z7
I
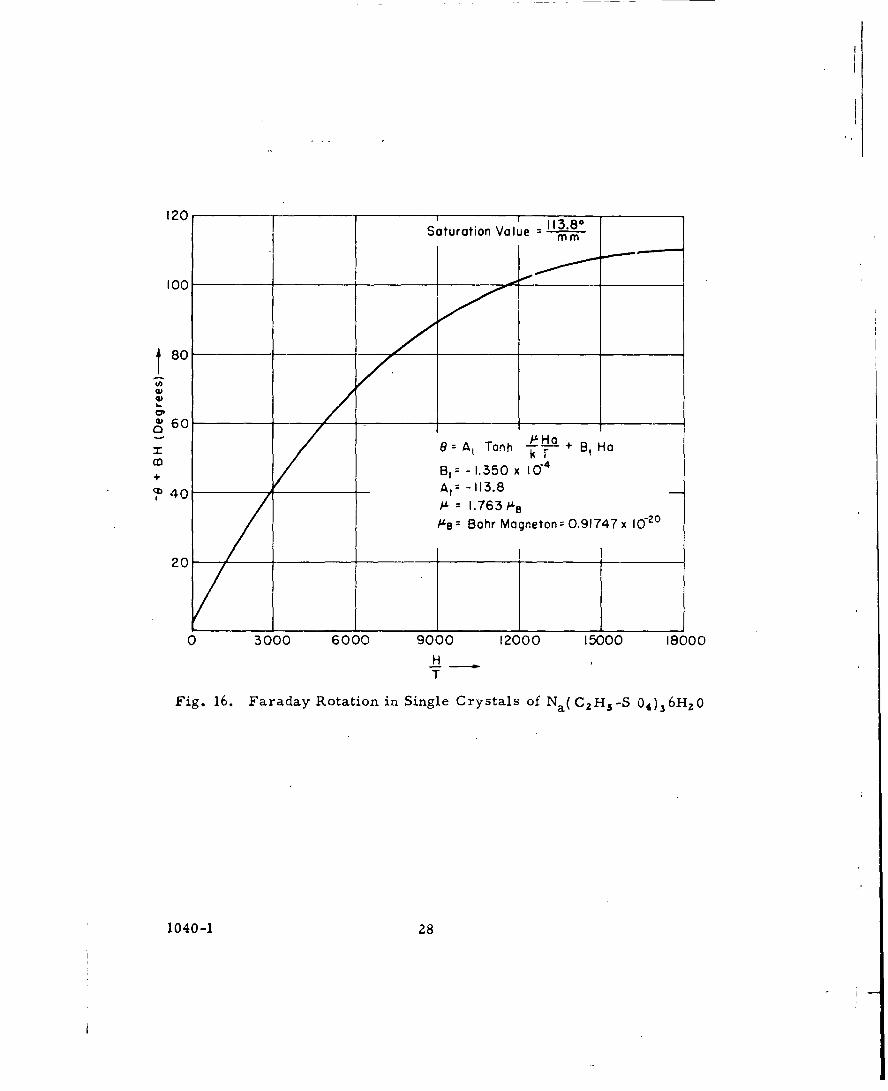
120 , 113.8 0Saturation Value mm
100
t80
S60
= A, Tanh FHa + Bt Harm k r
+ B z - 1.350 x I0"4,40 A,= -113.8
/L = 1.763," 8
Bo= Bohr Magneton 0.91747 x 10°20
20
0 3000 6000 9000 12800 15000 18000
HT
Fig. 16. Faraday Rotation in Single Crystals of Na( C 2 H 5 -S 04)36Hz20
1040-1 28

I (11) tx 0 = _ ATsS0o
These two conditions are usually satisfied for T.'v 40 K and t Ha <100 KMc. For T. > 40 K, Eq.(l will always be - and Eq. (11)should be modified to
(1.2) A00o BIa s
Since Ts is the spin temperature representing the thermodymamicstate of the spins, its value is not always equal to the value of the
bath temperature when there is paramagnetic absorption t.5 As a
matter of fact, Ts of a spin system is defined simply as the ratio ofthe populations of the pair of paramagnetic energy levels accordingto the Boltzmann distribution at the temperature Ts (i.e., Ts -E 2 -E,k 1oge•i ,where E 2 and El are the energy levels of the two spin
states: n? and nj are the propulations of the E 2 and El states) . Where
population inversion occurs such as in the masers, Ts would benegative. The saturation of paramagnetic resonance corresponds to
Tf T= 00
On the other hand, the rate equations of 46 the population densities
yield:
(13) dnZ = nI w 1 2 - n 2 wzj + (nj - n 2r dt
(14) dn1
-nz = W 2 1 - n1 wZ + (n 2 - n) w
(15) w2 =w 2 l e -(E7-EI)/kTb
I where w12 is the relaxation rate from El to E 2 ; Tb is the temperatureof the liquid helium bath; wis the induced transition probability of
the paramagnetic resonance; and 'under steady state conditions;
dna dn, = 0. Therefore, for I Ha <<k Tb and E2 -E, [ Hadt d-b-
(16) n 2 -nl = [Ha W Inj k Tb 1 + W 12
S1040-1 29i
or
(17) Ts= Tb W+v 2Wl 2
But
(18) - Pabs(n2 -nl)ýL Ha
the refore(19) A -0 Ts-Tb = . Pabs
0oTb T i (n2 -nl) i Ha
From the microwave power absorption point of view, as long asthe unloaded Q of the cavity is much greater than the magneticabsorption Q of the cavity, Pabs would be approximately equal toPin (i, e. , the total microwave power input) times the effect ofcoupling. Hence
P 4P/ 2(20) 2ý0 _ in (l+0)
0o w12 (nz-ni) k Ha
Qc avitywhere P is the coupling coefficient, P = v ext.
In other words, the Faraday rotation effect would diýýe-ctly measurethe power input for very low power levels where the saturation doesnot occur. Assuming that
-Z4IIHa= 10 KMC = 6. 624 x 10 joulesW12 = 200 -L_. (i. e. , 5 milliseconds for the relaxation time)
secn 2 -n 1 = no
_ ( _Ha 108 at 4 0 K for no 1019 spins2 k T ----
I= 1 for the critically coupled cavities,
then
(21) AO0= Pin (watts) x6.624 x 10-O
If the sample is 5 millimeter to 1 cm thick and the sensitivity ofdetection is 30 corresponding to a ALO 1 0/for a very crude
g 0o - 2optical measurement of A 0, then the minimum detectable Pin 6 1.watts.
1040-1 30

Comparing this value with the data obtained by J. M. Daniels and hiscolleagues in the University of British Columbia where they haveobtained saturation of the paramagnetic resonance with 40 i watts ofpower, it is concluded that the power measuring sensitivity of anordinary crude Faraday detection system would be in the order ofmagnitude of 10-6 watts.
In order to improve this sensitivity it is obvious that aparamagnetic crystal must be sought for which the coefficient Z is
large and a detection system must be used for which the minimumdetectable AO is small. The coefficient A' for various crystals can bemeasured simply by observing the Faraday effects of the Ha withoutparamagnetic resonance. The minimum detectable angle A0 can bedecreased if a Fabry-Perot interferometer is constructed by using twopartially reflecting surfaces perpendicular to the optical axis at both
ends of the crystal. The effect of such an interferometer can beestimated by geometric optics as follows. Let the original incidentlight be polarized along the x' direction and the optical axis of theparamagnetic material be along the z direction as shown in Fig. 17.Then, if the angle of rotation through the crystal is 0 for each path andthe reflection coefficient for the electric field is r , following relation-ships for the emergent light at B are obtained:
(22) EBy,, EoET2 [sin 0 + sin 30 r 2 + sin50 4 ...... ]
(23) EBx" Eo T2 cos 0 +cos 3 0 2 + cos50 • 4 +.......
24) EB = By iy1 + EBx' x-
Where T is the transmission coefficient of the electric field and
Eo is the incident electric field.
If a proper x and y axis are chosen in such a way that
25) ix = cos Llý ix + sin +
26ý iy = - sini ix/ + cost iy
where tan t EBy"
EBx
then it follows that
1040-1 31

A Polarization Of BThe Incident Light
Incident Light / \ ' Emergent Light
(2) ~ yE~ I co t /EX'1
I I Opticaly ',1" •Axis
/ I /
Fig. 17. The Proposed Fabry-Perot Interferometer.
( 29) EBy :EByl cos d/- EBX1 ý = 0
Therefore, if an ideal polarizer is placed after B along the iy direction,there would not be any light transmitted through this polarizer. Whena small change in 0, ,O, is caused by the paramagnetic absorption,
(30) EBy Eo T 2iý0 [cos ( 0o0-) + 3 cos 30o-¾) 1,2+5 cos (5 0 o0-)
.4 +....... . ]_ Eo T 2 A OF
1040-1 32
where, for an interferometer of length LAB
(31) 0= PHa- (31) 0o= (A, kLa + B, Ha)eAB.
Thus, the effect of the Fabry-Perot interferometer is to increase theeffective path length of the Faraday rotation by a factor of
"(32) F= cos (00 -4) + 3 cos (3 00 -4) r2 + 5cos (5 00 _4) r 4
To estimate the magnitude of F, let it be assumed that
(33) 0o =nir - (n=0, 1,2,3,----); then
F= cos (0o0 -)1[ + 3 2 +5 r4 +........ .
-cos (nTr -4) 21- l-] 2 ].
For 1"=97.5%, F=l1,O000cos (nir -M);
For r= 99.1%, F= 10,000 cos (n r- M)).
Therefore, the effect of the Fabry-Perot interferometer alone couldreduce the minimum measurable LZ0 by three orders of magnitudeand increase the sensitivity of the Faraday rotation detector to10 9 or 10*10 watt.
On the other hand, the size of the crystal can be decreased bychanging its transverse dimension alone without affecting thelongitudinal dimension or the effective path length of the optical light.The crystals can also be diluted with diamagnetic ions to increase thespin-lattice relaxation times. When these changes are taken intoaccount in Eq. 20, their total effect would improve the sensitivity ofthe detector by two or three more orders of magnitude. Therefore,it maybe concluded that the sensitivity of such a device would beexpected to be about l0-I1 to l0-1' watts depending upon the propertiesof the materials as well as the refinements of the measuring techniques.
Such an electromagnetic detector has never been demonstratedbefore. It provides one method where the electromagnetic radiationis detected by means of the atomic interactions. The ultimatesensitivity of such a device is limited by the control of the environmentssuch as both temperature and Hdc' the sensitivity of the optical
1040-1 33
r
detectors, and the quantum limits of all the atomic detectors that havebeen proposed. 47, 48 It may be said that one of the fundamental limitson the atomic detectors is the minimum number of changes of spinsfor change of Ts that are detectable. The investigation of the presentdetector will lead to some understanding of this limitation which maylead us to much more sensitive detectors. Moreover, as in all atomicdetectors, this interaction can take place equally well at milli-microwave frequencies using the Stark effect energy levels and inter-ferometers. Therefore, this principle has the potential of leading tothe development of very sensitive millimicrowave detectors.
The present analysis is presented on a macroscopic approachto gain some physical insight into this detector. A quantumstatistical analysis of the interactions of the Faraday effect andparamagnetic resonance has been made by Rosenfeld 49 andOpechowsky.s° This detailed microscopic analysis will be presentedin a future report. One interesting result of the exact theoreticalanalysis is that the Faraday rotation is dependent not only on the T.,but also, through a cross modulation process upon the magnitude ofthe rf field. If this effect can be made predominant, one can use iteither as an optical modulator or as a detector which has a timeresponse many orders of magnitude faster than that of the Golaydetector.
1040-1 34

VII. Bibliography and References
(1) Glasser, Otto, ed., Medical Physics Vol. 1, p. 1659, YearbookPublishers, Inc. (1944).( --- energy for visual excitation have repeatedly yielded resultsbetween 58-148 quanta/sec at 5000A. Due to scattering, etc.,in the eye the actual effective number is 5-14 at the retina. )
(2) Tamm, I. E., "Radiation of Particles with Speeds Greater thanLight," American Scientist 47, No. 2, June 1959, pp. 169-177(Ce renkov Radiation) .
(3) Benedetti, Sergio de, "The Mossbauer Effect," ScientificAmerican 202, No. 4 (April 1960) p. 73.
(4) Freygang, Jr., Walter H., "Some Functions of Nerve Cells inTerms of an Equivalent Network, " Proc. IRE 47, 1862-1869,1959.
(5) Moore, John W., "Electronic Control of Some Active BioelectricMembranes," Proc. IRE 47, 1869-1.880 (1959). (Shows negativeresistance characteristic in Fig. 17.)
(6) Siegel, K., "Solid State G-M counter for IR?, " Proc. IRE 47,p. 4A (Sept. 1959).
(7) Pake, George E. , "Magnetic Resonance, " Scientific American199, No. 2 (August 1958) p. 58.
(8) Daniels and Rieckhoff, "Spin Lattice Relaxation Times inNeodymimum Ethylsulphate, " Can. Phys. 38, pp. 604-618 (May1960).
(9) Daniels and Wesemeyer, Can. Phys. 36, p. 405 (1958).
(10) Wesemeyer and Daniels, Zeitschrift Fur Physik, 152, 591 (1958).
(-1)Cullen and Stephenson, "A Torque Operated Wattmeter For 3-cmMicrowaves," Proc. IEE, 99, pp. 294-301 (1952).
(1 2) Yamamoto, Hiroshi, "Pendulum Method of Power Measurementin the Millimeter Wave Region, " Proc. Symposium on MillimeterWaves (1959), New York, Brooklyn Polytech Institute Press.
1040-1 35

(13) Walenta, I.E., Connor, B. V., A Sinusoidal Vibrator ForGenerating High Accolerations at High Frequencies, JetPropulsion Laboratory, Tech. Rpt. 32-13 (Jan. 15, 1960).
(14) Bondi,, H. On the Physical Characteristics of Gravitational WavesASTIA 233 766, Kings College, University of London, Dept. ofMathematics, Tech. Note No. 7 ( 31 July 1959).
(15) Winans and Seldin, "Thermoluminescence, " Handbook of Physics,p. 6-144, Condon and Odishaw, ed. , VcGraw Hill (1958).
(16) Scholman, Ginther, Kirk, Goulart, "ThermoluminescentDosimeter has Storage Stability, Linearity." Nucleonics 18,No. 3,(March 1960) p. 92.
(17) Nahman and Martin, "$igh Performance Impedance.Transformationwith the EFP-60 Secondary Emission Pentode, " IRE Trans. onElectron Devices. Vol. ED-7, No. 2, (April 1960), p. 99.
(18) Sproull, R., Modern Physics, sec. 12-6, p. 385-393, Wiley(1956).
(19) L.J. and M.J. Milne, "Electrical Events in Vision," ScientificAmerican 195, No. 6 (Dec. 1956), pp. 113-122.
(20) Loewenstein, W.R. , "Biological Transducers," ScientificAmerican 203, No. 2 (August 1960) , p. 99.
(21) Bekesy, von., "The Ear," Scientific American 197, No. 2(August 1957), p. 66-79.
(22) Granit, Ragnar, Receptors and Sensory Perception, Yale Univ.Press (1955). (General reference).
( 23)Armstrong, E. H. , "Some Recent Developments of Regenerativecircuits, " Proc. IRE 10, 244 (Aug. 1922) .
(24) Hall, G.O. , "Superregenerative Receivers," Chap. 20., Vol. 23Microwave Receivers, van Voorhis, ed., MIT Rad Lab. SeriesMcGraw Hill (1948).
(25) Younger, Little, Heffner and Wade, "Parametric Amplifiers asSuperregenerative Detectors," Proc. IRE 47, 1271 (1959)
1040-1 36

(26) Jordan and Elco, "Esaki Diodes as Superregenerative Detectors,"Proc. IRE 48, 1902 (Nov. 1960).
(27) Chester and Bolef, "Superregenerative Masers, " Proc. IRE 451287 (1957)
(28) Hill, Olsen, "Microwave Oscillation and Detection by a SmoothAnode Coaxial Magnetron," Proc IRE 48, 1906-1907 (1960).
(29) Turner, F. M., "A Broadband Cyclotron Resonance RF DetectorTube," Proc IRE 48, 890-897 (May 1960).
(30) Tromp, S.W., Psychical Physics, Appendix IV "Additional NotesConcerning the Sensitivity of Animals, " p. 436-437 Elsevier,N.Y. (1949).
(31) Levi, L., "'Response of a Loaded Piezoelectric Plate to anElectric Signal, " J. Appl. Phys. 31, 1237 (July 1960).
(32) Williams, T.G., A Microwave Phototube, ASTIA 161 647,M.S. Thesis Univ. Wash. (1958), 35 pp. (neon lamp detector).
(33) Narinder S. Kapany, "Fiber Optics," Scientific American 203No. 5, (Nov. 1960), p. 72.
(34) Lalevic, Bogoljub, "Criteric For Choice of a SuperconductingBolometer," J. Appl. Phys. 31, 1234 (July 1960)
(35) Buckhold, T.A. , 'Applications of Superconductivity, "ScientificAmerican 202, No.: 3 (March 1960) , p. 74.
(36) Waterman, T.H., "Polarized Light and Navigation," ScientificAmerican 193, No. 1, 88-94, (July 1955).
(37) Olds, J. "Stimulation of Pleasure Centers in the Brain,"Scientific American 195, No. 4, (Oct. 1956) , pp. 1,05-116.
(38) Saver, E.G. F. , "Celestial Navigation by Birds, 1 ' ScientificAmerican 199, No.'2, (Aug. 1958), p. 42.
(39) Bossard, B. R. , "Superregenerative Reactance Amplifier,Proc. IRE 47, 1269-1270 (1959).
1040-1 37
I7
(40) Robinson, et. al. , "On Stabilizing the Gain of Varactor Amplifiers, A
Proc. IRE 48, 1648 (1960).
(41) Bossard and Frost, "X-band Superregenerative ParametricAmplifier, "1 Proc. IRE 48, 1329-1330 (July 1960).
(42) Chang, K. K. N., "Low.-Noise Tunnei-Diode Amplifier, " ProcIRE 47, 1268 (July 1959)
(43) Van Vleck, J.HI, " Electric and Magnetic Susceptibilities,"Oxford University Press., (1932), Chapter 8.
(44) Becquerel, J., De Haas, W. J., Van Deu Handel, J. , "PowerRotatoire Paramagne' tique De L' ethylsulphate De Ne' odymeHydrate' , Dans La Direction De L'axe Optique" Physica 5753 (1938).
(45)Abragam, A., and Procter, W., "Identity of Spin Temperatureand Thermodynamic temperature", C. R. Acad. Sci. , Paris,245, 1048-1050 (1957)
(46) Bloembeyen. N. , "Proposal for a new type solid-state mnaser"Phys. Rev., 104, ser. 2., 324-327 (15 Oct. 1956).
(47) Friedberg, H., "General Amplifier Limit," Quantum Electronics,
p. 228, Columbia University Press (1960).
(48) Weber, J., "Masers", Rev. of Mod. Phys. , 31, 681 (1959).
(49) Van Vleek, J. H., "Electronic and Magnetic Susceptibilities:Oxford University Press (1932) , Chapter 13.
(50) Opechowski, W., "Magneto-Optical Effects and ParamagneticResonance," Rev. of Mod. Phys. 25, 264, (1953).
VII!. Acknowledgements
This report is the result of the efforts of many people.Thanks are due especially to Dr. W. S.C. Chang who wrote theAppendix, edited this manuscript, and provided major guidance in theconstruction of the microwave-optical detector. The information on
biological detectors and electro-sensory physiology was obtained withthe aid of Dr. Leo E. Lipetz whose long discussions of these topicsare greatly appreciated.
1040-1 38

Investigator J4QMSIP .~... ~ j& ......................... Date ... t~4
Investigator Date .... -C......... Date....
Investigator ........................... .................................................................. D ate ............... ................................ .......... .
Investigator .............................................................................................. D ate ............. . ................................................ ,
For The Ohio State University Research FoundationExecutive Director .... Date ...... . ....... .. . ...........
1040-1 39