identifying stereotypes in the online perception of
TRANSCRIPT

IDENTIFYING STEREOTYPES IN THE ONLINE
PERCEPTION OF PHYSICAL ATTRACTIVENESS


CAMILA SOUZA ARAÚJO
IDENTIFYING STEREOTYPES IN THE ONLINE
PERCEPTION OF PHYSICAL ATTRACTIVENESS
Dissertação apresentada ao Programa dePós-Graduação em Ciência da Computaçãodo Instituto de Ciências Exatas da Univer-sidade Federal de Minas Gerais como req-uisito parcial para a obtenção do grau deMestre em Ciência da Computação.
Orientador: Wagner Meira Júnior
Coorientador: Virgilio Almeida
Belo Horizonte
Março de 2017


CAMILA SOUZA ARAÚJO
IDENTIFYING STEREOTYPES IN THE ONLINE
PERCEPTION OF PHYSICAL ATTRACTIVENESS
Dissertation presented to the GraduateProgram in Computer Science of the Fed-eral University of Minas Gerais in partialful�llment of the requirements for the de-gree of Master in Computer Science.
Advisor: Wagner Meira Júnior
Co-Advisor: Virgilio Almeida
Belo Horizonte
March 2017

© 2017, Camila Souza Araújo. Todos os direitos reservados
.
Ficha catalográfica elaborada pela Biblioteca do ICEx - UFMG
Araújo, Camila Souza.
A663i Identifying stereotypes in the online perception of
physical attractiveness. / Camila Souza Araújo. – Belo
Horizonte, 2017.
xx, 58 f.: il.; 29 cm.
Dissertação (mestrado) - Universidade Federal de
Minas Gerais – Departamento de Ciência da Computação.
Orientador: Wagner Meira Júnior.
Coorientador: Virgílio Augusto Fernandes Almeida.
1. Computação – Teses. 2. Viés algorítmico. 3.
Ferramentas de busca. 4. Sistemas de recuperação da
informação. 5. Estereotipo (Psicologia). I. Orientador. II.
Coorientador. III Título.
CDU 519.6*73(043)


To my wonderful parents and my lovely husband.
ix


Acknowledgments
First of all, I thank my parents for being a great example in my life and always
encouraging me to go after my dreams. Without you none of this would have been
possible. Thank you so much for supporting me in all my decisions and being my safe
haven.
I also thank my husband, Júlio, my partner on this journey and for life. Thank
you so much for always being by my side and encouraging me on each step.
Thank you to all my friends. Thank you to Raíssa and Amanda, my oldest
friends with whom I share wonderful moments since school. To Pedro, my friend since
the beginning of the graduation, thank you for the good moments at IJunior. Finally, I
thank my Speed Lab's friends, especially Denise, Samuel, Vinícius, Rubens, Elverton,
Osvaldo, Walter, Paulo and Derick for all the "fauna and �ora moments" and D&D
sessions, without you the last few years would not have been so fun.
To my advisors, Wagner Meira Jr. and Virgílio Almeida, thank you very much
for believing in the potential of my work and the academic guidance. To Fernando
Maurão, my �rst advisor, thank you for believing in my potential.
Finally, I would like to thank all the sta� of the Department of Computer Science,
especially Sônia, Linda and Sheila, for their attention and for being always willing to
help.
xi


�That which does not kill us makes us stronger.�
(Friedrich Nietzsche)
xiii


Resumo
Estereótipos podem ser vistos como ideias simpli�cadas sobre grupos sociais,
evoluindo de acordo com mudanças sociais e culturais. Alguns estereótipos e precon-
ceitos encontrados no mundo real são re�etidos no mundo virtual. A internet tem es-
treitado a distância entre as culturas locais e globais, afetando de diferentes maneiras a
percepção das pessoas sobre si e os outros. No contexto global da Internet, as platafor-
mas de máquinas de busca são um importante mediador entre indivíduos e informações.
O objetivo principal deste trabalho é identi�car estereótipos associados à atratividade
física feminina em imagens disponíveis nos resultados das máquinas de busca. Pre-
tendemos também identi�car a in�uência da globalização da internet e da cultura local
na formação de estereótipos por meio de dois fatores: linguagem e localização. Nós con-
duzimos experimentos no Google e no Bing, realizamos consultas por mulheres bonitas
e feias. Em seguida, coletamos imagens e extraímos informações das faces. Primeira-
mente, propomos uma metodologia para compreender como raça e idade se manifestam
nos estereótipos observados e como eles variam de acordo com os países e regiões. Nos-
sos resultados demonstram a existência de estereótipos de atratividade física feminina,
em particular estereótipos negativos para mulheres negras e estereótipos positivos para
mulheres brancas em termos de beleza. Também encontramos estereótipos negativos
associados a mulheres mais velhas. Em seguida, identi�camos uma fração signi�ca-
tiva de imagens replicadas em resultados de países com a mesma língua. No entanto,
quando as consultas são limitadas a sites locais, mostramos que a existência de imagens
comuns entre países é praticamente eliminada. Com base nisso, argumentamos que os
resultados das máquinas de busca são enviesados em relação a linguagem utilizada, o
que leva a certos estereótipos de beleza que muitas vezes são bastante diferentes da
maioria da população feminina do país.
xv


Abstract
Stereotypes can be viewed as oversimpli�ed ideas about social groups. They can
evolve in ways that are linked to social and cultural changes. Some stereotypes and
prejudgment found in the material world are transferred to the online world. The
Internet has been blurring the lines between local and global cultures, a�ecting in
di�erent ways the perception of people about themselves and others. In the global
context of the Internet, search engine platforms are a key mediator between individu-
als and information. The main goal of this work is to identify stereotypes for female
physical attractiveness in images available in search engines results. We also aim to
identify the in�uence of globalization of the internet and local culture on the formation
of stereotypes through two factors: language and location. We conducted experiments
on Google and Bing by querying the search engines for beautiful and ugly women. We
then collect images and extract information of faces. First, we propose a methodology
to understand how race and age manifest in the observed stereotypes and how they
vary according to countries and regions. Our �ndings demonstrate the existence of
stereotypes for female physical attractiveness, in particular negative stereotypes about
black women and positive stereotypes about white women in terms of beauty. We also
found negative stereotypes associated with older women in terms of physical attractive-
ness. Then, we identify a signi�cant fraction of replicated images within results from
countries with the same language. However, when the queries are limited to local sites,
we show that the existence of common images among countries is practically elimi-
nated. Based on that, we argue that results from search engines are biased towards the
language used to query the system, which leads to certain attractiveness stereotypes
that are often quite di�erent from the majority of the female population of the country.
xvii


List of Figures
3.1 Data Gathering Framework. . . . . . . . . . . . . . . . . . . . . . . . . . . 12
3.2 CDF - Useful Photos. . . . . . . . . . . . . . . . . . . . . . . . . . . . . . . 13
3.3 Race Fractions for Google (color online). . . . . . . . . . . . . . . . . . . . 14
3.4 Race Fractions for Bing (color online). . . . . . . . . . . . . . . . . . . . . 15
3.5 Age distribution for Google. . . . . . . . . . . . . . . . . . . . . . . . . . . 16
3.6 Age distribution for Bing. . . . . . . . . . . . . . . . . . . . . . . . . . . . 17
3.7 Clusters: dendrogram structure, cuto� of 5 clusters. . . . . . . . . . . . . . 23
4.1 Frequency of the number of occurrences (repetition) of images in our
datasets (color online). . . . . . . . . . . . . . . . . . . . . . . . . . . . . . 31
4.2 CDF of image repetition (color online). . . . . . . . . . . . . . . . . . . . . 31
4.3 Similarity of image results between countries, for global queries. . . . . . . 34
4.4 Similarity of image results between countries, for local queries. . . . . . . . 36
4.5 Distribution of races among countries, queries on Google (color online). . . 38
4.6 Distribution of races among countries, queries on Bing (color online). . . . 39
xix


List of Tables
3.1 Mean and Standard Deviation of Distributions . . . . . . . . . . . . . . . . 15
3.2 Clusters centroids - Google Dendrogram . . . . . . . . . . . . . . . . . . . 21
3.3 Clusters centroids - Bing Dendrogram . . . . . . . . . . . . . . . . . . . . 22
3.4 Summary of results for questions Q1, Q2, Q3, Q3, Q4, Q5, Q6 e Q7 . . 24
4.1 Similarity between Google and Bing - Countries . . . . . . . . . . . . . . . 32
4.2 Similarity between Google and Bing . . . . . . . . . . . . . . . . . . . . . . 33
4.3 Similarity between combination of queries . . . . . . . . . . . . . . . . . . 33
A.1 Useful photos from Google (Global). . . . . . . . . . . . . . . . . . . . . . 50
A.2 Useful photos from Bing (Global). . . . . . . . . . . . . . . . . . . . . . . . 51
A.3 Useful photos from Bing (Local). . . . . . . . . . . . . . . . . . . . . . . . 51
A.4 Useful photos from Google (Local). . . . . . . . . . . . . . . . . . . . . . . 52
B.1 Z-score table associated with the questions Q1, Q2 and Q3 (Bing) . . . . . 53
B.2 Z-score table associated with the questions Q1, Q2 and Q3 (Google) . . . . . . 54
B.3 Z-score table associated with the questions Q4, Q5 and Q6 (Google) . . . . . . 54
B.4 Z-score table associated with the questions Q4, Q5 and Q6 (Bing) . . . . . 55
C.1 P-value table associated with the questions Q7 (Google) . . . . . . . . . . 57
C.2 P-value table associated with the questions Q7 (Bing) . . . . . . . . . . . 58
xxi


Contents
Acknowledgments xi
Resumo xv
Abstract xvii
List of Figures xix
List of Tables xxi
1 Introduction 1
1.1 Research Goals . . . . . . . . . . . . . . . . . . . . . . . . . . . . . . . 2
1.2 Contributions . . . . . . . . . . . . . . . . . . . . . . . . . . . . . . . . 3
1.3 Organization . . . . . . . . . . . . . . . . . . . . . . . . . . . . . . . . 4
2 Background 5
2.1 Stereotypes . . . . . . . . . . . . . . . . . . . . . . . . . . . . . . . . . 5
2.2 Search Engines . . . . . . . . . . . . . . . . . . . . . . . . . . . . . . . 7
2.3 Principles for Accountable Algorithms and Algorithm Auditing . . . . . 8
3 Identifying and Characterizing Stereotypes 11
3.1 Methodology . . . . . . . . . . . . . . . . . . . . . . . . . . . . . . . . 11
3.1.1 Data Gathering . . . . . . . . . . . . . . . . . . . . . . . . . . . 11
3.1.2 Data Analysis . . . . . . . . . . . . . . . . . . . . . . . . . . . . 18
3.1.3 Clustering Stereotypes . . . . . . . . . . . . . . . . . . . . . . . 20
3.2 Summary and Discussion . . . . . . . . . . . . . . . . . . . . . . . . . . 22
4 Locality in Stereotypes 27
4.1 Methodology . . . . . . . . . . . . . . . . . . . . . . . . . . . . . . . . 28
4.1.1 Data Gathering: Global and Local . . . . . . . . . . . . . . . . 28
xxiii
4.1.2 Image Fingerprinting . . . . . . . . . . . . . . . . . . . . . . . . 29
4.1.3 Similarity Metric . . . . . . . . . . . . . . . . . . . . . . . . . . 29
4.2 Experiments and Results . . . . . . . . . . . . . . . . . . . . . . . . . . 30
4.2.1 Repetition of Images . . . . . . . . . . . . . . . . . . . . . . . . 30
4.2.2 Co-occurrence of Images . . . . . . . . . . . . . . . . . . . . . . 32
4.2.3 Global and Local Images . . . . . . . . . . . . . . . . . . . . . . 35
4.3 Summary and Discussion . . . . . . . . . . . . . . . . . . . . . . . . . . 37
5 Conclusions and Future Work 41
Bibliography 43
Appendix A Data Gathering Statistics 49
Appendix B Results of Z-Score Tests 53
Appendix C Results of Wilcoxon Tests 57
xxiv

Chapter 1
Introduction
Prejudice, discrimination and stereotyping often go hand-in-hand in the real
world. In social sense, the word discrimination refers to an action based on preju-
dice resulting in unfair treatment of people because of their social context, without
regard to individual merit. Discrimination can also refers to an unjusti�ed di�erence
in treatment on the basis of any physical or cultural trait, such as gender, ethnic group
and religion, among others [Romei and Ruggieri, 2014]. Stereotypes - positive, neutral
or negative - are generally de�ned as beliefs about the characteristics, attributes, and
behaviors of members of certain groups [Hilton and Von Hippel, 1996]. As Banaji and
Greenwald [2013] pointed out, humans think with the aid of categories and in many
circumstances, these categories turn into stereotypes, such as Africans have rhythm or
Asians are good at math.
Stereotypes may also be associated with some prejudgment, that indicates some
sort of social bias, positive or negative. Sometimes they can negatively a�ect the
way we evaluate ourselves. Age, race, gender, ethnicity, and sexual orientation are
elements that contribute to the creation of stereotypes in di�erent cultures that can
evolve in ways that are linked to social and cultural changes. For example, tiger moms
are considered a positive stereotype that refers to Asian-American mothers that keep
focus on achievement and performance in the education of their children. However,
negative stereotypes based on gender, religion, ethnicity, sexual orientation and age
can be harmful, for they may foster bias and discrimination. As a consequence, they
can lead to actions against groups of people [Cash and Brown, 1989, Kay et al., 2015].
While stereotyping can be viewed as oversimpli�ed ideas about social groups,
discrimination refers to actions that treat groups of people unfairly or put them at
a disadvantage with other groups. Some stereotypes and prejudgment found in the
material world are transferred to the online world. For example, Kay et al. [2015]
1

2 Chapter 1. Introduction
show a systematic under representation of women in image search results for some
occupations. This kind of stereotype a�ects people's ideas about professional gender
ratios in the real world and may create conditions for bias and discrimination.
All over the world, search engines are powerful mediators between individuals
and the access to information and knowledge. General search engines play a major
role when it comes to give visibility to cultural, social and economic aspects of the
daily life [Anthes, 2016]. With the ongoing growth of Internet and social media, people
are constantly exposed to steady �ows of news, information and subjective opinions of
others about cultural trends, political facts, economic ideas and social issues, among
others. In addition to information that come from di�erent sources, people use Google
to obtain answers and information in order to form their own opinion on various so-
cial issues. Recent studies have demonstrated that the ranking of answers provided
by search engines have a strong impact on individuals attitudes, preference and be-
havior [Epstein and Robertson, 2015]. Usually, people trust the answers in higher
ranks, without having any idea how the answers get ranked by complex and opaque
algorithms [Pasquale, 2015]. Search engines can be viewed as part of a broad class of
social algorithms, that are used to size us up, evaluate what we want, and provide a
customized experience [Lazer, 2015]. Physical attractiveness is a pervasive and pow-
erful agent in the social world, that is also being a�ected by social algorithms and by
the growing digitization of the physical world. Physical attractiveness has in�uence
on decisions, opportunities and perceptions of ourselves and others. Thus, one natural
question arises: what is the impact of search engines on the perception of physical
attractiveness? This question is one of the targets of this thesis.
1.1 Research Goals
Every day, Google processes over 3.5 billion search queries.1 The search engine
decides which of the billions of web pages are included in the search results and how to
rank the results. Google also provides images as the result of queries. Thus, in order to
understand the existence of global stereotypes, we decide to start looking at the search
engines as possible sources of stereotypes. In this thesis we focus our analysis on the
following research questions:
• Can we identify stereotypes for female physical attractiveness in the images avail-
able in the Web?
1http://www.internetlivestats.com/google-search-statistics/

1.2. Contributions 3
• How do race and age manifest in the observed stereotypes?
• How do stereotypes vary according to countries and regions?
In our analyses, we look for patterns of women's physical features that are con-
sidered aesthetically pleasant or beautiful in di�erent cultures. We also look at the
reverse, i.e., patterns are considered aesthetically ugly [William, 1753]. In order to an-
swer the research questions, we conduct a series of experiments on the two most popular
search engines, Google and Bing. We start the experimentation by querying the search
engines for beautiful and ugly women. We then collect the top 100 image search results
for di�erent countries. Once we have veri�ed the images, we use Face++, which is an
online API that detects faces in a given photo. Face++ infers information about each
face in the photo such as age, race and gender. Its accuracy is known to be over 90%
[Bakhshi et al., 2014] for face detection. The images collected from Google and Bing,
classi�ed by Face++, form the datasets used to conduct the stereotype analyses.
1.2 Contributions
The main goal of this work is to identify stereotypes for female physical attrac-
tiveness in images available in search engines results and to examine the local and
global impact of the internet on the formation of these stereotypes. We propose a
methodology to understand how race and age manifest in online stereotypes of beauty
and how they vary according to countries. To do that, we conducted experiments on
Google and Bing by querying the search engines for beautiful and ugly women. In
summary, our main contributions are:
• We identi�ed stereotypes for female physical attractiveness in the images available
in the Web.
• We showed how race and age manifest in the observed stereotypes. In partic-
ular, negative stereotypes about black women and older women, and positive
stereotypes about white women in terms of beauty and attractiveness.
• We showed how stereotypes may vary according to countries, depending how the
search is performed. Results from search engines are biased towards the language
used to query the system, in the sense that countries that share the same language
exhibit similar results.

4 Chapter 1. Introduction
We believe that the �rst step in solving a problem is to recognize that it does exist.
Our �ndings demonstrate the existence of stereotypes for female physical attractiveness
and an important way to �ght gender and age discrimination is to discourage them.
Part of the results presented in this thesis was published in [Araújo et al., 2016].
The publication of the paper itself was a great contribution, since our �ndings were
published in The Washington Post journal2 stimulating the discussion about the im-
portance of understanding the impact of search engine results for society. Besides, our
work was presented in two international workshops:
• Workshop on Data and Algorithmic Transparency (DAT'16), 2016, New York
University Law School, NY/USA.
• Algorithms, Law and Society: Building Rights for a Digital Era, 2016, Harvard
Law School, MA/USA.
1.3 Organization
This thesis is organized as follows:
Chapter 2 [Background]: In this chapter, we present the related work and an
overview about characterization studies of search engines, bias and discrimina-
tion in the media, as well as physical attractiveness. Furthermore, we give a
more detail description of the background information necessary for the reader
to understand the motivation and relevance of the work.
Chapter 3 [Identifying and Characterizing Stereotypes]: In Chapter 3, we
present our methodology to identifying and characterizing beauty stereotypes,
including the data gathering process and a characterization of the database.
Chapter 4 [Locality in Stereotypes]: In Chapter 4, based on insights obtained
through Chapter 3, we investigate the impact of local and global factors on the
formation of stereotypes in search engine results.
Chapter 5 [Conclusions and Future Work]: Finally, in Chapter 5, we present
the conclusions of this thesis, highlighting its main contributions and possibilities
for future work..
2https://www.washingtonpost.com/news/the-intersect/wp/2016/08/10/study-image-results-for-the-google-search-ugly-woman-are-disproportionately-black/?utm_term=.1a6613f563f1

Chapter 2
Background
In this chapter, we present some previous characterization studies of search en-
gines, bias and discrimination in the media, as well as physical attractiveness and
possibles origins of beauty standards. Furthermore, we give a more detail descrip-
tion of what are principles for accountable algorithms and algorithm auditing, these
concepts are important to understand the motivation and relevance of our work.
2.1 Stereotypes
Stereotypes can be regarded as "pictures in our head that portray all members
of a group as having the same attribute" [Banaji and Greenwald, 2013]. A context
where we may �nd stereotypes is beauty. Beauty is a property, or set of properties,
that makes someone capable of producing a certain sort of pleasurable experience in
any suitable perceiver [Rationality., 1999]. It is known that what is de�ned as beautiful
or ugly might change from person to person. Similarly, the concept of racial identity
is shaped by experiences and social interactions that are speci�c to the context of
each person or group, such as gender, education level, family structure [Mazza et al.,
1999]. In the past, television, movies, and magazines have played a signi�cant role
in the creation and dissemination of stereotypes related to the physical appearance or
physical attractiveness of women [Downs and Harrison, 1985]. The concepts of beauty
and youth have been used to create categories of cultural and social stereotypes. The
idealized images of beautiful women have contributed to create negative consequences
such as eating disorders, low self esteem and job discrimination. Because of this we
believe that investigating the existence of beauty stereotypes on the Web is relevant.
The reasons why beauty standards exist and how they are built are topics that
are broadly discussed from the biological and evolutionary point of view. In the book
5
6 Chapter 2. Background
"The Analysis of Beauty" published in 1753, William [1753] describes theories of visual
beauty and grace. For the authors in [van den Berghe and Frost, 1986] the aesthetic
preference of the human beings is a case of gene-culture co-evolution. In other words,
our standards of beauty are shaped, simultaneously, by a genetic and cultural evolu-
tion. Other studies [Fink et al., 2006, Grammer et al., 2003] argue that the beauty
standards are part of human evolution and therefore reinforce characteristics related to
health, among other features that may re�ect the search for more 'quali�ed' partners
for reproduction. Some works are concerned to understand how, despite cultural dif-
ferences, the concept of beauty seems to be built in the same way worldwide. Diverse
ethnic groups agree consistently over the beauty of faces [Cunningham et al., 1995],
although they disagree regarding the attractiveness of female bodies. It is even possible
to indicate which features are the most desirable: childish face features for women -
big eyes and small nose, for example. In [Coetzee et al., 2014], the authors conclude
that: people tend to agree more with respect to faces that are more familiar and in
some cultures the skin tone is more important in the classi�cation of beautiful people,
but, in other cases, it is the face shape. In Computer Science, Eisenthal et al. [2006]
demonstrated that using machine learning methods, it is possible to predict, at a cor-
relation of 0.6, a face attractiveness score, showing that it is possible for a machine to
learn what is beautiful from the point of view of a human.
Media in�uences people's perceptions about ethnic issues [Mazza et al., 1999].
In the USA, for example, media tends to propagate stereotypes that bene�t domi-
nant groups. Black men, for example, are often stereotyped as violent, even though
much of the black population does not agree with the way they are represented and
believe that this construction is harmful, unpleasant or distasteful. New technologies
bring prejudices already present in society, for example, Uber drivers who have African
American last names tend to get more negative reviews. Just as black tenants have
less chances of getting a vacancy at rented apartments on Airbnb site [Allibhai, 2016].
In the medical scenario, because of false judgments, black patients may receive inferior
treatment compared to the treatment given to white people [Ho�man et al., 2016].
Many health-care professionals believe in biological di�erences with respect to black
and white people, for example, black skin to be more resistant. In our work, we are
concerned with understanding the role of the Internet in disseminating stereotypes.
Algorithms have a strong in�uence in our lives, since they often determine what
content we will consume, places we will visit, etc. Therefore it is important, from
an ethical and social point of view, understanding how algorithms can be biased or
even discriminatory against some groups [Bonchi et al., 2016]. Discrimination is an
unjusti�ed di�erence in treatment on the basis of any physical or cultural trait, such

2.2. Search Engines 7
as gender, ethnic group and religion, among others [Romei and Ruggieri, 2014]. In
our case we will identify whether search engines propagate stereotypes by representing
negatively speci�c groups of people. Algorithms can do these sort of things, even if
the computing process is fair. Most machine learning methods, for example, are based
upon assumptions that the historical data is correct, and represents the population
well, which is often far from reality [Zliobaite, 2015]. A learning algorithm is designed
to pick up statistical patterns in training data and if the training data re�ect existing
social biases against a minority, the algorithm will probably incorporate these biases
[Barocas and Selbst, 2014, Hardt, 2014].
2.2 Search Engines
Still in 1994, McBryan [1994] wrote that a fundamental problem with the WWW
(World Wide Web) was the enormous number of resources available and the di�culty of
locating and tracking everything. In this scenario information retrieval, the process of
searching within a document collection for a particular information need [Langville and
Meyer, 2006], emerged, since the growing amount of information required the creation
of search tools for retrieval of useful information [Andronico et al., 2004]. Speci�cally,
a search engine is the practical application of information retrieval techniques to large-
scale text collections [Croft et al., 2009], and it is important for retrieving information
from the Web. In response to a user query, search engines return a list of results
ranked in order of relevance. Then, the user can examine one result at a time, until
the information has been found [Carpineto et al., 2009]. The search process consists,
basically, of three main steps: crawling, the process used by search engines to collect
pages from the Web; indexing, how the data is stored; and ranking, order the most
relevant documents [Baeza-Yates and Ribeiro-Neto, 2011, Castillo, 2005].
The World Wide Web Worm [McBryan, 1994] was one of the �rst developed web
search engines and, at the time, it had an index of 110.000 pages and web-accessible
documents. A few years later, Larry Page and Sergey Brin founded Google, one of
the most popular search engines nowadays1, while they were students at Stanford
University.2 Brin and Page [1998] presented Google as a prototype of a large-scale
search engine designed to crawl and index the Web e�ciently and produce much more
satisfying search results than existing systems at the time. Now, Google processes over
40.000 search queries every second on average, over 3.5 billion searches per day and 1.2
1http://www.ebizmba.com/articles/search-engines2https://www.google.com/about/company/history/

8 Chapter 2. Background
trillion searches per year around the world.3
Because of its scope and impact power, Google has become an object of study
in the �eld of digital media and key to understand how the results of queries a�ect
people who use search engines. Previous studies investigated the existence of bias in
speci�c scenarios. [Umoja Noble, 2013] shows how racial and gender identities may
be misrepresented, when, in this context, there is commercial interest. The result of
a query to Google typically prioritizes some kind of advertisement, which should -
ideally - be related to the query. But search engines are often biased, so it is important
to assess how the result ranking is built and how it a�ects the access to information
[Introna and Nissenbaum, 2000]. Some more recent results argue that discriminating
a certain group is inappropriate, since search engines are 'information environments'
that may a�ect the perception and behavior of people [Kay et al., 2015]. One example
of such discrimination is, when searching the names of people with black last names,
the higher likelihood of getting ads suggesting that these people were arrested, or face
a problem with justice, even when it did not happen [Sweeney, 2013]. In this case,
the search algorithm supposedly discriminates a certain group of people while looking
for pro�t from advertising. [Umoja Noble, 2012] has questioned the commercial search
engines because the way they represent women, especially black women, and other
marginalized groups, regardless of cultural issues. This behavior masks and perpetuate
unequal access to social, political and economic life of some groups. Besides the search
itself, other site features are also analyzed. Baker and Potts [2013] highlights how the
auto-complete search algorithm o�ered by Google can produce suggested terms which
could be viewed as racist, sexist or homophobic.
2.3 Principles for Accountable Algorithms and
Algorithm Auditing
The concept of accountability is important to many activities and arrangements
in government and business, such as elections, work-place hierarchies, and delegation
of authority. Accountability is used to encourage and reward good performance, to
expose failures and undesirable behavior, besides to build trust among competing indi-
viduals and organizations. Therefore, accountability is a subject that has been studied
in law, political theory, and philosophy. Nowadays, computer scientists and society are
concerned about accountable algorithms [Druschel, 2008, Feigenbaum et al., 2011]. In
an article published on The New York Times, Angwin [2016] stated the proliferation
3http://www.internetlivestats.com/google-search-statistics/#trend

2.3. Principles for Accountable Algorithms and Algorithm Auditing9
of automated decision-making in everyday life has been accompanied by a necessity to
make algorithms accountable. Algorithmic discrimination - for example, an individual
or group receiving unfair treatment as a result of algorithmic decision-making - is a
motivation for accountable algorithms [Goodman, 2016]. Autonomous decision mak-
ing is the essence of algorithmic power, but on other hand are humans that establish
criteria choices, such as optimization functions and training data [Diakopoulos, 2016].
In other words, the human operator in�uences the algorithm. In our modern society,
machine learning algorithms have an important role in making substantive decisions,
from online personalization to credit decisions. But often their decision-making pro-
cesses are opaque [Datta et al., 2016]. In [Introna and Nissenbaum, 2000] the authors
suggest that search engines systematically exclude, by design or accidentally, certain
sites and certain types of sites in favor of others, for users, it is di�cult to understand
why this certain decision was made.
Given the potential for signi�cant societal impact of algorithms, mentioned in
the previous paragraph, Diakopoulos et al. [2016] write a document to help in the
design and implementation of algorithmic systems in publicly accountable ways. For
them, accountability includes an obligation to report, explain, or justify algorithmic
decision-making as well as mitigate any negative social impacts or potential harms.
They outlined �ve important guiding principles:
• Responsibility: Make available externally visible avenues of redress for adverse
individual or societal e�ects of an algorithmic decision system, and designate an
internal role for the person who is responsible for the timely remedy of such issues.
• Explainability: Ensure that algorithmic decisions as well as any data driving those
decisions can be explained to end-users and other stakeholders in non-technical
terms.
• Accuracy: Identify, log, and articulate sources of error and uncertainty throughout
the algorithm and its data sources so that expected and worst case implications
can be understood and inform mitigation procedures.
• Auditability: Enable interested third parties to probe, understand, and review the
behavior of the algorithm through disclosure of information that enables monitor-
ing, checking, or criticism, including through provision of detailed documentation,
technically suitable APIs, and permissive terms of use.

10 Chapter 2. Background
• Fairness: Ensure that algorithmic decisions do not create discriminatory or un-
just impacts when comparing across di�erent demographics, such as race, gender
and age.
Transparency is also an important principle, algorithmic transparency provides
several bene�ts [Datta et al., 2016]. For example, Chen et al. [2016] analyzes empiri-
cally algorithmic pricing strategies on Amazon Marketplace showing that transparency
is important to help people to understand how the use of data about them a�ects the
ads they see. Unfortunately, very often, the principles for accountable algorithms are
not followed. In these cases it is possible to apply algorithm auditing - a mechanism
for achieving transparency and verify correct functioning of algorithms [Mittelstadt,
2016]. Some traditional areas of audit are, but are not limited to, �nancial audits,
compliance audits with respect to laws and regulations and performance audits [Hasan
and Stiller, 2005]. Sandvig et al. [2014] generally describes audit studies as �eld ex-
periments in which researchers participate in a social process that they suspect to be
corrupt in order to diagnose harmful discrimination. For example, to verify the ex-
istence of discrimination against job applicant seeking employment, researchers can
create di�erent candidate pro�les (age, gender, race...) with the same skills and target
it at real employers. A di�erent answer for two candidates with the same skills, but
di�erent demographic characteristics, may indicate the presence of bias or even discrim-
ination. From the perspective of Computer Science, the auditing process investigate
the functionality and impact of decision-making algorithms [Mittelstadt, 2016].
"Algorithm Auditing" is an emerging area of research and allows researchers,
designers, and users new ways to understand algorithms "from the outside", some-
times testing them for problems and harms without the cooperation of the algorithm
providers. Auditing studies have so far investigated algorithms that handle recom-
mendations, prices, news, and search, examining them for individually and societally
undesirable consequences such as racism or fraud [Karahalios, 2015]. In our work we
examined the presence of stereotypes in search engines, auditing two speci�c search
engines: Google and Bing. In [Sandvig et al., 2014], the authors de�ned di�erent
algorithm auditing methods. Our work employs a 'scraping audit' since we, repeat-
edly, send similar queries to the search engines and observe the results, looking for
stereotypes patterns.

Chapter 3
Identifying and Characterizing
Stereotypes
In this chapter we describe the methodology used for identifying and character-
izing stereotypes. We use a database of photos and information extracted from these
photos, in particular features of the people portrayed. The �rst step of the method-
ology involves the data collection process: what and how to collect the data. Then
we extract information about the collected photos, using computer vision algorithms
to identify race, age and gender of the people in each picture. The second part of the
research refers to the use of the collected information to identify stereotypes.
3.1 Methodology
3.1.1 Data Gathering
Our aim is to identify and characterize stereotypes in a beauty context. To work
with this context we build a dataset with the top 100 photos of the results of the
following queries (in di�erent languages): beautiful woman and ugly woman. It is
known that what is de�ned as beautiful or ugly might change from person to person,
then we chose these two antonym adjectives that are commonly used to describe the
quality of beauty of people.
Data gathering was carried through two search engine APIs for images: Google1
and Bing2. Once gathered, we extract features from the photos using Face++3.
1Google Custom Search: http://bit.ly/1WjHBNJ2Bing Image Search API: http://bit.ly/2cyjGsy3http://www.faceplusplus.com/
11

12 Chapter 3. Identifying and Characterizing Stereotypes
The data gathering process is depicted in Figure 3.1 and summarized next:
1. De�ne search queries
De�ne search queries, in our case beauty related, and translate4 the query to the
target languages.
2. Gathering
Using the search engines APIs, perform the searches with the de�ned queries.
Then, �lter photos that contain the face of just one person.
3. Extract attributes of photos
Using face detection tools estimate race and age.
Figure 3.1: Data Gathering Framework.
Bing's API o�ers a limited number of countries to choose for the searches5, we
collected data from 28 countries. For Google we collected data for 41 countries, adding
more countries with di�erent characteristics, providing better coverage in terms of
regions and internet usage. The searches were performed for the following countries and
their o�cial languages (for some countries more than one language, see appendix A):
Google: Algeria, Angola, Argentina, Australia, Austria, Brazil, Canada, Chile, China,
Denmark, Egypt, Finland, France, Germany, Greece, Guatemala, India, Iraq,
Italy, Japan, Kenya, Malaysia, Mexico, Morocco, Nigeria, Paraguay, Peru, Por-
tugal, Russia, Saudi Arabia, South Africa, South Korea, Spain, Sweden, Switzer-
land, Turkey, Ukraine, United Kingdom, United States, Venezuela, Zambia.
4Using Google Translator: http://translate.google.com.br/5https://msdn.microsoft.com/en-us/library/dn783426.aspx#countrycodes

3.1. Methodology 13
Bing: Argentina, Australia, Austria, Brazil, Canada, Chile, China, Denmark, Fin-
land, France, Germany, India, Ireland, Italy, Japan, Malaysia, Mexico, Portugal,
Russia, Saudi Arabia, South Africa, South Korea, Spain, Sweden, Switzerland,
Turkey, United Kingdom and United States.
3.1.1.1 Dataset Characterization
Now we present a brief characterization of the datasets collected for this work. As
mentioned, we picked the top 100 photos for each query but we consider as valid only
images for which Face++ was able to detect a single face. In appendix A, we present
the number of photos that Face++ was able to detect a single face per country, for
Google and Bing. In order to make our results more robust, we would like to de�ne a
minimum value of valid photos so that a query could be used in the characterization
and analysis. At the same time, we would like to eliminate as few queries as possible.
In the Figure 3.2, we observe the CDF (cumulative distribution function) of the values
of valid photos for queries. From the plot analysis, we decided that characterization
and analysis will be performed for all query responses that contain at least 40 valid
photos. In this way, we eliminate about 5% of the queries only.
Figure 3.2: CDF - Useful Photos.
For the �rst step of the characterization our aim is to show the race distribution

14 Chapter 3. Identifying and Characterizing Stereotypes
by country. Figure 3.3 (color online) shows the race distribution of the 41 countries
for which we performed searches on Google and in Figure 3.4 (color online) the 28
countries of Bing.
Figure 3.3: Race Fractions for Google (color online).
Our �rst observation from the charts is that the fraction of black women in search
'ugly women' is clearly larger, in general, for the two search engines. We have also
calculated the mean and standard deviation of each race for both queries and search
engines. From the results in Table 3.1 we can con�rm this observation.
Another interesting point is that Asian countries - China, Japan, Malaysia, South
Korea, Japan - generally have a larger proportion of Asians in both queries. This kind
3.1. Methodology 15
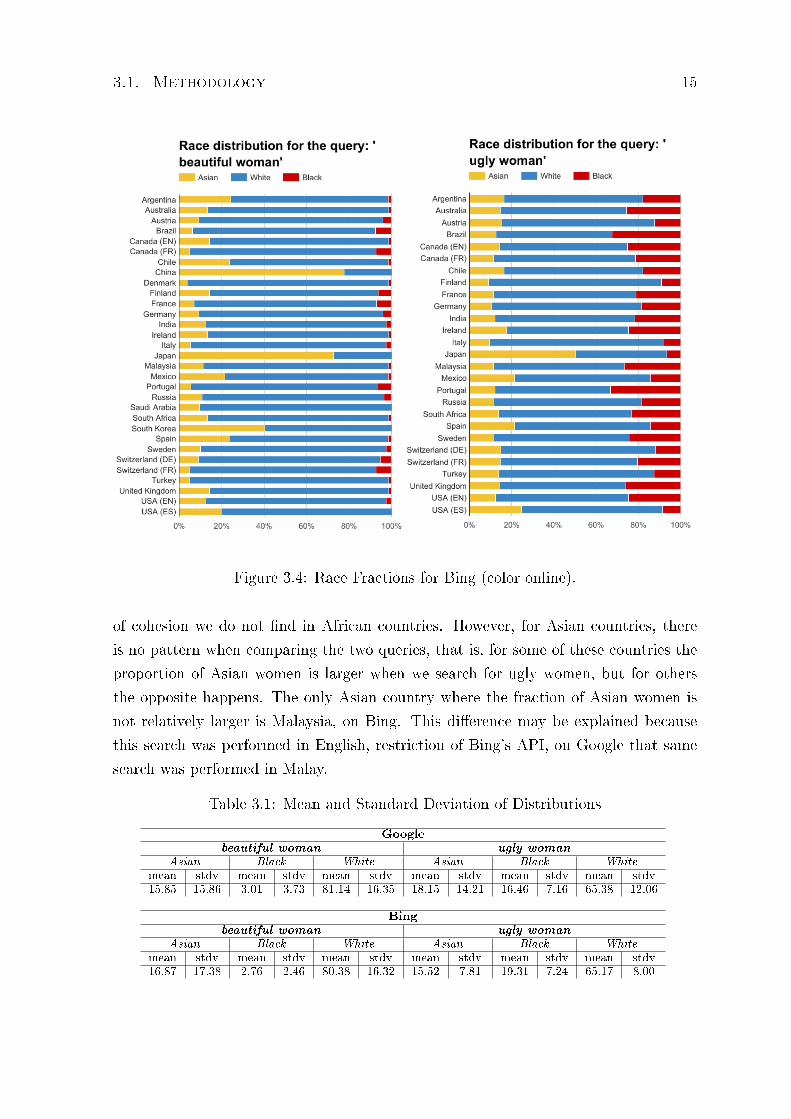
Figure 3.4: Race Fractions for Bing (color online).
of cohesion we do not �nd in African countries. However, for Asian countries, there
is no pattern when comparing the two queries, that is, for some of these countries the
proportion of Asian women is larger when we search for ugly women, but for others
the opposite happens. The only Asian country where the fraction of Asian women is
not relatively larger is Malaysia, on Bing. This di�erence may be explained because
this search was performed in English, restriction of Bing's API, on Google that same
search was performed in Malay.
Table 3.1: Mean and Standard Deviation of Distributions
beautiful woman ugly womanAsian Black White Asian Black White
mean stdv mean stdv mean stdv mean stdv mean stdv mean stdv15.85 15.86 3.01 3.73 81.14 16.35 18.15 14.21 16.46 7.16 65.38 12.06
Bing
beautiful woman ugly womanAsian Black White Asian Black White
mean stdv mean stdv mean stdv mean stdv mean stdv mean stdv16.87 17.38 2.76 2.46 80.38 16.32 15.52 7.81 19.31 7.24 65.17 8.00

16Chapter3.IdentifyingandCharacterizingStereotypes
Figure 3.5: Age distribution for Google.

3.1.Methodology
17
Figure 3.6: Age distribution for Bing.

18 Chapter 3. Identifying and Characterizing Stereotypes
The second step of the characterization shows the di�erence between the age dis-
tribution of women in photos by query and search engine through boxplots (Figures 3.5
and 3.6). In the x-axis we have the analyzed countries and the y-axis represents ages.
Analyzing the median and upper quartile, we noticed that beautiful women tend to
be younger than the ugly women. We can also observe that, in general, for Asian
countries, we have younger women.
3.1.2 Data Analysis
In the last section we observed the presence of some patterns in the racial pro-
portions and in the age distribution for the queries beautiful and ugly woman, such as
the fraction of black women in search 'ugly women' being generally larger and beau-
tiful women being younger than the ugly women. In the Data Analysis section our
main purpose is to identify if these patterns are in fact stereotypes, in other words,
our purpose is to identify whether there is a stereotype in the perception of physical
attractiveness. For sake of our analysis, we distinguish two characteristics extracted
from the pictures: race and age. As discussed, stereotype is a subjective concept and
quantifying it through objective criteria is a challenge. In our case, we employed a
contrast-based strategy. Considering race as a criterion, we check the di�erence be-
tween the fractions of each race for opposite queries, that is, beautiful woman and ugly
woman. We consider that there is a negative stereotype of beauty in relation to a race,
when the frequency of this particular race is larger when we search for ugly women
compared to when we search for beautiful woman. Likewise, the stereotype is consid-
ered to be positive when the fraction is larger when we search for beautiful woman.
Similarly, we say that there is a age stereotype when the age range of the women are
younger in the searches for beautiful women. We characterize the occurrence of these
stereotypes through seven questions. Formally,
Q1 (negative stereotype for black women): Is the fraction of black women larger when
we search for ugly women than when we search for beautiful women?
Q2 (negative stereotype for Asian women): Is the fraction of Asian women larger when
we search for ugly women than when we search for beautiful women?
Q3 (negative stereotype for white women): Is the fraction of white women larger when
we search for ugly women than when we search for beautiful women?
Q4 (positive stereotype for black women): Is the fraction of black women smaller when
we search for ugly women than when we search for beautiful women?

3.1. Methodology 19
Q5 (positive stereotype for Asian women): Is the fraction of Asian women smaller
when we search for ugly women than when we search for beautiful women?
Q6 (positive stereotype for white women): Is the fraction of white women smaller
when we search for ugly women than when we search for beautiful women?
Q7 (age stereotype): Are the women's ages when we search for beautiful women younger
than the ages of the women when we search for ugly women?
Each of these questions is associated with a test hypothesis. For the questions
Q1, Q2 and Q3, negative stereotype, the test hypothesis is:
H0(null hypothesis) : The fraction of women of the speci�c race (i.e., black, white,
Asian) is smaller, or equal, when we search for ugly women, than when we search
for beautiful women.
Ha(alternative hypothesis) : The fraction of women of the speci�c race (i.e., black,
white, Asian) is larger when we search for ugly women than when we search for
beautiful women.
For the questions Q4, Q5 and Q6, positive stereotype:
H0 : The fraction of women of a speci�c race (black, white, Asian) is larger, or equal,
when we search for ugly women than when we search for beautiful women.
Ha : The fraction of women of a speci�c race (black, white, Asian) is smaller when we
search for ugly women than when we search for beautiful women.
For the question Q7:
H0 : The age range of the beautiful women is older, or equal, than the age range of
the ugly women.
Ha : The age range of the beautiful women is younger than the age range of the ugly
women.
3.1.2.1 Racial Stereotype
We assume that there is a negative stereotype when the fraction of a given race is
signi�cantly larger when we search for ugly woman than when we search for beautiful
woman and there is a positive stereotype when the fraction associated with a search
for ugly woman is signi�cantly smaller. We then calculate the di�erence between

20 Chapter 3. Identifying and Characterizing Stereotypes
these two fractions for each race and each country and verify the signi�cance of each
di�erence through the two-proportion z-test, with a signi�cance level of 0.05. The
test determines whether the di�erence between fractions is signi�cant, as follows.
For the �rst three questions, (Q1, Q2 and Q3), with con�dence of 95% we
reject the null hypothesis when the z-score is smaller than −0.8289 and we accept the
alternative hypothesis, which is the hypothesis in study.
For example, considering Finland - Google, the z-score calculated for the hypoth-
esis associated with question Q1 was −0.04, 0.76 for Q2 and −0.61 for Q3. Since noneof these values is smaller than −0.8289 we can not reject the null hypothesis and we
can not answer positively to any of the 3 questions. On the other hand, for France, the
z-score associated with question Q1 was −3.15 and −1.10 for Q2, then we can answer
positively to both questions and consider that there is a negative stereotype associated
with blacks and Asians.
For questions ( Q4, Q5 and Q6), under the same conditions, we reject the null
hypothesis when the z-score is greater than 0.8289.
For example, considering China - Google, the z-score calculated for the hypothesis
associated with question Q4 was −1.06, 0.04 for Q5 and 0.21 for Q6. Since none of
these values is greater than 0.8289 we can not reject the null hypothesis and we can
not answer positively to any of the 3 questions. On the other hand, for Australia, the
z-score associated with question Q5 was 1.61 and 1.74 for Q6, then we can answer
positively to both questions and consider that there is a positive stereotype associated
with Asians and whites. Detailed results of the tests and z-scores for each country and
each search engine are in the appendix B.
3.1.2.2 Age Stereotype
For characterizing the age stereotype, we verify our hypothesis through the un-
paired Wilcoxon test [Wilcoxon, 1945]. The null hypothesis is rejected when the p-value
is less than 0.05 and with 95% of con�dence we can answer positively to question Q7
(see appendix C for detailed results). For example, considering South Korea - Google,
the p-value found was 0.4094 then we cannot reject the null hypothesis. For Saudi Ara-
bia the p-value was 0.0109 and we accept the alternative hypothesis that demonstrates
the existence of a stereotype that gives priority to younger women.
3.1.3 Clustering Stereotypes
After identifying the existence of stereotypes in the perception of physical at-
tractiveness, we want to discover whether there is a cohesion among these beauty

3.1. Methodology 21
stereotypes across countries. For this we use the z-score table, assuming that countries
with close z-scores are similar. Then, we use a clustering algorithm to identify coun-
tries that have the same racial stereotype of beauty. The results for each country and
search engine is represented by a 3D point where the dimensions are Asian, black and
white z-scores.
There are several strategies for clustering. However, a hierarchical clustering
strategy was used in this thesis because it is not required a priori information about
the number of clusters and it outputs a hierarchy that can be very useful for our
analysis. We used the Ward's minimum variance method6 which is brie�y described
next. Using a set of dissimilarities for the objects being clustered, initially, each object
is assigned to its own cluster and then the algorithm proceeds interactively. At each
stage it joins the two most similar clusters, continuing until there is just a single cluster.
The method aims at �nding compact and spherical clusters [Murtagh and Legendre,
2014]. Another advantage of employing a hierarchical clustering strategy is that it is
not necessary to set in advance parameters such as the number of cluster of minimal
similarity thresholds, allowing us to investigate various clusters con�gurations easily.
Table 3.2: Clusters centroids - Google Dendrogram
GOOGLEBlack Asian White
Cluster Countries Mean std Mean std Mean std
1Canada (FR), China, Finland, Japan, Kenya,Malaysia, Ukraine
-1.06 1.01 1.28 1.17 -0.43 1.15
2Australia, Nigeria, South Africa, UnitedKingdom, Zambia
-3.06 0.40 1.04 0.34 1.69 0.09
3Angola, Argentina, Brazil, Canada (EN),Chile, Denmark, France, Guatemala, Mexico,Paraguay, Peru, Portugal, Spain, Venezuela
-3.96 0.33 -0.18 0.29 3.02 0.36
4Algeria, Egypt, Greece, Iraq, Morocco, SaudiArabia, South Korea
-1.76 0.35 -2.79 0.42 3.44 0.53
5Austria, Germany, India, Italy, Russia, Sweden,Switzerland (DE), Turkey, USA(EN), USA(ES)
-1.87 0.71 -0.71 0.70 1.67 0.50
The clusters we are looking for should be cohesive and also semantically meaning-
ful. Cohesion is achieved by the Ward's minimum variance method, but the semantic
of the clusters should take into account cultural, political and historical aspects. In our
case, the variance is taken in its classical de�nition, that is, it measures how far the
entities, each one represented by a numeric triple (black, Asian and white z-score val-
ues), that compose a cluster are spread out from their mean. For the results presented
here we traversed the dendrogram starting from the smallest variance to the maximum
variance, which is the root of the dendrogram. For each group of entities, we verify
what they do have in common so that we may understand why they behaved similarly
6R library: https://stat.ethz.ch/R-manual/R-devel/library/stats/html/hclust.html
22 Chapter 3. Identifying and Characterizing Stereotypes
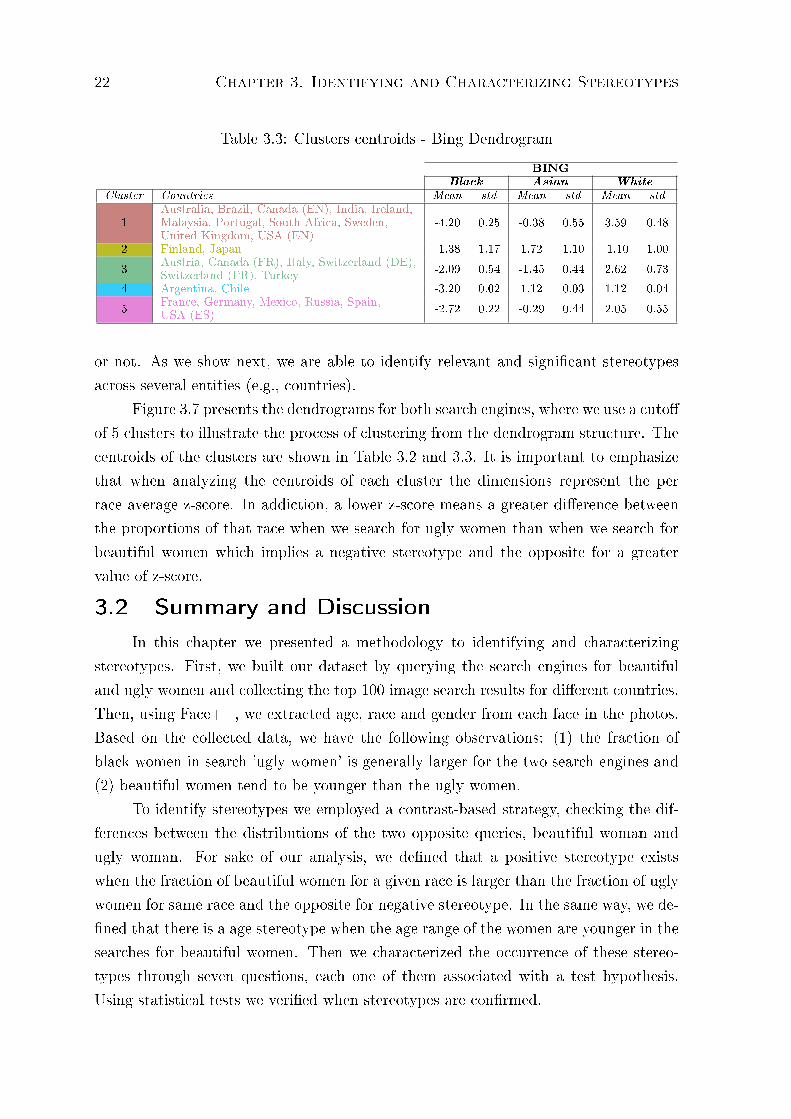
Table 3.3: Clusters centroids - Bing Dendrogram
BINGBlack Asian White
Cluster Countries Mean std Mean std Mean std
1Australia, Brazil, Canada (EN), India, Ireland,Malaysia, Portugal, South Africa, Sweden,United Kingdom, USA (EN)
-4.20 0.25 -0.38 0.55 3.59 0.48
2 Finland, Japan -1.38 1.17 1.72 1.10 -1.10 1.00
3Austria, Canada (FR), Italy, Switzerland (DE),Switzerland (FR), Turkey
-2.09 0.54 -1.45 0.44 2.62 0.73
4 Argentina, Chile -3.20 0.02 1.12 0.03 1.12 0.04
5France, Germany, Mexico, Russia, Spain,USA (ES)
-2.72 0.22 -0.29 0.44 2.05 0.55
or not. As we show next, we are able to identify relevant and signi�cant stereotypes
across several entities (e.g., countries).
Figure 3.7 presents the dendrograms for both search engines, where we use a cuto�
of 5 clusters to illustrate the process of clustering from the dendrogram structure. The
centroids of the clusters are shown in Table 3.2 and 3.3. It is important to emphasize
that when analyzing the centroids of each cluster the dimensions represent the per
race average z-score. In addiction, a lower z-score means a greater di�erence between
the proportions of that race when we search for ugly women than when we search for
beautiful women which implies a negative stereotype and the opposite for a greater
value of z-score.
3.2 Summary and Discussion
In this chapter we presented a methodology to identifying and characterizing
stereotypes. First, we built our dataset by querying the search engines for beautiful
and ugly women and collecting the top 100 image search results for di�erent countries.
Then, using Face++, we extracted age, race and gender from each face in the photos.
Based on the collected data, we have the following observations: (1) the fraction of
black women in search 'ugly women' is generally larger for the two search engines and
(2) beautiful women tend to be younger than the ugly women.
To identify stereotypes we employed a contrast-based strategy, checking the dif-
ferences between the distributions of the two opposite queries, beautiful woman and
ugly woman. For sake of our analysis, we de�ned that a positive stereotype exists
when the fraction of beautiful women for a given race is larger than the fraction of ugly
women for same race and the opposite for negative stereotype. In the same way, we de-
�ned that there is a age stereotype when the age range of the women are younger in the
searches for beautiful women. Then we characterized the occurrence of these stereo-
types through seven questions, each one of them associated with a test hypothesis.
Using statistical tests we veri�ed when stereotypes are con�rmed.

3.2.SummaryandDiscussion
23
(a) Dendrogram with the cuto� of 5 clusters for Google. (b) Dendrogram with the cuto� of 5 clusters for Bing.
Figure 3.7: Clusters: dendrogram structure, cuto� of 5 clusters.

24 Chapter 3. Identifying and Characterizing Stereotypes
Our results point out that, for the majority of countries analyzed, there is a
positive stereotype for white women and a negative one for black and, weakly, for
Asian women. Table 3.4 summarizes the test results with the fraction of countries
that we answer positively to each of the 7 questions (rejecting the null hypothesis).
For instance, column 'Google' and line 'Q1' indicates that for 90.90% of countries we
rejected the null hypothesis and we answered positively to the question Q1. That
is, the number of countries for which there is a negative stereotype for black women
dominates our statistics, since 96.30% of countries in Bing also display this type of
stereotype. We can see that the results of the two search engines agree. There is a
beauty stereotype in the perception of physical attractiveness, that is, we can say that,
signi�cantly, the fraction of black and Asian women is greater when we search for ugly
women compared to the fraction of those races when we search for beautiful women
(negative stereotype). The opposite occurs for white women (positive stereotype). In
the same way we show that there is a negative stereotype about older women. In 95.45%
of the countries in Google and 93.18% in Bing, the concept of beauty is associated with
young women and ugly women are associated with older women.
Table 3.4: Summary of results for questions Q1, Q2, Q3, Q3, Q4, Q5, Q6 e Q7
ResultsGoogle Bing
Q1 (negative/black) 90.90% 96.30%Q2 (negative/Asian) 29.54% 33.33%Q3 (negative/white) 4.54% 3.70%Q4 (positive/black) 0.00% 0.00%Q5 (positive/Asian) 18.18% 14.81%Q6 (positive/white) 84.09% 92.59%Q7 (negative/age) 95.45% 93.18%
After identifying the existence of stereotypes we explored the possibility to dis-
cover whether there is a cohesion among the beauty stereotypes across countries. Coun-
tries have di�erent con�gurations of stereotypes, and they can be grouped accordingly.
For example, some countries have a very negative stereotype against black women, but
can be 'neutral' with respect to other race. It is important to remember that a lower
z-score means a greater di�erence between the proportions of that race when we search
for ugly women than when we search for beautiful women which implies a negative
stereotype and the opposite for a greater value of z-score. Thus we use the z-score
table to cluster the countries, assuming that countries with close z-scores are similar.
In the Google dendrogram (Figure 3.7a), we can highlight cluster 3 - Angola, Ar-
gentina, Brazil, Canada, Chile, Denmark, France, Mexico, Paraguay, Peru, Portugal,

3.2. Summary and Discussion 25
Guatemala, Spain and Venezuela - which has a geographical (and linguistic) semantic
meaning. They are Latin language countries, most of them countries from the Amer-
icas. Denmark is the exception. The centroid of this cluster (black: −3.96, Asian:−0.18, white: 3.02) indicates that for this group of countries there is a very negative
stereotype regarding black women and a positive stereotype for white women. In Clus-
ter 4 - Algeria, Egypt, Greece, Iraq, Morocco, Saudi Arabia and South Korea - we
have countries from Africa, Asia and Middle East. Here we have a di�erent stereotype
(black: −1.76, Asian: −2.79, white: 3.44) since Asians have a more negative stereo-
type than blacks. For Cluster 1 - Canada, China, Finland, Japan, Kenya, Malaysia and
Ukraine - we could not identify a clear semantic meaning for the group. However, the
cluster has an interesting stereotype of beauty (black:−1.06, Asian:1.28, white:−0.43)in which the stereotype, positive or negative, are small. There is a coherence between
the proportions of the races for the two queries, that is, for part of these countries
there is no signi�cant di�erence between the fractions of the races when we search for
beautiful women or ugly women.
In order to deepen the understanding of the stereotypes, we looked at the race
composition of some countries to verify if they may explain some of the identi�ed
patterns. In Japan, Asians represent 99.4% of population7, in Argentina 97% of pop-
ulation are white8, in South Africa 79.2% are blacks and 8.9% white9, at last, in USA
racial composition is 12% of blacks and 62% of whites10. Although the racial compo-
sition of these countries indicate di�erent fractions of black people, the search engine
results show for all of them the presence of the negative stereotype of beauty about
black women. We did not �nd any speci�c relation between the racial composition of
a country and the patterns of stereotypes identi�ed for the country.
7http://www.indexmundi.com/japan/demographics_pro�le.html8http://www.indexmundi.com/argentina/ethnic_groups.html9http://www.southafrica.info/about/people/population.htm#.V4koMR9yvCI10http://k�.org/other/state-indicator/distribution-by-raceethnicity/

Chapter 4
Locality in Stereotypes
In the previous chapter we identi�ed stereotypes for female attractiveness in im-
ages available on the Web, more speci�cally on search results. However, we did not
�nd any speci�c relation between the racial composition of a country and the patterns
of stereotypes identi�ed for the same country. Considering the internet is blurring the
lines between local and global cultures, a relevant issue is to understand the impact of
local and global factors on the formation of stereotypes in search engine results. In this
chapter, in order to do that, we focus on the analysis of answers provided by search
engines in di�erent countries to questions associated with physical attractiveness. Our
methodology aims to identify the in�uence of globalization of the internet and local
culture on the formation of stereotypes through two factors: language and location.
The complexity of internet search platforms, such as Google and Bing, makes it
impossible to look for transparency of their algorithms and data. Thus, our approach
for the stereotype problem is to follow the concept of transparency of inputs and outputs
(a.k.a. as black-box techniques) of a class of speci�c queries [Chander, 2016]. This
approach allows us to verify whether the algorithm is generating discriminatory impact
or not. Identi�ng that the results of an algorithm are systematically discriminatory
is enough to seek to redesign the algorithm, or to distrust its results. This type of
approach has been successfully used to analyze the behavior of complex systems, such
as virtual machines [Wood et al., 2007]. Black-box techniques infer information about
the behavior of systems by simply observing each virtual machine from the outside
and without any knowledge of the application resident within each machine. Several
interesting observations related to bias and fairness were learned from the quantitative
analysis of the global and local answers provided by the search engines to our set of
input queries on female physical attractiveness.
Similarly to what was done in the previous chapter, the starting point of our
27

28 Chapter 4. Locality in Stereotypes
analysis is a set of image queries submitted to di�erent search engines. We then
analyze, for each query, the top 100 images checking which images do repeat across
queries as well as image characteristics (e.g., race) and try to draw patterns that
arise for languages and countries. However, at this stage in particular, since the same
language may be spoken in several countries, we employ a two-level strategy, where we
�rst check for patterns at the language and then we also consider location as well. In the
following sections, we �rst describe the data gathering strategy, then the procedure to
generate image �ngerprints that will allow to detect the occurrence of the same image
in several queries and �nally the similarity metric used to compare query results.
4.1 Methodology
4.1.1 Data Gathering: Global and Local
The data gathering process is the same described in Section 3.1.1. But now we
build two di�erent datasets, one with default parameters and the other with parameters
to return only results of the same country. For both datasets, each query is associated
with a single country, that is, it is expressed in the o�cial language of the country and
submitted to a service whose address is in the top level domain (TLD) of the target
country. The �rst dataset, named global, does not restrict the source of the images
in terms of TLD of the site that provides them, that is, the images collected are not
necessarily from hosts in the country for which the API is submitting the search. The
second dataset is named local, since we also de�ne the country from which the images
must come.
Over again, using the APIs we were able to obtain 100 images for query, but we
consider as valid only images in which Face++ was able to detect a single face and
the analysis will be performed for all query responses that contain at least 40 valid
images (see appendix A). The three query searches (beautiful woman, ugly woman
and woman) were performed for several countries, providing a good coverage in terms
of regions and internet usage, and their o�cial languages:
Google: Algeria, Angola, Argentina, Australia, Austria, Brazil, Canada, Chile, China,
Denmark, Egypt, Finland, France, Germany, Greece, Guatemala, India, Iraq,
Italy, Japan, Kenya, Malaysia, Mexico, Morocco, Nigeria, Paraguay, Peru, Por-
tugal, Russia, Saudi Arabia, South Africa, South Korea, Spain, Sweden, Switzer-
land, Turkey, Ukraine, United Kingdom, United States, Venezuela, Zambia.

4.1. Methodology 29
Bing: Argentina, Australia, Austria, Brazil, Canada, Chile, China, Denmark, Finland,
France, Germany, Greece, India, Ireland, Italy, Japan, Malaysia, Mexico, Portu-
gal, Russia, South Africa, South Korea, Spain, Sweden, Switzerland, Turkey,
United Kingdom and United States.
4.1.2 Image Fingerprinting
We aim to verify the co-occurrence of images in di�erent scenarios. In other
words, we want to evaluate whether images are repeated across service, queries and
countries. In order to identify the co-occurrence of images across datasets, we need to
determine whether or not two images are the same.
Matching their URLs is not enough, since the same image may be provided by
di�erent sites. Using a hash function such as MD5 or SHA-1 does not solve the problem
either, since a re-sized image would be associated with a completely di�erent hash value
compared to the original one. Thus, it was necessary to employ a technique able to
"�ngerprint" an image (i.e., to determine a label that uniquely identi�es the image,
despite small modi�cations): the dHash (di�erence hash) algorithm [Krawetz, 2013].
The dHash algorithm consists of four main steps:
1. Reduce size: shrinking images to 9x8 pixels;
2. Reduce color: converting images to grayscale;
3. Compute the di�erence: computing di�erences between adjacent pixels;
4. Assign bits: assigning bits whenever the left pixel is brighter than the right pixel.
This algorithm will output a 64-bit hash value per image that we use to uniquely
identify the images in our datasets.
4.1.3 Similarity Metric
Since we are able to uniquely identify each image, we need an adequate similarity
metric to compare the sets of images returned by di�erent queries. Given two lists of
images, A and B, the Jaccard Index measures the similarity (or diversity) between A
and B, and is calculated as:
J(A,B) =|A ∩B||A ∪B|
.
In other words, it is the ratio between the size of the intersection and the size of the
union of A and B. The closer the index is to 0, more diverse the sets are, while an
30 Chapter 4. Locality in Stereotypes
index closer to 1 indicates that A and B are similar. In practice, each set of images
returned by a search is represented as a set of �ngerprints, and we de�ne the similarity
of two searches through their Jaccard Index.
4.2 Experiments and Results
This section describes the experiments carried out in our analysis and present
the main results. First, we present evidence that images co-occur in di�erent datasets.
Then, we characterize the repetition of images across search results by analyzing the
similarities between them. Finally, we compare global and local results, analyzing them
in terms of similarity and racial pro�le of the target countries.
4.2.1 Repetition of Images
In order to analyze the repetition of images across our search results, we start
by calculating the dHash of each image and determining the frequency of each unique
hash value in our datasets. Our goal is to analyze how frequently the same images
appear in multiple queries, countries and services. For this experiment we use only the
global dataset.
First, in Figure 4.1 (color online) we observe the number images by the number
of occurrences, segmenting by services. Although most images are unique, it is possible
to see repetitions.
Figure 4.2 (color online) shows the Cumulative Distribution Function (CDF) of
the number of repeated images, for three scenarios: whole dataset (left), grouping by
query (center) and grouping by service (right). First, we observe that there are, indeed,
images that do appear in several sets of results. Although approximately 65% of the
images are unique, some images appear in up to 42 di�erent sets of results.
Another interesting �nding is that images resulting for the query "ugly woman"
seem to repeat more often than the other queries. For instance, the maximum value
of repetition for "ugly woman" is 42, whereas for "beautiful woman" is 16 and for
"woman" is 15. Also, analyzing the distribution in Figure 4.2 (center) we observe
that approximately 99% of the images repeat themselves less than 9 times for plain
and beautiful woman, while for ugly the same happens for approximately 95% of the
images.
Comparing the distribution between services, we observe that they are slightly
di�erent. In Bing results, approximately 60% of the images are unique, while in Google
it is approximately 70%. These results motivate us to investigate what are factors that
in�uence image repetition.

4.2.ExperimentsandResults
31
bing google
0 1 2 3 4 5 6 7 8 9 1011121314151617181920212223242526 0 1 2 3 4 5 6 7 8 9 10 11 12 13 14 15 16 17 18
0
400
800
1200
0
200
400
600
800
Number of Occurrences
Num
ber
of Im
ages
query woman beautiful woman ugly woman
Figure 4.1: Frequency of the number of occurrences (repetition) of images in our datasets (color online).
0.00.10.20.30.40.50.60.70.80.91.0
−1 1 3 5 7 9 1113151719212325272931333537394143
Number of Occurrences
P(X
< x
)
all
0.00.10.20.30.40.50.60.70.80.91.0
−1 1 3 5 7 9 1113151719212325272931333537394143
Number of Occurrences
P(X
< x
)
query woman beautiful woman ugly woman
0.00.10.20.30.40.50.60.70.80.91.0
0 2 4 6 8 10 12 14 16 18 20 22 24 26
Number of Occurrences
P(X
< x
)
service bing google
Figure 4.2: CDF of image repetition (color online).
32 Chapter 4. Locality in Stereotypes
4.2.2 Co-occurrence of Images
Now we aim to investigate the reasons for the co-occurrence of images. We
measure similarity between services, queries and countries. For the analysis presented
in this section just the global dataset was used.
4.2.2.1 Services
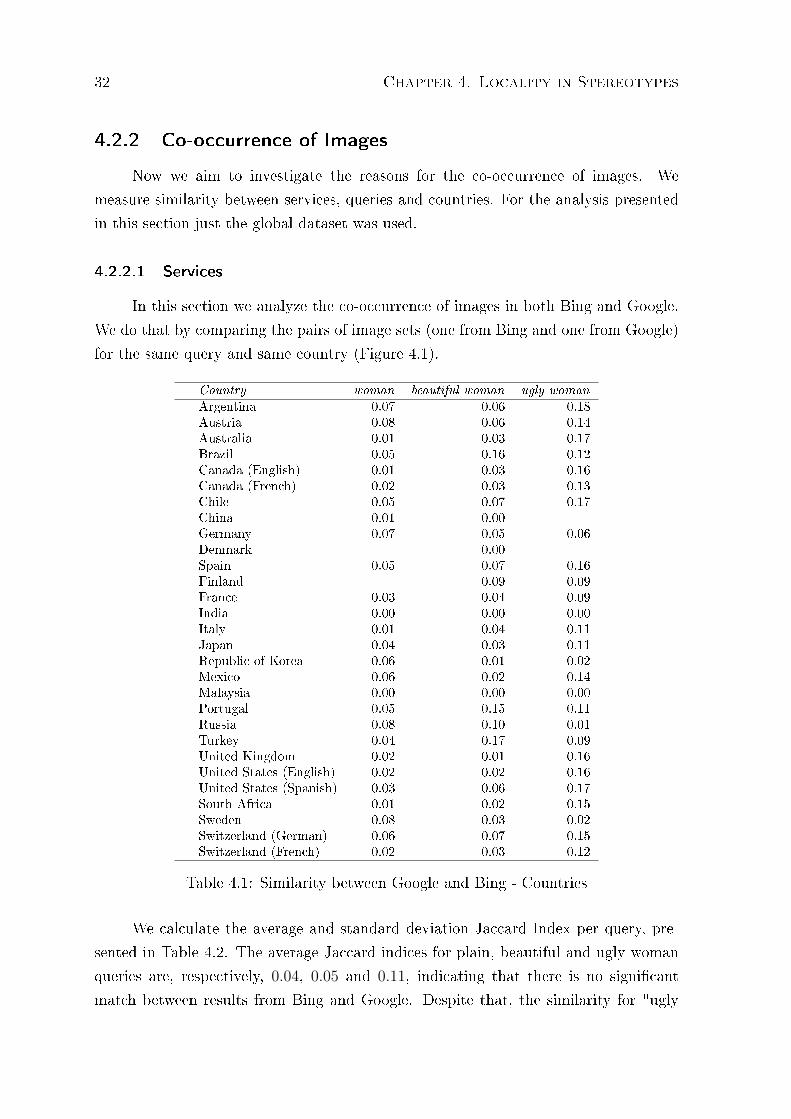
In this section we analyze the co-occurrence of images in both Bing and Google.
We do that by comparing the pairs of image sets (one from Bing and one from Google)
for the same query and same country (Figure 4.1).
Country woman beautiful woman ugly woman
Argentina 0.07 0.06 0.18Austria 0.08 0.06 0.14Australia 0.01 0.03 0.17Brazil 0.05 0.16 0.12Canada (English) 0.01 0.03 0.16Canada (French) 0.02 0.03 0.13Chile 0.05 0.07 0.17China 0.01 0.00Germany 0.07 0.05 0.06Denmark 0.00Spain 0.05 0.07 0.16Finland 0.09 0.09France 0.03 0.04 0.09India 0.00 0.00 0.00Italy 0.01 0.04 0.11Japan 0.04 0.03 0.11Republic of Korea 0.06 0.01 0.02Mexico 0.06 0.02 0.14Malaysia 0.00 0.00 0.00Portugal 0.05 0.15 0.11Russia 0.08 0.10 0.01Turkey 0.04 0.17 0.09United Kingdom 0.02 0.01 0.16United States (English) 0.02 0.02 0.16United States (Spanish) 0.03 0.06 0.17South Africa 0.01 0.02 0.15Sweden 0.08 0.03 0.02Switzerland (German) 0.06 0.07 0.15Switzerland (French) 0.02 0.03 0.12
Table 4.1: Similarity between Google and Bing - Countries
We calculate the average and standard deviation Jaccard Index per query, pre-
sented in Table 4.2. The average Jaccard indices for plain, beautiful and ugly woman
queries are, respectively, 0.04, 0.05 and 0.11, indicating that there is no signi�cant
match between results from Bing and Google. Despite that, the similarity for "ugly

4.2. Experiments and Results 33
woman" is almost twice as large as the others (on average), supporting our previous
�nding that "ugly woman" images repeat more often.
Jaccard IndexQuery Avg. Std.woman 0.04 0.03beautiful woman 0.05 0.05ugly woman 0.11 0.06
Table 4.2: Similarity between Google and Bing
4.2.2.2 Queries
Analogously to the comparison between services, we will now analyze the co-
occurrence of images between queries (e.g "woman" vs. "beautiful woman"). For this
scenario we have three possible pairs: "woman" vs. "beautiful woman", "woman" vs.
"ugly woman" and "beautiful woman" vs. "ugly woman". In Table 4.3, we present the
average and standard deviation values per query con�guration.
Jaccard IndexQuery 1 Query 2 Avg. Std.woman beautiful woman 0.03 0.02woman ugly woman 0.00 0.01beautiful woman ugly woman 0.00 0.02
Table 4.3: Similarity between combination of queries
We observe that, again, the similarity is small. The average Jaccard index for
"ugly woman" compared to either "woman" or "beautiful woman" is 0.01 (std = 0.02).
Interestingly, the similarity between "woman" and "beautiful woman" is three times
larger than the other combinations (avg = 0.03, std = 0.02), indicating that the plain
query ("woman") tends to give results closer to "beautiful woman". It is important
to notice that this is a preliminary result, since the standard deviation values are high
and the con�dence intervals overlap with the average values of the other.
4.2.2.3 Countries
Finally, we compare the lists between each pair of countries, and calculate their
Jaccard index. Figure 4.3 shows the similarity matrix between countries. To enhance
visibility, we present only the countries that cluster with other countries with higher
similarities (Jaccard index higher than 0.2).

34 Chapter 4. Locality in Stereotypes
●●
●
●
●
●
●
●
●
●
●
●
●
●
●
●
●
●
●
●
●
●
●
●●
●
●
●
●
●
●
●
●
●
●
●
●
●
●
●
●
●
●
●
●
●
●●
●
●
●
●
●
●
●
●
●
●
●
●
●
●
●
●
●
●
●
●
●
●●
●
●
●
●
●
●
●
●
●
●
●
●
●
●
●
●
●
●
●
●
●
●●
●
●
●
●
●
●
●
●
●
●
●
●
●
●
●
●
●
●
●
●
●
●●
●
●
●
●
●
●
●
●
●
●
●
●
●
●
●
●
●
●
●
●
●
●●
●
●
●
●
●
●
●
●
●
●
●
●
●
●
●
●
●
●
●
●
●
●●
●
●
●
●
●
●
●
●
●
●
●
●
●
●
●
●
●
●
●
●
●
●●●
●
●
●
●
●
●
●
●
●
●
●
●
●
●
●
●
●
●
●
●●●
●
●
●
●
●
●
●
●
●
●
●
●
●
●
●
●
●
●
●
●●●
●
●
●
●
●
●
●
●
●
●
●
●
●
●
●
●
●
●
●
●
●
●
●●
●
●
●
●
●
●
●
●
●
●
●
●
●
●
●
●
●
●
●
●
●
●●●●
●
●
●
●
●
●
●
●
●
●
●
●
●
●
●
●
●
●
●●●●
●
●
●
●
●
●
●
●
●
●
●
●
●
●
●
●
●
●
●●●●
●
●
●
●
●
●
●
●
●
●
●
●
●
●
●
●
●
●
●●●●
●
●
●
●
●
●
●
●
●
●
●
●
●
●
●
●
●
●
●
●
●
●
●●
●
●
●
●
●
●
●
●
●
●
●
●
●
●
●
●
●
●
●
●
●
●●●●●
●
●
●
●
●
●
●
●
●
●
●
●
●
●
●
●
●
●
●●●●
●
●
●
●
●
●
●
●
●
●
●
●
●
●
●
●
●
●●●●●
●
●
●
●
●
●
●
●
●
●
●
●
●
●
●
●
●
●●●●●
●
●
●
●
●
●
●
●
●
●
●
●
●
●
●
●
●
●●●●● 0
0.1
0.2
0.3
0.4
0.5
0.6
0.7
0.8
0.9
1
Sw
eden
Mal
aysi
aIn
dia
Fra
nce
Can
ada
(FR
)S
witz
erla
nd (
FR
)B
razi
lP
ortu
gal
Aus
tria
Ger
man
yS
witz
erla
nd (
DE
)U
nite
d S
tate
s (E
S)
Chi
leS
pain
Arg
entin
aM
exic
oR
ussi
aU
nite
d S
tate
s (E
N)
Aus
tral
iaS
outh
Afr
ica
Can
ada
(EN
)U
nite
d K
ingd
om
SwedenMalaysia
IndiaFrance
Canada (FR)Switzerland (FR)
BrazilPortugal
AustriaGermany
Switzerland (DE)United States (ES)
ChileSpain
ArgentinaMexicoRussia
United States (EN)Australia
South AfricaCanada (EN)
United Kingdom
Google − "woman" (global)
●●
●
●
●
●
●
●
●
●
●
●
●
●
●
●
●
●
●
●
●
●
●
●
●●●
●
●
●
●
●
●
●
●
●
●
●
●
●
●
●
●
●
●
●
●
●●●
●
●
●
●
●
●
●
●
●
●
●
●
●
●
●
●
●
●
●
●
●●●
●
●
●
●
●
●
●
●
●
●
●
●
●
●
●
●
●
●
●
●
●
●
●
●●
●
●
●
●
●
●
●
●
●
●
●
●
●
●
●
●
●
●
●
●
●
●
●●
●
●
●
●
●
●
●
●
●
●
●
●
●
●
●
●
●
●
●
●
●
●
●●
●
●
●
●
●
●
●
●
●
●
●
●
●
●
●
●
●
●
●
●
●
●
●●●
●
●
●
●
●
●
●
●
●
●
●
●
●
●
●
●
●
●
●
●
●●●
●
●
●
●
●
●
●
●
●
●
●
●
●
●
●
●
●
●
●
●
●●●
●
●
●
●
●
●
●
●
●
●
●
●
●
●
●
●
●
●
●
●
●
●
●
●●●●●●●●
●
●
●
●
●
●
●
●
●
●
●
●
●
●
●
●●●●●●●●
●
●
●
●
●
●
●
●
●
●
●
●
●
●
●
●●●●●●●●
●
●
●
●
●
●
●
●
●
●
●
●
●
●
●
●●●●●●●●
●
●
●
●
●
●
●
●
●
●
●
●
●
●
●
●●●●●●●●
●
●
●
●
●
●
●
●
●
●
●
●
●
●
●
●●●●●●●●
●
●
●
●
●
●
●
●
●
●
●
●
●
●
●
●●●●●●●●
●
●
●
●
●
●
●
●
●
●
●
●
●
●
●
●●●●●●●●
●
●
●
●
●
●
●
●
●
●
●
●
●
●
●
●
●
●
●
●
●
●
●
●●●●●
●
●
●
●
●
●
●
●
●
●
●
●
●
●
●
●
●
●
●
●●●●
●
●
●
●
●
●
●
●
●
●
●
●
●
●
●
●
●
●
●
●●●●
●
●
●
●
●
●
●
●
●
●
●
●
●
●
●
●
●
●
●
●●●●
●
●
●
●
●
●
●
●
●
●
●
●
●
●
●
●
●
●
●
●●●● 0
0.1
0.2
0.3
0.4
0.5
0.6
0.7
0.8
0.9
1
Sw
eden
Fra
nce
Can
ada
(FR
)S
witz
erla
nd (
FR
)R
ussi
aB
razi
lP
ortu
gal
Sw
itzer
land
(D
E)
Aus
tria
Ger
man
yC
anad
a (E
N)
Uni
ted
Sta
tes
(EN
)Ir
elan
dA
ustr
alia
Indi
aU
nite
d K
ingd
omM
alay
sia
Sou
th A
fric
aU
nite
d S
tate
s (E
S)
Spa
inC
hile
Arg
entin
aM
exic
o
SwedenFrance
Canada (FR)Switzerland (FR)
RussiaBrazil
PortugalSwitzerland (DE)
AustriaGermany
Canada (EN)United States (EN)
IrelandAustralia
IndiaUnited Kingdom
MalaysiaSouth Africa
United States (ES)SpainChile
ArgentinaMexico
Bing − "woman" (global)
●●
●
●
●
●
●
●
●
●
●
●
●
●
●
●
●
●
●
●
●
●
●
●●
●
●
●
●
●
●
●
●
●
●
●
●
●
●
●
●
●
●
●
●
●
●●
●
●
●
●
●
●
●
●
●
●
●
●
●
●
●
●
●
●
●
●
●
●●●
●
●
●
●
●
●
●
●
●
●
●
●
●
●
●
●
●
●
●
●●●
●
●
●
●
●
●
●
●
●
●
●
●
●
●
●
●
●
●
●
●●●
●
●
●
●
●
●
●
●
●
●
●
●
●
●
●
●
●
●
●
●
●
●
●●
●
●
●
●
●
●
●
●
●
●
●
●
●
●
●
●
●
●
●
●
●
●●
●
●
●
●
●
●
●
●
●
●
●
●
●
●
●
●
●
●
●
●
●●
●
●
●
●
●
●
●
●
●
●
●
●
●
●
●
●
●
●
●
●
●
●
●●
●
●
●
●
●
●
●
●
●
●
●
●
●
●
●
●
●
●
●
●
●●
●
●
●
●
●
●
●
●
●
●
●
●
●
●
●
●
●
●
●
●
●
●
●●
●
●
●●
●
●
●
●
●
●
●
●
●
●
●
●
●
●
●
●
●
●●●●
●
●
●
●
●
●
●
●
●
●
●
●
●
●
●
●
●
●
●●●●
●
●
●
●
●
●
●
●
●
●
●
●
●
●
●
●
●
●
●●●●
●
●
●
●
●
●
●
●
●
●
●
●
●
●
●
●
●
●
●●●●
●
●
●
●
●
●
●
●
●
●
●
●
●
●
●
●
●
●
●
●
●
●
●●
●
●
●
●
●
●
●
●
●
●
●
●
●
●
●
●
●
●
●
●
●
●●●●●
●
●
●
●
●
●
●
●
●
●
●
●
●
●
●
●
●
●●●●●
●
●
●
●
●
●
●
●
●
●
●
●
●
●
●
●
●
●●●●●
●
●
●
●
●
●
●
●
●
●
●
●
●
●
●
●
●
●●●●●
●
●
●
●
●
●
●
●
●
●
●
●
●
●
●
●
●
●●●●● 0
0.1
0.2
0.3
0.4
0.5
0.6
0.7
0.8
0.9
1
Rus
sia
Sw
eden
Mal
aysi
aS
witz
erla
nd (
DE
)A
ustr
iaG
erm
any
Can
ada
(FR
)F
ranc
eS
witz
erla
nd (
FR
)B
razi
lP
ortu
gal
Uni
ted
Sta
tes
(ES
)S
pain
Mex
ico
Arg
entin
aC
hile
Indi
aA
ustr
alia
Can
ada
(EN
)U
nite
d S
tate
s (E
N)
Sou
th A
fric
aU
nite
d K
ingd
om
RussiaSweden
MalaysiaSwitzerland (DE)
AustriaGermany
Canada (FR)France
Switzerland (FR)Brazil
PortugalUnited States (ES)
SpainMexico
ArgentinaChileIndia
AustraliaCanada (EN)
United States (EN)South Africa
United Kingdom
Google − "beautiful woman" (global)
●●
●
●
●
●
●
●
●
●
●
●
●
●
●
●
●
●
●
●
●
●
●
●
●●●
●
●
●
●
●
●
●
●
●
●
●
●
●
●
●
●
●
●
●
●
●●●
●
●
●
●
●
●
●
●
●
●
●
●
●
●
●
●
●
●
●
●
●●●
●
●
●
●
●
●
●
●
●
●
●
●
●
●
●
●
●
●
●
●
●
●
●
●●●
●
●
●
●
●
●
●
●
●
●
●
●
●
●
●
●
●
●
●
●
●●●
●
●
●
●
●
●
●
●
●
●
●
●
●
●
●
●
●
●
●
●
●●●
●
●
●
●
●
●
●
●
●
●
●
●
●
●
●
●
●
●
●
●
●
●
●
●●
●
●
●●
●
●
●
●
●
●
●
●
●
●
●
●
●
●
●
●
●
●
●●●●
●
●
●
●
●
●
●
●
●
●
●
●
●
●
●
●
●
●
●
●●●●
●
●
●
●
●
●
●
●
●
●
●
●
●
●
●
●
●
●
●
●●●●
●
●
●
●
●
●
●
●
●
●
●
●
●
●
●
●
●
●
●
●●●●
●
●
●
●
●
●
●
●
●
●
●
●
●
●
●
●
●
●
●
●
●
●
●
●●
●
●
●
●
●
●
●
●
●
●
●
●
●
●
●
●
●
●
●
●
●
●
●●
●
●
●
●
●
●
●
●
●
●
●
●
●
●
●
●
●
●
●
●
●
●●
●
●
●
●
●
●
●
●
●
●
●
●
●
●
●
●
●
●
●
●
●
●
●
●●●
●
●
●
●
●
●
●
●
●
●
●
●
●
●
●
●
●
●
●
●
●●●
●
●
●
●
●
●
●
●
●
●
●
●
●
●
●
●
●
●
●
●
●
●
●●
●
●●
●
●
●
●
●
●
●
●
●
●
●
●
●
●
●
●
●
●
●
●●●●●
●
●
●
●
●
●
●
●
●
●
●
●
●
●
●
●
●
●
●●●●●
●
●
●
●
●
●
●
●
●
●
●
●
●
●
●
●
●
●
●●●●●
●
●
●
●
●
●
●
●
●
●
●
●
●
●
●
●
●
●
●●●●●
●
●
●
●
●
●
●
●
●
●
●
●
●
●
●
●
●
●
●●●●● 0
0.1
0.2
0.3
0.4
0.5
0.6
0.7
0.8
0.9
1
Sw
eden
Fra
nce
Can
ada
(FR
)S
witz
erla
nd (
FR
)S
witz
erla
nd (
DE
)A
ustr
iaG
erm
any
Mex
ico
Uni
ted
Sta
tes
(ES
)S
pain
Arg
entin
aC
hile
Rus
sia
Bra
zil
Por
tuga
lIn
dia
Uni
ted
Sta
tes
(EN
)M
alay
sia
Uni
ted
Kin
gdom
Sou
th A
fric
aIr
elan
dA
ustr
alia
Can
ada
(EN
)
SwedenFrance
Canada (FR)Switzerland (FR)Switzerland (DE)
AustriaGermany
MexicoUnited States (ES)
SpainArgentina
ChileRussia
BrazilPortugal
IndiaUnited States (EN)
MalaysiaUnited Kingdom
South AfricaIreland
AustraliaCanada (EN)
Bing − "beautiful woman" (global)
●●
●
●
●
●
●
●
●
●
●
●
●
●
●
●
●
●
●
●
●
●
●
●●
●
●
●
●
●
●
●
●
●
●
●
●
●
●
●
●
●
●
●
●
●
●●●
●
●
●
●
●
●
●
●
●
●
●
●
●
●
●
●
●
●
●
●●●
●
●
●
●
●
●
●
●
●
●
●
●
●
●
●
●
●
●
●
●●●
●
●
●
●
●
●
●
●
●
●
●
●
●
●
●
●
●
●
●
●
●
●
●●●
●
●
●
●
●
●
●
●
●
●
●
●
●
●
●
●
●
●
●
●●●
●
●
●
●
●
●
●
●
●
●
●
●
●
●
●
●
●
●
●
●●●
●
●
●
●
●
●
●
●
●
●
●
●
●
●
●
●
●
●
●
●
●
●
●●
●
●
●
●
●
●
●
●
●
●
●
●
●
●
●
●
●
●
●
●
●●
●
●
●
●
●
●
●
●
●
●
●
●
●
●
●
●
●
●
●
●
●
●
●●●●●
●
●
●
●
●
●
●
●
●
●
●
●
●
●
●
●
●
●●●●●
●
●
●
●
●
●
●
●
●
●
●
●
●
●
●
●
●
●●●●●
●
●
●
●
●
●
●
●
●
●
●
●
●
●
●
●
●
●●●●●
●
●
●
●
●
●
●
●
●
●
●
●
●
●
●
●
●
●●●●●
●
●
●
●
●
●
●
●
●
●
●
●
●
●
●
●
●
●
●
●
●
●
●●
●
●
●
●
●
●
●
●
●
●
●
●
●
●
●
●
●
●
●
●
●
●●
●
●
●
●
●
●
●
●
●
●
●
●
●
●
●
●
●
●
●
●
●
●●●●●
●
●
●
●
●
●
●
●
●
●
●
●
●
●
●
●
●
●●●●●
●
●
●
●
●
●
●
●
●
●
●
●
●
●
●
●
●
●●●●●
●
●
●
●
●
●
●
●
●
●
●
●
●
●
●
●
●
●●●●●
●
●
●
●
●
●
●
●
●
●
●
●
●
●
●
●
●
●●●●● 0
0.1
0.2
0.3
0.4
0.5
0.6
0.7
0.8
0.9
1
Mal
aysi
aIn
dia
Sw
itzer
land
(D
E)
Aus
tria
Ger
man
yF
ranc
eC
anad
a (F
R)
Sw
itzer
land
(F
R)
Bra
zil
Por
tuga
lU
nite
d S
tate
s (E
S)
Mex
ico
Arg
entin
aC
hile
Spa
inS
wed
enR
ussi
aU
nite
d S
tate
s (E
N)
Aus
tral
iaC
anad
a (E
N)
Sou
th A
fric
aU
nite
d K
ingd
om
MalaysiaIndia
Switzerland (DE)Austria
GermanyFrance
Canada (FR)Switzerland (FR)
BrazilPortugal
United States (ES)Mexico
ArgentinaChile
SpainSwedenRussia
United States (EN)Australia
Canada (EN)South Africa
United Kingdom
Google − "ugly woman" (global)
●●
●
●
●
●
●
●
●
●
●
●
●
●
●
●
●
●
●
●
●
●
●
●●
●
●
●
●
●
●
●
●
●
●
●
●
●
●
●
●
●
●
●
●
●
●
●
●●●●
●
●
●
●
●
●
●
●
●
●
●
●
●
●
●
●
●
●
●
●●●
●
●
●
●
●
●
●
●
●
●
●
●
●
●
●
●
●
●
●
●
●●●
●
●
●
●
●
●
●
●
●
●
●
●
●
●
●
●
●
●
●
●
●
●
●
●●
●
●
●
●
●
●
●
●
●●
●
●
●
●
●
●
●
●
●
●
●
●
●●●●●●●●●
●●
●
●
●
●
●
●
●
●
●
●
●
●
●●●●●●●●●
●
●
●
●
●
●
●
●
●
●
●
●
●
●
●●●●●●●●●
●
●
●
●
●
●
●
●
●
●
●
●
●
●
●●●●●●●●●
●
●
●
●
●
●
●
●
●
●
●
●
●
●
●●●●●●●●●
●
●
●
●
●
●
●
●
●
●
●
●
●
●
●●●●●●●●●
●●
●
●
●
●
●
●
●
●
●
●
●
●
●●●●●●
●●●
●
●
●
●
●
●
●
●
●
●
●
●
●
●
●
●●●●●●●●
●
●
●
●
●
●
●
●
●
●
●
●
●
●
●
●
●
●
●
●
●
●
●●
●
●
●
●
●
●
●
●
●
●
●
●
●
●
●
●
●
●
●
●
●
●
●●
●
●
●
●
●
●
●
●
●
●
●
●
●
●
●
●
●
●
●
●
●
●
●●
●
●
●
●
●
●
●
●
●
●
●
●
●
●
●
●
●
●
●
●
●
●
●●
●
●
●
●
●
●
●
●
●
●
●
●
●
●
●
●
●
●
●
●
●
●
●●●
●●
●
●
●
●
●
●
●
●
●
●
●
●
●
●
●
●
●
●
●●●
●●
●
●
●
●
●
●
●
●
●
●
●
●
●
●
●
●
●
●
●
●
●●●
●
●
●
●
●
●
●
●
●
●
●
●
●
●
●
●
●
●
●●●●●
●
●
●
●
●
●
●
●
●
●
●
●
●
●
●
●
●
●
●●●●● 0.01
0.11
0.21
0.31
0.4
0.5
0.6
0.7
0.8
0.9
1
Aus
tria
Sw
itzer
land
(D
E)
Fra
nce
Can
ada
(FR
)S
witz
erla
nd (
FR
)S
wed
enIn
dia
Uni
ted
Sta
tes
(EN
)A
ustr
alia
Can
ada
(EN
)U
nite
d K
ingd
omM
alay
sia
Irel
and
Sou
th A
fric
aG
erm
any
Rus
sia
Bra
zil
Por
tuga
lA
rgen
tina
Chi
leU
nite
d S
tate
s (E
S)
Mex
ico
Spa
in
AustriaSwitzerland (DE)
FranceCanada (FR)
Switzerland (FR)Sweden
IndiaUnited States (EN)
AustraliaCanada (EN)
United KingdomMalaysia
IrelandSouth Africa
GermanyRussia
BrazilPortugal
ArgentinaChile
United States (ES)Mexico
Spain
Bing − "ugly woman" (global)
Figure 4.3: Similarity of image results between countries, for global queries.

4.2. Experiments and Results 35
In contrast to the service and query analyses, there are very strong similarities
between countries. We observe that the similarities are stronger among countries that
speak the same language, and almost nonexistent between countries that speak di�erent
languages. The in�uence of language is so pronounced that we may easily identify
"language-based clusters".
Such result is explained by the fact that images are indexed by the search engine
using the content of the web-page with which the image is associated. Since the queries
are issued using written natural language, it is possible that an image returned, for
example, by Google Mexico is actually from a site in Spain (e.g., xyz.es)
4.2.3 Global and Local Images
As shown in the previous section, there are very strong similarities between coun-
tries. Our hypothesis is that the results of image searches, on both search engine plat-
forms, are biased in relation to language and do not always re�ect the characteristics
of the female population of the country.
We investigate the e�ect of �ltering the search query to return only results from a
given country, de�ned by local sites existing in the country code domain of the speci�c
country. For this investigation we select the countries of the two largest clusters (En-
glish and Spanish), totaling 8 countries in Bing and 15 in Google. We then collect the
images using the same methodology used for searching globally (without the country
�lter).
4.2.3.1 Similarity
We initially assess the impact on the similarity between countries when searching
images locally. Similarly to Section 4.2.2.3, we calculate the Jaccard index for each
pair of countries.
Figure 4.4 shows the similarity matrix for the local search results. Compared
to the matrix for global queries (left), it is visible how the similarity is drastically
reduced. The clusters have virtually disappeared, only some small values (< 0.2)
remained, mainly for query 'ugly woman'. This result supports our observation that
the similarity is almost non-existent between countries that speak di�erent languages.
On the other hand, we may easily identify "language-based clusters".

36 Chapter 4. Locality in Stereotypes
●●
●
●
●
●
●
●
●
●
●
●
●
●
●
●
●
●
●
●
●
●
●
●●
●
●
●
●
●
●
●
●
●
●
●
●
●
●
●
●
●
●
●
●
●
●●
●
●
●
●
●
●
●
●
●
●
●
●
●
●
●
●
●
●
●
●
●
●●
●
●
●
●
●
●
●
●
●
●
●
●
●
●
●
●
●
●
●
●
●
●●
●
●
●
●
●
●
●
●
●
●
●
●
●
●
●
●
●
●
●
●
●
●●
●
●
●
●
●
●
●
●
●
●
●
●
●
●
●
●
●
●
●
●
●
●●
●
●
●
●
●
●
●
●
●
●
●
●
●
●
●
●
●
●
●
●
●
●●
●
●
●
●
●
●
●
●
●
●
●
●
●
●
●
●
●
●
●
●
●
●●
●
●
●
●
●
●
●
●
●
●
●
●
●
●
●
●
●
●
●
●
●
●●
●
●
●
●
●
●
●
●
●
●
●
●
●
●
●
●
●
●
●
●
●
●●
●
●
●
●
●
●
●
●
●
●
●
●
●
●
●
●
●
●
●
●
●
●●
●
●
●
●
●
●
●
●
●
●
●
●
●
●
●
●
●
●
●
●
●
●●
●
●
●
●
●
●
●
●
●
●
●
●
●
●
●
●
●
●
●
●
●
●●
●
●
●
●
●
●
●
●
●
●
●
●
●
●
●
●
●
●
●
●
●
●●
●
●
●
●
●
●
●
●
●
●
●
●
●
●
●
●
●
●
●
●
●
●●
●
●
●
●
●
●
●
●
●
●
●
●
●
●
●
●
●
●
●
●
●
●●
●
●
●
●
●
●
●
●
●
●
●
●
●
●
●
●
●
●
●
●
●
●●
●
●
●
●
●
●
●
●
●
●
●
●
●
●
●
●
●
●
●
●
●
●●
●
●
●
●
●
●
●
●
●
●
●
●
●
●
●
●
●
●
●
●
●
●●
●
●
●
●
●
●
●
●
●
●
●
●
●
●
●
●
●
●
●
●
●
●●
●
●
●
●
●
●
●
●
●
●
●
●
●
●
●
●
●
●
●
●
●
● 0
0.1
0.2
0.3
0.4
0.5
0.6
0.7
0.8
0.9
1
Sw
itzer
land
(F
R)
Sw
eden
Sou
th A
fric
aU
nite
d K
ingd
omU
nite
d S
tate
s (E
N)
Rus
sia
Mal
aysi
aIn
dia
Can
ada
(FR
)F
ranc
eB
razi
lP
ortu
gal
Ger
man
yA
ustr
iaS
witz
erla
nd (
DE
)A
rgen
tina
Chi
leU
nite
d S
tate
s (E
S)
Mex
ico
Spa
inA
ustr
alia
Can
ada
(EN
)
Switzerland (FR)Sweden
South AfricaUnited Kingdom
United States (EN)Russia
MalaysiaIndia
Canada (FR)France
BrazilPortugal
GermanyAustria
Switzerland (DE)Argentina
ChileUnited States (ES)
MexicoSpain
AustraliaCanada (EN)
Google − "woman" (local)
●●
●
●
●
●
●
●
●
●
●
●
●
●
●
●
●
●
●
●
●
●
●
●
●●
●
●
●
●
●
●
●
●
●
●
●
●
●
●
●
●
●
●
●
●
●
●
●●
●
●
●
●
●
●
●
●
●
●
●
●
●
●
●
●
●
●
●
●
●
●
●●
●
●
●
●
●
●
●
●
●
●
●
●
●
●
●
●
●
●
●
●
●
●
●●
●
●
●
●
●
●
●
●
●
●
●
●
●
●
●
●
●
●
●
●
●
●
●●
●
●
●
●
●
●
●
●
●
●
●
●
●
●
●
●
●
●
●
●
●
●
●●
●
●
●
●
●
●
●
●
●
●
●
●
●
●
●
●
●
●
●
●
●
●
●●
●
●
●
●
●
●
●
●
●
●
●
●
●
●
●
●
●
●
●
●
●
●
●●
●
●
●
●
●
●
●
●
●
●
●
●
●
●
●
●
●
●
●
●
●
●
●●
●
●
●
●
●
●
●
●
●
●
●
●
●
●
●
●
●
●
●
●
●
●
●●
●
●
●
●
●
●
●
●
●
●
●
●
●
●
●
●
●
●
●
●
●
●
●●
●
●
●
●
●
●
●
●
●
●
●
●
●
●
●
●
●
●
●
●
●
●
●●
●
●
●
●
●
●
●
●
●
●
●
●
●
●
●
●
●
●
●
●
●
●
●●
●
●
●
●
●
●
●
●
●
●
●
●
●
●
●
●
●
●
●
●
●
●
●●
●
●
●
●
●
●
●
●
●
●
●
●
●
●
●
●
●
●
●
●
●
●
●●
●
●
●
●
●
●
●
●
●
●
●
●
●
●
●
●
●
●
●
●
●
●
●●
●
●
●
●
●
●
●
●
●
●
●
●
●
●
●
●
●
●
●
●
●
●
●●
●
●
●
●
●
●
●
●
●
●
●
●
●
●
●
●
●
●
●
●
●
●
●●
●
●
●
●
●
●
●
●
●
●
●
●
●
●
●
●
●
●
●
●
●
●
●●
●
●
●
●
●
●
●
●
●
●
●
●
●
●
●
●
●
●
●
●
●
●
●●
●
●
●
●
●
●
●
●
●
●
●
●
●
●
●
●
●
●
●
●
●
●
●●
●
●
●
●
●
●
●
●
●
●
●
●
●
●
●
●
●
●
●
●
●
●
● 0
0.1
0.2
0.3
0.4
0.5
0.6
0.7
0.8
0.9
1
Uni
ted
Kin
gdom
Uni
ted
Sta
tes
(EN
)S
witz
erla
nd (
FR
)S
wed
enR
ussi
aM
alay
sia
Irel
and
Indi
aS
pain
Uni
ted
Sta
tes
(ES
)C
hile
Mex
ico
Can
ada
(FR
)F
ranc
eC
anad
a (E
N)
Bra
zil
Por
tuga
lS
witz
erla
nd (
DE
)A
ustr
iaG
erm
any
Arg
entin
aA
ustr
alia
Sou
th A
fric
a
United KingdomUnited States (EN)
Switzerland (FR)SwedenRussia
MalaysiaIreland
IndiaSpain
United States (ES)Chile
MexicoCanada (FR)
FranceCanada (EN)
BrazilPortugal
Switzerland (DE)Austria
GermanyArgentinaAustralia
South Africa
Bing − "woman" (local)
●●
●
●
●
●
●
●
●
●
●
●
●
●
●
●
●
●
●
●
●
●
●
●●
●
●
●
●
●
●
●
●
●
●
●
●
●
●
●
●
●
●
●
●
●
●●
●
●
●
●
●
●
●
●
●
●
●
●
●
●
●
●
●
●
●
●
●
●●
●
●
●
●
●
●
●
●
●
●
●
●
●
●
●
●
●
●
●
●
●
●●
●
●
●
●
●
●
●
●
●
●
●
●
●
●
●
●
●
●
●
●
●
●●
●
●
●
●
●
●
●
●
●
●
●
●
●
●
●
●
●
●
●
●
●
●●
●
●
●
●
●
●
●
●
●
●
●
●
●
●
●
●
●
●
●
●
●
●●
●
●
●
●
●
●
●
●
●
●
●
●
●
●
●
●
●
●
●
●
●
●●
●
●
●
●
●
●
●
●
●
●
●
●
●
●
●
●
●
●
●
●
●
●●
●
●
●
●
●
●
●
●
●
●
●
●
●
●
●
●
●
●
●
●
●
●●
●
●
●
●
●
●
●
●
●
●
●
●
●
●
●
●
●
●
●
●
●
●●
●
●
●
●
●
●
●
●
●
●
●
●
●
●
●
●
●
●
●
●
●
●●
●
●
●
●
●
●
●
●
●
●
●
●
●
●
●
●
●
●
●
●
●
●●
●
●
●
●
●
●
●
●
●
●
●
●
●
●
●
●
●
●
●
●
●
●●
●
●
●
●
●
●
●
●
●
●
●
●
●
●
●
●
●
●
●
●
●
●●
●
●
●
●
●
●
●
●
●
●
●
●
●
●
●
●
●
●
●
●
●
●●
●
●
●
●
●
●
●
●
●
●
●
●
●
●
●
●
●
●
●
●
●
●●
●
●
●
●
●
●
●
●
●
●
●
●
●
●
●
●
●
●
●
●
●
●●
●
●
●
●
●
●
●
●
●
●
●
●
●
●
●
●
●
●
●
●
●
●●
●
●
●
●
●
●
●
●
●
●
●
●
●
●
●
●
●
●
●
●
●
●●
●
●
●
●
●
●
●
●
●
●
●
●
●
●
●
●
●
●
●
●
●
● 0
0.1
0.2
0.3
0.4
0.5
0.6
0.7
0.8
0.9
1
Uni
ted
Sta
tes
(ES
)M
exic
oS
pain
Mal
aysi
aIn
dia
Ger
man
yS
wed
enC
anad
a (F
R)
Rus
sia
Bra
zil
Por
tuga
lA
ustr
iaA
rgen
tina
Chi
leS
witz
erla
nd (
DE
)F
ranc
eS
outh
Afr
ica
Sw
itzer
land
(F
R)
Aus
tral
iaU
nite
d S
tate
s (E
N)
Can
ada
(EN
)U
nite
d K
ingd
om
United States (ES)Mexico
SpainMalaysia
IndiaGermanySweden
Canada (FR)Russia
BrazilPortugal
AustriaArgentina
ChileSwitzerland (DE)
FranceSouth Africa
Switzerland (FR)Australia
United States (EN)Canada (EN)
United Kingdom
Google − "beautiful woman" (local)
●●
●
●
●
●
●
●
●
●
●
●
●
●
●
●
●
●
●
●
●
●
●
●
●●
●
●
●
●
●
●
●
●
●
●
●
●
●
●
●
●
●
●
●
●
●
●
●●
●
●
●
●
●
●
●
●
●
●
●
●
●
●
●
●
●
●
●
●
●
●
●●
●
●
●
●
●
●
●
●
●
●
●
●
●
●
●
●
●
●
●
●
●
●
●●
●
●
●
●
●
●
●
●
●
●
●
●
●
●
●
●
●
●
●
●
●
●
●●
●
●
●
●
●
●
●
●
●
●
●
●
●
●
●
●
●
●
●
●
●
●
●●
●
●
●
●
●
●
●
●
●
●
●
●
●
●
●
●
●
●
●
●
●
●
●●
●
●
●
●
●
●
●
●
●
●
●
●
●
●
●
●
●
●
●
●
●
●
●●
●
●
●
●
●
●
●
●
●
●
●
●
●
●
●
●
●
●
●
●
●
●
●●
●
●
●
●
●
●
●
●
●
●
●
●
●
●
●
●
●
●
●
●
●
●
●●
●
●
●
●
●
●
●
●
●
●
●
●
●
●
●
●
●
●
●
●
●
●
●●
●
●
●
●
●
●
●
●
●
●
●
●
●
●
●
●
●
●
●
●
●
●
●●
●
●
●
●
●
●
●
●
●
●
●
●
●
●
●
●
●
●
●
●
●
●
●●
●
●
●
●
●
●
●
●
●
●
●
●
●
●
●
●
●
●
●
●
●
●
●●
●
●
●
●
●
●
●
●
●
●
●
●
●
●
●
●
●
●
●
●
●
●
●●
●
●
●
●
●
●
●
●
●
●
●
●
●
●
●
●
●
●
●
●
●
●
●●
●
●
●
●
●
●
●
●
●
●
●
●
●
●
●
●
●
●
●
●
●
●
●●
●
●
●
●
●
●
●
●
●
●
●
●
●
●
●
●
●
●
●
●
●
●
●●
●
●
●
●
●
●
●
●
●
●
●
●
●
●
●
●
●
●
●
●
●
●
●●
●
●
●
●
●
●
●
●
●
●
●
●
●
●
●
●
●
●
●
●
●
●
●●
●
●
●
●
●
●
●
●
●
●
●
●
●
●
●
●
●
●
●
●
●
●
●●
●
●
●
●
●
●
●
●
●
●
●
●
●
●
●
●
●
●
●
●
●
●
● 0
0.1
0.2
0.3
0.4
0.5
0.6
0.7
0.8
0.9
1
Sw
eden
Mal
aysi
aS
outh
Afr
ica
Irel
and
Rus
sia
Fra
nce
Sw
itzer
land
(F
R)
Chi
leM
exic
oC
anad
a (F
R)
Uni
ted
Sta
tes
(EN
)In
dia
Can
ada
(EN
)U
nite
d K
ingd
omB
razi
lP
ortu
gal
Ger
man
yA
ustr
iaS
witz
erla
nd (
DE
)A
ustr
alia
Arg
entin
aS
pain
Uni
ted
Sta
tes
(ES
)
SwedenMalaysia
South AfricaIrelandRussiaFrance
Switzerland (FR)Chile
MexicoCanada (FR)
United States (EN)India
Canada (EN)United Kingdom
BrazilPortugal
GermanyAustria
Switzerland (DE)Australia
ArgentinaSpain
United States (ES)
Bing − "beautiful woman" (local)
●●
●
●
●
●
●
●
●
●
●
●
●
●
●
●
●
●
●
●
●
●
●
●●
●
●
●
●
●
●
●
●
●
●
●
●
●
●
●
●
●
●
●
●
●
●●
●
●
●
●
●
●
●
●
●
●
●
●
●
●
●
●
●
●
●
●
●
●●
●
●
●
●
●
●
●
●
●
●
●
●
●
●
●
●
●
●
●
●
●
●●
●
●
●
●
●
●
●
●
●
●
●
●
●
●
●
●
●
●
●
●
●
●●
●
●
●
●
●
●
●
●
●
●
●
●
●
●
●
●
●
●
●
●
●
●●
●
●
●
●
●
●
●
●
●
●
●
●
●
●
●
●
●
●
●
●
●
●●
●
●
●
●
●
●
●
●
●
●
●
●
●
●
●
●
●
●
●
●
●
●●
●
●
●
●
●
●
●
●
●
●
●
●
●
●
●
●
●
●
●
●
●
●●
●
●
●
●
●
●
●
●
●
●
●
●
●
●
●
●
●
●
●
●
●
●●
●
●
●
●
●
●
●
●
●
●
●
●
●
●
●
●
●
●
●
●
●
●●
●
●
●
●
●
●
●
●
●
●
●
●
●
●
●
●
●
●
●
●
●
●●
●
●
●
●
●
●
●
●
●
●
●
●
●
●
●
●
●
●
●
●
●
●●
●
●
●
●
●
●
●
●
●
●
●
●
●
●
●
●
●
●
●
●
●
●●
●
●
●
●
●
●
●
●
●
●
●
●
●
●
●
●
●
●
●
●
●
●●
●
●
●
●
●
●
●
●
●
●
●
●
●
●
●
●
●
●
●
●
●
●●
●
●
●
●
●
●
●
●
●
●
●
●
●
●
●
●
●
●
●
●
●
●●
●
●
●
●
●
●
●
●
●
●
●
●
●
●
●
●
●
●
●
●
●
●●
●
●
●
●
●
●
●
●
●
●
●
●
●
●
●
●
●
●
●
●
●
●●
●
●
●
●
●
●
●
●
●
●
●
●
●
●
●
●
●
●
●
●
●
●●
●
●
●
●
●
●
●
●
●
●
●
●
●
●
●
●
●
●
●
●
●
● 0
0.1
0.2
0.3
0.4
0.5
0.6
0.7
0.8
0.9
1
Sw
itzer
land
(F
R)
Indi
aS
wed
enG
erm
any
Uni
ted
Kin
gdom
Uni
ted
Sta
tes
(EN
)C
anad
a (F
R)
Can
ada
(EN
)F
ranc
eB
razi
lP
ortu
gal
Aus
tria
Sw
itzer
land
(D
E)
Sou
th A
fric
aA
ustr
alia
Mal
aysi
aR
ussi
aA
rgen
tina
Spa
inU
nite
d S
tate
s (E
S)
Chi
leM
exic
o
Switzerland (FR)India
SwedenGermany
United KingdomUnited States (EN)
Canada (FR)Canada (EN)
FranceBrazil
PortugalAustria
Switzerland (DE)South Africa
AustraliaMalaysia
RussiaArgentina
SpainUnited States (ES)
ChileMexico
Google − "ugly woman" (local)
●●
●
●
●
●
●
●
●
●
●
●
●
●
●
●
●
●
●
●
●
●
●
●
●●
●
●
●
●
●
●
●
●
●
●
●
●
●
●
●
●
●
●
●
●
●
●
●●
●
●
●
●
●
●
●
●
●
●
●
●
●
●
●
●
●
●
●
●
●
●
●●
●
●
●
●
●
●
●
●
●
●
●
●
●
●
●
●
●
●
●
●
●
●
●●
●
●
●
●
●
●
●
●
●
●
●
●
●
●
●
●
●
●
●
●
●
●
●●
●
●
●
●
●
●
●
●
●
●
●
●
●
●
●
●
●
●
●
●
●
●
●●
●
●
●
●
●
●
●
●
●
●
●
●
●
●
●
●
●
●
●
●
●
●
●●
●
●
●
●
●
●
●
●
●
●
●
●
●
●
●
●
●
●
●
●
●
●
●●
●
●
●
●
●
●
●
●
●
●
●
●
●
●
●
●
●
●
●
●
●
●
●●
●
●
●
●
●
●
●
●
●
●
●
●
●
●
●
●
●
●
●
●
●
●
●●
●
●
●
●
●
●
●
●
●
●
●
●
●
●
●
●
●
●
●
●
●
●
●●
●
●
●
●
●
●
●
●
●
●
●
●
●
●
●
●
●
●
●
●
●
●
●●
●
●
●
●
●
●
●
●
●
●
●
●
●
●
●
●
●
●
●
●
●
●
●●
●
●
●
●
●
●
●
●
●
●
●
●
●
●
●
●
●
●
●
●
●
●
●●
●
●
●
●
●
●
●
●
●
●
●
●
●
●
●
●
●
●
●
●
●
●
●●
●
●
●
●
●
●
●
●
●
●
●
●
●
●
●
●
●
●
●
●
●
●
●●
●
●
●
●
●
●
●
●
●
●
●
●
●
●
●
●
●
●
●
●
●
●
●●
●
●
●
●
●
●
●
●
●
●
●
●
●
●
●
●
●
●
●
●
●
●
●●
●
●
●
●
●
●
●
●
●
●
●
●
●
●
●
●
●
●
●
●
●
●
●●
●
●
●
●
●
●
●
●
●
●
●
●
●
●
●
●
●
●
●
●
●
●
●●
●
●
●
●
●
●
●
●
●
●
●
●
●
●
●
●
●
●
●
●
●
●
●●
●
●
●
●
●
●
●
●
●
●
●
●
●
●
●
●
●
●
●
●
●
●
● 0
0.1
0.2
0.3
0.4
0.5
0.6
0.7
0.8
0.9
1
Sw
itzer
land
(F
R)
Sou
th A
fric
aR
ussi
aIr
elan
dIn
dia
Can
ada
(EN
)C
anad
a (F
R)
Fra
nce
Uni
ted
Kin
gdom
Sw
eden
Ger
man
yU
nite
d S
tate
s (E
N)
Bra
zil
Por
tuga
lA
ustr
iaS
witz
erla
nd (
DE
)C
hile
Mex
ico
Arg
entin
aS
pain
Uni
ted
Sta
tes
(ES
)A
ustr
alia
Mal
aysi
a
Switzerland (FR)South Africa
RussiaIreland
IndiaCanada (EN)Canada (FR)
FranceUnited Kingdom
SwedenGermany
United States (EN)Brazil
PortugalAustria
Switzerland (DE)Chile
MexicoArgentina
SpainUnited States (ES)
AustraliaMalaysia
Bing − "ugly woman" (local)
Figure 4.4: Similarity of image results between countries, for local queries.

4.3. Summary and Discussion 37
4.2.3.2 Racial Pro�le
In chapter 3, we have demonstrated the existence of stereotypes for female phys-
ical attractiveness, in particular negative stereotypes about black women and positive
stereotypes about white women in terms of physical attractiveness. In this chapter
we show how the racial pro�le of the countries changes when we �lter local results,
indicating that query results do not re�ect the local demography. We then compare
the racial distribution of a country when issuing global queries vs. local queries.
It is possible to observe how the racial distribution changes for almost every
country/query when the search query is local (Figures 4.5 and 4.6 (color online)). For
African countries (Angola, Nigeria, Kenya, South Africa and Zambia) the proportion
of black women increases for almost all queries - only for Algeria, on Google, the
proportions decrease. This result is consistent with the demographics of those countries
where most of the population is black.1 On the other hand, the proportion of black
women decreases for almost all the local searches in Argentina and Austria, where 97%2
and 96%1 of the population is white, respectively.
4.3 Summary and DiscussionIn this chapter, we explored the local and global impact of the internet on the
formation of female physical attractiveness stereotypes in search engine results. First,
we queried 'woman', 'beautiful woman' and 'ugly woman' and downloaded the top
100 images returned by the search engines. Then, we analyzed the co-occurrence of
the images returned by the search engines. We queried and downloaded thousands
of images from di�erent search engines (Google and Bing), distinct queries (woman,
beautiful woman and ugly woman), originally provided to di�erent countries. We
showed that repetition occurs across our datasets, and it is more pronounced for "ugly
woman" pictures. By comparing and calculating the similarity metric between pairs
of search results we found out that images between services and between queries tend
to di�er, while images between countries present very high similarity for countries
that speak the same language, forming "language clusters". When submitting local
queries we observe that the similarity between countries is nearly eliminated. Also,
querying locally gives us a more trustworthy racial pro�le in some cases, re�ecting the
actual demographics of those particular countries. In summary, we show evidence that
results from search engines are biased towards the language used to query the system,
which leads to certain attractiveness stereotypes that are often quite di�erent from the
majority of the female population of the country.
1http://www.indexmundi.com2https://www.cia.gov/library/publications/the-world-factbook/�elds/2075.html

38Chapter4.Localityin
Stereotypes
woman
global
woman
local
beautiful woman
global
beautiful woman
local
ugly woman
global
ugly woman
local
goog
le
0 25 50 75 100 0 25 50 75 100 0 25 50 75 100 0 25 50 75 100 0 25 50 75 100 0 25 50 75 100
AlgeriaAngola
ArgentinaAustralia
AustriaBrazil
Canada (EN)Canada (FR)
ChileChina
DenmarkEgypt
FinlandFrance
GermanyGreece
GuatemalaIndiaIraqItaly
JapanKenyaKorea
MalaysiaMexico
MoroccoNigeria
ParaguayPeru
PortugalRussia
Saudi ArabiaSouth Africa
SpainSweden
Switzerland (DE)Switzerland (FR)
TurkeyUkraine
United KingdomUnited States (EN)United States (ES)
VenezuelaZambia
Race Percentage
Cou
ntry
race Asian White Black
Figure 4.5: Distribution of races among countries, queries on Google (color online).

4.3.SummaryandDiscussion
39
woman
global
woman
local
beautiful woman
global
beautiful woman
local
ugly woman
global
ugly woman
local
bing
0 25 50 75 100 0 25 50 75 100 0 25 50 75 100 0 25 50 75 100 0 25 50 75 100 0 25 50 75 100
Argentina
Australia
Austria
Brazil
Canada (EN)
Canada (FR)
Chile
China
Denmark
Finland
France
Germany
India
Ireland
Italy
Japan
Korea
Malaysia
Mexico
Portugal
Russia
South Africa
Spain
Sweden
Switzerland (DE)
Switzerland (FR)
Turkey
United Kingdom
United States (EN)
United States (ES)
Race Percentage
Cou
ntry
race Asian White Black
Figure 4.6: Distribution of races among countries, queries on Bing (color online).

Chapter 5
Conclusions and Future Work
Stereotypes are beliefs about the characteristics, attributes, and behaviors of
members of certain groups and they can sometimes a�ect negatively the way we eval-
uate ourselves. On the other hand, physical attractiveness has in�uence on decisions,
opportunities and perceptions of ourselves and others. It is a powerful agent in the
social world that is being a�ected by the growing digitization of the physical world.
Nowadays, search engines are one of the main mediators between individuals and the
access to information and knowledge. Therefore, one of the targets of this thesis was
instigate the discussion about the impact of search engines on the perception of physical
attractiveness. In order to do that we investigated the existence of global stereotypes
on search engines. We focused our analysis on the following research questions:
• Can we identify stereotypes for female physical attractiveness in the images avail-
able in the Web?
• How do race and age manifest in the observed stereotypes?
• How do stereotypes vary according to countries?
To the best of our knowledge, this is the �rst study to systematically analyze
di�erences in the perception of physical attractiveness of women in the Web. Using a
combination of face images obtained by search engine queries plus face's characteristics
inferred by a facial recognition system, the study shows the existence of appearance
stereotypes for women in the online world. These �ndings result from applying a
methodology we propose for analyzing stereotypes in online photos that portray people.
As future work we plan to expand the analysis to the male gender as well.
Overall, we found negative stereotypes for black and older women. We have
demonstrated that this pattern of stereotype is present in almost all the continents,
41

42 Chapter 5. Conclusions and Future Work
Africa, Asia, Australia/Oceania, Europe, North America, and South America. Our
experiments allowed us to pinpoint groups of countries that share similar patterns of
stereotypes. The existence of stereotypes in the online world may foster discrimination
both in the online and real world. This is an important contribution of this work
towards actions to reduce bias and discrimination in the online world.
We also study the impact of local and global images on the formation of female
physical attractiveness stereotypes. We start by analyzing the co-occurrence of images
returned by search engines in the context of pictures of women investigating datasets of
images collected from the search engines in several countries. We identi�ed a signi�cant
fraction of replicated images and we also showed that existence of common images
among countries is practically eliminated when the queries are limited to local sites.
Our �ndings highlight and evidence the fact that results from search engines are biased
towards the language used to query the system, which may impose certain stereotypes
that are often very di�erent from the majority of the female population of the country.
Furthermore, our methodology for investigating search engines bias by analyzing only
the input and output is a contribution by itself.
It is important to emphasize that we do not know exactly the reasons for the
existence of the identi�ed stereotypes. They may stem from a combination of the
stocks of available photos and characteristics of the indexing and ranking algorithms
of the search engines. The stock of photos online may re�ect prejudices and bias of
the real world that transferred from the physical world to the online world by the
search engines. Given the importance of search engines as source of information, we
suggest that they analyze the problems caused by the prominent presence of negative
stereotypes and �nd algorithmic ways to minimize the problem.
We know that using Face++, even though it is a widely used tool, implies some
limitations. The set of photos used for the algorithm training can introduce itself
a racial bias since the concept of racial identity is not the same around the world.
Therefore, follow-up studies will employ a crowdsourcing annotation - for example,
Amazon Mechanical Turk - for racial analysis and extraction of characteristics of face
images to generate a more detailed description of classes of stereotypes and compare
them with the results of di�erent facial recognition systems. Using the same service
we will validate the translation of search queries used in this work.

Bibliography
Allibhai, A. (2016). On racial bias and the sharing economy. https://onlabor.org/
2016/04/21/on-racial-bias-and-the-sharing-economy/. Accessed: 2016-12-24.
Andronico, P., Buzzi, M., and Leporini, B. (2004). Can i �nd what i'm looking for?
In Proceedings of the 13th International World Wide Web Conference on Alternate
Track Papers &Amp; Posters, WWW Alt. '04, pages 430--431, New York, NY, USA.
ACM.
Angwin, J. (2016). Make algorithms accountable. https://www.nytimes.com/2016/
08/01/opinion/make-algorithms-accountable.html. Accessed: 2017-01-12.
Anthes, G. (2016). Search engine agendas. Commun. ACM, 59(4):19--21.
Araújo, C. S., Meira, W., and Almeida, V. (2016). Identifying Stereotypes in the
Online Perception of Physical Attractiveness, pages 419--437. Springer International
Publishing, Cham.
Baeza-Yates, R. and Ribeiro-Neto, B. (2011). Modern Information Retrieval: The
Concepts and Technology Behind Search. Addison Wesley. ISBN 9780321416919.
Baker, P. and Potts, A. (2013). 'why do white people have thin lips?' google and
the perpetuation of stereotypes via auto-complete search forms. Critical Discourse
Studies, 10(2):187--204.
Bakhshi, S., Shamma, D. A., and Gilbert, E. (2014). Faces engage us: Photos with
faces attract more likes and comments on instagram. In Proceedings of the 32nd
annual ACM conference on Human factors in computing systems, pages 965--974.
ACM.
Banaji, M. and Greenwald, A. (2013). Blind Spot: Hidden Biases of Good People.
Delacorte Press. ISBN 9780553804645.
43

44 Bibliography
Barocas, S. and Selbst, A. D. (2014). Big data's disparate impact. Available at SSRN
2477899.
Bonchi, F., Castillo, C., and Hajian, S. (2016). Algorithmic bias: from discrimination
discovery to fairness-aware data mining. Conference on Knowledge Discovery and
Data Mining (KDD) tutorial.
Brin, S. and Page, L. (1998). The anatomy of a large-scale hypertextual web search
engine. Comput. Netw. ISDN Syst., 30(1-7):107--117. ISSN 0169-7552.
Carpineto, C., Osi«ski, S., Romano, G., and Weiss, D. (2009). A survey of web clus-
tering engines. ACM Comput. Surv., 41(3):17:1--17:38. ISSN 0360-0300.
Cash, T. F. and Brown, T. A. (1989). Gender and body images: Stereotypes and
realities. Sex Roles, 21(5):361--373. ISSN 1573-2762.
Castillo, C. (2005). E�ective web crawling. SIGIR Forum, 39(1):55--56. ISSN 0163-
5840.
Chander, A. (2016). The racist algorithm? Michigan Law Review, 2017.
Chen, L., Mislove, A., and Wilson, C. (2016). An empirical analysis of algorithmic
pricing on amazon marketplace. In Proceedings of the 25th International Conference
on World Wide Web, WWW '16, pages 1339--1349, Republic and Canton of Geneva,
Switzerland. International World Wide Web Conferences Steering Committee.
Coetzee, V., Gree�, J. M., Stephen, I. D., and Perrett, D. I. (2014). Cross-cultural
agreement in facial attractiveness preferences: The role of ethnicity and gender.
PLoS ONE, 9(7):1�8.
Croft, B., Metzler, D., and Strohman, T. (2009). Search Engines: Information Re-
trieval in Practice. Addison-Wesley Publishing Company, USA, 1st edition. ISBN
0136072240, 9780136072249.
Cunningham, M. R., Roberts, A. R., Barbee, A. P., Druen, P. B., and Wu, C. H.
(1995). Their ideas of beauty are, on the whole, the same as ours. In Journal of
Personality and Social Psychology.
Datta, A., Sen, S., and Zick, Y. (2016). Algorithmic transparency via quantitative input
in�uence: Theory and experiments with learning systems. In IEEE Symposium on
Security and Privacy, SP 2016, San Jose, CA, USA, May 22-26, 2016, pages 598--
617.

Bibliography 45
Diakopoulos, N. (2016). Accountability in algorithmic decision making. Commun.
ACM, 59(2):56--62. ISSN 0001-0782.
Diakopoulos, N., Friedler, S., Arenas, M., Barocas, S., Hay, M., Howe, B.,
Jagadish, H. V., Unsworth, K., Sahuguet, A., Venkatasubramanian, S., and
and, C. W. C. Y. (2016). Principles for accountable algorithms and a
social impact statement for algorithms. http://www.fatml.org/resources/
principles-for-accountable-algorithms. Accessed: 2016-12-24.
Downs, A. C. and Harrison, S. K. (1985). Embarrassing age spots or just plain ugly?
physical attractiveness stereotyping as an instrument of sexism on american televi-
sion commercials. Sex Roles, 13(1):9--19. ISSN 1573-2762.
Druschel, P. (2008). Accountability for distributed systems. In Proceedings of the
twenty-seventh ACM symposium on Principles of distributed computing, pages 13--
14. ACM.
Eisenthal, Y., Dror, G., and Ruppin, E. (2006). Facial attractiveness: Beauty and the
machine. Neural Comput., 18(1):119--142. ISSN 0899-7667.
Epstein, R. and Robertson, R. E. (2015). The search engine manipulation e�ect (seme)
and its possible impact on the outcomes of elections. Proceedings of the National
Academy of Sciences, 112(33):E4512--E4521.
Feigenbaum, J., Jaggard, A. D., and Wright, R. N. (2011). Towards a formal model
of accountability. In Proceedings of the 2011 workshop on New security paradigms
workshop, pages 45--56. ACM.
Fink, B., Grammer, K., and Matts, P. J. (2006). Visible skin color distribution plays
a role in the perception of age, attractiveness, and health in female faces. Evolution
and Human Behavior, 27(6):433--442.
Goodman, B. W. (2016). A step towards accountable algorithms?: Algorithmic discrim-
ination and the european union general data protection. Oxford Internet Institute.
Grammer, K., Fink, B., Moller, A. P., and Thornhill, R. (2003). Darwinian aesthetics:
sexual selection and the biology of beauty. Biological Reviews, 78:385--407.
Hardt, M. (2014). How big data is unfair. https://medium.com/@mrtz/
how-big-data-is-unfair-9aa544d739de#.xy0tjpua3. Accessed: 2016-12-24.

46 Bibliography
Hasan, B. S. and Stiller, B. (2005). A generic model and architecture for automated
auditing. In Proceedings of the 16th IFIP/IEEE Ambient Networks international
conference on Distributed Systems: operations and Management.
Hilton, J. L. and Von Hippel, W. (1996). Stereotypes. Annual review of psychology,
47(1):237--271.
Ho�man, K. M., Trawalter, S., Axt, J. R., and Oliver, M. N. (2016). Racial bias in pain
assessment and treatment recommendations, and false beliefs about biological di�er-
ences between blacks and whites. Proceedings of the National Academy of Sciences,
page 201516047.
Introna, L. D. and Nissenbaum, H. (2000). Shaping the web: Why the politics of search
engines matters. The information society, 16(3):169--185.
Karahalios, K. (2015). Auditing algorithms from the outside: Methods and implica-
tions.
Kay, M., Matuszek, C., and Munson, S. A. (2015). Unequal representation and gender
stereotypes in image search results for occupations. In Proceedings of the 33rd Annual
ACM Conference on Human Factors in Computing Systems, CHI '15, pages 3819--
3828, New York, NY, USA. ACM.
Krawetz, N. (2013). Kind of like that. http://www.hackerfactor.com/blog/index.
php?/archives/529-Kind-of-Like-That.html. Accessed: 2016-12-24.
Langville, A. N. and Meyer, C. D. (2006). Google's PageRank and Beyond: The Science
of Search Engine Rankings. Princeton University Press, Princeton, NJ, USA. ISBN
0691122024.
Lazer, D. (2015). The rise of the social algorithm. Science, 348(6239):1090--1091. ISSN
0036-8075.
Mazza, F., Da Silva, M. P., and Le Callet, P. (1999). Racial identity and media
orientation: Exploring the nature of constraint. In Journal of Black Studies.
McBryan, O. A. (1994). Genvl and wwww: Tools for taming the web. In Proceedings
of the �rst international world wide web conference, volume 341. Citeseer.
Mittelstadt, B. (2016). Automation, algorithms, and politics| auditing for transparency
in content personalization systems. International Journal of Communication, 10(0).
ISSN 1932-8036.

Bibliography 47
Murtagh, F. and Legendre, P. (2014). Ward?s hierarchical agglomerative clustering
method: Which algorithms implement ward?s criterion? Journal of Classi�cation,
31(3):274--295.
Pasquale, F. (2015). The black box society: The secret algorithms that control money
and information. Harvard University Press.
Rationality. (1999). The Cambridge Dictionary of Philosophy. Cambridge University
Press.
Romei, A. and Ruggieri, S. (2014). A multidisciplinary survey on discrimination anal-
ysis. The Knowledge Engineering Review, 29(05):582--638.
Sandvig, C., Hamilton, K., Karahalios, K., and Langbort, C. (2014). Auditing algo-
rithms: Research methods for detecting discrimination on internet platforms. Data
and Discrimination: Converting Critical Concerns into Productive Inquiry.
Sweeney, L. (2013). Discrimination in online ad delivery. Queue, 11(3):10.
Umoja Noble, S. (2012). Missed connections: What search engines say about women.
Umoja Noble, S. (2013). Google search: Hyper-visibility as a means of rendering black
women and girls invisible. In InVisible Culture, journal of visual culture from the
University of Rochester.
van den Berghe, P. L. and Frost, P. (1986). Skin color preference, sexual dimorphism
and sexual selection: A case of gene culture co-evolution? Ethnic and Racial Studies,
9(1):87�113.
Wilcoxon, F. (1945). Individual comparisons by ranking methods. Biometrics bulletin,
1(6):80--83.
William, H. (1753). The analysis of beauty. Written with a view of �xing the �uctuating
ideas of taste.
Wood, T., Shenoy, P. J., Venkataramani, A., and Yousif, M. S. (2007). Black-box and
gray-box strategies for virtual machine migration. In 4th Symposium on Networked
Systems Design and Implementation, April 11-13, 2007, Cambridge, Massachusetts,
USA, Proceedings.
Zliobaite, I. (2015). A survey on measuring indirect discrimination in machine learning.
CoRR, abs/1511.00148.


Appendix A
Data Gathering Statistics
Tables A.1 and A.2 present the number of photos that Face++ was able to detect
a single face per country, for Google and Bing, respectively.
49

50 Appendix A. Data Gathering Statistics
QueriesCountry Language woman beautiful woman ugly womanAlgeria Arabic 62 54 40Angola Potuguese 59 71 61Argentina Spanish 69 66 68Australia English 73 81 78Austria German 88 80 57Brazil Portuguese 58 74 60Canada English 73 81 78Canada French 73 67 69Chile Spanish 67 66 70China Chinese 66 62 56Denmark Danish 76 81 68Egypt Arabic 56 52 41Finland Finnish 81 77 75France French 81 74 75Germany German 80 80 58Greece Greek 57 70 53Guatemala Spanish 68 64 69India Hindi 64 71 52Iraq Arabic 56 55 42Italy Italian 68 68 69Japan Japanese 86 82 63Kenya Swahili 61 67 69Malaysia Malay 68 76 55Mexico Spanish 69 67 69Morocco Arabic 62 54 42Nigeria English 70 74 80Paraguay Spanish 69 65 69Peru Spanish 68 66 69Portugal Portuguese 63 71 62Russia Russian 79 86 72Saidi Arabia Arabic 57 53 45South Africa English 72 76 78South Korea Korean 73 67 50Spain Spanish 71 66 70Sweden Swedish 84 83 73Switzerland French 82 75 70Switzerland German 82 82 59Turkey Turkish 55 79 65Ukraine Ukrainian 72 84 68United Kingdom English 73 76 78United States English 68 74 77United States Spanish 58 66 65Venezuela Spanish 66 65 69Zambia English 71 72 79
Table A.1: Useful photos from Google (Global).

51
BING - GLOBAL
QueriesCountry Language woman beautiful woman ugly womanArgentina Spanish 62 66 73Australia English 73 75 82Austria German 73 75 65Brazil Portuguese 53 80 80Canada English 73 77 83Canada French 72 82 70Chile Spanish 63 67 73China Chinese 72 72 <40Denmark Danish <40 79 <40Finland Finnish <40 63 67France Franch 71 85 71Germany German 74 75 75India English 73 82 83Ireland English 72 75 85Italy Italian 75 77 83Japan Japanese 57 73 46Malaysia English 72 80 79Mexico Spanish 62 65 70Portugal Portuguese 57 74 75Russia Russian 75 84 87Saudi Arabia Arabic <40 52 23South Africa English 69 75 86South Korea Korean 68 52 37Spain Spanish 61 64 70Sweden Swedish 59 79 78Switzerland German 70 77 67Switzerland French 70 83 69Turkey Turkish 69 80 72United Kingdom English 73 77 85United States English 74 81 81United States Spanish 63 66 69
Table A.2: Useful photos from Bing (Global).
BING - LOCAL
QueriesCountry woman beautiful woman ugly womanArgentina 47 40 54Australia 73 91 81Austria 74 60 47Brazil 44 80 70Canada (English) 88 <40 66Canada (French) 44 74 47Chile 53 64 54China 72 77 <40Denmark <40 81 <40Finland 34 65 64France 58 84 69Germany 71 63 78Greece <40 92 <40India 84 89 69Ireland 88 90 59Italy 60 24 74Japan 70 80 40Malaysia 55 87 51Mexico 46 58 58Portugal 73 59 49Russia 33 88 59South Africa 44 84 42South Korea 59 55 39Spain 44 47 53Sweden <40 77 <40Switzerland (French - FR) 64 73 51Switzerland (German - DE) 58 73 34Turkey 67 81 57United Kingdom 69 83 76United States (Spanish - ES) 65 69 77United States (English - EN) 70 74 82
Table A.3: Useful photos from Bing (Local).

52 Appendix A. Data Gathering Statistics
Tables A.4 and A.3 present the number of photos that Face++ was able to detect
a single face per country, for Google and Bing, but now the photos returned by the
search contain only results of the same country.
QueriesCountry woman beautiful woman ugly womanAlgeria 40 52 61Angola 56 68 78Argentina 77 60 55Australia 74 68 61Austria 87 73 68Brazil 52 76 61Canada (English) 78 81 66Canada (French) 67 68 60Chile 68 58 60China 29 60 58Denmark 77 87 66Egypt 54 55 45Finland 76 77 72France 77 74 71Germany 82 84 69Greece 53 66 55Guatemala 71 77 64India 67 66 49Iraq 69 67 64Italy 60 76 69Japan 83 79 68Kenya 59 63 62Malaysia 55 64 54Mexico 71 68 58Morocco 54 74 65Nigeria 68 44 <40Paraguay 73 77 56Peru 72 64 67Portugal 72 81 47Russia 77 89 77Saidi Arabia 57 50 53South Africa 71 73 67South Korea 79 66 56Spain 76 65 57Sweden 83 80 72Switzerland (French - FR) 74 76 69Switzerland (German - DE) 77 84 66Turkey 59 77 62Ukraine 72 87 77United Kingdom 71 77 59United states (English - EN) 72 81 78United States (Spanish - ES) 58 69 <40Venezuela 50 70 57Zambia <40 42 <40
Table A.4: Useful photos from Google (Local).

Appendix B
Results of Z-Score Tests
In the Figures B.2 and B.1 the results highlighted are those which we reject the
null hypothesis and accept the alternative hypothesis. In other words, we can answer
YES to the questions Q1, Q2 and/or Q3.
Table B.1: Z-score table associated with the questions Q1, Q2 and Q3 (Bing)
z-score table (BING)Country Q1 (Black) Q2 (Asian) Q3 (White)Argentina -3.19 1.14 1.09Australia -4.38 -0.23 3.56Austria -1.82 -1.09 2.12Brazil -3.95 -1.36 4.34Canada (EN) -4.40 -0.03 3.40Canada (FR) -2.51 -1.49 3.08Chile -3.22 1.10 1.15Finland -0.56 0.95 -0.39France -2.56 -0.92 2.72Germany -2.83 -0.27 2.39India -3.79 0.03 2.86Ireland -4.29 -0.75 3.84Italy -1.60 -1.07 1.92Japan -2.21 2.50 -1.81Malaysia -4.63 -0.03 3.70Mexico -2.71 0.02 1.61Portugal -4.04 -1.43 4.47Russia -3.08 -0.16 2.45South Africa -4.12 -0.11 3.22Spain -2.68 0.28 1.34Sweden -4.02 -0.28 3.40Switzerland (DE) -1.46 -1.08 1.88Switzerland (FR) -2.37 -2.05 3.35Turkey -2.79 -1.89 3.40United Kingdom -4.48 0.03 3.44USA (EN) -4.13 0.00 3.23USA (ES) -2.45 -0.69 1.79
In the Figure B.3 and B.4 the results highlighted are those which we keep the
alternative hypothesis and we can answer YES to the questions Q4, Q5 and/or Q6.
53

54Appendix
B.ResultsofZ-ScoreTests
Table B.2: Z-score table associated with the questions Q1, Q2
and Q3 (Google)
z-score table (GOOGLE)Country Q1 (Black) Q2 (Asian) Q3 (White)Algeria -1.65 -2.86 3.43Angola -4.42 -0.30 3.75Argentina -3.90 -0.15 2.79Australia -3.77 1.61 1.74Austria -1.89 -0.33 1.47Brazil -4.38 -0.11 3.57Canada (EN) -3.72 0.10 2.55Canada (FR) -2.32 2.13 0.27Chile -3.99 -0.07 2.84China -1.06 0.04 0.21Denmark -3.73 -0.34 3.04Egypt -1.84 -3.33 3.95Finland -0.04 0.76 -0.61France -3.15 -1.10 3.23Guatemala -3.96 -0.03 2.80Germany -1.86 -0.56 1.64Greece -2.08 -2.18 3.15India -2.24 -1.26 2.47Iraq -1.89 -2.99 3.72Italy -2.18 -0.67 1.97Japan 0.36 2.29 -2.43Kenya -1.57 1.08 0.50Malaysia -2.10 2.83 -1.52Mexico -4.05 -0.15 2.95Morocco -1.53 -2.71 3.23Nigeria -2.84 0.71 1.74Paraguay -4.14 -0.07 3.01Peru -4.02 -0.11 2.90Portugal -4.37 0.00 3.47Russia -1.71 -1.87 2.61Saudi Arabia -2.19 -3.18 4.05South Africa -2.95 0.92 1.73South Korea -1.16 -2.32 2.54Spain -3.84 -0.07 2.68Sweden -2.41 0.09 1.71Switzerland (DE) -1.56 -1.06 1.86Switzerland (FR) 0.00 -1.00 3.15Turkey -1.75 -1.48 2.32Ukraine -0.68 -0.20 0.56United Kingdom -2.95 0.92 1.73USA (EN) -2.75 0.37 1.92USA (ES) -2.27 -0.04 1.75Venezuela -3.84 -0.07 2.69Zambia -2.81 1.05 1.53
Table B.3: Z-score table associated with the questions Q4, Q5
and Q6 (Google)
z-score table (GOOGLE)Country Q4 (Black) Q5 (Asian) Q6 (White)Algeria -1.65 -2.86 3.43Angola -4.42 -0.30 3.75Argentina -3.90 -0.15 2.79Australia -3.77 1.61 1.74Austria -1.89 -0.33 1.47Brazil -4.38 -0.11 3.57Canada (EN) -3.72 0.10 2.55Canada (FR) -2.32 2.13 0.27Chile -3.99 -0.07 2.84China -1.06 0.04 0.21Denmark -3.73 -0.34 3.04Egypt -1.84 -3.33 3.95Finland -0.04 0.76 -0.61France -3.15 -1.10 3.23Guatemala -3.96 -0.03 2.80Germany -1.86 -0.56 1.64Greece -2.08 -2.18 3.15India -2.24 -1.26 2.47Iraq -1.89 -2.99 3.72Italy -2.18 -0.67 1.97Japan 0.36 2.29 -2.43Kenya -1.57 1.08 0.50Malaysia -2.10 2.83 -1.52Mexico -4.05 -0.15 2.95Morocco -1.53 -2.71 3.23Nigeria -2.84 0.71 1.74Paraguay -4.14 -0.07 3.01Peru -4.02 -0.11 2.90Portugal -4.37 0.00 3.47Russia -1.71 -1.87 2.61Saudi Arabia -2.19 -3.18 4.05South Africa -2.95 0.92 1.73South Korea -1.16 -2.32 2.54Spain -3.84 -0.07 2.68Sweden -2.41 0.09 1.71Switzerland (DE) -1.56 -1.06 1.86Switzerland (FR) 0.00 -1.00 3.15Turkey -1.75 -1.48 2.32Ukraine -0.68 -0.20 0.56United Kingdom -2.95 0.92 1.73USA (EN) -2.75 0.37 1.92USA (ES) -2.27 -0.04 1.75Venezuela -3.84 -0.07 2.69Zambia -2.81 1.05 1.53

55
Table B.4: Z-score table associated with the questions Q4, Q5 and Q6 (Bing)
z-score table (BING)
Country Q4 (Black) Q5 (Asian) Q6 (White)
Argentina -3.19 1.14 1.09
Australia -4.38 -0.23 3.56
Austria -1.82 -1.09 2.12
Brazil -3.95 -1.36 4.34
Canada (EN) -4.40 -0.03 3.40
Canada (FR) -2.51 -1.49 3.08
Chile -3.22 1.10 1.15
Finland -0.56 0.95 -0.39
France -2.56 -0.92 2.72
Germany -2.83 -0.27 2.39
India -3.79 0.03 2.86
Ireland -4.29 -0.75 3.84
Italy -1.60 -1.07 1.92
Japan -2.21 2.50 -1.81
Malaysia -4.63 -0.03 3.70
Mexico -2.71 0.02 1.61
Portugal -4.04 -1.43 4.47
Russia -3.08 -0.16 2.45
South Africa -4.12 -0.11 3.22
Spain -2.68 0.28 1.34
Sweden -4.02 -0.28 3.40
Switzerland (DE) -1.46 -1.08 1.88
Switzerland (FR) -2.37 -2.05 3.35
Turkey -2.79 -1.89 3.40
United Kingdom -4.48 0.03 3.44
USA (EN) -4.13 0.00 3.23
USA (ES) -2.45 -0.69 1.79


Appendix C
Results of Wilcoxon Tests
Results highlighted in the Tables C.1 and C.2 show those countries for which we
keep the alternative hypothesis.
Table C.1: P-value table associated with the questions Q7 (Google)
GOOGLEWilcoxon test (Q7)
Country p-value Country p-valueAlgeria 0.0023 Mexico 0.0002Angola 0.0034 Morocco 0.0162Argentina 0.0003 Nigeria 0.0000Australia <0.0000 Paraguay 0.0001Austria 0.0002 Peru 0.0001Brazil 0.0072 Portugal 0.0077Canada (EN) <0.0000 Guatemala 0.0001Canada (FR) 0.0003 Russia 0.0023Chile 0.0003 Saudi Arabia 0.0109China 0.0002 South Africa 0.0000Denmark 0.0181 South Korea 0.4094Egypt 0.0046 Spain 0.0001Finland 0.0183 Sweden 0.0241France 0.0006 Switzerland (DE) <0.0000Germany 0.0002 Switzerland (FR) 0.0026Greece 0.0000 Turkey <0.0000India 0.0072 Ukraine 0.0524Iraq 0.0092 United Kingdom <0.0000Italy 0.0101 USA (EN) <0.0000Japan 0.0001 USA (ES) 0.0051Kenya 0.0016 Venezuela 0.0006Malaysia <0.0000 Zambia <0.0000
57

58 Appendix C. Results of Wilcoxon Tests
Table C.2: P-value table associated with the questions Q7 (Bing)
BINGWilcoxon test (Q7)
Country p-value Country p-valueArgentina 0.0034 Malaysia <0.0000Australia <0.0000 Mexico 0.0182Austria <0.0000 Portugal 0.0001Brazil 0.0002 Russia 0.0009Canada (EN) <0.0000 South Africa 0.0000Canada (FR) <0.0000 Spain 0.0087Chile 0.0045 Sweden 0.0094Finland 0.1084 Switzerland (DE) <0.0000France 0.0016 Switzerland (FR) 0.0001Germany <0.0000 Turkey 0.0020India <0.0000 United Kingdom <0.0000Ireland <0.0000 USA (EN) 0.1297Italy 0.0001 USA (ES) <0.0000Japan 0.0916