identification of areas susceptible to the establishment
TRANSCRIPT

Identification of Areas Susceptible to the Establishment of Fifty-three Bactrocera spp. (Diptera: Tephrididae: Dacinae) in the United States
Margaret L. Margosian, USDA-APHIS-PPQ-CPHST-STT, Manhattan, KS Christie A. Bertone, Daniel M. Borchert, Yu Takeuchi, USDA-APHIS-PPQ-CPHST-PERAL, Raleigh, NC

1
Cover Photo credits: Top Row: Bactrocera carambolae and larvae. Photos from www.iica.int Bottom Left: Bactrocera latifrons. Photo from http://stri.discoverlife.org Bottom Right: Bactrocera oleae. Photo from www.cnr.berkeley.edu

2
Table of Contents Introduction 3 Biology 3 Susceptible Hosts 3 Climate Characteristics 5 Analysis 7 Results 17 Indications for Monitoring Programs 18 References 18 Appendix A. Distribution of Susceptible Hosts in the US 20 Appendix B. Table for Reclassification of Susceptible Host Densities into
Low to High Risk Scale of 1-10 41 Appendix C. Potential Generations Calculations for Hawaii 41 Appendix D. Analysis Model Diagram 42 Tables and Maps Table 1. Bactrocera spp. Fruit Flies by Lure Response and Their Hosts 4 Table 2. Cold Mortality Conditions and Life Cycle Statistics
for Species Found in the Literature 6 Table 3. Summary of Analysis Parameters for Risk Assessment 7 Map 1a. Host Densities per County for Methyl Eugenol (ME) Group Hosts 8 Map 1b. Host Densities per County for Cue Lure (CL) Group Hosts 9 Map 1c. Host Densities per County for Non Responder (NR) Group Hosts 10 Map 2a. Risk for Multiple Fruit Fly Generations for the ME Group,
Based on Parameters for B. dorsalis 11 Map 2b. Risk for Multiple Fruit Fly Generations for the CL Group,
Based on Parameters for B. cucurbitae 12 Map 2c. Risk for Multiple Fruit Fly Generations for the NR Group,
Based on Parameters for B. latifrons 13 Map 3. Cold Temperature Exclusion Area for All Lure Groups,
Based on Parameters for B. tryoni 14 Map 4a. Risk Map for Methyl Eugenol (ME) Fruit Fly Group Developed
Through the Combination of Hosts, Biological Development, and Cold Temperature Restrictions 15
Map 4b. Risk Map for Cue Lure (CL) Fruit Fly Group Developed Through the Combination of Hosts, Biological Development, and Cold Temperature Restrictions 16
Map 4c. Risk Map for Non Responders (NR) Fruit Fly Group Developed Through the Combination of Hosts, Biological Development, and Cold Temperature Restrictions 17

3
Identification of Areas Susceptible to the Establishment of Fifty-three Bactrocera spp. (Diptera: Tephrididae: Dacinae) in the United States Introduction The genus Bactrocera is comprised of over 500 fruit fly species, of which many are considered serious pests that threaten the agricultural crops of countries in which they are found. The majority of these species are native to the South Pacific, Australia, India, and Southeast Asia (zipcodezoo.com), although many have moved into Africa, Europe, and South America. It appears that some have been so recently discovered or separated from like species (B. dorsalis group, Clarke et al., 2005) that very little information is available on their life cycles and host preferences. Countries like Australia already have extensive monitoring and eradication programs in place, while other countries are still attempting to assess which fruit flies are present and causing damage (Saurs-Muller, 2005). Fifty-three species of concern to United States agriculture are considered in this analysis (Table 1), which utilizes host availability and climate information to determine which agricultural areas in the US are most susceptible to damage, for monitoring purposes. Some, like B. oleae, are already established in the US, while others pose a future threat if accidental transport and escape occur. To simplify the analysis process, the 53 species have been grouped by their lure preference, namely methyl eugenol (ME), cue lure (CL), and those species that are not responsive to either (NR). The groups are then further generalized by identifying those characteristics among the group that represent worst-case scenarios, such as ability to utilize the greatest number of hosts, and ability to tolerate the coldest temperatures, making them the most likely to spread far into the United States once escaped. Biology The life cycles for many of the species on this list are similar, but specific information appears for only some of the 53 species in the literature. In general, the life cycle follows a pattern of adults mating, usually in the foliage of plants surrounding or near the host but not necessarily on the host (Raghu, 2002); followed by eggs being deposited within the flesh of the favored host fruit for the species. In a short period of time, usually a few days, larvae hatch and begin to consume the fruit in which they find themselves. After an additional number of days ranging between 4 and 12, the larvae drop from the fruit and become pupae in the soil. Adults emerge 7-10 days later and feed for about a week before sexually maturing and mating. (Peña et al., 2002). Table 2 reviews the life cycle parameters for species under consideration in this risk assessment that were available in the literature. Information on the amount of time a fruit fly takes to develop from egg to egg varies in scope and detail. For instance, one source lists the life cycle for B. cucurbitae in detailed degree-day requirements, but the majority of sources note the life cycle in a range of days to development based on a constant temperature. Susceptible Hosts The Bactrocera group under consideration in this document is attracted to a wide variety of hosts. Some prefer only one or two host species, or specialize on one group of hosts, while others are generalists and infest as many as 31 host species now grown commercially in the United States (White and Elson-Harris, 1992). Hosts can be grouped into types of fruit or vegetable. The 53 Bactrocera species make use of a few or many of the following hosts, as shown in Table 1.
A. Tropical Fruits. Guava (1), persimmon (2), banana (3), papaya (4), mango (5), pomegranate (6), quince (7), pineapple (8), kumquat (9), avocado (10).
B. Dates and Figs. Date palms (11) and figs (12). C. Citrus. Oranges (13), grapefruit (14), lemons (15), limes (16), tangerines (17), mandarin oranges
(18), citrons (19).

4
D. Olives. Olives (20). E. Tree Nuts. Cashew (21), walnut (22), sweet almond (23). F. Temperate Tree and Vine Fruits. Apples (24), peaches (occasionally nectarine) (25), pears (26),
plums (27), apricots (28), cherries (29), mulberries (30), grapes (wine grapes are specifically mentioned in the literature) (31).
G. Cucurbits (Gourds and Squash). Gourds (32), cucumbers (33), luffa (34), pumpkin (35), squash (36), watermelon (37), other melons (38).
H. Other Fruits/Vegetables. Tomatoes (39), bell peppers (40), chili peppers (41), eggplant (42), garden beans (43), lima beans (44), strawberries (45), raspberries (46), blackberries (47), gooseberries (48), cauliflower(49), okra (50).
Of these hosts, National Agricultural Statistics Service (NASS) crop data is not available for quince (7), mandarin oranges (18), citrons (19), cashew (21), mulberries (30), gourds (may be included with squash) (32), luffa (34), gooseberries (48), cauliflower (49), or okra (50); therefore, these are not used in the risk analysis. Maps of the distribution of all susceptible hosts are in Appendix A. Table 1. Bactrocera spp. Fruit Flies by Lure Response and Their Hosts Source: White and Elson-Harris, 1992, except for B. dorsalis (CFR, 2003) and B. cucurbitae (CFR, 2005) Lure Group and Species Hosts (US Commodities) Methyl Eugenol Response B. cacuminata (Hering) 39, wild tobacco B. carambolae (Drew & Hancock) 1, 3, 5, 13, 14, 17, 23, 39, 41 B. caryeae (Kapoor) all Host Group C, 1, 3, 5, 12 B. correcta (Bezzi) 1, 5, 13, 23, 25, 27 B. diversa (Coquillett) 1, 3, 5, 13, 32, 34, 35 B. dorsalis (Hendel) all Host Groups B, E, and F; 1, 2, 3, 4, 5, 6, 7, 9, 10, 13,
14, 15, 16, 17, 33, 37, 39, 40, 41, 48 B. kandiensis (Drew & Hancock) 5, 14 B. mayi (Hardy) 28 B. musae (Tryon) 1, 3 B. occipitalis (Bezzi) 5 B. papayae (Drew & Hancock) 1, 3, 4, 5, 13, 32, 41 B. philippinensis (Drew & Hancock) 5 B. tuberculata (Bezzi) 5, 25 B. umbrosa (Fabricius) 13, 32 B. xanthodes (Broun) 1, 4, 8, 18, 37, 39, 40 B. zonata (Saunders) 1, 4, 5, 6, 7, 11, 13, 23, 24, 25, 32, 38, 37, 39 Cue Lure Response B. albistrigata (Meijere) 23 B. aquilonis (May) 1, 3, 5, 10, 14, 15, 17, 21, 23, 24, 25, 27, 39, 40 B. bryoniae (Tryon) wild watermelon and wild cucurbits B. caudata (Fabricius) 1, 13, 25, 34, 32, 33, 34, 35, 39, 41 B. cucurbitae (Coquillett) all Host Groups B and G; 1, 4, 5, 7, 10, 11, 12, 13, 14, 15, 22,
possibly 24, 25, 26, 28, 39, 40, 42, 43, 44, 49, 50 B. curvipennis (Froggatt) all Host Group C B. distincta (Malloch) no hosts listed are grown commercially in US B. facialis (Coquillett) 1, 8, 10, 13, 14, 15, 21, 23, 25, 37, 40 B. frauenfeldi (Schiner) 1, 3, 4, 5, 23 B. jarvisi (Tryon) 1, 2, 3, 4, 5, 6, 7, 13, 23, 24, 25, 26, 39 B. kirki (Froggatt) 1, 5, 8, 13, 16, 18, 23, 25, 40 B. kraussi (Hardy) no hosts listed are grown commercially in US B. melanotus (Coquillett) all Host Group C, 1, 5 B. passiflorae (Froggatt) 1, 4, 5, 10, 16, 18, 21, 42 B. pedestris (Bezzi) no source for hosts found
5
B. psidii (Froggatt) all Host Group C, 1, 5 B. scutellata (Hendel) 35 B. tau (Walker) 1, 30, 32, 33, 34, 35 B. trivialis (Drew) 1, 14, 25 B. tryoni (Froggatt) all Host Group B, all Host Group E, all Host Group F, 1, 2, 3,
4, 5, 6, 7, 9, 10, 13, 14, 15, 16, 18, 19, 20, 47, 48 Non-responders B. arecae (Hardy & Adachi) no hosts listed are grown commercially in US B. atristosa (Perkins) 33, 35, 37, 39 B. cucumis (French) 4, 32, 33, 34, 35, 36, 39 B. decipiens (Drew) 35, possibly other cucurbits B. depressa (Shiraki) 32, possibly 33, 35, 37, 39 B. expandens (Walker) possibly 35 B. halfordiae (Tryon) 9, 12, 13, 14, 18 B. latifrons (Hendel) 1, 3, 5, 13, 15, 33, 39, 41, 42 B. melanoscutata (Drew) no hosts listed are grown commercially in US B. melas (Perkins & May) 1, 9, 11, 12, 13, 14, 24, 25, 26, 27 B. minax (Enderlein) 9, 13, 15, 17 B. munda (Bezzi) 35 B. mutabilis (May) 9 B. neohumeralis (Hardy) 1, 5, 11, 13, 14, 15, 18, 23, 24, 25, 26, 27, 28, 39, 45, 46 B. oleae (Rossi) 20 B. trimaculata (Hardy & Adachi) 32 B. tsuneonis (Miyake) 9, 13, 17, possibly others in Host Group C In the analysis, hosts were combined to represent an overall landscape crop density that any Bactrocera species within a lure response group could utilize. In the ME group, the following hosts were combined: guavas, persimmon, bananas, papayas, mangos, pomegranates, pineapples, kumquats, avocadoes, date palms, figs, all citrus, sweet almonds, walnuts, apples, peaches, pears, plums, apricots, cherries, grapes, all cucurbits, tomatoes, bell peppers, and chili peppers. When NASS data were not available, hosts were removed from analyses. For the CL group, every host listed above was combined except strawberries, and those hosts for which NASS data were not available. For the NR group, the following hosts were combined: guavas, bananas, papayas, mangos, kumquats, date palms, figs, oranges, grapefruits, lemons, tangerines, mandarin oranges, olives, sweet almonds, apples, peaches, plums, pears, apricots, cucumbers, pumpkins, squash, watermelon, tomatoes, chili peppers, eggplant, strawberries, and raspberries. When data were not available, hosts were removed from analyses. Climate Characteristics Bactrocera spp., like many fruit flies, rely on warm temperatures and few if any days or nights of cold weather in order to complete their life cycle. Most species that have been investigated demonstrate that the life cycle can be accomplished more quickly during warmer temperatures than in even slightly less warm temperatures. The application of cold temperatures to fruit before and during shipping is one method of treatment of the species; therefore, cold temperatures represent a significant barrier to fruit fly spread on land. Analysis included climate modeling that identified those areas of the US that become too cold to remain at risk for fruit fly spread beyond a single season. Cold tolerance for Bactrocera species is not well researched. In fact, in several published papers, authors regularly assumed that the species being investigated was similar in cold tolerance to other species with published cold tolerance values and used that data in their research. In this assessment, the same assumption will have to be made. In the ME group, cold tolerance data for B. dorsalis has been reported most often for both the species and as a substitute for others , with mortality occuring after exposure to

6
minimum temperature of 1.67°C/35°F for 18 days. In the CL group, B. tryoni suffers 100% mortality at exposure to 1°C for 16 days and represented the worst-case scenario for that lure group. No cold tolerance information for any species in the NR group was found in the literature. Because of the similarity of the cold tolerance parameters for the two groups with reported parameters, and the NR group requires surrogate parameters, the worst-case scenario for all three (B. tryoni) is adopted for all three. Table 2. Cold Mortality Conditions and Life Cycle Statistics for Species Found in the Literature NRF = No reference found --- Not researched if no hosts are commercially produced in US Lure Group and Species Cold Mortality Degree Days Required for Development Methyl Eugenol Response B. cacuminata (Hering) NRF NRF B. carambolae (Drew & Hancock) NRF eggs 1-2 d, larvae 6-9 d, pupae 8-9 d, Adults 8-10 d, all @ 26°C1 B. caryeae (Kapoor) NRF NRF B. correcta (Bezzi) NRF NRF B. diversa (Coquillett) NRF NRF B. dorsalis (Hendel) 1.67°C(35°F)2 625 dd from egg to adult base for 18 days developmental temperature 8.375 C10
B. kandiensis (Drew & Hancock) NRF NRF B. mayi (Hardy) NRF NRF B. musae (Tryon) NRF entire cycle 2.5 weeks1 B. occipitalis (Bezzi) NRF NRF B. papayae (Drew & Hancock) NRF NRF B. philippinensis (Drew & Hancock)NRF NRF B. tuberculata (Bezzi) NRF NRF B. umbrosa (Fabricius) NRF NRF B. xanthodes (Broun) NRF NRF B. zonata (Saunders) assumed = B. dorsalis3 455 dd egg to adult base developmental
temp 12.64 C10 Cue Lure Response B. albistrigata (Meijere) NRF NRF B. aquilonis (May) NRF NRF B. bryoniae (Tryon) NRF NRF B. caudata (Fabricius) NRF NRF B. cucurbitae (Coquillett) at least 3°C/37.4°F 282.38 dd egg to adult
(implied)4 base developmental temp 9.06 C9 B. curvipennis (Froggatt) NRF NRF B. distincta (Malloch) --- --- B. facialis (Coquillett) NRF NRF B. frauenfeldi (Schiner) NRF NRF B. jarvisi (Tryon) NRF NRF B. kirki (Froggatt) NRF NRF B. kraussi (Hardy) --- --- B. melanotus (Coquillett) NRF NRF B. passiflorae (Froggatt) NRF NRF B. pedestris (Bezzi) --- --- B. psidii (Froggatt) NSF NRF B. scutellata (Hendel) NSF NRF B. tau (Walker) NSF NRF B. trivialis (Drew) NSF NRF B. tryoni (Froggatt) 1 °C NRF
(up to 16 days)10 Non-responders

7
B. arecae (Hardy & Adachi) --- --- B. atristosa (Perkins) NSF NRF B. cucumis (French) NSF NRF B. decipiens (Drew) NSF NRF B. depressa (Shiraki) NSF NRF B. expandens (Walker) NRF NRF B. halfordiae (Tryon) NRF NRF B. latifrons (Hendel) NRF 393.82 dd base developmental temp 9.2C
egg to adult9 B. melanoscutata (Drew) --- --- B. melas (Perkins & May) NRF NRF B. minax (Enderlein) NRF pupae 180 d1 B. munda (Bezzi) NRF NRF B. mutabilis (May) NRF NRF B. neohumeralis (Hardy) NRF NRF
B. oleae (Rossi) NRF NRF B. trimaculata (Hardy & Adachi) NRF NRF B. tsuneonis (Miyake) assumed = Ceratitis capitata
(1.11°C/34° for 20 days)8 1Peña et al., 2002; 2Hennesey and Borchert, 2006; 3Stibick, 2002; 4Koyama et al., 2004; 5Dhillon et al., 2005; 6Hill et al., 1988;7Meats, 2006; 8CABI/EPPO, 1990; 9Neitschke et al., in press, 10Borchert et al., 2006 Analysis Table 3. Summary of analysis parameters for risk assessment Lure Group Susceptible Hosts Cold Tolerance Threshold Degree Day Model ME 1, 2, 3, 4, 5, 6, 8, 9, 10, 1°C/33°F for 16 days (B. tryoni) 301.1 dd (B. zonata) 11, 12, 13, 14, 15, 16, 17, 22, 23, 24, 25, 26,
27, 28, 29, 31, 33, 35, 36, 37, 38, 39, 40, 41
CL all except 45 1°C/33°F for 16 days (B. tryoni) 282.4 dd (B. cucurbitae) NR 1, 3, 4, 5, 9, 11, 12, 13 1°C/33°F for 16 days (B. tryoni) 393.8 (B. latifrons)
14, 15, 17, 20, 23, 24, 25, 26, 27, 28, 33, 35, 36, 37, 39, 41, 42, 45
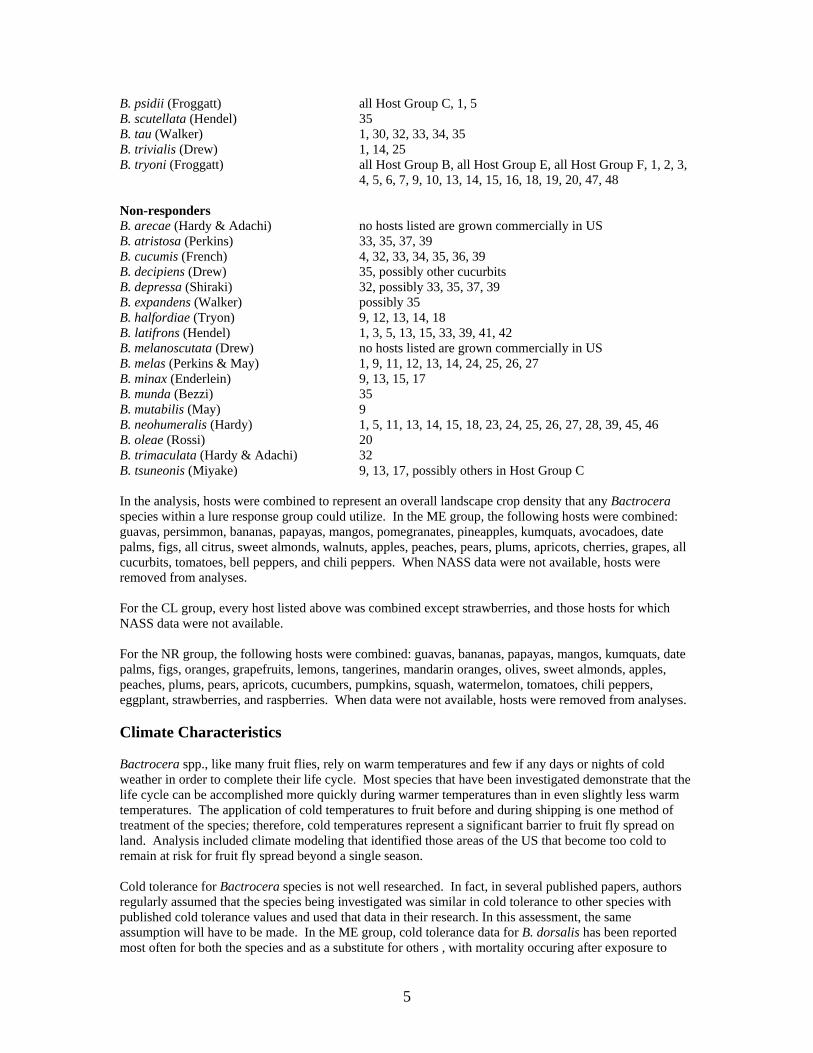
Table 3 shows a summary of the parameters of susceptible hosts, cold tolerance thresholds, and degree days per generation used in the analysis. Susceptible host acres per US county were combined to estimate total acreage of all susceptible hosts per county. The total host acreage was divided by county acreage to create density of host per county. The results for the ME, CL, and NR groups are shown in Maps 1a, b, and c respectively. The host densities were reclassified to a scale of one through ten, with one being areas with very low density of susceptible hosts, and ten being areas with high densities of a variety of hosts (maps not shown). The table for this reclassification is shown in Appendix B.
8
Map 1a. Host Densities per County for Methyl Eugenol (ME) Group Hosts

9
Map 1b. Host Densities per County for Cue Lure (CL) Group Hosts

10
Map 1c. Host Densities per County for Non Responder (NR) Group Hosts Degree day models were run using the North Carolina State University APHIS Plant Pest Forecast System (NAPPFAST) for B. dorsalis (ME group), B. curcurbitae (CL group) and B. latifrons (NR group). For each of the three representative species, 15 probability maps were generated for 1 to 15 generations during a 365 day cycle, beginning January 1 and ending December 31, using a ten-year climate database for the time period of 1997 through 2006. The 15 probability maps were combined, averaged and displayed in 10 classes representing the relative risk of Bactrocera based on the ability to pass through multiple generations. The 1 to 10 relative risk scale in the Multiple Generation Risk maps represent areas that have low (1) or high (10) potential for development of multiple generations (up to 15) of the Bactrocera species indicated. Degree day modeling is a commonly used approach for estimating pest phenology and the limitations and shortcomings to this methodology expressed by several authors such as Wang (1960), Sharpe and DiMichele (1977) and Wagner et al. (1984) are acknowledged. NAPPFAST does not create degree day models for Hawaii at this time, so a separate estimate for the islands was made for each group using data from 39 weather stations for 2005; an explanation of the estimation method used is in Appendix C. Maps of these results are shown in Maps 2a, b, and c, in which risk is shown with a scale of one to ten, representing areas that have low (1) or high (10) potential for development of multiple generations (up to 15) of the Bactrocera species indicated. It important to note that even the slowest of the species examined to develop, B. dorsalis, passed through potentially four generations in much of the southern half of the United States; however, due to the rapid development of B. curcurbitae, we used probability maps up to 15 generations as the standard for all species. This provided differentiation among the three species and was based on the assumption that more generations represented greater potential risk.

11
Map 2a. Risk for Multiple Fruit Fly Generations for the ME Group, Based on Parameters for B. dorsalis

12
Map 2b. Risk for Multiple Fruit Fly Generations for the CL Group, Based on Parameters for B. cucurbitae

13
Map 2c. Risk for Multiple Fruit Fly Generations for the NR Group, Based on Parameters for B. latifrons A single cold temperature exclusion area layer was utilized for all three lure group types due to the similarity in cold temperature response for the Bactrocera species examined. The information used to generate the model was based on Hill et al. (1988) and used the occurrence of 15-59 days with average daily temperature during January and February below 1°C. The areas were based on a ten-year climate data between 1997 and 2006. The results of these areas are shown in Map 3.

14
Map 3. Cold Temperature Exclusion Area for All Lure Groups, Based on Parameters for B. tryoni The reclassified Susceptible Host Totals and the Generations data were combined in a weighted sum analysis, with a 2:1 ratio applied to the host data over the generational data, maintaining the 1(low)-to-10(high) risk scale. The resulting maps were masked by areas of the country that exceeded the cold tolerance threshold selected for the lure group, as these areas represent the cutoff for generational development. Lastly, the resulting areas of risk were reclassified to represent High, Medium, and Low risk throughout the remaining areas. The complete steps for this analysis model are shown in Appendix D. The potential risks for fruit fly infestations in the US based on this analysis are shown in Maps 4a, b, and c. Risk analysis values from 1-4 are considered lower risk, 5-7 are considered moderate risk, and 8-10 are considered higher risk.

15
Map 4a. Risk Map for Methyl Eugenol (ME) Fruit Fly Group Developed Through the Combination of Hosts, Biological Development, and Cold Temperature Restrictions
16
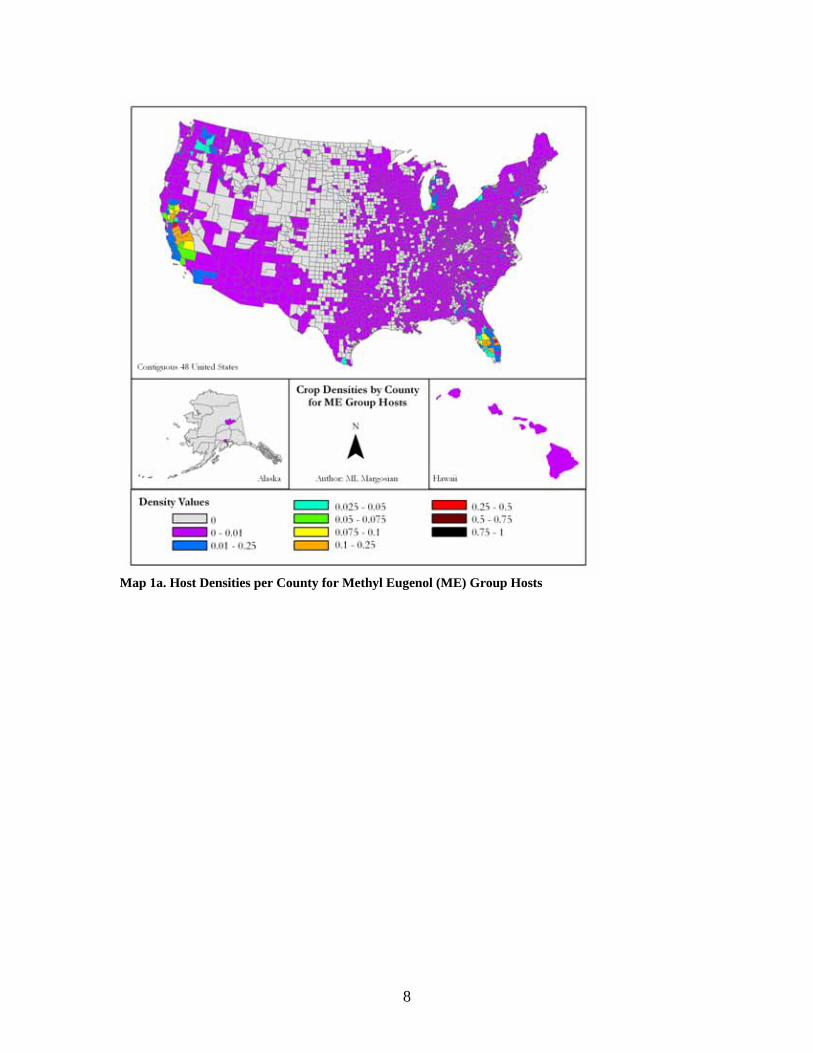
Map 4b. Risk Map for Cue Lure (CL) Fruit Fly Group Developed Through the Combination of Hosts, Biological Development, and Cold Temperature Restrictions
17
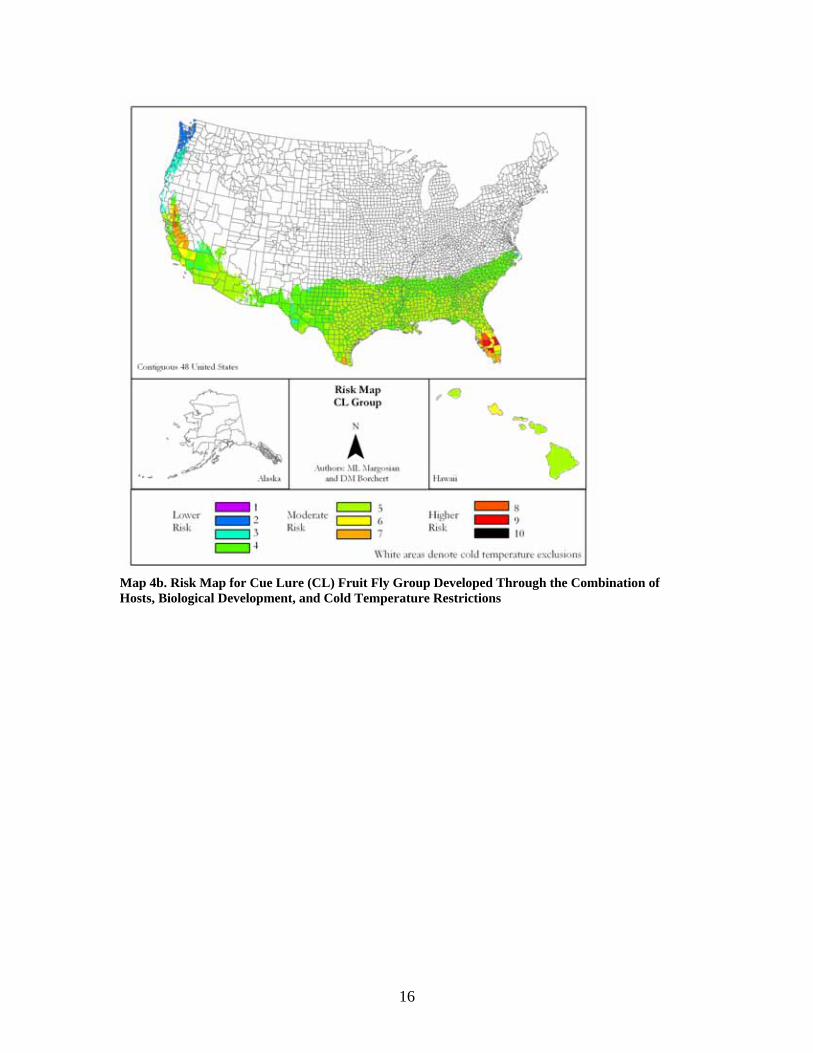
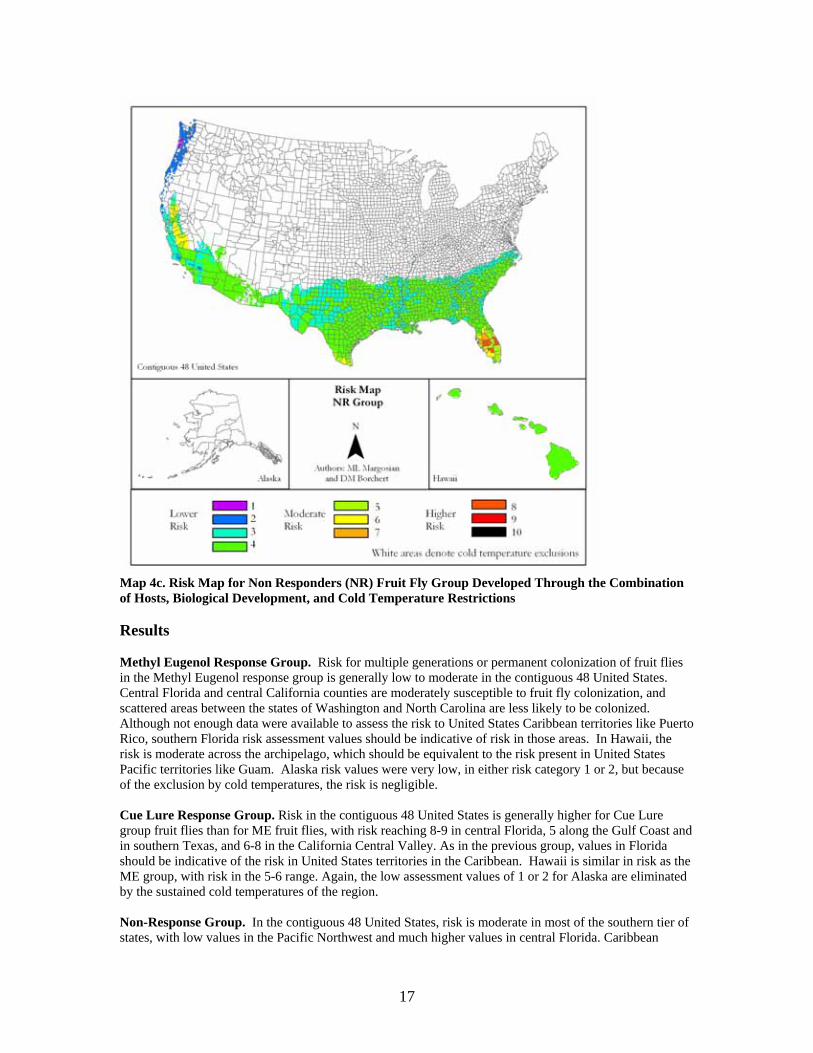
Map 4c. Risk Map for Non Responders (NR) Fruit Fly Group Developed Through the Combination of Hosts, Biological Development, and Cold Temperature Restrictions Results Methyl Eugenol Response Group. Risk for multiple generations or permanent colonization of fruit flies in the Methyl Eugenol response group is generally low to moderate in the contiguous 48 United States. Central Florida and central California counties are moderately susceptible to fruit fly colonization, and scattered areas between the states of Washington and North Carolina are less likely to be colonized. Although not enough data were available to assess the risk to United States Caribbean territories like Puerto Rico, southern Florida risk assessment values should be indicative of risk in those areas. In Hawaii, the risk is moderate across the archipelago, which should be equivalent to the risk present in United States Pacific territories like Guam. Alaska risk values were very low, in either risk category 1 or 2, but because of the exclusion by cold temperatures, the risk is negligible. Cue Lure Response Group. Risk in the contiguous 48 United States is generally higher for Cue Lure group fruit flies than for ME fruit flies, with risk reaching 8-9 in central Florida, 5 along the Gulf Coast and in southern Texas, and 6-8 in the California Central Valley. As in the previous group, values in Florida should be indicative of the risk in United States territories in the Caribbean. Hawaii is similar in risk as the ME group, with risk in the 5-6 range. Again, the low assessment values of 1 or 2 for Alaska are eliminated by the sustained cold temperatures of the region. Non-Response Group. In the contiguous 48 United States, risk is moderate in most of the southern tier of states, with low values in the Pacific Northwest and much higher values in central Florida. Caribbean

18
territories should be considered at a similar risk as southern Florida. The risk in Hawaii stands at a moderate value of 5. Alaska is once again eliminated from risk due to sustained cold temperatures and low host availability. Indications for Monitoring Programs Monitoring programs may utilize these risk maps to develop plans for the placement and density of traps. Higher risk areas suggest more frequently placed traps with a wider variety of lures than areas with lower risks. Frequency of trapping could rely on either the 1-10 scale of relative risk or the three groupings of that scale, depending on the complexity of trapping and monitoring desired. It is important to note that this analysis only uses host, generation potential and cold temperature exclusion information to estimate the potential risk of Bactrocera spp. in the United States. There are other factors not examined in this analysis such as importation and movement of infested material that could increase the risk of Bactrocera in areas of the United States. References Australian Department of Agriculture, Fisheries and Forestry (DAFF). 2003. Tahitian Limes from New Caledonia, Draft Import Risk Analysis Report. Borchert, D., K. Hoffman, and R. Vargas. 2006a. Peach fruit fly life-cycle model review. USDA-APHIS document. 6 pp. http://ncraas13/workbench/fileProxy.cfm?subdir=Documents&filename=Peach%20Fruit%20Fly%20Ad%2DHoc%20Report%20final%2Epdf Borchert, D., K. Hoffman and R. Vargas. 2006b. Oriental fruit fly life-cycle model review. USDA-APHIS document. 6 pp. http://ncraas13/workbench/fileProxy.cfm?subdir=Documents&filename=OFF%20Life%5FCycle%20Review%20Final%2Epdf Clarke, A. R., K. F. Armstrong, A. E. Carmichael, J. R. Milne, S. Raghu, G. K. Roderick and D. K. Yeates. 2005. Invasive Phytophagous Pests Arising Through a Recent Tropical Evolutionary Radiation: The Bactrocera dorsalis Complex of Fruit Flies. Annual Review Entomology. 50:293-319 CFR. 2003. United States Code of Federal Regulations. 7 CFR 301.93-2. CFR. 2005. United States Code of Federal Regulations. 7 CFR 301.97-2. Dhillon, M. K., R. Singh, J. S. Naresh, and H. C. Sharma. Dec. 2005. The melon Fruit fly, Bactrocera cucurbitae: a review of its biology and management. Journal of Insect Science. Hennessey, M. K., 2006. Risk Assessment to Determine Placement of a New Fruit Fly Production Facility. USDA APHIS PPQ CPHST PERAL report. 15 pp. Hennessey, M. K., and D. M. Borchert. 2006. Area of the United States Susceptible to Establishment of the Oriental Fruit Fly (OFF), Bactrocera dorsalis. Draft USDA APHIS Report. Hill, A. R., C. J. Rigney and A. N. Sproul. 1988. Cold Storage of oranges as a disinfestation treatment against the fruit flies Dactus tyroni (Froggart) and Ceratitis capitata (Weidemann) (Diptera: Tephritidae). J. Econ. Entomol. 81:257-260. Koyama, J., H. Kakinohana, and T. Miyatake. 2004. Eradications of the Melon Fly, Bactrocera cucurbitae, in Japan: Importance of Behavior, Ecology, Genetics and Evolution. Annual Review of Entomology 49:331-49.
19
Meats, A. 2006. Attributes pertinent to overwintering potential do not explain why Bactrocera neohumeralis does not spread further south within the geographical range of B. tryoni. Austrailian Journal of Entomology, 45:20-25. National Agricultural Statistics Service, 2002. Census of Agriculture data tables in GIS format. http://www.nass.usda.gov/Data_and_Statistics/index.asp. Nietschke, B.S., R. D. Magarey, D. M. Borchert, D. D. Calvin, and E. Jones. In press. A developmental database to support insect phenology models. Crop Protection. Peña, J.E., Sharp, J.L. and Wysoki, M., ed. 2002. Tropical Fruit Pests and Pollinators: Biology, Economic Importance, Natural Enemies and Control. CABI Publishing, New York. 430 pp. Raghu, S. 2002. The Autecology of Bactrocera cacuminata: Functional Significance of Resources. PhD Thesis, Griffith University. Sharpe, J. H, and D. W. DeMichele. 1977. Reaction kinetics of poikilotherm development. J. Theor. Biol. 64:649-670. Stibick, J. N. L. 2000. Peach Fruit Fly Action Plan. With revisions. Food and Agriculture Organization and International Atomic Energy Agency. Unknown Author. 1990. Data Sheets on Quarantine Pests, Bactrocera tsuneonis. CABI and EPPO. USDA. 2005. Plant Protection and Quarantine Treatment Manual, updated March 26, 2007. USDA-APHIS Plant Protection and Quarantine. http://www.aphis.usda.gov/ppq/manuals/port/Treatment_Chapters.htm Van Sauers-Muller, A. 2005. Host Plants of the Carmbola Fruit Fly, Bactrocera carambolae, in Suriname, South America. Neotrapical Entomology 34(2):203-214. Wagner, T. L., H. Wu, P. J. Sharpe, R. M. Schoolfield, and R. N. Coulson. 1984. Modeling insect development rates: A literature review and application of a biophysical model. Ann. Entomol. Soc. Am. 77:208-225. Wang, J. Y. 1960. A critique of the heat unit approach to plant response studies. Ecology 41:785-790. White, I.M. and M. M. Elson-Harris. 1992. Fruit Flies of Economic Significance. CAB International. London, U.K Zipcode Zoo Distribution Maps. http://zipcodezoo.com.
20
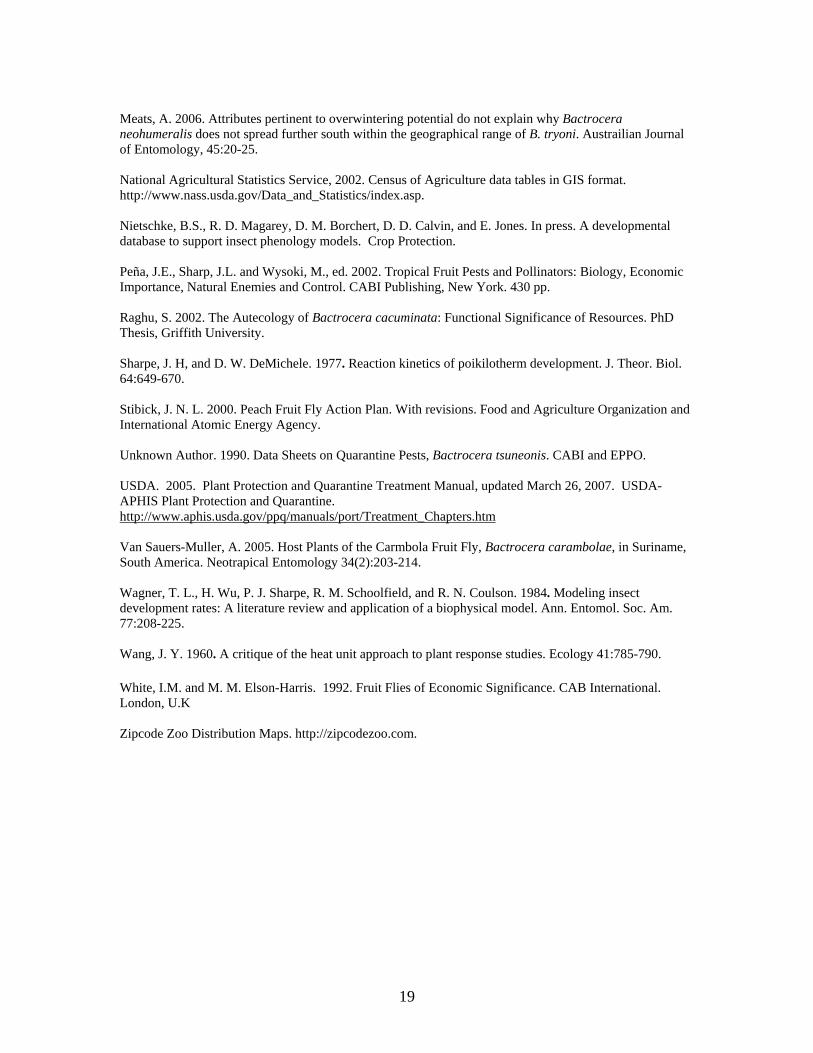
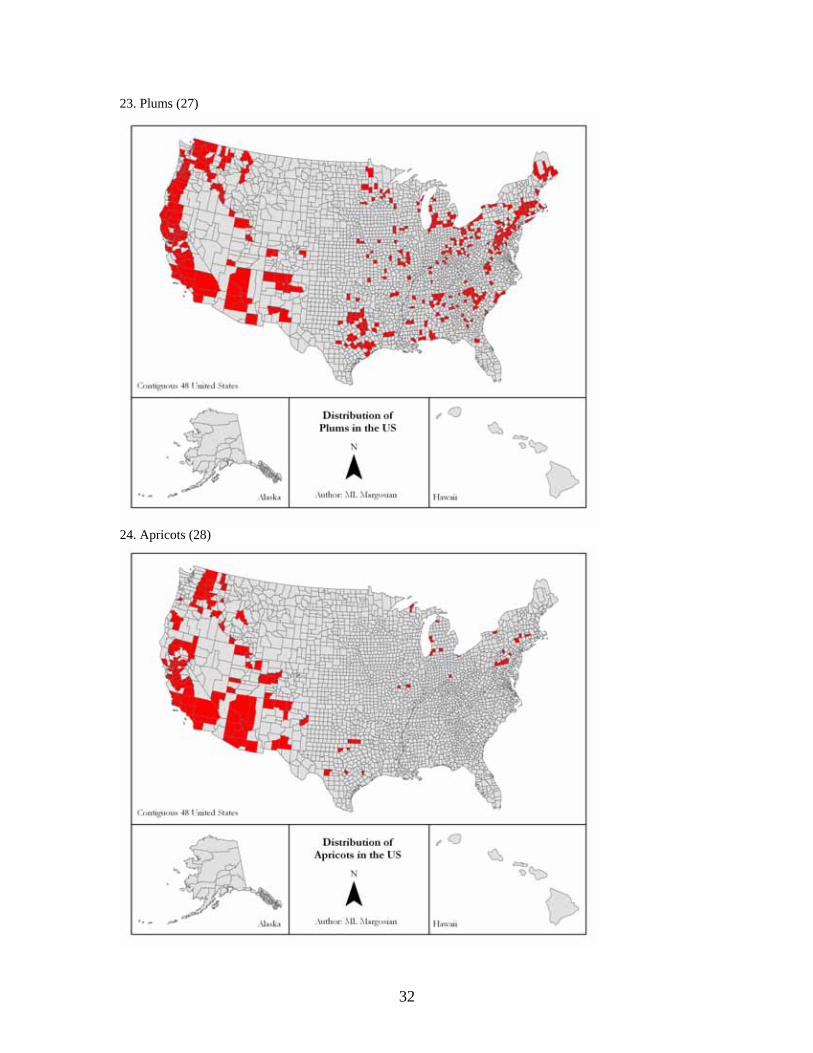
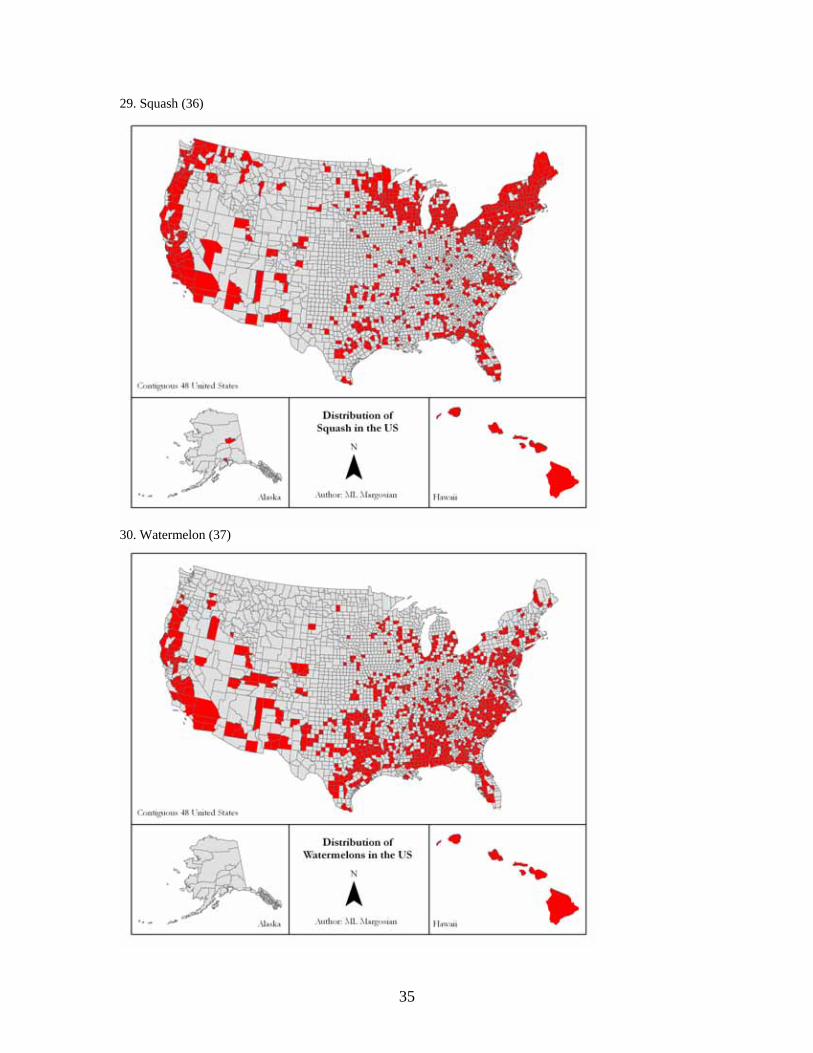
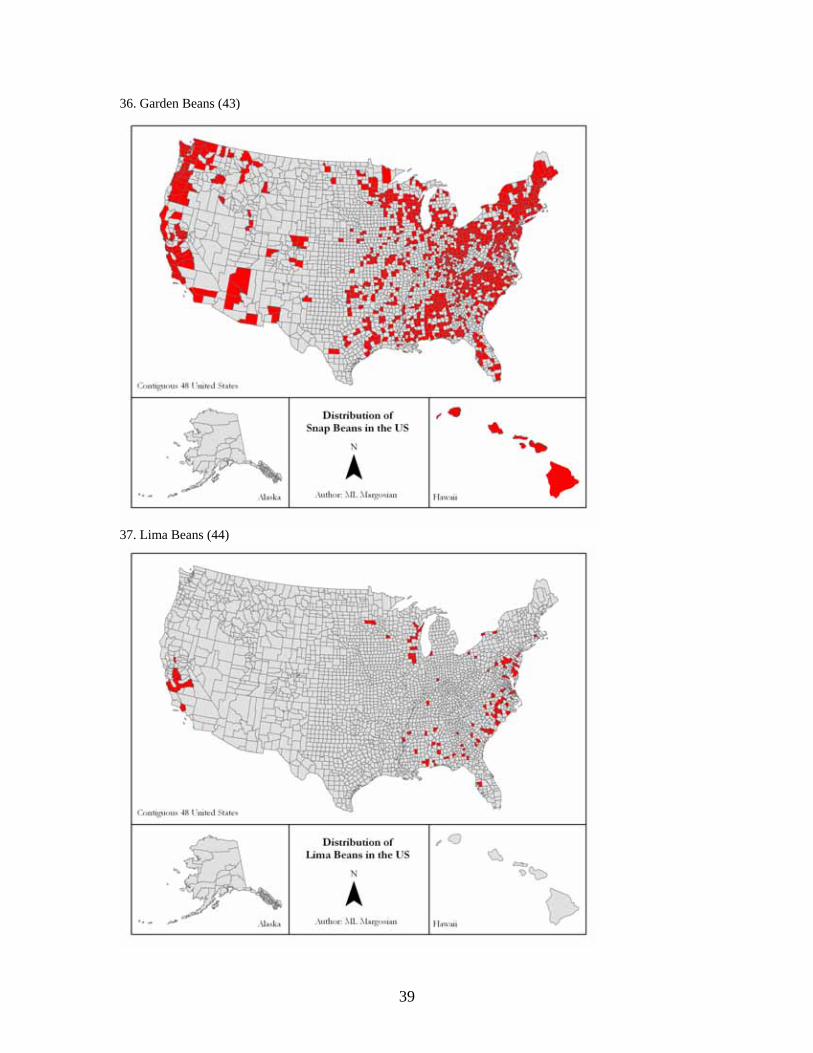
Appendix A. Distribution of Susceptible Hosts in the US Maps developed from NASS 2002 Census Data. Scale of Contiguous 48 US States approx. 1:30,000,000; of Alaska, 1:58,000,000; of Hawaii, 1:10,500,000. 1. Guava (1)

21
2. Persimmon (2)
3. Banana (3)
22
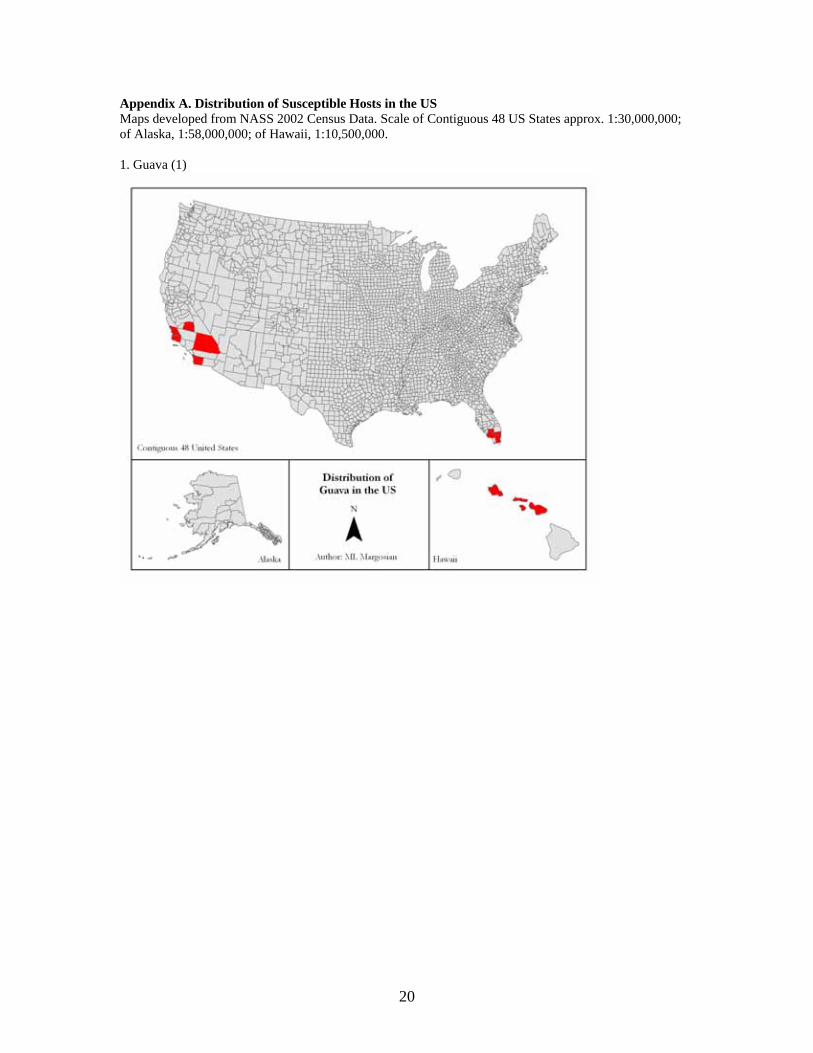
4. Papaya (4)
5. Mango (5)

23
6. Pomegranate (6)
7. Pineapple (8)

24
8. Kumquat (9)
9. Avocado (10)

25
10. Dates (11)
11. Figs (12)

26
12. Oranges (all types) (13)
13. Grapefruit (14)
27
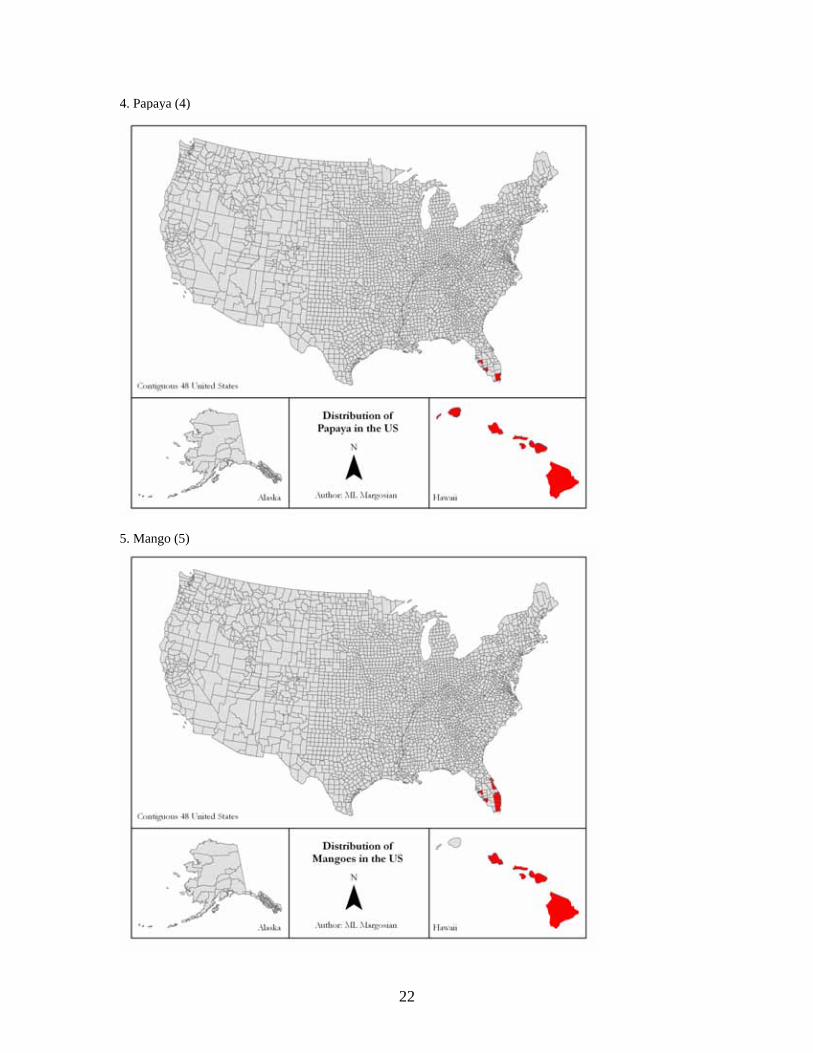
14. Lemons (15)
15. Limes (16)

28
16. Tangerines (17)
17. Olives (20)

29
18. Walnuts (22)
19. Almonds (23)

30
20. Apples (24)
21. a. Peaches (25)

31
21.b. Nectarines (25)
22. Pears (26)
32
23. Plums (27)
24. Apricots (28)

33
25. Cherries (sweet and tart) (29)
26. Grapes (31)

34
27. Cucumbers (33)
28. Pumpkin (35)
35
29. Squash (36)
30. Watermelon (37)

36
31.a. Other Melons - Cantaloupe (38)
31.b. Other Melons - Honeydew (38)

37
32. Tomatoes (39)
33. Bell Peppers (40)

38
34. Chili Peppers (all) (41)
35. Eggplant (42)
39
36. Garden Beans (43)
37. Lima Beans (44)

40
38. Strawberries (45)
39. Raspberries (46)
41
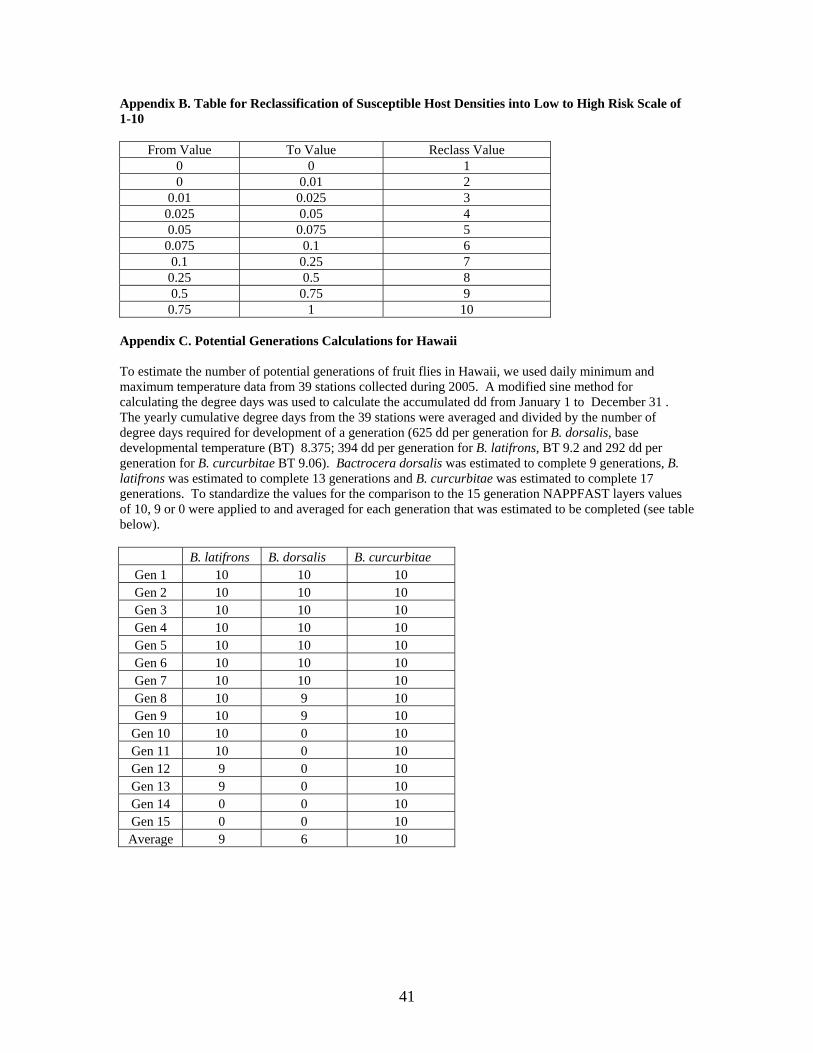
Appendix B. Table for Reclassification of Susceptible Host Densities into Low to High Risk Scale of 1-10
From Value To Value Reclass Value 0 0 1 0 0.01 2
0.01 0.025 3 0.025 0.05 4 0.05 0.075 5 0.075 0.1 6 0.1 0.25 7
0.25 0.5 8 0.5 0.75 9
0.75 1 10 Appendix C. Potential Generations Calculations for Hawaii To estimate the number of potential generations of fruit flies in Hawaii, we used daily minimum and maximum temperature data from 39 stations collected during 2005. A modified sine method for calculating the degree days was used to calculate the accumulated dd from January 1 to December 31 . The yearly cumulative degree days from the 39 stations were averaged and divided by the number of degree days required for development of a generation (625 dd per generation for B. dorsalis, base developmental temperature (BT) 8.375; 394 dd per generation for B. latifrons, BT 9.2 and 292 dd per generation for B. curcurbitae BT 9.06). Bactrocera dorsalis was estimated to complete 9 generations, B. latifrons was estimated to complete 13 generations and B. curcurbitae was estimated to complete 17 generations. To standardize the values for the comparison to the 15 generation NAPPFAST layers values of 10, 9 or 0 were applied to and averaged for each generation that was estimated to be completed (see table below). B. latifrons B. dorsalis B. curcurbitae
Gen 1 10 10 10 Gen 2 10 10 10 Gen 3 10 10 10 Gen 4 10 10 10 Gen 5 10 10 10 Gen 6 10 10 10 Gen 7 10 10 10 Gen 8 10 9 10 Gen 9 10 9 10 Gen 10 10 0 10 Gen 11 10 0 10 Gen 12 9 0 10 Gen 13 9 0 10 Gen 14 0 0 10 Gen 15 0 0 10 Average 9 6 10

42
Appendix D. Analysis Model Diagram