identification of active cell in potassium transporting epithelium
TRANSCRIPT

J. exp. Biol. (1978), 77. »-i3 1
With 5 figuresPrinted in Great Britain
IDENTIFICATION OF ACTIVE CELL IN POTASSIUMTRANSPORTING EPITHELIUM
BY JAMES T. BLANKEMEYER* AND WILLIAM R. HARVEY
Department of Biology, Temple University, Philadelphia, Pennsylvania 19122
(Received 11 November 1077)
SUMMARY
Epithelial ion transport regulates the environment of cells and modulatesthe environment inside them, making possible the evolution of eukaryoticorganisms. Analysis of the transport process requires that the route taken byions as they are actively transported across epithelia be known. The routecan be determined by locating ion pumps electrically and by measuringtransport pool sizes kinetically provided that the epithelial structure is simpleenough to enable the results to be interpreted in cellular terms. The route bywhich potassium is actively transported across the lepidopteran midgut isdemonstrated here by a combination of electrical and kinetic analyses.
Two sorts of cells, goblet and columnar cells, are distinguished by theirelectrical properties. The goblet cell is identified as the site of activepotassium transport, the pump being localized in its apical membrane. Thegoblet cells are electrically coupled with columnar cells only when midgutsthat have been isolated from diet- reared larvae are short circuited. A corollaryto this result is that the size of the pool of potassium which is involved in trans-port should be small when the goblet cells are not coupled with columnarcells and should become large when they are coupled. This corollary has beenconfirmed by direct measurement of the transport pools using isotope tracerkinetic analysis.
This is the first time that the cell type responsible for active ion transportin a polymorphic tissue has been identified directly by physiological means.
INTRODUCTION
Knowledge of epithelial ion transport is important for our understanding of cellularfunction because the ionic composition of the fluid in which eukaryotic cells arebathed is regulated by epithelial ion pumps. As Claude Bernard has stressed, thevery evolution of eukaryotic organisms has been possible only because the internalenvironment is constant (Bernard, 1878). Thus, the ionic composition within cells,which modulates protein synthesis (Lubin & Ennis, 1964), is determined in part bythe extracellular ionic composition. Before such epithelial ion pumps can be isolatedchemically and their structures proven by reconstitution, the route taken by the ionsduring transport must be established. Specifically, the location of the ion pump andof the pool from which it transports must be known.
• Present address: Department of Physiological Sciences, College of Veterinary Medicine, OklahomaState University, Stillwater, Oklahoma 74074.

2 J. T. BLANKEMEYER AND W. R. HARVEY
If an ion pump is electrogenic (i.e. if its action produces an electrical potentialdifference) then the most direct way to locate the pump is to probe the tissue withmicroelectrodes and look for changes in electrical resistance as the pump is turnedoff and on (Blankemeyer, 1976a, b). The most direct way to locate an ion pool is todetermine its size by tracer kinetic analysis and use this information to deduce thecompartment within the epithelium which might contain it (Wood & Harvey, 1975).Both electrical probing of pump location and tracer measurement of pool size mustbe interpreted with respect to cell structure. Hopefully, the route can be confirmedby testing corollary hypotheses (e.g. that the pool size must increase if non-transportingcells become electrically coupled to the transporting cells).
Surprisingly, the transport route has not previously been established for any complextissue. Thus the location of the sodium pump within the well known frog skin is stillundecided with recent papers still trying to demonstrate which cellular layer withinthe skin contains the pump (Nagel, 1976). In toad urinary bladder the sodium poolis only a small fraction of the total sodium, making the deduction of its locationdifficult (MacKnight, Civan & Leaf, 1975).
In the present paper we establish the route taken by potassium ions as they areactively transported across the isolated midgut of lepidopteran larvae. The midgut'snumerous columnar cells and less numerous goblet cells are arranged in a single layerwith occasional replacement cells clustered basally, all of the cells being so large thatinterpretation of both electrical and tracer kinetic data is possible in cellular terms(Anderson & Harvey, 1966).
A summary of the little known midgut system follows (Harvey & Zerahn, 1972).When larvae of Hyalophora cecropia (L) are reared on foliage the high potassiumlevel of the leaves is reflected by a high level, 250 mM, in the midgut contents whereasthe haemolymph level is much lower, 26 mM (Harvey et al. 1975). The isolated midguttransports potassium actively from haemolymph to lumen sides. The transportprocess is electrogenic and renders the lumen side more than 100 mV positive to theblood side. The activity of the potassium pump (as measured by the potential dif-ference, the short circuit current, or by isotopically measured fluxes) is quickly in-hibited by anoxia or metabolic inhibitors but is unaffected by cardiac glycosides(Haskell, Clemons & Harvey, 1965; Jungreis & Vaughan, 1977).
The midgut epithelium of H. cecropia is composed of numerous columnar cells,with apical microvilli and basal infoldings of the plasma membrane lined with mito-chondria, and less numerous goblet cells, with an apical cavity ringed with cytoplasmicprojections each containing a mitochondrion and, uniquely, bearing spicules on theinner leaflet of the plasma membrane (Anderson & Harvey, 1966). In other Lepido-pteran insects such as Manduca sexta, there are small numbers of a third cell type,the replacement cell, (T. W. Schultz, personal communication), but these are virtuallyabsent in H. cecropia (Anderson & Harvey, 1966), and therefore cannot be thepumping cells.
The first attempt to locate the potassium pump electrically was by Wood, Farrand& Harvey (1969) who impaled the isolated midgut with Ling-Gerard microelectrodesand described a single type of two-step potential profile across the epithelium. On theaverage, as the microelectrode penetrated the tissue from the basal side it became27 mV negative with respect to the basal bathing solution. This basal PD step was

Identification of transporting cell 3
insensitive to anoxia but sensitive to changes in the potassium concentration of thebathing solution. As the microelectrode emerged from the tissue to the lumen side itbecame 98 mV positive with respect to the basal bathing solution, i.e. it measuredthe transepithelial PD. Later Schultz (1972) showed that PD measurements alone arenot sufficient to characterize epithelia electrically.
The first attempt to measure the transport pool size was by Harvey & Zerahn (1969)who used 42K influx kinetics to measure the K transport pool. The report of Woodet al. (1969) that there was only one type of basal step in the impalement profilesimplied that all of the epithelial cells were coupled electrically and must share a com-mon ion pool. The small pool size found by Harvey & Zerahn (1969) suggested anextracellular or non-mixing pool and an extracellular K pump location. However,a subsequent kinetic analysis by Wood (1972) and Harvey & Wood (1972) revealeda large transport pool which amounted to two thirds of the tissue potassium. Later,Harvey & Wood (1973) demonstrated that the loading pool of potassium was approxi-mately equal to the kinetically measured transport pool and concluded that thepotassium transport pool and active potassium transport site were located intracel-lularly. This pool size controversy remained extant with Zerahn (1973, 1975) rindingevidence for a small isotope loading pool and Wood & Harvey (1975) rinding a largepool size from both influx and loading experiments.
We will show that the potassium pump is located in the apical membrane of thegoblet cells because the resistance of that membrane increases uniquely when theelectrogenic potassium pump is turned off by removing its oxygen supply. We willshow that the potassium pool size is so small that it can be contained in just the gobletcells under conditions when these cells are uncoupled from columnar cells but thatthe pool size is so large that it must occupy the columnar cells as well under con-ditions when these two cell types are coupled.
We are able to conclude that potassium ordinarily enters the goblet cells acrosstheir basal and lateral borders and forms a cellular pool from which it is activelytransported across the apical membrane to the goblet cavity which is confluent withthe lumen side of the tissue. When midguts are isolated from larvae fed on artificialmedium and are short-circuited the columnar cells become electrically coupled tothe goblet cells while the size of the potassium pool increases accordingly.
MATERIALS AND METHODS
All experiments were performed on feeding fifth instar larvae. Leaf-fed H. cecropiawere reared on wild black cherry trees; diet-fed H. cecropia were reared on Riddiford'sdiet (1968); and diet-fed M. sexta were reared on Yamamoto's diet (1969). Midgutswere isolated from larvae and mounted as flat sheets on perspex chambers (Wood,1972). The bathing solutions were composed of 32 mM-KCl, 1 mM-CaCl2, 1 mM-MgCl2, 5 mM-TrisCl, and 166 mM-sucrose. The transepithelial potential differencewas measured with calomel electrodes and a Keithley 602 electrometer (KeithleyInstruments). The midgut was short-circuited by a device which automatically passescurrent (through Ag-AgCl electrodes) sufficient to maintain the PD at the asymmetryPD of the calomel electrodes (close to zero) (Wood, 1972). The potassium influx wasmeasured with 42K or MRb and was corrected for decay in the short circuit current
J. T. BLANKEMEYER AND W. R. HARVEY
Chartrecorder
Bathinsolutions
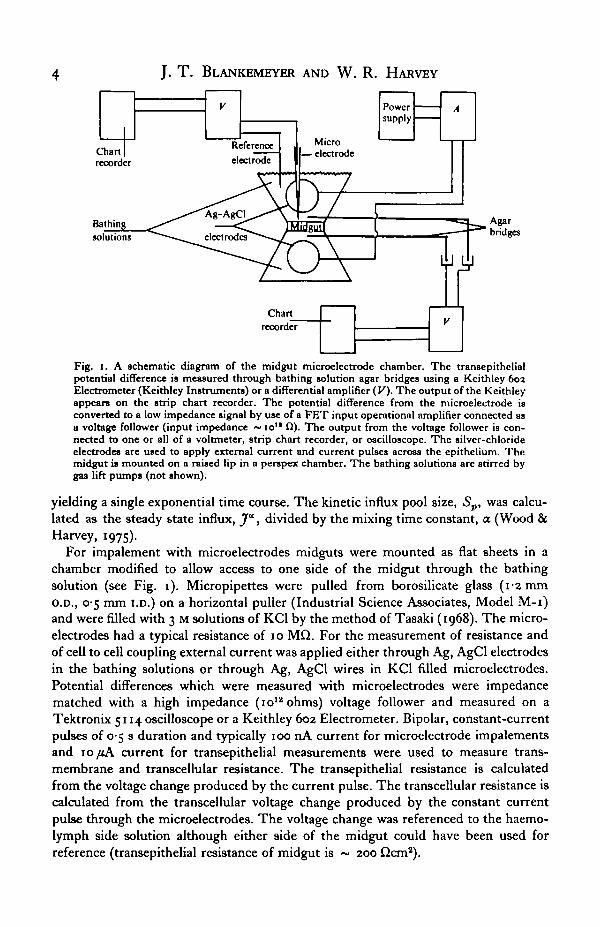
Fig. i. A schematic diagram of the midgut microelectrode chamber. The transepithelialpotential difference is measured through bathing solution agar bridges using a Keithley 602Electrometer (Keithley Instruments) or a differential amplifier (K). The output of the Keithleyappears on the strip chart recorder. The potential difference from the microelectrode isconverted to a low impedance signal by use of a FET input operational amplifier connected asa voltage follower (input impedance ~ 10" fl). The output from the voltage follower is con-nected to one or all of a voltmeter, strip chart recorder, or oscilloscope. The silver-chlorideelectrodes are used to apply external current and current pulses across the epithelium. Themidgut is mounted on a raised lip in a perspex chamber. The bathing solutions are stirred bygas lift pumps (not shown).
yielding a single exponential time course. The kinetic influx pool size, Sp, was calcu-lated as the steady btate influx, J*, divided by the mixing time constant, a (Wood &Harvey, 1975).
For impalement with microelectrodes midguts were mounted as flat sheets in achamber modified to allow access to one side of the midgut through the bathingsolution (see Fig. 1). Micropipettes were pulled from borosilicate glass (i-2mmO.D., 0-5 mm I.D.) on a horizontal puller (Industrial Science Associates, Model M-i)and were filled with 3 M solutions of KC1 by the method of Tasaki (1968). The micro-electrodes had a typical resistance of 10 MQ. For the measurement of resistance andof cell to cell coupling external current was applied either through Ag, AgCl electrodesin the bathing solutions or through Ag, AgCl wires in KC1 filled microelectrodes.Potential differences which were measured with microelectrodes were impedancematched with a high impedance (ioiaohms) voltage follower and measured on aTektronix 5114 oscilloscope or a Keithley 602 Electrometer. Bipolar, constant-currentpulses of 0-5 s duration and typically 100 nA current for microelectrode impalementsand 10/iA current for transepithelial measurements were used to measure trans-membrane and transcellular resistance. The transepithelial resistance is calculatedfrom the voltage change produced by the current pulse. The transcellular resistance iscalculated from the transcellular voltage change produced by the constant currentpulse through the microelectrodes. The voltage change was referenced to the haemo-lymph side solution although either side of the midgut could have been used forreference (transepithelial resistance of midgut is ~ 200 Qcm2).

Identification of transporting cell
+ 100 -
+ 50 -
(c 0
- 5 0 -
-
Basalstep
-
Apicalstep
+ 132
1 1
-27
lu-HPD
~*
"rans-epithelial PD+ 105
Basalstep
1
Apicalstep
+ 1221
-—1/ *-ri
LPD
min
'rans-epithelial PD+ 121
Fig. a. Profile of PD (Vmiorortiotrodi- ^huai KtaUcm) obtained as a microelectrode is movedfrom the haemolymph (basal) side through a midgut isolated from a leaf-reared larva bathed instandard solution under open circuit conditions. On left: first PD step encountered; micro-electrode is 27 mV negative with respect to the basal solution. This type of profile is designatedas High Potential Difference, HPD, profile. On right: first PD step encountered; micro-electrode is i mV negative with respect to the basal solution. This type of profile is designateda Low Potential Difference, LPD, profile. (H. cecropia, leaf.)
RESULTS AND DISCUSSION
Microelectrode PD profiles of the midgut
An impalement of the midgut of H. cecropia with a microelectrode reveals the PDprofile shown in Fig. z (left). The microelectrode was advanced toward the tissuefrom the haemolymph (basal) side. In the first PD step encountered, the basal PD,the microelectrode voltage becomes negative with respect to the haemolymph sidebathing solution. After further movement of the microelectrode toward the lumen(apical) side of the tissue a second PD step is encountered, the apical PD, in whichthe voltage becomes positive to the haemolymph side solution yielding the trans-epithelial PD. The basal PD in Fig. z (left) has a value of - 27 mV in good agreementwith the values reported by Wood et al. (1969). The value of the apical PD is thealgebraic difference between the transepithelial PD and the basal PD and is thereforedependent on the value of both. In this case it amounted to +132 mV.
Less frequently such an impalement of the midgut reveals a second type of PDprofile which is shown in Fig. 2 (right). This profile has a lower (closer to zero) basalPD than that in Fig. 2 (left). The value of this second type of basal PD varies frompreparation to preparation, often being positive to the basal solution, and amountingto - 1 mV in this case. At first it seemed that this second profile was an artifact of
6 J. T. BLANKEMEYER AND W. R. HARVEY
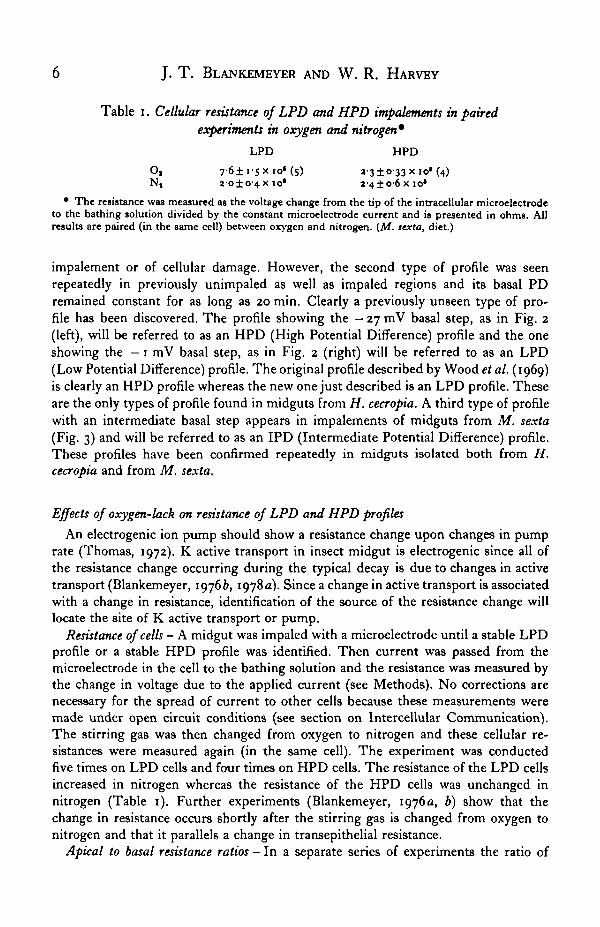
Table i. Cellular resistance of LPD and HPD impalements in pairedexperiments in oxygen and nitrogen*
LPD HPD
O, 7'6±r5Xio' (5) »'3±°'33 * 10* (4)N, 20 ±0-4x10* 2-4±o-6xio*
• The resistance was measured as the voltage change from the tip of the intracellular microelectrodeto the bathing solution divided by the constant microelectrode current and is presented in ohms. Allresults are paired (in the same cell) between oxygen and nitrogen. (M. texta, diet.)
impalement or of cellular damage. However, the second type of profile was seenrepeatedly in previously unimpaled as well as impaled regions and its basal PDremained constant for as long as 20 min. Clearly a previously unseen type of pro-file has been discovered. The profile showing the — 27 mV basal step, as in Fig. 2(left), will be referred to as an HPD (High Potential Difference) profile and the oneshowing the — 1 mV basal step, as in Fig. 2 (right) will be referred to as an LPD(Low Potential Difference) profile. The original profile described by Wood et al. (1969)is clearly an HPD profile whereas the new one just described is an LPD profile. Theseare the only types of profile found in midguts from H. cecropia. A third type of profilewith an intermediate basal step appears in impalements of midguts from M. sexta(Fig. 3) and will be referred to as an IPD (Intermediate Potential Difference) profile.These profiles have been confirmed repeatedly in midguts isolated both from H.cecropia and from M. sexta.
Effects of oxygen-lack on resistance of LPD and HPD profiles
An electrogenic ion pump should show a resistance change upon changes in pumprate (Thomas, 1972). K active transport in insect midgut is electrogenic since all ofthe resistance change occurring during the typical decay is due to changes in activetransport (Blankemeyer, 1976ft, 1978a). Since a change in active transport is associatedwith a change in resistance, identification of the source of the resistance change willlocate the site of K active transport or pump.
Resistance of cells - A midgut was impaled with a microelectrode until a stable LPDprofile or a stable HPD profile was identified. Then current was passed from themicroelectrode in the cell to the bathing solution and the resistance was measured bythe change in voltage due to the applied current (see Methods). No corrections arenecessary for the spread of current to other cells because these measurements weremade under open circuit conditions (see section on Intercellular Communication).The stirring gas was then changed from oxygen to nitrogen and these cellular re-sistances were measured again (in the same cell). The experiment was conductedfive times on LPD cells and four times on HPD cells. The resistance of the LPD cellsincreased in nitrogen whereas the resistance of the HPD cells was unchanged innitrogen (Table 1). Further experiments (Blankemeyer, 1976a, b) show that thechange in resistance occurs shortly after the stirring gas is changed from oxygen tonitrogen and that it parallels a change in transepithelial resistance.
Apical to basal resistance ratios - In a separate series of experiments the ratio of

Identification of transporting cell
Table 2. Ratio of apical to basal resistances in LPD and HPD cellsin nitrogen and oxygen*
LPD HPD
O, 4 '3i±°S3 (13) 2N, 2o±i-75 (6) 3°'4±4'i (s)
• The resistance ratio was calculated from the ratio of apical PD change to basal PD change whena current pulse was passed across the epithelium. (M. sexta, diet.)
apical to basal resistances was determined by passing current across the midgut andmeasuring the ratio of apical to basal voltage drops associated with both the LPD andHPD profile. In each case the apical to basal resistance ratio was determined with bothoxygen and nitrogen as the stirring gas. Again the experiments were conducted underopen circuit conditions so that corrections for electrical coupling between cells are notnecessary. The apical to basal resistance ratio of the LPD profile changes from 4-31 inoxygen to 20 in nitrogen whereas the ratio of the HPD profile is not significantlychanged from oxygen to nitrogen (Table 2).
The finding of the primary resistance change in the LPD cell (Table 1) identifiesthis cell type as the source of the increase in transepithelial resistance in anoxia andtherefore as the source of the transepithelial active potassium transport. The valuesof cellular resistance (Table 1) and of the apical to basal resistance ratios (Table 2)can be substituted into simultaneous equations which show that the resistancechange in the LPD cell is localized in its apical membrane identifying the apicalmembrane of the LPD cell as the location of the potassium pump (Blankemeyer,19766).
Identification of LPD profile with goblet cell and HPD profile with columnar cell
Having demonstrated that the active potassium transport site is located in the apicalregion of the cell yielding the LPD profile it remains to identify the cell. In H. cecropiathere are essentially only two cell types: the goblet cell and the columnar cell, replace-ment cells being so infrequent that Anderson & Harvey (1966) could find none forelectron microscope analysis. Only LPD and HPD profiles are found in H. cecropia(Blankemeyer, 19766). Therefore, the LPD profile must arise in either goblet orcolumnar cells in impalements from H. cecropia. In M. sexta there are replacementcells as well (T. W. Schultz, personal communication). In M. sexta there are threetypes of impalement profile, the third being the IPD profile which is infrequent(Fig. 3) and must arise from the infrequent replacement cells. Therefore the LPDprofile must arise in either goblet or columnar cells in impalements from M. sexta aswell as in those from H. cecropia.
Indirect but convincing evidence points to the goblet cell rather than the columnarcell as the source of the LPD profile. In impalements from H. cecropia LPD profilesare about one-half as frequent as HPD profiles (see Fig. 3). Analysis of the micro-graphs of Anderson & Harvey (1966) reveals that the goblet cells occur only one halfas often as columnar cells and that there is scant goblet cell cytoplasm in which amicroelectrode tip may rest, so it is clear that the LPD profiles must come fromgoblet cells in H. cecropia. This hypothesis was tested in M. sexta by making 227

J. T. BLANKEMEYER AND W. R. HARVEY
40
30
r10 J
_50 - 4 0 - 3 0 - 2 0 - 1 0 0Basal PD (haemolymph side)
10 20 30
Fig. 3. Frequency distribution of 227 impalements of midguts showing three populations.We designate the left hand population (mode at —28 mV) as HPD, the middle population(mode at —17 mV) as IPD, and the right hand population (mode —9 mV) as LPD profilesrespectively. The HPD and LPD profile populations do not overlap being separated by theIPD profile population. (M. sexta, diet.)
random impalements under as nearly identical conditions as possible (Fig. 3). Themost frequent profile was the HPD profile which clearly must arise in the numerouslarge columnar cells in M. sexta as well as in H. cecropia. The least frequent profilewas the IPD profile which must arise from the infrequent replacement cells asdiscussed in the previous pragraph. By elimination, then, the LPD profile must arisefrom the goblet cells in M. sexta as well as in H. cecropia, a conclusion which issupported by the relatively low frequency of both LPD profiles and goblet cells inM. sexta.
Efforts to confirm this deduction by iontophoretic injection of Niagara Sky Bluedye via microelectrodes in M. sexta revealed in whole mounts that dye injected intoHPD cells appears in columnar cells (Blankemeyer, personal observation). Attemptsto recover the dye in sectioned midguts have been unsuccessful.
In summary, then it is virtually certain that the LPD profiles arise in goblet cellsand that the HPD profiles arise in columnar cells. It should be noted in passing,

Identification of transporting cell 9
however, that the validity and significance of finding the K pump in the apicalmembranes of the LPD cells does not require that these cells be identified as gobletcells.
Pool size controversy
Although these electrical and cytological results clearly identify the apical regionof the goblet cell as the active K transport site, a transport route through just thegoblet cells cannot be regarded as established until the controversy regarding poolsize is resolved. A goblet cell pathway would explain the small pool size found byHarvey & Zerahn (1969) and confirmed in loading experiments by Zerahn (1973,1975) but it is inconsistent with the large pool size found by Wood & Harvey (1975).An answer was suggested when communication between goblet and columnar cellswas found only in short circuited preparations from diet-fed larvae and was confirmedby comparing pool sizes from leaf- and diet-fed larvae under both open circuit andshort circuit conditions.
Intercellular communication - corollary hypothesis
Extensive communication between goblet and columnar cells had been suggested bythe uniform PD profiles obtained with microelectrodes in the original study by Woodet al. (1969) and seemed to be confirmed because the kinetically measured pool sizewas so large that it must involve all of the epithelial cells (Wood, 1972). Howeverthe microelectrode impalements illustrated in Fig. 2 and summarized in Fig. 3 showthat the PD profiles are not uniform but that there are three types of profile, namely,LPD, IPD, and HPD profiles. These results imply that normally there is no electricalcoupling between goblet and columnar cells. To resolve this discrepancy intercellularcommunication was studied in midguts from both leaf- and diet-reared larvae underboth open circuit and short circuit conditions. The results of this study, which areshown as Table 3, reveal that there is no coupling between LPD and HPD cells inmidguts from leaf-fed larvae or in those from diet-fed larvae under open circuitconditions. However, preparations from diet-fed larvae under short circuit conditionsshow extensive electrical coupling between LPD and HPD cells beginning less thanone minute after the onset of short circuiting. This result suggests the corollaryhypothesis that large pool sizes will be found in short circuited preparations fromdiet-fed larvae but under no other conditions.
Potassium influx pool under open circuit conditions
So long as the midgut is maintained under open circuit conditions the pool size issmall whether the preparation is from leaf-fed or diet-fed larvae. This result is illus-trated in Fig. 4 in which the steady state influx was measured with 89Rb and the timecourse of mixing was measured with UK. The size of the influx pool, which is the areabetween these two curves (Wood, unpublished), is small, less than 10 /*equiv K g"1 wetweight, in both leaf-fed preparations and in diet-fed preparations. Using the value of65 /iequiv K g"1 wet weight of tissue for a midgut mounted on a chamber (Harvey &Zerahn, 1969) the influx pool is 15% of the tissue K. These results confirm thesmall pool size initially reported by Harvey & Zerahn (1969) and subsequently

10 J. T. BLANKEMEYER AND W. R. HARVEY
Table 3. Coupling ratio (VJtty between epithelial cells of isolated midgut*
Leaf-fed Diet-fed
Open circuitShort circuit
ccO'O
00
CG
00
00
CC
00
00
CG
00
0 -46±009 (3 midguts)
• A microelectrode was placed in each of two adjacent cells. A current was passed to ground fromthe first electrode and the ratio of PD between this cell to ground and the adjacent cell to ground (Vi/Vt)was calculated. In columns headed CC both electrodes were in columnar cells and in those headed CGone was in a columnar cell and the other in a goblet cell. The ' N ' for all entries was 10 or more impale-ments/midgut and at least 3 midgut/entry. The measurements showing coupling in 3 midguts undershort circuit conditions were paired with measurements showing no coupling under open circuitconditions, with the microelectrodes in the same cell. (H. cecropia and M. texta, diet and H. cecropia,leaf.)
PD
Leaf-fed Diet-fed
0-47/i-equiv K — • 0-38 /i-equiv K
200
100 £
150Time (min)
Fig. 4. Pool sizes in open circuit preparations. The upper traces record the time course of thetransepithelia] PD (left axis; mV) and the lower traces record the time course of "potassium-measured influx (right axis, fiA). The influx pool sizes were calculated as the area betweenthe extrapolated steady state "Rb influx (straight horizontal) lines and the "K influx curves.For leaf-fed larvae (left) the pool sire was 0-47 /tequiv of potassium and for diet-fed larvae(right) the size was 0-38 /iequiv. The latter determination was at 120 min when the transportrate as indicated by the PD had decayed somewhat accounting for the slightly smaller poolsize. (H. cecropia).
confirmed by Zerahn (1973, 1975)- However both this initial report and the challengeto it by Wood & Harvey (1975) were based on pool size determinations under shortcircuit conditions.
Potassium influx pool under short circuit conditions
So long as the midgut is isolated from leaf-fed larvae this same small pool size isfound even under short circuit conditions (Fig. 5, horizontal hatching). This resultconfirms the small pool size found by Harvey & Zerahn (1969) in short circuitedpreparations from leaf-fed larvae. However, if the midgut is isolated from diet-fedlarvae and is short circuited, then the pool size is large, amounting to 60 /<equiv K g- 1
wet weight (Fig. 5, vertical hatching). This is the same large pool size reported by

Identification of transporting cell I I
400 -
5 300 -
100 -
Leaf-fed /
Sp-0-50 n-eq. K
"KN.
35TTH• W^ ^Influx
\ Diet-fed
Sp= 1 -47 /i-equiv K1 I
30 60 90Time (min)
Fig. s. Pool sizes in short circuited preparations. The upper traces record the time courses ofthe short circuit current (/„) and the lower traces record the time courses of the "po t assium-measured influx. The influx pool sizes were calculated as the area (X-hatched) between theIK curve and the influx curve. For leaf-fed larvae (left) the pool size wai 0 5 /«equiv (horizont-ally hatched) and for diet-fed larvae (vertically hatched and most of horizontally hatched) thepool size was 1 '47 /tequiv of potassium. (H. cecropia.)
Harvey & Wood (1972) and Wood & Harvey (1975)- In both of these latter papers thepool size was measured under short circuit conditions in midguts from diet-fedH. cecropia larvae. A detailed account of the pool sizes obtained with H. cecropia andM. sexta is in Blankemeyer (1976 b) and is being prepared for publication (Blankemeyer,1978ft).
The corollary hypothesis is proven to be correct and the influx pool size controversyis resolved: only short circuited preparations from diet-fed larvae have large poolsizes; and only short circuited preparations from diet-fed larvae have coupling betweencolumnar and goblet cells. Clearly the large pool size is the result of the addition ofthe columnar cell potassium pool to the goblet cell potassium pool in short circuitedpreparations from diet-fed larvae. In all other cases the cells are not coupled; onlythe goblet cell potassium pool is involved in transport; and the pool size is small.
Conclusion
The chain of evidence demonstrating that the potassium transport route lies throughthe goblet cells is strong and unbroken. Electrical evidence demonstrates that thetransporting cells give rise to the LPD profiles and that the pump is in the apicalborder of the LPD cells. The histogram of basal PD's strongly indicates that the LPDprofiles are from goblet cells. Therefore, the site of active, transepithelial, potassiumtransport is in the apical membrane of the goblet cells. In open circuited preparationsand in short circuited preparations from leaf-fed larvae the goblet cells are not coupledto columnar cells and the influx pool sizes are correspondingly small. However, inshort circuited preparations from diet-fed larvae the goblet cells are coupled tocolumnar cells and the influx pool sizes are large. The transport route is demonstratedto be through the goblet cells with the pump in their apical border. In short circuited

J2 J. T. BLANKEMEYER AND W. R. HARVEY
preparations from diet-fed larvae potassium ions reach the goblet cells both fromtheir basal surfaces and also from the interior of the columnar cells.
A powerful tool for the study of cellular coupling becomes available because forthe first time coupling can be altered reversibly by the simple application of externalcurrent. Perhaps of greater significance, however, is the success of straightforwardelectrical resistance analysis and of straightforward influx kinetic analysis in thissimple insect epithelium whose structure and ion pumping characteristics madepossible the identification of the transporting cell type and transport route. The successof this approach in locating the transporting cell type in this simple polymorphicepithelium may establish a rationale for locating the transporting cell type in morecomplex polymorphic epithelia.
We thank Mr Frank Abramcheck and Ms Mary Hengen for excellent technicalassistance and Mrs Thelma S. Golden and Dr William E. Robbins of the InsectPhysiology Laboratory, Agricultural Research Service, U.S. Department of Agricul-ture, Beltsville, Maryland for assistance in starting a Manduca sexta rearing pro-gramme. This research was supported in part by a research grant (AI-09503) fromthe National Institute of Allergy and Infectious Diseases, U.S. Public Health Service.
REFERENCES
ANDERSON, E. & HARVEY, W. R. (1966). Active transport by the Cecropia midgut. II. Fine structure ofthe midgut epithelium. J. Cell Biol. 31, 107-134.
BERNARD, C. (1878). Lecons sur lea phenomenes de la vie communs aux animaux et aux v^getaux.Paris, j . B. Bailliere et fils. (Translation: Springfield, Illinois, Charles C. Thomas, 1974.)
BLANKEMEYER, J. T. (1976a). The use of microelectrode potential and resistance profiles to establishthe location of the K pump of the midgut of silkmoth larvae. Biopkys. J. 16, p. 4a.
BLANKEMEYER, J. T. (19766). The route of active potassium ion transport in the midgut of Hyalophoracecropia and Manduca texta. Ph.D. thesis, Temple University.
BLANKEMEYER, J. T. (1978a). The electrical characteristics of the decay of the spontaneous potentialdifference in insect midgut (in preparation).
BLANKEMEYER, J. T. (19786). The potassium transport pool in the midgut of Hyalophora cecropia andManduca texta (in preparation).
HARVEY, W. R. & WOOD, J. L. (197a). Cellular pools involved in active K-transport across the isolatedCecropia midgut. In Role of Membranes in Secretory Processes (ed. L. Bolis, R. D. Keynes andW. Wilbrandt), pp. 310-331. Amsterdam: North-Holland Press.
HARVEY, W. R. & WOOD, J. L. (1973). The route of cation transport across the silkworm midgut InTransport Mechanisms in Epithelia. Alfred Benson Symposium, V (ed. H. H. Ussing and N. A. Thorn),pp. 342-359. New York: Academic Press.
HARVBY, W. R., WOOD, J. L., QUATRALE, R. P. & JUNGREIS, A. M. (1975). Cation distributions acrossthe larval and pupal midgut of the Lepidopteran, Hyalophora cecropia, in vivo. J. exp. Biol. 63, 321-33°-
HARVEY, W. R. & ZERAHN, K. (1969). Kinetics and route of active K-transport in the isolated midgutof Hyalophora cecropia. J. exp. Biol. 50, 297-306.
HARVEY, W. R. & ZERAHN, K. (1972). Active transport of potassium and other alkali metals by theisolated midgut of the silkworm. In Current Topics in Membranes and Transport, vol. 3 (ed. F.Bronner and A. Kleinzeller), pp. 367-410. New York: Academic Press.
HASKELL, J. A., CLBMONS, R. D. & HARVEY, W. R. (1965). Active transport by the Cecropia midgut I.Inhibitors, stimulants, and potassium-transport. J. cell. Physiol. 65, 45-56.
JUNGREIS, A. M. & VAUGHAN, G. L. (1977). Insensitivity of Lepidopteran tissues to ouabain I. Absenceof ouabain binding and Na + -K + ATPases in larval and adult midgut. J. Insect Physiol. (in the press).
LUBIN, M. & ENNIS, H. L. (1964). On the role of intracellular potassium in protein synthesis. Biochem.Biopkys. Ada 80, 614-631.
MACKNIOHT, A. D. C , CIVAN, M. M. & LEAF, A. (1975). The sodium transport pool in toad urinarybladder epithelial cells. J. Memb. Biol. ao, 365-386.

Identification of transporting cell 13
NAOHL, W. (1976). The intracellular electrical potential profile of the frog skin epithelium. PfiiigersArch. Eur. J. Pkytiol., 135-144.
RIDDIFORD, L. M. (1968). Artificial diet for Cecropia and other Saturniid silkworms. Science, N.Y.160, 1461-1462.
SCHULTZ, S. G. (197a). Electrical potential differences and electromotive forces in epithelial tissues.Jf. gen. Phyiiol. 59, 794"798.
SCHULTZ, T. W. (personal communication).TASAKI, K., TSUKAHARA, Y., ITO, S.( WAYNBR, M. J. & Yu, W. Y. (1068). A simple, direct and rapid
method for filling microelectrodes. Phytiol. Behav. 3, 1009—1010.THOMAS, R. C. (1972). Electrogenic sodium pump in nerve and muscle cells. Physiol. Rev. 5a, 563-594.WOOD, J. L. (1972). Some aspects of active potassium transport by the midgut of the silkworm, Antheraea
pernyi, Ph.D. thesis, Cambridge University, pp. 1-342.WOOD, J. L., FARRAND, P. S. & HARVEY, W. R. (1969). Active transport of potassium by the Cecropia
Midgut. VI. Microelectrode potential profile, y. exp. Biol. 50, 169-178.WOOD, J. L. & HARVEY, W. R. (1975). Active transport of potassium by the Cecropia midgut; tracer
kinetic theory and transport pool size. y. exp. Biol. 63, 301-311.YAMAMOTO, R. T. (1969). Mass rearing of the tobacco hornworm. II. Larval rearing and pupation.
y. Econ. Entomol. 6a, 1427-1431.ZERAHN, K. (1973). Properties of the cation pump in the midgut of Hyalophora cecropia. In Transport
Mechanisms in Epithelia. Alfred Benson Symposium, V (ed. H. H. Ussing and N. A. Thorn), pp. 360-371. New York: Academic Press.
ZERAHN, K. (1975). Potassium exchange between bathing solution and midgut of Hyalophora cecropiaand time delay for potassium flux through the midgut. y. exp. Biol. 63, 295-300.
