ichigo office reit april 2017 fiscal period corporate ... · ・reserve for adjustment of ......
TRANSCRIPT
Ichigo Investment Advisors Co., Ltd.Ichigo Office REIT Investment Corporation (8975)
© 2017 Ichigo Investment Advisors Co., Ltd. Ichigo Office REIT Investment Corporation All rights reserved. www.ichigo-office.co.jp/english
June 14, 2017
Ichigo Office REIT April 2017 Fiscal Period Corporate Presentation
Ichigo Office(8975)
© 2017 Ichigo Investment Advisors Co., Ltd. Ichigo Office REIT Investment Corporation All rights reserved.
Ichigo Preserves and Improves Real Estate
© 2017 Ichigo Investment Advisors Co., Ltd. Ichigo Office REIT Investment Corporation All rights reserved.
© 2017 Ichigo Investment Advisors Co., Ltd. Ichigo Office REIT Investment Corporation All rights reserved. 4
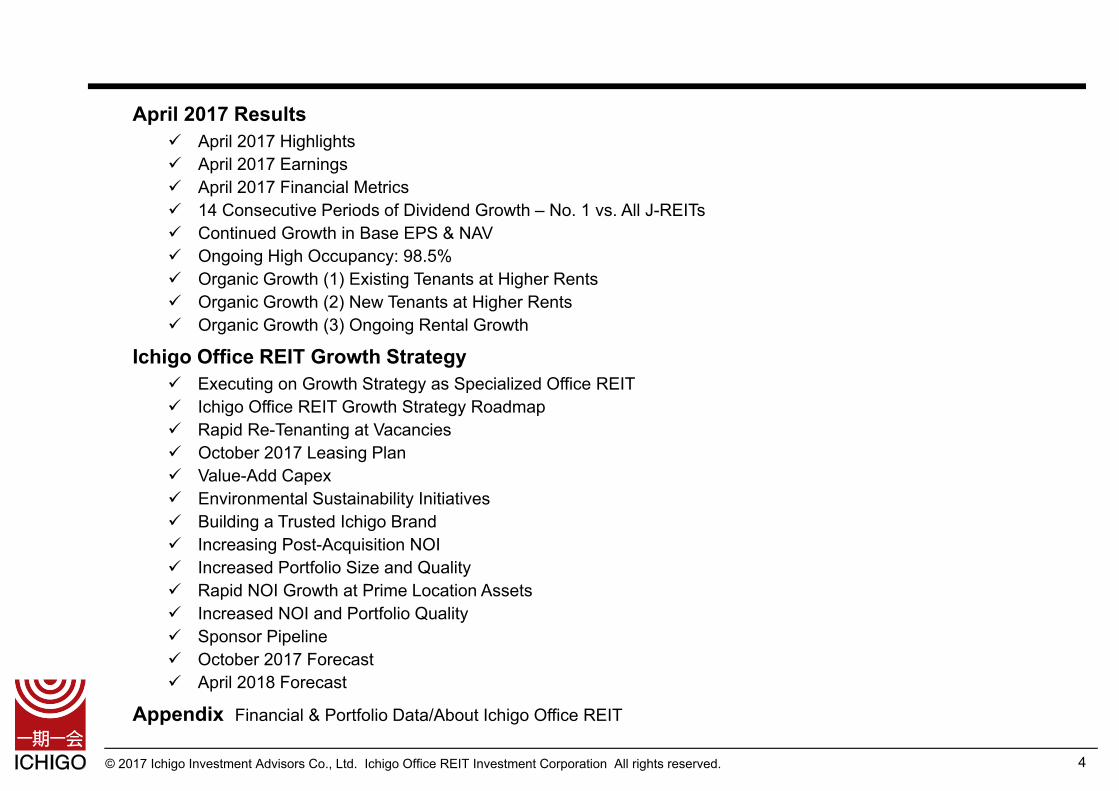
April 2017 Results April 2017 Highlights April 2017 Earnings April 2017 Financial Metrics 14 Consecutive Periods of Dividend Growth – No. 1 vs. All J-REITs Continued Growth in Base EPS & NAV Ongoing High Occupancy: 98.5% Organic Growth (1) Existing Tenants at Higher Rents Organic Growth (2) New Tenants at Higher Rents Organic Growth (3) Ongoing Rental Growth
Ichigo Office REIT Growth Strategy Executing on Growth Strategy as Specialized Office REIT Ichigo Office REIT Growth Strategy Roadmap Rapid Re-Tenanting at Vacancies October 2017 Leasing Plan Value-Add Capex Environmental Sustainability Initiatives Building a Trusted Ichigo Brand Increasing Post-Acquisition NOI Increased Portfolio Size and Quality Rapid NOI Growth at Prime Location Assets Increased NOI and Portfolio Quality Sponsor Pipeline October 2017 Forecast April 2018 Forecast
Appendix Financial & Portfolio Data/About Ichigo Office REIT
© 2017 Ichigo Investment Advisors Co., Ltd. Ichigo Office REIT Investment Corporation All rights reserved.
April 2017 Results
5
© 2017 Ichigo Investment Advisors Co., Ltd. Ichigo Office REIT Investment Corporation All rights reserved.
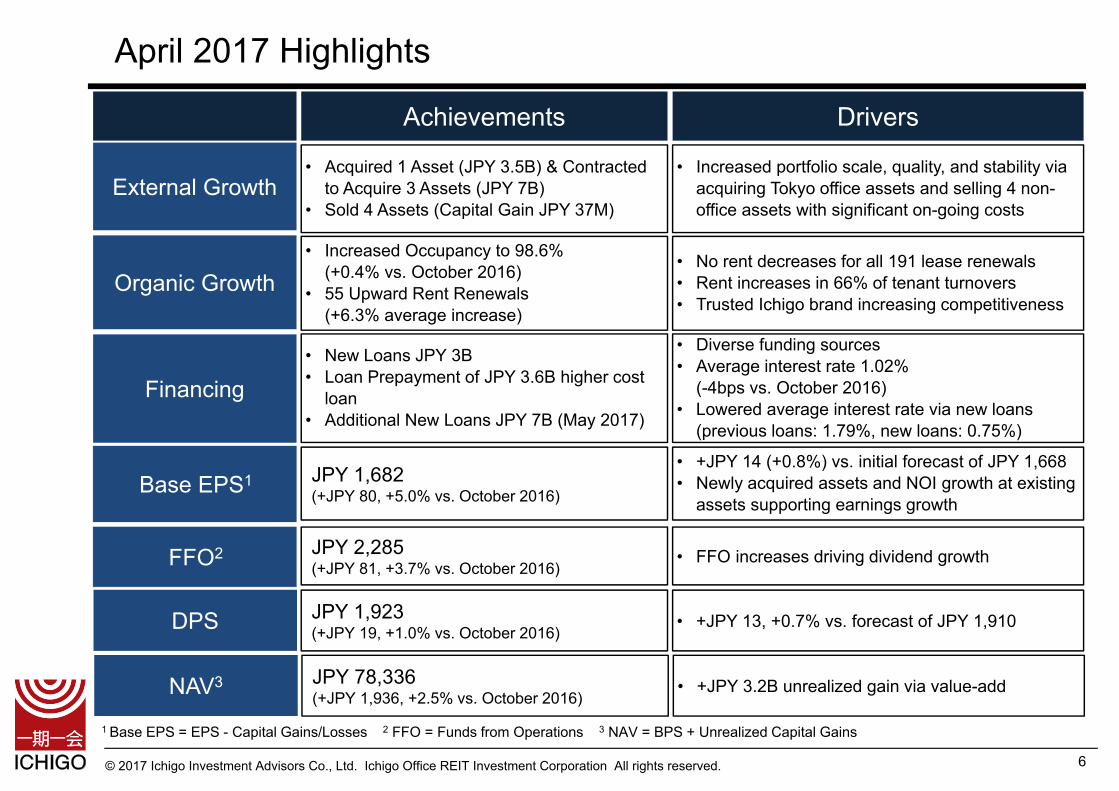
April 2017 Highlights
6
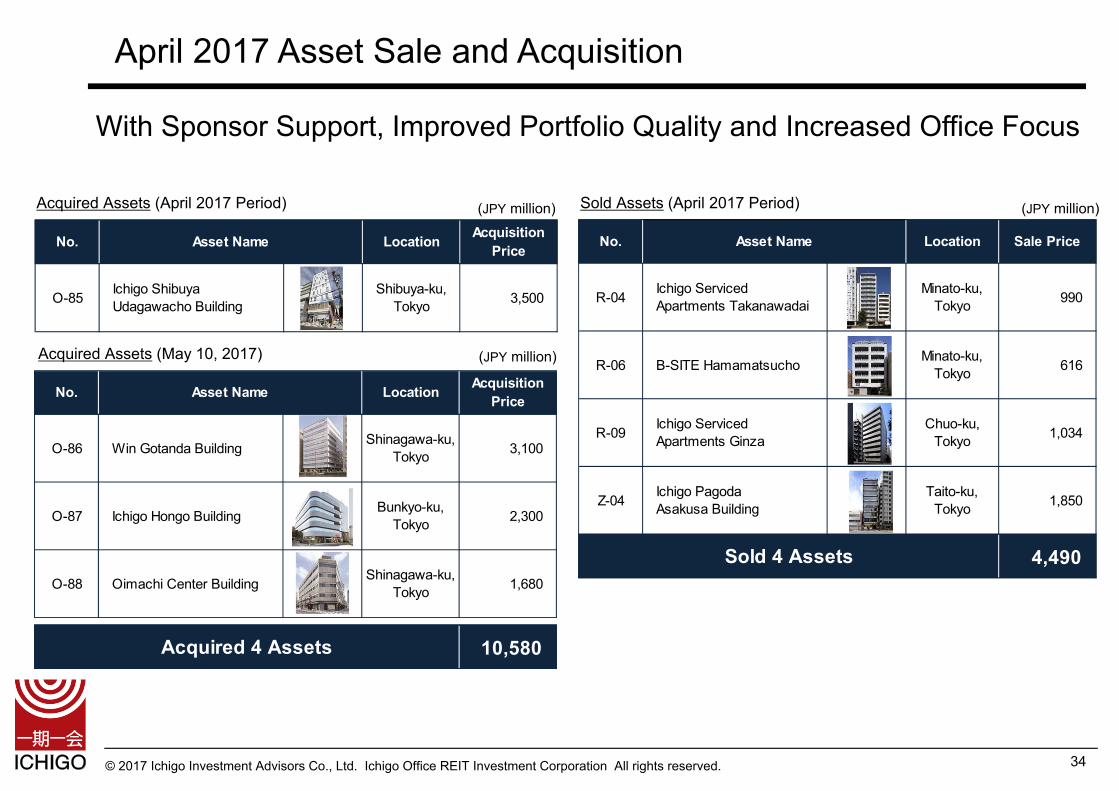
• Acquired 1 Asset (JPY 3.5B) & Contractedto Acquire 3 Assets (JPY 7B)
• Sold 4 Assets (Capital Gain JPY 37M)
• Increased Occupancy to 98.6%(+0.4% vs. October 2016)
• 55 Upward Rent Renewals(+6.3% average increase)
Financing• New Loans JPY 3B• Loan Prepayment of JPY 3.6B higher cost
loan• Additional New Loans JPY 7B (May 2017)
• Increased portfolio scale, quality, and stability via acquiring Tokyo office assets and selling 4 non-office assets with significant on-going costs
• No rent decreases for all 191 lease renewals• Rent increases in 66% of tenant turnovers• Trusted Ichigo brand increasing competitiveness
• Diverse funding sources• Average interest rate 1.02%
(-4bps vs. October 2016)• Lowered average interest rate via new loans
(previous loans: 1.79%, new loans: 0.75%)
Achievements Drivers
External Growth
Organic Growth
FFO2 JPY 2,285(+JPY 81, +3.7% vs. October 2016)
DPS
• FFO increases driving dividend growth
JPY 1,923(+JPY 19, +1.0% vs. October 2016)
• +JPY 13, +0.7% vs. forecast of JPY 1,910
Base EPS1 JPY 1,682(+JPY 80, +5.0% vs. October 2016)
• +JPY 14 (+0.8%) vs. initial forecast of JPY 1,668• Newly acquired assets and NOI growth at existing
assets supporting earnings growth
NAV3 JPY 78,336(+JPY 1,936, +2.5% vs. October 2016)
• +JPY 3.2B unrealized gain via value-add
1 Base EPS = EPS - Capital Gains/Losses 2 FFO = Funds from Operations 3 NAV = BPS + Unrealized Capital Gains
© 2017 Ichigo Investment Advisors Co., Ltd. Ichigo Office REIT Investment Corporation All rights reserved.
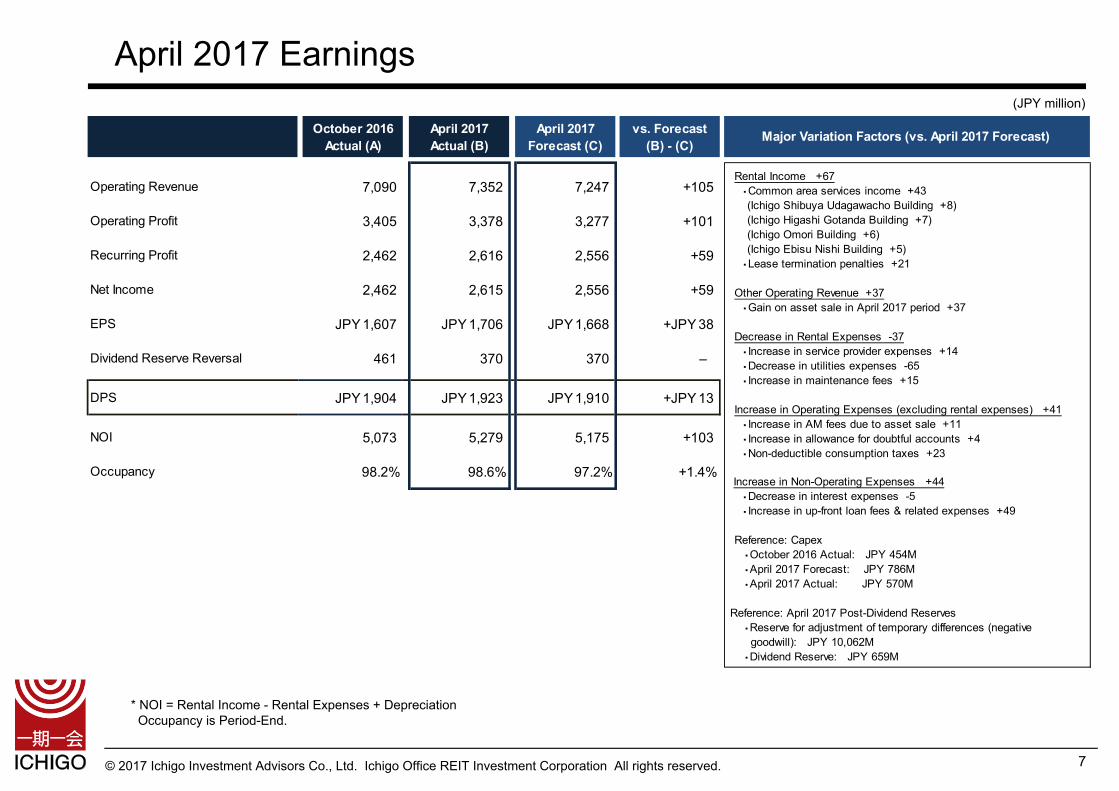
October 2016Actual (A)
April 2017Actual (B)
April 2017Forecast (C)
vs. Forecast(B) - (C)
Operating Revenue 7,090 7,352 7,247 +105
Operating Profit 3,405 3,378 3,277 +101
Recurring Profit 2,462 2,616 2,556 +59
Net Income 2,462 2,615 2,556 +59
EPS JPY 1,607 JPY 1,706 JPY 1,668 +JPY 38
Dividend Reserve Reversal 461 370 370 –
DPS JPY 1,904 JPY 1,923 JPY 1,910 +JPY 13
NOI 5,073 5,279 5,175 +103
Occupancy 98.2% 98.6% 97.2% +1.4%
Major Variation Factors (vs. April 2017 Forecast)
Rental Income +67 ・Common area services income +43 (Ichigo Shibuya Udagawacho Building +8) (Ichigo Higashi Gotanda Building +7) (Ichigo Omori Building +6) (Ichigo Ebisu Nishi Building +5) ・Lease termination penalties +21
Other Operating Revenue +37 ・Gain on asset sale in April 2017 period +37
Decrease in Rental Expenses -37 ・Increase in service provider expenses +14 ・Decrease in utilities expenses -65 ・Increase in maintenance fees +15
Increase in Operating Expenses (excluding rental expenses) +41 ・Increase in AM fees due to asset sale +11 ・Increase in allowance for doubtful accounts +4 ・Non-deductible consumption taxes +23 Increase in Non-Operating Expenses +44 ・Decrease in interest expenses -5 ・Increase in up-front loan fees & related expenses +49
Reference: Capex ・October 2016 Actual: JPY 454M ・April 2017 Forecast: JPY 786M ・April 2017 Actual: JPY 570M
Reference: April 2017 Post-Dividend Reserves ・Reserve for adjustment of temporary differences (negative goodwill): JPY 10,062M ・Dividend Reserve: JPY 659M
April 2017 Earnings
7
(JPY million)
* NOI = Rental Income - Rental Expenses + DepreciationOccupancy is Period-End.
© 2017 Ichigo Investment Advisors Co., Ltd. Ichigo Office REIT Investment Corporation All rights reserved.
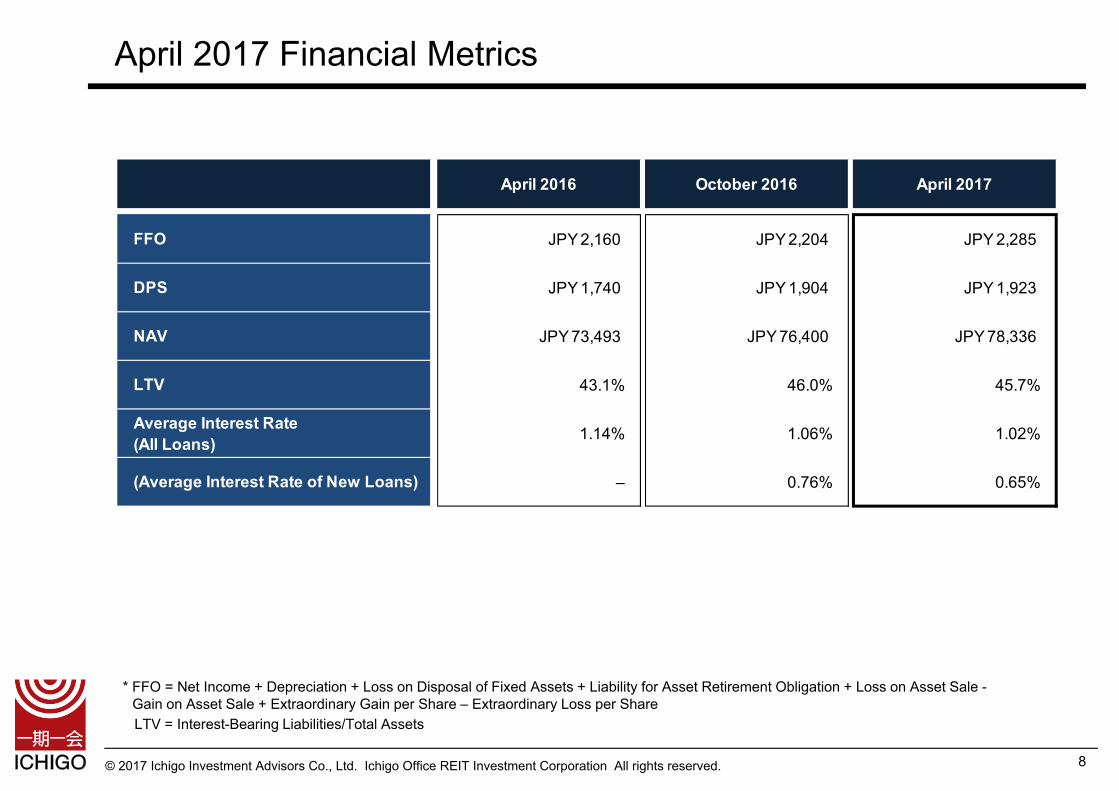
FFO JPY 2,160 JPY 2,204 JPY 2,285
DPS JPY 1,740 JPY 1,904 JPY 1,923
NAV JPY 73,493 JPY 76,400 JPY 78,336
LTV 43.1% 46.0% 45.7%
Average Interest Rate(All Loans) 1.14% 1.06% 1.02%
(Average Interest Rate of New Loans) – 0.76% 0.65%
April 2016 October 2016 April 2017
April 2017 Financial Metrics
8
* FFO = Net Income + Depreciation + Loss on Disposal of Fixed Assets + Liability for Asset Retirement Obligation + Loss on Asset Sale -Gain on Asset Sale + Extraordinary Gain per Share – Extraordinary Loss per ShareLTV = Interest-Bearing Liabilities/Total Assets

© 2017 Ichigo Investment Advisors Co., Ltd. Ichigo Office REIT Investment Corporation All rights reserved.
14 Consecutive Periods of Dividend Growth – No. 1 vs. All J-REITs
9
* April 2010 to October 2011 dividends adjusted to reflect stock split on November 1, 2011
October 2016
April2017
April 2010
October 2010
April 2011
October 2011
April 2012
October 2012
April 2013
October 2013
October 2014
April 2014
April 2015
October 2015
1,7401,904 1,923
1,706
899 979 1,0311,219
1,541 1,547 1,603
737
1,3871,494 1,537
April 2016
(JPY)
© 2017 Ichigo Investment Advisors Co., Ltd. Ichigo Office REIT Investment Corporation All rights reserved. 10
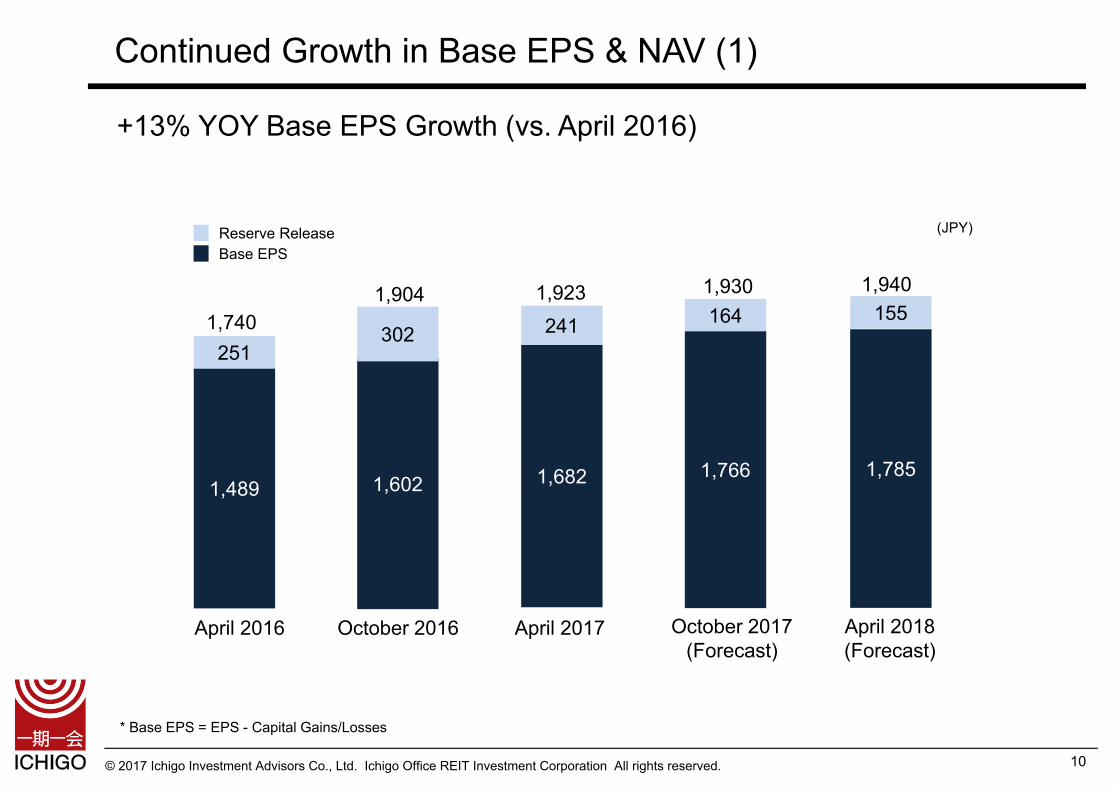
Continued Growth in Base EPS & NAV (1)
+13% YOY Base EPS Growth (vs. April 2016)
* Base EPS = EPS - Capital Gains/Losses
Reserve ReleaseBase EPS
(JPY)
1,740
1,489 1,602 1,682 1,766 1,785
251302 241 164 155
April 2016 April 2017 October 2017(Forecast)
April 2018(Forecast)
October 2016
1,923 1,930 1,9401,9041,740
© 2017 Ichigo Investment Advisors Co., Ltd. Ichigo Office REIT Investment Corporation All rights reserved. 11
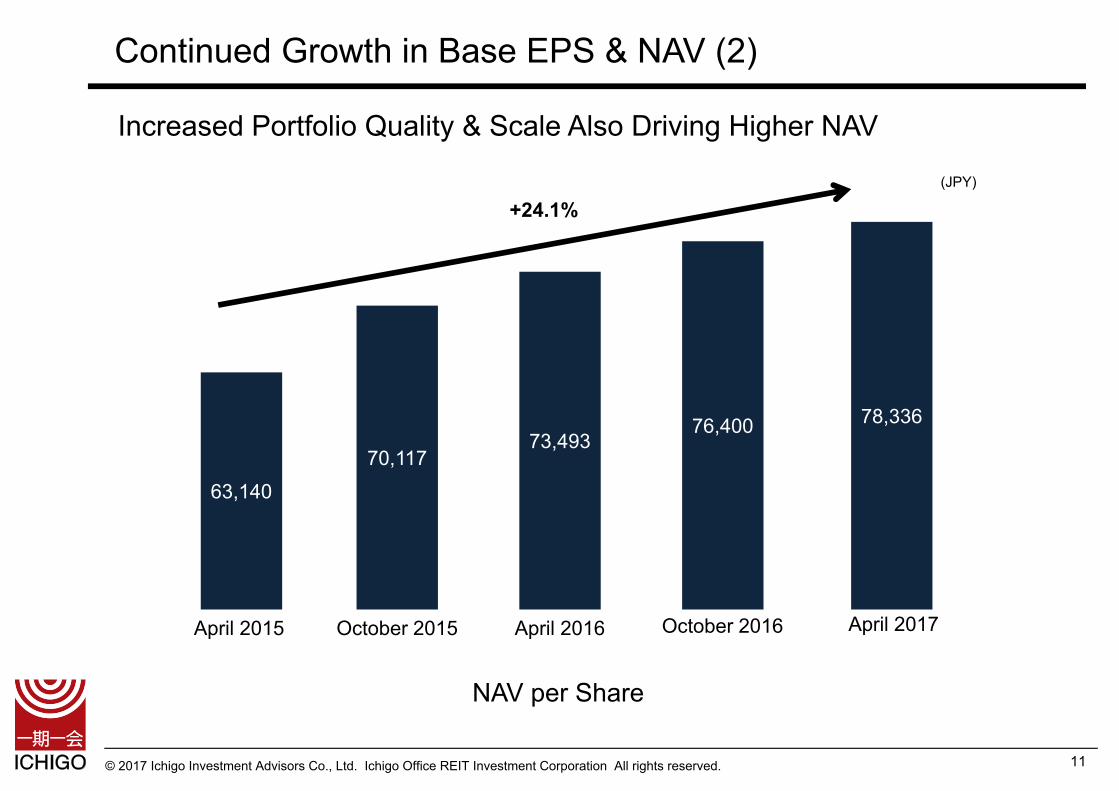
Continued Growth in Base EPS & NAV (2)
+24.1%(JPY)
Increased Portfolio Quality & Scale Also Driving Higher NAV
63,14070,117
73,49376,400 78,336
April 2015 April 2016 October 2016 April 2017October 2015
NAV per Share
© 2017 Ichigo Investment Advisors Co., Ltd. Ichigo Office REIT Investment Corporation All rights reserved.
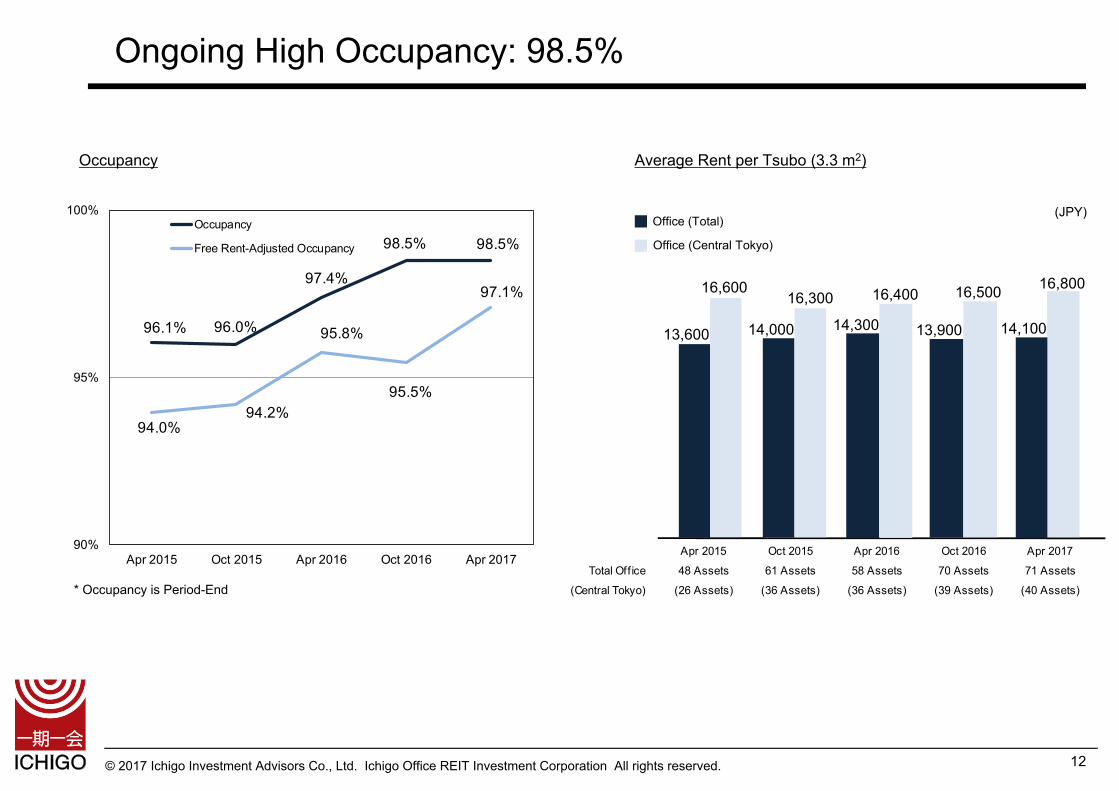
96.1% 96.0%
97.4%
98.5% 98.5%
94.0%94.2%
95.8%
95.5%
97.1%
90%
95%
100%
Apr 2015 Oct 2015 Apr 2016 Oct 2016 Apr 2017
Occupancy
Free Rent-Adjusted Occupancy
Ongoing High Occupancy: 98.5%
Occupancy
12
(JPY)
Average Rent per Tsubo (3.3 m2)
* Occupancy is Period-End
Apr 2015 Oct 2015 Apr 2016 Oct 2016 Apr 2017
Total Off ice 48 Assets 61 Assets 58 Assets 70 Assets 71 Assets
(Central Tokyo) (26 Assets) (36 Assets) (36 Assets) (39 Assets) (40 Assets)
16,60016,300 16,400 16,500
13,600 14,000 14,300 13,900 14,100
Office (Total)
Office (Central Tokyo)
16,800

© 2017 Ichigo Investment Advisors Co., Ltd. Ichigo Office REIT Investment Corporation All rights reserved.
-145 -74 -115 0 0
220
3,448
2,110
4,268
1,888
+75
+3,374
+1,994
+4,268
Upward Downward Rent Change
1.9%
40.6%
15.6%33.1%
96.9%
58.7%
82.1%
66.9%
1.2% 0.7% 2.3%
Oct 2015 Apr 2016 Oct 2016 Apr 2017
Downward Flat Upward
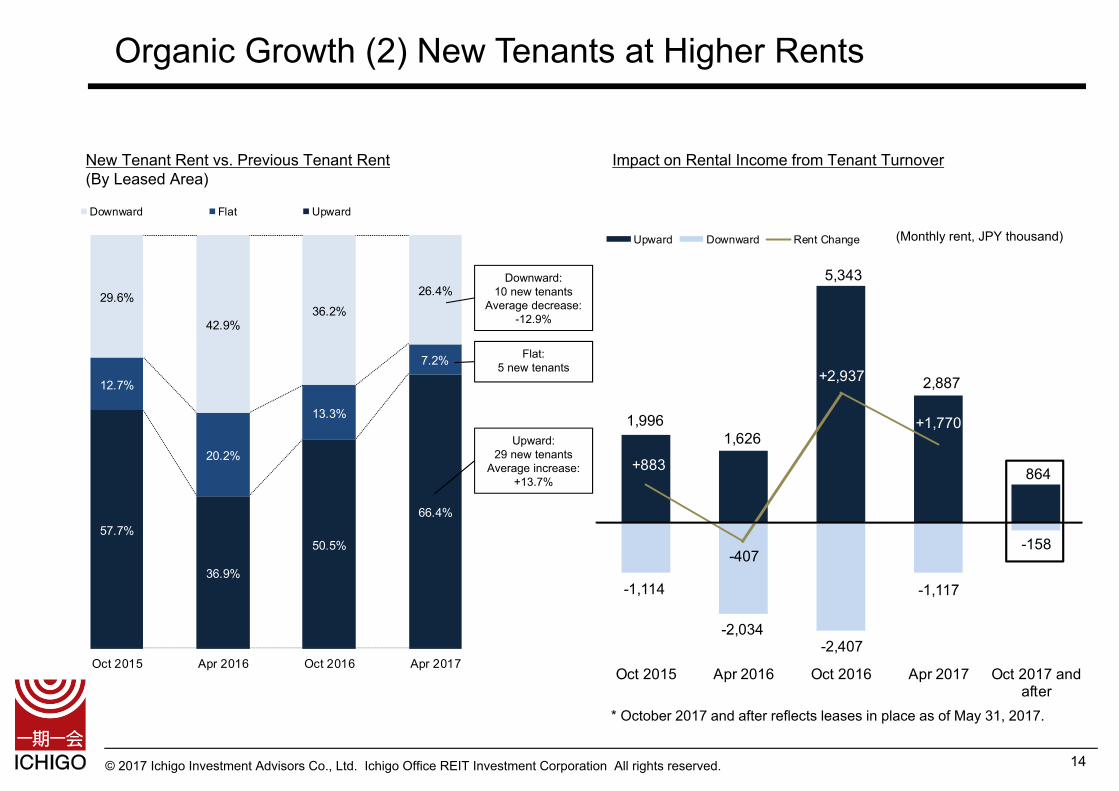
Organic Growth (1) Existing Tenants at Higher Rents
New Rent Level vs. Previous Rent Level(By Leased Area)
Lease Renewals
13
(Monthly rent, JPY thousand)Downward:0 tenants
Flat:136 tenants
Upward:55 tenants
Average increase:+6.3%
* October 2017 and after reflects leases in place as of May 31, 2017.
Apr 2016 Oct 2016 Apr 2017Oct 2015 Oct 2017 andafter
© 2017 Ichigo Investment Advisors Co., Ltd. Ichigo Office REIT Investment Corporation All rights reserved.
-1,114
-2,034-2,407
-1,117
-158
1,9961,626
5,343
2,887
864+883
-407
+2,937
+1,770
Oct 2015 Apr 2016 Oct 2016 Apr 2017 Oct 2017 andafter
Upward Downward Rent Change
57.7%
36.9%
50.5%
66.4%
12.7%
20.2%
13.3%
7.2%
29.6%
42.9%36.2%
26.4%
Oct 2015 Apr 2016 Oct 2016 Apr 2017
Downward Flat Upward
New Tenant Rent vs. Previous Tenant Rent(By Leased Area)
Impact on Rental Income from Tenant Turnover
Organic Growth (2) New Tenants at Higher Rents
14
* October 2017 and after reflects leases in place as of May 31, 2017.
Downward:10 new tenants
Average decrease: -12.9%
Flat:5 new tenants
Upward:29 new tenants
Average increase:+13.7%
(Monthly rent, JPY thousand)
© 2017 Ichigo Investment Advisors Co., Ltd. Ichigo Office REIT Investment Corporation All rights reserved. 15
Organic Growth (3) Ongoing Rental Growth
+1.5%1,034 1,042
October 2016 April 2017
New Tenant/Increased Space
Departing Tenant/Decreased Space
Renewals at Higher Rent
Change due totenant movements
+JPY 3.6M (+0.3%)
Change due to lease renewals
+JPY 4.3M (+0.4%)
(JPY million)
Change in Occupancy: 98.5% (October 2016) 98.6% (April 2017)
* Change in Occupancy is like-for-like and thus excludes newly acquired assets.
+4.3+33 -29
Monthly Rent
© 2017 Ichigo Investment Advisors Co., Ltd. Ichigo Office REIT Investment Corporation All rights reserved.
Ichigo Office REIT Growth Strategy
16
© 2017 Ichigo Investment Advisors Co., Ltd. Ichigo Office REIT Investment Corporation All rights reserved.
Executing on Growth Strategy as Specialized Office REIT
Achievements since April 2015 Fiscal Period Organic Growth Strategy
− High occupancy (98.6%)− Increased NOI via higher rents at renewals and new tenants External Growth Strategy
− Portfolio growth (+JPY 66.5B, +54%) − Increased office weighting (Currently 90%, +12%)− NAV growth (+JPY 15,196 per share, +24.1%) Financing
− Expanded lender base and de-collateralized all loans− Acquired an A- (Stable) credit rating (JCR)− Lowered average interest rates (1.23% → 1.02%) and increased
fixed-rate loans to >80%− 2 public offerings increased shareholder capital by 15% and shares
outstanding by 8% Dividend
− 14 consecutive increases in DPS (+JPY 320, +20%)
17
* Above calculations reflect changes between April 2015 period (before specialized-office REIT transition) and April 2017 period.

© 2017 Ichigo Investment Advisors Co., Ltd. Ichigo Office REIT Investment Corporation All rights reserved.
Ichigo Office REIT Growth Strategy Roadmap
■ Organic Growth StrategyDrive growth with strong Ichigo Office brand and 100 asset portfolio・Increase competitiveness of Ichigo assets via
strong Ichigo brand・Develop original services for Ichigo tenants・Drive higher rents within and outside of Tokyo ・Maximum return on capex
■ External Growth StrategyAim for portfolio size of JPY 230B・Broaden acquisition pipeline via diversified
sourcing ・Use Ichigo sponsor support and diversified
funding capability to close quickly under deadline
■ Financing StrategyImprove credit rating and diversify funding・Achieve an A (Stable) credit rating ・ Consider issuance of REIT bonds and
broadening lender base・ Use financial strength and commitment line to
grow acquisition capacity・Further improve borrowing terms・Enter global REIT indices
Grow Office PortfolioGoals
Action Plans
Lay Foundation for Long-Term Growth
Durably and Dynamically Grow Ichigo Office REITGenerate Funds to Invest for Growth・Secure funds for growth investments via strategic portfolio
restructuring and sale of non-office assets・Rework implementation of dividend reserve releases Invest for Sustainable Growth in Shareholder Value ・Acquire high-quality assets via portfolio restructuring or using
borrowing capacity・Carry out value-add capex
■ Organic Growth Strategy・Achieve minimal downtime between leases・Carry out value-add capex to drive higher returns・Implement environmental sustainability initiatives to grow long-
term value・Build a trusted Ichigo brand
■ External Growth Strategy・Restructure portfolio to drive higher portfolio quality・Acquire assets to increase shareholder value・Consider M&A
■ Financing Strategy・ Further improve borrowing terms・ Diversify funding via issuance of REIT bonds ・ Raise credit rating ・ Enter global REIT indices
2016/10 2017/4 2017/10 2018/4 2018/10
Stage VI Stage VII
2011/10
18
© 2017 Ichigo Investment Advisors Co., Ltd. Ichigo Office REIT Investment Corporation All rights reserved.
Organic Growth
Rapid Re-Tenanting at Vacancies
19
Newly Leased and Newly Vacated Space
(m2)
April 2017• Minimal downtime between leases• Increased rents at re-tenanting
October 2017 Plan• Forecast includes expected
vacancies• Strong office leasing market
supportive• Continue focus on tenant needs• Goals: Minimize lease downtime and
increase rentsNewly Leased 7.2% 5.6% 7.4% 11.3% 6.4% TBD
Newly Vacated 8.3% 5.8% 5.3% 9.5% 5.8% 4.9%
Net Leasing (m2) -804 -129 + 2,043 + 2,056 + 656 TBD
Apr 2015 Oct 2015 Apr 2016 Oct 2016 Apr 2017 Oct 2017
-5,911 -5,501-4,730
-10,502
-6,498-5,652
5,108 5,3726,772
12,558
7,153
TBD
Newly Leased
Newly Vacated

© 2017 Ichigo Investment Advisors Co., Ltd. Ichigo Office REIT Investment Corporation All rights reserved.
No. Asset Name Location LeasableArea
ExpiringLease
LeaseTermination
Date
O-88 Oimachi Center Building Shinagawa-ku,Tokyo 2,748m2 610m2 (currently
vacant)・Strengthen marketing to increase asset's recognition among tenants・Sub-divide units to meet tenant needs for smaller office space
O-54 Ichigo Omiya Building Omiya City,Saitama 6,180m2 757m2 Jun 2017 to
Oct 2017・Target tenants with branch office and sales office needs・Attract tenants with new air conditioning system and provision of ample parking
O-77 Ichigo Ikenohata Building Taito-ku, Tokyo 5,504m2 604m2 Jul 2017 ・Add QR code to leasing materials to access promotional video for the building・Renovate common areas
O-20 Ichigo Gotanda Building Shinagawa-ku,Tokyo 5,346m2 1,925m2 Nov 2017 ・Prime-location asset facing Gotanda Station with potential for redevelopment
・Lease with fixed-term contracts to allow for potential sales to developers
O-65 Ichigo Shinkawa Building Chuo-ku, Tokyo 2,312m2 1,032m2 Nov 2017 ・Renovate common areas・Minimize downtime via strengthening marketing and increasing recognition
O-69 Ichigo Higashi IkebukuroBuilding
Toshima-ku,Tokyo 4,553m2 1,069m2 Nov 2017 ・Sub-divide units to meet tenant needs for smaller office space
・Increase rent at tenant replacements given strong tenant demand
Strategy
Organic Growth
October 2017 Leasing Plan
20

© 2017 Ichigo Investment Advisors Co., Ltd. Ichigo Office REIT Investment Corporation All rights reserved. 21
Before
Renovations to Further Enhance Competitiveness and ProfitabilityIchigo Mita Building (Minato-ku, Tokyo)
・Rapidly renovated common areas, including restrooms and office pantries, on vacated floors
・Promote awareness of the newly renovated common areas which drive tenant satisfaction
・Brought in new tenants quickly and at higher rents
Economics
Investment
JPY 8MNOI Annual Increase
JPY 5MInvestment Return
64.7% p.a.
Average Rent per Tsubo (3.3m2)
Before JPY 14,200
After JPY 15,000(+5.6%)
After
October 2016
100.0%
Occupancy
April 2017
78.3%
After June 1, 2017
100.0%
Organic Growth
Value-Add Capex
© 2017 Ichigo Investment Advisors Co., Ltd. Ichigo Office REIT Investment Corporation All rights reserved. 22
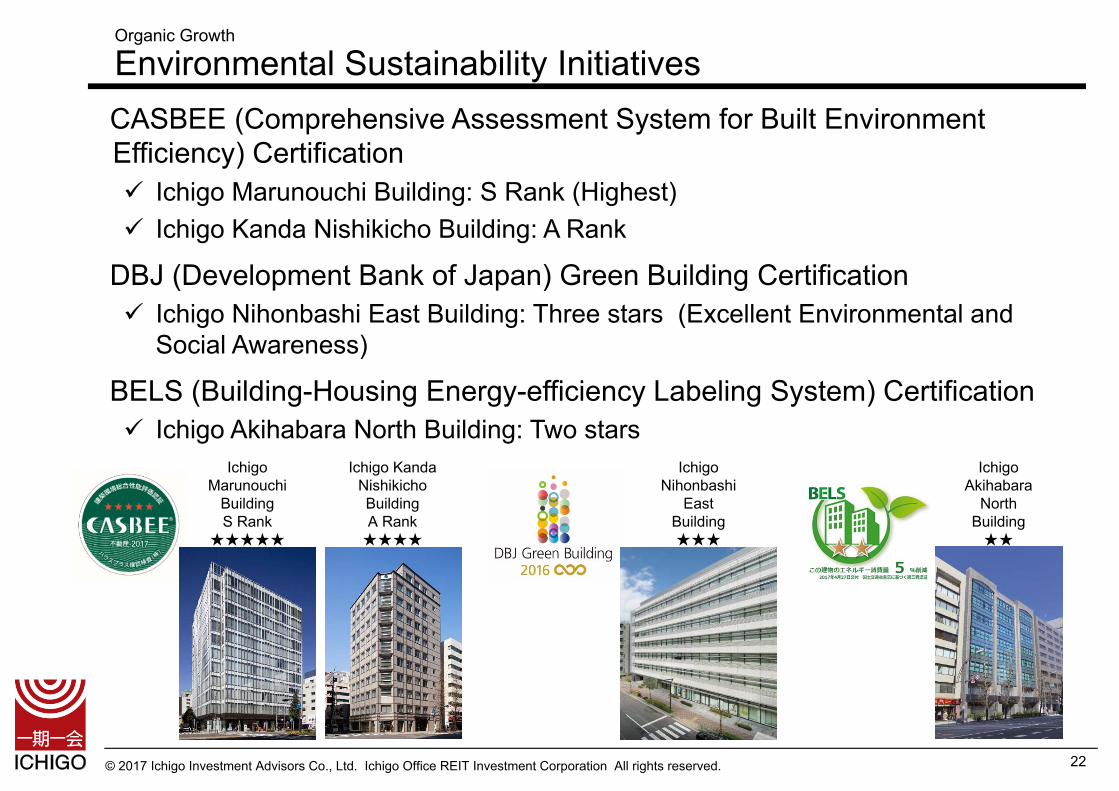
Organic Growth
Environmental Sustainability InitiativesCASBEE (Comprehensive Assessment System for Built Environment Efficiency) Certification Ichigo Marunouchi Building: S Rank (Highest) Ichigo Kanda Nishikicho Building: A Rank
DBJ (Development Bank of Japan) Green Building Certification Ichigo Nihonbashi East Building: Three stars (Excellent Environmental and
Social Awareness)
BELS (Building-Housing Energy-efficiency Labeling System) Certification Ichigo Akihabara North Building: Two stars
Ichigo Marunouchi
BuildingS Rank
★★★★★
Ichigo Kanda Nishikicho BuildingA Rank★★★★
Ichigo Nihonbashi
East Building★★★
Ichigo Akihabara
North Building★★
© 2017 Ichigo Investment Advisors Co., Ltd. Ichigo Office REIT Investment Corporation All rights reserved. 23
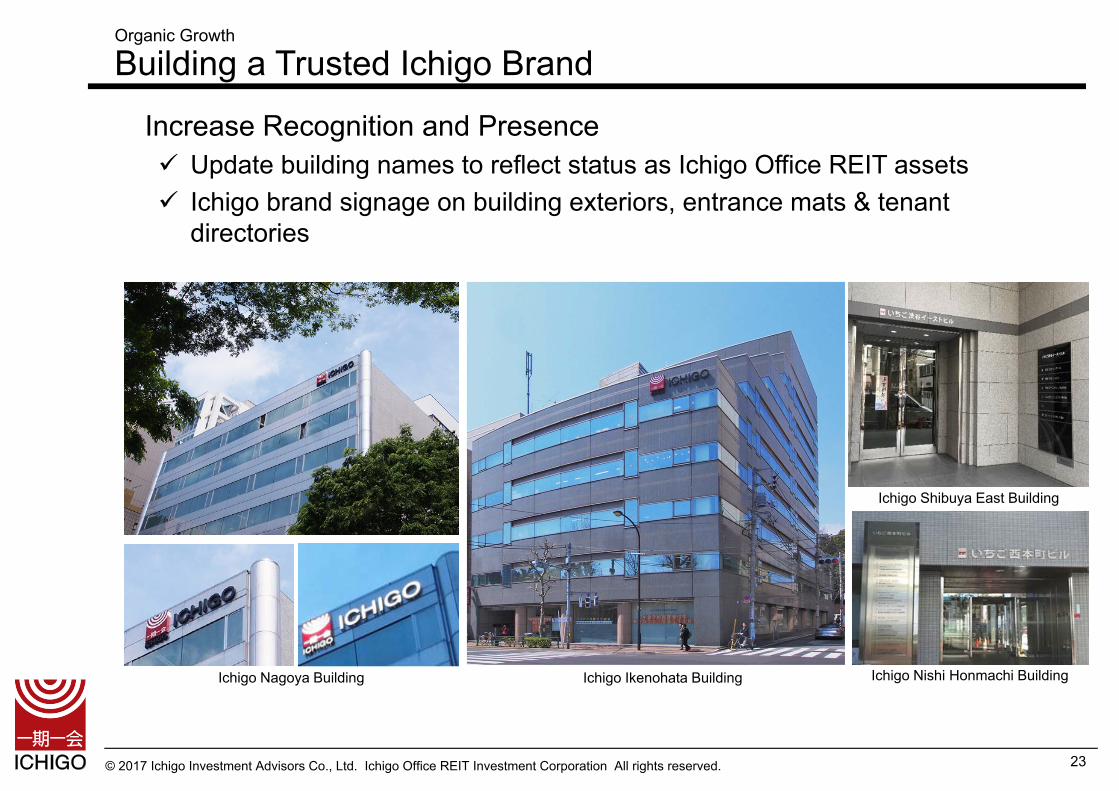
Organic Growth
Building a Trusted Ichigo Brand
Increase Recognition and Presence Update building names to reflect status as Ichigo Office REIT assets Ichigo brand signage on building exteriors, entrance mats & tenant
directories
Ichigo Nagoya Building Ichigo Ikenohata Building Ichigo Nishi Honmachi Building
Ichigo Shibuya East Building
© 2017 Ichigo Investment Advisors Co., Ltd. Ichigo Office REIT Investment Corporation All rights reserved.
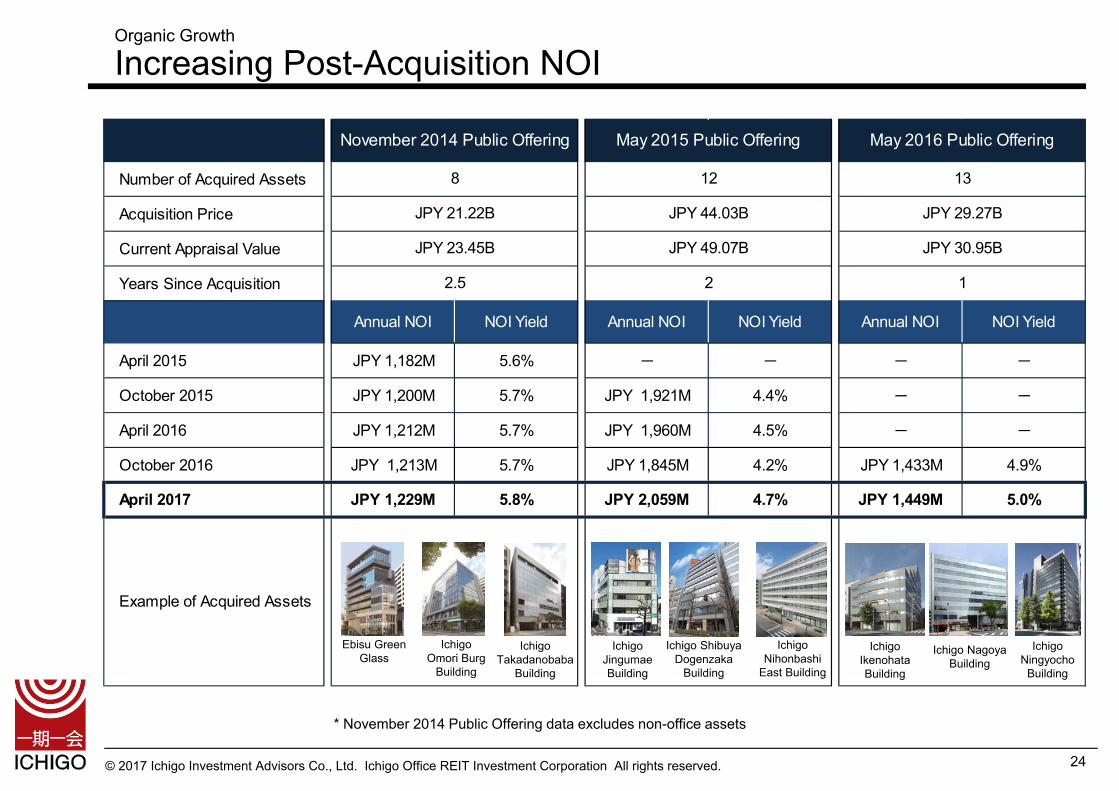
Number of Acquired Assets
Acquisition Price
Current Appraisal Value
Years Since Acquisition
Annual NOI NOI Yield Annual NOI NOI Yield Annual NOI NOI Yield
April 2015 JPY 1,182M 5.6% - - - -
October 2015 JPY 1,200M 5.7% JPY 1,921M 4.4% - -
April 2016 JPY 1,212M 5.7% JPY 1,960M 4.5% - -
October 2016 JPY 1,213M 5.7% JPY 1,845M 4.2% JPY 1,433M 4.9%
April 2017 JPY 1,229M 5.8% JPY 2,059M 4.7% JPY 1,449M 5.0%
Example of Acquired Assets
November 2014 Public Offering May 2015 Public Offering May 2016 Public Offering
8 12 13
JPY 21.22B JPY 44.03B JPY 29.27B
JPY 23.45B JPY 49.07B JPY 30.95B
2.5 2 1
Organic Growth
Increasing Post-Acquisition NOI
24
Ebisu Green Glass
Ichigo Omori Burg
Building
Ichigo Takadanobaba
Building
Ichigo Jingumae Building
Ichigo Shibuya Dogenzaka
Building
Ichigo Nihonbashi
East Building
Ichigo Ningyocho
Building
Ichigo Nagoya Building
Ichigo Ikenohata Building
* November 2014 Public Offering data excludes non-office assets
© 2017 Ichigo Investment Advisors Co., Ltd. Ichigo Office REIT Investment Corporation All rights reserved. 25
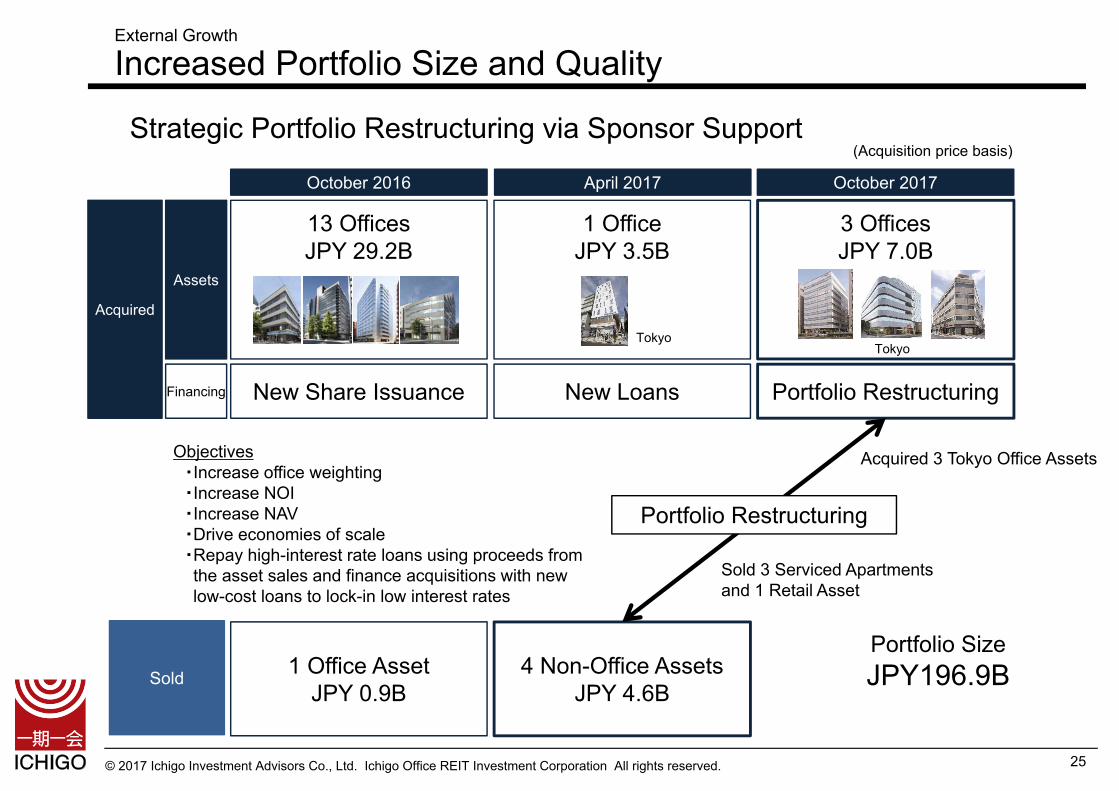
External Growth
Increased Portfolio Size and Quality
Strategic Portfolio Restructuring via Sponsor Support
October 2016 April 2017 October 2017
Sold
Acquired
Assets
Financing
13 OfficesJPY 29.2B
New Share Issuance
1 Office AssetJPY 0.9B
1 OfficeJPY 3.5B
New Loans
4 Non-Office AssetsJPY 4.6B
3 OfficesJPY 7.0B
Portfolio Restructuring
TokyoTokyo
Portfolio Restructuring
Acquired 3 Tokyo Office Assets
Sold 3 Serviced Apartments and 1 Retail Asset
Portfolio SizeJPY196.9B
Objectives・Increase office weighting・Increase NOI・Increase NAV ・Drive economies of scale・Repay high-interest rate loans using proceeds from the asset sales and finance acquisitions with new low-cost loans to lock-in low interest rates
(Acquisition price basis)
© 2017 Ichigo Investment Advisors Co., Ltd. Ichigo Office REIT Investment Corporation All rights reserved.
External Growth
Rapid NOI Growth at Prime Location Assets
26
Ichigo Shibuya Udagawacho Building +33% NOI since Acquisition (Nov 2016) on Higher Occupancy and Rents
Other Shibuya Assets Also Growing NOI on Strong Office Demand
Ichigo Shibuya Udagawacho Building
Ichigo Nanpeidai Building
Ichigo Shibuya Dogenzaka Building
11 Assets in the Shibuya Area
Ebisu/Hiroo
* Office-use units only
October 2015 April 2016 October 2016 April 2017
Occupancy 100% 100% 100% 100%Average Rent per Tsubo* (JPY) 17,900 18,700 19,400 19,700Annual NOI (JPY M) 98 91 104 108
October 2015 April 2016 October 2016 April 2017
Occupancy 100% 100% 100% 100%Average Rent per Tsubo* (JPY) 18,600 18,600 21,400 21,400Annual NOI (JPY M) 115 147 60 187
At Acquisition April 2017
Occupancy 67.3% 89.1%Average Rent per Tsubo* (JPY) 28,200 28,300Annual NOI (JPY M) 88 117

© 2017 Ichigo Investment Advisors Co., Ltd. Ichigo Office REIT Investment Corporation All rights reserved.
External Growth
Increased NOI and Portfolio Quality
27
Acquired Three Tokyo Office Assets and Sold Four Tokyo Non-Office Assets
Win Gotanda Building Ichigo Hongo Building Oimachi Center Building
・Acquisition Price: JPY 3.1B・NOI Yield: 5.0%・Location: 3-min walk from Gotanda Station on the JR Yamanote Line
・Acquisition Price: JPY 2.3B・NOI Yield: 4.9%・Location: 3-min walk from Kasuga Station on the Toei Mita Line
・Acquisition Price: JPY 1.68B・NOI Yield: 5.2%・Location: 3-min walk from Oimachi Station on the JR Keihin Tohoku Line
Prime Location Office Assets in TokyoSold Acquired
Number of Assets 4 3
Acquisition Price JPY 4.60B JPY 7.08B
Office % – 100.0%
Annual NOI JPY 220M JPY 350M
NOI Yield 4.9% 5.0%
Post-Depreciation NOI Yield 4.1% 4.7%
Occupancy 92.4% 93.3%
Number of Tenants 9 25

© 2017 Ichigo Investment Advisors Co., Ltd. Ichigo Office REIT Investment Corporation All rights reserved. 28
Ichigo (2337) Office Assets: JPY 60B
External Growth
Sponsor Pipeline
MIF Building(Tokyo)
Hakata Ekimae Square (Fukuoka)
Kakyouin Plaza(Sendai)
Kichijoji Central Building (Tokyo)
Hakata MST(Fukuoka)
Tradepia Odaiba(Tokyo)
Win Dai2 Gotanda Building (Tokyo)
Ichigo Akasaka 317 Building(Tokyo)
Takeyama Hakata Building (Fukuoka)
As of February 2017
© 2017 Ichigo Investment Advisors Co., Ltd. Ichigo Office REIT Investment Corporation All rights reserved.
April 2017Actual (A)
October 2017Forecast (B)
vs. April 2017(B) - (A)
Operating Revenue 7,352 7,462 +109
Operating Profit 3,378 3,450 +71
Recurring Profit 2,616 2,707 +91
Net Income 2,615 2,706 +91
EPS JPY 1,706 JPY 1,766 +JPY 60
Dividend Reserve Reversal 370 250 -119
DPS JPY 1,923 JPY 1,930 +JPY 7
NOI 5,279 5,354 + 75
Occupancy 98.6% 97.1% -1.5%
Major Variation Factors (vs. April 2017)
Rental Income +147 ・Asset acquisition in October 2017 period +234 ・Asset sale in April 2016 period -162 [Existing Assets] ・Common area services income +58 (Ichigo Ebisu Nishi Building +12) (Ichigo Marunouchi Building +10) (Ichigo Jingumae Building +8) ・Utilities Income +31 ・Lease termination penalties -16
Other Operating Revenue -37 ・Decrease in gain on asset sale in April 2017 period -37
Increase in Rental Expenses +73 ・Increase due to asset acquisition in October 2017 period +67 ・Decrease due to asset sale in April 2016 period -82 [Existing Assets] ・Increase in utilities expenses +67 ・Increase in property tax due to asset acquisitions in Oct 2016 and Apr 2017 periods +41 ・Decrease in maintenance fees -18
Decrease in Operating Expenses (excluding rental expenses) -35 ・Decrease in AM fees due to asset sale -11 ・Decrease in non-deductible consumption taxes -24
Decrease in Non-Operating Expenses -22 ・Decrease in up-front loan fees & related expenses -32
Reference: Capex ・April 2017 Period: JPY 570M, October 2017 Forecast: JPY 635M
Reference: October 2017 Post-Dividend Reserves ・Reserve for adjustment of temporary differences (negative goodwill): JPY 9,862M, Dividend reserve: JPY 608M
October 2017 Forecast
29
(JPY million)
* NOI = Rental Income - Rental Expenses + Depreciation Occupancy is Period-End.
© 2017 Ichigo Investment Advisors Co., Ltd. Ichigo Office REIT Investment Corporation All rights reserved.
October 2017Forecast (A)
April 2018Forecast (B)
vs. October 2017(B) - (A)
Operating Revenue 7,462 7,338 -123
Operating Profit 3,450 3,551 +101
Recurring Profit 2,707 2,735 +28
Net Income 2,706 2,735 +28
EPS JPY 1,766 JPY 1,785 +JPY 19
Dividend Reserve Reversal 250 238 -12
DPS JPY 1,930 JPY 1,940 +JPY 10
NOI 5,354 5,292 -62
Occupancy 97.1% 96.8% -0.3%
Major Variation Factors (vs. October 2017 Forecast)
Rental Income -123 ・Asset acquisition in October 2017 period +13 [Existing Assets] ・Common area services income -94 (Ichigo Gotanda Building -45) (Ichigo Shinkawa Building -21) (Ichigo Higashi Ikebukuro Building -20) ・Utilities Income -35 ・Lease termination penalties -5
Decrease in Rental Expenses -67 ・Increase due to asset acquisition in October 2017 period +1 [Existing Assets] ・Decrease in service provider expenses -13 ・Decrease in utilities expenses -23 ・Decrease in maintenance fees -17 ・Decrease in depreciation -7
Decrease in Operating Expenses (excluding rental expenses) -157 ・Increase in AM fees due to asset acquisition in October 2017 period +7 ・Decrease in performance fee to asset manager -165
Increase in Non-Operating Expenses +73 ・Decrease in interest expenses -5 ・Increase in up-front loan fees & related expenses +79
Reference: Capex ・October 2017 Forecast: JPY 635M, April 2018 Forecast: JPY 504M
Reference: April 2018 Post-Dividend Reserves ・Reserve for adjustment of temporary differences (negative goodwill): JPY 9,662M, Dividend reserve: JPY 570M
April 2018 Forecast
30
* NOI = Rental Income - Rental Expenses + DepreciationOccupancy is Period-End.
(JPY million)

© 2017 Ichigo Investment Advisors Co., Ltd. Ichigo Office REIT Investment Corporation All rights reserved.
Appendix: Financial & Portfolio Data
31
© 2017 Ichigo Investment Advisors Co., Ltd. Ichigo Office REIT Investment Corporation All rights reserved.
October 2016Actual (A)
April 2017Actual (B)
vs. October 2016(B) - (A)
Operating Revenue 7,090 7,352 +262
Operating Profit 3,405 3,378 -26
Recurring Profit 2,462 2,616 +153
Net Income 2,462 2,615 +152
EPS JPY 1,607 JPY 1,706 +JPY 99
Dividend Reserve Reversal 461 370 -91
DPS JPY 1,904 JPY 1,923 +JPY 19
NOI 5,073 5,279 +205
Occupancy 98.2% 98.6% +0.4%
Major Variation Factors (vs. October 2016)
Rental Income +240 ・Asset acquisition in October 2016 +111 ・Asset acquisition in April 2017 +69 ・Asset sale in October 2016 -50 ・Asset sale in April 2017 -20 [Existing Assets] ・Common area services income +147 (Ichigo Shibuya Dogenzaka Building +49) (Ichigo Nihonbashi East Building +26) ・Utilities Income -33 ・Lease termination penalties +20
Other Operating Revenue +21 ・Gain on asset sale in April 2017 +30 ・Decrease in TK dividend in October 2016 -9
Increase in Rental Expenses +38 ・Increase due to asset acquisition in October 2016 +88 (of which is property tax +51) ・Increase due to asset acquisition in April 2017 +14 ・Decrease due to asset sale in October 2016 -27 [Existing Assets] ・Decrease in service provider expenses -29 ・Decrease in utilities expenses -45 ・Increase in maintenance fees +41
Increase in Operating Expenses (excluding rental expenses) +250 ・Increase in AM fees on asset acquisition in October 2016 +39 ・Increase in performance fee to asset manager +170
Decrease in Non-Operating Expenses -177 ・Increase in up-front loan fees & related expenses -146 ・Decrease in new share issuance expenses -31
April 2017 vs. October 2016 Earnings
32
(JPY million)
*NOI = Rental Income - Rental Expenses + Depreciation Occupancy is Period-End
© 2017 Ichigo Investment Advisors Co., Ltd. Ichigo Office REIT Investment Corporation All rights reserved.
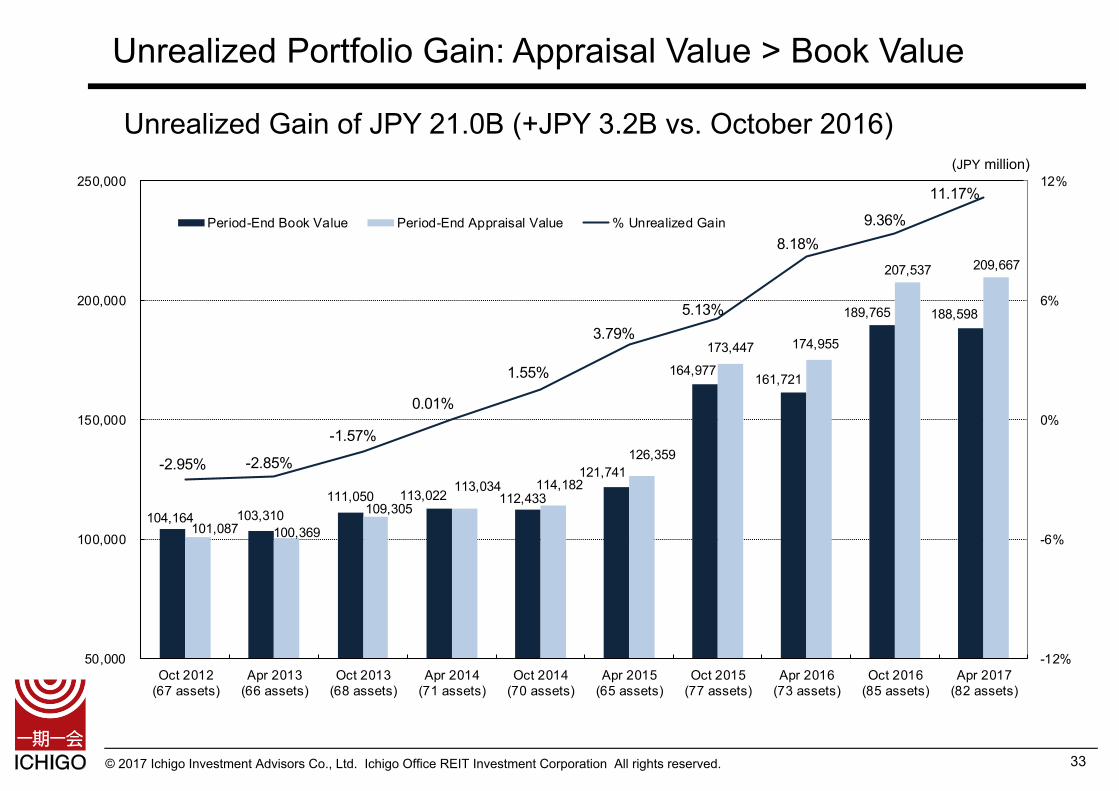
Unrealized Portfolio Gain: Appraisal Value > Book Value
33
Unrealized Gain of JPY 21.0B (+JPY 3.2B vs. October 2016)(JPY million)
104,164 103,310 111,050 113,022 112,433
121,741
164,977 161,721
189,765 188,598
101,087 100,369
109,305 113,034 114,182
126,359
173,447 174,955
207,537 209,667
-2.95% -2.85%
-1.57%
0.01%
1.55%
3.79%5.13%
8.18%9.36%
11.17%
-12%
-6%
0%
6%
12%
50,000
100,000
150,000
200,000
250,000
Oct 2012(67 assets)
Apr 2013(66 assets)
Oct 2013(68 assets)
Apr 2014(71 assets)
Oct 2014(70 assets)
Apr 2015(65 assets)
Oct 2015(77 assets)
Apr 2016(73 assets)
Oct 2016(85 assets)
Apr 2017(82 assets)
Period-End Book Value Period-End Appraisal Value % Unrealized Gain
© 2017 Ichigo Investment Advisors Co., Ltd. Ichigo Office REIT Investment Corporation All rights reserved.
No. Location AcquisitionPrice
O-86 Win Gotanda Building Shinagawa-ku,Tokyo 3,100
O-87 Ichigo Hongo Building Bunkyo-ku,Tokyo 2,300
O-88 Oimachi Center Building Shinagawa-ku,Tokyo 1,680
10,580
Asset Name
Acquired 4 Assets
April 2017 Asset Sale and Acquisition
34
With Sponsor Support, Improved Portfolio Quality and Increased Office Focus
Acquired Assets (April 2017 Period) Sold Assets (April 2017 Period)
Acquired Assets (May 10, 2017)
(JPY million)(JPY million)
(JPY million)
No. Location AcquisitionPrice
O-85 Ichigo ShibuyaUdagawacho Building
Shibuya-ku,Tokyo 3,500
Asset Name No. Location Sale Price
R-04 Ichigo ServicedApartments Takanawadai
Minato-ku,Tokyo 990
R-06 B-SITE Hamamatsucho Minato-ku,Tokyo 616
R-09 Ichigo ServicedApartments Ginza
Chuo-ku,Tokyo 1,034
Z-04 Ichigo PagodaAsakusa Building
Taito-ku,Tokyo 1,850
4,490
Asset Name
Sold 4 Assets

© 2017 Ichigo Investment Advisors Co., Ltd. Ichigo Office REIT Investment Corporation All rights reserved.
1.53%
1.23% 1.19% 1.14%1.06% 1.02% 1.00%2.6 years
3.7 years
4.2 years
3.8 years 3.8 years3.5 years 3.6 years
0
1
2
3
4
5
0.0%
0.5%
1.0%
1.5%
2.0%
2.5%
Oct 2014 Apr 2015 Oct 2015 Apr 2016 Oct 2016 Apr 2017 May 10, 2017
Weighted Average Interest Rate Weighted Average Loan Term
35
Loan Details (1)Average Interest Rate and Loan Term
Fixed-to-Floating Rate Ratio
72.9%
27.1%
73.5%
26.5%
80.1%
19.9%
79.4%
20.6%
83.4%
16.6%
82.3%
17.7%
Oct 2014 Apr 2015 Apr 2016Oct 2015 Apr 2017Oct 2016
* Fixed includes floating loans fixed via interest rate swaps
Fixed
Floating*
Fixed
Floating
81.9%
18.1%
May 10, 2017
(Average Loan Term, Years)(Interest Rate)

© 2017 Ichigo Investment Advisors Co., Ltd. Ichigo Office REIT Investment Corporation All rights reserved.
FloatingFixed (includes floating loans fixed via interest rate swaps)
45.2%43.7% 44.0% 43.1%
46.0% 45.7%
44.6%42.3% 42.1%
40.1%
42.4%41.6%
35
40
45
50
55
Oct 2014 Apr 2015 Oct 2015 Apr 2016 Oct 2016 Apr 2017
LTV LTV (Market-Value Basis)*
Loan Details (2)
36
Loan Maturity Distribution (as of May 10, 2017)
(JPY million)
LTV (as of April 30, 2017)(%)
* Market-Value = Total Assets + Unrealized Gains
LTV 40-50%
8,938
4,549
3,000892 1,204700
3,8676,370
8,359
9,574 10,233 9,639 9,629 9,633 9,623
3,000 3,400
Oct 2017 Apr 2018 Oct 2018 Apr 2019 Oct 2019 Apr 2020 Oct 2020 Apr 2021 Oct 2021 Apr 2022 Oct 2022 Apr 2023 Oct 2023 Apr 2024 Oct 2024 Apr 2025
6,867 7,263
9,563
© 2017 Ichigo Investment Advisors Co., Ltd. Ichigo Office REIT Investment Corporation All rights reserved.
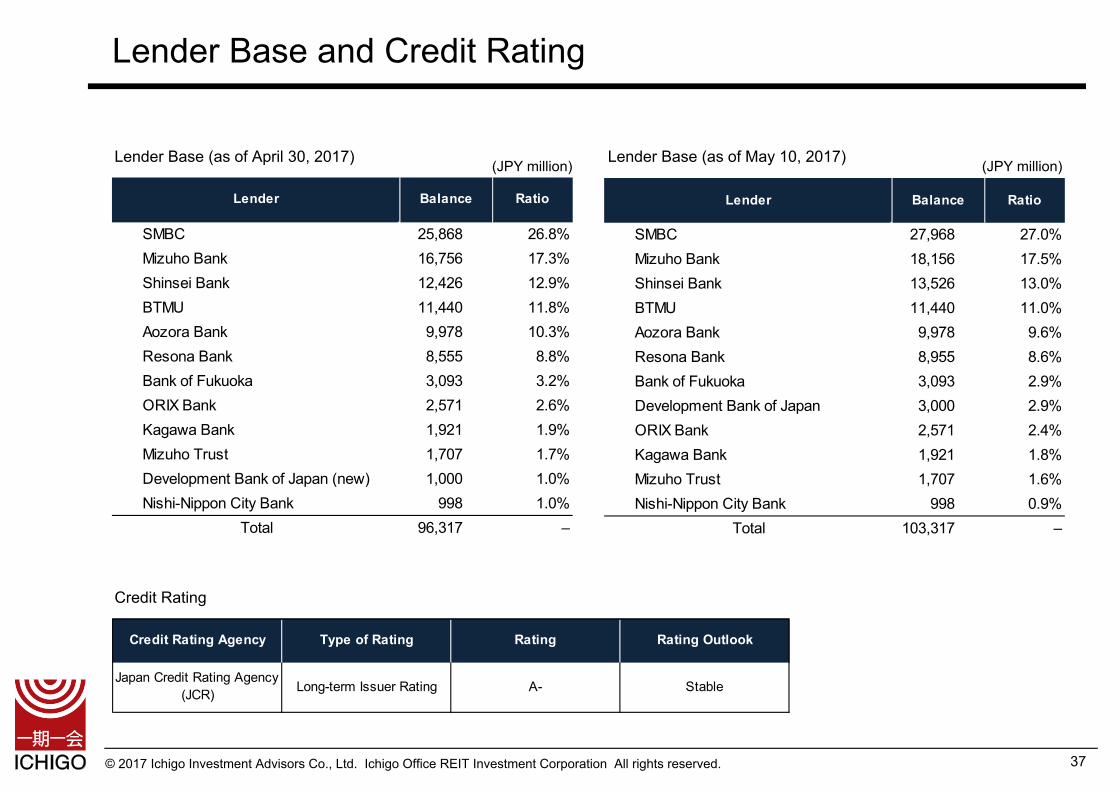
Lender Base and Credit Rating
37
(JPY million)
Credit Rating
Lender Base (as of April 30, 2017) Lender Base (as of May 10, 2017)
SMBC 25,868 26.8%Mizuho Bank 16,756 17.3%Shinsei Bank 12,426 12.9%BTMU 11,440 11.8%Aozora Bank 9,978 10.3%Resona Bank 8,555 8.8%Bank of Fukuoka 3,093 3.2%ORIX Bank 2,571 2.6%Kagawa Bank 1,921 1.9%Mizuho Trust 1,707 1.7%Development Bank of Japan (new) 1,000 1.0%Nishi-Nippon City Bank 998 1.0%
Total 96,317 –
Lender Balance Ratio
Credit Rating Agency Type of Rating Rating Rating Outlook
Japan Credit Rating Agency(JCR) Long-term Issuer Rating A- Stable
Lender Balance Ratio
SMBC 27,968 27.0%Mizuho Bank 18,156 17.5%Shinsei Bank 13,526 13.0%BTMU 11,440 11.0%Aozora Bank 9,978 9.6%Resona Bank 8,955 8.6%Bank of Fukuoka 3,093 2.9%Development Bank of Japan (new) 3,000 2.9%ORIX Bank 2,571 2.4%Kagawa Bank 1,921 1.8%Mizuho Trust 1,707 1.6%Nishi-Nippon City Bank 998 0.9%
Total 103,317 –
(JPY million)

© 2017 Ichigo Investment Advisors Co., Ltd. Ichigo Office REIT Investment Corporation All rights reserved.
Survey Data: New & Departing Tenant Rationale
38
New Tenants Departing Tenants
35.7% 50.0%
25.0% 70.0%
19.6% 57.1%
36.4% 50.0%
24.0% 60.0%
19.0% 47.6%
30.0% 52.5%
22.9% 60.0%
Oct 2015
Apr 2016
Oct 2016
Apr 2017
10.7% 3.6%
2.5%2.5%
14.3% 8.9%
9.1% 4.5%
12.0% 4.0%
14.3% 19.0%
10.0% 7.5%
14.3% 2.9%
Opening a new office or moving to a better location
Moving to a different building for larger floor space / adding floor spaceReducing cost or floor spaceOther
Moving to a different building for larger floor space or better location
Reducing cost or moving to a different building to integrate with other divisionsClosing officeOther
Oct 2015
Apr 2016
Oct 2016
Apr 2017
© 2017 Ichigo Investment Advisors Co., Ltd. Ichigo Office REIT Investment Corporation All rights reserved.
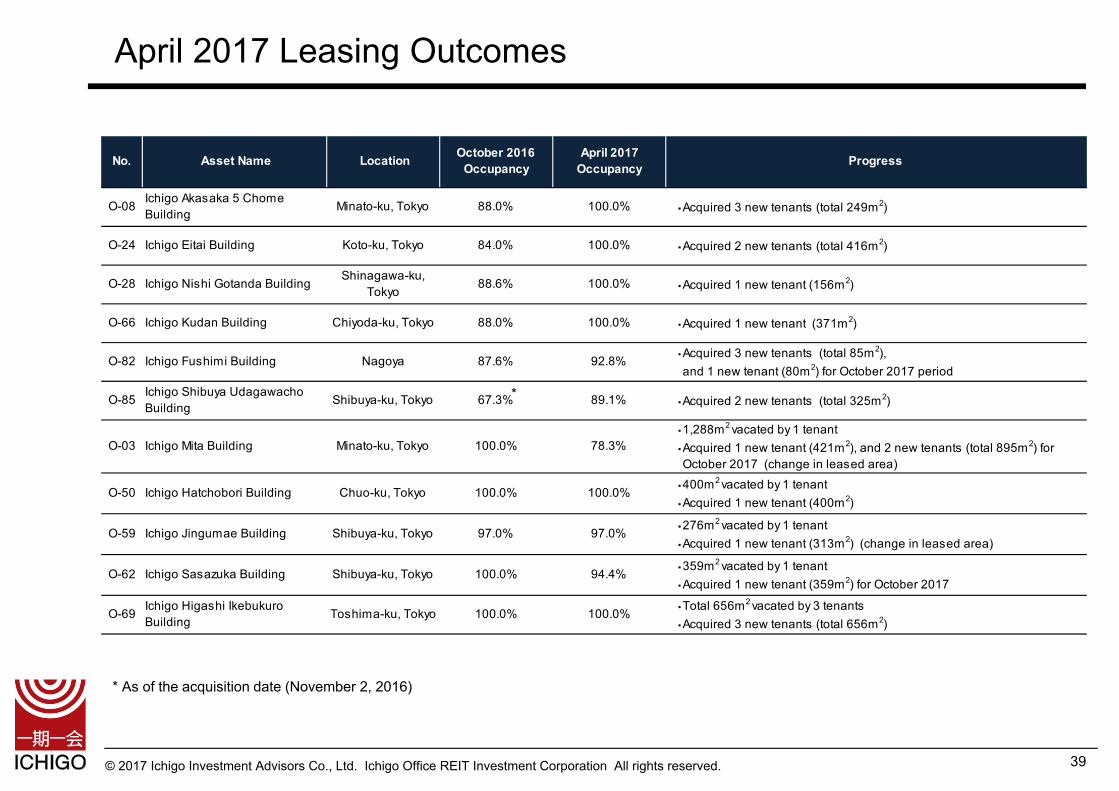
April 2017 Leasing Outcomes
39
*
* As of the acquisition date (November 2, 2016)
O-08 Ichigo Akasaka 5 ChomeBuilding Minato-ku, Tokyo 88.0% 100.0% ・Acquired 3 new tenants (total 249m2)
O-24 Ichigo Eitai Building Koto-ku, Tokyo 84.0% 100.0% ・Acquired 2 new tenants (total 416m2)
O-28 Ichigo Nishi Gotanda Building Shinagawa-ku,Tokyo 88.6% 100.0% ・Acquired 1 new tenant (156m2)
O-66 Ichigo Kudan Building Chiyoda-ku, Tokyo 88.0% 100.0% ・Acquired 1 new tenant (371m2)
O-82 Ichigo Fushimi Building Nagoya 87.6% 92.8% ・Acquired 3 new tenants (total 85m2), and 1 new tenant (80m2) for October 2017 period
O-85 Ichigo Shibuya UdagawachoBuilding Shibuya-ku, Tokyo 67.3% 89.1% ・Acquired 2 new tenants (total 325m2)
O-03 Ichigo Mita Building Minato-ku, Tokyo 100.0% 78.3%・1,288m2 vacated by 1 tenant・Acquired 1 new tenant (421m2), and 2 new tenants (total 895m2) for October 2017 (change in leased area)
O-50 Ichigo Hatchobori Building Chuo-ku, Tokyo 100.0% 100.0% ・400m2 vacated by 1 tenant・Acquired 1 new tenant (400m2)
O-59 Ichigo Jingumae Building Shibuya-ku, Tokyo 97.0% 97.0% ・276m2 vacated by 1 tenant・Acquired 1 new tenant (313m2) (change in leased area)
O-62 Ichigo Sasazuka Building Shibuya-ku, Tokyo 100.0% 94.4% ・359m2 vacated by 1 tenant・Acquired 1 new tenant (359m2) for October 2017
O-69 Ichigo Higashi IkebukuroBuilding Toshima-ku, Tokyo 100.0% 100.0% ・Total 656m2 vacated by 3 tenants
・Acquired 3 new tenants (total 656m2)
ProgressNo. Asset Name Location October 2016Occupancy
April 2017Occupancy

© 2017 Ichigo Investment Advisors Co., Ltd. Ichigo Office REIT Investment Corporation All rights reserved.
Asset Type No. of Assets Leased Area Change in Rent(Entire Period)
Change fromPrevious Rent
Upward Office 55 16,826m2 +JPY 25.6M +6.3%
Other 1 145m2 +JPY 0.2M +10.0%
Total 56 16,972m2 +JPY 25.8M +6.4%
Downward Office – – – –
Other – – – –
Total – – – –
Flat Office 136 34,074m2 – –
Other 13 3,856m2 – –
Total 149 37,931m2 – –
Total Office 191 50,901 m2 +JPY 25.6M +2.2%
Other 14 4,002m2 +JPY 0.2M +5.0%
Total 205 54,903m2 +JPY 25.8M +2.2%
Lease Renewals
40
April 2017: Change in Monthly Rent by Asset Type
April 2017: Lease Renewals by Asset Type (Office/Other)
((JPY million)
Oct 31, 2016(A)
NewContracts
ContractTerminations Upward Downward Asset
AcquisitionAssetSale
Apr 30, 2017(B)
Change(A) - (B)
Change atExisting Assets
Office 923 34 -28 4 – 9 – 943 +19 +10
Other 135 1 – – – – -25 111 -24 –
Total 1,058 35 -29 4 – 9 -25 1,054 -4 +10

© 2017 Ichigo Investment Advisors Co., Ltd. Ichigo Office REIT Investment Corporation All rights reserved.
Leased Area
41
New Leases Lease Terminations
April 2017: Leased Area by Asset Type (Office/Other)
April 2017: New Leases & Lease Terminations by Asset Type (Office/Other)
((m²)
Asset Type No. ofAssets
LeasedArea
Change in Rent(Entire Period)
Change fromPrevious Rent
Upward Office 29 4,752m2 +JPY 142M +13.7%
Other 1 130m2 +JPY 3M +11.1%
Total 30 4,883m2 +JPY 146M +13.6%
Downward Office 10 1,886m2 +JPY 45M -12.9%
Other 1 145m2 +JPY 2M -8.1%
Total 11 2,032m2 +JPY 47M -12.7%
Flat Office 5 514m2 +JPY 40M –
Other –- –- – –
Total 5 514m2 +JPY 40M –
Office 44 7,153m2 +JPY 362M +5.3%
Total Other 2 276m2 +JPY 5M +2.0%
Total 46 7,429m2 +JPY 367M +5.2%
No. ofAssets
LeasedArea
Change in Rent(Entire Period)
Change fromPrevious Rent
Office 35 6,497m2 -JPY 171M –
Other 2 177m2 -JPY 4M –
Total 37 6,674m2 -JPY 175M –
Oct 31, 2016 NewContracts
ContractTerminations
AssetAcquisition
AssetSale Apr 30, 2017 Change Change at
Existing Assets
Office 218,851 7,153 -6,497 1,003 – 220,510 +1,659 +655
Other 33,601 276 -177 – -4,330 29,370 -4,231 +99
Total 252,453 7,429 -6,674 1,003 -4,330 249,881 -2,572 +754

© 2017 Ichigo Investment Advisors Co., Ltd. Ichigo Office REIT Investment Corporation All rights reserved.
12.15%
10.95%
8.84%
8.33%
2.03%
0.50%1.48% 1.48%
13.66%
12.01%
8.19%
9.10%
1.09%
-0.12% 0.40% 0.21%
-5%
0%
5%
10%
15%
Oct 2013 Apr 2014 Oct 2014 Apr 2015 Oct 2015 Apr 2016 Oct 2016 Apr 2017
All Central Tokyo
Rents Increasing with Market Rents
Rising Market Rents Increasing Rent Upside (“Rent Gap”)Ichigo Leasing Focused on Existing Tenants with Below-Market Rents
42
Rent Gap Between Current Rent vs. Market Rent Rent Gap by Fiscal Period (JPY million)
* Excludes scheduled tenant departures.Percentage in parentheses at top of bars shows the percentage of leases up for renewal in that period.
Below M
arket Rent
Oct 2017 Oct 2018Apr 2018 Apr 2019 and after
<-10%
≧0% , <10%
≧-10%, < 0%
≧10%
* Market rent data from CBRE
142 (18.2%)
178 (23.1%)
191 (24.8%)
263 (34.1%)
35
3456
40
60
43
86
83
53 6359 66
19 19 29 28

© 2017 Ichigo Investment Advisors Co., Ltd. Ichigo Office REIT Investment Corporation All rights reserved.
Free Rent Incentives
43
Free Rent Incentives Rental Income Loss due to Free Rent
(JPY million)(Months)
4,1595,228 5,315
5,989 6,251
40
49 67
143112
Loss from Free Rent Actual Rent Income
Oct 2015Apr 2015 Oct 2016Apr 2016 Apr 2017
1.6
2.4
2.0 2.4
1.8
3.1
4.4
1.2
2.6 2.6
0
1
2
3
4
5
Apr 2015 Oct 2015 Apr 2016 Oct 2016 Apr 2017
Average of Tokyo Metropolitan AreaAverage of Regional Cities
© 2017 Ichigo Investment Advisors Co., Ltd. Ichigo Office REIT Investment Corporation All rights reserved.
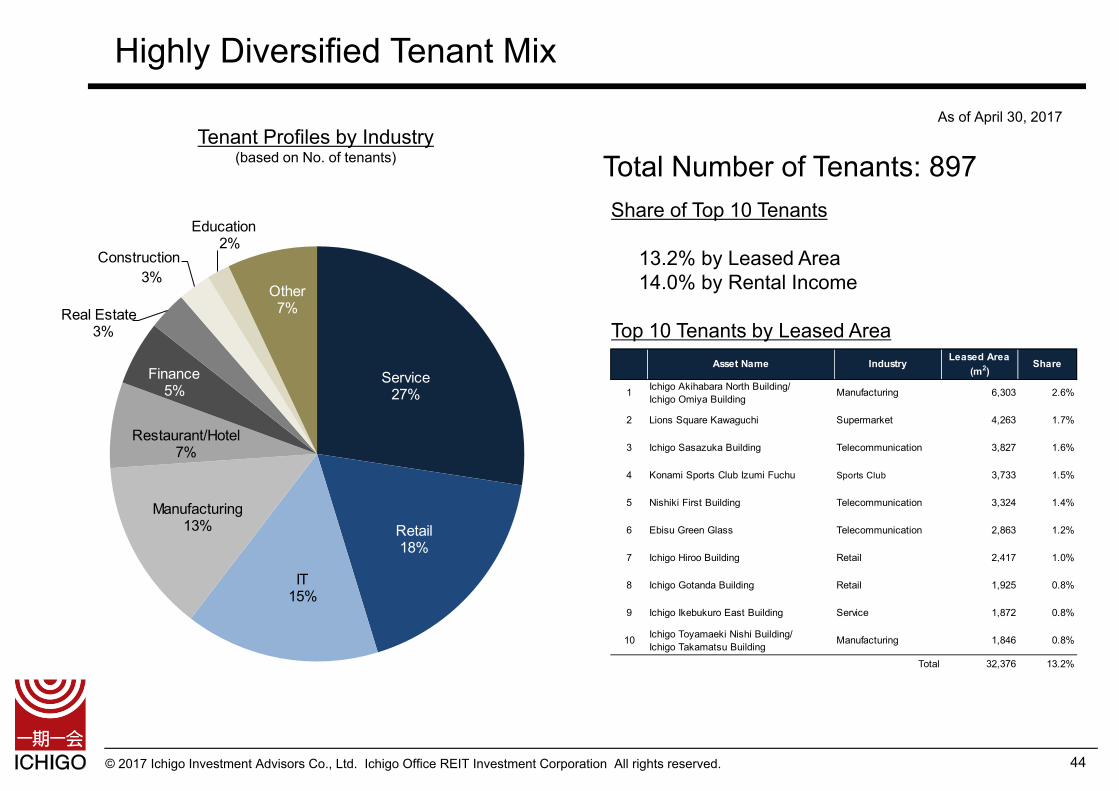
Service 27%
Retail 18%
IT 15%
Manufacturing 13%
Restaurant/Hotel 7%
Finance 5%
Real Estate3%
Construction3%
Education 2%
Other7%
Highly Diversified Tenant Mix
44
Tenant Profiles by Industry(based on No. of tenants)
As of April 30, 2017
Share of Top 10 Tenants
13.2% by Leased Area14.0% by Rental Income
Top 10 Tenants by Leased Area
Total Number of Tenants: 897
Asset Name Industry Leased Area(m2)
Share
1 Ichigo Akihabara North Building/Ichigo Omiya Building
Manufacturing 6,303 2.6%
2 Lions Square Kawaguchi Supermarket 4,263 1.7%
3 Ichigo Sasazuka Building Telecommunication 3,827 1.6%
4 Konami Sports Club Izumi Fuchu Sports Club 3,733 1.5%
5 Nishiki First Building Telecommunication 3,324 1.4%
6 Ebisu Green Glass Telecommunication 2,863 1.2%
7 Ichigo Hiroo Building Retail 2,417 1.0%
8 Ichigo Gotanda Building Retail 1,925 0.8%
9 Ichigo Ikebukuro East Building Service 1,872 0.8%
10 Ichigo Toyamaeki Nishi Building/Ichigo Takamatsu Building
Manufacturing 1,846 0.8%
Total 32,376 13.2%
© 2017 Ichigo Investment Advisors Co., Ltd. Ichigo Office REIT Investment Corporation All rights reserved.
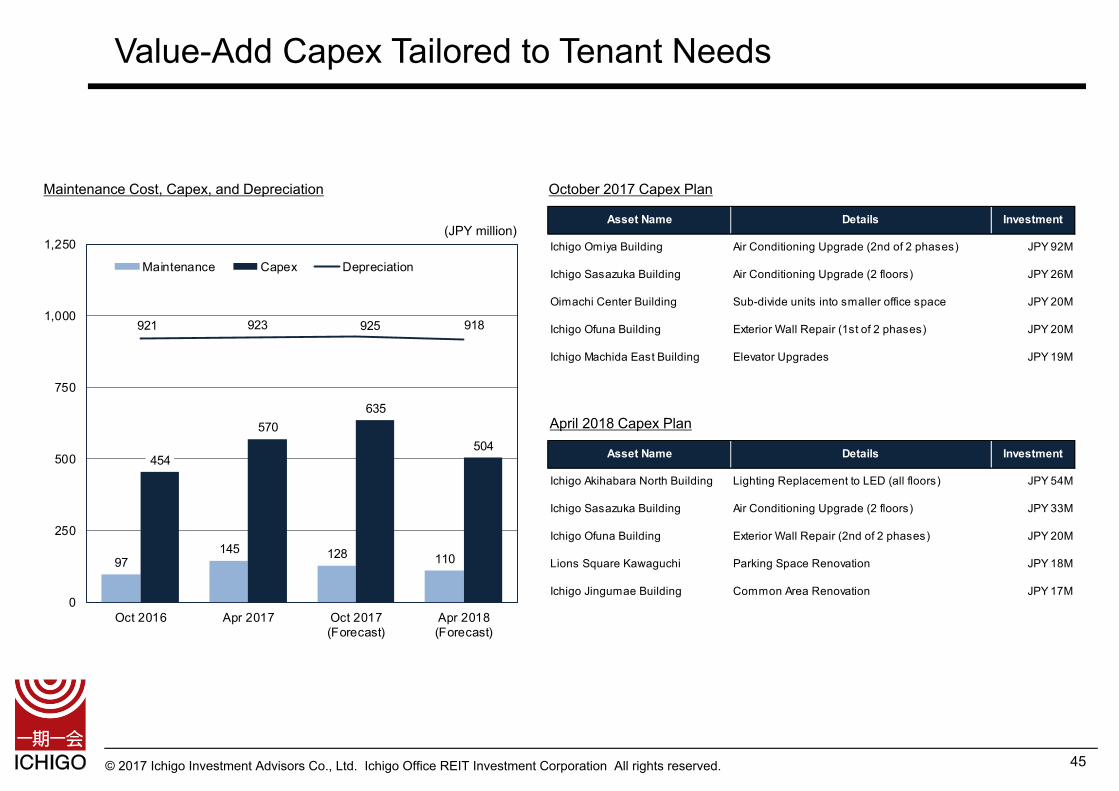
97145 128 110
454
570635
504
921 923 925 918
0
250
500
750
1,000
1,250
Oct 2016 Apr 2017 Oct 2017(Forecast)
Apr 2018(Forecast)
Maintenance Capex Depreciation
Value-Add Capex Tailored to Tenant Needs
45
Maintenance Cost, Capex, and Depreciation
(JPY million)
October 2017 Capex Plan
April 2018 Capex Plan
Asset Name Details Investment
Ichigo Omiya Building Air Conditioning Upgrade (2nd of 2 phases) JPY 92M
Ichigo Sasazuka Building Air Conditioning Upgrade (2 floors) JPY 26M
Oimachi Center Building Sub-divide units into smaller office space JPY 20M
Ichigo Ofuna Building Exterior Wall Repair (1st of 2 phases) JPY 20M
Ichigo Machida East Building Elevator Upgrades JPY 19M
Asset Name Details Investment
Ichigo Akihabara North Building Lighting Replacement to LED (all floors) JPY 54M
Ichigo Sasazuka Building Air Conditioning Upgrade (2 floors) JPY 33M
Ichigo Ofuna Building Exterior Wall Repair (2nd of 2 phases) JPY 20M
Lions Square Kawaguchi Parking Space Renovation JPY 18M
Ichigo Jingumae Building Common Area Renovation JPY 17M
© 2017 Ichigo Investment Advisors Co., Ltd. Ichigo Office REIT Investment Corporation All rights reserved. 46
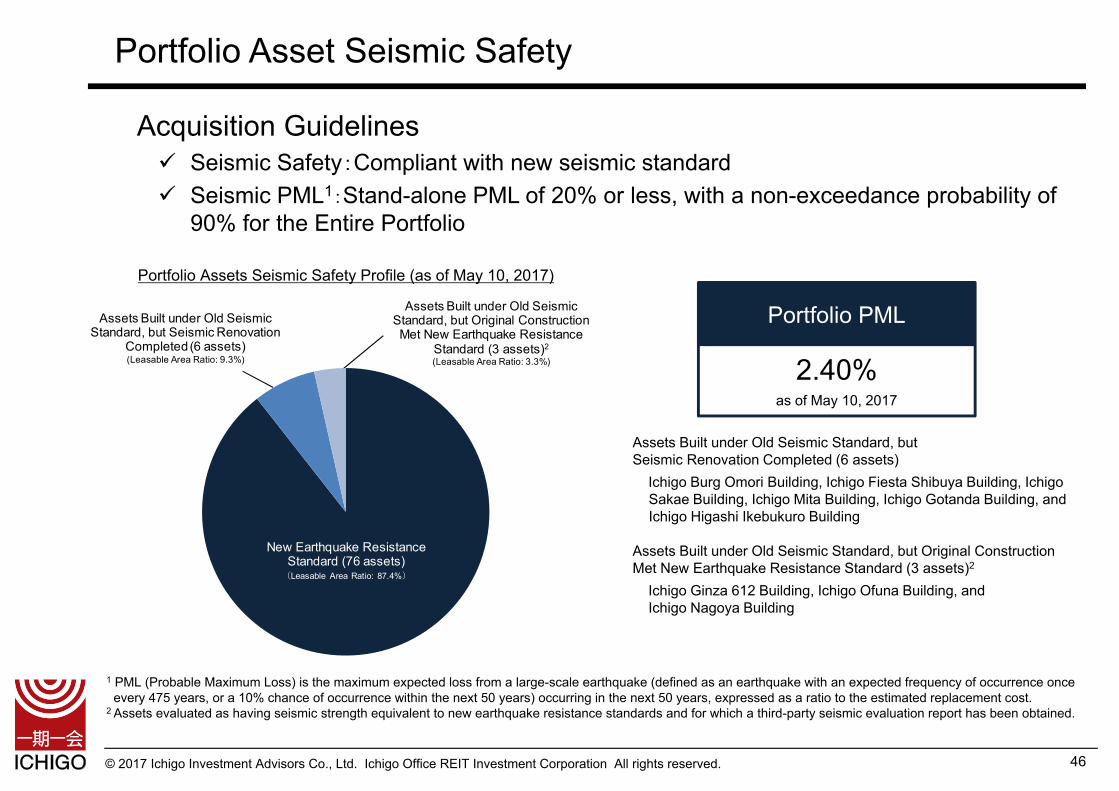
Portfolio Asset Seismic Safety
Acquisition Guidelines Seismic Safety:Compliant with new seismic standard Seismic PML1:Stand-alone PML of 20% or less, with a non-exceedance probability of
90% for the Entire Portfolio
Portfolio Assets Seismic Safety Profile (as of May 10, 2017)
Portfolio PML
Assets Built under Old Seismic Standard, butSeismic Renovation Completed (6 assets)
Ichigo Burg Omori Building, Ichigo Fiesta Shibuya Building, Ichigo Sakae Building, Ichigo Mita Building, Ichigo Gotanda Building, andIchigo Higashi Ikebukuro Building
Assets Built under Old Seismic Standard, but Original ConstructionMet New Earthquake Resistance Standard (3 assets)2
Ichigo Ginza 612 Building, Ichigo Ofuna Building, and Ichigo Nagoya Building
2.40%as of May 10, 2017
1 PML (Probable Maximum Loss) is the maximum expected loss from a large-scale earthquake (defined as an earthquake with an expected frequency of occurrence once every 475 years, or a 10% chance of occurrence within the next 50 years) occurring in the next 50 years, expressed as a ratio to the estimated replacement cost.
2 Assets evaluated as having seismic strength equivalent to new earthquake resistance standards and for which a third-party seismic evaluation report has been obtained.
New Earthquake Resistance Standard (76 assets)(Leasable Area Ratio: 87.4%)
Assets Built under Old Seismic Standard, but Seismic Renovation
Completed (6 assets)(Leasable Area Ratio: 9.3%)
Assets Built under Old Seismic Standard, but Original Construction Met New Earthquake Resistance
Standard (3 assets)2
(Leasable Area Ratio: 3.3%)
© 2017 Ichigo Investment Advisors Co., Ltd. Ichigo Office REIT Investment Corporation All rights reserved.
Mid-Size Office Portfolio Growth
47
* Leasable Area is as of May 10, 2017. Occupancy and number of tenants are as of April 30, 2017 for existing assets and as of acquisition dates for those acquired in the October 2017 period.
* NOI Yield as of May 10, 2017 and April 30, 2017 are provisionally calculated excluding assets sold during the fiscal period; NOI Yield of assets acquired in the October 2017 period are determined from the annual NOI calculated using a DCF method based on appraisal value at acquisition.
As of October 31, 2016 As of April 30, 2017 As of May 10, 2017
No. of Assets Total 85 assets 82 assets 85 assets
Office 70 assets 71 assets 74 assets
Other 15 assets 11 assets 11 assets
Portfolio Size Total JPY 191.0B JPY 189.8B JPY 196.9B
Office 88% 90% 91%
Other 12% 10% 9%
Area Central Tokyo 54% 55% 55%
Tokyo Metropolitan Area 25% 24% 24%
Four Major Regional Cities 15% 15% 14%
Other Regional Cities 6% 6% 6%
Appraisal Value JPY 207.5B JPY 209.6B JPY 217.0B
Leasable Area 257,142m2 253,545m2 262,707m2
Occupancy 98.2% 98.6% 98.4%
No. of Tenants 892 897 922
NOI Yield 5.3% 5.5% 5.5%
© 2017 Ichigo Investment Advisors Co., Ltd. Ichigo Office REIT Investment Corporation All rights reserved.
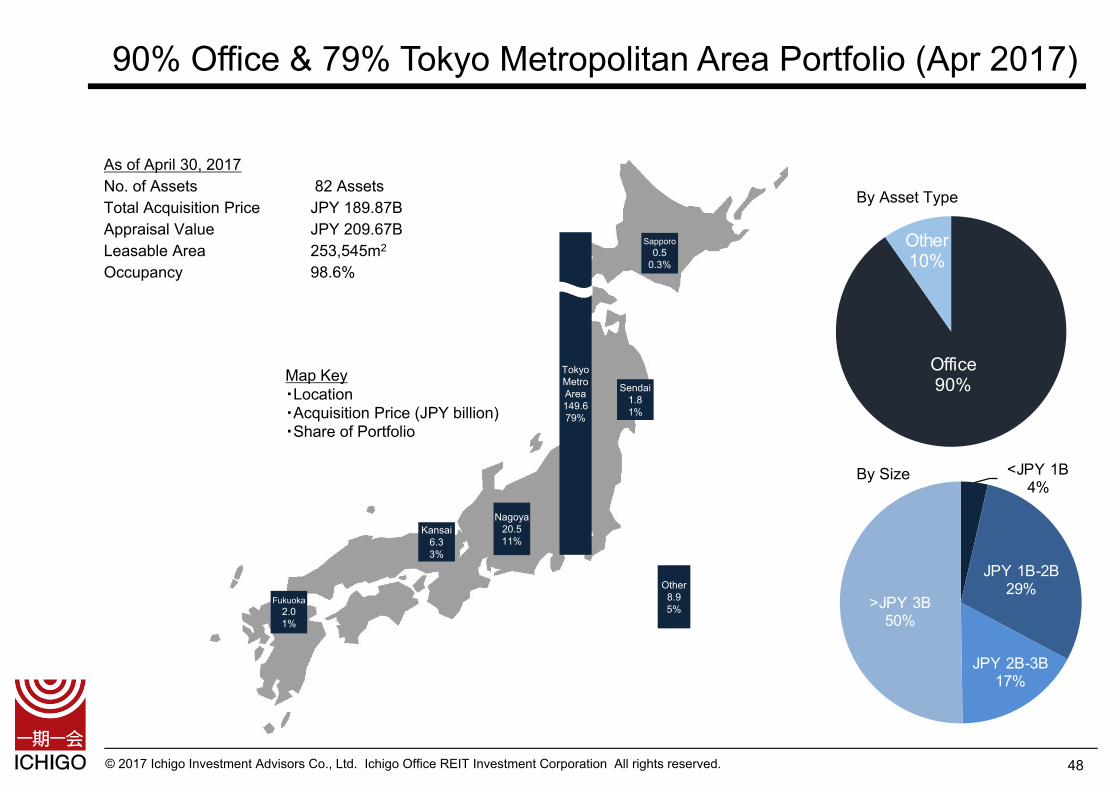
<JPY 1B4%
JPY 1B-2B29%
JPY 2B-3B17%
>JPY 3B50%
Kansai6.33%
Sapporo0.5
0.3%
Nagoya20.511%
Fukuoka2.01%
Other8.95%
TokyoMetroArea149.679%
Sendai1.81%
By Asset Type
By Size
48
90% Office & 79% Tokyo Metropolitan Area Portfolio (Apr 2017)
Map Key・Location・Acquisition Price (JPY billion)・Share of Portfolio
As of April 30, 2017No. of Assets 82 AssetsTotal Acquisition Price JPY 189.87BAppraisal Value JPY 209.67BLeasable Area 253,545m2
Occupancy 98.6%
Office90%
Other10%
© 2017 Ichigo Investment Advisors Co., Ltd. Ichigo Office REIT Investment Corporation All rights reserved.
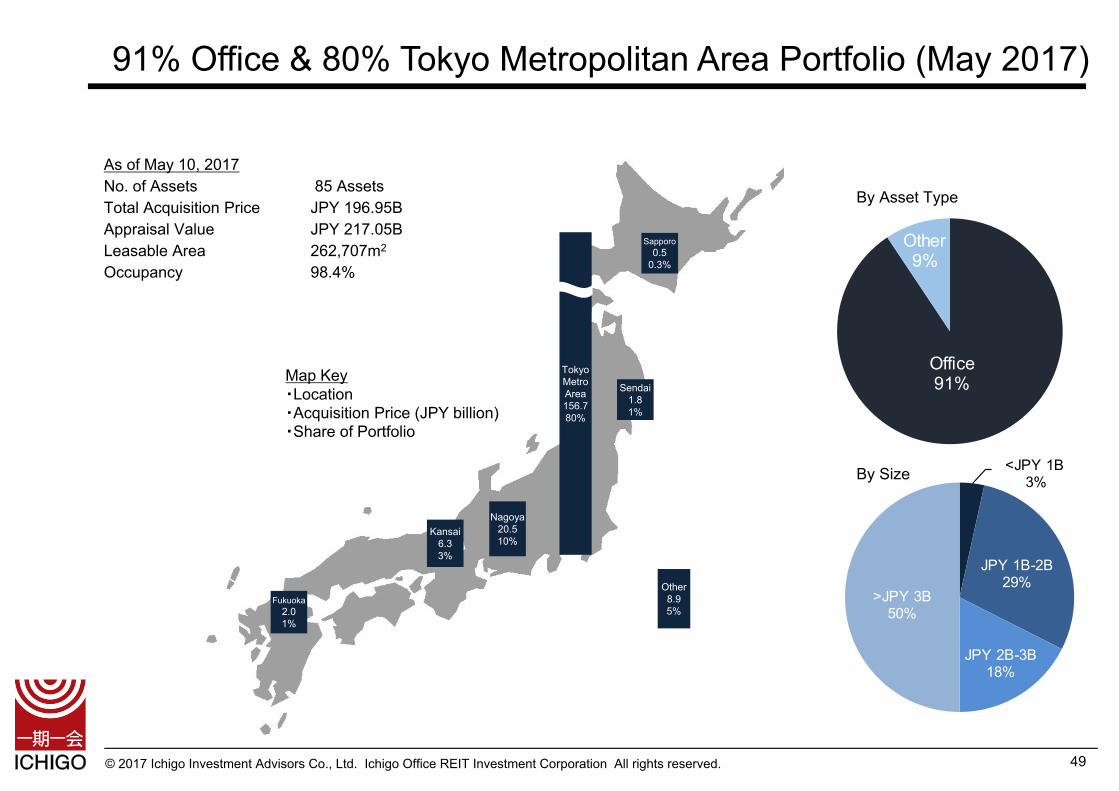
<JPY 1B3%
JPY 1B-2B29%
JPY 2B-3B18%
>JPY 3B50%
Kansai6.33%
Sapporo0.5
0.3%
Nagoya20.510%
Fukuoka2.01%
Other8.95%
TokyoMetroArea156.780%
Sendai1.81%
By Asset Type
By Size
49
91% Office & 80% Tokyo Metropolitan Area Portfolio (May 2017)
Map Key・Location・Acquisition Price (JPY billion)・Share of Portfolio
As of May 10, 2017No. of Assets 85 AssetsTotal Acquisition Price JPY 196.95BAppraisal Value JPY 217.05BLeasable Area 262,707m2
Occupancy 98.4%
Office91%
Other9%
© 2017 Ichigo Investment Advisors Co., Ltd. Ichigo Office REIT Investment Corporation All rights reserved.
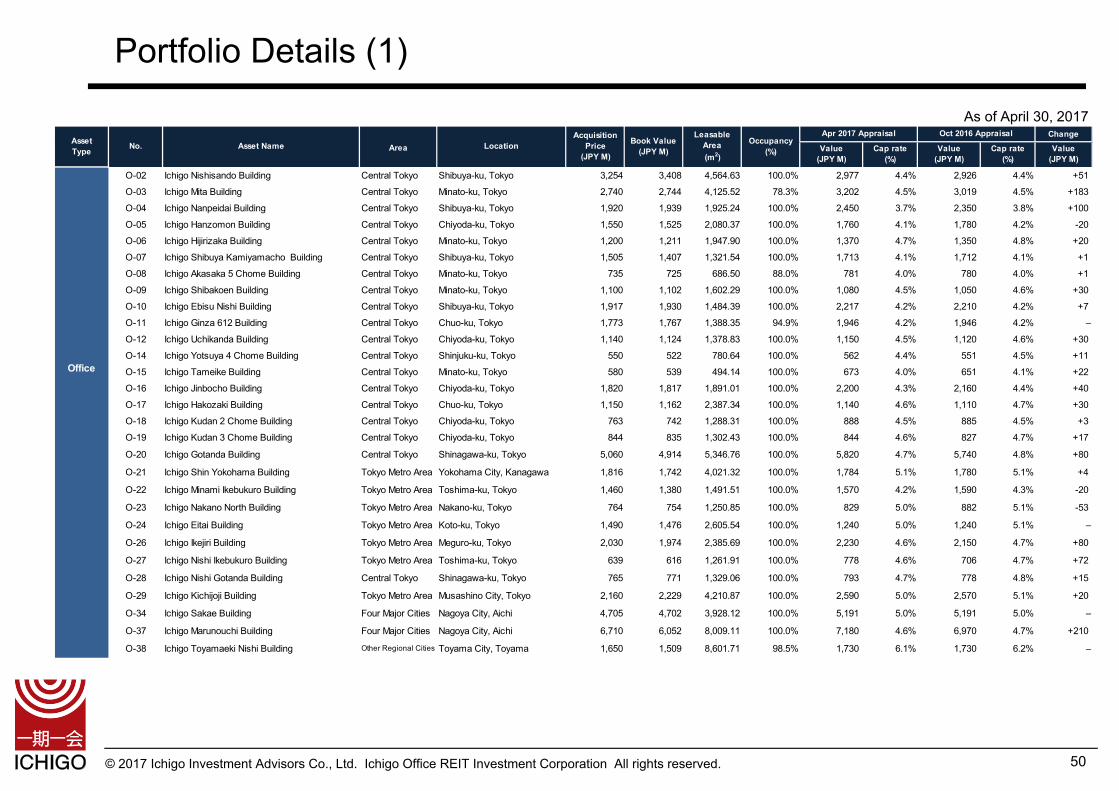
Portfolio Details (1)
50
As of April 30, 2017Change
Area
O-02 Ichigo Nishisando Building Central Tokyo Shibuya-ku, Tokyo 3,254 3,408 4,564.63 100.0% 2,977 4.4% 2,926 4.4% +51
O-03 Ichigo Mita Building Central Tokyo Minato-ku, Tokyo 2,740 2,744 4,125.52 78.3% 3,202 4.5% 3,019 4.5% +183
O-04 Ichigo Nanpeidai Building Central Tokyo Shibuya-ku, Tokyo 1,920 1,939 1,925.24 100.0% 2,450 3.7% 2,350 3.8% +100
O-05 Ichigo Hanzomon Building Central Tokyo Chiyoda-ku, Tokyo 1,550 1,525 2,080.37 100.0% 1,760 4.1% 1,780 4.2% -20
O-06 Ichigo Hijirizaka Building Central Tokyo Minato-ku, Tokyo 1,200 1,211 1,947.90 100.0% 1,370 4.7% 1,350 4.8% +20
O-07 Ichigo Shibuya Kamiyamacho Building Central Tokyo Shibuya-ku, Tokyo 1,505 1,407 1,321.54 100.0% 1,713 4.1% 1,712 4.1% +1
O-08 Ichigo Akasaka 5 Chome Building Central Tokyo Minato-ku, Tokyo 735 725 686.50 88.0% 781 4.0% 780 4.0% +1
O-09 Ichigo Shibakoen Building Central Tokyo Minato-ku, Tokyo 1,100 1,102 1,602.29 100.0% 1,080 4.5% 1,050 4.6% +30
O-10 Ichigo Ebisu Nishi Building Central Tokyo Shibuya-ku, Tokyo 1,917 1,930 1,484.39 100.0% 2,217 4.2% 2,210 4.2% +7
O-11 Ichigo Ginza 612 Building Central Tokyo Chuo-ku, Tokyo 1,773 1,767 1,388.35 94.9% 1,946 4.2% 1,946 4.2% –
O-12 Ichigo Uchikanda Building Central Tokyo Chiyoda-ku, Tokyo 1,140 1,124 1,378.83 100.0% 1,150 4.5% 1,120 4.6% +30
O-14 Ichigo Yotsuya 4 Chome Building Central Tokyo Shinjuku-ku, Tokyo 550 522 780.64 100.0% 562 4.4% 551 4.5% +11
O-15 Ichigo Tameike Building Central Tokyo Minato-ku, Tokyo 580 539 494.14 100.0% 673 4.0% 651 4.1% +22
O-16 Ichigo Jinbocho Building Central Tokyo Chiyoda-ku, Tokyo 1,820 1,817 1,891.01 100.0% 2,200 4.3% 2,160 4.4% +40
O-17 Ichigo Hakozaki Building Central Tokyo Chuo-ku, Tokyo 1,150 1,162 2,387.34 100.0% 1,140 4.6% 1,110 4.7% +30
O-18 Ichigo Kudan 2 Chome Building Central Tokyo Chiyoda-ku, Tokyo 763 742 1,288.31 100.0% 888 4.5% 885 4.5% +3
O-19 Ichigo Kudan 3 Chome Building Central Tokyo Chiyoda-ku, Tokyo 844 835 1,302.43 100.0% 844 4.6% 827 4.7% +17
O-20 Ichigo Gotanda Building Central Tokyo Shinagawa-ku, Tokyo 5,060 4,914 5,346.76 100.0% 5,820 4.7% 5,740 4.8% +80
O-21 Ichigo Shin Yokohama Building Tokyo Metro Area Yokohama City, Kanagawa 1,816 1,742 4,021.32 100.0% 1,784 5.1% 1,780 5.1% +4
O-22 Ichigo Minami Ikebukuro Building Tokyo Metro Area Toshima-ku, Tokyo 1,460 1,380 1,491.51 100.0% 1,570 4.2% 1,590 4.3% -20
O-23 Ichigo Nakano North Building Tokyo Metro Area Nakano-ku, Tokyo 764 754 1,250.85 100.0% 829 5.0% 882 5.1% -53
O-24 Ichigo Eitai Building Tokyo Metro Area Koto-ku, Tokyo 1,490 1,476 2,605.54 100.0% 1,240 5.0% 1,240 5.1% –
O-26 Ichigo Ikejiri Building Tokyo Metro Area Meguro-ku, Tokyo 2,030 1,974 2,385.69 100.0% 2,230 4.6% 2,150 4.7% +80
O-27 Ichigo Nishi Ikebukuro Building Tokyo Metro Area Toshima-ku, Tokyo 639 616 1,261.91 100.0% 778 4.6% 706 4.7% +72
O-28 Ichigo Nishi Gotanda Building Central Tokyo Shinagawa-ku, Tokyo 765 771 1,329.06 100.0% 793 4.7% 778 4.8% +15
O-29 Ichigo Kichijoji Building Tokyo Metro Area Musashino City, Tokyo 2,160 2,229 4,210.87 100.0% 2,590 5.0% 2,570 5.1% +20
O-34 Ichigo Sakae Building Four Major Cities Nagoya City, Aichi 4,705 4,702 3,928.12 100.0% 5,191 5.0% 5,191 5.0% –
O-37 Ichigo Marunouchi Building Four Major Cities Nagoya City, Aichi 6,710 6,052 8,009.11 100.0% 7,180 4.6% 6,970 4.7% +210
O-38 Ichigo Toyamaeki Nishi Building Other Regional Cities Toyama City, Toyama 1,650 1,509 8,601.71 98.5% 1,730 6.1% 1,730 6.2% –
Value(JPY M)
AssetType No. Asset Name Location
AcquisitionPrice
(JPY M)
Book Value(JPY M)
LeasableArea(m2)
Occupancy(%)
Apr 2017 Appraisal Oct 2016 Appraisal
Value(JPY M)
Cap rate(%)
Value(JPY M)
Cap rate(%)
Office
© 2017 Ichigo Investment Advisors Co., Ltd. Ichigo Office REIT Investment Corporation All rights reserved.
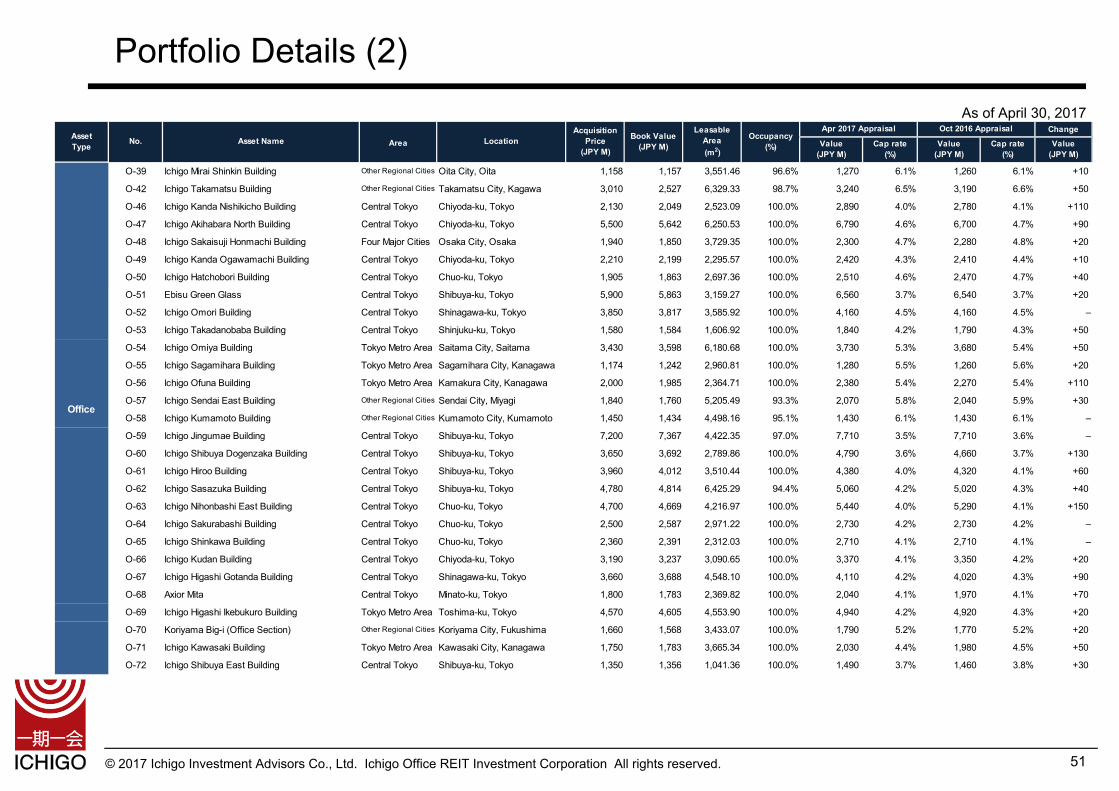
Portfolio Details (2)
51
As of April 30, 2017Change
Area
O-39 Ichigo Mirai Shinkin Building Other Regional Cities Oita City, Oita 1,158 1,157 3,551.46 96.6% 1,270 6.1% 1,260 6.1% +10
O-42 Ichigo Takamatsu Building Other Regional Cities Takamatsu City, Kagawa 3,010 2,527 6,329.33 98.7% 3,240 6.5% 3,190 6.6% +50
O-46 Ichigo Kanda Nishikicho Building Central Tokyo Chiyoda-ku, Tokyo 2,130 2,049 2,523.09 100.0% 2,890 4.0% 2,780 4.1% +110
O-47 Ichigo Akihabara North Building Central Tokyo Chiyoda-ku, Tokyo 5,500 5,642 6,250.53 100.0% 6,790 4.6% 6,700 4.7% +90
O-48 Ichigo Sakaisuji Honmachi Building Four Major Cities Osaka City, Osaka 1,940 1,850 3,729.35 100.0% 2,300 4.7% 2,280 4.8% +20
O-49 Ichigo Kanda Ogawamachi Building Central Tokyo Chiyoda-ku, Tokyo 2,210 2,199 2,295.57 100.0% 2,420 4.3% 2,410 4.4% +10
O-50 Ichigo Hatchobori Building Central Tokyo Chuo-ku, Tokyo 1,905 1,863 2,697.36 100.0% 2,510 4.6% 2,470 4.7% +40
O-51 Ebisu Green Glass Central Tokyo Shibuya-ku, Tokyo 5,900 5,863 3,159.27 100.0% 6,560 3.7% 6,540 3.7% +20
O-52 Ichigo Omori Building Central Tokyo Shinagawa-ku, Tokyo 3,850 3,817 3,585.92 100.0% 4,160 4.5% 4,160 4.5% –
O-53 Ichigo Takadanobaba Building Central Tokyo Shinjuku-ku, Tokyo 1,580 1,584 1,606.92 100.0% 1,840 4.2% 1,790 4.3% +50
O-54 Ichigo Omiya Building Tokyo Metro Area Saitama City, Saitama 3,430 3,598 6,180.68 100.0% 3,730 5.3% 3,680 5.4% +50
O-55 Ichigo Sagamihara Building Tokyo Metro Area Sagamihara City, Kanagawa 1,174 1,242 2,960.81 100.0% 1,280 5.5% 1,260 5.6% +20
O-56 Ichigo Ofuna Building Tokyo Metro Area Kamakura City, Kanagawa 2,000 1,985 2,364.71 100.0% 2,380 5.4% 2,270 5.4% +110
O-57 Ichigo Sendai East Building Other Regional Cities Sendai City, Miyagi 1,840 1,760 5,205.49 93.3% 2,070 5.8% 2,040 5.9% +30
O-58 Ichigo Kumamoto Building Other Regional Cities Kumamoto City, Kumamoto 1,450 1,434 4,498.16 95.1% 1,430 6.1% 1,430 6.1% –
O-59 Ichigo Jingumae Building Central Tokyo Shibuya-ku, Tokyo 7,200 7,367 4,422.35 97.0% 7,710 3.5% 7,710 3.6% –
O-60 Ichigo Shibuya Dogenzaka Building Central Tokyo Shibuya-ku, Tokyo 3,650 3,692 2,789.86 100.0% 4,790 3.6% 4,660 3.7% +130
O-61 Ichigo Hiroo Building Central Tokyo Shibuya-ku, Tokyo 3,960 4,012 3,510.44 100.0% 4,380 4.0% 4,320 4.1% +60
O-62 Ichigo Sasazuka Building Central Tokyo Shibuya-ku, Tokyo 4,780 4,814 6,425.29 94.4% 5,060 4.2% 5,020 4.3% +40
O-63 Ichigo Nihonbashi East Building Central Tokyo Chuo-ku, Tokyo 4,700 4,669 4,216.97 100.0% 5,440 4.0% 5,290 4.1% +150
O-64 Ichigo Sakurabashi Building Central Tokyo Chuo-ku, Tokyo 2,500 2,587 2,971.22 100.0% 2,730 4.2% 2,730 4.2% –
O-65 Ichigo Shinkawa Building Central Tokyo Chuo-ku, Tokyo 2,360 2,391 2,312.03 100.0% 2,710 4.1% 2,710 4.1% –
O-66 Ichigo Kudan Building Central Tokyo Chiyoda-ku, Tokyo 3,190 3,237 3,090.65 100.0% 3,370 4.1% 3,350 4.2% +20
O-67 Ichigo Higashi Gotanda Building Central Tokyo Shinagawa-ku, Tokyo 3,660 3,688 4,548.10 100.0% 4,110 4.2% 4,020 4.3% +90
O-68 Axior Mita Central Tokyo Minato-ku, Tokyo 1,800 1,783 2,369.82 100.0% 2,040 4.1% 1,970 4.1% +70
O-69 Ichigo Higashi Ikebukuro Building Tokyo Metro Area Toshima-ku, Tokyo 4,570 4,605 4,553.90 100.0% 4,940 4.2% 4,920 4.3% +20
O-70 Koriyama Big-i (Office Section) Other Regional Cities Koriyama City, Fukushima 1,660 1,568 3,433.07 100.0% 1,790 5.2% 1,770 5.2% +20
O-71 Ichigo Kawasaki Building Tokyo Metro Area Kawasaki City, Kanagawa 1,750 1,783 3,665.34 100.0% 2,030 4.4% 1,980 4.5% +50
O-72 Ichigo Shibuya East Building Central Tokyo Shibuya-ku, Tokyo 1,350 1,356 1,041.36 100.0% 1,490 3.7% 1,460 3.8% +30
Value(JPY M)
AssetType No. Asset Name Location
AcquisitionPrice
(JPY M)
Book Value(JPY M)
LeasableArea(m2)
Occupancy(%)
Office
Apr 2017 Appraisal Oct 2016 Appraisal
Value(JPY M)
Cap rate(%)
Value(JPY M)
Cap rate(%)
© 2017 Ichigo Investment Advisors Co., Ltd. Ichigo Office REIT Investment Corporation All rights reserved.
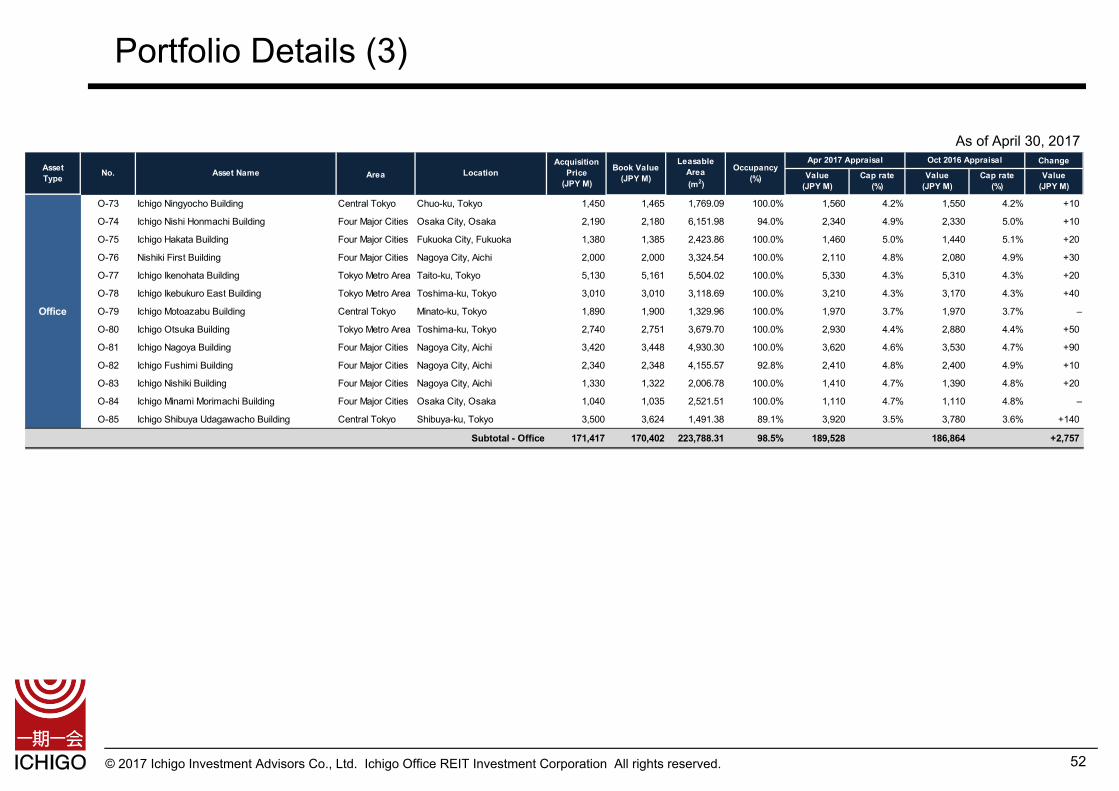
Portfolio Details (3)
52
As of April 30, 2017Change
Area
O-73 Ichigo Ningyocho Building Central Tokyo Chuo-ku, Tokyo 1,450 1,465 1,769.09 100.0% 1,560 4.2% 1,550 4.2% +10
O-74 Ichigo Nishi Honmachi Building Four Major Cities Osaka City, Osaka 2,190 2,180 6,151.98 94.0% 2,340 4.9% 2,330 5.0% +10
O-75 Ichigo Hakata Building Four Major Cities Fukuoka City, Fukuoka 1,380 1,385 2,423.86 100.0% 1,460 5.0% 1,440 5.1% +20
O-76 Nishiki First Building Four Major Cities Nagoya City, Aichi 2,000 2,000 3,324.54 100.0% 2,110 4.8% 2,080 4.9% +30
O-77 Ichigo Ikenohata Building Tokyo Metro Area Taito-ku, Tokyo 5,130 5,161 5,504.02 100.0% 5,330 4.3% 5,310 4.3% +20
O-78 Ichigo Ikebukuro East Building Tokyo Metro Area Toshima-ku, Tokyo 3,010 3,010 3,118.69 100.0% 3,210 4.3% 3,170 4.3% +40
O-79 Ichigo Motoazabu Building Central Tokyo Minato-ku, Tokyo 1,890 1,900 1,329.96 100.0% 1,970 3.7% 1,970 3.7% –
O-80 Ichigo Otsuka Building Tokyo Metro Area Toshima-ku, Tokyo 2,740 2,751 3,679.70 100.0% 2,930 4.4% 2,880 4.4% +50
O-81 Ichigo Nagoya Building Four Major Cities Nagoya City, Aichi 3,420 3,448 4,930.30 100.0% 3,620 4.6% 3,530 4.7% +90
O-82 Ichigo Fushimi Building Four Major Cities Nagoya City, Aichi 2,340 2,348 4,155.57 92.8% 2,410 4.8% 2,400 4.9% +10
O-83 Ichigo Nishiki Building Four Major Cities Nagoya City, Aichi 1,330 1,322 2,006.78 100.0% 1,410 4.7% 1,390 4.8% +20
O-84 Ichigo Minami Morimachi Building Four Major Cities Osaka City, Osaka 1,040 1,035 2,521.51 100.0% 1,110 4.7% 1,110 4.8% –
O-85 Ichigo Shibuya Udagawacho Building Central Tokyo Shibuya-ku, Tokyo 3,500 3,624 1,491.38 89.1% 3,920 3.5% 3,780 3.6% +140
Subtotal - Office 171,417 170,402 223,788.31 98.5% 189,528 186,864 +2,757
Office
Cap rate(%)
AssetType No. Asset Name Location
AcquisitionPrice
(JPY M)
Book Value(JPY M)
LeasableArea(m2)
Occupancy(%) Value
(JPY M)
Apr 2017 Appraisal Oct 2016 Appraisal
Value(JPY M)
Cap rate(%)
Value(JPY M)
© 2017 Ichigo Investment Advisors Co., Ltd. Ichigo Office REIT Investment Corporation All rights reserved.
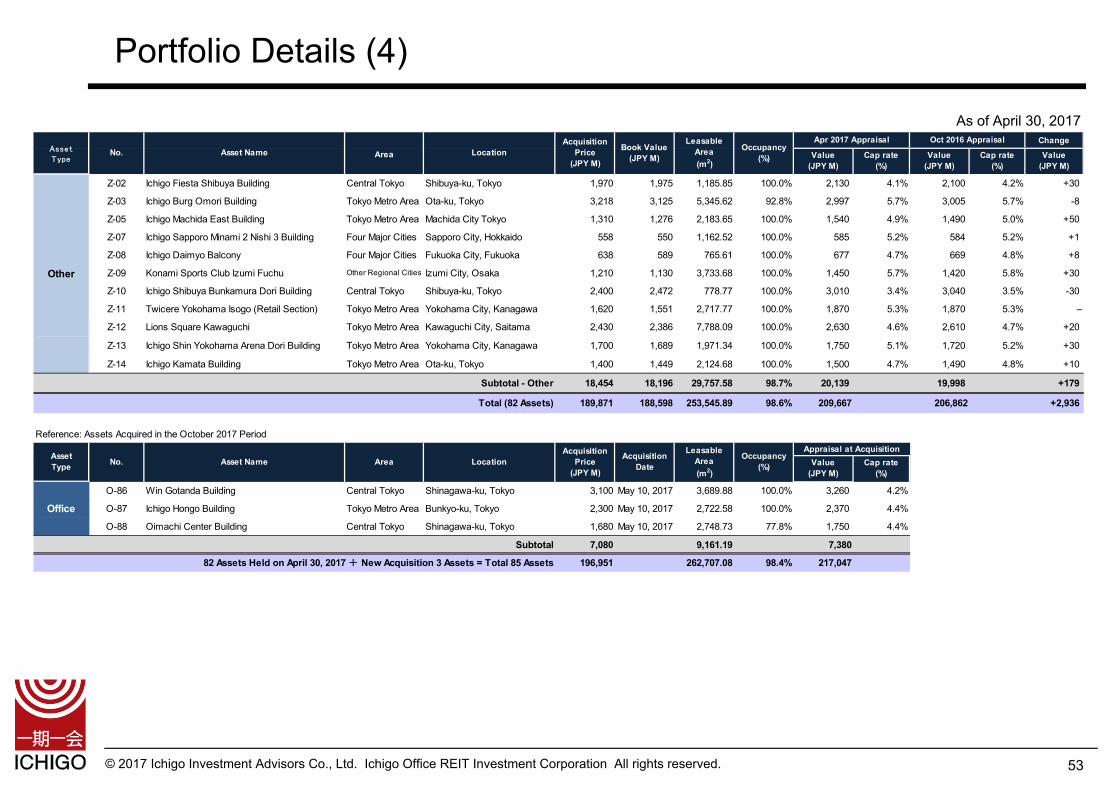
Portfolio Details (4)
53
As of April 30, 2017Change
Area
Z-02 Ichigo Fiesta Shibuya Building Central Tokyo Shibuya-ku, Tokyo 1,970 1,975 1,185.85 100.0% 2,130 4.1% 2,100 4.2% +30
Z-03 Ichigo Burg Omori Building Tokyo Metro Area Ota-ku, Tokyo 3,218 3,125 5,345.62 92.8% 2,997 5.7% 3,005 5.7% -8
Z-05 Ichigo Machida East Building Tokyo Metro Area Machida City Tokyo 1,310 1,276 2,183.65 100.0% 1,540 4.9% 1,490 5.0% +50
Z-07 Ichigo Sapporo Minami 2 Nishi 3 Building Four Major Cities Sapporo City, Hokkaido 558 550 1,162.52 100.0% 585 5.2% 584 5.2% +1
Z-08 Ichigo Daimyo Balcony Four Major Cities Fukuoka City, Fukuoka 638 589 765.61 100.0% 677 4.7% 669 4.8% +8
Z-09 Konami Sports Club Izumi Fuchu Other Regional Cities Izumi City, Osaka 1,210 1,130 3,733.68 100.0% 1,450 5.7% 1,420 5.8% +30
Z-10 Ichigo Shibuya Bunkamura Dori Building Central Tokyo Shibuya-ku, Tokyo 2,400 2,472 778.77 100.0% 3,010 3.4% 3,040 3.5% -30
Z-11 Twicere Yokohama Isogo (Retail Section) Tokyo Metro Area Yokohama City, Kanagawa 1,620 1,551 2,717.77 100.0% 1,870 5.3% 1,870 5.3% –
Z-12 Lions Square Kawaguchi Tokyo Metro Area Kawaguchi City, Saitama 2,430 2,386 7,788.09 100.0% 2,630 4.6% 2,610 4.7% +20
Z-13 Ichigo Shin Yokohama Arena Dori Building Tokyo Metro Area Yokohama City, Kanagawa 1,700 1,689 1,971.34 100.0% 1,750 5.1% 1,720 5.2% +30
Z-14 Ichigo Kamata Building Tokyo Metro Area Ota-ku, Tokyo 1,400 1,449 2,124.68 100.0% 1,500 4.7% 1,490 4.8% +10
Subtotal - Other 18,454 18,196 29,757.58 98.7% 20,139 19,998 +179
Total (82 Assets) 189,871 188,598 253,545.89 98.6% 209,667 206,862 +2,936
Reference: Assets Acquired in the October 2017 Period
O-86 Win Gotanda Building Central Tokyo Shinagawa-ku, Tokyo 3,100 May 10, 2017 3,689.88 100.0% 3,260 4.2%
O-87 Ichigo Hongo Building Tokyo Metro Area Bunkyo-ku, Tokyo 2,300 May 10, 2017 2,722.58 100.0% 2,370 4.4%
O-88 Oimachi Center Building Central Tokyo Shinagawa-ku, Tokyo 1,680 May 10, 2017 2,748.73 77.8% 1,750 4.4%
Subtotal 7,080 9,161.19 7,380
82 Assets Held on April 30, 2017 + New Acquisition 3 Assets = Total 85 Assets 196,951 262,707.08 98.4% 217,047
Value(JPY M)
Cap rate(%)
AssetType
No. Asset Name LocationAcquisition
Price(JPY M)
Book Value(JPY M) Value
(JPY M)
Other
AssetType No. Asset Name Area Location
AcquisitionPrice
(JPY M)
AcquisitionDate
LeasableArea(m2)
LeasableArea(m2)
Occupancy(%)
Apr 2017 Appraisal Oct 2016 Appraisal
Value(JPY M)
Cap rate(%)
Occupancy(%)
Appraisal at AcquisitionValue
(JPY M)Cap rate
(%)
Office
© 2017 Ichigo Investment Advisors Co., Ltd. Ichigo Office REIT Investment Corporation All rights reserved.
0
10,000
20,000
30,000
40,000
50,000
0
20,000
40,000
60,000
80,000
100,000
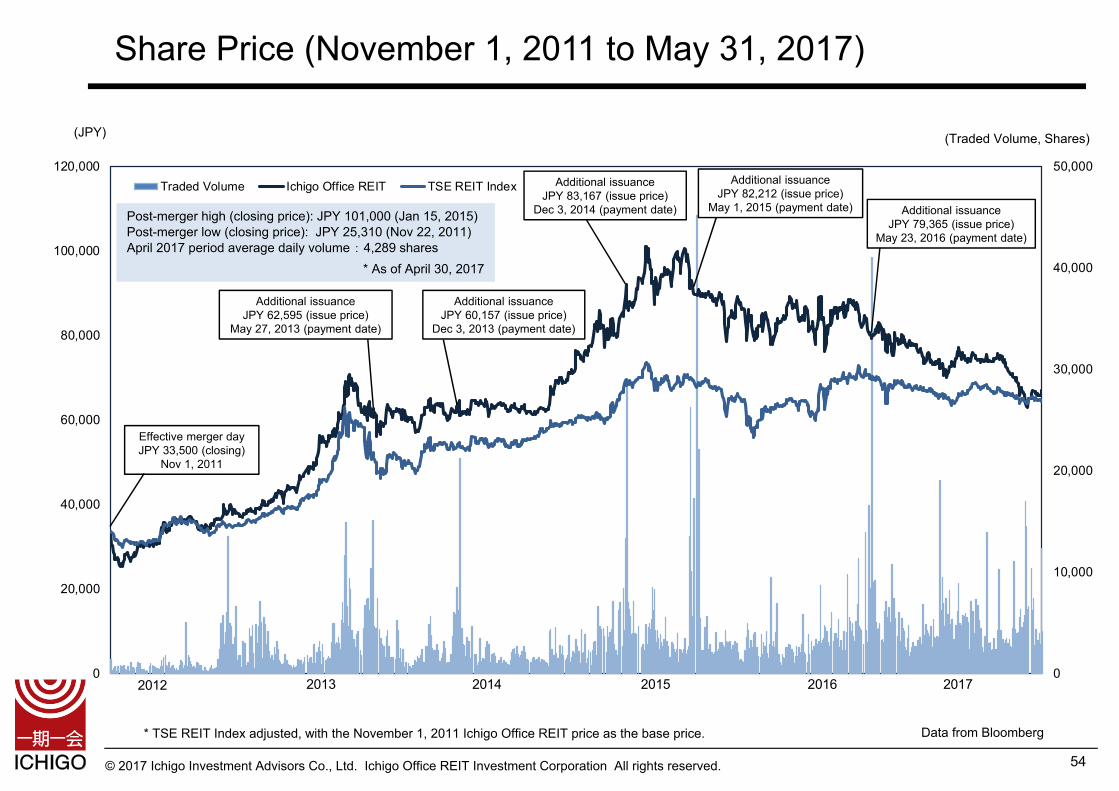
120,000Traded Volume Ichigo Office REIT TSE REIT Index
2012 2013 2014 2015 2016 2017
Share Price (November 1, 2011 to May 31, 2017)
54
* TSE REIT Index adjusted, with the November 1, 2011 Ichigo Office REIT price as the base price. Data from Bloomberg
Additional issuanceJPY 79,365 (issue price)
May 23, 2016 (payment date)
Additional issuanceJPY 82,212 (issue price)
May 1, 2015 (payment date)
Additional issuanceJPY 83,167 (issue price)
Dec 3, 2014 (payment date)
Additional issuanceJPY 60,157 (issue price)
Dec 3, 2013 (payment date)
Additional issuance JPY 62,595 (issue price)
May 27, 2013 (payment date)
Effective merger day JPY 33,500 (closing)
Nov 1, 2011
Post-merger high (closing price): JPY 101,000 (Jan 15, 2015)Post-merger low (closing price): JPY 25,310 (Nov 22, 2011)April 2017 period average daily volume : 4,289 shares
* As of April 30, 2017
(JPY) (Traded Volume, Shares)
© 2017 Ichigo Investment Advisors Co., Ltd. Ichigo Office REIT Investment Corporation All rights reserved.
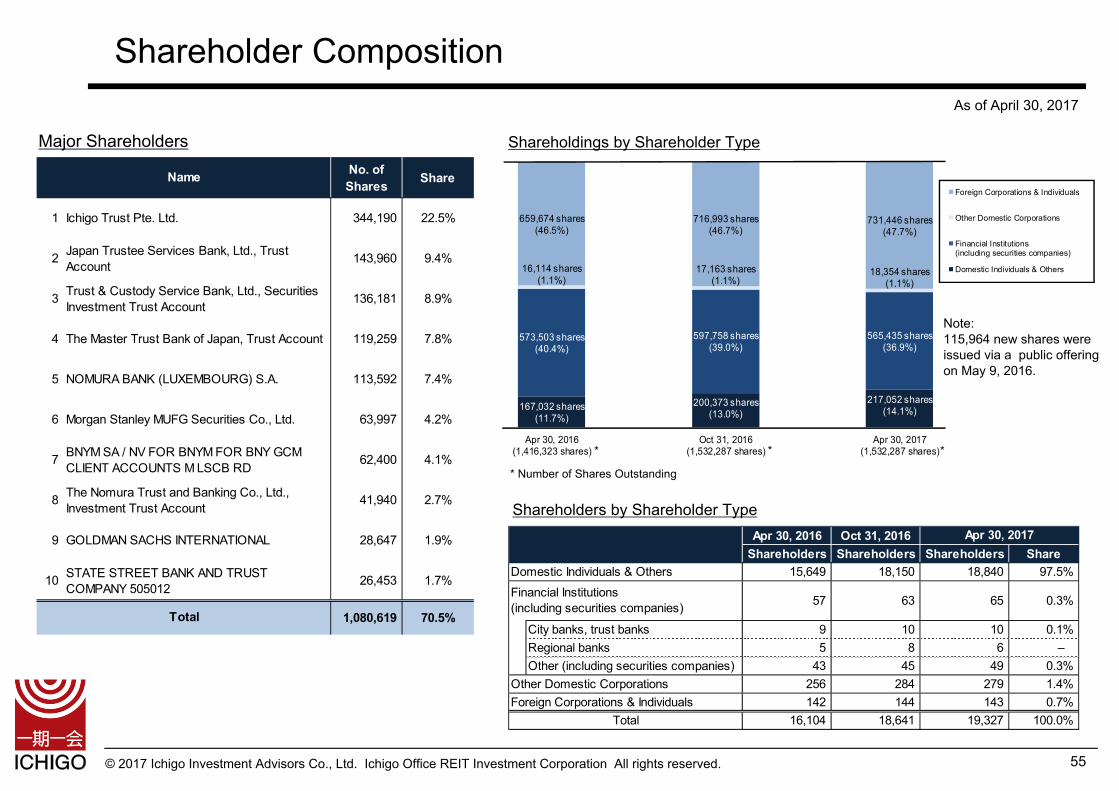
167,032 shares(11.7%)
200,373 shares(13.0%)
217,052 shares(14.1%)
573,503 shares(40.4%)
597,758 shares(39.0%)
565,435 shares(36.9%)
16,114 shares(1.1%)
17,163 shares(1.1%)
18,354 shares(1.1%)
659,674 shares(46.5%)
716,993 shares(46.7%)
731,446 shares(47.7%)
Apr 30, 2016(1,416,323 shares)
Oct 31, 2016(1,532,287 shares)
Apr 30, 2017(1,532,287 shares)
Foreign Corporations & Individuals
Other Domestic Corporations
Financial Institutions(including securities companies)
Domestic Individuals & Others
Shareholder Composition
Major Shareholders Shareholdings by Shareholder Type
Shareholders by Shareholder Type
55
As of April 30, 2017
Note: 115,964 new shares wereissued via a public offering on May 9, 2016.
* Number of Shares Outstanding
Apr 30, 2016 Oct 31, 2016Shareholders Shareholders Shareholders Share
Domestic Individuals & Others 15,649 18,150 18,840 97.5%
57 63 65 0.3%
City banks, trust banks 9 10 10 0.1% Regional banks 5 8 6 –Other (including securities companies) 43 45 49 0.3%
Other Domestic Corporations 256 284 279 1.4% Foreign Corporations & Individuals 142 144 143 0.7%
16,104 18,641 19,327 100.0% Total
Apr 30, 2017
Financial Institutions(including securities companies)
* * *
No. ofShares Share
1 Ichigo Trust Pte. Ltd. 344,190 22.5%
2 Japan Trustee Services Bank, Ltd., TrustAccount 143,960 9.4%
3 Trust & Custody Service Bank, Ltd., SecuritiesInvestment Trust Account 136,181 8.9%
4 The Master Trust Bank of Japan, Trust Account 119,259 7.8%
5 NOMURA BANK (LUXEMBOURG) S.A. 113,592 7.4%
6 Morgan Stanley MUFG Securities Co., Ltd. 63,997 4.2%
7 BNYM SA / NV FOR BNYM FOR BNY GCMCLIENT ACCOUNTS M LSCB RD 62,400 4.1%
8 The Nomura Trust and Banking Co., Ltd.,Investment Trust Account 41,940 2.7%
9 GOLDMAN SACHS INTERNATIONAL 28,647 1.9%
10 STATE STREET BANK AND TRUSTCOMPANY 505012 26,453 1.7%
1,080,619 70.5%
Name
Total

© 2017 Ichigo Investment Advisors Co., Ltd. Ichigo Office REIT Investment Corporation All rights reserved.
Appendix: About Ichigo Office REIT
56
© 2017 Ichigo Investment Advisors Co., Ltd. Ichigo Office REIT Investment Corporation All rights reserved.
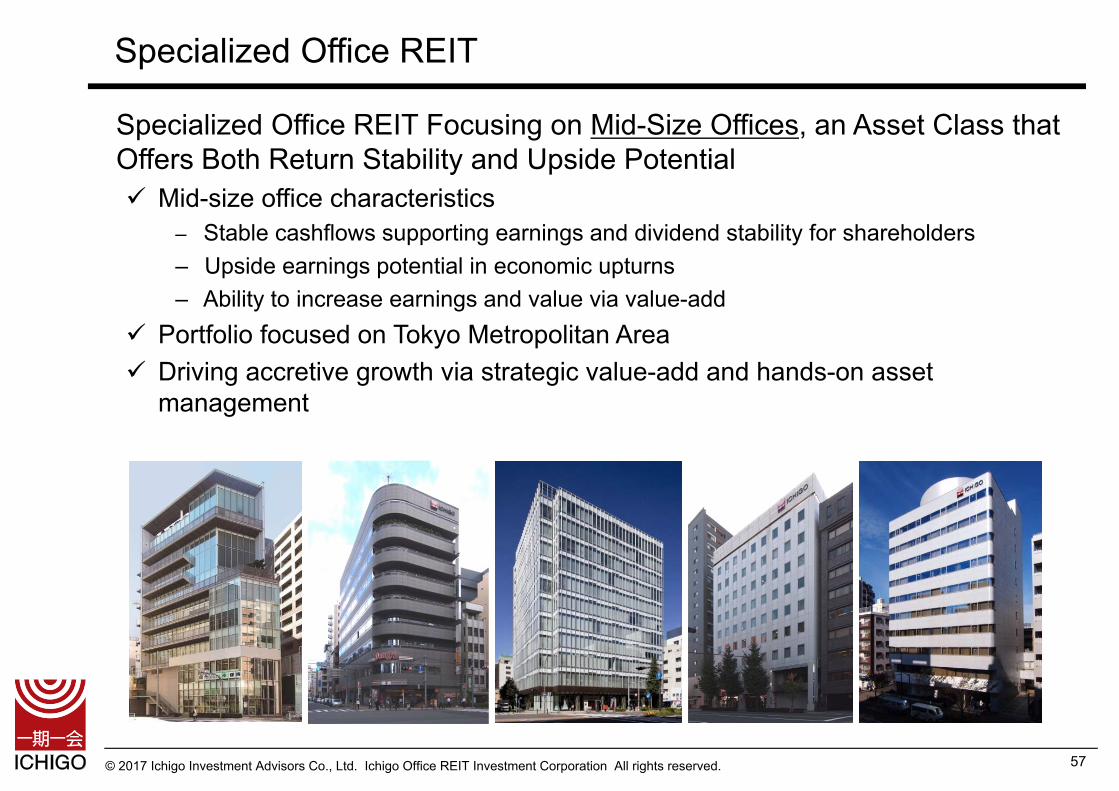
Specialized Office REIT
57
Specialized Office REIT Focusing on Mid-Size Offices, an Asset Class that Offers Both Return Stability and Upside Potential Mid-size office characteristics
‒ Stable cashflows supporting earnings and dividend stability for shareholders‒ Upside earnings potential in economic upturns‒ Ability to increase earnings and value via value-add
Portfolio focused on Tokyo Metropolitan Area Driving accretive growth via strategic value-add and hands-on asset
management

© 2017 Ichigo Investment Advisors Co., Ltd. Ichigo Office REIT Investment Corporation All rights reserved.
No. of AssetsAcquisition
Sale
JCR Credit RatingA-
StrategicRestructuring
Accretive PO Accretive PO Accretive PO Accretive PO
Transition to PureOffice REIT
Events
MergerComprehensive
Refinancing Accretive PO
4 1 4
StrategicRestructuring
De-Collateralization
of All Loans
Total Assets
34 1 1 1 1 1 16 1
11 13 13 11 3 465 77 73 85 82 85
October2016
April2017
October2017
April2015
October2015
April2016
71 67 67 66 68 71 70
October2013
April2014
October2014
Stage VI
Foundation for Growth Accretive Growth Cycle Enhance Profitability Increase Size & Scale Lay Foundation for SustainableDividend Growth
Lay Foundation forLong-Term Growth
Stage I Stage II Stage III Stage IV Stage V
MergerNov 1, 2011
April2012
October2012
April2013
JPY 107.9B
OfficeJPY 74.3B
JPY 104.8B
OfficeJPY 71.1B
JPY 106.1B
OfficeJPY 72.4B
JPY 104.3B
OfficeJPY 70.6B
JPY 112.3B
OfficeJPY 77.5B
JPY 114.3B
OfficeJPY 75.5B
JPY 114.0B
OfficeJPY 75.1B
JPY 123.3B
OfficeJPY 95.8B
JPY 165.6B
OfficeJPY 141.6B
JPY 162.7B
OfficeJPY 139.6B
JPY 191.0B
OfficeJPY 167.9B
JPY 189.8B
OfficeJPY 171.4B
JPY 196.9B
OfficeJPY 178.4B
58
Historic Operating Results and Current Targets
As of May 31, 2017
© 2017 Ichigo Investment Advisors Co., Ltd. Ichigo Office REIT Investment Corporation All rights reserved.
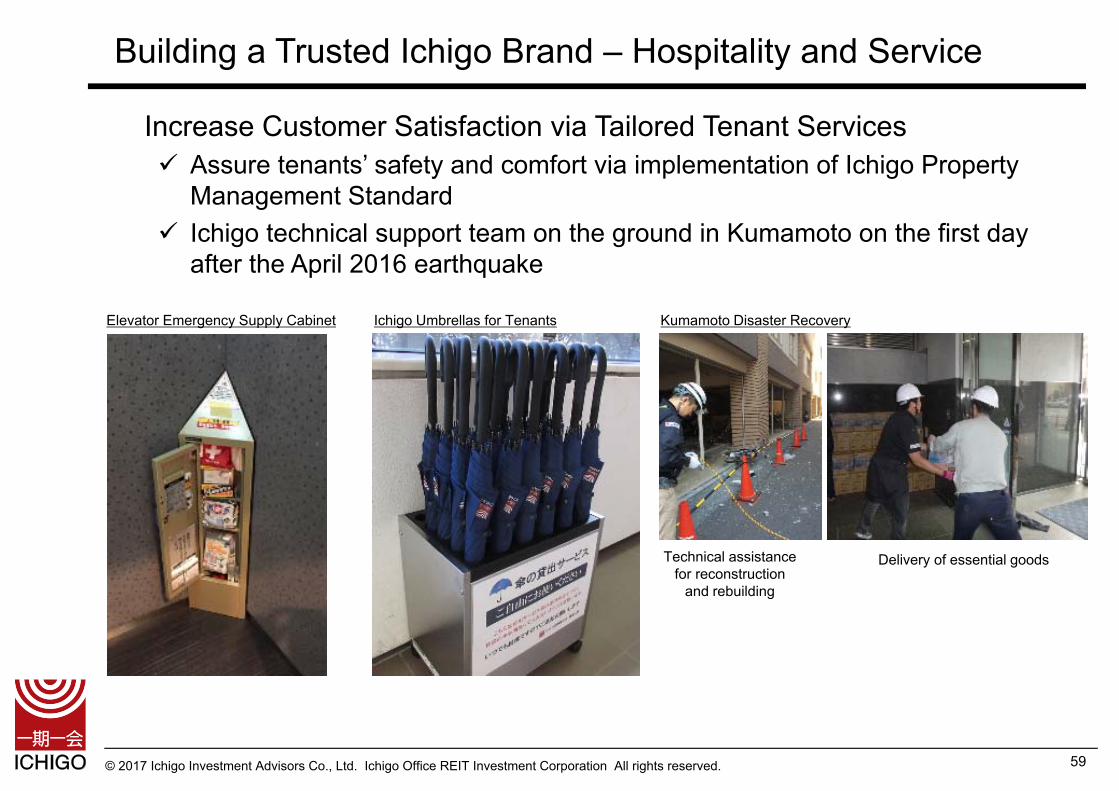
Building a Trusted Ichigo Brand – Hospitality and Service
59
Increase Customer Satisfaction via Tailored Tenant Services Assure tenants’ safety and comfort via implementation of Ichigo Property
Management Standard Ichigo technical support team on the ground in Kumamoto on the first day
after the April 2016 earthquake
Elevator Emergency Supply Cabinet Ichigo Umbrellas for Tenants
Technical assistance for reconstruction
and rebuilding
Delivery of essential goods
Kumamoto Disaster Recovery
© 2017 Ichigo Investment Advisors Co., Ltd. Ichigo Office REIT Investment Corporation All rights reserved.
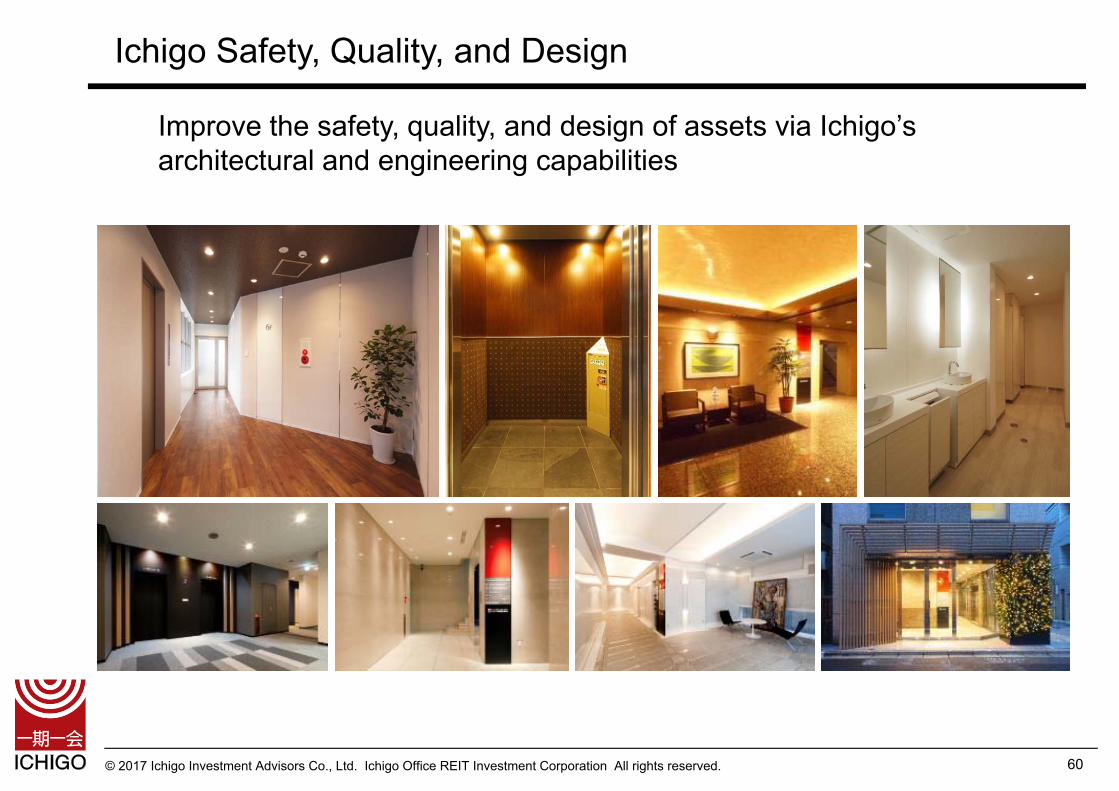
Ichigo Safety, Quality, and Design
Improve the safety, quality, and design of assets via Ichigo’s architectural and engineering capabilities
60
© 2017 Ichigo Investment Advisors Co., Ltd. Ichigo Office REIT Investment Corporation All rights reserved. 61
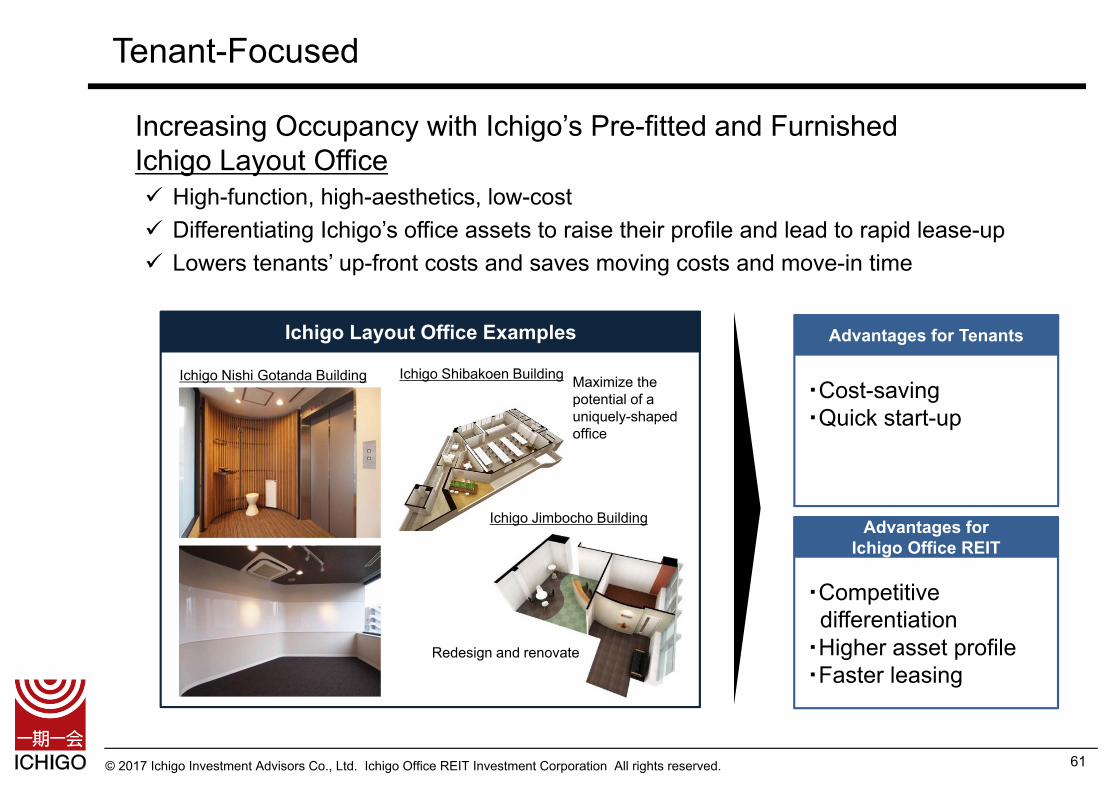
Increasing Occupancy with Ichigo’s Pre-fitted and Furnished Ichigo Layout Office High-function, high-aesthetics, low-cost Differentiating Ichigo’s office assets to raise their profile and lead to rapid lease-up Lowers tenants’ up-front costs and saves moving costs and move-in time
Tenant-Focused
Ichigo Layout Office Examples Advantages for Tenants
・Cost-saving・Quick start-up
Advantages forIchigo Office REIT
・Competitive differentiation
・Higher asset profile・Faster leasing
Ichigo Nishi Gotanda Building
Ichigo Jimbocho Building
Maximize the potential of a uniquely-shaped office
Redesign and renovate
Ichigo Shibakoen Building
© 2017 Ichigo Investment Advisors Co., Ltd. Ichigo Office REIT Investment Corporation All rights reserved.
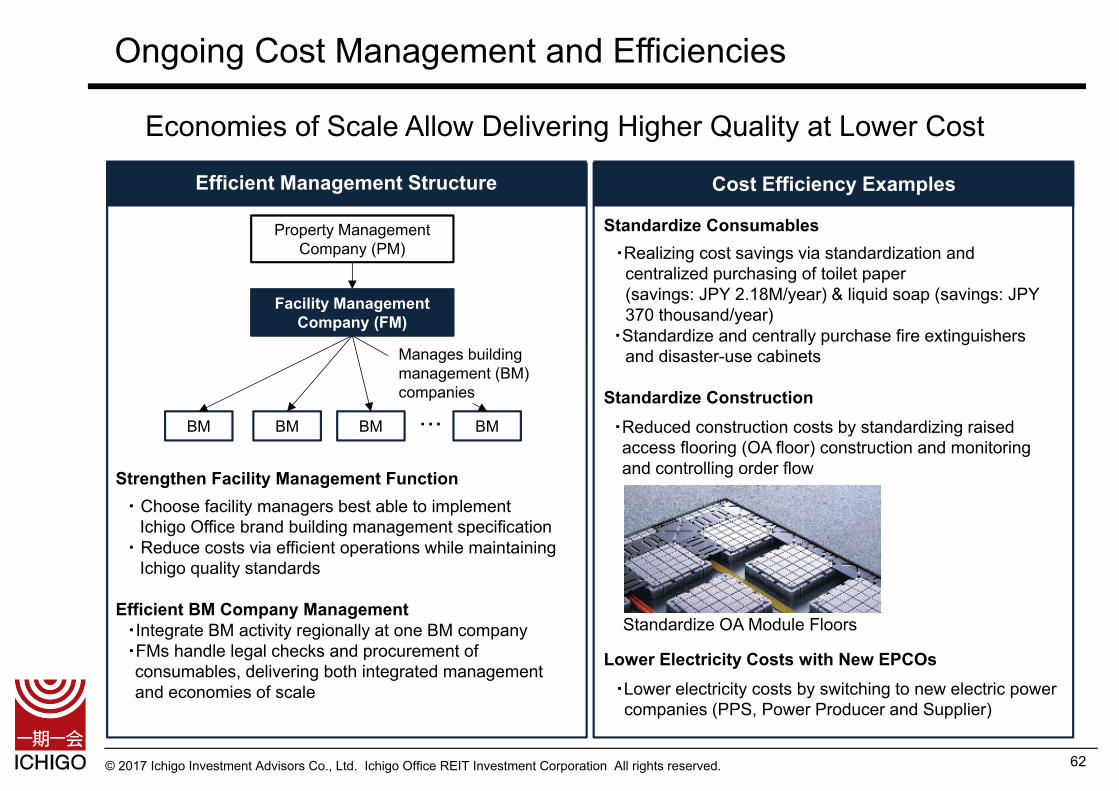
Standardize Consumables・Realizing cost savings via standardization and
centralized purchasing of toilet paper(savings: JPY 2.18M/year) & liquid soap (savings: JPY 370 thousand/year)
・Standardize and centrally purchase fire extinguishers and disaster-use cabinets
Standardize Construction・Reduced construction costs by standardizing raised access flooring (OA floor) construction and monitoring and controlling order flow
Lower Electricity Costs with New EPCOs・Lower electricity costs by switching to new electric power companies (PPS, Power Producer and Supplier)
Strengthen Facility Management Function・ Choose facility managers best able to implement
Ichigo Office brand building management specification・ Reduce costs via efficient operations while maintaining
Ichigo quality standards
Efficient BM Company Management・Integrate BM activity regionally at one BM company・FMs handle legal checks and procurement of consumables, delivering both integrated management and economies of scale
Economies of Scale Allow Delivering Higher Quality at Lower Cost
Efficient Management Structure
BM BM BM
Property Management Company (PM)
Cost Efficiency Examples
BM
Facility Management Company (FM)
・・・
Manages building management (BM) companies
Ongoing Cost Management and Efficiencies
62
Standardize OA Module Floors
© 2017 Ichigo Investment Advisors Co., Ltd. Ichigo Office REIT Investment Corporation All rights reserved. 63
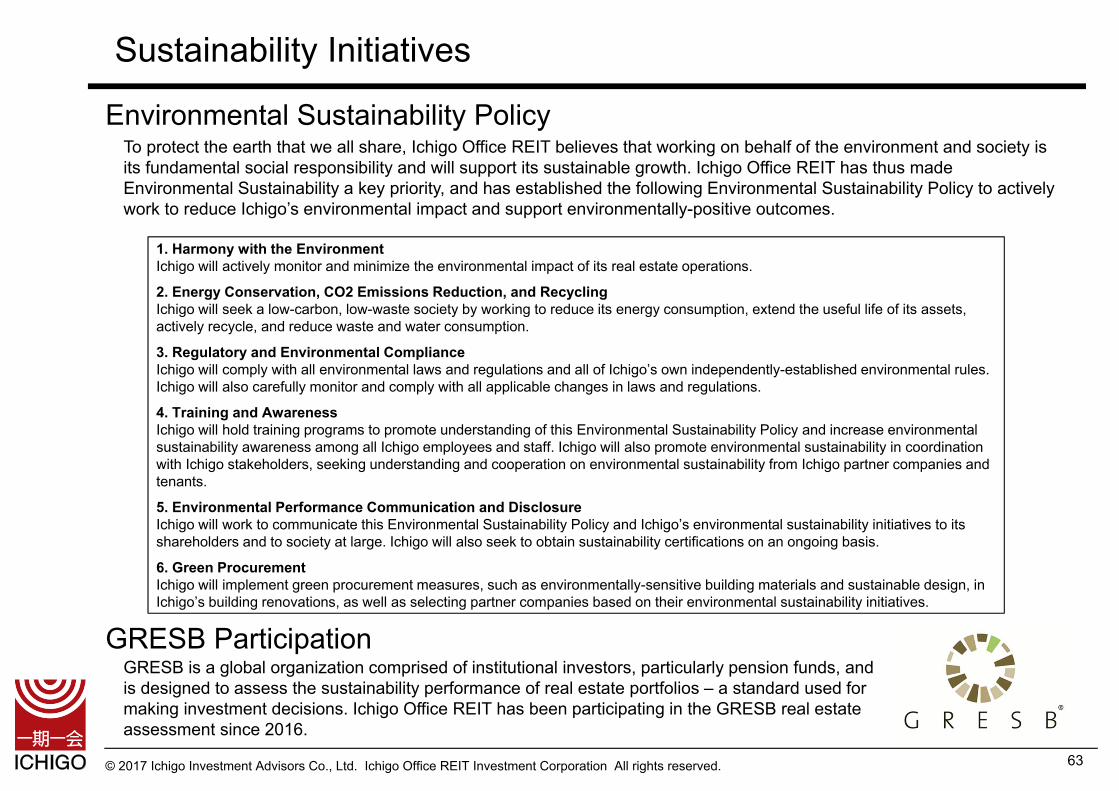
Sustainability Initiatives
Environmental Sustainability Policy
1. Harmony with the EnvironmentIchigo will actively monitor and minimize the environmental impact of its real estate operations.
2. Energy Conservation, CO2 Emissions Reduction, and RecyclingIchigo will seek a low-carbon, low-waste society by working to reduce its energy consumption, extend the useful life of its assets, actively recycle, and reduce waste and water consumption.
3. Regulatory and Environmental ComplianceIchigo will comply with all environmental laws and regulations and all of Ichigo’s own independently-established environmental rules. Ichigo will also carefully monitor and comply with all applicable changes in laws and regulations.
4. Training and AwarenessIchigo will hold training programs to promote understanding of this Environmental Sustainability Policy and increase environmental sustainability awareness among all Ichigo employees and staff. Ichigo will also promote environmental sustainability in coordination with Ichigo stakeholders, seeking understanding and cooperation on environmental sustainability from Ichigo partner companies and tenants.
5. Environmental Performance Communication and DisclosureIchigo will work to communicate this Environmental Sustainability Policy and Ichigo’s environmental sustainability initiatives to its shareholders and to society at large. Ichigo will also seek to obtain sustainability certifications on an ongoing basis.
6. Green ProcurementIchigo will implement green procurement measures, such as environmentally-sensitive building materials and sustainable design, in Ichigo’s building renovations, as well as selecting partner companies based on their environmental sustainability initiatives.
To protect the earth that we all share, Ichigo Office REIT believes that working on behalf of the environment and society is its fundamental social responsibility and will support its sustainable growth. Ichigo Office REIT has thus made Environmental Sustainability a key priority, and has established the following Environmental Sustainability Policy to actively work to reduce Ichigo’s environmental impact and support environmentally-positive outcomes.
GRESB is a global organization comprised of institutional investors, particularly pension funds, and is designed to assess the sustainability performance of real estate portfolios – a standard used for making investment decisions. Ichigo Office REIT has been participating in the GRESB real estate assessment since 2016.
GRESB Participation
© 2017 Ichigo Investment Advisors Co., Ltd. Ichigo Office REIT Investment Corporation All rights reserved.
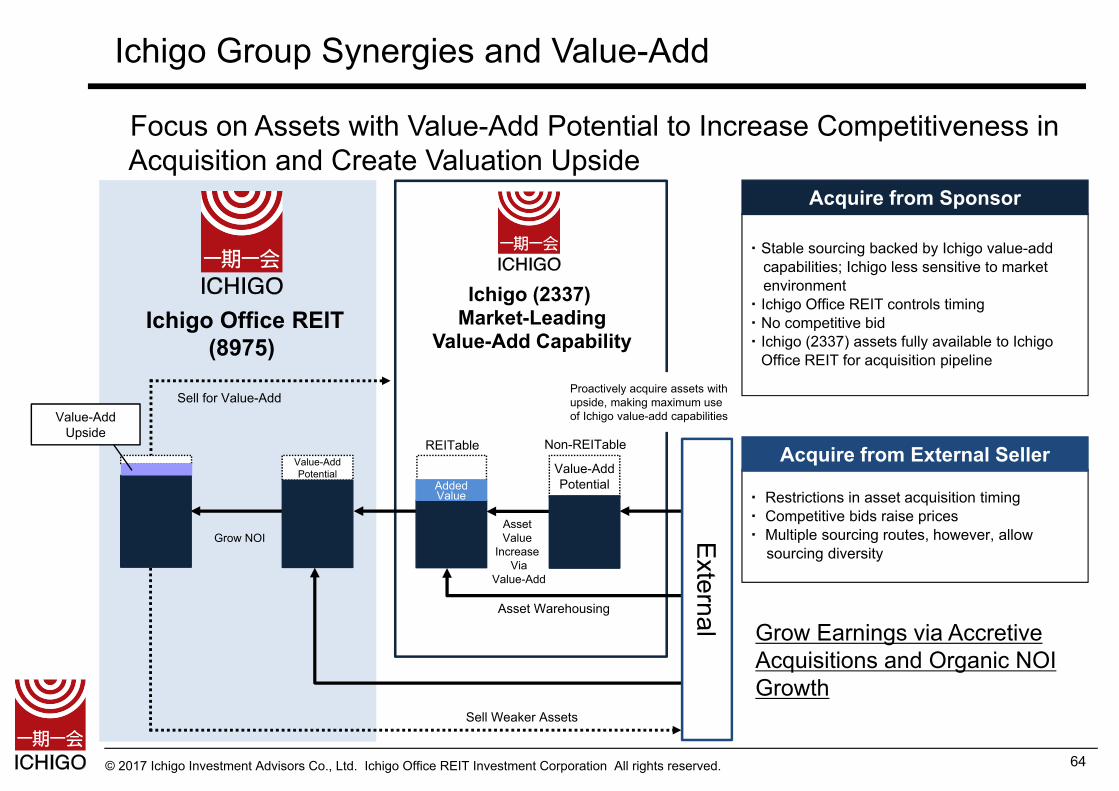
Ichigo Group Synergies and Value-Add
Focus on Assets with Value-Add Potential to Increase Competitiveness in Acquisition and Create Valuation Upside
64
・Stable sourcing backed by Ichigo value-add capabilities; Ichigo less sensitive to market environment
・Ichigo Office REIT controls timing・No competitive bid・Ichigo (2337) assets fully available to Ichigo
Office REIT for acquisition pipeline
Acquire from Sponsor
・ Restrictions in asset acquisition timing・ Competitive bids raise prices・ Multiple sourcing routes, however, allow
sourcing diversity
Acquire from External Seller
Ichigo Office REIT(8975)
Ichigo (2337) Market-Leading
Value-Add Capability
Non-REITableREITable
Proactively acquire assets with upside, making maximum use of Ichigo value-add capabilities
Sell for Value-Add
Asset Warehousing
価値向上
Asset Value
Increase Via
Value-Add
Grow NOI
Sell Weaker Assets
Grow Earnings via Accretive Acquisitions and Organic NOI Growth
Value-AddPotential
Value-AddPotential
External
AddedValue
Value-Add Upside
© 2017 Ichigo Investment Advisors Co., Ltd. Ichigo Office REIT Investment Corporation All rights reserved. 65
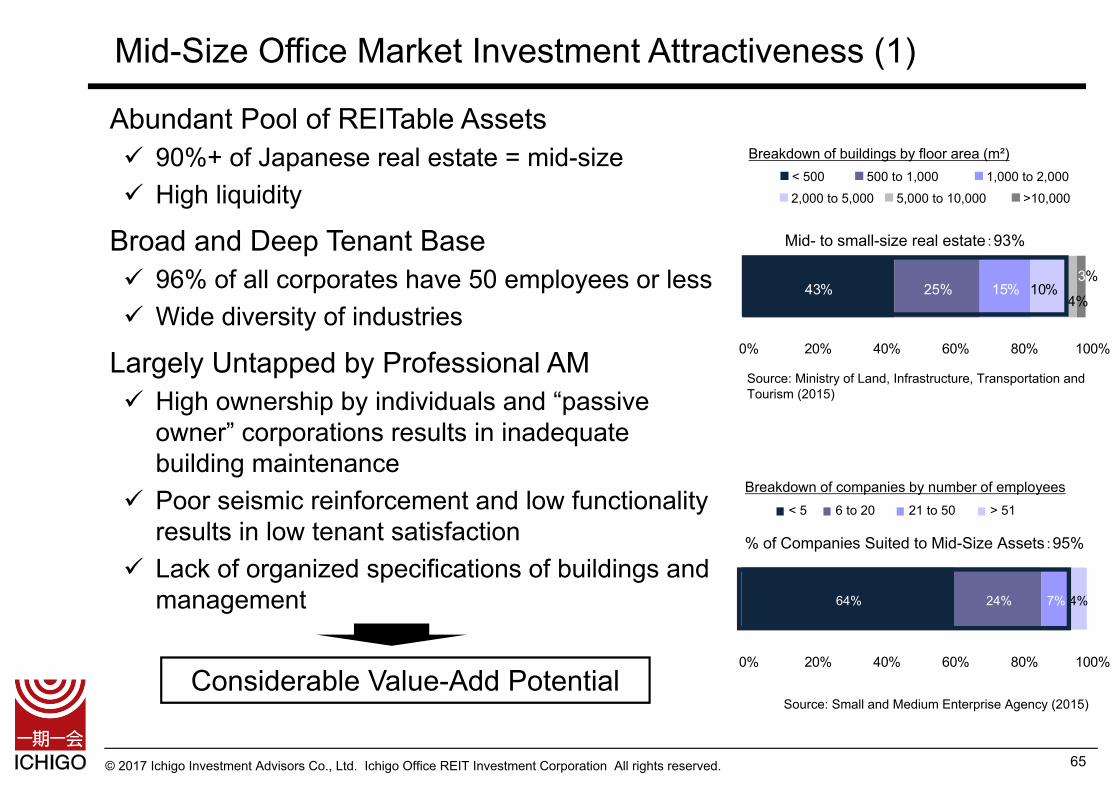
64% 24% 7% 4%
43% 25% 15% 10%4%
3%
Mid- to small-size real estate:93%
% of Companies Suited to Mid-Size Assets:95%
0% 20% 40% 60% 80% 100%
0% 20% 40% 60% 80% 100%
Breakdown of buildings by floor area (m²)
Source: Ministry of Land, Infrastructure, Transportation and Tourism (2015)
Breakdown of companies by number of employees
Source: Small and Medium Enterprise Agency (2015)
< 5 6 to 20 21 to 50 > 51
< 500 500 to 1,000 1,000 to 2,0002,000 to 5,000 5,000 to 10,000 >10,000
Abundant Pool of REITable Assets 90%+ of Japanese real estate = mid-size High liquidity
Broad and Deep Tenant Base 96% of all corporates have 50 employees or less Wide diversity of industries
Largely Untapped by Professional AM High ownership by individuals and “passive
owner” corporations results in inadequate building maintenance
Poor seismic reinforcement and low functionality results in low tenant satisfaction
Lack of organized specifications of buildings and management
Considerable Value-Add Potential
Mid-Size Office Market Investment Attractiveness (1)

© 2017 Ichigo Investment Advisors Co., Ltd. Ichigo Office REIT Investment Corporation All rights reserved.
40
60
80
100
120
140
Sep 2006 Sep 2007 Sep 2008 Sep 2009 Sep 2010 Sep 2011 Sep 2012 Sep 2013 Sep 2014 Sep 2015 Sep 2016
Very Large Large Small/Mid
Mid-Size Office Market Investment Attractiveness (2)
Mid-Size Office Rents More Stable than Larger-Size Office Rents
66
Office Rent Movements in Central Tokyo (Chiyoda, Chuo, & Minato Wards)
Source: Sanko Estate Co., Ltd.Very Large refers to offices with a standard floor area of 660m2 or more. Large are 330 to 660m2. Small/Mid are less than 330m2.
© 2017 Ichigo Investment Advisors Co., Ltd. Ichigo Office REIT Investment Corporation All rights reserved.
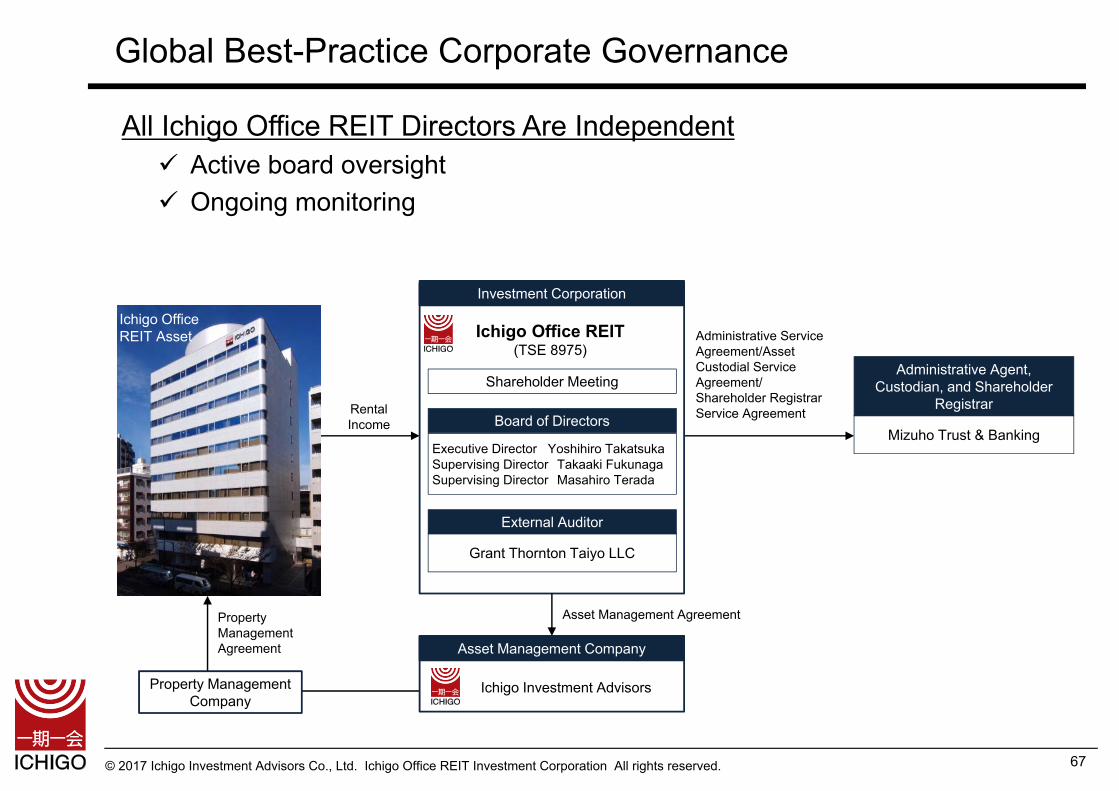
All Ichigo Office REIT Directors Are Independent Active board oversight Ongoing monitoring
Global Best-Practice Corporate Governance
67
Ichigo Office REIT(TSE 8975)
Shareholder Meeting
Executive Director Yoshihiro TakatsukaSupervising Director Takaaki FukunagaSupervising Director Masahiro Terada
Board of Directors
Grant Thornton Taiyo LLC
External Auditor
Asset Management Company
Ichigo Investment Advisors
Asset Management Agreement
Ichigo Office REIT Asset
Rental Income
Property Management Agreement
Property Management Company
Mizuho Trust & Banking
Administrative Agent, Custodian, and Shareholder
Registrar
Investment Corporation
Administrative Service Agreement/Asset Custodial Service Agreement/ Shareholder Registrar Service Agreement
© 2017 Ichigo Investment Advisors Co., Ltd. Ichigo Office REIT Investment Corporation All rights reserved. 68
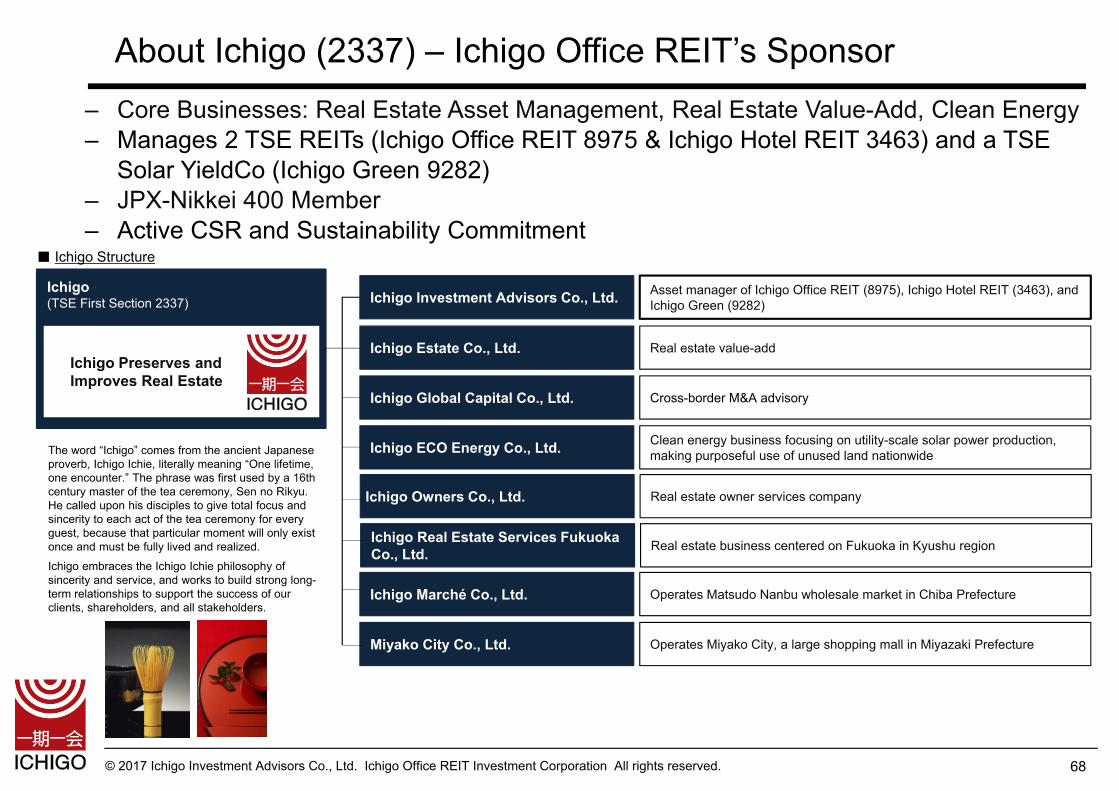
About Ichigo (2337) – Ichigo Office REIT’s Sponsor
■ Ichigo Structure
‒ Core Businesses: Real Estate Asset Management, Real Estate Value-Add, Clean Energy‒ Manages 2 TSE REITs (Ichigo Office REIT 8975 & Ichigo Hotel REIT 3463) and a TSE
Solar YieldCo (Ichigo Green 9282) ‒ JPX-Nikkei 400 Member‒ Active CSR and Sustainability Commitment
Ichigo Investment Advisors Co., Ltd.
Ichigo Owners Co., Ltd.
Ichigo (TSE First Section 2337)
Asset manager of Ichigo Office REIT (8975), Ichigo Hotel REIT (3463), and Ichigo Green (9282)
Real estate value-add
Clean energy business focusing on utility-scale solar power production, making purposeful use of unused land nationwide
Operates Miyako City, a large shopping mall in Miyazaki Prefecture
Real estate owner services company
Cross-border M&A advisory
Operates Matsudo Nanbu wholesale market in Chiba Prefecture
Real estate business centered on Fukuoka in Kyushu region
Ichigo Estate Co., Ltd.
Ichigo Global Capital Co., Ltd.
Ichigo ECO Energy Co., Ltd.
Ichigo Real Estate Services Fukuoka Co., Ltd.
Ichigo Marché Co., Ltd.
Miyako City Co., Ltd.
The word “Ichigo” comes from the ancient Japanese proverb, Ichigo Ichie, literally meaning “One lifetime, one encounter.” The phrase was first used by a 16th century master of the tea ceremony, Sen no Rikyu. He called upon his disciples to give total focus and sincerity to each act of the tea ceremony for every guest, because that particular moment will only exist once and must be fully lived and realized. Ichigo embraces the Ichigo Ichie philosophy of sincerity and service, and works to build strong long-term relationships to support the success of our clients, shareholders, and all stakeholders.
Ichigo Preserves and Improves Real Estate
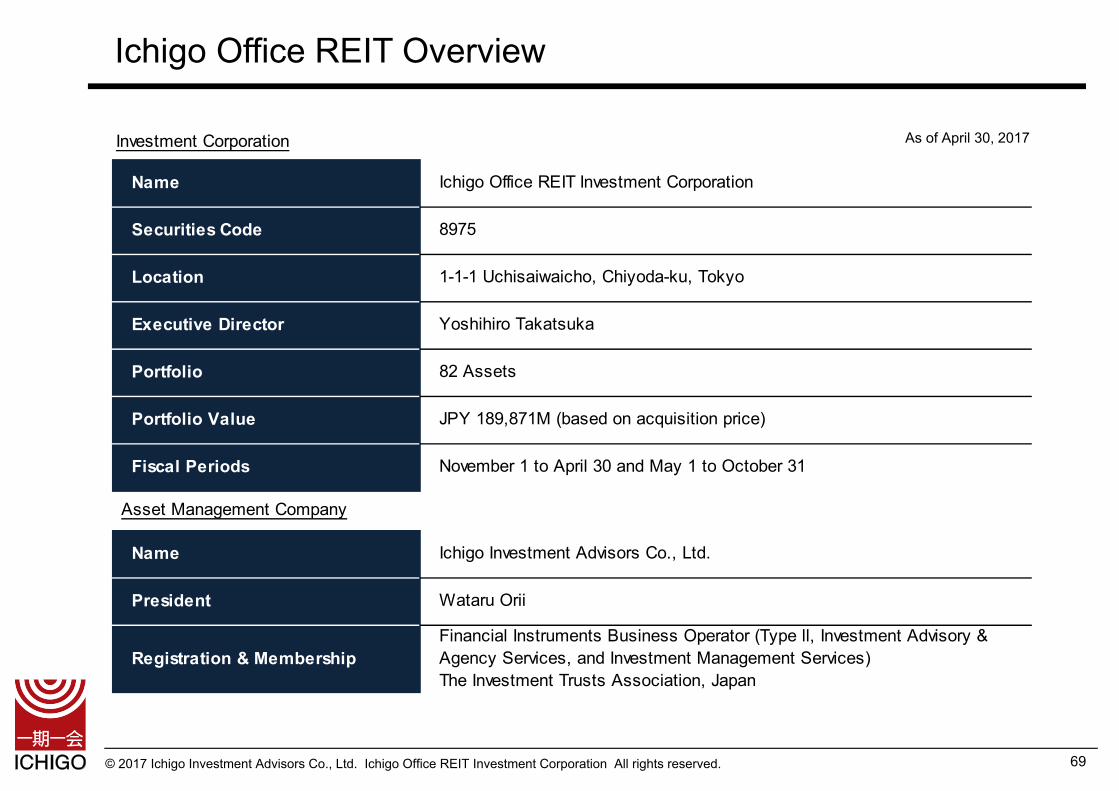
© 2017 Ichigo Investment Advisors Co., Ltd. Ichigo Office REIT Investment Corporation All rights reserved.
Ichigo Office REIT Overview
69
As of April 30, 2017Investment Corporation
Name Ichigo Office REIT Investment Corporation
Securities Code 8975
Location 1-1-1 Uchisaiwaicho, Chiyoda-ku, Tokyo
Executive Director Yoshihiro Takatsuka
Portfolio 82 Assets
Portfolio Value JPY 189,871M (based on acquisition price)
Fiscal Periods November 1 to April 30 and May 1 to October 31
Name Ichigo Investment Advisors Co., Ltd.
President Wataru Orii
Registration & MembershipFinancial Instruments Business Operator (Type ll, Investment Advisory &Agency Services, and Investment Management Services)The Investment Trusts Association, Japan
Asset Management Company
© 2017 Ichigo Investment Advisors Co., Ltd. Ichigo Office REIT Investment Corporation All rights reserved.
MEMO
70
© 2017 Ichigo Investment Advisors Co., Ltd. Ichigo Office REIT Investment Corporation All rights reserved.
These materials are for informational purposes only, and do not constitute or form a part of, and should not be construed as, anoffer to sell or a solicitation of an offer to buy any securities of Ichigo Office REIT Investment Corporation (Ichigo Office REIT).
These materials may contain forward-looking statements regarding the intent, belief or current expectations of management of Ichigo Office REIT with respect to financial condition and future results of operations. These statements are based on certain assumptions founded on currently available information. Accordingly, such statements are subjects to risks, uncertainties andassumptions and there is no assurance as to actual financial conditions or results of operations. Actual results may vary from those indicated in the forward-looking statements. Accordingly, please refrain from solely relying on these statements.
These materials have been created by the management of Ichigo Office REIT and Ichigo Investment Advisors Co., Ltd. (IIA) withthe belief that the information contained is accurate. However, there is no assurance given as to the accuracy, certainty, validity or fairness of any such information. Please note that the content of these materials is subject to revision or retraction without prior notice.
This document is a translation. If there is any discrepancy between the Japanese version and the English translation, the Japanese version shall prevail. No copying or reproduction of these materials or part of these materials is allowed without obtaining prior consent from Ichigo Office REIT and IIA.
Ichigo Office REIT IR DeskTEL:03-3502-4891 FAX:[email protected] www.ichigo-office.co.jp/english
Disclaimer
71
Ichigo is Japan’s first zero-carbon listed real estate company. We are taking responsibility for our environmental footprint by offsetting our carbon emissions and investing in low-carbon technologies such as solar energy.