ichigo group holdings co ltd (2337) ichigo group … breakdown ‒growth investments driving...
TRANSCRIPT

February 2015 Q1 (March 2014 – May 2014) Corporate Presentation
April 23, 2014
Ichigo Group Holdings Co Ltd (2337)
July 17, 2014
Ichigo Group Holdings Co., Ltd. (2337)
© 2014 Ichigo Group Holdings Co., Ltd. All rights reserved. www.ichigo-holdings.co.jp/english

© 2014 Ichigo Group Holdings Co., Ltd. All rights reserved.

© 2014 Ichigo Group Holdings Co., Ltd. All rights reserved.

Creating peace of mind through honest and committed managementand committed management.
© 2014 Ichigo Group Holdings Co., Ltd. All rights reserved.
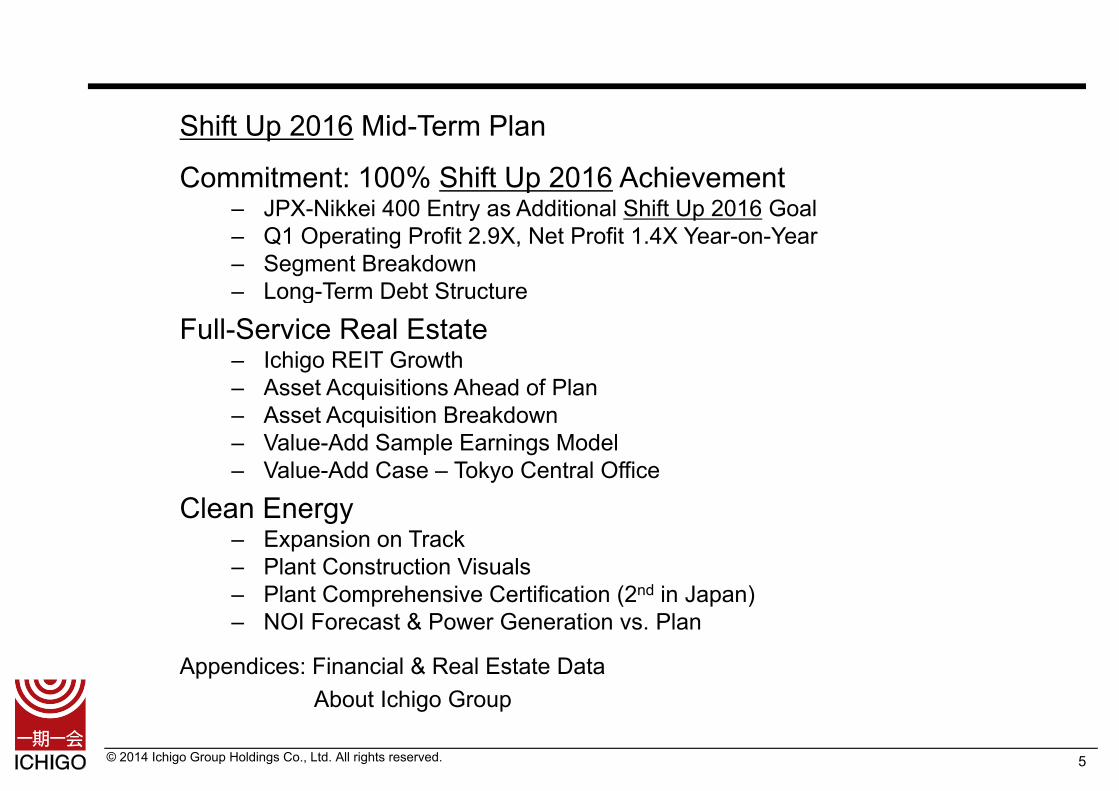
Shift Up 2016 Mid-Term Plan
Commitment: 100% Shift Up 2016 AchievementJPX Nikk i 400 E t Additi l Shift U 2016 G l‒ JPX-Nikkei 400 Entry as Additional Shift Up 2016 Goal
‒ Q1 Operating Profit 2.9X, Net Profit 1.4X Year-on-Year‒ Segment Breakdown‒ Long-Term Debt StructureLong Term Debt Structure
Full-Service Real Estate‒ Ichigo REIT Growth‒ Asset Acquisitions Ahead of Plansse cqu s o s ead o a‒ Asset Acquisition Breakdown‒ Value-Add Sample Earnings Model‒ Value-Add Case – Tokyo Central Office
Clean Energy‒ Expansion on Track‒ Plant Construction Visuals
Pl t C h i C tifi ti (2nd i J )‒ Plant Comprehensive Certification (2nd in Japan)‒ NOI Forecast & Power Generation vs. Plan
Appendices: Financial & Real Estate Data
© 2014 Ichigo Group Holdings Co., Ltd. All rights reserved.
About Ichigo Group
5
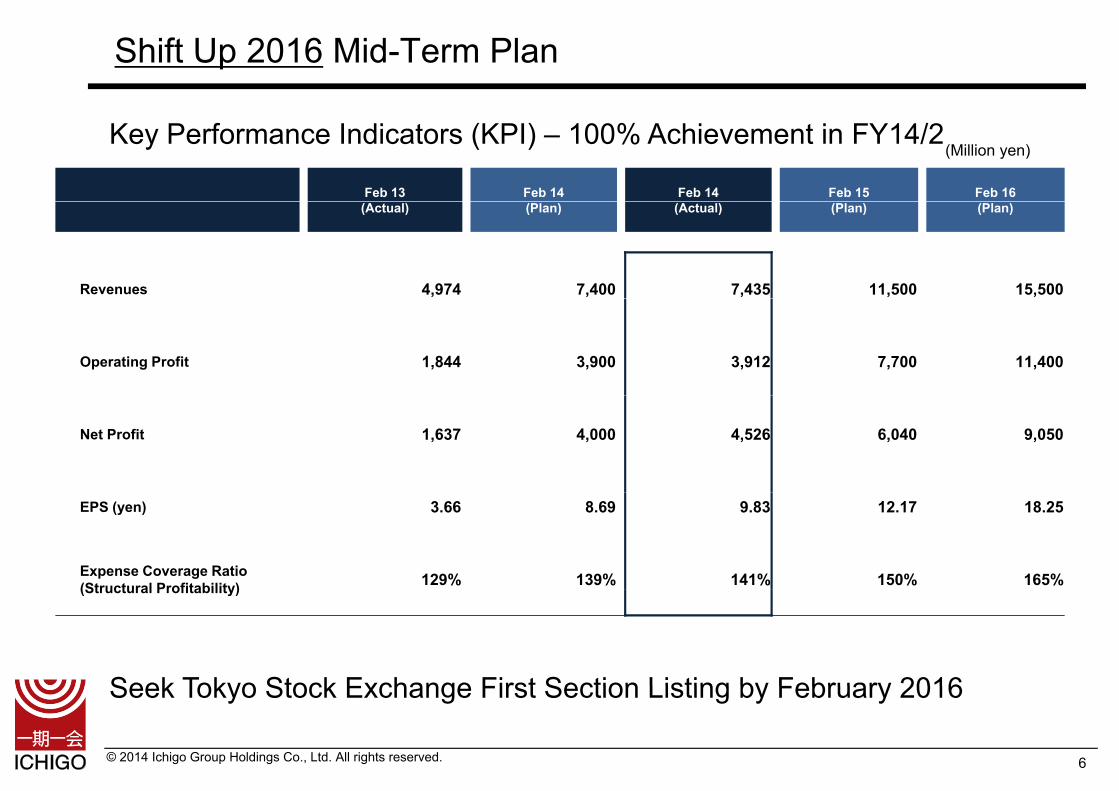
Shift Up 2016 Mid-Term Plan
Key Performance Indicators (KPI) – 100% Achievement in FY14/2(Million yen)
Feb 13 Feb 14 Feb 14 Feb 15 Feb 16 (Actual) (Plan) (Actual) (Plan) (Plan)
Revenues 4,974 7,400 7,435 11,500 15,500
Operating Profit 1,844 3,900 3,912 7,700 11,400
Net Profit 1,637 4,000 4,526 6,040 9,050
EPS (yen) 3.66 8.69 9.83 12.17 18.25
Expense Coverage Ratio (Structural Profitability) 129% 139% 141% 150% 165%
Seek Tokyo Stock Exchange First Section Listing by February 2016
(Structural Profitability)
© 2014 Ichigo Group Holdings Co., Ltd. All rights reserved.
Seek Tokyo Stock Exchange First Section Listing by February 2016
6

Commitment: 100% Shift Up 2016 Achievement
© 2014 Ichigo Group Holdings Co., Ltd. All rights reserved. 7

JPX-Nikkei 400 Entry as Additional Shift Up 2016 Goal
‒ Further materialize Ichigo’s commitment to shareholders by b i f J ’ t 400 i i t f it lbecoming one of Japan’s top 400 companies in terms of capital efficiency and shareholder performance
‒ 3-year average ROE (40% weighting), 3-year total operating y g ( g g), y p gprofit (40% weighting), and market capitalization (20% weighting) are quantitative selection criteria, so Ichigo entry goal is a commitment to continue to increase ROE, operatingis a commitment to continue to increase ROE, operating profitability, and shareholder value
‒ Target achievement date: August 2016 annual index rebalance b d FY16/2 I hi fi i lbased upon FY16/2 Ichigo financials
© 2014 Ichigo Group Holdings Co., Ltd. All rights reserved. 8

Q1 Operating Profit 2.9X, Net Profit 1.4X Year-on-Year
‒ High Value-Add sales drive profits despite lower revenues FY14/2 Q1 JPY 8B Real Estate & Value-Add sales, JPY 270M gross profit FY15/2 Q1 JPY 3 5B R l E t t & V l Add l JPY 1 6B fit FY15/2 Q1 JPY 3.5B Real Estate & Value-Add sales, JPY 1.6B gross profit
Feb 14 Q1 Feb 15 Q1 vs Full Year FY14/2
Feb 2015 Q1 (Million yen)
Feb 14 Q1 Actual
Feb 15 Q1Actual YOY Full-Year Forecast vs. Full-Year
ForecastFY14/2Actual
Revenues 11,023 6,528 0.6X 42,000 15.5% 35,101
Operating Profit 767 2 236 2 9X 7 700 29 0% 3 912Operating Profit 767 2,236 2.9X 7,700 29.0% 3,912
Recurring Profit 742 2,056 2.8X 6,500 31.6% 3,597
Net Profit 1,360 1,864 1.4X 6,055 30.8% 4,526
EPS (yen) 3.03 3.75 1.2X 12.17 30.8% 9.83
Fixed Revenues 1,026 1,639 1.6X - - 4,917
Fixed Expensesp(Fixed SG&A + Interest Expense)
803 1,079 1.3X - - 3,499
Expense Coverage Ratio (Structural Profitability) 128% 152% 1.2X - - 141%
© 2014 Ichigo Group Holdings Co., Ltd. All rights reserved. 9

Segment Breakdown
‒ Growth Investments Driving Operating Profit in Real Estate and Value-Add‒ Newly Operational Solar Plants in Clean Energy
(Million yen)
Segment
Revenues Operating Profit
Earnings DriversFeb 2014 Q1 Feb 15 Q1 Change (YoY)
Feb 15Full-Year(Forecast)
Vs. Forecast Feb 2014 Q1 Feb 15 Q1 Change (YoY)Feb 15
Full-Year(Forecast)
Vs. Forecast
Asset Management 1,149 1,095 95% 3,634 30% 306 207 68% 536 39% ・AM Fee gross profitREIT:193M, Private:32M
Real Estate 556 1,322 238% 15,591 9% 200 831 416% 3,000 28% ・Increased Rental Income・Real Estate Capital Gains: 452M
Value-Add 8,912 3,964 45% 21,983 18% 411 1,412 344% 4,905 29% ・Increased Rental Income・Real Estate Capital Gains: 1,115M
Clean Energy 0 125 - 793 16% - 81 - 41 - - 157 - ・Solar electricity sales gross profit: 40M
Others 405 19 5% 0 - - 3 - 4 - - 43 - ・Advisory Fee gross profit: 21M
Total 11,023 6,528 59% 42,000 16% 834 2,405 288% 8,241 29% -
Adjustment (including offsets 66 169 541of cross-segment transactions) - - - - - - 66 - 169 - - 541 - -
Total 11,023 6,528 59% 42,000 16% 767 2,236 292% 7,700 29% -
© 2014 Ichigo Group Holdings Co., Ltd. All rights reserved. 10

Long-Term Debt Structure
‒ 92% of debt is now long-term (vs. 61% FY14/2 Q1)‒ Lengthened average debt tenure by 2.4 years YOY
■ Corporate Debt
Weighted Average Interest Rate
Average Borrowing Period
7 2 yearsWeighted Average Interest Rate
2.08%-23bpt Weighted Average Interest
Rate
1.85%Average Borrowing
7.2 years
●.●●%Long-TermDebt
40 8 billi
1.85%g gPeriod
4.8 years
Debt
40.8 billion yen(92.1%)
Long-TermDebt
8.4 billion yen(61 4%)Debt● yen
Short-Term Debt5.3 billion yen
Short-Term Debt3.5 billion yen
(61.4%)
© 2014 Ichigo Group Holdings Co., Ltd. All rights reserved. 11
FY14/2 Q1 FY15/2 Q1
y

Full-Service Real Estate
© 2014 Ichigo Group Holdings Co., Ltd. All rights reserved. 12

Asset Management
Ichigo REIT Growth‒ Increased Property Acquisition Capacity through Public Offering Expanded bridge funds for Ichigo REIT FY15/2 YTD IGH real estate acquisitions of JPY 28B include potential FY15/2 YTD IGH real estate acquisitions of JPY 28B include potential
Ichigo REIT assets
‒ Strengthening Leasing via Real Estate Services Divisiong g g Direct leasing with specialized asset teams Customized leasing reflecting the specific characteristics of each asset Established a specialized team offering native English services
Ichigo REITProperty Management
Company
A ti t tAsset Management
Company(I hi R l E t t I t t)
Ichigo Group Holdings
Real Estate Services (Office, residence, retail,
Support Contract
Leasing Contact Active tenant leasing
© 2014 Ichigo Group Holdings Co., Ltd. All rights reserved. 13
(Ichigo Real Estate Investment) international clients)

Real Estate & Value-Add
Asset Acquisitions Ahead of PlanJPY 45B of acquisitions in 6 months since public offering‒ Vs. planned JPY 80B of acquisitions for full-year FY15/2 (real estate
JPY 69B, megasolar JPY 11B)JPY 69B, megasolar JPY 11B) Already acquired JPY28B in real estate Additional JPY16 billion in current real estate pipeline
‒ Real estate sales FY15/2 YTD = JPY 1.6B in capital gains and JPY 2B in net proceeds to be used for reinvestment
仮
© 2014 Ichigo Group Holdings Co., Ltd. All rights reserved. 14

Real Estate & Value-Add
Asset Acquisition Breakdown‒ June 2014: 16 assets, JPY28B (Real Estate JPY9B, Value-Add JPY19B)‒ Net JPY 16B increase in Real Estate for Sale on B/S
■ Real Estate
Asset Type Location Building Age Acquisition Price Date of Acquisition
Retail Fukuoka 8 1-2 billion yen 2014/04
Office Shinagawa-ku, Tokyo 22 >3 billion yen 2014/03
Office Koriyama City Fukushima 13 1 2 billion yen 2014/03Office Koriyama City, Fukushima 13 1-2 billion yen 2014/03
Office Shinjuku-ku, Tokyo 20 1-2 billion yen 2014/03
Retail Yokohama City, Kanagawa 12 1-2 billion yen 2014/05
Total 5 Assets 9.2 billion yen
■ Value-Add
Asset Type Location Building Age Acquisition Price Date of Acquisition
Retail Shibuya-ku, Tokyo 30 <1 billion yen 2014/03
Ground Lease Fujisawa City Kanagawa - 1-2 billion yen 2014/03Ground Lease Fujisawa City, Kanagawa 1 2 billion yen 2014/03
Office Shibuya-ku, Tokyo 4 1-2 billion yen 2014/04
Office Shinagawa-ku, Tokyo 24 2-3 billion yen 2014/05
Office Shinagawa-ku, Tokyo 21 1-2 billion yen 2014/05
Retail Minato-ku, Tokyo 5 2-3 billion yen 2014/05
Residence Kumamoto City, Kumamoto 7 >3 billion yen 2014/06
Office Chiyoda-ku, Tokyo 20 <1 billion yen 2014/06
Office Shinjuku-ku, Tokyo 27 1-2 billion yen 2014/06
Office Chuo-ku, Tokyo 39 2-3 billion yen 2014/06
Office Minato-ku Tokyo 25 <1 billion yen 2014/06
© 2014 Ichigo Group Holdings Co., Ltd. All rights reserved. 15
Office Minato-ku, Tokyo 25 <1 billion yen 2014/06
Total 11 Assets 18.7 billion yen

Value-Add Sample Earnings Model
‒ 5.5% NOI, JPY 2B purchase, LTV 70%, 1.5% interest rate, JPY 50M capex, 20% increase in NOI, 3-year holding period
‒ Upgrade tenants, aesthetic improvement, remedy building codeUpgrade tenants, aesthetic improvement, remedy building code violations, earthquake retrofit, etc.
【At Acquisition】
Debt
・(110 million yen NOI/year) - (21 million yen interest/year) = 89 million yen net income/year・Net income ÷ Investment =14.8% return during investment.
【After Value-Add】
Asset2 billion
yen
Debt1.4 billion
yen
【After Value Add】・(132 million yen NOI/year) - (21 million yen interest/year) = 111 million yen net income/year・Net income ÷ Investment (2 billion + 50 million) =17.1% return duringinvestmentyen
Equity 0.6 billion
yen
investment.
→ Value-Add to increase NOI 20% at equivalent cap rate increases exit price by 20%: 2 billion yen * 120% = 2.4 billion yen→ 2.4 billion yen – (2 billion yen + 50 million yen) = 350 million yen
capital gaincapital gain.
【Result】・650 million yen investment generates 617 million yen over 3 years → 31.6% p.a.
3 years of value-add activity50 million yen of capex
© 2014 Ichigo Group Holdings Co., Ltd. All rights reserved. 16
p

Value-Add Case – Tokyo Central Office
Address Mita, Minato-ku, TokyoZoning CommercialLand Area 181 tsubo (598㎡)
Property Summary
Land Area 181 tsubo (598㎡)Building Area 1,046 tsubo (3,458㎡)Rentable Area 717 tsubo (2,370㎡)Structure 14 floors, reinforced concreteUse By Floor Offices (2F-11F), Residence (12F-14F)Y B ilt O t b 2011Year Built October 2011Ownership Sectional ownershipAccess 6 min. walk from Tamachi StationRemarks Offices are 80% of the space (2F-11F)
− Acquired for a low price by taking on leasing risk1 0% NOI at acquisition After leasing− 1.0% NOI at acquisition → After leasing, 5.9% NOI
− Raised occupancy from 40% to 80% in 5 monthsmonths
− To further add value, introduced Ichigo Layout Office format to lower tenant move-in costs and speed move-in
© 2014 Ichigo Group Holdings Co., Ltd. All rights reserved. 17
in costs and speed move in
Clean Energy
© 2014 Ichigo Group Holdings Co., Ltd. All rights reserved. 18

Expansion on Track
‒ As of June 2014, 9 Megasolar Plants (11MW) Online Total operating and in-development plants: 24 projects, 83MW
(Feed-in tariff 40 yen: 20 projects, 34MW; 36yen: 4 projects, 49MW)( y p j , ; y p j , )
Of 15 in-development plants, 9 currently under construction
■ Total Megasolar Plants (24 projects, 83MW)
(9 projects, 11MW online by Apr 2014) (15 projects, 72MW under development)
Megasolar AreaPanel
Output(MW)
Fixed Tariff (Pre-tax,
yen)
Operation Start Date(expected)
Under Construction
Megasolar AreaPanel
Output(MW)
Fixed Tariff (Pre-tax, yen)
Operation Start Date
Ichigo Betsukai Kawakamicho ECO Power Plant Hokkaido 0.88 40 Oct-14 ○
Ichigo Toyokoro Sasadamachi ECO Power Plant Hokkaido 0.61 40 Oct-14 ○
Ichigo Nakashibetsu Midorigaoka ECO Power Plant Hokkaido 1.93 40 Nov-14 ○
Ichigo Abira Toasa ECO Power Plant Hokkaido 1.16 40 Nov-14 ○
Ichigo Toyokoro ECO Power Plant Hokkaido 1.03 40 Dec-14 ○
Ichigo Tokushima Higashi-Okinosu ECO Power Plant Shikoku 2.52 40 Aug-13
Ichigo Kiryu Okuzawa ECO Power Plant Kanto 1.33 40 Sep-13
Ichigo Motomombetsu ECO Power Plant Hokkaido 1.40 40 Feb-14
Ichigo Fuchu Jogecho Yano ECO Power Plant Chugoku 0.99 40 Mar-14
Ichigo Muroran Hacchodaira ECO Power Plant Hokkaido 1.24 40 Mar-14
Ichigo Engaru Kiyokawa ECO Power Plant Hokkaido 1.12 40 Mar-14
Ichigo Yubetsu Barou ECO Power Plant Hokkaido 0.80 40 Apr-14Ichigo Higashi-Hiroshima Saijocho Taguchi ECO Power Plant Chugoku 2.64 40 Jan-15 ○
Ichigo Akkeshi Shirahama ECO Power Plant Hokkaido 0.81 40 Jan-15
Ichigo Engaru Higashimachi ECO Power Plant Hokkaido 1.24 40 Feb-15
Ichigo Nago Futami ECO Power Plant Okinawa 8.44 40 Mar-15 ○
Ichigo Takamatsu Kokubunjicho Nii ECO Power Plant Shikooku 2.43 36 Mar-15 ○
g p
Ichigo Iyo Nakayamacho Izubuchi ECO Power Plant Shikoku 1.23 40 Apr-14
Ichigo Maebashi Naegashima ECO Power Plant Kanto 0.67 40 Apr-14
Operation Schedule:17 megasolar plants, 22MW online by Feb 20157 megasolar plants, 61MW online after Feb 2015
Ichigo Takamatsu Kokubunjicho Nii ECO Power Plant Shikooku 2.43 36 Mar 15 ○
Ichigo Miyakonojo Yasuhisacho ECO Power Plant Kyushu 1.44 36 Jul-15 ○
Ichigo Yonago Izumi ECO Power Plant Chugoku 2.61 40 Dec-15
Ichigo Yamaguchi Aionishi ECO Power Plant Chugoku 1.13 40 Dec-15
Ichigo Yamaguchi Sayama ECO Power Plant Chugoku 2.36 36 Feb-16
Ichigo Showamura Ogose ECO Power Plant Kanto 43.01 36 Mar-17
© 2014 Ichigo Group Holdings Co., Ltd. All rights reserved. 19

Plant Construction Visuals
Ichigo Betsukai Kawakamicho ECO Power PlantIchigo Toyokoro Sasadamachi ECO Power Plant
Ichigo Nakashibetsu Midorigaoka ECO Power PlantIchigo Nago Futami ECO Power Plant
© 2014 Ichigo Group Holdings Co., Ltd. All rights reserved. 20
Ichigo Nakashibetsu Midorigaoka ECO Power PlantIchigo Nago Futami ECO Power Plant

Plant Comprehensive Certification (2nd in Japan)
Ichigo Kiryu Okuzawa ECO Power Plant recently received a domesticIchigo Kiryu Okuzawa ECO Power Plant recently received a domestic and international certification from third party inspection agency TÜV Rheinland Japan Ltd.
(Forecast)
Thorough on-site plant inspections throughout construction and operation Already widespread in Europe, such third party certification is becoming
more widespread throughout Japan to promote megasolar plant reliabilityp g p p g p y TÜV Rheinland is a top-in-class inspection agency with offices in 60
countries and a 140 year history
■ Comprehensive Certification Certificate (TÜV Rheinland)■ Ichigo Kiryu Okuzawa ECO Power Plant
© 2014 Ichigo Group Holdings Co., Ltd. All rights reserved. 21

P t d i ti NOI f 24 P j t (83MW) F t t R h JPY
NOI Forecast & Power Generation vs. Plan
Post-depreciation NOI from 24 Projects (83MW) Forecast to Reach JPY 1.6B/Year
■ NOI F t (Billion yen)Long-Term Stable Earnings Stream(Note) Revenue forecast assumes current operating and in-development megasolar plants operate per forecast over the period of 20 years
NOI Net Operating Income minus
■ NOI Forecast (Billion yen)
1 1
1.6Long Term Stable Earnings Stream
1.6
1.3
NOI = Net Operating Income minus Depreciation
0.6
1.1
1.0
0 5
20-Year NOI : JPY 32.5B
0 04
0.3
0.5
■ Power Generation to-date
2013/08 2013/09 2013/10 2013/11 2013/12 2014/01 2014/02 2013/03 2014/04 2014/05 Total
FY2014/2 15/2 16/2 17/2 18/2 19/2 20/2 21/2 22/2 23/2 24/2 25/2 26/2 27/2 28/2 29/2 30/2 31/2 32/2 33/2 34/2 35/2 36/2 FY2037/2
0.04
Expected Power Generation(A) (kwh) 21,977 258,514 351,705 298,064 298,491 322,506 436,129 910,951 1,299,261 1,440,600 5,638,198
Actual Power Generation (B) (kwh) 13,606 300,871 335,627 345,417 320,292 390,386 406,844 963,171 1,445,602 1,611,799 6,133,616
Ratio (B/A) 61.91% 116.38% 95.43% 115.89% 107.30% 121.05% 93.29% 105.73% 111.26% 111.88% 108.79%
© 2014 Ichigo Group Holdings Co., Ltd. All rights reserved. 22
Power generation has exceeded expectations by 9%

Appendix: Financial & Real Estate Data
© 2014 Ichigo Group Holdings Co., Ltd. All rights reserved. 23

New: Fuller Consolidated and Asset Disclosure
From this quarter, we are increasing our disclosure with respect to our statutory consolidated financials and assets, including risk-based disclosure of our balance sheet that separates out client and non-recourse assets and liabilities, and discontinuing “Pro Forma” financial reporting. We take investor feedback seriously and that p g yfeedback has been that more detailed disclosure with respect to our consolidated P&L financials and assets is needed in lieu of Pro Forma numbersForma numbers.
© 2014 Ichigo Group Holdings Co., Ltd. All rights reserved. 24

Corporate Structure and Earnings Segments
‒ Asset Management, Real Estate, Value-Add, Clean Energy, Other
Full-Service Real Estate
Ichigo Real Estate Investment Advisors Co., Ltd.
(S b idi )
Clean EnergyReal Estate Value-AddAsset
ManagementOther
○ ○○(Subsidiary)
Ichigo Estate Co., Ltd.(Subsidiary)
Ichigo ECO Energy Co Ltd
○ ○○
○
○ ○○
Ichigo ECO Energy Co., Ltd.(Subsidiary)
Ichigo Marché Co., Ltd.(Subsidiary)
Ichigo Group Holdings Co., Ltd.
(Holding Company)
○
○○
Miyako City Co., Ltd.(Subsidiary)
Takara Building Maintenance Co., Ltd.
(Subsidiary)
○○
○( y)
Ichigo Global Capital Co.,Ltd.
(Subsidiary) ○
Ichigo Real Estate Services Fukuoka Co., Ltd. ○○
© 2014 Ichigo Group Holdings Co., Ltd. All rights reserved. 25
,(Subsidiary) ○○
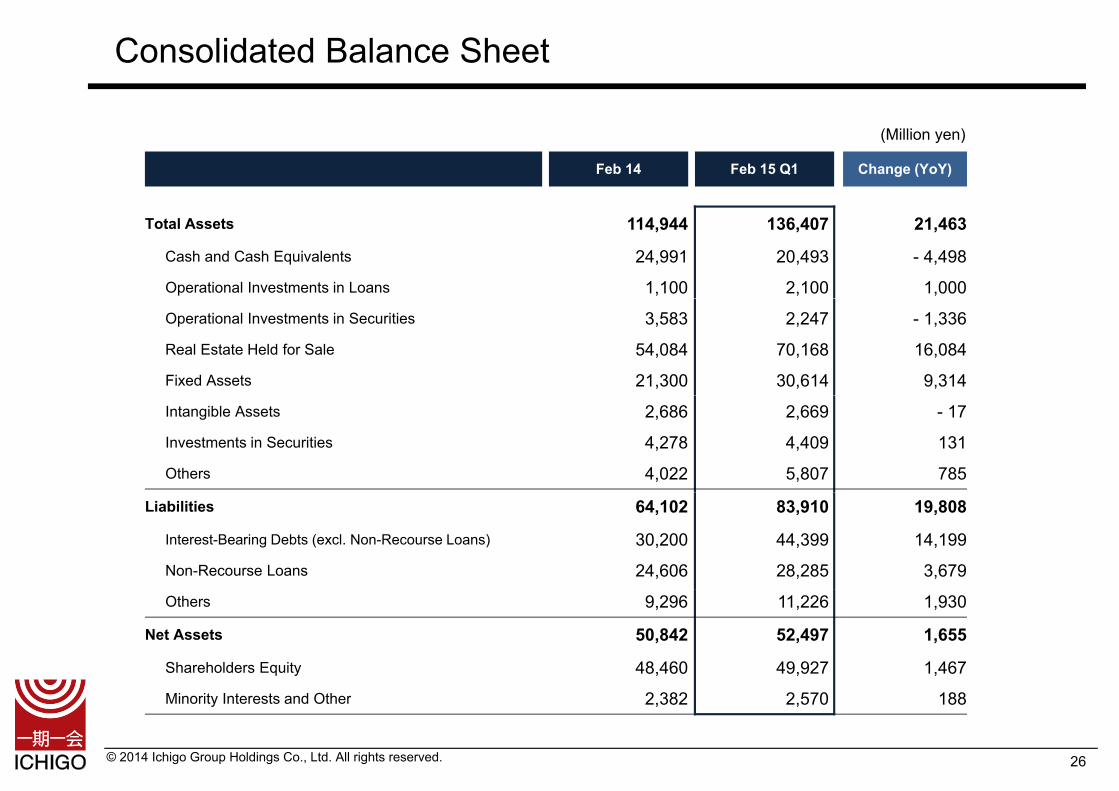
Consolidated Balance Sheet
(Million yen)
Feb 14 Feb 15 Q1 Change (YoY)
Total Assets 114,944 136,407 21,463
Cash and Cash Equivalents 24,991 20,493 - 4,498
Operational Investments in Loans 1,100 2,100 1,000
Operational Investments in Securities 3,583 2,247 - 1,336
Real Estate Held for Sale 54,084 70,168 16,084
Fixed Assets 21,300 30,614 9,314
Intangible Assets 2,686 2,669 - 17
Investments in Securities 4,278 4,409 131
Others 4,022 5,807 785
Liabilities 64,102 83,910 19,808
Interest-Bearing Debts (excl. Non-Recourse Loans) 30,200 44,399 14,199
Non-Recourse Loans 24,606 28,285 3,679
Others 9,296 11,226 1,930
Net Assets 50,842 52,497 1,655
Shareholders Equity 48,460 49,927 1,467
© 2014 Ichigo Group Holdings Co., Ltd. All rights reserved. 26
Minority Interests and Other 2,382 2,570 188

Assets: Segment Breakdown
(Million yen)Feb 2014 Feb 2015 Q1 Change (YoY) Market Value Unrealized Gain
Cash and Cash Equivalents 24,991 20,493 -4,498 20,493 0
Operational Investments in Securities 1,100 2,100 1,000 2,100 0Real Estate 1,100 1,100 0 1,100 0
Value-Add 0 1,000 1,000 1,000 0
Operational Investment in Securities 3,583 2,247 -1,336 2,620 373p , , , ,Real Estate 369 0 -369 134 134
Value-Add 2,125 999 -1,126 1,237 238
Others 1,090 1,248 158 1,248 0
Real Estate For Sale 54,084 70,168 16,084 81,769 11,601Real Estate 17,187 25,226 8,039 31,884 6,658ea s a e , 8 5, 6 8,039 3 ,88 6,658
Value-Add 36,897 44,943 8,046 49,885 4,942
Fixed Tangible Assets 21,300 30,614 9,314 33,212 2,598Asset Management 48 49 1 50 1
Real Estate 16,876 17,950 1,074 20,132 2,182
Value Add 371 7 027 6 656 7 441 414Value-Add 371 7,027 6,656 7,441 414
Clean Energy 3,939 5,526 1,587 5,526 0
Unallocated 66 63 -3 63 0
Fixed Intangible Assets 2,686 2,669 -17 2,669 0
Investments in Securities 4,278 4,409 131 4,409 0Others 4,278 4,409 131 4,409 0
Other Assets 2,922 3,707 785 3,707 0
Total 114,944 136,407 21,462 150,979 14,572
© 2014 Ichigo Group Holdings Co., Ltd. All rights reserved. 27

Risk-Based Balance Sheet
Risk-Based Shareholder Equity Ratio 48.7%Consolidated Balance Sheet Risk-Based Balance Sheet
Net Assets
Shareholder Equity Ratio 36.6%
136.4 billion yen
Non-Recourse Loans
33.9 billion yenNon-Recourse LoanRelated Assets
Net Assets102 4 billionyen43.3 billion yen
Cash & Cash Equivalents
16.4 billion yen DebtCorporate Loans
44.4 billion yen
Non-Recourse LoanRelated IGH Equity
9.3 billion yen
102.4 billionyen
Corporate Loans
44 4 billion yenCash & Cash Equivalents
16.4 billion yeny
Operating Investments in Loans 2.1 billion yen
Operational Investments in Securities 2.2 billion yen
Debt52.5 billion
yenDebt86.5
billion yen
Guarantee Deposits Received 3.3 billion yen
44.4 billion yen
Guarantee Deposits Received 3.3 billion yen
y
Operating Investments in Loans 2.1 billion yen
Operational Investments in Securities 2.2 billion yen
Shareholder
Real Estate For Sale
39.5 billion yen
Fixed Assets
yenOthers 4.8 billion yen
Shareholder
Others 4.8 billion yenReal Estate For Sale
39.5 billion yen
Fixed Assets
Equity49.9 billion yen
Fixed Assets
22.1 billion yen
Investments in Securities4.4 billion yen
Others 6.1 billion yen
Equity49.9 billion yen
22.1 billion yen
Investments in Securities4.4 billion yen
Others 6.1 billion yen
© 2014 Ichigo Group Holdings Co., Ltd. All rights reserved. 28

Consolidated P&L
(Million yen)
Feb 14 Q1 Feb 15 Q1 YoY Forecast vs Full-YearForecast
Feb 14Full-Year
Revenues 11,023 6,528 59% 42,000 16% 35,101
Cost of Revenues 9,385 3,270 - - - 27,666
Gross Profit 1,638 3,257 199% - - 7,435
SG&A 870 1,021 - - - 3,522
Operating Profit 767 2,236 292% 7,700 29% 3,912
Non-Operating Gain (Loss), net - 25 - 180 - - - - 315
Recurring Profit 742 2,056 277% 6,500 32% 3,597
Extraordinary Gain (Loss) net 668 336Extraordinary Gain (Loss), net 668 - - - - 336
Pre-tax Profit 1,410 2,056 - - - 3,933
Tax 14 147 - - - - 573
Minority Interests 34 44 - - - - 19
Net Profit 1,360 1,864 137% 6,055 31% 4,526
© 2014 Ichigo Group Holdings Co., Ltd. All rights reserved. 29

Consolidated P&L: Gross Profit Segment Breakdown
(Million yen)
Segment Revenues Gross Profit YoY(Gross Profit)Feb 14 Q1 Feb 15 Q1 Change Feb 14 Q1 Feb 15 Q1 Change
Note: Operating Profit Segment Breakdown on p. 10
Asset Management 1,149 1,095 - 54 704 559 - 145 79%
Asset Management Fees 336 424 88 296 411 115 139%
PM / BM Fees 517 631 114 113 112 - 1 99%
Others 294 38 - 256 294 34 - 260 12%
Real Estate 556 1,322 766 325 1,003 678 309%
Rental Income 556 871 315 325 552 227 170%
Real Estate Sales 0 451 451 0 451 451 -Real Estate Sales 0 451 451 0 451 451 -
Value-Add 8,912 3,964 - 4,948 597 1,638 1,041 274%
Rental Income 829 926 97 325 523 198 161%
Real Estate Sales 8,082 3,037 - 5,045 286 1,115 829 390%
Others 0 0 - - 14 0 14 -
Clean Energy 0 125 125 - 4 39 43 -
Other 405 19 - 386 15 15 0 100%
Ad i F 13 20 7 13 20 7 154%Advisory Fees 13 20 7 13 20 7 154%
Securities Sales 391 -1 - 392 6 0 - 6 -
Others 0 0 0 - 4 - 5 - 1 125%
Total 11,023 6,528 - 4,495 1,638 3,257 1,619 199%
© 2014 Ichigo Group Holdings Co., Ltd. All rights reserved. 30

Consolidated P&L: Segment Q1 Actual vs Full-Year Forecast
(Million yen)
External Sales Change Gross Profit Change Operating Profit Change Revenues GrossProfit
OperatingProfit
SegmentFull-Year Forecast2015/02 1Q Performance (3M)
Asset Management 1,095 30% 559 34% 207 39% 3,634 1,667 536
Asset Management Fees 424 34% 411 35% - - 1,234 1,185 -
PM / BM Fees 631 26% 112 24% - - 2,393 477 -
Others 38 633% 34 567% - - 6 6 -
Real Estate 1,322 9% 1,003 25% 831 28% 15,591 4,064 3,000
Rental Income 871 16% 552 15% - - 5,307 3,574 -
Real Estate Sales 451 4% 451 92% - - 10,284 490 -
Value-Add 3,964 18% 1,638 28% 1,412 29% 21,983 5,813 4,905
Rental Income 926 24% 523 22% - - 3,870 2,333 -
Real Estate Sales 3,037 17% 1,115 32% - - 18,113 3,480 -
Others 0 - 0 - - - 0 0 -
Clean Energy 125 16% 39 20% -41 - 793 197 -157
Other 19 - 15 - -4 - 0 0 -43
Advisory Fees 20 - 20 - - - 0 0 -
Securities Sales -1 - 0 - - - 0 0 -
Others 0 - -5 - - - 0 0 -
Total 6,528 16% 3,257 28% 2,405 29% 42,000 11,742 8,241
- - - - -169 - - - -541
Total 6,528 16% 3,257 28% 2,236 29% 42,000 11,742 7,700
Adjustment (including offsets ofcross-segment transactions)
© 2014 Ichigo Group Holdings Co., Ltd. All rights reserved. 31

Significant Unrealized Gains on Balance Sheet
Real estate directly held by IGH (either on IGH balance sheet or in SPCs where IGH is sole equity holder) (Million yen)
Book Value Cap rate (at Acquisition) Cap Rate (current) Appraisal ValueLocation Acquisition Value NOI Unrealized Gain(after write-
down) NOI / Acquisition Value NOI / Book Value after write-down
as of February 2014
Tokyo 48,231 44,513 2,853 6.4% 6.8% 52,495 7,982
Outside Tokyo 44,214 42,208 2,960 6.8% 7.2% 47,535 5,327
(Note) Excludes two development assets (c. JPY 1,150M) which are not currently generating NOI
y , , , , ,
Total 92,444 86,721 5,813 6.6% 7.0% 100,030 13,309
Real estate held by IGH within IGH-managed funds (SPCs) where there are other non-IGH equity holders
B k V l A i l V lLocation Acquisition Value
Book Value Appraisal ValueUnrealized Gain
as of May 2014 as of May 2014
Equity Investments 2,066 1,227 1,885 +667
© 2014 Ichigo Group Holdings Co., Ltd. All rights reserved. 32

IGH-Owned Real Estate Asset Breakdown
(As of May 2014) (Billion yen)
Assets by Type Assets by Location
Sendai
Tokyo47
6
Kanto16
Assets by Size
Osaka2
Others8
Fukuoka12
Total Assets: JPY 91 Billion
© 2014 Ichigo Group Holdings Co., Ltd. All rights reserved. 33
(AUM Including Ichigo-Managed Assets: 256 billion yen)

Appendix: About Ichigo Group
© 2014 Ichigo Group Holdings Co., Ltd. All rights reserved. 34
Full Service Real Estate & Clean EnergyI hi f i t J bIchigo comes from an ancient Japanese proverb, Ichigo Ichie, meaning “One lifetime, one encounter”
As the core company of the Ichigo Group, Ichigo Group Holdings seeks to serve the needs of society by investing in Japanese real estate We drawserve the needs of society by investing in Japanese real estate. We draw upon our extensive experience in real estate and financial services to provide our shareholders and clients secure long-term returns. As Japan’s first zero-carbon public real estate firm, we are deeply committed to supporting the balanced, green, and ecologically-responsible development of Japan’s economy and society through our real estate investmentof Japan s economy and society through our real estate investment activities.
We were established in March 2000 and listed on NASDAQ Japan (now JASDAQ) in November 2002. We are focused on stable and profitable growth for our shareholders.
Kenji IwasakiScott Callon
g
To strengthen Ichigo Group’s capabilities as a real estate owner/operator, we merged our key real estate subsidiaries on July 1, 2012. The mergers bring together our J-REIT and private equity real estate asset management companies, providing more scale to our teams and enabling us to add further value to small to mid sized assets and ground leases
Scott CallonChairman & Representative Statutory Executive Officer
Callon has lived in Japan since 1994. Previous to Ichigo, he was with he Japan Development Bank Bankers Trust and the UK Prudential Group us to add further value to small-to-mid-sized assets and ground leases.
We operate and add value across the full spectrum of Japanese real estate assets, including a Tokyo Stock Exchange-listed J-REIT (Ichigo REIT, 8975), private equity real estate funds, property management, and facility management.
Japan Development Bank, Bankers Trust, and the UK Prudential Group, and was Managing Director & Head of Equities of Morgan Stanley Japan. He established Ichigo Asset Management in 2006. He has been Chairman and Representative Statutory Executive Officer since October 2008. Callon is one of three judges for the Tokyo Stock Exchange’s annual Corporate Value Improvement Award, as well as a member of the Japanese government’s Competitiveness and Incentives for Sustainable G th B ildi F bl R l ti hi b t C i d In addition, in 2012 we launched a clean energy business
which produces megasolar power nationwide.
We look forward to building upon our track record as a Japanese real estate services provider,
ti f li t d h h ld
Growth: Building Favorable Relationship between Companies and Investors Project in the Ministry of Economy, Trade, and Industry.
Kenji IwasakiPresident & Representative Statutory Executive Officer
Iwasaki has been President and Representative Statutory Executive Officer since October 2008 with 18 years of real estate experience
© 2014 Ichigo Group Holdings Co., Ltd. All rights reserved.
creating success for our clients and our shareholderswhile being ever-mindful stewards of both societyand our environment.
35
Officer since October 2008, with 18 years of real estate experience. From 2004-2008, he was the head of the Company’s real estate fund business. Prior to joining the Company in 2001, he was engaged in urban development projects at Fujita Corporation.

Corporate HistoryA Pioneer in the Real Estate Securitization and Fund Businesses in JapanA Pioneer in the Real Estate Securitization and Fund Businesses in Japan2000 March Establish PI Technology Co., Ltd.
April Establish Asset Managers Co., Ltd.2001 August Asset Managers arranges the securitization of assets from the Ikebukuro store of The Seibu Department Stores, Ltd.
September Merger between Asset Managers and PI Technology
Successful Public Listing Accelerated Business ExpansionSuccessful Public Listing, Accelerated Business Expansion
2002 November List on NASDAQ Japan (now JASDAQ, Ticker:2337)2006 May Set up a board committee system to support corporate governance
December Acquire an equity stake in CITIC International Assets Management Limited, part of the CITIC Group, China's largest banking and financial services group
2007 April Establish private equity real estate fund management company2007 April Establish private equity real estate fund management company2008 March Establish Group holding company
Ichigo Trust Becomes Major Shareholder, Focus on the Core Business of Japanese Real Estate Asset Management
2008 August Bolster capital through a third-party allotment of new shares to Ichigo TrustOctober Appoint Scott Callon and Kenji Iwasaki as Chairman and President, respectively
2009 F b Wi t h ld l t t th G b l h t b i i t f th Z C C tibl N t d M h 18 20112009 February Win noteholder approval to strengthen Group balance sheet by revising terms of the Zero Coupon Convertible Notes due March 18, 2011
Full-Service Real Estate and Clean Energy
2010 February Ichigo Trust becomes our controlling shareholderSeptember Change in Company Name to Ichigo Group Holdings Co., Ltd.
2011 January Acquire Japan Office Advisors, Inc., the asset manager of a J-REIT, Japan Office Investment Corporation (Ticker: 8983)y q p , , g , p p ( )Establish Ichigo Estate Co., Ltd., specializing in small-sized assets and ground leases
March Japan Office REIT renamed Ichigo Real Estate Investment Corporation (Ticker: 8983)August Acquire Fund Creation REIT Advisers Co., Ltd., the asset manager of a J-REIT, FC Residential Investment Corporation (”FCR”, Ticker: 8975)November Merger between FCR and Ichigo Real Estate Investment Corporation (New REIT name: Ichigo Real Estate Investment Corporation, Ticker:
8975)Merger between the two REIT asset management companiesMerger between the two REIT asset management companies
2012 July Merger between J-REIT and private equity real estate fund management companies (New name: Ichigo Real Estate Investment AdvisorsCo., Ltd.)Merger between Ichigo Estate and Ichigo Solutions Co., Ltd. (New name: Ichigo Estate Co., Ltd.) Establish Ichigo Global Capital Co., Ltd. specializing in cross-border fundraising and M&A advisoryIchigo’s Miyake wins a silver medal at London Olympics, the first Japanese medalist in women’s weightlifting
© 2014 Ichigo Group Holdings Co., Ltd. All rights reserved.
November Establish Ichigo ECO Energy Co., Ltd., specializing in clean energy2013 November Ichigo Group and Ichigo REIT simultaneous PO (Japan’s first double PO)2014 January Announce Shift Up 2016 mid-term business plan
36

Ichigo Group Holdings Co., Ltd. Company Profile
Name
Address
Established
Ichigo Group Holdings Co., Ltd.The Imperial Hotel Tower, 1-1-1 Uchisaiwaicho, Chiyoda-ku, Tokyo 100-0011
March 17, 2000 Board andSenior Executives
8 Directors, of which 5 Independent Directors12 Executive Officers
Paid-in Capital
Major Shareholder
Business
26,443 million yen (as of May 2014)
Ichigo Trust (as of February 2014)
Full-Service Real Estate and Clean Energy
Scott Callon Chairman & Representative Statutory Executive Officer Kenji Iwasaki President & Representative Statutory Executive Officer Minoru Ishihara Executive Vice President & Statutory Executive Officer
(Real Estate Services) Takashi Minamikawa Executive Managing Director & Statutory Executive
Officer (Finance)
Registrations & Licenses
First-class Architectural Firm, Tokyo Metropolitan Government registration #55543Real Estate Business, Tokyo Metropolitan Government (1) registration #90527Construction Licenses, Tokyo Metropolitan
Statutory Executive Officers(as of March 1, 2014)
Officer (Finance)Eri Murai Senior Statutory Executive Officer (Administration & HR)Katsuhiko Hattori Statutory Executive Officer
(Engineering, Environmental & Architectural Solutions) Haruki Nakane Statutory Executive Officer (Compliance)Hiroshi Shimazu Statutory Executive Officer (Audit)Hi hi T t St t t E ti Offi (Fi )
Listed Exchange
Consolidated Subsidiaries
Government (26) registration #141677
JASDAQ (Security code: 2337)
57 companies (as of May 2014)
Hisayoshi Towata Statutory Executive Officer (Finance)Kenichi Nagao Statutory Executive Officer (Business Development,
Special Projects) Takeyuki Yoshimatsu Statutory Executive Officer (Business Management) Masaaki Yajima Statutory Executive Officer (Real Estate Services)
Company’s Shareholders’ Meeting
Audit Committee
Nominating Committee
Compensation Committee
Compliance Committee
P id t
Board of Directors
ChairmanGroup Management
Committee Audit
Website www.ichigo-holdings.co.jp/english
PR & IRSystemsBusiness DevelopmentLegal & Risk Management
Finance
President
Business Planning FinanceAccountingSpecial Projects
Business Management
Committee
Real Estate Services
Office AssetsResidential AssetsRetail/Hotel AssetsInternational Sales
Compliance
Administration & HR
AdministrationHRIchigo UniversityCash Management
© 2014 Ichigo Group Holdings Co., Ltd. All rights reserved.
(As of March 1, 2014)
37
Legal & Risk Management Special ProjectsInternational SalesEngineeringEnvironmental & Architectural SolutionsPM&BM Development
Cash Management
C B i F ll S i R l E t t d Cl E
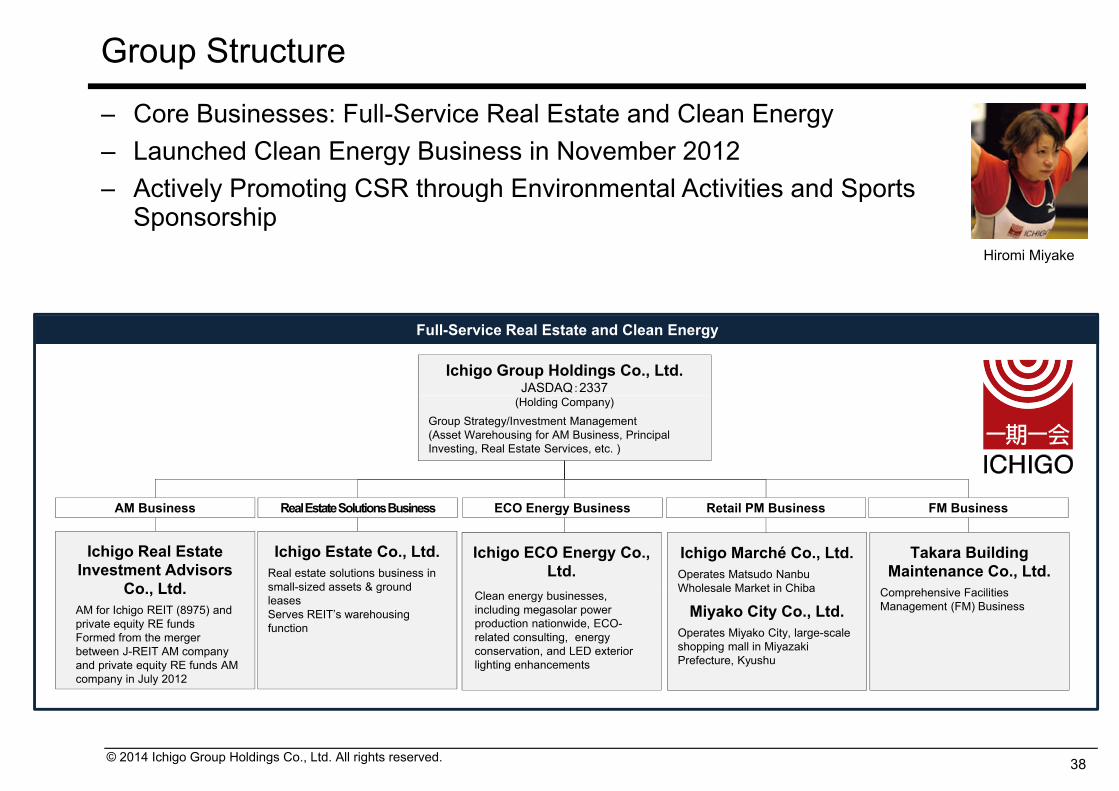
Group Structure
‒ Core Businesses: Full-Service Real Estate and Clean Energy ‒ Launched Clean Energy Business in November 2012‒ Actively Promoting CSR through Environmental Activities and Sports y g g p
Sponsorship Hiromi Miyake
Ichigo Group Holdings Co., Ltd.JASDAQ:2337
Full-Service Real Estate and Clean Energy
(Holding Company)Group Strategy/Investment Management (Asset Warehousing for AM Business, Principal Investing, Real Estate Services, etc. )
Ichigo Real Estate Investment Advisors
Co Ltd
Ichigo Estate Co., Ltd.Real estate solutions business in small-sized assets & ground
Real Estate Solutions Business ECO Energy BusinessAM Business
Ichigo ECO Energy Co., Ltd.
FM Business
Takara Building Maintenance Co., Ltd.
C h i F iliti
Retail PM Business
Ichigo Marché Co., Ltd. Operates Matsudo NanbuWholesale Market in ChibaCo., Ltd.
AM for Ichigo REIT (8975) and private equity RE fundsFormed from the merger between J-REIT AM company and private equity RE funds AM company in July 2012
small sized assets & ground leasesServes REIT’s warehousing function
Clean energy businesses, including megasolar power production nationwide, ECO-related consulting, energy conservation, and LED exterior lighting enhancements
Comprehensive Facilities Management (FM) Business
Wholesale Market in Chiba
Miyako City Co., Ltd.Operates Miyako City, large-scale shopping mall in Miyazaki Prefecture, Kyushu
© 2014 Ichigo Group Holdings Co., Ltd. All rights reserved. 38

These materials were prepared to explain the Company’s businesses and are not for the purpose ofsoliciting investment in marketable securities issued by the Company. The Company does notguarantee the accuracy of the figures, information, estimates or other statements included herein, andg y g , , ,accepts no responsibility for damages or losses arising through the use of the figures, information,estimates or other statements contained herein.
These materials are based upon information available as of the publication date, and may containp p , yforward-looking statements pertaining to the Company’s expectations, targets, plans and strategies.Such forward-looking statements are not facts, but are the result of management’s judgment based oninformation currently available. Actual operating results or developments concerning the Companymay differ substantially from those indicated by forward-looking statements. The information enclosedy y y gis subject to revision without prior notice.
Contact:Ichigo Group Holdings Co., Ltd.Investor Relations
TEL: +81-3-3502-4818 FAX:+81-3-3502-4801E-mail: [email protected]/englishIchigo Group is Japan’s first zero-carbon listed real estate company. We are
© 2014 Ichigo Group Holdings Co., Ltd. All rights reserved.
g p p p ytaking responsibility for our environmental footprint by offsetting our carbon emissions as well as working with organizations to invest in low-carbon technologies.
39