iceird 2014 proceedings book 2014 proceedings a4.pdf · 2014-08-26 · of iceird 2014 and the...
TRANSCRIPT
ICEIRD 2014 The 7th International Conference for Entrepreneurship, Innovation and Regional Development
5-6 June 2014, Nicosia, Cyprus
Editors:
G. A. Papadopoulos, P. H. Ketikidis & S. A. Kofteros

2
EDITORS:
George A. Papadopoulos University of Cyprus Department of Computer Science Nicosia, Cyprus E-mail: [email protected] Panos H. Ketikidis University of Sheffield International Faculty, CITY College Thessaloniki, Greece E-mail: [email protected] Stavriana A. Kofteros Democratic Rally (DISY) Nicosia, Cyprus E-mail: [email protected]
ISBN 978-9963-7355-4-9

III
WELCOME NOTE
It is our great pleasure to welcome you to the 7th International Conference for Entrepreneurship, Innovation and Regional Development (ICEIRD 2014) in Nicosia, Cyprus. Since the 1st ICEIRD in 2008, the International Conference for Entrepreneurship, Innovation and Regional Development has been committed to providing an effective channel of communication between decision-makers (government, ministries and state agencies), researchers (universities, research and development centres, start-up centres and incubators), practitioners (SME leaders and managers) and persons concerned with the latest research, scientific development and practice on innovation and entrepreneurship in order to discuss topics that are of currency, relevance and significance for national competitiveness as well as sustainable, robust , and equitable regional development. ICEIRD has been the key forum for:
• Addressing key factors in regional economic development, entrepreneurial vitality and innovation processes
• Raising the level of awareness about innovation, entrepreneurship and competitive advantage
• Strengthening the regional and international network among representatives from SEE countries and those from EU member states
• Consolidating intra-SEE networks of SMEs, Start-up Centers and Incubators • Understanding cultural and national barriers of entrepreneurship in the global
economy • Promoting best practices in innovation research and business development • Facilitating regional partnerships and innovation networks
The multidisciplinary ICEIRD community encompasses interests at regional and international level and is targeted to academics, entrepreneurs, policy-makers, researchers and students who are involved in the latest research, scientific development and practice on innovation and entrepreneurship.
Putting together ICEIRD 2014 has been a team effort. First of all, we would like to thank the authors of all submitted papers. Furthermore, we would like to express our gratitude to the program committee and to all external reviewers, who worked very hard on reviewing papers and providing suggestions for their improvements.
The technical program consists of 51 full-papers. Moreover, we are proud and thankful of having two renowned keynote speakers at the 2014 edition of ICEIRD:
• Georgios Peroulakis on “Innovation policy making in the EU, RIS3: a crisis exit strategy? The case for Cyprus and Greece”
• George E. Georgiou on “Novel Photovoltaic Technologies for Improved Energy Harvesting”
Furthermore, a Stakeholders Meeting Event is conducted as a Satellite Event in the context of ICEIRD 2014 and the European INTERREG IVC project InnoFun, as well as the First Roundtable Discussion on Triple Helix (University – Industry – Government) Interactions in Cyprus.

IV
Finally, we would like to thank our sponsors, CEIRD, Cyprus Telecommunications Authority, the University of Sheffield, Austrian Airlines, the Cyprus Tourism Organisation and the University of Cyprus for their support of this conference.
We hope that you will find this program interesting and thought-provoking and that it will provide you with a valuable opportunity to share ideas with other researchers and practitioners from institutions around the world.
George A. Papadopoulos
ICEIRD 2014 General Chair University of Cyprus,
Nicosia, Cyprus
Panos H. Ketikidis
ICEIRD 2014 Co-Chair CITY College - International Faculty of the University of
Sheffield Greece
Stavriana A. Kofteros
ICEIRD 2014 Co-Chair Special Entrepreneurship &
RDI Adviser, Democratic Rally (DISY) Cyprus
V
COMMITTEES
CONFERENCE CHAIR
Prof. George A. Papadopoulos (General Chair)
University of Cyprus, Cyprus
Prof. Panos H. Ketikidis (Co-Chair) CITY College - International Faculty of the University of Sheffield, Greece
Stavriana A. Kofteros (Co-Chair) Special Entrepreneurship & RDI Adviser, Democratic Rally (DISY), Cyprus
LOCAL ORGANIZING COMMITTEE
Prof. George A. Papadopoulos University of Cyprus, Cyprus
Eleni Stavrou-Costea Department of Public and Business Administration, University of Cyprus, Cyprus
PROGRAMM COMMITTEE
Ioannis Bakouros Mater Lab, Greece
Dimitar Birov University of Sofia, Bulgaria
Alok Choudhary The University Of Sheffield, UK
Petros Kefalas CITY College - International Faculty of the University of Sheffield, Greece
Radmil Polenakovik Cyril and Methodi University, Skopje
Adrian Solomon The University of Sheffield International Faculty, City College, UK
Anna Sotiriadou CITY Liberal Studies, Greece
Zeljko Tekic University of Novi Sad, Serbia
Yanka Todoroff Sofia University, Bulgaria
Bahadir Tunaboylu Istanbul Sehir University, Turkey
Nikos Zaharis SEERC, Greece

VII
TABLE OF CONTENTS
REGIONAL INNOVATION STRATEGIES AND SMART REGIONS ......................................................... 1
The EcoHelix: Redefining Paradigms and Co-Creating Value through Ecotourism as Stewardship ...................................................... 3
David Lansdale, Patricio Álvarez, Ana Deaconu, María José Ayala, Andrea Espinoza, Candy Abad, Diego Rojas
Unused Potential of Co-Creation in South-East Europe: Is it about the Culture? .............. 13
Anja Orcik, Zeljko Tekic, Jelena Borocki, Zoran Anisic
Transferable Cluster Policies in the South-East Europe Region ....................................... 22
Predrag Matkovic, Marton Sakal, Pere Tumbas, Tiberiu Diaconescu
Boosting the Innovation Potential in the Metropolitan area of Thessaloniki Through Triple Helix Interactions ............................................................. 32
Panayiotis Ketikidis, Tatjana Taneva, Adrian Solomon
Application of methodological tools for the design and validation of new business models in Entrepreneurship ICT in Colombia............................................. 42
Gladys Elena Rueda, Maryi Cardrazco, Juan Carlos Aguirre
SMART GROWTH FOR SMES .................................................................................................. 51
Towards a new, Multidimensional Management and MeasurementFramework of (Young) German Small and Medium Sized Enterprises’ Intellectual Capital .........................53
Sabrina Aschenbrenner, Thomas Heupel, Mercedes Carmona-Martínez
The Human Resource Practices as Drivers of Innovations in SMEs.......................................64
Vesna Zabijakin Chatleska
Importance of Financial Information in Improving SMEs performance ...................................73
Katarina Zager, Nikolina Decman, Ana Novak
SMEs in the cloud: The impact of cloud adoption on economic growth and development .............................................................................................................................83
Evangelia Filiopoulou, Persefoni Mitropoulou, Christos Michalakelis
ENTREPRENEURIAL LEARNING AND EDUCATION ...................................................................... 95
Entrepreneurial Knowledge and Educational Structures ...........................................................97
Jörg Dötsch
Capstone Design Courses as a Vehicle for Technology Transfer .........................................107
Efthimia Staiou, Sencer Yeralan, Murat Fadiloglu

VIII
Developing University–SME Collaboration ................................................................................117
Sinikka Seppänen, Kristiina Lilja
Should I stay or should I go: is the leadership style important for the sector where it is performed? ..................................................................................................................123
Gligor Stojkov, Dusica Janevska, Radmil Polenakovik
The Impact of Student's Entrepreneurship Education on Self-employment and Business Start-up Intentions: Research Results from Serbia .................................................133
Srdan Bogetic, Dejan Dordevic, Dragan Cockalo
MANAGEMENT OF INNOVATION IN SMES ............................................................................... 143
Implementation of Environmental Management Systems into SMEs ....................................145
Ruzena Kralikova, Lydia Sobotova, Miroslav Badida
Debt management in small and medium-sized enterprises using financial ratios ...............150
Lajoš Žager, Sanja Sever Mališ, Ana Ježovita
Potential for the Improvement of Innovation Activities of SMEs .............................................160
Miroljub Hadžić, Petar Pavlović
Does Internationalization of Small and Medium Enterprises (SME-s) Determines the Allowance of Bank Loans for Investment – an overview of Kosovo SME-s .........................170
Florin Peci
REGIONAL AND NATIONAL DEVELOPMENT STRATEGIES ......................................................... 181
Cluster Policy and Cluster Governance in Croatia ...................................................................183
Mirjana Dragičević, Alka Obadić
The place of Russia in the Entrepreneurship and Innovative Development of BRICS countries ..........................................................................................................................................191
Svetlana Gusarova
Research and development - a potential growth driver of the European economy ............200
Tomislav Herceg, Marina Dabic, Davor Vlajcic
''EUROPE 2020'' strategy as a global imperative for SEE countries .....................................210
Andjelko S. Lojpur, Milivoje Radovic, Ana Lalevic-Filipovic
Three years of GEM in Bucaramanga: a comparative analysis .............................................220
Maryi Cadrazco, Gladys Rueda

IX
ENHANCING THE COMPETITIVENESS OF SMES THROUGH INNOVATION .................................... 227
Intrapreneurial management profiles of Chief Executive Officers in SMEs ..........................229
Bidyut Baruah, Anthony Ward 17 not word, 6 keywords not in alphab
Business Membership Organizations as a policy approach to increase SMEs’ EU funds absorption .......................................................................................................................................239
Tobias Stolz, Tine Schrammel
Role of International Financial Reporting Standards for small and medium sized entities in the quality of business information ..............................................................................................249
Ivana Mamić Sačer, Ivana Sever
Valuing and Dealing Patents in High-Tech Industries – Implications for SMEs...................259
Zeljko Tekic, Milana Vitas, Miroslava Drazic, Dragan Kukolj
Improving and Developing the Quality of SME Business Operations Aimed at the Economic Development of the Republic of Serbia ...................................................................265
Srdjan Bogetic, Zorana Antic, Milka Ivanovic, Maja Durica
PATHWAYS TO FUNDING – FINANCIAL TOOLS ........................................................................ 275
Crisis, Co-Financing, and Crowdfunding: Igniting Regional Development ...........................277
Thomas Müllerleile, Dieter William Joenssen, Andreas Müllerleile
Emerging VC industry: do market expectations play the most important role in project selection? Evidence on Russian data .........................................................................................286
Ivan Rodionov, Alexander Semenov, Eleonora Gosteva, Ekaterina Eremeeva
Innovation Funding: The Case of Cyprus ..................................................................................296
Christos Mettouris, George A. Papadopoulos
Fostering cross-border early stage funding for innovative SMEs in the region of South-East Europe: The case of the VIBE project ........................................................................................306
Andreas C.R. Baresel-Bofinger, Panayiotis H. Ketikidis, Nikos Zaharis, Fay Kandiliari
The Presence of Venture Capital in Less Developed Regions - a Key Cultural Necessity? ..........................................................................................315
Aron Jinaru, Alexandru Caragea, Roxana Voicu-Dorobantu, Thomas Straub,
Stefano Borzillo
FOSTERING ENTREPRENEURSHIP AND INNOVATION ................................................................ 327
A Methodology Guide for the Transformation of Research to Innovation .............................329
Athanasios P. Kalogeras, Christos Anagnostopoulos

X
A Guide to assessing the impact of innovation and technology transfer in the economic and social plan ..................................................................................................336
Sorin Mircea Axinte, Bogdan Ciocanel, Gheorghe Bala
Sustaining Entrepreneurial Ecosystems with ebarts ................................................................344
Yasmine Arafa, Miriam Joy Morris and Cornelia Boldyreff
Overcoming Crisis: from Offshore to Online ..............................................................................349
Alexander Zelitchenko
University Research and Development Projects in a Rapidly Changing Technology Environment....................................................................................................................................357
Sencer Yeralan , Efthimia Staiou
PROMOTING ENTREPRENEURSHIP AND INNOVATION FOR COMPETITIVE REGIONS ...................... 363
Impact of using unique resources of the regions classified by rurality for higher value added and new jobs creation .......................................................................................................365
Zivile Gedminaite-Raudone
Social Enterprises in Regional Innovation Systems .................................................................374
Satu Rinkinen, Tuija Oikarinen, Helinä Melkas
The impact of the EU cohesion policy on the regional convergence process of the new member states in the European Union .......................................................................................384
Radmila Jovančević, Tomislav Globan
ICEIRD2014: Family-friendliness and regional competitiveness. Family-friendliness: Best practice ...................................................................................................................................394
Sviatlana Prakapiuk, Prof. Dr. Christopher Stehr, Prof. Dr. Martina Eckardt
INNOVATIVE SUPPLY CHAINS , NETWORK COLLABORATION AND JOINT VENTURES ..................... 403
Reverse Supply Chain for Remanufacturing with Uncertain Demand and Return Product Yield .................................................................................................................................................405
Samar K. Mukhopadhyay
Comparative Electricity Demand Generation Forecast, Applying a Grey Analysis Model in Correlation with Monte Carlo Simulation in Discretized Time Frames ..................................415
Moyses Moyseos, Stefanos Katsavounis, Nikolaos Patsianis
Data mining in customer profitability analysis ...........................................................................425
Dražena Gašpar, Ivica Coric, Mirela Mabic

XI
A Methodological Approach for the Enhancement of Solar Thermal Market in South East Europe .............................................................................................................................................434
Athanasios Kalogeras, Gino Verrocchi
INNOVATION PROCESSES IN SERVICES ................................................................................... 445
Reducing skills mismatch as a key for increasing the regional competitiveness of women entrepreneurs in SEE ....................................................................................................................447
Bojan R. Jovanovski, Igor Nikoloski, Radmil Polenakovik, Trajce Velkovski, Emilija Nikoloska
Tires recycling ................................................................................................................................457
Radoš Vorkapic, Rade Vorkapic
Innovation as a business model for SMEs .................................................................................464
Sorin Mircea AXINTE, Gabriela IVANUS
Science and Technology Park-a tool in promoting and sustaining innovation in SMEs .....473
Sorin Mircea AXINTE, Alexandru MARIN,Gabriela IVANUS
Challenges in developing online business networking competencies for Albanian and Estonian business students ........................................................................................................483
Oliana Sula, Tiit Elenurm
AUTHOR INDEX .................................................................................................................... 491
ICEIRD 2015 ...................................................................................................................... 493


1
REGIONAL INNOVATION STRATEGIES AND SMART REGIONS


3 Proceedings of International Conference for Entrepreneurship, Innovation and Regional Development
ICEIRD 2014
The EcoHelix: Redefining Paradigms and Co-Creating Value through Ecotourism as Stewardship
David Lansdale1, Patricio Álvarez2, Ana Deaconu3, María José Ayala4, Andrea Espinoza5, Candy Abad6, Diego Rojas7 1 Beyond Chacay Foundation, 19 Sears Road, Vermont USA, [email protected]; Universidad San Francisco de Quito, Colegio de Administración para el Desarrollo, Cumbaya, Ecuador, [email protected] 2 Delloitte &Touche, Amazonas y Juan Pablo Sanz, Quito, Ecuador, [email protected] 3 Comisión Fulbright Ecuador, PO Box 17-07-9081, Quito, Ecuador, [email protected] 4 Imperial College London Centre for Environmental Policy, [email protected] 5 Universidad San Francisco de Quito, Colegio de Administración para el Desarrollo, Cumbayá, Ecuador, [email protected] 6 Universidad San Francisco de Quito, Colegio de Administración para el Desarrollo, Cumbayá, Ecuador, [email protected] 7 Beyond Chacay Foundation, Los Granados 374, Quito, Ecuador, [email protected]
Traditional development paradigms face the challeng e of sustainability. This paper presents an innovative intervention that is grounde d in Ecotourism as Stewardship, focuses on the co-creation of value, and is based o n the promotion of a dynamic entrepreneurship ecosystem. This ecosystem arises f rom the collaboration of the public, private and civic sectors, and academia, th e four blades of the quadruple helix. Ecopreneurship, the promotion of ecologically respo nsible startups, provides sustainable outcomes and addresses both economic an d ecological benefits and opportunities. Emerging market economies in particu lar stand to benefit from the EcoHelix intervention, and the dramatic increase of tourism internationally holds great promise for local, community based entrepreneurship initiatives, with tourists and local entrepreneurs working together as agents of c hange to promote quality of life for both clients and service providers. The EcoHelix is a dynamic, iterative, cloud based platform and mobilizes the Lean Startup model to en able small businesses to succeed, in a joint venture with their clients, bas ed on constant input and the opportunity for the latter to invest their time, ta lent and treasure to that end. The potential of the EcoHelix model lies in its capacit y to be replicated in tourism destinations around the world where entrepreneurshi p would benefit the local community.
Keywords

4 Proceedings of International Conference for Entrepreneurship, Innovation and Regional Development
ICEIRD 2014
Co-Creation of Value; Ecopreneurship; Ecotourism as Stewardship; Sustainability
1. Introduction and Overview
Sustainability is one of the major challenges in traditional economic development models. Additionally, many interventions and proposed solutions fail to present alternative models that question existing paradigms. This paper addresses the following paradigms: northern-southern hemisphere cultural and economic dependence [1]; the role of eco-tourists as change agents [2]; the co-creation of value in the value chain [3]; the incompatibility between business and conservation [4]; the collaboration of the public, private, civic sectors and academia to create dynamic entrepreneurship ecosystems [5]; personal motivation based on self-efficacy theory [6]; a compelling theory of change driven by entrepreneurship [7]; the mobilization of the Internet as a vehicle for mobilizing resources to promote economic opportunity [8], environmental awareness [9], and quality of life in emerging and developing markets [10].
This paper proposes an innovative intervention driven by ecotourism as stewardship, based on a pilot project. A group of fifty-five high school students, under the guidance of a team of twelve university student leaders, collaborated for two and a half weeks in August 2013 to create a data base of every business on the island of San Cristobal, Galapagos, capital of the Enchanted Isles Archipelago, a UNESCO Natural Heritage Site for Humanity. A cloud-based platform, www.ecohelix.com, was created, based on existing models including Trip Advisor, eBay, Kiva, Kickstarter, and SalesForce. The foundation of the intervention is based on the collaboration between the public, private, civic sectors and academia, with the Internet as the driver and hub of the quadruple helix. Communities are the unit of analysis, and community based ecopreneurship is the outcome, with high school students and tourists as agents of change. A beta version of the platform provides access to the database of businesses in Puerto Baquerizo Moreno, and smart phone applications are being developed that will provide seamless access to that information. Tourists not only have direct access to that information, but also can rank their experience regarding quality of product, customer service, cleanliness, environment and accessibility. The EcoHelix facilitates tourist access to community based experiences, creates healthy competition, and most significantly, enables tourists to invest their time, talent and treasure to enable small businesses to refine and improve their business model, based on the Lean Startup approach [11]. Value chain clusters [12], including ecotourism, also provide opportunities for return on investment by ecotourists, introducing environmental sustainability and economic development [9]. 2. Paradigm Shifts, the Co-creation of Value, and a Compelling Theory of Change
2.1 The Context: Latin America, Ecuador, and the Ga lapagos Islands
Latin America is famous for its paradoxes: It is wealthy in natural resources, but few countries manage to keep the wealth at home with its own people. The continent has unusually high levels of entrepreneurial initiatives among ordinary citizens, yet this does not translate into sustained economic growth. It is renowned both for the intact nature of much of its natural beauty as well as for its extreme levels of environmental degradation. It is rich in diversity of cultures, yet inequality and poverty rates rank consistently high. For these
5 Proceedings of International Conference for Entrepreneurship, Innovation and Regional Development
ICEIRD 2014
reasons, Latin America has long been an important focus of international development efforts [1]. Yet old development paradigms have proven largely ineffective. Development strategies often approach problems from only one or a few disciplines, and do not account for all the dimensions necessary to develop a holistic understanding and design a complete solution. As a result, development strategies often create an unwanted trade-off between economic opportunity and locally-based culture, values and lifestyles. This paper proposes a new model based on interdisciplinary analysis, multi-sectorial cooperation and the co-creation of shared value between local communities and the globalized world, with eco-tourists as agents of change [2]. One of the most fascinating case studies in Latin America, Ecuador, is also the most biodiverse country, per square meter, in the world. In recent years, its charismatic president, Rafael Correa, has rewritten the constitution, focusing on a traditional indigenous concept, Sumak Kawsai, which roughly translates into well-being or quality of life. While much of the country’s development since he took power in 2007 has been driven by the price of oil per barrel, the government has recognized tourism as its most promising investment: the president has authorized $600 million toward both promoting Ecuador internationally and developing the infrastructure the country needs to address a growing stream of tourists. In 2013, the Ministry of Tourism bought the rights to the Beatles’ All You Need Is Love, and has invited Paul McCartney to visit the country and perform in the capital in May 2014. Taking advantage of these two initiatives, an ambitious campaign was launched by the Ministry through various social networks to attract the world’s attention to Ecuador as an extraordinary tourist destination. Three significant paradigms shifts can trace their origin to Ecuador. In the 17th century, a team of geographers, led by La Condamine, identified the colony of Spain at the time as the Middle of the World. Roughly a century later, the German explorer and naturalist, Alexander von Humboldt, visited Ecuador and launched a new discipline based on his research: ecology. And probably the most renowned paradigm shift can trace its origin to the Galapagos Islands, which first received international recognition based on the research of its most renowned visitor, Charles Darwin, in 1836. Darwin’s groundbreaking study of the fauna and flora of the Enchanted Islands captured the imagination of the scientific community and became the foundation for the theory of evolution.
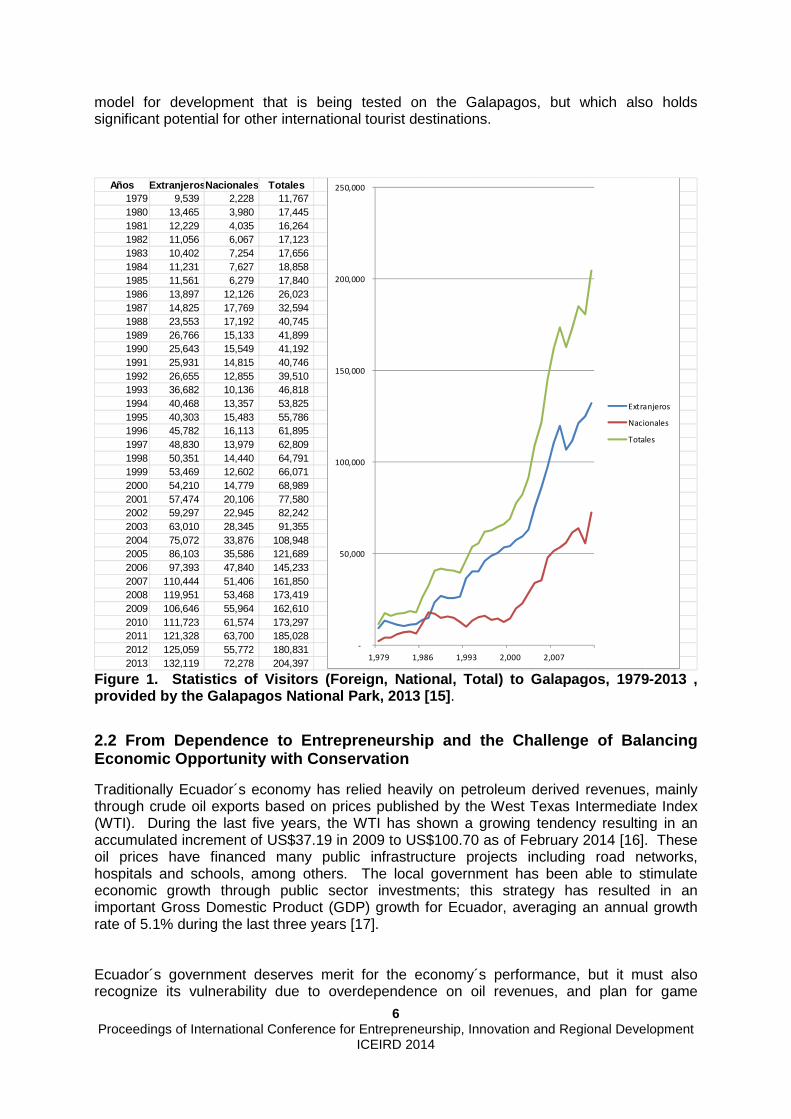
The Galapagos Islands are famous for their unique and idiosyncratic biodiversity [13]. The merits of the Galapagos Islands earned them classification as a UNESCO World Heritage Site in 1978. In 2007, however, environmental threats posed by invasive species, over-fishing and unbridled tourism earned the Galapagos a new title on the UNESCO List of World Heritage Sites in Danger. Tourism has a significant economic presence in Galapagos, but many of the benefits go to exogenous companies. While Galapagos enjoys the highest reported per capita income in Ecuador, 52% of Galapagos residents experience poverty conditions.[14] Figure 1 below demonstrates that in the 1980’s, the Galapagos Islands began to experience a dramatic growth in tourists whose imagination was captured by the opportunity to visit this world class natural heritage site. The influx of tourists, originally arriving by boat, received a significant boost when the airports of Baltra, a former U.S. naval base during World War II, and later Puerto Baquerizo Moreno, made it possible for airlines to take advantage of a new, growing, and lucrative destination. The growth in tourism, based predominantly on a cruise based model, also required the labor necessary to provide services for the growing tourism industry. It is the confluence of these factors that provide the backdrop for an alternative
6 Proceedings of International Conference for Entrepreneurship, Innovation and Regional Development
ICEIRD 2014
model for development that is being tested on the Galapagos, but which also holds significant potential for other international tourist destinations.
Años Extranjeros Nacionales Totales1979 9,539 2,228 11,767 1980 13,465 3,980 17,445 1981 12,229 4,035 16,264 1982 11,056 6,067 17,123 1983 10,402 7,254 17,656 1984 11,231 7,627 18,858 1985 11,561 6,279 17,840 1986 13,897 12,126 26,023 1987 14,825 17,769 32,594 1988 23,553 17,192 40,745 1989 26,766 15,133 41,899 1990 25,643 15,549 41,192 1991 25,931 14,815 40,746 1992 26,655 12,855 39,510 1993 36,682 10,136 46,818 1994 40,468 13,357 53,825 1995 40,303 15,483 55,786 1996 45,782 16,113 61,895 1997 48,830 13,979 62,809 1998 50,351 14,440 64,791 1999 53,469 12,602 66,071 2000 54,210 14,779 68,989 2001 57,474 20,106 77,580 2002 59,297 22,945 82,242 2003 63,010 28,345 91,355 2004 75,072 33,876 108,948 2005 86,103 35,586 121,689 2006 97,393 47,840 145,233 2007 110,444 51,406 161,850 2008 119,951 53,468 173,419 2009 106,646 55,964 162,610 2010 111,723 61,574 173,297 2011 121,328 63,700 185,028 2012 125,059 55,772 180,831 2013 132,119 72,278 204,397
-
50,000
100,000
150,000
200,000
250,000
1,979 1,986 1,993 2,000 2,007
Extranjeros
Nacionales
Totales
Figure 1. Statistics of Visitors (Foreign, Nationa l, Total) to Galapagos, 1979-2013 , provided by the Galapagos National Park, 2013 [15] .
2.2 From Dependence to Entrepreneurship and the Cha llenge of Balancing Economic Opportunity with Conservation
Traditionally Ecuador´s economy has relied heavily on petroleum derived revenues, mainly through crude oil exports based on prices published by the West Texas Intermediate Index (WTI). During the last five years, the WTI has shown a growing tendency resulting in an accumulated increment of US$37.19 in 2009 to US$100.70 as of February 2014 [16]. These oil prices have financed many public infrastructure projects including road networks, hospitals and schools, among others. The local government has been able to stimulate economic growth through public sector investments; this strategy has resulted in an important Gross Domestic Product (GDP) growth for Ecuador, averaging an annual growth rate of 5.1% during the last three years [17].
Ecuador´s government deserves merit for the economy´s performance, but it must also recognize its vulnerability due to overdependence on oil revenues, and plan for game
7 Proceedings of International Conference for Entrepreneurship, Innovation and Regional Development
ICEIRD 2014
changing tendencies in the future. The government is currently working on a strategy shift towards a new productive matrix in which this oil dependence is addressed, and new agents are incorporated as key players in the long term economic growth strategy [18]. This aspired productive diversification aligns perfectly with the EcoHelix’s core strategy, which is to bring together investors and community entrepreneurs through ecotourism using a technological platform as a foundation for communication, collaboration and expansion. This will ultimately result in an increase of foreign investment that will encourage further improvement of current products in order to deliver more processed goods and fewer commodities - like raw materials.
One component of the EcoHelix’s paradigm is to create a sustainable income source that brings together multiple stakeholders with a common objective. Aside from generating revenue from tourism, the EcoHelix initiative generates value throughout its value chain. Another component involves stewardship itself: this is a result of the tourist stays that will include visits to local businesses. If visitors are interested in any of the businesses as potential investment projects, they are given the option to become mentors or investors for these businesses. These investments will result in value generation for both local business owners and foreign investors. The EcoHelix´s role is to facilitate these investments through its platform and through direct advisory. This advisory includes project analysis, business model definition and sustainability certification to ensure that the investors will receive a well-structured “winning” project which is both sustainable and financially attractive.
Tourism can also result in incremental sales for local business owners without the necessity of investment. One of EcoHelix’s platform applications will permit local business to access a virtual, local marketplace in which they can generate important growth in sales. According to Hart and Milstein, “A sustainable enterprise is one that contributes to sustainable development by delivering simultaneously economic, social, and environmental benefits - the so-called triple bottom line.” [19]. The EcoHelix model generates value on all levels of its value chain and benefits economic, social and environmental aspects of its stakeholders. In summary, the EcoHelix intervention seeks to maximize economic benefits for all of the stakeholders in the value chain.
2.3 Ecopreneurship: Addressing the Balance between Economic Development and Ecological Responsibility
One of the major challenges the EcoHelix model faces in a destination as fragile as Galapagos is the conservation of its flora and fauna. In general, the world’s natural resources face unprecedented pressures due, in part, to explosive population growth and significant consumption patterns stemming from economic development. Historically, the tourism industry has been linked to ecological and social impacts associated with factors such as overconsumption of resources, environmental contamination in terms of emissions and discharges, waste generation, energy consumption, ecosystem disruption, population influx, economic inequality and alterations of community interactions [13, 14, 20].
The Galapagos Islands have faced all of these pressures as a result of a booming tourism industry where the balance between environmental conservation and economic development has not quite levelled out. The island’s ecological fragility, endemism and biological diversity add to the current challenge of ensuring environmental sustainability while managing these natural resources as a source for local and national economic development. There is a longstanding perception that economic gain and ecological conservation are incompatible [14, 21, 22]. Past and current threats to Galapagos’ preservation affirm this
8 Proceedings of International Conference for Entrepreneurship, Innovation and Regional Development
ICEIRD 2014
notion. Researchers question how economic development and resource conservation can reconcile to promote environmental sustainability, and how continued tourism growth can succeed without further depleting the island’s natural resources [14]. These concerns need to be addressed and resolved to ensure the conservation of valuable ecosystems, especially in world renowned destinations like the Galapagos. An alternative approach to addressing these questions calls for the revision and disruption of traditional paradigms. The Ecohelix project leverages entrepreneurship to develop disruptive thinking for sustainable innovation to find answers to these questions. Since the 1990’s, researchers have argued that business and the environment are not only compatible, but that they form synergies that can be more effective for driving conservation than tools stemming from government regulation and civil society. Ecopreneurship or sustainable entrepreneurship, defined as ‘the continuing commitment by businesses to behave ethically and contribute to economic development while improving the quality of life of the workforce, their families, the local and global community, as well as future generations’ [9], is an innovative business and societal movement that is bridging that gap between profit, people and planet. Drivers such as environmental awareness, demand for sustainable products and services, finite resources, business risk management and economic efficiency [22, 23] have propelled the rise of the ecopreneur and the creation of sustainable business models that prove that achieving the triple bottom line (benefits for people, the planet, and profits) is an attainable win-win strategy [23]. Not only is green business effective for large corporations, but research shows that small and medium enterprises (SME’s) can also harness the benefits of creating profitable, sustainable businesses to reduce poverty in resource dependent economies. With SME’s accounting for almost 95% of private sector firms in most nations, it is imperative that they act as agents of change, given that their contribution can be more meaningful for sustainability in a local context [6]. As Allen & Malin [23] highlight, green entrepreneurship can ‘allow the problems of poverty and natural resource dependency to be more thoroughly and intelligently approached’ (p. 829). These scholars [23] agree that ‘green entrepreneurship can be a driving force for a new economic start for modern economies’, consolidating EcoHelix’s commitment of promoting entrepreneurial innovation through successful green businesses as a tool for improving local livelihoods, but at the same time ensuring environmental sustainability. Environmental conservation can generate opportunities for ecopreneurs through the establishment of green ventures that tap into and benefit emerging markets, capitalization from new consumer preferences and innovative business practices that have been shown to create competitive advantages and financial sustainability [22]. Ecotourism in particular is identified as a business sector that stands to profit from biodiversity conservation and generate biodiversity gains through the management of ecosystem services. Studies indicate the emergence of ‘sustainable travellers’ who look for goods and services that match their notions of environmental sustainability, and who are willing to spend up to 10% more on businesses that deliver [22]. The challenge remains in ensuring a triple bottom line, as local communities have been found to stay out of the green business loop. EcoHelix not only capitalizes on the business case for environmental sustainability but also focuses on magnifying the positive social impacts through investing, mentoring and promoting local sustainable enterprises. Just as business and local communities stand to benefit from thoughtfully designed green ventures, so does the environment. Academic research has supported the claim that environmental gains stand to be made from businesses aligning with sustainability criteria [20, 9]. Market based environmental policy, like the promotion and development of ecotourism, has proven effective in countries like Costa Rica, where studies have found that ecotourism can benefit the environment and the local population [20]. A challenge remains to

9 Proceedings of International Conference for Entrepreneurship, Innovation and Regional Development
ICEIRD 2014
engage tourists not only on the environmental objectives of the industry, but also on the social impacts that must be warranted to achieve a truly sustainable sector. Entrepreneurship in general is seen as an important factor contributing to growing economies. However, 40% of entrepreneurial activities in Latin America take place out of a sense of necessity, not out of opportunity. Meanwhile, weak and confusing institutions prevent many entrepreneurial efforts from translating into productivity. For these reasons, entrepreneurship in Latin America is largely seen as having failed its economies. The Quadruple Helix, the conceptual and practical driving force presented in this paper, serves both as a heuristic to identify tourist destinations and communities that could benefit from collaboration, and then in turn mobilizes the resources necessary, working on behalf of emerging entrepreneurs, providing them with best practices in entrepreneurial skills, networks that form part of a dynamic ecosystem and access to markets. The EcoHelix becomes a driver that turns crises into opportunities, enabling community based entrepreneurs to take advantage of the collaboration of the public, private and civic sectors, and academia including, in addition to universities, both high schools and elementary schools, as well as non-formal educational institutions. The EcoHelix focuses on ecotourism because of proven promise. Ecotourism differs from conventional tourism in that it prioritizes environmental stewardship and local economic benefits. On a small scale, such as in Bonito, Brazil, and at a national level, such as in Costa Rica, ecotourism has allowed local entrepreneurs and their social and economic network to gain economic benefits while fortifying their natural resources and cultural heritage. In rural areas, it provides a local economy strong enough to keep young talent from moving to cities. On a national scale, it is a viable alternative to natural resource extraction. The EcoHelix seeks to build ecotourism based entrepreneurship in areas that hold the highest natural value and are therefore the most vulnerable to mismanagement of natural resources [24]. The EcoHelix entrepreneurship and ecotourism strategies are complemented by the co-creation of shared value, a concept by which businesses benefit the communities they operate in, and the communities in turn benefit their local businesses. This model supports strong local economies through networks that promote solidarity and mutual support. Ecotourists are significant players and stakeholders in the EcoHelix model. Each tourist has a skill-set to offer based on their professional or personal background. The EcoHelix model makes it possible for tourists to be mobilized as agents of change who offer their unique abilities in ecotourism-based development solutions. Through their investment, they become part of the civic sector blade of the Quadruple Helix. The co-creation of value finds expression through client to business, business to client, client to client and business to business feedback loops. In summary, the EcoHelix model challenges existing development paradigms, creating instead a paradigm based on efficiency, self-efficacy and reciprocity by promoting a dynamic and sustainable ecosystem.
3. The EcoHelix in Action: From Theory to Practice The EcoHelix is an innovative intervention that mobilizes cloud based technology, entrepreneurship, conservation and ecotourism to improve the conditions endangering the Galapagos. The EcoHelix recognizes that environmental problems can only be addressed with the full support of local communities. The competitive model enables Galapagos residents to gain economic benefit while also acting as stewards of the environment, in collaboration with tourists as investors in their business. The EcoHelix intervention includes the following benefits and opportunities:

10 Proceedings of International Conference for Entrepreneurship, Innovation and Regional Development
ICEIRD 2014
• An interactive on-line platform where tourists can browse and evaluate Galapagos services according to their quality of service and environmental sustainability
• Complementary entrepreneurial support for Galapagos businesses. • Tourists are invited and enabled to invest their time, knowledge, and wealth in
sustainable businesses. • Access to international tourist markets • Online marketing and publicity • Capacity building in entrepreneurship and technology • Direct online sales and reservations • Improved services that in turn will attract more tourists • Improved services that can be sold at a higher price point
The online platform provides the public-facing utility of the project at the website http://www.echohelix.com, as well the facility for administrative end data input. The website places emphasis on the importance of “vote with your dollar”, encouraging tourists to support businesses with better environmental practices. The website shows basic information for each business, along with the option of rating quality of service. Users can also purchase products and make reservations online. Users can include their own ranking, comments, or photos while traveling or once back home.
Puerto Baquerizo Moreno is the pilot project site for the EcoHelix initiative. Fifty five high schools students worked closely with twelve university students to gather data from a variety of businesses, including basic information (Name, Contact, Address, RUC (Ecuadorian business ID number), Hours, etc.); GPS location; a photo of the business; and a brief history of the business. Using a train-the-trainer approach, the university students were prepared to coach local high school students based on self-efficacy theory, with its four pillars: mastery, modeling, social persuasion and adaptation, challenging them to think of themselves as future change agents in their community. At the present time, these youth leaders are working with business owners (parents, family members, neighbors), training them to understand the benefits and opportunities the EcoHelix offers. Youth leaders are also the key players for updating information on the platform.
Originally, an environmental rating scale was suggested that would allow tourists to choose services most in line with their values based on a model established by “Sustainable Tourism CST: Certification for Sustainable Tourism in Costa Rica.” Tourists would rate businesses in four areas: conservation of water, energy, waste management and the use of local products. As the project matured, however, the municipality, which recently has installed water meters, has agreed to provide data instead, along with ElecGalapagos, the local energy company, which will inform tourists of water and energy consumption and recycling levels for each business. Tourists can be informed by looking up that information on line to determine the environmental commitment of a business they are considering visiting.
The EcoHelix tourist interface is currently being refined in order to be tested during the summer of 2014. An application is being developed that will be activated when the tourist arrives on the island. The municipality, in collaboration with the National Telecommunications Agency, is setting up four kiosks in the following locations: the airport, the water front, in front of the municipality, and the Charles Darwin Interpretation Center.

11 Proceedings of International Conference for Entrepreneurship, Innovation and Regional Development
ICEIRD 2014
The local university (Universidad San Francisco de Quito, GAIAS Extension) will provide complementary entrepreneurial support and training through an Ecopreneurship Center, ensuring that small businesses have access to the knowledge and resources necessary to compete within the project framework. Entrepreneurial support will allow small, locally owned businesses to capture more value from the tourist economy, especially in the new context that promotes an environmentally conscious tourist economy.
Entrepreneurial support through the Center as well as that provided by the Human Resource Office of the Galapagos Governing Council will include the following elements:
• On-line resources for Galapagos businesses, providing information on basic business practices and the elements of creating an environmentally sustainable business.
• Workshops for use of Galapagos Ecosystem on-line platform. • Tailored support for each business, explaining achievements and improvements
based on a set of both economic and environmental guidelines and criteria. • Entrepreneurship workshops addressing innovation, motivation, business model
development, marketing plan development, financial planning, web page building, best practices for tourism and ecotourism, environmental sustainability, added value product development, industry and market analysis, and online resources to help entrepreneurs promote and improve their business.
4. Lessons Learned: Paradigm Shifts Require Time, C onsistency, and Follow Up The EcoHelix Intervention is still in an experimental stage. The program will be replicated in the summer of 2014, with the financial support of Celebrity Expedition, on the three remaining populated islands: Santa Cruz (28,500 inhabitants), Isabela (2,500 inhabitants) and Floreana (158 inhabitants). A similar model to the one used on San Cristobal will be applied: high school students will be trained both to collect data and to serve as champions and change agents for the initiative. Key stakeholders are currently being approached and invited to collaborate. With the platform fully functioning, it will be possible to involve incoming tourists, inviting them to benefit from the resources each community offers. At a functional level, the idea is to provide the community, in collaboration with each municipality, with ownership of the data, inviting them to take responsibility for updating the information on a regular basis. The competition the platform generates through tourist feedback should produce significant improvements, based on subsequent training provided to business owners in the quality of service. The greatest promise of the EcoHelix platform, however, lies in the potential of mobilizing tourists both in the rating of the services received as well as in the option to invest their time, their expertise, and their discretionary income. The vehicle that will enable tourists to evaluate the potential of the business is the Lean Startup [25] business model canvas. Business owners will be challenged to create a canvas, identifying both expenses and revenue streams. This is the most promising aspect of the EcoHelix intervention, and provides a solution that has been one of the major challenges in development paradigms: economic sustainability that is also environmentally responsible.

12 Proceedings of International Conference for Entrepreneurship, Innovation and Regional Development
ICEIRD 2014
References
1 Cardoso, H., & Faletto, E. (1979). Dependency and Development in Latin America. California: Univesity of California Press.
2 Epler, B. (2007). Tourism the Economy, population Growth and Conservation in Galápagos. 3 Hannu Saarijärvi, K., & Kannan Hannu, K. (2013). Value co-creation:theorical approaches and
practical implications. In J. Gonzales, C. Montes, J. Rodriguez, & W. Tapia, European Business Review (Vol. XXV, pp. 6-19)
4 Rethinking the Galapagos Islands as a complex social-ecological system: implications for conservation and management. (2009). Retrieved from Ecology and Society: http://dlc.dlib.indiana.edu/dlc/handle/10535/2456.
5 Carayannis, E., & Campbell, D. (2012). Mode 3 Knowledge Production in Quadruple Helix Innovation Systems (Vol. 7). New York: Springer Briefs in Business.
6 Bandura, A. (1997). Self Efficacy: The exercise of control. Mc. Millan . 7 Kooter, & Schlesinger, L. (1979). Choosing strategies for change. Harvard Business Review . 8 Nottebohm, O., Manyika, J., Bughin, J., Chui, M., & Syed, A. (2012). Online and upcoming: The
internet´s impact on aspiring countries. 9 Bishop, J., Kapila, S., Hicks, F., Mitchell, P., & Vorhies, F. (2009). New Business Models for
Biodiversity Conservation. Journal of Sustainable Forestry, 285-303. 10 Costanza, R. (2008). An Integrative Approach to Quality of Life Measurement. Research and
Policy, S.A.P.I.EN.S. 11 Blank, S. (2013). Why the Lean StartUp Changes Everything. Harvard Business Review. 12 Porter, M. (1985). Competitive Advantage. In Creating and Sustaining Superior Performance. 13 Durham, W. (2008). Ecotourism and Conservation in the Americas. In Fishing for solutions:
ecotourism and conservation in Galapagos national park 14 Brewington, L., Engie, K., Walsh, J., & Mena, C. (2013). Collaborative Learning and Global
Education: Human–Environment Interactions in the Galápagos Islands. Ecuador: Journal of Geography
15 Statistics of Visitors to Galapagos. (2014, February 26). Retrieved March 25, 2014, from Galapagos Nacional Park: http://www.galapagospark.org/onecol.php?page=turismo_estadisticas& set_lang=en
16 Index Mundi. (n.d.). Light Sweet Crude Oil Futures Ends of Day Settlements Prices. Retrieved March 26, 2014, from Index: www.indexmundi.com/commodities/?commodity=crude-oil-west-texas-intermediate&months=60
17 Banco Central del Ecuador. (n.d.). Economic statistics. Retrieved March 26, 2014, from www.bce.fin.ec/index.php/estadisticas-economicas
18 Secretaria Nacional de Planificación y Desarrollo. (2012). Folleto Informatico. Retrieved March 2014, 26, from http://www.planificacion.gob.ec/wp-content/uploads/downloads/2013/01/
matriz_productiva_WEBtodo.pdf 19 Stuart, H., & Mark, B. (2003). Creating sustainable value. Retrieved March 26, 2014, from
http://www.stuartlhart.com/sites/stuartlhart.com/files/creatingsustainablevalue.pdf 20 Seales, L., & Stein, T. (2012). Environmental Conservation. In Linking commercial success of tour
operators and agencies to conservation and community benefits in Costa Rica (pp. 20-29). 21 Di Minin, E., Macmillan, D., Goodman, P., Escott, B., R, S., & Moilanen, A. (2013). Conservation
Businesses and Conservation Planning in a Biological Diversity Hotspot. Conservation Biology, pp. 808-820
22 TEEB. (2012). The Economics of Ecosystems and Biodiversity in Business and Enterprise. (Joshua, Ed.) London and New York: Earthscan. 23 Allen, J., & Malin, S. (2008). Green Entrepreneurship: A Method for Managing Natural Resources? Society & Natural Resources , 828-844. 24 Pizzitutti, F., Mena, C., & Walsh, S. (2014, January 17). Modelling Tourism in the Galapagos Islands: An Agent- Based Model Approach. Retrieved from Journal of Artificial Societies and Social Simulation: http://jasss.soc.surrey.ac.uk/17/1/14.html.

13 Proceedings of International Conference for Entrepreneurship, Innovation and Regional Development
ICEIRD 2014
Unused Potential of Co-Creation in South-East Europe: Is it about the Culture?
Anja Orcik1, Zeljko Tekic2, Jelena Borocki3, Zoran Anisic4 1Faculty of Technical Sciences, University of Novi Sad, Trg Dositeja Obradovica 6, Novi Sad, Serbia, [email protected]
2Faculty of Technical Sciences, University of Novi Sad, Trg Dositeja Obradovica 6, Novi Sad, Serbia, tekicz @uns.ac.rs
3Faculty of Technical Sciences, University of Novi Sad, Trg Dositeja Obradovica 6, Novi Sad, Serbia, [email protected]
4Faculty of Technical Sciences, University of Novi Sad, Trg Dositeja Obradovica 6, Novi Sad, Serbia, [email protected]
Transferring from triple helix to quadruple helix o f innovation supports the trend towards the engagement of all stakeholders in innov ation. Companies tend to tap into both internal and external knowledge sources to acc elerate innovation, turn to co-creation across innovation processes and allow the flow of knowledge over their organizational boundaries. There are numerous examp les that show that the co-creation is seen as a powerful engine for innovatio n, through an active, creative and social process, usually based on collaboration betw een producers and users initiated by the company to generate value for customers. How ever, world regions differ from one another in the sense of accepting the co-creati on practice in innovation. South-East Europe is seen as a region with the low level of co-creation initiatives, with very similar characteristics, concerning co-creation typ e, product development project type, stage of the product life cycle, co-creative environment, types of customers as main co-creators, as well as their motivation to jo in the co-creation. These similar co-creation initiatives in South-East Europe show that there is unused potential of co-creation in this region, through other co-creation types and product development project types in different stages of the product li fe cycle. Having in mind there are probably various reasons for the low acceptance of co-creation in South-East Europe, authors of this paper suggest that the national cul ture could be one of them. Following the results of previous research on co-creation exa mples in South-East Europe and the cultural dimensions, defined by Geert Hofstede, for countries in this region, and bringing them into a relation, it is explained in t his paper how the culture prevalent in South-East Europe can be one of the obstacles for h igher adoption level of co-creation practice in this region.
Keywords Co-creation, national culture, product development, product life cycle, South-East Europe

14 Proceedings of International Conference for Entrepreneurship, Innovation and Regional Development
ICEIRD 2014
1. Introduction
According to Global Innovation Index 2013 [1], South-East Europe (SEE) is characterized as low innovation performance region in comparison to the rest of European Union. One way to increase the innovation performance in SEE is the adoption of co-creation and involvement of customers in all stages of the product life cycle, since this practice is seen as a powerful engine for innovation. Even though there are a lot of world examples that show the benefits of co-creation even when it is practiced in the early stages of the product life cycle (e.g. Nokia lead user and expert co-creation sessions, Philips co-creation expert team, Local Motors, Mobile Flite Deck by Jeppesen Sanderson Inc., Linux, etc.), that is not the case in SEE region. Having in mind there are probably numerous reasons that explain the low level of co-creation initiatives in SEE, the purpose of this paper is to show whether the culture can be one of them. Previous research shows the proven link between the prevalent cultural system in a respective country and different aspects of innovation, e.g. culture’s impact on new product development process [2], R&D projects [3], consumer innovativeness [4], diffusion patterns of new products [5] and the acceptance of new products in the market [6]. Following the scores of SEE countries’ on national culture dimensions defined by Geert Hofstede [7] and available on the Hofstede Centre website [8], authors explain their relation with the level of co-creation initiatives. After the literature review on co-creation and national culture that is offered in the second section, the third section deals with co-creation practices in SEE [9] and represents the unused potential of co-creation in SEE within the framework that integrates product development project types, co-creation types, customer types, their motives for co-creation, stage of product life cycle, and co-creative environment [10]. The fourth section describes national cultures in SEE countries, and gives the foundation for the discussion on the relation between the characteristics of these cultures and the low level of co-creation initiatives in SEE countries, given in the fifth section.
2. Literature Review
2.1. Co-Creation as an Engine for Innovation
Innovation is built on a foundation of creativity and sometimes on invention, resulting in the creation of new knowledge and learning within the organization [11]. By adopting open innovation companies have recognized that product development performance can no longer be solely determined by internal R&D functions, but also depends on the contributions of a broad range of external players, from individual customers to large research institutes [12]. Pull systems open the process to many diverse participants, whose input can take product and service offerings in unexpected directions that serve a much broader range of needs [13]. Innovation can be seen as a co-creation process within social and technological networks in which actors integrate their resources to create mutual value [14]. Companies are increasingly aware that they need to tap into both internal and external knowledge sources to accelerate innovation [15], and find ways to increase their ability to grow into new business fields where they do not have any prior expertise [16]. They need to turn to co-creation across innovation processes and allow the flow of knowledge over organizational boundaries, exploiting internal knowledge in more diversified markets, as well as identifying and absorbing external knowledge to support the internal innovation process [17]. Co-creation as a powerful engine for innovation has become a very interesting research area. It is defined as an active, creative and social process, based on collaboration between
15 Proceedings of International Conference for Entrepreneurship, Innovation and Regional Development
ICEIRD 2014
producers and users that is initiated by the company to generate value for customers [18] that is fundamental to a company’s competitive advantage. It is claimed that it is more effective to encourage a diverse group of people outside the company, or the discipline, to seek innovative solutions [19]. Involving customers as co-creators in innovation produces ideas that are more creative, more highly valued by customers, and more easily implemented [20]. Information access, global view, networking, experimentation and activism of customers do not allow companies to develop products on their own, without co-creation [21]. The role of the individual customer is becoming more important and companies have to form close relationships with them in order to understand their needs and incorporating those needs in their product and/or service offering [22]. Doing innovation with customers rather than just for customers can help shift value creation and business concepts away from the product towards holistic solutions, as well as strengthening service provision and non-material values [23].
2.2. National Culture
Culture as a set of shared values, beliefs, and expected behaviours, shapes all aspects of our lives, political institutions, social and technical systems, all of which simultaneously reflect and reinforce values and beliefs [3]. Geert Hofstede defined national culture as “the collective programming of the mind which distinguishes the members of one group or category of people from those of another” [24]. It refers more tangibly to relatively enduring personality characteristics that are common or standardized in a given society [2]. Hofstede has shown that national cultures differ in particular at the level of, usually unconscious, values held by a majority of the population that represent broad preferences for one state of affairs over others [3]. His theory on national culture and its dimensions describes the effects of a society's culture on the values of its members, and how these values relate to their behaviour. The theory was one of the first that could be quantified, and could be used to explain observed differences between cultures. Although there are many different individual personalities in any society, the statistical mode has been used to approximate national culture [2]. This research has given valuable results in cross-cultural psychology that are frequently used by consultants and others researchers, mostly in the field of international business and communication. In his original theory, Hofstede suggested four dimensions of national culture in the original theory, along which cultural values could be analyzed: (1) power distance, (2) individualism vs. collectivism, (3), masculinity vs. femininity and (4) uncertainty avoidance. The fifth dimension long-term vs. short-term orientation was added later. Nevertheless, it was substituted by the new dimension pragmatism vs. normativism, with the addition of the sixth dimension indulgence vs. self-restraint. These dimensions will be explained in more details in the fourth section.
3. Co-Creation in SEE
There is a study focused on the examples of co-creation in South-East Europe, reviewed through the framework that integrates four dimensions: customers’ motives for co-creation, stage of product life cycle in which co-creation is initiated, co-creation types and platforms used for co-creation initiatives [9]. According to these dimensions, authors represented lessons learned from co-creation practices in SEE. Co-creation initiatives in SEE countries are usually in the form of contests, where companies offer reward for the winning solution. It seems that customers who get involved in these contests are highly motivated with the prize they will possibly get. The need for better and different products or services could not be tracked as a motive for co-creation, and curiosity and intrinsic interest for innovation as co-creation drivers are very rare. Additionally, companies from SEE region usually use co-creation as a marketing strategy to attract the
16 Proceedings of International Conference for Entrepreneurship, Innovation and Regional Development
ICEIRD 2014
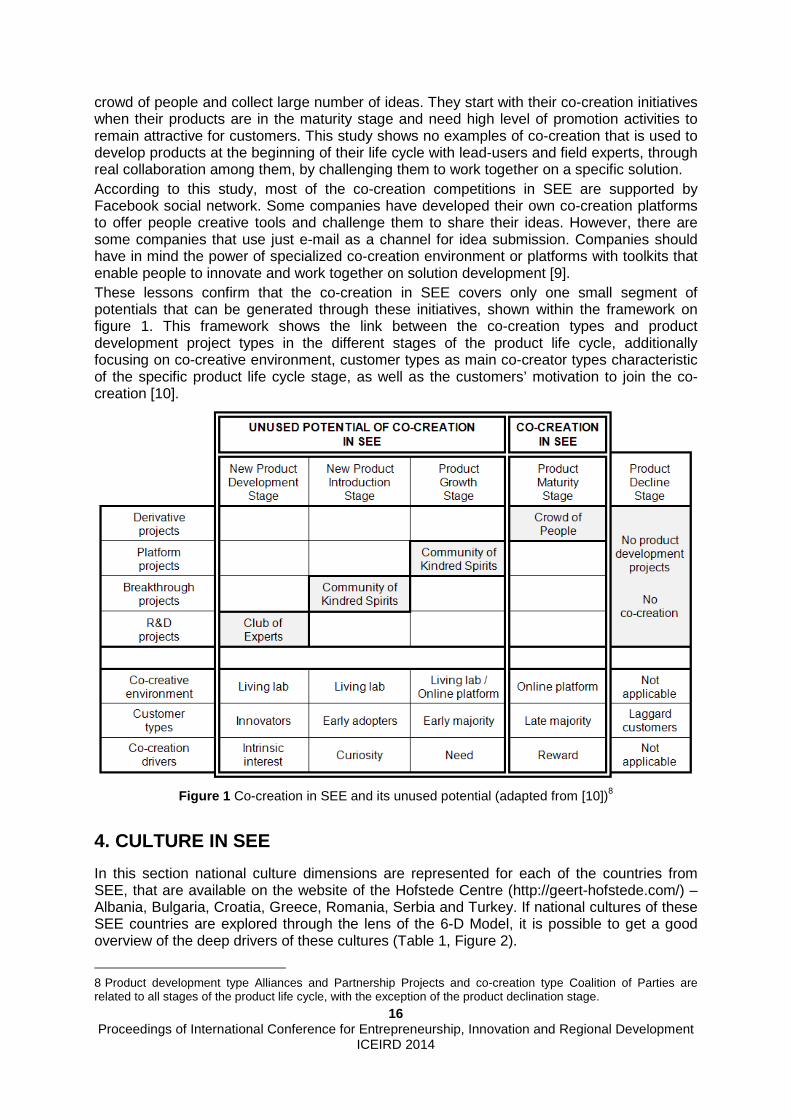
crowd of people and collect large number of ideas. They start with their co-creation initiatives when their products are in the maturity stage and need high level of promotion activities to remain attractive for customers. This study shows no examples of co-creation that is used to develop products at the beginning of their life cycle with lead-users and field experts, through real collaboration among them, by challenging them to work together on a specific solution. According to this study, most of the co-creation competitions in SEE are supported by Facebook social network. Some companies have developed their own co-creation platforms to offer people creative tools and challenge them to share their ideas. However, there are some companies that use just e-mail as a channel for idea submission. Companies should have in mind the power of specialized co-creation environment or platforms with toolkits that enable people to innovate and work together on solution development [9]. These lessons confirm that the co-creation in SEE covers only one small segment of potentials that can be generated through these initiatives, shown within the framework on figure 1. This framework shows the link between the co-creation types and product development project types in the different stages of the product life cycle, additionally focusing on co-creative environment, customer types as main co-creator types characteristic of the specific product life cycle stage, as well as the customers’ motivation to join the co-creation [10].
Figure 1 Co-creation in SEE and its unused potential (adapted from [10])8
4. CULTURE IN SEE
In this section national culture dimensions are represented for each of the countries from SEE, that are available on the website of the Hofstede Centre (http://geert-hofstede.com/) – Albania, Bulgaria, Croatia, Greece, Romania, Serbia and Turkey. If national cultures of these SEE countries are explored through the lens of the 6-D Model, it is possible to get a good overview of the deep drivers of these cultures (Table 1, Figure 2).
8 Product development type Alliances and Partnership Projects and co-creation type Coalition of Parties are related to all stages of the product life cycle, with the exception of the product declination stage.

17 Proceedings of International Conference for Entrepreneurship, Innovation and Regional Development
ICEIRD 2014
Table 1 National culture dimensions of SEE countries
Power
Distance Individualism Masculinity Uncertainty Avoidance Pragmatism Indulgence
Albania 90 20 80 70 61 15
Bulgaria 70 30 40 85 69 16
Croatia 73 33 40 80 58 33
Greece 60 35 57 100 45 50
Romania 90 30 42 90 52 20
Serbia 86 25 43 92 52 28
Turkey 66 37 45 85 46 49
The first dimension power distance expresses the attitude of the culture towards inequalities among members of a society. Cultures high in power distance are more autocratic and people accept a hierarchical order and differences in power and wealth. Cultures with low power distance are more consultative and democratic, equality is valued and class distinctions are less tolerable [25]. Table 1 shows high power distance in all SEE countries, with the highest score of 90 in Albania and Romania and the lowest score of 60 in Greece. These high scores in power distance show that SEE countries are hierarchical and centralized societies. People accept inequalities, autocracy, dependency, selectiveness and control. The different distribution of power justifies the fact that power holders have more benefits than the less powerful in these countries. Status symbols are extremely important to indicate social position and respect that should be shown [8]. The second dimension individualism vs. collectivism defines the degree to which individuals are integrated into groups and the degree of interdependence that societies maintain among their members. In cultures high in individualism people are focused on their personal achievements and individual rights. In these cultures the interdependence among people is weak. On the other hand, in cultures high in collectivism people are members of lifelong, strong and cohesive groups. They hold group values and beliefs and seek collective interests [25]. Table 1 indicates very low individualism or very high collectivism in SEE countries. Albania with the lowest score of 20 is the most collectivistic society in SEE and Turkey, with its score of 37, is the culture with highest individualism dimension in SEE. However, it is still very low in comparison to other countries of EU and characterises this country also as a collectivistic society. SEE countries are defined as “we” societies that foster strong relationships where everyone takes responsibility for fellow members of their group, in aspects of their lives. These strong relations can lead to nepotism, which is often in the countries of SEE [8]. The third dimension masculinity vs. femininity is based on the distribution of emotional roles between the genders - the masculinity is defined as the degree to which a culture is characterized by task orientation and the femininity by person-orientation. More masculine cultures value results, achievements, tasks, ambition, power, money, performance, success and purposefulness. They are more competitive than more feminine cultures that place value on quality of life, relationship among people, cooperation, helping others, caring for environment, etc. In these cultures modesty is a virtue and standing out from the crowd is not admirable [25]. Table 1 shows that most countries of SEE have the score on this dimension below 50, with the exception of Greece (57), that is considered medium ranking masculinity society, and Albania, that has very high masculinity score (80). These two countries are defined as success oriented and driven. On the other hand, Bulgaria, Croatia, Romania, Serbia and Turkey are considered relatively feminine societies, where relationships among people are more important [8].

18 Proceedings of International Conference for Entrepreneurship, Innovation and Regional Development
ICEIRD 2014
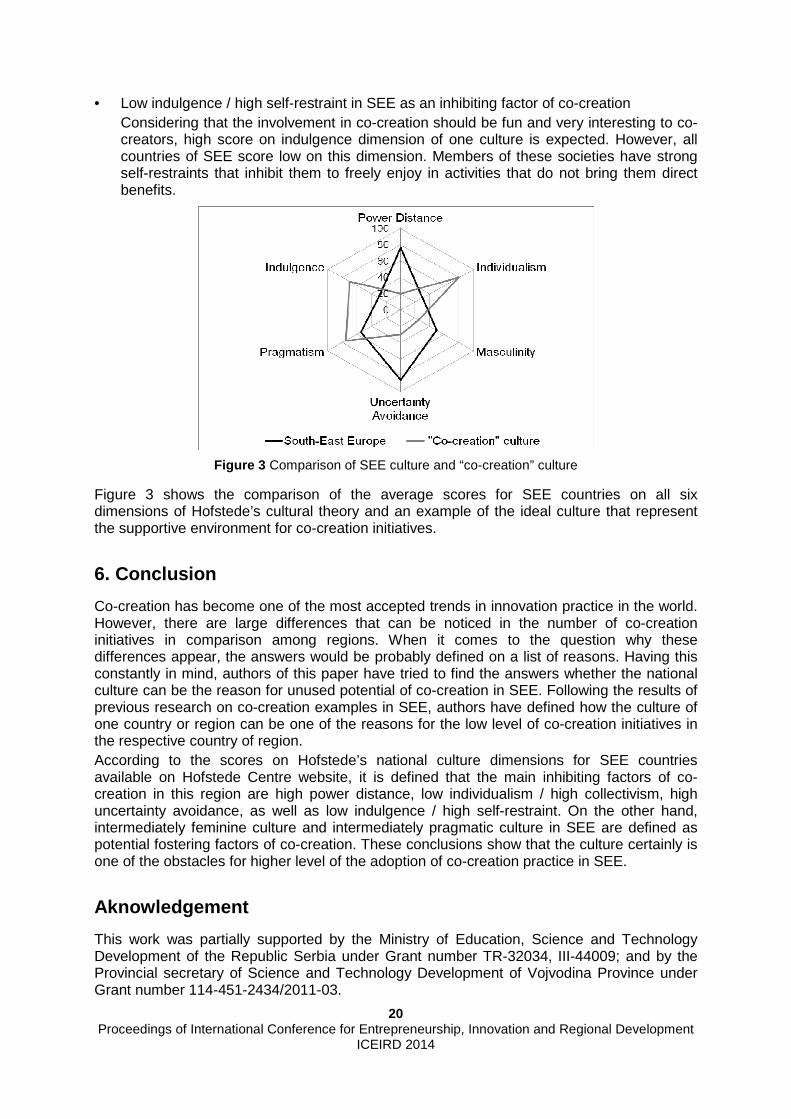
The fourth dimension uncertainty avoidance focuses on how societies deal with unknown aspects of the future and expresses the degree to which the members of a society feel uncomfortable with uncertainty and ambiguity. It indicates how people feel in novel and unknown situations. In cultures with low uncertainty avoidance people accept changes and tend to have as few rules as possible. In contrast, in cultures with high uncertainty avoidance people are anxious about the future, actively avoid risks and try to manage changes by careful planning and implementing rules, laws and regulations [25]. Table 1 shows that SEE countries have very high scores on this dimension. Albania has the lowest score (70) and the highest score belongs to Greece (100), that defines it as a culture with extremely high uncertainty avoidance. People from SEE are very risk averse, avoid unknown situations, do not accept new ideas and products. Innovations may be resisted, while security is an important element [8]. The fifth dimension pragmatism vs. normativism explains to what extent people try to explain everything that happens around them. In cultures with a normative orientation most people have a strong desire to explain as much as possible. They respect social conventions and traditions, do not focus on the future, but past and present, and focus on achieving quick results. On the other hand, in cultures with a pragmatic orientation, most people do not have a need to explain everything, as they believe that it is impossible to understand fully the complexity of life. They accept contradictions, adapt to the circumstances, invest in future and focus on long-term results [25]. Table 1 does not indicate strong orientation towards pragmatism or normativism in Greece, Turkey, Romania and Serbia, since their scores are medium ranked (45-52). Cultures of other countries of SEE lean towards pragmatism. The most pragmatic society is Bulgaria, with it score of 69. The sixth dimension indulgence vs. self-restraint indicates the degree to which member in society try to control their desires and impulses. Cultures high in indulgence have a tendency to allow relatively free gratification of basic and natural human desires related to enjoying life and having fun, and cultures with high self-restraint suppress gratification of needs and regulate it by means of strict social norms [25]. Table 1 shows strong self-restraints in SEE countries. Albania has the lowest score on indulgency dimension (15) that makes it strongly restrained culture. With its score of 50, Greece has the highest score on this dimension. However, it does not show any clear preference between indulgence and self-restraint in this country. Figure 2 represents national culture dimensions of SEE. Power distance and uncertainty avoidance are very high, and individualism and indulgence are low in all countries of SEE. On masculinity and pragmatism dimension most countries of SEE can be defined as intermediately feminine/pragmatic or neutral concerning these dimensions.
Figure 2 National culture dimensions of SEE countries

19 Proceedings of International Conference for Entrepreneurship, Innovation and Regional Development
ICEIRD 2014
5. Discussion
Following the framework given in Figure 1, authors try to explain why there is a low level of co-creation in SEE and try to find the answers why the potential of co-creation is unused in this region. In the earlier stages of the product life cycle, co-creation should be integrated within R&D, breakthrough and platform projects, that are undertaken in order to explore new possibilities for new product development, deliver new products that differ fundamentally from previous generations and provide a continuous transition between product generations, by offering moderately innovative products, respectively. These project types have a goal to explore previously unknown in order to deliver innovative products. Additionally, in the earlier stages potential co-creators are visionary, imaginative and risk-taking innovators, early adopters, who easily adopt innovations, and early majority of customers, who prefer products of proven quality, but also much better ways of doing things they already do. These characteristics of co-creation projects and potential co-creators represent a large contrast in comparison to the characteristics of the prevalent culture in SEE countries: • High power distance in SEE as an inhibiting factor of co-creation
Co-creation asks for low power distance in a society, while generation of diverse ideas and concepts of new products asks for encouragement of all potential co-creators irrespective of their position or status in society. Supporting their active participation, low power distance helps to equalize people by giving to all stakeholders a voice in the co-creation. Co-creators should be willing to contribute and share ideas for new products, without fear of negative feedback. High power distance in SEE countries does not offer this environment.
• Low individualism / high collectivism in SEE as an inhibiting factor of co-creation Since ideas for successful new products usually come from individuals, co-creation asks for high individualism. Co-creation offers freedom to all contributors do work on a specific problem on their own and then to present their solution to the initiator of the co-creation. Low individualism and high dependence of others in SEE inhibit co-creation in the early stages of the product life cycle.
• Intermediately feminine culture in SEE as a potential fostering factor of co-creation Tendency towards feminine cultures in most countries of SEE, through a focus on people and relationships among them, as well as the establishment of supportive climates, positively affect co-creation in the early stages, especially because it happens usually face-to-face within living labs, since people-related aspects, such as trust, good communications, team spirit, and low conflict, are associated with superior performance [26]. However, the degree of femininity is not high enough, and these countries are considered neutral on this dimension.
• High uncertainty avoidance in SEE as an inhibiting factor of co-creation Taking risk is of crucial importance in innovation projects. This is the reason why potential co-creators should not be risk averse and should like to explore what is unknown and accept innovations. Considering this, low levels of uncertainty avoidance in a society are necessary to support co-creation in the early stages of the product life cycle. However, very high uncertainty avoidance in SEE countries represents one of the biggest inhibitors for this kind of co-creation initiatives.
• Intermediately pragmatic culture in SEE as a potential fostering factor of co-creation With its practical orientation, accepting contradictions, adapting to existing circumstances and focusing on future results, pragmatism is of great importance in co-creation in the new product development and introduction stages. Even though there are countries in SEE with pragmatic cultures, average score on this dimension is intermediate for most countries in this region.
20 Proceedings of International Conference for Entrepreneurship, Innovation and Regional Development
ICEIRD 2014
• Low indulgence / high self-restraint in SEE as an inhibiting factor of co-creation Considering that the involvement in co-creation should be fun and very interesting to co-creators, high score on indulgence dimension of one culture is expected. However, all countries of SEE score low on this dimension. Members of these societies have strong self-restraints that inhibit them to freely enjoy in activities that do not bring them direct benefits.
Figure 3 Comparison of SEE culture and “co-creation” culture
Figure 3 shows the comparison of the average scores for SEE countries on all six dimensions of Hofstede’s cultural theory and an example of the ideal culture that represent the supportive environment for co-creation initiatives.
6. Conclusion
Co-creation has become one of the most accepted trends in innovation practice in the world. However, there are large differences that can be noticed in the number of co-creation initiatives in comparison among regions. When it comes to the question why these differences appear, the answers would be probably defined on a list of reasons. Having this constantly in mind, authors of this paper have tried to find the answers whether the national culture can be the reason for unused potential of co-creation in SEE. Following the results of previous research on co-creation examples in SEE, authors have defined how the culture of one country or region can be one of the reasons for the low level of co-creation initiatives in the respective country of region. According to the scores on Hofstede’s national culture dimensions for SEE countries available on Hofstede Centre website, it is defined that the main inhibiting factors of co-creation in this region are high power distance, low individualism / high collectivism, high uncertainty avoidance, as well as low indulgence / high self-restraint. On the other hand, intermediately feminine culture and intermediately pragmatic culture in SEE are defined as potential fostering factors of co-creation. These conclusions show that the culture certainly is one of the obstacles for higher level of the adoption of co-creation practice in SEE.
Aknowledgement
This work was partially supported by the Ministry of Education, Science and Technology Development of the Republic Serbia under Grant number TR-32034, III-44009; and by the Provincial secretary of Science and Technology Development of Vojvodina Province under Grant number 114-451-2434/2011-03.

21 Proceedings of International Conference for Entrepreneurship, Innovation and Regional Development
ICEIRD 2014
References
1 Global Innovation Index, “Data Analysis | The Global Innovation Index 2013,” 2013. [Online]. Available: http://www.globalinnovationindex.org/content.aspx?page=data-analysis. [Accessed: 05-Apr-2014].
2 C. Nakata and K. Sivakumar, “National Culture and New Product Development: An Integrative Review.,” J. Mark., vol. 60, no. 1, pp. 61–72, 1996.
3 S. Ehrenmann and Z. Tekic, “Cultural Diversity as a Factor of Product Development - Case of Indo-German Collaboration,” in Proceedings of the XV International Scientific Conference on Industrial Systems (IS’11), 2011, pp. 557–562.
4 J.-B. E. M. Steenkamp, F. ter Hofstede, and M. Wedel, “A cross-national investigation into the individual and national cultural antecedents of consumer innovativeness,” J. Mark., vol. 63, no. 2, pp. 55–69, 1999.
5 H. Takada and D. Jain, “Cross-national analysis of diffusion of consumer durable goods in Pacific Rim countries,” J. Mark., vol. 55, no. 2, p. 48−54, 1991.
6 S. Yeniyurt and J. D. Townsend, “Does culture explain acceptance of new products in a country? An empirical investigation,” Int. Mark. Rev., vol. 20, no. 4, pp. 377–396, 2003.
7 G. Hofstede, Culture’s Consequences: International Differences in Work-Related Values. Beverly Hills, CA: Sage Publications, 1980.
8 Hofstede Centre, “National Culture,” 2014. [Online]. Available: http://geert-hofstede.com/. 9 A. Orcik, T. Stojanova, and R. Freund, “Co-Creation : Examples and Lessons Learned from South-
East Europe,” in Proceedings of International Conference for Entrepreneurship, Innovation and Regional Development ICEIRD 2013, 2013, pp. 36–44.
10 A. Orcik, “Co-Creation in Product Development Projects,” in Proceedings of the 14th International Symposium and Doctoral School, 2014, pp. 228–233.
11 D. O’Sullivan and L. Dooley, Applying Innovation. SAGE Publications, Inc., 2009. 12 H. Bahemia and B. Squire, “a Contingent Perspective of Open Innovation in New Product
Development Projects,” Int. J. Innov. Manag., vol. 14, no. 04, pp. 603–627, Aug. 2010. 13 J. S. Brown and J. Hagel, “From Push to Pull: The Next Frontier of Innovation,” 2005. [Online].
Available: http://www.mckinseyquarterly.com/Strategy/Strategic_Thinking/From_push_to_pull_The _next_frontier_of_innovation_1642?gp=1 .
14 T. Russo-Spena and C. Mele, “‘Five Co-s’ in innovating: a practice-based view,” J. Serv. Manag., vol. 23, no. 4, pp. 527–553, 2012.
15 A. S. Huff, K. M. Möslein, and R. Reichwald, Leading Open Innovation. Mit Press, 2013. 16 R. Rohrbeck, K. Hoelzle, and H. G. Gemünden, “Opening up for Competitive Advantage – How
Deutsche Telekom Creates an Open Innovation Ecosystem,” R&D Manag., vol. 39, no. 4, pp. 420–430, 2009.
17 H. W. Chesbrough, Open Innovation: The New Imperative for Creating and Profiting from Technology. USA: Harvard Business School Press, 2003.
18 T. Roser, A. Samson, P. Humphreys, and E. Cruz-Valdivieso, “Co-creation: New Pathways to Value an Overview,” Promise/LSE Enterp. …, 2009.
19 K. R. Lakhani and L. B. Jeppesen, “Getting Unusual Suspects to Solve R & D Puzzles,” Harv. Bus. Rev., vol. 85, no. May, pp. 30–32, 2007.
20 P. Kristensson, J. Matthing, and N. Johansson, “Key strategies for the successful involvement of customers in the co-creation of new technology-based services,” Int. J. Serv. Ind. Manag., vol. 19, no. 4, pp. 474–491, 2008.
21 V. Ramaswamy, “It’s about human experiences and beyond, to co-creation,” Ind. Mark. Manag., vol. 40, no. 2, pp. 195–196, Feb. 2011.
22 M. Mukhtar, M. N. Ismail, and Y. Yahya, “A hierarchical classification of co-creation models and techniques to aid in product or service design,” Comput. Ind., vol. 63, no. 4, pp. 289–297, May 2012.
23 K. Rahbek, “Co-creation makes demands on the organisation,” in Copenhagen co’creation: Designing for change, 2009.
24 G. Hofstede, “Management Scientists Are Human,” Manage. Sci., vol. 40, no. 1, pp. 4–13, Jan. 1994. 25 G. Hofstede, G. J. Hofstede, and M. Minkov, Cultures and Organizations: Software of the Mind, 3rd
Editio. New York, USA: McGraw-Hill, 2010. 26 D. Thwaites, “Organizational Influences on the New Product Development Process in Financial
Services,” J. Prod. Innov. Manag., vol. 9, pp. 303–13, 1992.

22 Proceedings of International Conference for Entrepreneurship, Innovation and Regional Development
ICEIRD 2014
Transferable Cluster Policies in the South-East Europe Region
Predrag Matkovic1, Pere Tumbas1, Marton Sakal1, Tiberiu Diaconescu2 1University of Novi Sad, Faculty of Economics, Segedinski put 9-11, Subotica, Serbia, [email protected], [email protected], [email protected]
2Institute of Economic Forecasting, Calea 13 septembrie, Bucharest, Romania, [email protected]
Presence of a multitude of regulations in the area of cluster policies in EU member countries has not resulted in the expected outcomes . The degree of cluster development is exceedingly uneven among some Europe an countries, as is the perception of their role and their importance in so cial and economic development of the EU and its member states. While clusters are re cognised as agents of innovations for small and medium sized enterprises in some coun tries, cluster development is still in its infancy in other. What is recognised as the principal cause for unbalanced development are cluster policies, which however at the same time carry the potential for initiating future cluster development. Owing to the above mentioned differences in the per ception and role of clusters in different EU countries, the research that this pape r is based on started from interpreting cluster policies as a set of different regulations adopted in order to strengthen existing clusters and create a positive environment for developing new ones. Cluster policies can concern various areas, b ut in this analysis are treated with regard to the following six thematic areas: Researc h & development and innovation; Sustainability; Internationalization, cooperation a nd networking; Financing; Regional smart specialisation; and New skills and jobs creat ion. The research problem of this paper is associated wi th the necessity for providing a strong basis for discovering transferable component s of cluster policies thru identification and analysis of strengths, weaknesse s, opportunities and threats of regional cluster policies in South-East Europe (SEE ) region. The data on regional cluster policies was gathered from relevant stakeho lders in 10 countries of the specified region. The research itself was conducted by use of the modified SWOT method. A data gathering software solution was deve loped to facilitate the process and assure that the obtained data is more suitable for further analysis. The software solution was accompanied by a template defining the standards that the respondents observed while preparing their replies.
Based on the gathered SWOT analyses of 28 responden ts from SEE region, authors completed a regional quantitative and qualitative a nalysis of the cluster policies, and established the basis for regional learning and tra nsfer of positive experiences in the region, which should stimulate development of clust ers in the SEE area as the place of innovation.
Keywords Cluster policies, positive experience, South East Europe region, SWOT analysis.
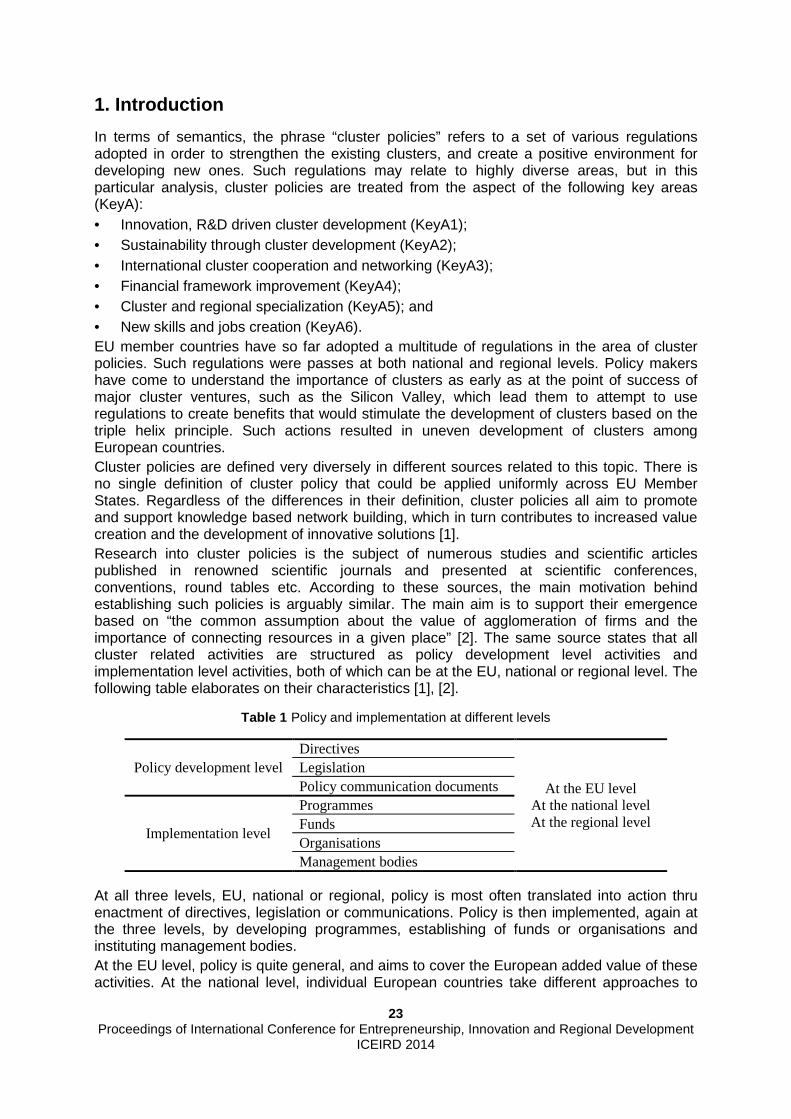
23 Proceedings of International Conference for Entrepreneurship, Innovation and Regional Development
ICEIRD 2014
1. Introduction
In terms of semantics, the phrase “cluster policies” refers to a set of various regulations adopted in order to strengthen the existing clusters, and create a positive environment for developing new ones. Such regulations may relate to highly diverse areas, but in this particular analysis, cluster policies are treated from the aspect of the following key areas (KeyA): • Innovation, R&D driven cluster development (KeyA1); • Sustainability through cluster development (KeyA2); • International cluster cooperation and networking (KeyA3); • Financial framework improvement (KeyA4); • Cluster and regional specialization (KeyA5); and • New skills and jobs creation (KeyA6). EU member countries have so far adopted a multitude of regulations in the area of cluster policies. Such regulations were passes at both national and regional levels. Policy makers have come to understand the importance of clusters as early as at the point of success of major cluster ventures, such as the Silicon Valley, which lead them to attempt to use regulations to create benefits that would stimulate the development of clusters based on the triple helix principle. Such actions resulted in uneven development of clusters among European countries. Cluster policies are defined very diversely in different sources related to this topic. There is no single definition of cluster policy that could be applied uniformly across EU Member States. Regardless of the differences in their definition, cluster policies all aim to promote and support knowledge based network building, which in turn contributes to increased value creation and the development of innovative solutions [1]. Research into cluster policies is the subject of numerous studies and scientific articles published in renowned scientific journals and presented at scientific conferences, conventions, round tables etc. According to these sources, the main motivation behind establishing such policies is arguably similar. The main aim is to support their emergence based on “the common assumption about the value of agglomeration of firms and the importance of connecting resources in a given place” [2]. The same source states that all cluster related activities are structured as policy development level activities and implementation level activities, both of which can be at the EU, national or regional level. The following table elaborates on their characteristics [1], [2].
Table 1 Policy and implementation at different levels
Policy development level Directives
At the EU level At the national level At the regional level
Legislation Policy communication documents
Implementation level
Programmes Funds Organisations Management bodies
At all three levels, EU, national or regional, policy is most often translated into action thru enactment of directives, legislation or communications. Policy is then implemented, again at the three levels, by developing programmes, establishing of funds or organisations and instituting management bodies. At the EU level, policy is quite general, and aims to cover the European added value of these activities. At the national level, individual European countries take different approaches to

24 Proceedings of International Conference for Entrepreneurship, Innovation and Regional Development
ICEIRD 2014
dealing with the establishment and implementation of cluster policies. At the regional level, cluster policies are normally integrated as a segment of regional development policy, science and technology policy and/or industrial policy of individual EU countries. It must be pointed out that an overarching cluster policy that is more explicit and a policy on its own can also be found at this level [2]. Programmes at the implementation level mostly integrate two policy streams, although also programmes that integrate three policy streams also exist. One of the more prominent sources, a research study entitled “Cluster policy in Europe”, prepared for the European Cluster Observatory, lists three forms of cluster policies [3]: • Cluster development policies that are more directed at establishing clusters by mobilising
funds and relevant stakeholders; • Cluster leveraging policies that tend to provide indirect incentives to SMEs or other
companies to formalise or to join clusters; and • Cluster facilitating policies that create a favourable business environment at the company
level, allowing companies to join clusters. The same study states that the above listed three forms of cluster policies are most frequently used for deriving programmes harmonised with the objectives to be achieved by cluster development. The implementation modes of these programmes also vary. They can be conducted by existing bodies, or new actors / organisations can be set up in order to implement / manage these programmes. In any case, funding usually comes from the programme itself, on a limited time basis with criteria that apply at the regional / national level [3]. Existing literature already provides a good summary of the status of cluster policies across EU Member States. The different levels of adoption of cluster policies by individual European countries is presented in the Europe Innova’s interim report [3], [4]. This analysis encompasses 31 European countries. The most significant findings of this document, which provide a basis for setting the cluster policy of the SEE region, are as follows: • All European countries have cluster policies on a national and/or regional level. • The mapping shows that in most instances there are no persons or organisations behind
the cluster policy, although in a minor number of EU countries, introduction and development of a country’s cluster policy can be associated with a particular individual/political party/research institute.
• There are huge variations among the European countries when it comes to how many and what kind of national ministries are responsible for the implementation of cluster policy.
• The importance of cluster policy at national level varies to a great extent. • Clusters may play a role as a framework in a number of policy areas. • Two thirds of the EU countries have published cluster policy papers on a national level,
public and / or official studies, white papers where the cluster approach is part of the innovation policy.
• A high number of national or state-level cluster agencies have been identified in the EU countries.
• There are fewer regional cluster programmes than national ones. The number of cluster programmes varies greatly between the countries.
• The focus of cluster policies in national cluster programmes is broadly distributed and diverse. Cluster programmes predominantly provide financial support, although those with support to knowledge building or network building tend to appear in a small number of cases.
• Cluster policies in most Eastern European countries are highly to moderately significant at the regional level as well.

25 Proceedings of International Conference for Entrepreneurship, Innovation and Regional Development
ICEIRD 2014
• The number of agencies responsible for the implementation of cluster policy at a regional level is very high and difficult to be determined precisely. Furthermore, it is very difficult to identify the types of regional cluster organisations.
• Most of the mapped EU countries have regional cluster programmes. Regional programme policies are characterised by overall policy focus. Nevertheless, most programmes have regional focus, industry and enterprise focus, and science and technology focus.
• The regional cluster programmes can be targeted at businesses, research institutions, educational institutions, public authorities and others.
• In general, the regional programmes can offer finance, knowledge/network or both. Differences between countries in terms of contents offered by programmes are insignificant.
The presented results may serve as an experiential basis for defining the cluster policy in the SEE region, where special attention must be devoted to providing the best framework criteria by nourishing innovation, excellence and cooperation across the countries to be covered by the cluster policies. To support this approach, common efforts are needed to achieve better synergy and complementarity between different policies, programs and initiatives. It is especially important to highlight the significance of cluster programmes in implementing cluster policies, “which would promote construction of clusters and networking in society to overcome market imperfections and improve structures to allow free movement of knowledge” [4]. Two main goals were set for this research: • Identify strengths, weaknesses, opportunities and threats of regional cluster policies in
SEE region in six predefined key areas. • Provide strong basis for identifying transferable cluster policies in the SEE region based
on current practice and experience of analysed countries. This paper is structured into four chapters. The introduction elaborates on the result of previous research on cluster policies in EU countries. The second chapter expounds the selected the methodology that was used to conduct the research. The third chapter gives a brief overview of results of quantitative and qualitative research, while the last chapter reveals initial conclusions that can be used for identifying transferable positive practice and experience among countries in the South East Europe region.
2. Research methods
The survival of any organisation is conditioned by continuous actions in the present, taken in order to create a better position in the future. The choice of actions that need to be taken in order to attain set objectives must be prudent and based on the analysis of internal and external indicators. One of the most frequent techniques for identifying an organisation’s current position and the potential avenues of future action is SWOT analysis. SWOT analysis is a valuable technique for understanding one’s own strengths and weaknesses, and identifying both the opportunities and threats one is faced with in the chosen area of research. For this paper, this is the area of cluster policies and programmes in South East Europe countries [5]. E-survey research type was chosen for resolving the research problem and achieving the set goals. It is a typical form of quantitative exploratory research, but this time it was applied (alongside SWOT analysis) for gathering qualitative data. This research, therefore, has some features of both quantitative and qualitative research. In this research, the qualitative (Qual) and quantitative (Quan) components are expressly combined only in the data analysis and interpretation phase, so that the design of this research belongs in the class of partially mixed research designs. As, in view of the problem and purpose of this research, qualitative

26 Proceedings of International Conference for Entrepreneurship, Innovation and Regional Development
ICEIRD 2014
analysis and interpretation are more significant than quantitative, the quantitative analysis and interpretation of data, and as quantitative and qualitative data analysis in this research are predominantly simultaneous rather than expressly sequential, the design of this research can be said to belong to the class of partially mixed Qual + Quan research designs.
2.1 Data gathering methods
Starting from the defined research problem, considering the defined research objectives/ questions and research design and strategies, the authors set out to determine the most suitable method and manner of gathering primary data. Bearing in mind, on the one hand, the limitation that data gathering by the interviewers was not realistic, and other, the requirement that data gathering had to be done cheaply and quickly, self-completion via e-mail imposed itself as a logical and realistic alternative to structured interviews (as the most natural choice), with all the advantages of the former (for instance, avoiding the risk of interviewer bias, easy distribution by e-mail, convenient for respondents, cheaper and quicker administration) and its risks (cannot ensure that the ‘right’ person answers, respondent fatigue if too many questions, greater risk of missing data, lower response rate etc). In the next step, focus was placed on future respondents, with the objective of minimising their concerns regarding the software and ensuring maximum possible facilitation of concentration on the replies they are to give. The research covered a total of 28 respondents from 10 countries of SEE region: Albania, Austria, Croatia, Bulgaria, Greece, Hungary, Italy, Romania, Serbia, and Slovakia. The respondents comprised different organizations: ministerial departments, regional and local public authorities, national and regional development agencies, business associations, national cluster associations, chambers of commerce, development funds, university research centres. The expected outcomes were predominantly qualitative, subjective replies, that were not supposed to be assessed as right or wrong (as their quality might be assessed by the surveyors’ projective techniques), but rather to serve as input for descriptive (detection and description of a phenomenon), explorative (establishing correlation between phenomena by using statistical correlation methods), and, possibly, explicative (verification of hypotheses) analysis, i.e. research. The responses were therefore to be archived in a manner suitable for further analyses, but without setting requirements related to storing responses before the respondents, but rather resolving this required by means of software, in the background, without the users being aware that it is happening. As the predefined set of 70 criteria, structured into six predefined key areas for analysis, which was initially offered to the respondents was comparatively large and comparatively complex (which means that its overview required a considerable time and mental effort), it was realistic to expect that the respondents will not provide answers at once, in a short time, but rather on several successive occasions over a period of time. The future respondents, therefore, had to be enabled to provide their answers in the time and environment they find suitable, without the prerequisite of having internet connection at their disposal. Furthermore, given successive manner of filling in questionnaires described above, it was realistic to expect that the respondents will modify and add to their earlier replies. The future respondents, therefore, had to be provided with easy and simple manipulation with lists and straightforward and intuitive entry and modification of text. The initial assumption was that a certain number of future respondents would find it a difficult to install a program for capturing the survey replies, for various reasons: unavailability of administrator rights over the computer, non-existence of .NET framework, lack of experience in installing software, or simply resistance to it, etc. It was therefore necessary to provide an extremely simply method of distributing and running the program for response capture: without prior installation, without many adjustments, and with extremely simple way of

27 Proceedings of International Conference for Entrepreneurship, Innovation and Regional Development
ICEIRD 2014
returning the entered replies by e-mail. Files arriving from respondents were further processed with the Excel VBA program, in order to select, group and export the gathered data into forms suitable for importing into statistical processing programmes.
2.2. Data analysis methods
The quantitative analysis of data obtained by this research used: Statistical description procedures Multiple response – frequencies/ cross-tabulation (tables and bar graphs); Correlation (Pearson r) and distances; Goodness of fit One-Sample Kolmogorov-Smirnov test; Statistical tests for related samples: Wilcoxon matched-pairs signed-ranks test; Friedman two-way analysis of variance; Cochran Q test; and Exploratory procedures: Hierarchical cluster analysis (for binary variables) and MDS (Multidimensional scaling) for binary variables. Statistical packages SPSS and StatSoft STATISTICA were used for quantitative analysis. In addition to the traditional qualitative data analysis and interpretation by re-reading, interpreting and classifying the respondents’ responses, two qualitative analysis methods were applied: The Word Usage Frequency method and The Key Words in Context (KWIC) method. The VIVO QDA computer software package was used for the application of these two methods.
3. Research results
Results gathered thru a regional SWOT analysis that involved 10 countries of the SEE region were quantitatively and qualitatively analysed using methods stated in the previous chapter. Considering the great number of methods applied and the length limit for this paper, the authors have presented and interpreted only on a number of selected results. Further results of the SWOT analysis can be found on the learning platform of the "Smarter Cluster Policies for South East Europe" project (http://www.clusterpolisees3.eu/ClusterpoliSEEPortal/) Of the 70 criteria identified in the SWOT analysis, previously associated with one or more key areas of cluster policies, respondents had most frequently used the criteria C09 - Degree of correlation between the regional innovation and cluster policies from the KeyA1; C01 - The development stage of the cluster policy from the KeyA2; C14 - The Extent to which the cluster policy provides support to networking and partnership from the KeyA3; C46 - Financing sources of cluster programmes from the KeyA4; C63 - The role of clusters and cluster policy with regard to the setting up of smart specialization strategies from the KeyA5; and C17 - Extent of support to the availability of human capital to the cluster companies from the KeyA6. On the other hand, 43 criteria under S (strengths), 37 criteria under W (weaknesses), 34 criteria under O (opportunities) and 51 criteria under T (threats) were unused (not stated) by any of the respondents, and were therefore excluded from the further analysis. In terms of frequency, the use of individual criteria varied vastly in the analysis strengths, weaknesses, opportunities and threats. The most frequently used criteria in the analysis of strengths were C46 - Financing sources of cluster programmes (f=7) and C15 - The ways in which the cluster policy provides support to networking and partnership (f=6). The most frequently used criteria in the analysis of weaknesses were C46 - Financing sources of cluster programmes (f=11), C04 - Ministries responsible for cluster policy implementation (f=8) and C09 - Degree of correlation between the regional innovation and cluster policies (f=7). The most frequently used criteria in the analysis of opportunities were C46 - Financing sources of cluster programmes (f=8), C02 - The significance of the cluster policy at national or regional level (f=7) and C27 - The various roles of the government in the cluster policy (f=7).Finally, The most frequently used criteria in the analysis of threats was C46 - Financing sources of cluster programmes (f=7).
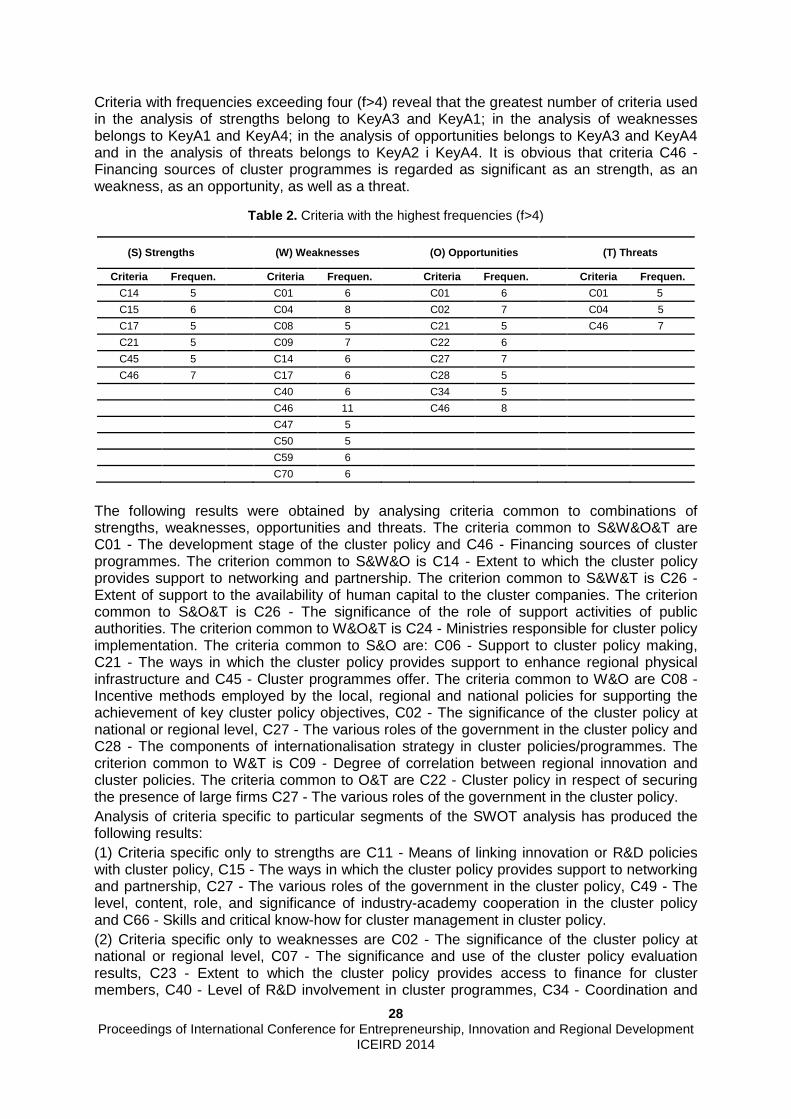
28 Proceedings of International Conference for Entrepreneurship, Innovation and Regional Development
ICEIRD 2014
Criteria with frequencies exceeding four (f>4) reveal that the greatest number of criteria used in the analysis of strengths belong to KeyA3 and KeyA1; in the analysis of weaknesses belongs to KeyA1 and KeyA4; in the analysis of opportunities belongs to KeyA3 and KeyA4 and in the analysis of threats belongs to KeyA2 i KeyA4. It is obvious that criteria C46 - Financing sources of cluster programmes is regarded as significant as an strength, as an weakness, as an opportunity, as well as a threat.
Table 2. Criteria with the highest frequencies (f>4)
(S) Strengths (W) Weaknesses (O) Opportunities ( T) Threats
Criteria Frequen. Criteria Frequen. Criteria Freq uen. Criteria Frequen.
C14 5 C01 6 C01 6 C01 5
C15 6 C04 8 C02 7 C04 5
C17 5 C08 5 C21 5 C46 7
C21 5 C09 7 C22 6
C45 5 C14 6 C27 7
C46 7 C17 6 C28 5
C40 6 C34 5
C46 11 C46 8
C47 5
C50 5
C59 6
C70 6
The following results were obtained by analysing criteria common to combinations of strengths, weaknesses, opportunities and threats. The criteria common to S&W&O&T are C01 - The development stage of the cluster policy and C46 - Financing sources of cluster programmes. The criterion common to S&W&O is C14 - Extent to which the cluster policy provides support to networking and partnership. The criterion common to S&W&T is C26 - Extent of support to the availability of human capital to the cluster companies. The criterion common to S&O&T is C26 - The significance of the role of support activities of public authorities. The criterion common to W&O&T is C24 - Ministries responsible for cluster policy implementation. The criteria common to S&O are: C06 - Support to cluster policy making, C21 - The ways in which the cluster policy provides support to enhance regional physical infrastructure and C45 - Cluster programmes offer. The criteria common to W&O are C08 - Incentive methods employed by the local, regional and national policies for supporting the achievement of key cluster policy objectives, C02 - The significance of the cluster policy at national or regional level, C27 - The various roles of the government in the cluster policy and C28 - The components of internationalisation strategy in cluster policies/programmes. The criterion common to W&T is C09 - Degree of correlation between regional innovation and cluster policies. The criteria common to O&T are C22 - Cluster policy in respect of securing the presence of large firms C27 - The various roles of the government in the cluster policy. Analysis of criteria specific to particular segments of the SWOT analysis has produced the following results: (1) Criteria specific only to strengths are C11 - Means of linking innovation or R&D policies with cluster policy, C15 - The ways in which the cluster policy provides support to networking and partnership, C27 - The various roles of the government in the cluster policy, C49 - The level, content, role, and significance of industry-academy cooperation in the cluster policy and C66 - Skills and critical know-how for cluster management in cluster policy. (2) Criteria specific only to weaknesses are C02 - The significance of the cluster policy at national or regional level, C07 - The significance and use of the cluster policy evaluation results, C23 - Extent to which the cluster policy provides access to finance for cluster members, C40 - Level of R&D involvement in cluster programmes, C34 - Coordination and

29 Proceedings of International Conference for Entrepreneurship, Innovation and Regional Development
ICEIRD 2014
implementation of cluster programmes, C47 - Key improvement area the cluster policy is addressed to, C50 - The position, role and significance of intermediaries in the cluster policy, C59 - Cluster financing and self-financing models in the cluster policy and C70 - Evaluating and measuring cluster policy effectiveness. (3) Criteria specific only to opportunities are C27 - The various roles of the government in the cluster policy, C28 - The components of internationalisation strategy in cluster policies/programmes, C29 - The contents of international activities at the national/regional cluster policies, C51 - The use of R&D results in innovativeness identified in the cluster policy, C58 - Forms of effective and sustainable cluster support in the cluster policy and C69 - New and creative industries in cluster policy. (4) The criterion specific only to threats is C52 - Sustainability of cluster programmes by ensuring a leadership role in the cluster policy. For the purpose of qualitative analysis of results obtained thru SWOT analysis, responses from 28 respondents were subjected to text coding, with the aim of identifying words with the greatest impact on the subject of work of each key area. The obtained key words are given in table 3. The analysis of gathered data was performed in accordance with the key words and additional classification of criteria. The only analysed replies for a corresponding key area were those containing some of the above listed key words, which were given for the criteria related to the key area.
Table 3. Key words for individual key areas of cluster policies
Key Area
KeyA1 KeyA2 KeyA3 KeyA4 KeyA5 KeyA6 Innovation, R&D driven Cluster Development
Sustainability through Cluster Development
International Cluster Cooperation and Networking
Financial Framework Improvement
Cluster and Regional Specialization
New Skills and Jobs Creation
Identified key words
R&D; regional; innovation; correlation areas; support; results; industry-academy cooperation
development stage; incentives methods; sustainability; support; forms; eco-innovation
international; cooperation; networking; partnership; methods; ways; contents; forms
financing methods; support; sources; forms; models; tools
S3; smart specialization; regions; areas; roles; collaboration
skills; jobs; training; courses; programmes; roles; forms; competency
It is interesting to view which criteria were most commented on by the respondents, in which quadrants of the SWOT matrix and within which key areas, presented in table 4. This table shows the number of entries/comments in individual quadrants of the SWOT matrix and in individual key areas. The table clearly shows that respondents commented opportunities, as many as 115 times. Opportunities were most mentioned in the largest number of SWOT matrix of KeyA2, KeyA3, KeyA4, and KeyA5, whereas the criteria of KeyA1 was most commented in the context of weaknesses. Strengths and weaknesses have an equal number of comments in KeyA6. In relation to the number of comments related to opportunities, half as much attention was devoted to other quadrants of the SWOT matrix: weaknesses 58, threats 53 and strengths 48. The most commented criteria were C08 - Incentive methods employed by the local, regional and national policies for supporting the achievement of key cluster policy objectives (35 comments), C27 - The various roles of the government in the cluster policy (34 comments), C09 - Degree of correlation between the regional innovation and cluster policies (12 comments) and C21 - The ways the cluster policy provides support to enhancing regional physical infrastructure (12 comments).

30 Proceedings of International Conference for Entrepreneurship, Innovation and Regional Development
ICEIRD 2014
Table 4 . Number of comments by key areas in the SWOT matrix quadrants
S W O T Total
KeyA1 10 22 16 9 57
KeyA2 12 13 22 13 60
KeyA3 13 6 43 18 80
KeyA4 4 13 18 8 43
KeyA5 3 2 10 1 16
KeyA6 6 2 6 4 18
Total 48 58 115 53 274
4. Conclusions
By use of software tools, the authors have applied chosen qualitative and quantitative methods to analyse data gathered thru SWOT analysis. The research also had some limitations: • The SWOT analysis criteria were predefined, thus channelling the rewards towards the
established working groups. Admittedly, the respondents were given the possibility to expand the existing list of criteria with their own criteria, but only a small number of respondents used this opportunity, so that the semi-structured character of research was only partially achieved.
• Insufficiently precisely and strictly established structure of respondents, including cluster policy makers. It would have been much more significant for the research if the analysis had included respondents affected by cluster policies while not being directly involved in their adoption. Actually, the interests and viewpoints of policy makers, different implementation agencies and clusters affected by cluster policies can be different, and even opposed.
• Various structures of respondents contributed to the variety of capture of the areas of cluster policies from national through regional, to local.
• Some of the responses were not in compliance with the defined criterion/criteria; their occasional ambiguity can be blamed on unclearly defined criteria, or the respondents’ failure to understanding.
• The level of some respondents’ commitment to providing detailed answers is different. • The number of SWOT analysis from individual regions is different, and in many cases
inadequate for making general conclusions. Despite the above limitations, the SWOT analyses gathered from the respondents provide an appropriate input for further activities on the achievement of the research primary objective – establishing common elements for developing smarter policies in support of existing/developing, improving the understanding of existing data and information related to cluster development, and, at the same time, strengthening support to result-oriented transnational cooperation for the design of new strategies and as contribution to support SEE area as the place of innovation. A great number of identified strengths and opportunities in key areas analysed in different South-East Europe countries points to potential possibilities for their transfer and use in the development and redesign of cluster policies of other countries in the region. The greatest number of strengths in KeyA1 were identified in Serbia and Bulgaria; in KeyA2 – Serbia and Albania; in KeyA3 – Hungary and Serbia; in KeyA4 – Serbia and Hungary, in KeyA5 – Albania, Serbia and Hungary and in KeyA6 – Albania and Serbia. Most opportunities in KeyA1 were identified in Hungary, Greece and Croatia; in KeyA2 – Bulgaria, Greece and

31 Proceedings of International Conference for Entrepreneurship, Innovation and Regional Development
ICEIRD 2014
Croatia; in KeyA3 – Austria, Croatia and Albania; in KeyA4 – Bulgaria and Croatia; in KeyA5 – Austria and Croatia and in KeyA6 – Albania and Hungary. It should be highlighted that the greatest number of strengths and opportunities was identified in KeyA3 and KeyA1, which indicates that “International cluster cooperation and networking” and “Innovation, R&D driven cluster development” are areas with the most potential for determining elements of cluster policies transferable between different regions. At the same time, the least strengths and opportunities were identified in the KeyA6, which suggests that “New skills and jobs creation” is the area with least possibility for determining transferable elements. The question that was raised was what actually can be learnt from identified experiences. We saw that the possibility of drawing lessons depends on several 'contingencies'. These preconditions present both opportunities and difficulties in transferring a particular cluster policy elements from one area to another. Identified strengths and opportunities in specific regions, similar to successful examples of cluster policies, cannot be transferred mechanically. Instead, they should be perceived as sources of inspiration, rather than as recipes for successful regional economic development. In each specific case, they should be considered with regards for national and regional limitations, i.e. uniqueness of fundamental regional cultural characteristics.
Acknowledgements
This work was supported in part by the Provincial Secretariat for Science and Technology Development of AP Vojvodina, under the Grants 114-451-4591/2013-01.
References
1 Barsoumian, S., Severin, A., van der Spek, T. (2011). Eco-innovation and national cluster policies in Europe: A Qualitative Review, Greenovate! Europe EEIG.
2 OECD (2007). Competitive Regional Clusters: National Policy Approaches. OECD Reviews of Regional Innovation.
3 Oxford Research (2008). Cluster policy in Europe: A brief summary of cluster policies in 31 European countries. Europe Innova Cluster Mapping Project.
4 DG Enterprise and Industry report. (2007). Innovation Clusters in Europe – A statistical analysis and overview of current policy support. Brussels: Europe INNOVA / PRO INNO.
5 Tumbas, P., Lipnik, A., Matkovic, P. & Sakal, M. (2013). Impact of Clusters on University-Industry Interaction. Proceedings of the 6th International Conference of Education, Research and Innovation (ICERI) (pp. 3997-4005). Sevilla - Spain: The International Academy of Technology, Education and Development (IATED).

32 Proceedings of International Conference for Entrepreneurship, Innovation and Regional Development
ICEIRD 2014
Boosting the Innovation Potential in the Metropolitan area of Thessaloniki Through Triple Helix Interactions
Panayiotis Ketikidis1, Tatjana Taneva2, Adrian Solomon3 1The University of Sheffield International Faculty, CITY College, Administration Board, 13 Tsimiski Street, Thessaloniki, Greece, [email protected]
2The University of Sheffield International Faculty, CITY College, Business Administration and Economics Department, 3 Leontos Sofou Street, Thessaloniki, Greece, [email protected]
3South East European Research Centre, 24 Proxenou Koromilla Street, Thessaloniki, Greece, [email protected]
New knowledge has become increasingly important for the development of innovative and entrepreneurial business as well as for boostin g sustainable socio-economic growth. This knowledge is critical especially with the latest EU strategies for smart specialization towards regional growth. Even more, the proper knowledge exploitation towards gaining socio-economic growth is highly eff ective only in contexts where the triple helix actors (university-industry-government ) interact in a proper manner to enable co-creation. Additionally, technology (ICT) is a critical pillar for fostering innovation for a well tailored smart specialization strategy through triple helix interactions. In this context, the purpose of this article is to discuss how the new innovative model of Triple Helix can assist the met ropolitan area of Thessaloniki (Northern Greece area) in its regional development process by enabling capacity building and innovation outburst. Various identifie d problems and suggested solutions are presented in this article with the ai m of assisting with the development of the Northern area of Greece. This is achieved by presenting theories and foundations for the Triple Helix model, as well as the current state of the research and development/innovation practices in the target area . The provided findings are collected from academic journals and formal reports and strengthened by data collected from two roundtable discussions on triple helix interactions and smart specialization with key stakeholders from Greece wh ich have been organized over the last six months. The findings show that in order fo r the Thessaloniki Metropolitan area to properly foster an innovation environment, there is a high need to overpass several identified barriers, while upgrading in the same ti me triple helix interactions to enable proper regional socio-economic growth, aspect which brings considerable contribution both to literature and practice.
Keywords Triple Helix; Greek innovation systems; university-industry cooperation; innovation systems; smart specialization;
1. Introduction
It has been a matter of an important discussion whether and how the big industrial cities can find a new approach towards their socio-economic development. The question raises the

33 Proceedings of International Conference for Entrepreneurship, Innovation and Regional Development
ICEIRD 2014
subject of employing new resources, new- potential methods and ICT that can help expanding the span of possibilities of one region. It is a chance that provides a fresh, out of the box approach, which will stabilize and give a chance for re-birth of a complete different era [25]. In order to achieve sustainable growth, one region needs competitive businesses within the industries, while gaining competitive advantages can be done only by introducing innovative products and processes [23]. Moreover, the innovation in one company can be implemented by deliberate R&D activities and appliance of new knowledge and ICT. In this sense, entrepreneurial academics are potentially the most suitable resource for appropriate and fresh knowledge [23] as well as for effective technology transfer.
In the context of this paper, it is important to understand that new information has become increasingly significant for the development of sustainable socio-economic development [13]. Thus, overcoming the gap between the new trend of knowledgeable society and the out-of-date systems which are followed by a centric organization is becoming quite the challenge for justifiable and successful regional innovation. Even more, the proper knowledge exploitation towards gaining socio-economic growth is highly effective only in contexts where the triple helix actors (university-industry-government) interact in a proper manner to enable co-creation. To this end, the purpose of this article mainly focuses on debating how this new system of innovation can contribute to the regional development of the Northern area of Greece, more specifically the Thessaloniki region by fostering proper triple helix interactions with effective knowledge and technology transfer.
The remainder of the paper is structured as the following: Section two includes a discussion of the literature about the new shift towards an innovative culture, referring to the new Triple Helix model; Section three deals with the current state of the Greek innovation policies and rules on a country level. In the following section four, there is a more specific illustration of the current situation in Thessaloniki by presenting the existing innovative activities in the region. Section five includes how the adaptation of the Triple Helix model can bring the maximum potential for innovation in the area of Thessaloniki. Finally, section six presents a conclusion on the article’s topic.
2. Defining the triple helix innovation system
Etzkowitz and Ranga [7] discuss the important shift from seeking and adopting innovation through a single sphere connected to a particular innovation source to the introduction of the new Triple Helix system which combines and reconstructs innovational resources in an original concept of interaction among university-industry-government. The Triple Helix system is an actual set of components, referring to the innovation actors in the system (university, industry and government), relationships between components, discussing the collaboration and networking between the key players in the system and functions transition in spaces labeled as “Knowledge, Innovation and Consensus Space” [6]. Taking a central role as an innovative system in the Europe 2020 strategy, the Triple Helix is perceived as the clarification of the “innovation emergency” in Europe. The basis on which this model operates is that the separate roles of the participants in the system are being extended beyond their traditional missions. Universities, being associated only with the dissemination of knowledge and research, are now being involved with the economic development on regional or national level [4]. This approach does not only support the relationships between the academia and the society, but it influences the positive development of new ideas and skills. By doing this, entrepreneurship is being developed through the Universities, which also assists in the emerging of new products and practices. The Universities operating under the Triple Helix system are being motivated to educate individuals with improved methods, with new and fresh concepts, theories and practices, in

34 Proceedings of International Conference for Entrepreneurship, Innovation and Regional Development
ICEIRD 2014
Figure 1 From State Centric model to Triple Helix model
order for them to be prepared as a strong and skilful workforce, talented to enhance the expansion of the usage of innovative systems [8]. The University, which in this context is characterized as “entrepreneurial university” is a “key instrument of technology innovation” [3]. Furthermore, the Government’s role in the concept of the Triple Helix is-supporting the helices (universities and industries), rather than controlling them. The main activity is creating relationships and encouraging interaction which will move the appearance of innovation not in a linear flow, but in a mutually constructed manner. Therefore, the academia will provide the knowledge, which is crucial and vital for the innovation process, the Governmental institutions will motivate and stimulate, and industry players will apply and disseminate the innovative ideas into actual products, processes and services [2]. Farinha & Ferreira [9] draw the attention on the formation of incubators and ICT based science parks, where Triple Helix partners have the opportunity to exchange significant ideas which will lead to new research topics and fields, as well as development of new ground-breaking projects. The “capitalization” of knowledge, grows the need of moving from industrial society to knowledge society. Figure 1 represents the path of this transfer, which shows that in the extreme extent to the Soviet Republics, there was a state centric approach, where the state had the major lead over industry and academia. Subsequently to this system, there was a laissez-faire model, where these entities were separated but the relationships between them were vague and weak. Finally, the evolutionary model of the Triple Helix, which as explained and discussed above was introduced to bring the helices in strong and useful collaboration [6]. Having a competitive region, with this kind of companies that have found an effective technique to boost innovation implies to a society capable of fighting any crises that could possibly come along. The notion of these techniques lays either in exogenous or external providers of new technology and investments or endogenous methods which support the idea of adopting the Triple Helix approach. The Triple Helix as an endogenous technique uses domestic intellectual capital to support research. Furthermore, looking at figure two and its representation, it is crucial to point out that in the whole picture there are clusters which according to [10] are networks that build the relations between associated entities from companies, to suppliers, knowledge providers and various agencies. Within these clusters, depending on the actual demand and environment factors, partnerships are being created

35 Proceedings of International Conference for Entrepreneurship, Innovation and Regional Development
ICEIRD 2014
involving human and financial capital supported by various governmental policies which have the possibility to influence the whole creation of innovative competitive advantage [10].
Figure 2 The new Triple Helix model (adapted from [9])
3. Current observations: the innovation systems in Greece
According to Bartzokas’s assessments [1] obtained in his country review report on Greece related to the policies used in order to monitor the R&D practices, the Greek innovational system has been falling behind in comparison to the other EU members. The latest figures show that this country has been spending only 0.61 % of the total GDP on Research & Development projects [1]. In addition to this, bigger number of SMEs also hesitate to go ahead with the implementation and promotion of new and innovative ideas within their companies. This way they contribute to the hold back in regional and innovative development of the country. Only a small number of firms actually excel in this area, hence leaving a gap and space for significant improvement. Currently, the major source for R&D investments in the country comes from foreign financial projects and funds. Overall, the last 20 years show an assorted combination of good and bad moments for the country in reflection to becoming close or equal to other European economies [1]. Taking into account that the governmental policies were not highly prioritizing innovational and R&D activities so far, Greece has had lower than 5% of the final distribution of the funds of the Community Support Funds (CSF) [1]. Nevertheless, recently the country has been facing important challenges in this aspect. The first challenge set from innovation driven European companies, refers to getting and using a chance to improve the companies’ knowledge enticement activities with the goal of becoming more entrepreneurial and innovative. This kind of activities might not only improve the firm’s competitiveness, but assist in economic regional development. Thus far, Greece has failed to accomplish this task in a reasonable manner. On the other hand, there is the incentive of adopting and dispersing technological development and change. In order to meet these requirements, industrializing countries have established masses of local technological capabilities, which Greece has also failed to complete because of the low scales of investments. Hence, the interaction of the triple helix actors in Greece is not efficient.

36 Proceedings of International Conference for Entrepreneurship, Innovation and Regional Development
ICEIRD 2014
4. The current situation of the helices in Thessalo niki
In the city of Thessaloniki currently the main creators of knowledge are the University of Aristotle and the University of Macedonia [17]. Although they are known for providing significant research, there is no major evidence for engaging in a transfer of knowledge between the Universities and the businesses in the region [17]. Additional to this, there are very limited investments in the development of the Universities. Furthermore, the engagement in creating entrepreneurial and innovative ideas is quite low due to the fact that the number of higher education institutions is very small. Besides this, in order to use their maximum potential, the universities should be supported and encouraged by the other helices, but on the contrary the existing cooperation with the government and the regional businesses lack coordination [17]. Overall, Thessaloniki has a very weak economic structure, due to the high unemployment rate, R&D practices have been reduced to a minimum level [12]. This unemployment rate is a sign for the existence of the economic crisis from which the whole country is suffering. To be more precise, the economic crisis has emerged from various internal and international factors [21]. The improper policies and high government spending has destroyed the execution of the current and actual duties for development of the regional authorities which is supporting, financing and developing initiatives for R&D. Thus, by not accomplishing this, the area of Thessaloniki has been staying behind in its development. The lack of investments and creation of international competitiveness has also contributed to the whole situation of creating the financial crisis [21]. Recently referred to as the “European paradox”, Thessaloniki is nurturing companies which belong to the group of industries with “medium-intensive technology” [11]. In other words, the entrepreneurs in this area appear as consumers of innovation, instead of producers of innovation. Although there are various research centres, incubators, business organizations and dynamic companies the region has been considered as a region with low level of innovation, aspect which raises the need for proper triple helix interactions in this region.
5. How can the Triple Helix concept be implemented in (Northern) Greece/Thessaloniki area? Having the Triple Helix model elaborated in the introduction part of this article, further on it will be applied in practical ways that can be used in the Greek system, more specifically in the Northern area of the country in order to increase and promote innovativeness and competitiveness of the region. Many countries have been trying successfully to implement this model and have had positive results in this. Still, the adaptation of this is not nearly easy or simple, since all of the helices are supposed to pass through radical changes and reforms in order to effectively achieve economic growth. 5.1 Measures 5.1.1 Reforms in the educational system Higher education is expected to engage more in teaching with new, inspiring methods that will awake the sense for entrepreneurship and innovation among the students and the academia. Research and community projects should be supported as well as knowledge should be disseminated through teaching and consultation [2]. In addition to this, the university leaders, academics, scholars and students that are supposed to boost and support innovation and entrepreneurship are being trapped in the system subverting their goals [14]. On the contrary they should try exploiting their capabilities and focus on using new technology for exploration of new research potentials. Moreover, the links between the

37 Proceedings of International Conference for Entrepreneurship, Innovation and Regional Development
ICEIRD 2014
productive sector and the academia should be redefined with the aim of facilitating successful interaction. There is already a “Digital Research Center” in the Aristotle University of Thessaloniki which can be used as an intermediary actor between businesses and academia [11]. The desired result would be getting access of the research projects which can contribute to the invention of new products. 5.1.2 Increase incentives for research There is a very big potential in this area for further development and support of the University-Industry collaboration. According to [22] there are particular critical success factors for establishing a productive transfer of knowledge between universities and industries. These factors have a great potential for appliance over the Greek system as well. Thus, it is being discussed that although this kind of networks might increase the chances for success and bringing innovativeness in the industry, there are some drawbacks which have to be considered before trying to push towards a goal without good foundation. Academia and industries might work on setting missions and objectives in the same direction, which will set a solid ground for further collaboration. Moreover, there might be organizational differences as well which could be solved with different Governmental policies in terms of funding and cost structures policies, as well as insisting on placing some researches which will bring not only academic prestige, but solutions for profit-driven problems in particular industries [22]. The other barrier that the system is facing as mentioned earlier is lack of motivation for research and development in the academia. There is still an institutional bureaucracy and very complex administration structure in the public universities in Thessaloniki, limiting the encouragements for profounder research which could be eased up by empowering corresponding management team and supporting entrepreneurial development and expertise within the whole structure. These incentives could increase the effectiveness of the relationships between the universities and the industries in the region [22]. 5.1.3 Implementation of the EU 2020 Horizon focus o n smart specialization The rationale behind the term “smart specialization” is that by focusing on knowledge assets and connecting them to a narrow number of specific economic actions, a region can become competitive. By following this concept one region can use its maximum potential for knowledge into improving productivity of businesses. Being smart, cannot happen without being innovative and vice versa, being innovative is a crucial precondition for being smart. The metropolitan region of Thessaloniki can excel in several priority areas which have potential to make the region sustainably competitive. Moreover, the fact that the nation has gone bankrupt, is just a sign that the economy cannot be sustained through the central system of sharing the government expenditures, but reforms have to be made in order the localities to increase their capacity and chances for development [16]. In this sense, an initial list of the sectors through which a regional competitive advantage can be built is: - Agriculture (The city of Thessaloniki is centrally positioned in an agricultural area, where traditional crops can still be harvested and reoriented to organic and functional foods.) - Tourism (The geographical location of the city provides very big benefit for the development of the tourism sector. The history of the city, along with the great areas for summer and winter vacationing can be used to make the region ideal for tourists.) - ICT (Information and communication technology can become an important part of the successful economy of the region, since the area has very high human power.) - Transport and logistics (Taking the geographical position of the city, Thessaloniki is well known for its inter-territorial possibilities, thus developing them further will contribute significantly to the economy.)

38 Proceedings of International Conference for Entrepreneurship, Innovation and Regional Development
ICEIRD 2014
- Education (Again taking the location of the city, higher education institutions have big potential for further development not only because of Greek students, but because of the students coming from wider regions.) [11] 5.1.4 Effective implementation of ICT Another beneficial idea which the Northern area of Greece can apply and make a great usage out of it, refers to creating or redefining organizations with the aim of building strong bridges which will link Government, University and Industry. Suggesting that the Triple Helix model is a new paradigm of disseminating valued ideas that can be put into action with making all partners in the system-winners, breaking new grounds for creating and distributing knowledge is of an excessive importance [20]. In addition to this, the new digital age in which we live, have brought numerous options for making significant transformations in the social and economic structures [20]. Information and communication technology have assisted in improving the efficiency of the businesses, enable easier diffusion of knowledge and redefine and reinforce Governmental processes. The approach that the ICT tools use in order to contribute to the overall development of one society are cumulating opportunities for economic purposes, increasing knowledge which will advance the employees’ competences and skills and providing active involvement of individuals in the public life. Since the Authorities in Thessaloniki have different strategic plans in their e-governance agenda, which are still not realized, the city is significantly behind in the exploitation of ICTs [26]. Thus, developing a good ICT infrastructure among the Triple Helix partners will contribute to fair dissemination of knowledge, and innovation as well as reducing the “digital divide” which represents a gap between those who have the chance and opportunities to use technology and absorb new information and those with limited access to this [20]. The initiation of building strong ICT economy would result and assist into the creation of smart city which basically refers to a city that consists of: smart economy, smart people, smart life-style, smart society, smart environment and smart government [18]. 5.2 Available intermediaries As strong as the helices might be independently the factor that they need intermediaries that will build the networks and bridges between them is highly important. These separate entities are expected to provide strategic plans to the key partners in the Triple Helix system with the aim of overcoming any failure or negative result. The intermediaries refer in general to private or public organizations, as well as profit or non-profit organizations that act as “meeting platforms” in order to bring together various knowledge providers, financial supporters, and governmental authorities and so forth to achieve effective collaboration without any interruption [24]. The metropolitan area of Thessaloniki has already developed some platforms that can assist in the same role as intermediaries, responsible for disseminating innovation and new business ideas [24]. These so called incubators and entities are well known for their projects in this area and they operate under private law with the orientation of developing new projects and products which will have strong impact on society and economy. One of these incubators is C.E.R.T.H. as well as the Thessaloniki Technology Park, which mainly concentrate on developments in the chemistry, agro biotechnology, information and telecommunication systems and transportation. Another well-known high tech park in the area is the Technopolis Thessaloniki ICT Business Park which also gives a great assistance in the creation of new businesses as well as chances for integration of necessary infrastructure and financial support of innovative companies. The main mission of this park is commercializing the innovative and new business ideas providing the main ground for establishment and development.

39 Proceedings of International Conference for Entrepreneurship, Innovation and Regional Development
ICEIRD 2014
Having the solid ground of these potential intermediaries, the overall implementation of the Triple Helix Model should be easier and simpler for the region. These entities can help in the creation of cluster-like synergies and expand the learning potential of the environment [24]. Thus, the innovation boosted in the area will not be a one-time deal, but rather a sustainable and continuous upward curve. Moreover, the adaptation of the Triple Helix and the maintenance and upgrading of the innovative incubators in order to develop the needed networks can help in suggesting and providing new innovation policies, involving the Regional Government in the decision making process, as well as designing new schemes and programs for improving the competitiveness of the economy in Thessaloniki [24]. 5.3 Success factors Intermediaries bring the possibility to fail, or succeed as explained in the previous section which raises the subject of setting more stable basis for more positive outcomes. Thus, in order to succeed, vague discussions are not enough. The whole process has to be planned in details with the aim of having a productive Triple Helix collaboration [15]. The Thessaloniki area, may use this suggested plan in order to implement and start operating with the new innovational model. What is being proposed is that the process preferably starts with pre-project planning, suggestion coming from in-house from a company, that access to knowledge sources is needed in order to develop a certain project. For some SMEs this could be a great chance for acquiring governmental funding for the development of the same project. Thus, in this stage the need for specialized personnel with specific skills is being identified. Further, the next step is followed by project initiation, or selecting suitable project partners. Afterwards, the on-going project management is being utilized in the process, where the actual research is being conducted by the side of the selected partner-University, and the results are being put into practice. Finally, the project close-out does not mean that it is the end of the technological development for the firm, but preparation for continuous possible collaboration [15]. In the whole process, significant role play the 4th pillar organizations, or intermediaries which work through the whole process in the establishment and nurturing of the relations between the helices. The question is not only what should be invested in order to implement the system in the Northern area of Greece, but what are the factors on which the helices should concentrate in order to succeed? Starting by having an open and inclusive communication will serve as a great platform for bringing the academia, businesses and government in an integrative system. This would assist the exchange of innovative ideas and the possibility for overcoming any obstacles that might occur. Furthermore, any project that would involve connecting the partners in the Triple Helix should start with clear objectives on which all the entities should be agreed. Roles and incentives of every partner should also be clear with the aim of achieving quality results. Keeping the university participants of the project, the Regional Government and the involved businesses motivated by having profound guidelines to follow is also an essential success factor. Being flexile should also be possible matter, with the option to follow another scenario which will develop the project with successful results [19].
3. Conclusions
This article discussed the issue of boosting the innovation capacity and socio-economic growth of the Thessaloniki Metropolitan region (Northern Greece) by enhancing triple helix interactions for proper knowledge and technology transfer. The findings show that what this region is lacking is a clear and planned frame which will maximize its possibilities. The indicated problems in this article are related to the limiting factors for economic growth. Thus,

40 Proceedings of International Conference for Entrepreneurship, Innovation and Regional Development
ICEIRD 2014
overcoming these restrictions will help the successful dissemination of innovation. Moreover, as elaborated in the paper, stronger regional policies and strategies will help the continuity and coordination of the effective development. Using what already exists and capitalizing on every possible chance, will create a competitive society. Although the process is not simple and easy at all, because of its sensitive demand for joining agendas as well as overcoming organizational boundaries, thinking outside the box will harmonize and assist in achieving shared and individual objectives. Finally, being situated in an economic crisis and political confusion, as well as incompetence and diverging interests of individuals are other factors that should not influence the collaboration between the three sectors. Because if this is the case, the gap between the current regional innovations level of the Thessaloniki area and the vision to become better will just grow in time.
References
1 Bartzokas, A. (2008) Country Review Greece. [online] http://ec.europa.eu/research/policymix/userfiles/file/uploadeddocs/policy-mix_countryreview_ greece.pdf (Accessed 10th January 2014)
2 Brundin, E.et al (2008) ‘Triple Helix Networks in a Multicultural Context: Triggers and Barriers for Fostering Growth and Sustainability’, Journal of Development Entrepreneurship, Vol. 13 No. 1, pp. 77-98
3 Degroof, J. and Roberts, E. B. (2004) ‘Overcoming weak entrepreneurial infrastructures for academic spin-off ventures’, Journal of Technology Transfer, Vol 29 No 3-4, pp. 327-352
4 Diaconu, M. and Zaharia, R. (2009) ‘University Entrepreneurship-A chance to improve the relationship between universities and business in the knowledge society’, Annals of the University of Oradea, Economic Science Series, Vol. 18 No. 4, pp. 174-179
5 Etzkowitz, H., & Dzisah, J. (2008) ‘Rethinking development: circulation in the triple helix’,Technology Analysis & Strategic Management, Vol 20No 6, pp. 653-666
6 Etzkowitz, H., & Leydesdorff, L. (2000) ‘The dynamics of innovation: from National Systems and “Mode 2” to a Triple Helix of university – industry – government relations’,Science and Technology, pp. 109-123
7 Etzkowitz, H., & Ranga, M. (2013)‘Triple Helix Systems: An Analytical Framework for Innovation Policy and Practice in the Knowledge Society’,Industry and Higher Education, Vol 27 No 4, pp. 1-22
8 Etzkowitz,H. and Klofsten, M. (2005) ‘The innovating region: toward a theory of knowledge-based regional development’, R&D Management, Vol. 35 No. 3, pp. 243-255
9 Farinha, J. and Farinha, L. (2013) ‘Triangulation of the Triple Helix: a Conceptual Framework’, Triple Helix Association, pp. 1-21
10 Feldman, J. (2007) ‘The Managerial Equation and Innovation Platforms: The Case of Linkoping and Berzelius Science Park’, European Planning Studies, Vol. 15 No. 8, pp.1027-1040
11 Georgiou, C. et al (2012) ‘Development of an Innovation Strategy for the Thessaloniki Metropolitan region’, Paper read at International Conference for Entrepreneurship, Innovation and Regional Development.
12 Gialis, S. (2011) ‘Restructuring strategies, firms’ size and atypical employment in the local productive system of Thessaloniki, Greece’, International Relations Journal, Vol. 42 No. 5, pp. 412-427.
13 Goddard, J. et al (2012) ‘Universities, Technology and Innovation Centers and Regional Development: the case of the North-East of England’, Cambridge Journal of Economics, Vol. 36, pp. 609-627
14 International Committee (2010) Report of the International Committee on Higher Education in Greece. [Online] http://www.tsoukalas.org/attachments/313/INTERNATIONALCOMMITTEEON HIGHER EDUCATIONINGREEC E_EN.pdf (Accessed 11th January 2014)
15 Johnson, W. (2007) ‘Managing Collaborations of Engineering Management With Academia and Government in Triple Helix Technology Development Projects: A Case Example of Precarn From the Intelligent System Sector’, Engineering Management Journal, Vol. 19 No. 2, p.12-22
16 Kamaras, A. (2011) The origins of the Greek Financial Crisis. [Online] http://www.foreignaffairs. com/features/letters-from/the-origins-of-the-greek-financial-crisis (Accessed 6th February 2014)
41 Proceedings of International Conference for Entrepreneurship, Innovation and Regional Development
ICEIRD 2014
17 Ketikidis, P. et al (2010) ‘Regional innovation and competitiveness: Analysis of the Thessaloniki Metropolitan Region’, Proceedings of the 5th European Conference on Innovation and Entrepreneurship, Athens, Greece.
18 Lombardi, P. et al (2012) ‘Modelling the smart city performance’, Innovation-The European Journal of Social Science Research, Vol. 25 No. 2, pp.137-149
19 OECD, (2012) Science and Innovation: Greece. [online] http://www.oecd.org/greece/sti-outlook-2012-greece.pdf (Accessed 11th January 2014)
20 Piaggesi, D. et al(2012) ‘Sleeping Giant: the Triple Helix approach for Effective International Cooperation for Development’, Triple Helix Association, pp. 1-15
21 Rady, D. (2012) ‘Greece Debt Crisis: Causes, Implications and Policy Options’, Academy of Accounting & Financial Studies Journal, Vol. 16, pp. 87-96.
22 Schofield, T. (2013) ‘Critical success factors for knowledge transfer collaborations between university and industry’, Journal of Research Administration, Vol. 44 No. 2, pp. 38-56
23 Stankovic, M. et al (2012) ‘Is Triple Helix Innovation Possible in Macedonia?’, The International Journal of Knowledge, Culture and Change Management, Vol. 11 No. 5, pp.221-232
24 Suvinen, N. et al (2010) ‘How Necessary are Intermediary Organizations in the Commercialization of Research?’, European Planning Studies, Vol. 18 No. 9, pp.1365-1389
25 Svensson, P. et al (2012) ‘An Entrepreneurial University Strategy for Renewing a Declining Industrial City: The Norrkoping Way’, European Planning Studies, Vol. 20 No. 4, pp. 505-524
26 Tasopoulou, A. and Kakderi, C. (2007) ‘Metropolitan Governance and ICT Applications: spatial planning and entrepreneurship policies in the Greater Area of Thessaloniki’, Paper read at ERSA Conference.
27 Technology Park Thessaloniki. [online] http://www.thestep.gr/active.aspx?mode=en{150db8c4-df79-45f4-9c2b-33593af83045}View(Accessed 12th January 2014)
28 Technopolis Thessaloniki ICT Business Park. [online] http://www.technopolis.gr/en/pages/incubator(Accessed 12th January 2014)

42 Proceedings of International Conference for Entrepreneurship, Innovation and Regional Development
ICEIRD 2014
Application of methodological tools for the design and validation of new business models in Entrepreneurship ICT in Colombia
Gladys Elena Rueda1, Maryi Cardrazco2, Juan Carlos Aguirre3 1Research Director of the School of Strategic Studies, Leader of the Management Research Group, Universidad Pontificia Bolivariana de Bucaramanga, Colombia, [email protected]
2 Director of the Entrepreneurship Unit UPB, member of the Management Research Group, Universidad Pontificia Bolivariana de Bucaramanga, Colombia, [email protected]
3 Expert Mentor Apps.Co Program, Unión Temporal UPB-UDI-CETICS, SantanderApps, [email protected]
The design and validation of new business ideas wit h entrepreneurship requires different tools, Business Model Generation – Canvas [1], Customer Development and Lean Startup [2]. In Colombia, the Government is pr omoting entrepreneurship ICT-based, through Apps.Co program, which aims to train and mentor more than 5,000 entrepreneurs to develop mobile applications and di gital content to different industrial sectors.
The Apps.Co program has four stages: the first stag e, boot camps, the second stage, ideation, prototyping and validation, the third sta ge, consolidation, and the fourth stage acceleration. The article aims to share the e xperience of the second stage of ideation, prototyping and validation, performed in the city of Bucaramanga (Colombia) by the Temporary Union Pontifical Bolivarian Univer sity of Bucaramanga, the University of Research and Development, and the Clu ster of Companies in Information Technology in Santander. During the process, the bu siness component methodology CANVAS new business models and customer development was applied to generate a value proposition based on the needs of customers. On the technical component applications on Android and IOS, which were validat ed with a prototype in the market and online marketing strategies implemented were de veloped.
For the development of mentoring, Co-Working spaces are arranged, and Net-Working spaces for the development of business meetings. As a strategy to consolidate the teams was applied Lego Serious Play methodology and lessons learned workshops were conducted. Currently, and as a result of this experience, we have generated more than 90 ICT entrepreneurship ideas in this region, mainly aimed at the education, construction, marketing, games, and disabled, among others.
Keywords Entrepreneurship Education, regional entrepreneurship, Information Technology and communication
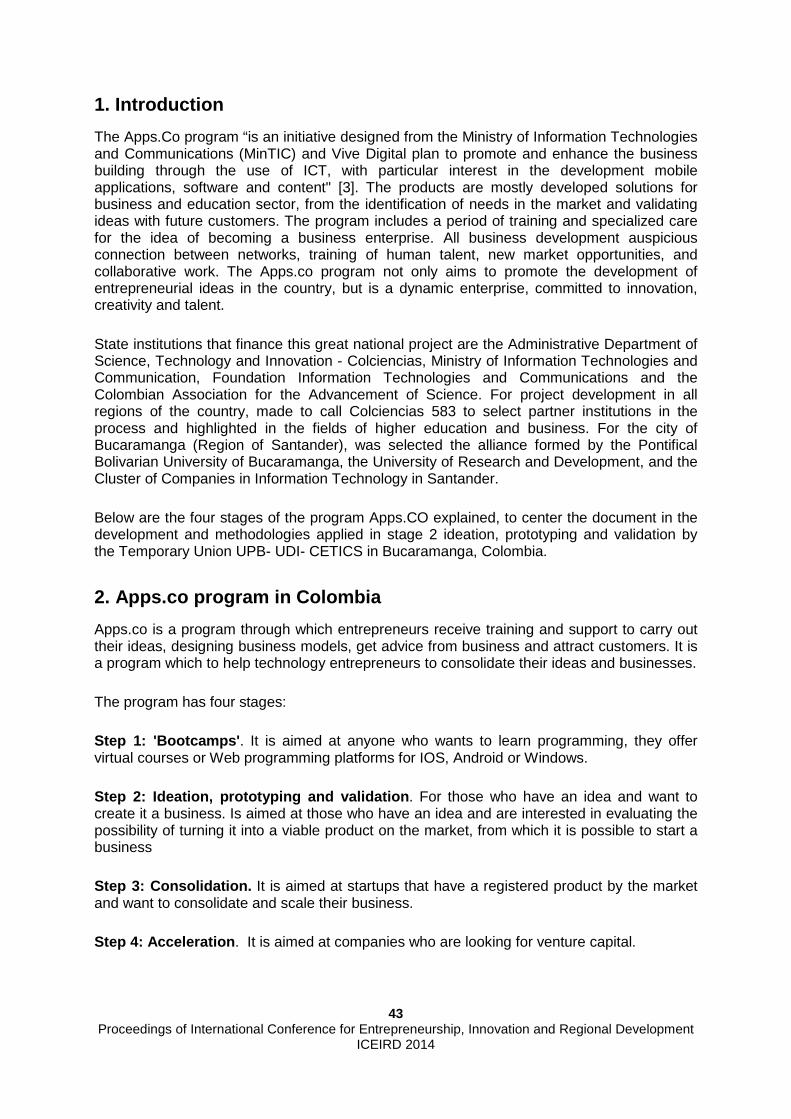
43 Proceedings of International Conference for Entrepreneurship, Innovation and Regional Development
ICEIRD 2014
1. Introduction
The Apps.Co program “is an initiative designed from the Ministry of Information Technologies and Communications (MinTIC) and Vive Digital plan to promote and enhance the business building through the use of ICT, with particular interest in the development mobile applications, software and content" [3]. The products are mostly developed solutions for business and education sector, from the identification of needs in the market and validating ideas with future customers. The program includes a period of training and specialized care for the idea of becoming a business enterprise. All business development auspicious connection between networks, training of human talent, new market opportunities, and collaborative work. The Apps.co program not only aims to promote the development of entrepreneurial ideas in the country, but is a dynamic enterprise, committed to innovation, creativity and talent. State institutions that finance this great national project are the Administrative Department of Science, Technology and Innovation - Colciencias, Ministry of Information Technologies and Communication, Foundation Information Technologies and Communications and the Colombian Association for the Advancement of Science. For project development in all regions of the country, made to call Colciencias 583 to select partner institutions in the process and highlighted in the fields of higher education and business. For the city of Bucaramanga (Region of Santander), was selected the alliance formed by the Pontifical Bolivarian University of Bucaramanga, the University of Research and Development, and the Cluster of Companies in Information Technology in Santander. Below are the four stages of the program Apps.CO explained, to center the document in the development and methodologies applied in stage 2 ideation, prototyping and validation by the Temporary Union UPB- UDI- CETICS in Bucaramanga, Colombia.
2. Apps.co program in Colombia
Apps.co is a program through which entrepreneurs receive training and support to carry out their ideas, designing business models, get advice from business and attract customers. It is a program which to help technology entrepreneurs to consolidate their ideas and businesses. The program has four stages: Step 1: 'Bootcamps' . It is aimed at anyone who wants to learn programming, they offer virtual courses or Web programming platforms for IOS, Android or Windows. Step 2: Ideation, prototyping and validation . For those who have an idea and want to create it a business. Is aimed at those who have an idea and are interested in evaluating the possibility of turning it into a viable product on the market, from which it is possible to start a business Step 3: Consolidation. It is aimed at startups that have a registered product by the market and want to consolidate and scale their business. Step 4: Acceleration . It is aimed at companies who are looking for venture capital.
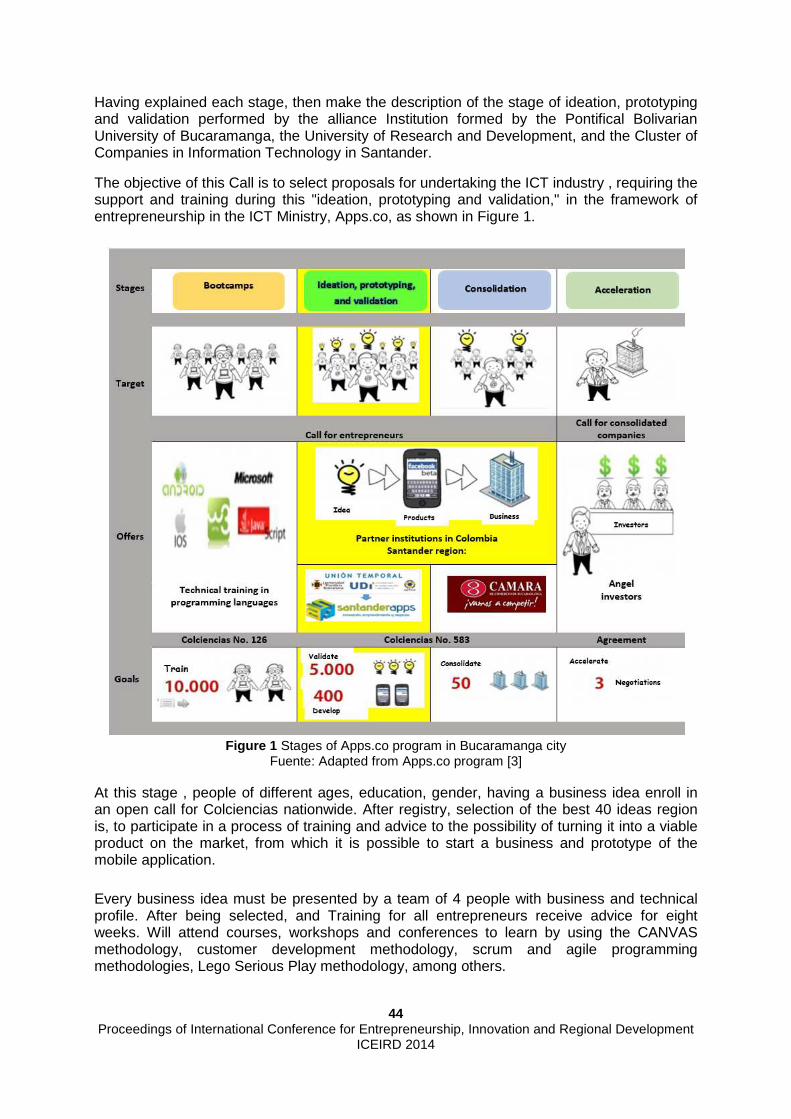
44 Proceedings of International Conference for Entrepreneurship, Innovation and Regional Development
ICEIRD 2014
Having explained each stage, then make the description of the stage of ideation, prototyping and validation performed by the alliance Institution formed by the Pontifical Bolivarian University of Bucaramanga, the University of Research and Development, and the Cluster of Companies in Information Technology in Santander.
The objective of this Call is to select proposals for undertaking the ICT industry , requiring the support and training during this "ideation, prototyping and validation," in the framework of entrepreneurship in the ICT Ministry, Apps.co, as shown in Figure 1.
Figure 1 Stages of Apps.co program in Bucaramanga city
Fuente: Adapted from Apps.co program [3]
At this stage , people of different ages, education, gender, having a business idea enroll in an open call for Colciencias nationwide. After registry, selection of the best 40 ideas region is, to participate in a process of training and advice to the possibility of turning it into a viable product on the market, from which it is possible to start a business and prototype of the mobile application. Every business idea must be presented by a team of 4 people with business and technical profile. After being selected, and Training for all entrepreneurs receive advice for eight weeks. Will attend courses, workshops and conferences to learn by using the CANVAS methodology, customer development methodology, scrum and agile programming methodologies, Lego Serious Play methodology, among others.

45 Proceedings of International Conference for Entrepreneurship, Innovation and Regional Development
ICEIRD 2014
3.1 Canvas Methodology
According to Osterwalder and Pigneur [1] “a business model describes the rationale of how an organization creates, delivers, and captures value”. The business model describes nine basic blocks which show the logic of how a company. The nine blocks cover the four main areas of a business: customers, offer, infrastructure, and financial viability, as shown in figure 2.
Figure 2. Nine basic blocks of Canvas Methodology [1]
• Customer Segments: An organization serves one or several Customer Segments. • Value Propositions: It seeks to solve customer problems and satisfy customer
needs with value propositions. • Channels: Value propositions are delivered to customers through communication,
distribution, and sales Channels. • Customer Relationships: are established and maintained with each Customer
Segment. • Revenue Streams Revenue streams result from value propositions successfully
offered to customers. • Key Resources: are the assets required to offer and deliver the previously
described elements. • Key Activities : by performing a number of Key Activities. • Key Partnerships: Some activities are outsourced and some resources are
acquired outside the enterprise. • Cost Structure: The business model elements result in the cost structure.

46 Proceedings of International Conference for Entrepreneurship, Innovation and Regional Development
ICEIRD 2014
3.1 Customer development methodology A methodology for discovering and validating the right market for your idea, building the right product features that solve customers’ needs, testing the correct model and tactics for acquiring and converting customers, and deploying the right organization and resources to scale the business. Is based in four steps: customer discovery, customer validation, customer creation, and company building, as shown in figure 3. [2]
Figure 3. Steps for customer development [4]
3.2 Scrum methodology A methodology for agile programming iterative development of software for project management and software product or application development , it is a team that works as a unit to achieve a common goal. Scrum enables online collaboration of all team members, daily meetings to resolve issues among all members, regular contact with customers to improve the prototype. [5] Scrum has the following guidelines: • Individuals and interactions over processes and tools • Software running on extensive documentation • Customer collaboration over contract negotiation • Responding to change over following a plan 3.3 Lego Serious Play© methodology This innovative methodology is basad in building three-dimensional models to identify, analyze and troubleshoot equipment trabjo and businesses [6]. learning and playing people better understand their working and personal environment, identify weaknesses, threats, strengths and opportunities. With esat tool is staged and shares the vision of oneself, team work, product or service and organization.

47 Proceedings of International Conference for Entrepreneurship, Innovation and Regional Development
ICEIRD 2014
All participants, individually or collectively, once staged the model can simulate changes that allow viewing future changes and their possible consequences within the organization, as shown in figure 4.
Figure 4. Workshops using Lego Serious Play Methology in Bucaramanga
4. Results Apps.co program in the city of Bucaraman ga 4.1. Training and consulting The process takes eight weeks, and a work plan that includes individual sessions for each business team, and group activities with all teams. Each team is trained and advised by an expert mentor and mentee mentor with experience in business, and two mentors specialized in digital marketing and programming languages. During the process, entrepreneurs attending the activities: Training by experts : - Methodology Canvas - Customer Development - Online Marketing - Startup Finance - Legal aspects of business. - Programming languages: Android, iOS , Windows - Scrum agile programming - Graphic Design - Communication skills - Team Leadership - Workshop Visual Apps - Tips Workshop for Mobile Application Development - Intellectual Property and Copyright - Apps economy

48 Proceedings of International Conference for Entrepreneurship, Innovation and Regional Development
ICEIRD 2014
- Construction of my mobile app - Communication Skills Advising Mentors initiatives experts and assistants (co -working rooms) : - Weekly Tracking initiatives - Improvement of the initial business idea - Application of knowledge acquired in training - Market - Contacts with customers - Business meals - Socialization of initiatives in the media Workshops: - Pre - ideation workshops - Lego Serious Play Methodology - Technology companies in the Stock Exchange - Development of Pitch - Business Networking with entrepreneurs - Events Demo Day - Video conference with experts from Silicon Valley
4.2 Entrepreneurs and Business Ideas During the program Apps.co in Bucaramanga have developed five iterations, from November 2012 to February 2014. So far has involved more than 300 entrepreneurs and more than 100 business ideas, as shown in Table 1.
Table 1 Number of entrepreneurs and initiatives in the city of Bucaramanga.
Iteration Entrepreneurs Business Ideas
1 72 19
2 76 20
3 83 21
4 77 20
5 77 21
Total 385 101
To complete each iteration, the entrepreneurs participating in events such as Elevators Pitch, Demo Day, Show Room, Apps camp, to publicize their new business models and achieve monetize their product to market.

49 Proceedings of International Conference for Entrepreneurship, Innovation and Regional Development
ICEIRD 2014
5. Conclusions
The Temporary Union Pontifical Bolivarian University of Bucaramanga, the University of Research and Development, and the Cluster of Companies in Information Technology in Santander is establishing itself as a regional leader in the generation of technological capabilities, and strengthening the powers of the resource through exercise "learning by doing". It is a strategic alliance between universities, companies in the ICT sector and the Colombian state, that offers entrepreneurs a greater richness in the exercise of entrepreneurship with the rigor of academia and science, which affects their education, and secondly side expertise and practice the productive sector which leads to the creation of new companies, which by their very nature can get strong in domestic and international markets.
The project is aligned with the objectives of the Ministry of ICT of Santander, which aims to strengthen the sector, managed funds to create and promote the creation of new technology companies, to promote research and innovation in technological developments and increased productivity and competitiveness of the sector. Thus, the ICT sector allows new entrepreneurs, mostly young people to display their creativity and break the mold of traditional companies in the production sector, with new innovative bets not only for the local market but with large opportunities to enter the world market.
Finally, the project has been positively evaluated at the national level by the Ministry of ICT. The challenge is to continue working to position the city of Bucaramanga as the most entrepreneurial city, in partnership with academic, productive and state sectors to consolidate ICT Entrepreneurship ecosystem of the country.
References
[1] A. Osterwalder y Y. Pigneur, Business Model Generation, Ed. Modderman Drukwerk, 2009, p. 72.
[2] S. Blank y B. Dorf, The Startup Owner's Manual: The Step-By-Step Guide for Building a Great Company, Ed. K&S Ranch Press, 2012, p. 557.
[3] Ministerio de las Tecnologías de la Información y la Comunicación, “Apps.co,” Ministerio de las Tecnologías de la Información y la Comunicación, November 2012. [Online]. Available: https://apps.co/about/apps-co-que-es/. [Accessed 2014].
[4] B. Cooper y P. Vlaskovits, The Entrepreneur's Guide to Customer Development, 2010. [5] K. Schwaber y M. Beedle, Agile Software Development with Scrum, 2001. [6] Lego Serious Play™, «Lego Serious Play™» [Online]. Available:
http://www.seriousplay.com/. [Último acceso: 15 febrero 2014].


51
SMART GROWTH FOR SMES


53 Proceedings of International Conference for Entrepreneurship, Innovation and Regional Development
ICEIRD 2014
Towards a new Management and Measurement Framework of (Young) German Small and Medium Sized Enterprises’ Intellectual Capital Sabrina Aschenbrenner1, Thomas Heupel2, Mercedes Carmona-Martínez3 1 FOM - IOM, Leimkugelstraße 6, Essen, Germany, [email protected] 2 FOM - IOM, Leimkugelstraße 6, Essen, Germany, [email protected] 3 UCAM - Administración y Dirección de Empresas, Campus de los Jerónimos, s/n
Guadalupe, Murcia, Spain, [email protected]
The information technology (IT) revolution and glob alization cause a dynamic and complex environment in which businesses’ success de pends progressively on intellect-based factors like human’s brain power, i nnovations and strategic alliances. That is because the latter help to deal with curren t challenges such as quickly changing demands or shortening product lifecycles b y identifying trends, acquiring relevant inputs, and developing and implementing re spective adjustments. Accordingly, it is accepted that firms’ performance improves as they leverage the management of their intellect-based factors which a re also known as intellectual capital (IC). This is particularly the case in smal l and medium sized enterprises (SME) and young firms which are faced with limited tangib le resources but highly innovative and successful. As such, they are arguably even mor e required to rely and able to compete on intangibles. The purpose of this theoretical paper is to contrib ute to (young) German SME’ management practise and in particular the managemen t of their knowledge-based aspects by enriching the understanding of their IC and its potential impact on corporate performance in today’s economy. Specifica lly, this article draws on the knowledge-based theory, international IC frameworks , German guidelines for reporting SME’ intangibles, German SME’ success fac tor research (SFR) and literature on start-ups/young companies. Thereby, it broadens the scope of conventional IC-works and develops an IC-model suitable for compani es of various age segments. The proposed new framework for managing and measuring G erman SME’ IC, which serves as the basis for subsequent empirical examinations, mainly differs from current IC models in two ways: it suggests multidimensional (m easurement) constructs for dealing with IC and it incorporates IC-aspects whic h are expected to be of great relevance for young enterprises. Keywords Conceptual model, German small and medium sized enterprises (SME), higher-order constructs/dimensions, intellectual capital (IC), young firms.
1. Relevance and Objective
In the current knowledge society companies' competitive advantages and long-term success are increasingly determined by (the management of) intellect-based, intangible resources instead of the former production factors – i.e. land, capital or labour [1]. This is not only recognized by businesses but also accepted, studied and verified in the scientific community [2, 3]. It is, for example, discovered that intellect-based values, which are also referred to as
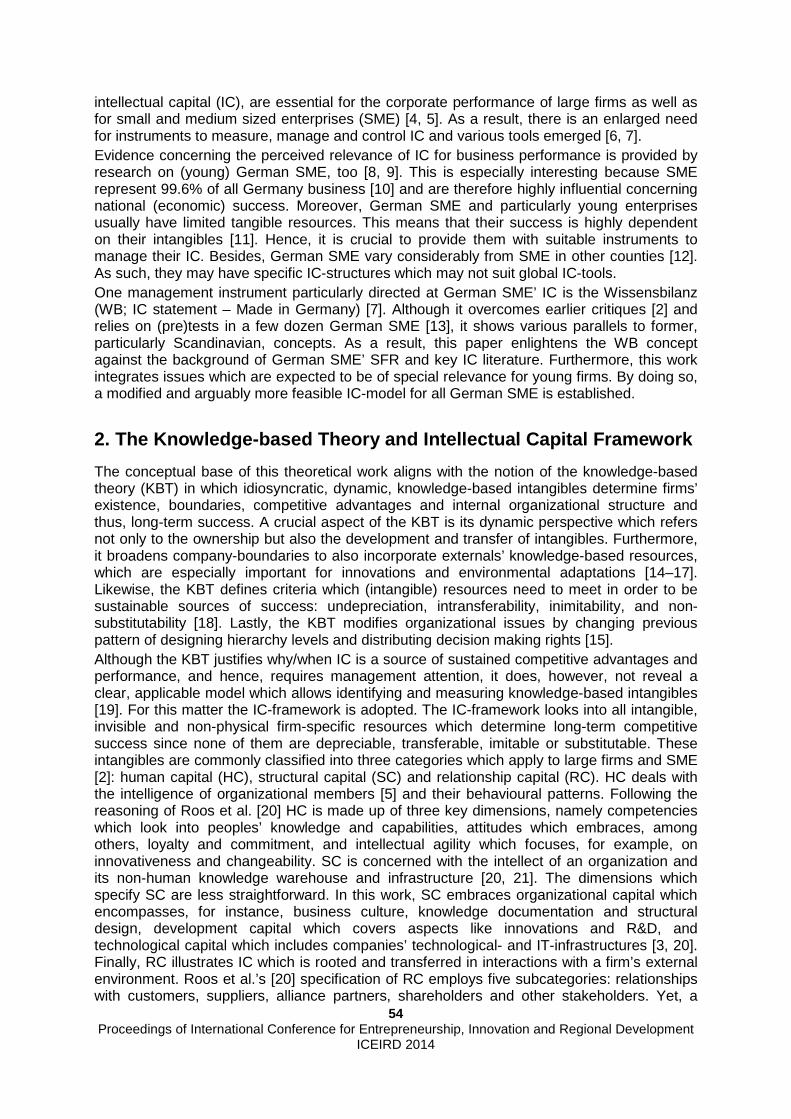
54 Proceedings of International Conference for Entrepreneurship, Innovation and Regional Development
ICEIRD 2014
intellectual capital (IC), are essential for the corporate performance of large firms as well as for small and medium sized enterprises (SME) [4, 5]. As a result, there is an enlarged need for instruments to measure, manage and control IC and various tools emerged [6, 7]. Evidence concerning the perceived relevance of IC for business performance is provided by research on (young) German SME, too [8, 9]. This is especially interesting because SME represent 99.6% of all Germany business [10] and are therefore highly influential concerning national (economic) success. Moreover, German SME and particularly young enterprises usually have limited tangible resources. This means that their success is highly dependent on their intangibles [11]. Hence, it is crucial to provide them with suitable instruments to manage their IC. Besides, German SME vary considerably from SME in other counties [12]. As such, they may have specific IC-structures which may not suit global IC-tools. One management instrument particularly directed at German SME’ IC is the Wissensbilanz (WB; IC statement – Made in Germany) [7]. Although it overcomes earlier critiques [2] and relies on (pre)tests in a few dozen German SME [13], it shows various parallels to former, particularly Scandinavian, concepts. As a result, this paper enlightens the WB concept against the background of German SME’ SFR and key IC literature. Furthermore, this work integrates issues which are expected to be of special relevance for young firms. By doing so, a modified and arguably more feasible IC-model for all German SME is established.
2. The Knowledge-based Theory and Intellectual Capi tal Framework
The conceptual base of this theoretical work aligns with the notion of the knowledge-based theory (KBT) in which idiosyncratic, dynamic, knowledge-based intangibles determine firms’ existence, boundaries, competitive advantages and internal organizational structure and thus, long-term success. A crucial aspect of the KBT is its dynamic perspective which refers not only to the ownership but also the development and transfer of intangibles. Furthermore, it broadens company-boundaries to also incorporate externals’ knowledge-based resources, which are especially important for innovations and environmental adaptations [14–17]. Likewise, the KBT defines criteria which (intangible) resources need to meet in order to be sustainable sources of success: undepreciation, intransferability, inimitability, and non-substitutability [18]. Lastly, the KBT modifies organizational issues by changing previous pattern of designing hierarchy levels and distributing decision making rights [15]. Although the KBT justifies why/when IC is a source of sustained competitive advantages and performance, and hence, requires management attention, it does, however, not reveal a clear, applicable model which allows identifying and measuring knowledge-based intangibles [19]. For this matter the IC-framework is adopted. The IC-framework looks into all intangible, invisible and non-physical firm-specific resources which determine long-term competitive success since none of them are depreciable, transferable, imitable or substitutable. These intangibles are commonly classified into three categories which apply to large firms and SME [2]: human capital (HC), structural capital (SC) and relationship capital (RC). HC deals with the intelligence of organizational members [5] and their behavioural patterns. Following the reasoning of Roos et al. [20] HC is made up of three key dimensions, namely competencies which look into peoples’ knowledge and capabilities, attitudes which embraces, among others, loyalty and commitment, and intellectual agility which focuses, for example, on innovativeness and changeability. SC is concerned with the intellect of an organization and its non-human knowledge warehouse and infrastructure [20, 21]. The dimensions which specify SC are less straightforward. In this work, SC embraces organizational capital which encompasses, for instance, business culture, knowledge documentation and structural design, development capital which covers aspects like innovations and R&D, and technological capital which includes companies’ technological- and IT-infrastructures [3, 20]. Finally, RC illustrates IC which is rooted and transferred in interactions with a firm’s external environment. Roos et al.’s [20] specification of RC employs five subcategories: relationships with customers, suppliers, alliance partners, shareholders and other stakeholders. Yet, a

55 Proceedings of International Conference for Entrepreneurship, Innovation and Regional Development
ICEIRD 2014
sixth dimension is arguably required to fully represent RC: stakeholders’ perceptions of a company [22].
3. Proposed IC-framework for (Young) German SME
Based on the above presented global IC-framework, a modified IC-model, which is tailored to the intangible sources of German SME’ success, is now presented. In depth, the previous IC-framework is compared to and adjusted in line with the German WB concept, the outcomes of German SME’ SFR and literature on young firms' as well as start ups' sources of success.
Intellectual Capital (IC) of Ger SME
Human Capital (HC)
Structural Capital (SC)
Relationship Capital (RC)
Employees‘ Competencies
Employees‘ Attitude
Employees‘ Intellectual
Agility
Leader(ship) and manage-ment ability
Customer Relationships
Supplier Relationships
Shareholder Relationships
Alliance // Cooperations Relationships
Informal Networks
Relationships
Public Perceptions
Organizational Capital
Technological Capital
Development Capital
Figure 1 New framework of (Young) German SME’ IC
Figure 1 illustrates the new IC-framework for (young) German SME which can be viewed as a foundation for better managing their IC. The proposed model still consists of three main components which correspond to the previously described global IC-categories (HC, SC, RC). Yet, the dimensions which specify these categories are modified based on an intensive literature review and interviews with five German SME experts as well as 16 German SME. Moreover, potential indicators for the respective HC-, SC- and RC-dimensions are suggested since “you can’t manage what you don’t measure” [23] (cf. Table 1). These selections are initially based on the operationalization of IC in former research on IC and German SME, and IC reporting. Subsequently, they are adjusted according to the aforementioned interviews.
3.1 Human Capital
HC is the most important facet of German SME’ IC [8] and represents a source of sustained competitive lead because of its tacit substance – i.e. embedded in peoples’ values or actions – which makes it unique, intransparent, intransferable, non-shareable and inimitable [15, 24]. The first dimension of the new model for German SME looks into employees’ competencies. It conforms to the WB since peoples’ education and the German dual apprenticeship system are important sources of success because they help to maintain a satisfactory stock and flow of qualified labour [25-27]. Same applies to further education provided by German SME. That is because many German SME offer it and in particular because advanced trainings are

56 Proceedings of International Conference for Entrepreneurship, Innovation and Regional Development
ICEIRD 2014
predominantly informal, unsystematic and internally performed [27, 28]. Hence, they are difficult to transfer, imitate, and substitute and thus, regarded as a source of sustained competitive success. The WB-aspect experience is also covered by German SME’ SFR. It can, for example, be argued that German SME’ workers have much experience because of their multifunctional, interdisciplinary and niche-market focused tasks [27, 29, 30]. The next dimension of the new HC-model, employees’ attitude, is based on the work of Roos et al. [20] since it well matches the research on (young) German SME. Broadly, this HC-subcategory resembles the WB-dimensions ‘employee motivation’ and ‘social competence’. Employees’ loyalty, for example, is a critical attribute of this dimension since it assures that peoples’ IC remains in a firm. German SME have great levels of staff’s loyalty as can be seen in their high seniority, small fluctuation and low sick-leave [26, 27]. This loyalty and other behavioural aspects like the willingness to take responsibility, workers’ commitment or motivation are to large parts attributable to intangible reasons such as close relationships between German SME’ workers and with the entrepreneur [26, 27, 31 - 33] and are especially important to young German SME because of their relatively low budgets and thus, limited abilities to motivate people monetarily [34]. Because of their undepreciation, intransferability, inimitability and non-substitutability, all these aspects are included in the new model. The third dimension of German SME’ IC also corresponds to Roos et al.'s concept [20] instead of the WB because intellectual agility is wider ranging than the WB ‘social competence’ which is partly already covered above. Specifically, this HC-dimension builds on and enhances the aforementioned ability of German SME’ staff to perform multifunctional tasks and its fairly broad knowledge base. In detail, it is assumed that these attributes grant that employees can/are willing to be, for example, flexibly stationed within a firm/across departments and are more likely to understand complex issues [26, 27]. This is also backed by literature on young firms which stresses the importance of employees' wanted autonomy and flexibility [35]. Other aspects of this third HC-dimension look into the innovativeness of German SME’ workers and thus, their potentials to provide innovative ideas/solutions as well as people’s personal developments which strengthen IC especially in today’s knowledge-based society [26, 27, 33]. All of these attributes are company-specific, undepreciable, intransferable, inimitable and non-substitutable and thus, require a spot in the new German SME’ IC-model. The last dimension of German SME’ HC agrees with former works on SME’ IC and the WB and focuses on (young) German SME’ leaders since they are very important for corporate performance [31, 36, 37]. Contrary to the WB, the content of this dimension follows, for consistency purpose, the patterns of the discussion on employees. Firstly, the attribute leaders’ competencies, which comprises education, advanced training and wide ranging experience, is supported by SFR of German SME and young firms [26, 33, 38-40]. Consequently, it deserves integration in the advanced IC-framework. The same applies for entrepreneurs’ attitudes since these people are highly motivated, passionate for and fully identify with their firm, which mostly determines private success, too [26, 27, 30, 41]. Therefore, the leaders are expected to utterly perform towards firms’ success. In terms of intellectual agility a similar picture is observed since German SME’ entrepreneurs generally strive for competitive advantages. Against this background it is not surprising that they constantly watch out for market changes, adjust accordingly, push innovations, learn from past actions and (intuitively) make right choices [26, 31, 42]. Lastly, it is interesting to point out that German SME’ leaders usually act not only as role models but also uphold an optimistic attitude which visualizes and plans their firms’ future [26, 27, 31]. Since all of the discussed facets are undepreciable, intransferable, inimitable and non-substitutable, they need to be included in the new IC-model. Concerning the measurement of the aforementioned four HC-dimensions, table 1 highlights exemplary indicators which are based on former research [most notably 7, 43-46] or newly created as a response to the above discussion (labelled 1). The first draft of these measures

57 Proceedings of International Conference for Entrepreneurship, Innovation and Regional Development
ICEIRD 2014
is tested with German SME experts and SME. They are especially responsible for adding or modifying all items labelled with 2. Compared to the WB-measures, the new set of indicators, which is only fractionally shown, is more comprehensive. Specifically, it covers all measurement items addressed by the WB – sometimes slightly modified (e.g. ‘number of’ is replaced by ‘euro spend on’) – apart from the measures on conflicts and company-internal surveys since they are either not supported by SFR or do not apply to the majority of German SME.
Table 1 Proposed indicators for HC, SC and RC
HC dimensions IndicatorsEmployees'
Competencies- No. of employees with academic degrees
- Percentage of training conducted in-house1
Employees' Attitude
- Average no. of years in the company of all employees (i.e. seniority)
- Estimate: percentage of employees who are highly motivated1
Employees' intellectual agility
- Percentage of employees who are capable of performing tasks beyond their actual field of competencies2
- Percentage of employees who can solve (important) issues without consulting their supervisor for advice2
Leader(ship) and management
ability
- Percentage of managerial tasks dedicated to direct communication with employees2
- Self-assessment: percentage to which the entrepreneurs/managers are visionary?1
SC dimensions
Organizational capital
- How strong is your company culture during crisis (scale) - in general?2
- Percentage of orders/services which are delivered/performed on time2
Development capital
- No. of improvement/innovation suggestions made by employees3
- Turnover generated via new products/services which have been launched in the past three years3
Technological capital
- Euro invested in IT3
- Euro invested to maintain/guarantee state-of-the-art technological level of machinery, process engineering and equipment
RC dimensions
Customer relationship
- Turnover generated with top 5 customers3
- Percentage of orders/services/projects, which lead to complaints (complaint rate)3
Supplier relationship
- Percentage of value of goods/raw materials/services procured from top 5 suppliers3
- Percentage of innovations developed with suppliers1
Shareholder // capital provider
relationship
- Percentage of credit/ debenture capital granted by the key external capital provider1
- Average duration of relationship with key external capital provider1
Alliance // cooperations relationship
- Percentage of projects conduced in cooperation with other firms1, 3
- No. of employees hired out of an alliance (firm and educational/research institution)2
Informal networks
relationship
- Percentage of turnover generated via the help of „gate keepers“ known from social/private networks1
- No. of memberships in associations or other interest groups2, 3
Public perceptions
- Euro invested in public relations work1
- No. of employees who applied via unsolicited application3
3.2 Structural Capital
German SME’ SC is predominantly concerned with IC manifested in organisational properties and an infrastructure which supports to leverage HC [47]. According to the WB it consists of six dimensions which differ majorly from the global IC-model. Yet, the latter is adopted and transferred into the context of (young) German SME since it is internationally accepted. Organizational capital is the first dimension of the new SC-model. It focuses on four success-critical attributes which fractionally overlap with the WB. The attribute business culture, for example, is of high significance for German SME’ long-term success since it is frequently performance-orientated and thus, pushes achievements. Likewise, it is important because German SME’ and particularly young firms' employees are generally motivated by instinct/cultural aspects like shared values or the allowance to learn from mistakes which also promote the sharing of intangibles [24, 26, 27, 48]. The characteristics of being idiosyncratic, intransparent, intransferable, unshareable and inimitable also apply to German SME’ attribute communication structure, knowledge documentation and decision making. Specifically, the majority of the latter is mainly informally, unsystematically and directly

58 Proceedings of International Conference for Entrepreneurship, Innovation and Regional Development
ICEIRD 2014
handled in German SME. This means that face-to-face meetings, quick reconciliations and tacit knowledge stocks are preferred over official formalized processes or IT-systems. This in turn, allows dealing with and corresponding to e.g. environmental demands fast and with great ease. Thus, it provides (young) German SME with a competitive advantage [9, 24, 26, 27, 48, 49]. The former is also facilitated by German SME’ third attribute – i.e. simple/flexible organizational structure/processes with low bureaucracy and little work division. Specifically, these operational attributes allow innovative and timely responses to changes, too [27, 31, 33]. With respect to young German firms it needs to be particularly stressed that they have not yet established structural procedures but still perform well because of their flexibility [36, 38, 40]. These structural settings also facilitate (young) German SME in terms of delivering high quality which is relevance since it is valued by customers and helps to compensate for cost-disadvantages compared to large firms or already established SME. Thus, quality is the fourth attribute which calls for integration in the new SC-model [26, 27, 31, 38, 39]. Development capital is the second dimension of (young) German SME’ SC and focuses primarily on innovations and intellectual property. As such it combines and enhances the WB’s ‘product innovation’ and ‘process optimisation and innovation’. The development and permanent advancement of products, processes and structures, which represents the first attribute of the new SC-model, is an important source of German SME’ and particularly young firms’ success because such innovations help to keep up with continuously changing demands. Moreover, this is especially interesting when taking into account that most German SME do generally not have the resources to manage their innovations systematically and instead do it along with daily task. As such, their innovation management is successful and sustainable because it is idiosyncratic, intransferable, inimitable and non-substitutable [26, 30, 31, 39, 49, 50]. With respect to intellectual property there is no common stream in German SME’ SFR. Patents, for example, are important to some SME and irrelevant and unfeasible to others [26–28, 49]. Yet, they are integrated in the new IC-model even if meaningless at times. German SME’ technical infrastructure is the theme of the last SC-dimension. It is similar to the WB’s ‘IT and explicit knowledge’ but embraces a wider range. Specifically, technological advancements are regarded as contributing to German SME’ success since they emend, for example, production flexibility, efficiency and the integration of diverse business areas. This, in turn, positively impacts throughput time or data usage which directly relates to economic success. Furthermore, it is interesting to stress that this SC-dimension is not only interested in technology per se or its productive usage but also the undepreciatable, intransferable, inimitable and non-substitutable choices regarding technological investment [39, 51]. An extract of the measurement model for SC and its dimensions is displayed in table 1, too. It shows that some items are newly incorporated or adjusted as a response to the qualitative test with German SME experts and SME (labelled 2). Interestingly, none of the newly created indicators of the initially developed set (labelled 1) withstood this test. Consequently, none of them are presented in this illustration. With respect to the WB, it can be observed that only a few out the WB’s 28 measures remain (labelled 3). All other measures rely either on other literature [among others 43-46] or the interviews. This deviation is fairly logic since the above discussion relies on a contrasting framework than the WB does.
3.3 Relationship Capital
RC is relevant since German SME are unable to exist without stakeholders like customers [52] and rely on knowledge-/IC-exchanges with them [47]. The global IC-model and the WB agree that RC encompasses relations with customers, suppliers, shareholders, alliance partners, and the public. The global IC-framework’s ‘other stakeholders’ is, however, neither incorporated in the WB nor in the new concept because it is quite inexact. Instead a new dimension which is of particular interest to young SME is added: ‘informal relationships’ [41].

59 Proceedings of International Conference for Entrepreneurship, Innovation and Regional Development
ICEIRD 2014
Customers represent the content of the first RC-dimension. They are the most central aspect of German SME’ and young firm’s RC [11] because of the mutual dependence between them and their customers which results from German SME’ mostly differentiated niche offerings and customers’ demand for these. Simultaneously, these require a reasonably high level of reconciliation and proximity which also facilitate IC-exchanges, impulses for innovations, and trust, satisfaction and loyalty [26, 27, 34, 49, 53]. Since these are undepreciable, intransferable, inimitable and non-substitutable, they require inclusion in the new IC-model. German SME’ second RC-dimension focuses on sources of success related to suppliers, who are especially important for manufacturers. That is because their supplies affect performance with respect to, for instance, product quality, production costs and timely delivery [11, 52]. Yet, since many of German SME’ suppliers are SME themselves, the discussed relations between firms and their customers apply in a reversed manner [54]. Capital providers are also important for (young) German SME’ corporate performance since they promote financial certainty [55]. Apart from German SME’ preferred financial autonomy, they resort, if necessary, mainly to (house-)bank credits. That is because their close, trustworthy and long-term relationships with financial institutions reduce information asymmetries and transaction costs and place focus on qualitative aspects as opposed to tangible collateral. Thus, the chances of receiving (cheap) capital are high, even with low equity ratios [26, 55, 56]. Since that latter are undepreciable, intransferable, inimitable and non-substitutable, they justify a position in the new IC-model. Young SME - especially the ones without break-even - do, however, not have established such relationships yet. Thus, they are likely to find it tough to raise funds [36, 40, 50] and need to rely on other sources. The fourth dimension of all German SME’ RC concerns their relationships to co-operation partners [11, 52]. These are particularly beneficial to focus on core competencies, amend resources, exchange IC, develop joint innovations and counterbalance labour shortage [57]. Most interestingly, it is mainly successful German SME which enter co-operations since they make it appealing to potential partners [58]. This as well as German SME’ fear to lose autonomy or important intangibles explains why they pick partners carefully and rarely [9, 26, 28]. The same holds for outsourcing activities, too [26, 30]. However, different conditions can be noticed for young German firms since they are more eager to enter co-operations since they support their innovations, knowledge and other resource exchanges [41, 50]. The new dimension of RC focuses on German SME’ informal relationships which are particularly meaningful for young firms since they compensate for other missing stakeholder relationships. In detail, family members, friends and other personal contacts provide undepreciable, intransferable, inimitable and non-substitutable psychological support like enthusiasm and active aid including labour, financial assets and innovation inputs [41, 50, 59]. Public perception also requires discussion in the context of (young) German SME. That is because relationships to the public and reputation are increasingly important to German SME’ sustained performance since they take time to establish and lose value if they are not maintained. In detail, German SME’ public perceptions are beneficial because German SME are well respected in the society for being a key tax payer, supplier of job, and sponsor of diverse activities like cultural or athletic events [26, 60]. For young firms this dimension matters for different reasons: it helps them, among others, to inform stakeholders of their existence, convince customers of their quality, gain investments and reduce suppliers’ risk [53]. The RC-dimensions are measured via indicators which rely on former works and the aforementioned two kinds of interviews, too. Table 1 demonstrates an extracted list of measures and shows that the indicators are mainly new (labelled 1) but inspired by existing literature [such as 43, 45, 46, 52]. Moreover, items are added as a response to the qualitative research (labelled 2). Besides it is notable that the measures are closely related to the WB (labelled 3).

60 Proceedings of International Conference for Entrepreneurship, Innovation and Regional Development
ICEIRD 2014
4. Conclusion
Overall it can be concluded that this paper presents an IC-model for German SME as well as young firms which party resemble the WB. However, because of its alignment to the German SME’ SFR, global IC literature, and literature on young firms, it broadens the scope with regard to content. Because of that it is expected that if German SME and young firms follow the new IC-framework instead of the WB, they increases their chances of success. Yet, this theoretical model requires empirical support which is therefore recommended for future research. In particular, the multivariate analytical method structural equation modelling is appropriate for this matter due to the fact that it can handle multidimensional latent constructs and their assumed impact on success. Lastly, the proposed framework might give impulses for international reflection which is especially important to test the model's steadfastness.
Abbreviations
HC Human capital IT Information technology IC Intellectual capital KBT Knowledge based theory (of the firm) RC Relationship capital SC Structural capital SFR Success factor research SME Small and medium sized enterprises
References
1. Bontis N, Dragonetti NC, Jacobsen K, Roos G. The knowledge toolbox: A review of the tools available to measure and to manage intangible resources. European Management Journal 1999; 17(4):391–402.
2. Kaufmann L, Schneider Y. Intangibles: A synthesis of current research. Journal of Intellectual Capital 2004; 5(3):366–88.
3. Martín de Castro G, Delgado-Verde M, López Sáez P, Navas López JE. Towards an intellectual capital-based view of the firm: Origins and nature. Journal of Business Ethics 2011;98(4):649–62.
4. F-Jardon CM, Martos MS. Intellectual capital and performance in wood industries of Argentina. Journal of Intellectual Capital 2009; 10(4):600–16.
5. Bontis N. Intellectual capital: An exploratory study that develops measures and models. Management Decision 1998; 36(2):63–76.
6. Edvinsson L, Malone MS. Intellectual capital: Realizing your company’s true value by finding its hidden roots. New York: Harper Business; 1997.
7. BMWi, editor. Wissensbilanz – Made in Germany: Leitfaden 2.0 zur Erstellung einer Wissensbilanz. Berlin; 2013.
8. BMWi, editor. Studie „Wissensstandort Deutschland“: Deutsche Unternehmen auf dem Weg in die wissensbasierte Wirtschaft – Ergebnisse 2010. Berlin; 2010.
9. Pawlowsky P, Gözalan A, Schmid S. Wettbewerbsfaktor Wissen: Managementpraxis von Wissen und Intellectual Capital in Deutschland: Eine repräsentative Unternehmensbefragung zum Status quo“. Chemnitz: Forschungsstelle organisationale Kompetenz & Strategie; 2011.
10. IfM-Bonn (Institut für Mittelstandsforschung Bonn). Schlüsselzahlen des Mittelstands nach der KMU-Definition des IfM Bonn - Deutschland; 2012/2013 [cited 2012 Dec 16/2013 Oct 29]. Available from: URL:http://www.ifm-bonn.org/index.php?id=889.
11. BMWi, editor. Studie „Wissensstandort Deutschland“: Deutsche Unternehmen auf dem Weg in die wissensbasierte Wirtschaft – Zwischenergebnisse 2009. Berlin; 2010.
12. Malshe A, Eckhoff J. Triebwerk des Erfolgs: der deutsche Mittelstand im Fokus. London: GE Capital EMEA Services Limited; ESSEC Business School; 2012.

61 Proceedings of International Conference for Entrepreneurship, Innovation and Regional Development
ICEIRD 2014
13. Arbeitskreis Wissensbilanz, editor. „Wissensbilanz – Made in Germany“: Projektstudie über weiche Faktoren als Teil der Unternehmenseinschätzung – Finanzmarkt Wirkungstest (Teil 1). Berlin; 2006.
14. Nonaka I. The knowledge-creating company. Harvard Business Review 1991; 69(6):96–104. 15. Grant RM. Towards a knowledge-based theory of the firm. Strategic Management Journal 1996;
17(Special Issue Winter):109–22. 16. Teece DJ, Pisano G, Shuen A. Dynamic capabilities and strategic management. Strategic
Management Journal 1997; 18(7):509–33. 17. Prahalad CK, Hamel G. The core competence of the corporation. Harvard Business Review
1990; 68(3):79–91. 18. Bamberger I, Wrona T. Der Ressourcenansatz und seine Bedeutung für die strategische
Unternehmensführung. Schmalenbachs Zeitschrift für betriebswirtschaftliche Forschung 1996; 48(2):130–53.
19. Reed KK, Lubatkin MH, Srinivasan N. Proposing and testing an intellectual capital-based view of the firm. Journal of Management Studies 2006; 43(4):867–93.
20. Roos J, Roos G, Dragonetti NC, Edvinsson L. Intellectual capital: Navigating the new business landscape. Houndmills, Basingstoke, Hampshire, London: Macmillan; 1997.
21. Swart J. Intellectual capital: Disentangling an enigmatic concept. Journal of Intellectual Capital 2006; 7(2):136–59.
22. Brooking A. Intellectual Capital. London et al.: International Thomson Business Press; 1997. 23. Kaplan RS, Norton DP. The balanced scorecard: Translating Strategy into Action. Boston:
Harvard Business School Press; 1996. 24. Voigt S, Finke I, Orth R. Fazit aus 15 mittelständischen Fallstudien. In: Mertins K, Seidel H,
editors. Wissensmanagement im Mittelstand: Grundlagen - Lösungen - Praxisbeispiele. Berlin, Heidelberg: Springer; 2009. p. 271–82.
25. Kay R, Kranzusch P, Suprinovič O. Absatz- und Personalpolitik mittelständischer Unternehmen im Zeichen des demografischen Wandels: Herausforderungen und Reaktionen. Bonn: IfM-Materialien Nr. 183; 2008.
26. Simon H. Hidden Champions des 21. Jahrhunderts: Die Erfolgsstrategien unbekannter Weltmarktführer. Frankfurt am Main, New York: Campus Verlag; 2007.
27. Simon H. Die heimlichen Gewinner (Hidden Champions): Die Erfolgsstrategien unbekannter Weltmarktführer. Frankfurt am Main, New York: Campus Verlag; 1996.
28. Pawlowsky P, Gerlach L, Hauptmann S, Puggel A. Wissen als Wettbewerbsvorteil in kleinen und mittelständischen Unternehmen: Empirische Typologisierungen auf Grundlage einer bundesweiten Befragung. Chemnitz: Forschungsstelle Organisationale Kompetenz & Strategie - prints; 2006.
29. Völker R, Sauer S, Simon M. Wissensmanagement im Innovationsprozess. Heidelberg: Physica; 2007.
30. Adenäuer C. Erfolgsunternehmen in der Industrie: Analyse von Einflussfaktoren auf Grundlage des BDI-Mittelstandspanels. In: IfM-Bonn (Institut für Mittelstandsforschung Bonn), editor. Jahrbuch zur Mittelstandsforschung 1/2007. Wiesbaden: Gabler; 2007. p. 15–47.
31. Gruber M. Der Wandel von Erfolgsfaktoren mittelständischer Unternehmen. Wiesbaden: Deutscher Universitätsverlag; 2000.
32. Fueglistaller U, Halter F, Müller C. Increasing the value of small and medium-sized enterprises by means of employee loyalty / Wertsteigerung von Klein- und Mittelunternehmen durch Mitarbeiterloyalität: An action-oriented model / ein handlungsorientiertes Modell: Universität St.Gallen; 2004 [cited 2013 Oct 30]. Available from:
URL: www1.kmu.unisg.ch/rencontres/RENC2004/Topics/Fueglistaller_Renc_04_Topic_D.pdf. 33. Daschmann H. Erfolgsfaktoren mittelständischer Unternehmen: Ein Beitrag zur
Erfolgsfaktorenforschung [Dissertation]. Stuttgart: Poeschel; 1993. 34. Wagner J. Firmenalter und Firmenperformance: Empirische Befunde zu Unterschieden zwischen
jungen und alten Firmen in Deutschland. Luneburg: University of Luneburg; 2005. 35. Bau F. Anreizsysteme in jungen Unternehmen: Eine empirische Untersuchung [Dissertation,
Universität Regensburg]. Lohmar, Cologne: Eul; 2003.
62 Proceedings of International Conference for Entrepreneurship, Innovation and Regional Development
ICEIRD 2014
36. Egeln J, Falk U, Heger D, Höwer D, Metzger G. Ursachen für das Scheitern junger Unternehmen in den ersten fünf Jahren ihres Bestehens: Studie im Auftrag des Bundesministeriums für Wirtschaft und Technologie. Mannheim, Neuss; 2010.
37. Pleitner HJ. Ausgewählte Schriften von Hans Jobst Pleitner. In: Mugler J, Schmidt K, editors. Klein- und Mittelunternehmen in einer dynamischen Wirtschaft: Ausgewählte Schriften von Hans Jobst Pleitner. Berlin, Munich, St. Gallen: Duncker & Humblot; 1995.
38. Gottschalk S, Kanzen S, Licht G, Müller K, Niefert M, Gude H et al. KfW/ZEW-Gründungspanel für Deutschland: Beschäftigung, Finanzierung und Markteintrittsstrategien junger Unternehmen – Resultate der ersten Befragungswelle. Mannheim: Verband der Vereine Creditreform e.V.; KfW Bankengruppe; Zentrum für Europäische Wirtschaftsforschung GmbH (ZEW); 2008.
39. Küpper H. Erfolgsfaktoren mittelständischer Unternehmen. In: Pleitner HJ, editor. Strukturen und Strategien in Klein- und Mittelunternehmen als Wegbereiter des Aufschwungs: Beiträge zu den "Rencontres de St-Gall" 1994. St. Gallen; 1994. p. 115–24.
40. Fryges H, Gottschalk S, Metzger G, Mohr B, Murmann M, Ulrich K. Gründungspanelbericht: Start mit Strategie - Beschäftigungsfluktuation und Finanzierungsverhalten junger Unternehmen. 5th ed. Mannheim: Verband der Vereine Creditreform e.V.; KfW Bankengruppe; Zentrum für Europäische Wirtschaftsforschung GmbH (ZEW); 2012.
41. Hormiga E, Batista-Canino R, Sánchez-Medina A. The role of intellectual capital in the success of new ventures. International Entrepreneurship and Management Journal 2011; 7(1):71–92.
42. Stahl HK. Führungskräfte als Mentoren. In: Stahl HK, Hinterhuber HH, editors. Erfolgreich im Schatten der Großen: Wettbewerbsvorteile für kleine und mittlere Unternehmen. Göttingen: Erich Schmidt Verlag; 2003. p. 65–82.
43. Danish Ministry of Science, Technology and Innovation. Intellectual capital statements: The new guideline. Copenhagen; 2003.
44. AKIW (Arbeitskreis "Immaterielle Werte Rechnungswesen" der Schmalenbach Gesellschaft für Betriebswirtschaft). Freiwillige externe Berichterstattung über immaterielle Werte. Der Betrieb 2003; 56(23):1233–7.
45. Ordonez Pablos P de. Intellectual capital reporting in Spain: A comparative view. Journal of Intellectual Capital 2003; 4(1):61–81.
46. Thorleifsdottir A, Claessen E. Putting intellectual capital into practice: Nordic harmonized knowledge indicators. Oslo: Nordic Innovation Centre; 2006. (Project number: 03094).
47. Alwert K. Wissensbilanzen für mittelständische Organisationen: Entwicklung und prototypische Anwendung einer geeigneten Implementierungsmethode [Dissertation]. Berlin: Technische Universität Berlin; 2005.
48. Brettel M, Engelen A, Heinemann F, Kessell A. Marktorientierte Unternehmenskultur als Erfolgsfaktor in jungen Wachstumsunternehmen. Zeitschrift für Betriebswirtschaft 2008; 78(11):1197–220.
49. Dömötör R. Erfolgsfaktoren der Innovativität von kleinen und mittleren Unternehmen [Dissertation]. Wiesbaden: Gabler; 2011.
50. Dautzenberg K, Ehrlinspiel M, Gude H, Käser-Erdtracht J, Schultz PT, Tenorth J et al. Studie über schnell wachsende Jungunternehmen (Gazellen): Endbericht. not specified: Bundesministerium für Wirtschaft und Technologie; 2012.
51. Schneider HM. Produktionsmanagement. In: Pfohl H, editor. Betriebswirtschaftslehre der Mittel- und Kleinbetriebe: Größenspezifische Probleme und Möglichkeiten zur Lösung. 4th ed. Berlin: Erich Schmidt Verlag; 2006. p. 149–82.
52. Bischof J. Nachhaltige strategische Steuerung von Geschäftsbeziehungen im Mittelstand. Zeitschrift für Controlling & Management 2012; (Special Issue 1):10–20.
53. Hormiga E, Batista-Canino RM, Sánchez-Medina A. The impact of relational capital on the success of new business start-ups. Journal of Small Business Management 2011; 49(4):617–38.
54. Krüger W. Standortbestimmung: Wo steht der Mittelstand? In: Krüger W, Klippstein G, Merk R, Wittberg V, editors. Praxishandbuch des Mittelstandes: Leitfaden für das Management mittelständischer Unternehmen. Wiesbaden: Gabler; 2006. p. 13–31.
55. Reinemann H. Mittelstandsmanagement: Einführung in die Theorie und Praxis. Stuttgart: Schäffer-Poeschel; 2011.

63 Proceedings of International Conference for Entrepreneurship, Innovation and Regional Development
ICEIRD 2014
56. Börner CJ. Finanzierung. In: Pfohl H, editor. Betriebswirtschaftslehre der Mittel- und Kleinbetriebe: Größenspezifische Probleme und Möglichkeiten zur Lösung. 4th ed. Berlin: Erich Schmidt Verlag; 2006. p. 297–329.
57. Verworn B. Auswirkungen des demografischen Wandels auf die Innovationsfähigkeit von KMU: Handlungsfelder für das Personalmanagement: Brandenburg University of Technology Cottbus, Chair of Organization, Human Resource & General Management; 2007 [cited 2013 Dec 5]. Available from: URL:http://www.econstor.eu/bitstream/10419/52349/1/672338653.pdf.
58. Knop R, editor. Erfolgsfaktoren strategischer Netzwerke kleiner und mittlerer Unternehmen: Ein IT-gestützter Wegweiser zum Kooperationserfolg [Dissertation]. Wiesbaden: Gabler; 2009.
59. Baldegger R, Julien P. Regionales Unternehmertum: Ein interdisziplinärer Ansatz. Wiesbaden: Gabler; 2011.
60. Englisch P, Sahr K, Volkmann C, Blank C, Tokarski KO. Nachhaltige Unternehmensführung: Lage und aktuelle Entwicklungen im Mittelstand. Essen, Wuppertal, Bern: Ernst & Young GmbH, Wirtschaftsprüfungsgesellschaft; UNESCO Chair of Entrepreneurship and Intercultural Management, Schumpeter School of Business and Economics; Berner Fachhochschule, Fachbereich Wirtschaft; 2012. (Agenda Mittelstand).

64 Proceedings of International Conference for Entrepreneurship, Innovation and Regional Development
ICEIRD 2014
The Human Resource Practices as Drivers of Innovations in SMEs Vesna Zabijakin Chatleska
UKIM, ISPPI, Centre for Management and Human Resource Development,
Partizanski odredi bb, 1000 Skopje, Republic of Macedonia, [email protected] In recent times important subject for academics and practitioners has become the innovative capacity and economic growth of the ente rprises. Within the innovation studies, the role of effective human resource manag ement (HRM) in providing a sustainable innovative capability has become a prom inent issue. This is particularly important for small and medium sized enterprises (S MEs) in less developed economies. On the one hand, SMEs are dominant in th e structure of active business entities in the national economies and employ signi ficant number of the total workforce. On the other hand, they are faced with l imited resources and difficult access to new, which are necessary for their growth and competitiveness. Human resources (HR), as part of the internal organizatio nal resources, have the potential to be the bearers of the progress, to develop and impl ement new innovative solutions if they are managed trough appropriate HR policies and practices. This paper is a preliminary attempt to explore the relationship bet ween human resource practices and innovation performance of SMEs in a transition econ omy. The main purpose was to identify the human resource practices enabling and leveraging the innovation processes. The empirical research was conducted on a purposive sample of 36 SMEs in the Republic of Macedonia, which have medium and high innovation performance in relation to industry competitors and are ranked amo ng the 200 most profitable enterprises in 2010. The results suggest that innov ation performance is statistically significantly correlated with: participation in dec ision making, quality management training and upward communication through attitude survey and job satisfaction survey. But this is not the case with practices such as tea mwork and performance related pay. Those findings open numerous questions about the relationship between human resource practices and innovation performance and refer to the need of further, more comprehensive research. Keywords Human resource practices, Innovation performance, SMEs, Transition economy. 1. Introduction Small and medium sized enterprises (SMEs) are the driving force of national economies and are important part in generating the gross domestic product in the developed countries. In less developed economies, most SMEs are facing with unfavorable external economic and social conditions and at the same time they have a poor internal capacity which impedes their growth and competitiveness. Serious problem of SMEs in a transitional economy are the additional burden with issues of survival, due to frequent and sometimes extreme forms of institutional upheaval and changing economic environment. In this sense, the biggest challenge for SMEs is how to survive and how to achieve a sustainable growth. According to the Resource based theory of the firm, the advantage over the competitors and the improved business performance, as well as the innovative performance, can be built up through internal resources, which also includes the human resources [1]. This topic has been extensively empirically tested in the developed economies [2], unlike in Republic of

65 Proceedings of International Conference for Entrepreneurship, Innovation and Regional Development
ICEIRD 2014
Macedonia which is a country that goes through a long transition and is in constant changes. The research studies, conducted in developed countries, confirm the positive relation between strategic human resource management (SHRM) and organizational performance. However, there is a lack of serious empirical confirmation for this connection in small transitional economies, such as Macedonia. On the other hand, there is an increased need for research studies that will be aimed specifically at the relationship between HMR and the innovative performance in SMEs in terms of achieving competitive advantage. This paper makes an attempt to provide answers on the topic of HR practices that promote and support innovations in SMEs and to open a debate on ways of achieving higher innovation capabilities through development and exploiting human resources. The primary goal of this study is to determine and analyze those HR practices that are related with innovation performance of successful companies, in context of transitional economies. 2. HRM in SMEs under transitional economy The human resource management in European transitional economies is an important research topic because of the fact that companies from these economies operate in specific changeable and turbulent environment. Republic of Macedonia (as one of the ex Yugoslavia republics) belongs to the East European countries in transition. Even after more than 20 years, although there are significant improvements, the consequences of the unfinished and sometimes inadequately managed transitional processes from self governing economy to free market economy are still evident. The most significant results of these processes are: a) rapid forming of new SMEs; b) privatization (with domestic capital) and restructuring of the existent companies that mostly are SMEs; and c) acquisition from foreign companies/investors. As a result, most of the newly formed were faced with the problem of week internal capability and the week ability to compete at the open markets. The entrepreneur process is Macedonia is burdened with many weaknesses besides the fact that the country made a significant step forward in forming institutions and favorable environment for SMEs development. The number of real entrepreneurial firms with innovative features, export-oriented, and fast growing SMEs, is still low. In the first years of transition, as an inheritance of the old system, the HR function was down to administrative activities related to the legal aspects of employee relations. The top management was focused on issues such restructuring and important strategic decision making for the future, and thereby, intentionally or due to lack of knowledge for HR related questions, the activities for creating appropriate HR system were neglected. The slow development of HR functions in SMEs is also due to absence of tradition for strategic approach towards HR, although the top managers agree that employees are important source of competitiveness. In the past years, out of necessity and above all reactive, the interest and activities related to HR have increased as a need for more educated and skilled workforce, driven by the efforts for company development. This was going on in parallel with layoffs and cutting of jobs in search for more profitable operating or for survival. The entrance of foreign companies and investments, encourage the development of HRM or at least there have been initiatives for more effective management of the employees and work relations. The large as well as some medium-sized companies introduced HR sectors, following the example of foreign companies or as a result of takeover from foreign investors who are establishing these function by default. Recently there is an evidence of positive steps, such as employing educated workforce competent in HR, consultation services and through development of the existing workforce (trainings, workshops and seminars). Although positive changes are evident, still the main problem is the absence of more serious strategic approach from top management when it comes to questions like investments in human capital development, mainly because of the belief that employees represent cost and not investment.

66 Proceedings of International Conference for Entrepreneurship, Innovation and Regional Development
ICEIRD 2014
3. Concept of innovation and innovation capability in SMEs The innovation capability is an important factor in the success of enterprises. The industrial innovation is positively connected with the long term business growth. Enterprise development through continuous innovation is positively related with value added and overall performance, and indirectly affects the national and regional economy. The concept of innovation is a complex one and it is defined differently, depended on the search fields. In the most general sense, the process of innovation represents a system of organized and fully directed activities and utilization of the whole knowledge, which creates ‘novelties’ and changes in any domain of business activity, commercial use, diffusion and utilization. This definition does not assume only technical progress; it also has broader meaning and includes all types of technological and non-technological innovations which apply equally to both manufacturing and service sector [3]. Technological innovations refer to the creating new technologies and their wide implementation on everyday business activities. They are: product innovations (introduction of new products or improving the quality of the existing ones) and process innovations (implementing new production methods) [4]. Non-technological innovations are resulting from changes in other economics activates of the company, for example innovations in supply, innovations in marketing and commercialization, new management methods, competitive strategies, organizational structure, innovative HRM practices, etc. It must be emphasized that, regardless of what kind of innovation it is, every system that creates and implements innovation must go through changes in the existing practices, which means radical or at least incremental changes in the knowledge, skills, abilities, routines as well as change of the technical equipment [5]. The innovation capability is not connected with the size of the company. Research on innovation and entrepreneurship clearly shows that SMEs are positively connected with the innovative performance. It is definitely confirmed that beside large companies, small companies also have important role in processes for creating innovations and have meaningful contribution in the technological development as a whole [4]. The advantage of SMEs is their flexibility, organic structure, effective communication, entrepreneurship spirit, readiness for change and risk readiness, passion for higher achieving. These features are suppressed when the firm grows in size and it’s faced with the need of formal operations control, higher hierarchical pyramid and bureaucratic structure. On the other hand, large companies have advantage in the approach and possession of different kind of resources and capacities for research and development, which quite often lack the SMEs [6]. Such conditions are forcing them to rely more on internal resources, such as HR and invest in development of the human capital for enabling innovative capability and higher innovative performance. 4. The relationship between HR practices and innova tion performance In the literature, innovation is viewed from different approaches and traditions. The first approach is based on adaptation theory (diffusion of new product, service, and process). The second one, studies the innovation from the aspect of the degree of ‘novelty’ that brings the innovation. The third approach is focused on the behavior and the capability of the employees and as a starting point takes Resource-based view of the firm [1, 6]. According to Altman and his colleagues, the capacity of the company for creating and implementing innovations is conditioned by the internal resources, more precisely the employees, and their specific behavior and knowledge, that have the potential to support, develop and implement new ideas. It is already confirmed that the company’s biggest innovative assets are the employees, not their products. This research accepts the third approach as the relevant one in the studying the relation between HRM and innovation performance. If innovation performance is the result of the employees’ knowledge, skills and
67 Proceedings of International Conference for Entrepreneurship, Innovation and Regional Development
ICEIRD 2014
behavior, then it would be expected that the way they are managed would have an impact on the innovative outcomes. In this regards, theoretically and empirically, it can be assumed direct connection between the HR practices and the organization innovative capability for developing new product, process or service. Research findings, that have been carried out so far, suggest that some HR practices and policies are positively connected with the innovative performance and innovation capability [5, 7, 8, 9, 10]. Those are: recruiting and selecting of talented people that are open to new knowledge and posses entrepreneurial spirit, training and knowledge improvements, teamwork, internal carrier opportunities/promotions, employee participation and empowerment for decision making, information sharing, performance related pay (incentive-based remuneration schemes etc.). Given that these practices are adapted to a various extent (or are not used at all) in Macedonia’s SME, this study will be focused on exploring those HR practices for which there is some prior knowledge and insights. At the same time, those are practices that refer to the creation of high-performing employees. More accurately, they are part of the HR policies for decentralization and motivation. Decentralization policy is among the most important for encouraging innovation performance. It is implemented through several practices. HR practice of delegating decision-making and problem-solving enables utilization of all knowledge, especially that what is tacit. Employee participation means responsibility and empowerment in decision making regarding questions about production, processes and services. Pfeffer points that empowerment increases the employees’ discretional rights and creates autonomy which is an important dimension of the work itself [11]. Task autonomy can be referred to an individual worker or to a team as a whole. Usually, autonomy is given to teams in terms of tasks accomplishment and, as a HR practice, is an important part of the decentralization process. Increased adaption of autonomous teams is important because enables joint operation of different knowledge, skills and capabilities of the employees which can result in better innovative performance. Teamwork is considered to have a direct positive effect on the technological innovation [3] and contributes to incremental process improvement [7,10]. Participation in decision-making by itself will have little impact on increasing innovation capabilities if not properly combined with practices of training and employee development. Modern organizations recognize the importance of knowledge, continuous learning and innovation. Knowledge capital becomes the driving force of economic growth, as well as training and skills developments are two important factors for organizational innovation and performance [10]. Training will enable employees to better perform their respective tasks; it will provide them with the sense of responsibility and creativity, job satisfaction and motivation which on the long run results in increased productivity. Companies that tend to be innovative, use open communication practices and information sharing that enabling ‘the voice of the employees’ to be heard. This proactive practice encourages bigger participation, commitment and communication (lateral and vertical) as well as creating culture of collaboration and innovation [3]. Attitude survey and job satisfaction survey are extremely important upward communication instruments and methods of employee involvement. These are regular anonymous surveys through which the top management can see a clear picture for the interests, preferences, problems and the level of job satisfaction and commitment of the employees. Based on previous assertions and arguments, it is expected that the universal and direct connection between HR practices and organizational performance in terms of innovation to be confirmed. Therefore the following hypothesis is proposed: There is a direct positive relationship between individual HR practices, such as: a) training; b) teamwork; c) participation in decision making; d) upward communication; e) performance related pay, and innovation performance.

68 Proceedings of International Conference for Entrepreneurship, Innovation and Regional Development
ICEIRD 2014
5. Method 5.1. Sample According to the data of the State Statistical Office, the number of active business entities in the Republic of Macedonia in 2010 was 75497. The data on the structure of active business entities according to the number of persons employed show that the highest share of 78.5% belongs to business entities with 1-9 persons employed, followed by business entities with no persons employed (or the entities did not provide information about persons employed) with 14.2%, and entities with 10-19 persons employed with 3.3%. The share of entities with 20-49 persons employed was 2.1%, those with 50-249 persons employed participated with 1.6%, while entities with 250 or more persons employed had a share of only 0.3% [12]. The data for this research are based on a representative sample of 36 SMEs from the private sector (which accepted to fill in the questionnaires) from the population of 200 biggest (ranked by total revenue) and most successful (ranked by profit before income tax) public and private companies in Republic of Macedonia, for the fiscal year 2010 [13]. The criteria used for selecting the sample are the organizational performances. The criteria of innovative performance were not used due to the lack of official data. Out of the 36 companies, 18 were from the service sector and 18 from the manufacturing sector. In respect of the type of ownership, 23 enterprises were domestic and 13 were foreign (> 51% foreign capital). According to the size of the companies, 29 were medium sized (less than 250 employees) and 7 were small (less than 50 employees). The sample does not contain micro-enterprises (less than 10 employees). More accurate data are presented in Table 1. Table 1 Frequency of enterprises in the sample categorized by size (number of employees) Company size Number of employees Frequency % Cumulative %
Small (< 50) 7 19.4 19.4 Medium-sized (< 250) 50-99 12 33.35 52.8
100-199 14 38.9 91.7
200-249 3 8.3 100.0 Total 36 100.0 /
Most of the enterprises, precisely 75% (27) are established after the ’90-ties, when the economic system was changed to open market economy. Table 2 shows in detail the sectors in which the enterprises from the sample are operating in. Table 2 Business entities by sectors of activity in the representative sample Sector of activity No. of business entities Agriculture, foresting and fishing 1 Manufacturing 16 Electricity, gas, steam, waste management and remediation activity 1 Construction 1 Wholesale and retail trade 14 Transportation and storage 1 Information and communication 1 Professional, scientific and technical activities 1 Total 36

69 Proceedings of International Conference for Entrepreneurship, Innovation and Regional Development
ICEIRD 2014
86.1% of the enterprises in the sample said that they are working in an industry with high pressure of competition. These sectors are manufacturing and wholesale and retail trade. The research instrument consisted of two questionnaires, one intended for the HR manager (or responsible for HR) who is competent to provide information regarding the HR practices and one for the CEO (or financial/production manager), who was asked to answer the questions related to the innovative performance. 5.2 Measures In this study two basic constructs are explored: HR practices and innovation performance. HR practices are measured with the instrument of 5 items, which are quality management training, teamwork, participation in decision making, upward communication through attitude survey and job satisfaction survey, and performance related pay. The instrument is created on the basis of research studies on relationship between HRM and innovation [5, 7]. The respondent was asked about the degree of adoption of practices in the firm, on a five-point Likert scale (1 = ‘never’ to 5 = always). Cronbach’s Alpha on the scale is 0.68, which is the lowest limit of reliability, but it is acceptable, given that the HR practices are treated as multidimensional construct which does not require a high level of reliability. The second instrument consists of 4 items and is adapted in accordance to Delaney and Huselid [2]. The basic variable, innovative performance, which is defined as a capability of the firm for innovating, is measured trough one item – new product/process/service development. The remaining three items are: quality of the product/process/service, quality of the relationship between management and employees and customer satisfaction. The objective of the instrument designed like this was to explore the relationship between innovative performances and other indicators of operating performance. A CEO, CFO or production manager was asked to make a subjective assessment of the level of innovation, as well as the other operating performance of the firm compared to industry average for the past two years, on the Likert scale, where 1= ‘much below average’ to 5 = ‘much above average’. Cronbach’s Alpha on this scale is 0.72. 6. Analysis The main proposition was the existence of positive relationship between the selected HR practices and the innovative performance. For that purpose, it was carried out a bivariate correlation between the variables (Pearson’s r). The results have shown statistically significant positive correlation coefficient of the variable new product/process/service development with three variables of HR practices: quality management training in the last three years (r = 0.336, p < 0.05); participation in decision making (r = 0.448, p < 0.01) and upward communication through attitude survey and job satisfaction survey (r = 0.392, p < 0.05). In contrast, no significant correlation was found for teamwork and practice of incentives for suggested improvements in product/process/service. Taking in consideration that the research sample was purposive (N=36), caring out a regressive analyses would not be appropriate and the result would have to be accepted with great caution. According to the calculated correlation coefficients, out of the five HR practices, three are statistically significant correlated with the innovative performance and two have no significant correlation. These findings point that the research hypothesis is partially confirmed. Furthermore, it is meaningful to analyze correlation between single HR practices: quality management training (M=3.19); teamwork (M=3.36); upward communication through attitude survey and job satisfaction survey (M=2.83); participation in decision making (M=3.83); and incentives for suggested improvements in product/process/service (M=2.94). The results of the 2-tailrd Pearson correlation have shown that the quality management training practice is in statistically significant direct correlation with: upward communication through attitude survey and job satisfaction survey (r=0.465, p<0.05); participation in decision making (r=0.514, p<0.01); and incentives for suggested improvements in product / process / service

70 Proceedings of International Conference for Entrepreneurship, Innovation and Regional Development
ICEIRD 2014
(r=0.370, p<0.05). Also, upward communication through attitude survey and job satisfaction survey is in positive correlation with participation in decision making (r=0.330, p<0.05) and incentives for suggested improvements in product/process/service (r=0.338, p<0.05). Significant correlation exists between participation in decision making and incentives for suggested improvements in product/process/service (r=0.359, p<0.05). Teamwork has not shown significant correlation with any of the other four HR practices. Because innovative performance is only one of many components of the operating performance, additionally it is taken in consideration the relation between the main research variable – new product/process/service development (M=3.86) and the other three operating performance variables – quality of the product/process/service (M=4.14); customer satisfaction (M=4.17); and quality of the relationship between management and employees (M=4.00). Results have shown an existence of significant positive correlation of new product/process/service development (r=0.483, p<0.01) with customer satisfaction (r=0.394, p<0.05) and with the quality of the relationship between management and employees (r =0 .374, p < 0.05). 7. Discussion of the results The main research objective was to explore the relationship between HR practices and innovative performance, on a purposive sample composed of most successful private SMEs in the manufacturing and services sector for 2010, which counts as the last officially, closed fiscal year at the point when this research started. It must be noted that this year was marked by the influences of the global economic crises, which was manifested through slowed investments and reduced credit activity of the business entities, accompanied by great obscurity and uncertainty. The research findings, although the causality was not the subject of the research, are consistent with the findings of other research conducted in developed countries and provide partial empirical support for the universalistic approach, according to which, implementation of individual HR practices, called “best practices”, have universal, direct, additive positive effects on the innovation capability. This empirical research contributes with presented significant findings and at the same time, opened up additional questions and dilemmas. First, the results of the analysis have clearly shown that there is a direct positive interaction between the two main research variables: HR practices and innovative performance. The adaption of a single such practice can result in increased innovative outcomes. The strongest correlation turned out to be the practice of participation in decision making. Employee participation is important because it helps individual knowledge and new ideas to turn into innovative products and processes. Empowering and involving employees in decision making process contributes to a greater commitment towards achieving organizational goals, encourages creative thinking, supports generating new ideas and create innovation culture. These findings are modest additional confirmation on previous studies that demonstrated a positive relationship of HRM and innovation in the developed economies [6, 8, 14]. The analysis also shows that there is a significant interaction between the practices of quality management training and innovation. Training can be factor that leads to significant improvement of the process and can also lead to product innovation [8,10]. Development of sophisticated function-specific and technical skills as well as knowledge about product/process quality and creativity paves the way for employees to generate improvements, suggestions and ‘novelties’. Furthermore, the empirical analysis also confirms that there is a positive correlation between the practices of upward communication and new product/process/service development. Key success factor for empowerment and responsible participation is intensive lateral and vertical communication. This is particularly important for upward communication. Through practices of attitude survey and job satisfaction survey, managers can have clear and relevant information about the preferences of the employees, potential problems as well as the job

71 Proceedings of International Conference for Entrepreneurship, Innovation and Regional Development
ICEIRD 2014
satisfaction, commitment and working moral. The employees are in the best position to recognize problems or potentials as well as to respond quickly and find a solution. Organizations which are strategically committed towards innovations are significantly relaying on the expertise and initiatives from their employees. On the other hand, the effective implementation of practices of employee participation and empowerment is conditioned by two way communication between management and employees, as well as the availability of important information. According to the researches findings, the practice of teamwork is adapted in research organizations (ranking from “sometimes” to “frequent”), but does not show significant correlation with the innovative performance. This can be interpreted in two ways: a) inefficiency of the teams as a result of various factors; and b) teamwork is not yet being used for innovative purposes. Similarly, performance related pay practice is not connected to innovative performance. Some studies confirm that this correlation is higher in companies that operate in industries with high knowledge-intensity [7] or show that this practice does not contribute as much towards innovations [14]. Second, HR practices are conditioned among themselves. Successful adaptation of one practice depends on the degree of adaptation of another one. The results from the intercorrelation matrix showed significant correlation between individual practices. The practice of quality management training is highly correlated with the employee empowerment and participation in decision making. The effectiveness and the extent of given right for decision making depends on the training efforts and vice versa, participation in decision making requires larger investments in employee knowledge, skills and capabilities. Also, quality management training is correlated with the capability of expressing ones views and job satisfaction. This is a way to demonstrate concern for employees and opens opportunities for professional and career development. Financial incentives are in positively, statistically significant but week correlation with other practices, which probably means that there is a lack of appropriate, well-designed pay and rewards system that could be an important motivational instrument. Additionally, it is worth mentioning the empirical findings for correlation of innovative performance with other variables of operative performance, although this was not one of the research objectives. Organizational innovation capability cannot be studied in isolation, but rather as a part of the overall operational performance. The results are showing that the variables quality of the product/process/service; customer satisfaction; and the quality of the relationship between the management and the employees are positively correlated with the new product/process/service development. Without going in detail analysis of this relationship, it can be said that conceptualization of the link HRM – innovation should also take in consideration the other performance variables that can have an impact on the degree of innovation. The correlation among HRM and the innovative outcomes is not always a direct one, and can be conditioned by contingent factors. The influence of HR practices over the innovative performance can be modeled in terms of mediator (human capital, knowledge management capacity, behavioral variables) or moderator (human capital either weakens or straightens the correlation). HR practices are more effective for enterprises in ‘high’ and ‘medium’ knowledge – intensive industries [10]. Research studies carried so far, are not sufficient, since the underlying casual mechanisms remain unclear as well as the direction of causality over which the link HRM – Innovation is based upon. This is particularly important for developing countries, as is Republic of Macedonia where some aspects of the institutional and industrial environment have significant influence on the relationship between HR practices and innovation performance. All this suggests the need for further more comprehensive research. 8. Conclusion From theoretical aspect, investments of SMEs in creating innovative capacities would be little

72 Proceedings of International Conference for Entrepreneurship, Innovation and Regional Development
ICEIRD 2014
cost effective if there is no established appropriate HR system. In that sense, the research findings from this study contribute in determining the initial indications of HRM - innovation relationship in SMEs in transitional economy and also are the starting point in understanding the role of HR practices in enterprises wish are intended to be innovators. Also, these findings have implications on mangers and practitioners, most notably in showing appropriate direction of human capital development, especially in efforts to establish innovation-oriented HRM system. The main limitation of this study was the inability to draw generalized conclusions due to the small sample size. Future research should be conducted on a representative sample, in terms of the sample size and structure that will be represented diverse sectors and industries. Furthermore, additional research efforts should be aimed at antecedents to HRM practices in various sectors of economic activity because of the impact of some contingent factors (technology, organizational structure, business strategy) that are conditioning or shaping the adaptation of HR practices. References 1 Barney J, Wright M, Ketchen Jr D. The Resource Based View of the Firm: Ten Years after 1991. Journal of Management. 2001; 27(6): 625-641. http://search.ebscohost.com 2009 January. 2 Delany J T, Huselid M A. The impact of human resource management practices on perceptions of organizational performance. Academy of Management Journal. 1996; 39: 949-960. http://search.ebscohost.com 2009 January. 3 Perdomo-Ortiz J, Gonzalez-Benito J, Galende J. An analysis of the relationship between total quality management-based human resource management practices and innovation. The International Journal of Human Resource Management. 2009; 20(5): 1191-1218. http://search.ebscohost.com 2012 December. 4 Deakins D, Fril M. Entrepreneurship and small firm. 4/E. McGraw-Hill International; 2005. 5 Michie J, Sheehan-Quinn M. Labor Market Flexibility, Human Resource Management and Corporate Performance. British Journal of Management. 2001; 12: 287-306. http://search.ebscohost.com 2012 December. 6 Altman P, Rundquist J, Floren H. Sustained innovativeness and human resource management. In: Hörte S Å. (ed.) Research on Technology, Innovation and Marketing Management 2009-2011: Introducing the Research Area of Innovation Science. Halmstad: Högskolan i Halmstad; 2011. p. 21-35. http://www.diva-portal.org/smash/record.jsf?pid=diva2:451700 2014 January. 7 Laursen K. The Importance of Sectoral Differences in the Application of Complementary HRM Practices for Innovation Performance. International Journal of the Economics of Business. 2002; 9(1): 139-156. http://search.ebscohost.com 2013 December. 8 Beugelsdijk S. Strategic Human Resource Practices and Product Innovation. Organization Studies. 2008; 29(6): 821-847. http://search.ebscohost.com 2012 December. 9 Wei L, Liu J, Herndon N C. SHRM and product innovation: testing the moderating effects of organizational culture and structure in Chinese firms. The International Journal of Human Resource Management. 2011; 22(1): 19-33. http://search.ebscohost.com 2014 February. 10 Laursen K, Foss N J. Human Resource Management Practices and Innovation”, SMG Working Paper No. 5/2012. http://papers.ssrn.com/sol3/papers.cfm?abstract_id=2149464 2014 January. 11 Pfeffer J. Producing Sustainable Competitive Advantage through the Effective Management of People. Academy of Management Executive. 2005; 19(4): 95-106. 12 State Statistical Office. Number of active business entities, News release (25.02.2011). http://www.stat.gov.mk/PrikaziSoopstenie_en.aspx?id=79&rbr=340 2014 February. 13 Euro Business Center. 200 LARGEST COMPANIES IN MACEDONIA. http://www.eurobc.com.mk/en/utd_200.html 2012 September. 14 Walsworth S, Verna A. Globalization, Human Resource Practices and Innovation: Resent Evidence from The Canadian Workplace and Employee Survey. Industrial Relations. 2007; 46(2): 222-240. http://search.ebscohost.com 2013 December.

73 Proceedings of International Conference for Entrepreneurship, Innovation and Regional Development
ICEIRD 2014
Importance of Financial Information in Improving SMEs performance
Katarina Zager1, Nikolina Decman2, Ana Novak3
1 Faculty of Economics and Business - University of Zagreb, Trg J. F. Kennedyja 6, Zagreb, Croatia, [email protected]
2 Faculty of Economics and Business - University of Zagreb, Trg J. F. Kennedyja 6, Zagreb, Croatia, [email protected]
3 Faculty of Economics and Business - University of Zagreb, Trg J. F. Kennedyja 6, Zagreb, Croatia, [email protected]
In modern business, when the global competition inc reases together with more complex regulatory requirements, financial informat ion is becoming an increasingly important instrument of corporate governance. In th is sense, we need to emphasize accounting as an advisory function which primary se rves decision making processes since it should be able to assist management in sol ving existing problems in terms of identifying the best alternative that will contribu te to the growth and development of the company. Depending on the size of the company t he approach to decision making as well as the information basis for business decis ions will be different. In smaller enterprises, most often, the primary purpose of acc ounting is to satisfy tax rules. Therefore accounting information is used in a much lesser extent. Small and medium enterprises (SMEs) are mainly managed by their owne rs, who often neglect the importance of accounting information. Possible reas ons for lack of use of accounting information in corporate governance can be found in the fact that the owners are not aware of the benefits of their use, the costs excee d the usefulness and the fact that the owners/managers think primarily in terms of cas h, rather than accrual accounting basics and consider the information difficult to un derstand. Therefore, it is important to point out the possibilities of accounting inform ation systems that can help owners of small and medium-sized enterprises in the succes sful management of their business processes. Above is even more important if we know that research results have confirmed that intensive use of accounting inf ormation contributes to increased performance. Therefore, the main goal of this paper is to explore, using appropriate research methods, the role and importance of financ ial information in business decision making of SMEs, taking into account the fa ct that a large number of small and medium-sized enterprises insufficiently use the ir potential and consequently their performance is diminished.
Keywords Decision-making processes, Financial information, Performance management, Small and medium-sized enterprises
1. Introduction
Accounting, as a part of total information subsystem, is a function that greatly helps in management subsystem in order to make a good business decision. In modern businesses where the global competition is increasing, while the regular requirements are getting more complex financial i.e. accounting information becomes an even more important instrument in

74 Proceedings of International Conference for Entrepreneurship, Innovation and Regional Development
ICEIRD 2014
managing an enterprise. Therefore a common saying is that “accounting is a service function in the process of management”. Traditionally, accounting fulfils three basic functions; primarily by monitoring business results through journalizing business events or through summarizing and presenting financial results in the form of financial statements. Accountants also have an advisory role since they are paying management’s attention on the comparisons between planned and actual business results. At last they need to be helpful in resolving the problem i.e. this means finding the best alternative that will contribute to the growth of an enterprise. The information that management requires are specific and their function is that they aid to solve a particular problem. Top management is interested in global information that is included in annual financial statements. These are primarily information about financial “health” and business efficiency which can be read from the balance sheet and the profit and loss account. Very often, publication of financial statements is considered as a form of communication between two interdependent functions, accounting and management. On the other hand, especially at the lower levels of management owners/managers often require periodic analytical reports on production, expense and income, reports on accounts receivables, accounts payables, inventories and other either on a daily, monthly or annual basis.
Due to specificity of small and medium-sized enterprises (SMEs) and in line with the fact that often in SMEs the management function and ownership overlap, the approach to the decision making and the selection of information basis will differ. Smaller enterprises generally operate by relying more often on intuition and experiential approach to decision making processes. The primary purpose of this paper is to explore whether the owners/managers consider the use of financial information being useful and to what extent an intensive use of this information would contribute in enhancing their performance and consequently in their growth. In this regard, we will present existing experience of accounting information usage by small and medium-sized enterprises as well as the most important empirical results of a research conducted on a sample of SMEs in the Republic of Croatia.
2. Information Base for Decision Making in Small an d Medium-sized Enterprises
Information is an immensely important resource that affects the efficiency of management as well as the performance of the company. The importance and meaning of "the right information at the right time" in making business decisions is the mainstay of good business philosophy of each company. Firstly, it is necessary to point out that business information is considered to be an indispensable tool in the enterprise management and only adequate information enables simplification in business decision making and provide savings of other resources. It is often pointed out that especially in SMEs the benefits of informing managers/owners are not recognized due to lack of resources or because of the limited availability of high quality information. Consequently, SMEs often make business decisions on an intuitive level, and do not base them on any financial or other non-financial information.
To make information helpful for decision making processes they must contain the same relevance feature, timeliness and accuracy. Information is considered appropriate when the requirement for adaptation to the specific needs of their users is met. This implies good cooperation between management and accounting in the sense that they communicate and create the necessary information transmission. In order to consider accounting information as useful information they must be understandable, trustful and neutral in a sense that they don’t favor ones interest. We also assume timeliness and truthfulness of presented information. Although management usually demands information that is future-oriented, it is important to satisfy the requirement that the results achieved are correctly presented, since the future predictions are based on them. Therefore, the application of the principle of

75 Proceedings of International Conference for Entrepreneurship, Innovation and Regional Development
ICEIRD 2014
prudence is very important in designing the quality accounting information. At the same time it is important to identify to whom the information is intended. That means that all relevant information should be available to its real user. One of the characteristics of quality information is its comparability on multiple levels. Comparability assumes that the accounting information is generated with the application of the consistency principle. It implies the consistent use of methods for measurement and evaluation of the financial effect of similar transactions and also includes the presentation of used accounting policies in the notes. Horizontal analysis results, based on the comparative financial statements over longer time period, management can find useful in order to detect company’s financial position and business efficiency trends. Besides that, management can find valuable information in industry trends analysis i.e. comparison of financial statements with its competitors in the same industry. Reasons for comparisons are numerous; the most important are assessment of their financial “health” and profitability performance as well as cash flows trends. Finally it should be noted that only complete and cost-effective information presupposes quality business decisions. The enterprise, as an independent organizational unit, can be viewed through three subsystems; functional, informational and managerial. Informational subsystem is the source of many, for the company extremely important quantitative and qualitative information that are essential for the purposes of business decision-making (figure 1).
Figure 1 Information categorization [1]
Financial information derived from accounting records is extremely useful in the process of business management. Their role will be even more important if one knows that a higher level of financial information usage has an impact on the higher profitability of SMEs. The problem of the accounting information use can be observed from the aspect of business decisions. Different users require different information. Top management should be focused on the information needed to make strategic, long-term decisions (planning new products, capital investments, financing). Tactical and operational management require information that are more frequent, repetitive, short-term and narrow structured for making tactical i.e. operational decisions (such as pricing, the production cost transferring, inventory management, cost management, etc.). However, it is important to emphasize that management levels in small enterprises often are not divided into multiple levels. Hence, they are usually consolidated in one person i.e. owner-manager. Therefore, the financial reporting practices and use of accounting information can vary in relation to large enterprises. Depending on the method for decision-making, theory [2] distinguishes intuitive decision-making, decision-making based on judgment and rational decision-making. The process of business decision making will depend on the size of the company (table 1). Small enterprises base their business decisions to a great extent on intuition while a rational decision-making is

76 Proceedings of International Conference for Entrepreneurship, Innovation and Regional Development
ICEIRD 2014
minimized. Some surveys support such thinking: “SMEs often operate on an informal and intuitive basis (hearing the phones ringing, knowing if he or she is busy, counting the cash coming in, etc.) but they come together to provide a complex continuous monitoring of the firm’s performance through all stages from initial customer contact to final payment” [3].This does not mean that their business decisions are wrong, quite the opposite. The rule is that intuitive decision making has positive effects in simple business decision. If we have more alternative solutions of the same decision problem the chances that we will intuitively choose the best decision are minimal. Therefore large enterprises resort to rational decision-making based on an analytical approach to each problem, and it is used for non-repetitive situations. Medium-sized enterprises, but especially small ones usually entrust the bookkeeping to a specialized company (bookkeeping services). Large enterprises have a large amount of accounting work and only the organization of its own accounting is acceptable to them. Possible reasons for that can be easier and up to date access to needful information for decision-making processes. Depending on the subject of decision making, large enterprises primarily use management accounting information while mid-sized enterprises equally use planned and actual values recorded in the financial statements. Since smaller enterprises keep business records primarily for the purpose of satisfying legal requirements this tax reports will be, quite often, the only information used in the process of making business decisions. Of course, every rule has its exceptions, so these cannot be generalized. The way of making business decisions will determine the information being used for this purpose.
Table 1 Differences in business decisions, depending on the size of the enterprise
Features Small Medium -sized Large
Accounting organization
accounting outsourcing, to a lesser extent internally organized function
generally internally organized function within the company
internally organized function, financial accounting separate from the management accounting
Methods of decision making
experiential methods, intuitive decision-making
decisions primarily on the basis of judgment
primarily rational decision making
Information base general journal and ledger, financial statements
general journal and ledger, financial statements, planned values
a wide range of realized and budgeted information generated as a result of the financial and management accounting
Subject of decision making
routine, everyday tasks, in a much lesser extent strategically oriented problems
equal share of routine and strategic tasks
primarily focused on the achievement of strategic objectives with regularly performed routine tasks at the lower levels of management
Regards to the simplicity of the organizational structure and the presence of unilevel hierarchical organization structure managers of small enterprises need a much narrower spectrum of information and often use their own estimates. In medium-sized enterprises the complexity of information increases, and hence their estimates are not sufficient. It is therefore necessary to develop specific procedures for making business decisions in SMEs. Typically, large enterprises have well established business practice in making business decisions that is based on internal rules and codes of conduct that direct employees in terms of respecting business principles but also moral ones in doing business.
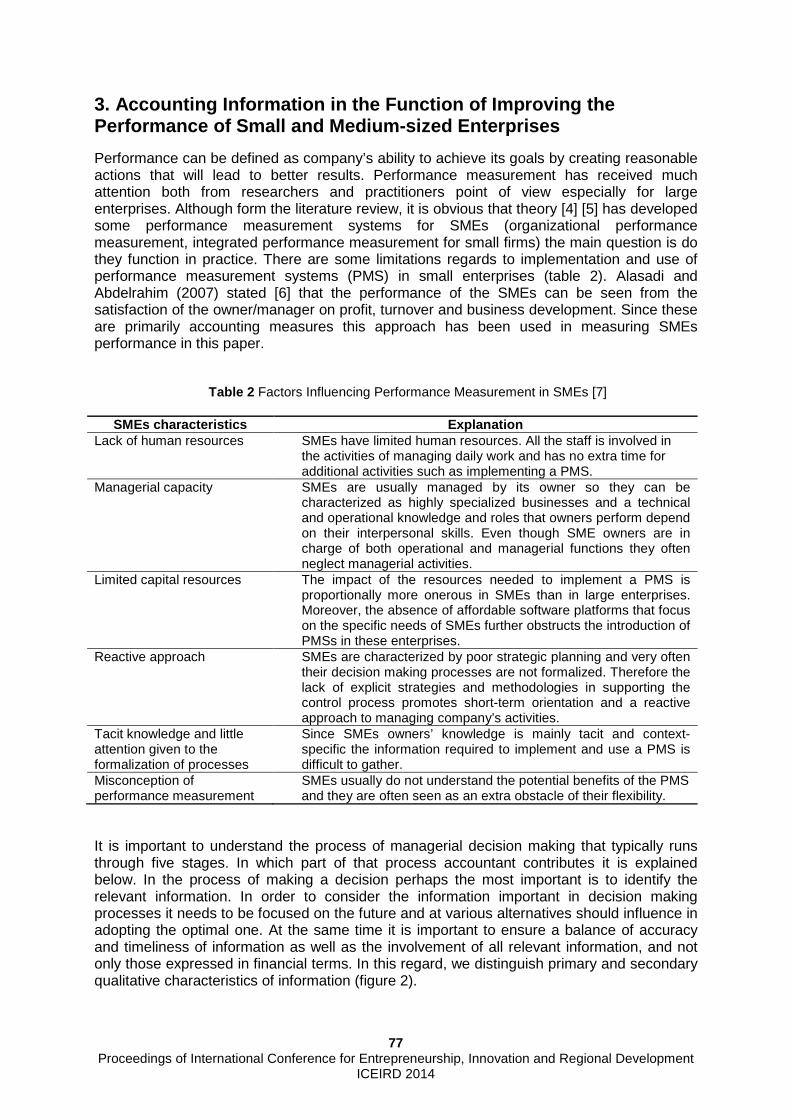
77 Proceedings of International Conference for Entrepreneurship, Innovation and Regional Development
ICEIRD 2014
3. Accounting Information in the Function of Improv ing the Performance of Small and Medium-sized Enterprises
Performance can be defined as company’s ability to achieve its goals by creating reasonable actions that will lead to better results. Performance measurement has received much attention both from researchers and practitioners point of view especially for large enterprises. Although form the literature review, it is obvious that theory [4] [5] has developed some performance measurement systems for SMEs (organizational performance measurement, integrated performance measurement for small firms) the main question is do they function in practice. There are some limitations regards to implementation and use of performance measurement systems (PMS) in small enterprises (table 2). Alasadi and Abdelrahim (2007) stated [6] that the performance of the SMEs can be seen from the satisfaction of the owner/manager on profit, turnover and business development. Since these are primarily accounting measures this approach has been used in measuring SMEs performance in this paper.
Table 2 Factors Influencing Performance Measurement in SMEs [7]
SMEs characteristics Explanation Lack of human resources SMEs have limited human resources. All the staff is involved in
the activities of managing daily work and has no extra time for additional activities such as implementing a PMS.
Managerial capacity SMEs are usually managed by its owner so they can be characterized as highly specialized businesses and a technical and operational knowledge and roles that owners perform depend on their interpersonal skills. Even though SME owners are in charge of both operational and managerial functions they often neglect managerial activities.
Limited capital resources The impact of the resources needed to implement a PMS is proportionally more onerous in SMEs than in large enterprises. Moreover, the absence of affordable software platforms that focus on the specific needs of SMEs further obstructs the introduction of PMSs in these enterprises.
Reactive approach SMEs are characterized by poor strategic planning and very often their decision making processes are not formalized. Therefore the lack of explicit strategies and methodologies in supporting the control process promotes short-term orientation and a reactive approach to managing company’s activities.
Tacit knowledge and little attention given to the formalization of processes
Since SMEs owners’ knowledge is mainly tacit and context-specific the information required to implement and use a PMS is difficult to gather.
Misconception of performance measurement
SMEs usually do not understand the potential benefits of the PMS and they are often seen as an extra obstacle of their flexibility.
It is important to understand the process of managerial decision making that typically runs through five stages. In which part of that process accountant contributes it is explained below. In the process of making a decision perhaps the most important is to identify the relevant information. In order to consider the information important in decision making processes it needs to be focused on the future and at various alternatives should influence in adopting the optimal one. At the same time it is important to ensure a balance of accuracy and timeliness of information as well as the involvement of all relevant information, and not only those expressed in financial terms. In this regard, we distinguish primary and secondary qualitative characteristics of information (figure 2).

78 Proceedings of International Conference for Entrepreneurship, Innovation and Regional Development
ICEIRD 2014
Figure 2 Hierarchy of the quality of accounting information [8]
There are many reasons [9] why it is necessary to present only the relevant information to the management. First of all data collection is an expensive process. Relevant information should be collected and analyzed and it takes time and effort. Accountants, focusing on relevant information, simplify the data-gathering process and shorten the analysis of the different effects on the decisions made. In this way we save the valuable time and resources so managers can focus only on the valuable information. On the other hand, it is possible to effectively use only a limited amount of information because with information overload the effectiveness of business decision-making is reduced. There is a wide range of accounting information that can be used in making quality business decisions. Related to the above accounting information may be the result of two separate, yet interconnected accounting systems, internally oriented reporting (management accounting) and externally oriented financial reporting (financial accounting). The most noticeable difference between these two systems is reflected in the orientation of key users and in terms of their final product. That means their reports that they present to their target users. In this sense, the most important output of externally oriented accounting are basic financial statements while various internal reports prepared for management at different organizational levels are the main output of management accounting. It has already been mentioned that the needs and requirements of financial reporting users (decision makers) define and form the structure of the accounting information system. We can assume that information requirements of the internal users of small and medium-sized enterprises will be significantly lesser than in the case of large ones. It is often said that the accounting of small and medium-sized enterprises is primarily focused to the fulfilment of tax/legal requirements. Furthermore, information from the internally oriented accounting is not used for management purposes or is used to a much lesser extent. Above mentioned can be easily confirmed by results of the majority of previous studies. They indicate the fact
Decision making carriers and their characteristics
COST< BENEFITS SIGNIFICANCE strong limitation Basis for recognition
Intelligibility
USUFULLNESS IN DECISION MAKING PROCESSES
Accounting infomation users
Limitations
Specific characteristics
Important criteria
Primary quality
Parts of primary quality
Secondary quality
RELEVANT RELIABLE
verifiability impartiality truthfulnesss
predictions value
feedback value
comparabilitys
Intelligibility Intelligibility

79 Proceedings of International Conference for Entrepreneurship, Innovation and Regional Development
ICEIRD 2014
that SMEs generally consider accounting information to be key factor in decision-making [10] but their primarily purpose is actually meeting legal obligations, accounting and tax requirements and publication obligation of reports for statistical purposes, satisfying the bank requirements, etc. [11] and [12]. On the other hand, there are several studies that show the opposite results and consequently much more extensive use of accounting information for the purposes of increasing business performance, long-term planning, hiring new employees and improving customer satisfaction as well as the utilization of strategic planning and corporate budgets [13] and [14].
In order to know the usefulness, purpose and intensity of accounting information usage in the improvement of business excellence of Croatian SMEs empirical research was conducted through a questionnaire [15]. The program Survey Monkey is used for the purpose of creating a questionnaire. The questionnaire was distributed via e-mail. The target population is comprised of small and medium-sized enterprises whose primary activity is the manufacture and trade i.e. that are classified in area C - Manufacturing, G - retail and wholesale according to the National Classification of Activities in Croatia. Variables examined were mostly qualitative (later they were coded into a numerical value in processing the results) and quantitative in smaller proportion. They were generally measured in nominal and interval measuring scale. The format of a five-level Likert item was used in a questionnaire (strongly disagree, disagree, don’t agree nor disagree, agree, strongly agree). Questions asked were mostly closed type questions except when respondents were given the choice to submit their response to the list of answers (option "others"). A total of 422 responses were received, of which 271 questionnaires were suitable for further analysis. Respondents, in their vast majority, are managers and accountants. Enterprises whose employees participated in this empirical research in 86% of cases are classified as small and 14% as medium-sized enterprises.
The most important empirical results, in the context of the financial information importance, show that Croatian small and medium-sized enterprises consider accounting information as a significant factor that affects the growth and development of their businesses in terms of advanced financial position and increased business performance (average grade 4.48, while the most common given grade; mode is 5). In doing so, they find analytical reports prepared for management purposes (average grade 4.45), information about cash flows (average grade 4.4) and tax records (average grade 3.94) the most useful in decision making processes. The least significant they consider the published information on industry average ratios (average grade 3.44) – figure 3.
Figure 3 Usefulness of accounting information in SMEs management
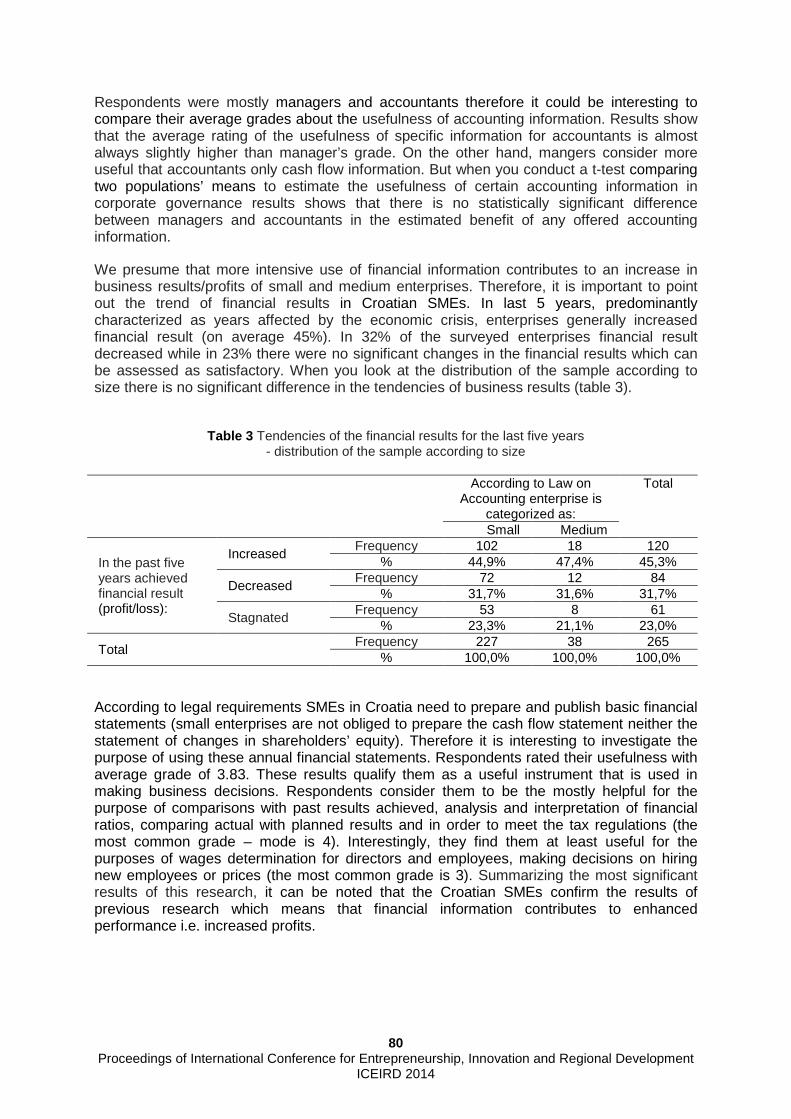
80 Proceedings of International Conference for Entrepreneurship, Innovation and Regional Development
ICEIRD 2014
Respondents were mostly managers and accountants therefore it could be interesting to compare their average grades about the usefulness of accounting information. Results show that the average rating of the usefulness of specific information for accountants is almost always slightly higher than manager’s grade. On the other hand, mangers consider more useful that accountants only cash flow information. But when you conduct a t-test comparing two populations’ means to estimate the usefulness of certain accounting information in corporate governance results shows that there is no statistically significant difference between managers and accountants in the estimated benefit of any offered accounting information.
We presume that more intensive use of financial information contributes to an increase in business results/profits of small and medium enterprises. Therefore, it is important to point out the trend of financial results in Croatian SMEs. In last 5 years, predominantly characterized as years affected by the economic crisis, enterprises generally increased financial result (on average 45%). In 32% of the surveyed enterprises financial result decreased while in 23% there were no significant changes in the financial results which can be assessed as satisfactory. When you look at the distribution of the sample according to size there is no significant difference in the tendencies of business results (table 3).
Table 3 Tendencies of the financial results for the last five years
- distribution of the sample according to size
According to Law on Accounting enterprise is
categorized as:
Total
Small Medium
In the past five years achieved financial result (profit/loss):
Increased Frequency 102 18 120
% 44,9% 47,4% 45,3%
Decreased Frequency 72 12 84
% 31,7% 31,6% 31,7%
Stagnated Frequency 53 8 61
% 23,3% 21,1% 23,0%
Total Frequency 227 38 265
% 100,0% 100,0% 100,0%
According to legal requirements SMEs in Croatia need to prepare and publish basic financial statements (small enterprises are not obliged to prepare the cash flow statement neither the statement of changes in shareholders’ equity). Therefore it is interesting to investigate the purpose of using these annual financial statements. Respondents rated their usefulness with average grade of 3.83. These results qualify them as a useful instrument that is used in making business decisions. Respondents consider them to be the mostly helpful for the purpose of comparisons with past results achieved, analysis and interpretation of financial ratios, comparing actual with planned results and in order to meet the tax regulations (the most common grade – mode is 4). Interestingly, they find them at least useful for the purposes of wages determination for directors and employees, making decisions on hiring new employees or prices (the most common grade is 3). Summarizing the most significant results of this research, it can be noted that the Croatian SMEs confirm the results of previous research which means that financial information contributes to enhanced performance i.e. increased profits.

81 Proceedings of International Conference for Entrepreneurship, Innovation and Regional Development
ICEIRD 2014
4. Conclusion
Small and medium-sized enterprises, because of their specificity, are different from large ones. Therefore systems for evaluating the performance differ somewhat. Results of previous research suggest that the use of accounting information in corporate governance leads to better financial performance of an enterprise. The key question is whether similar relationships apply in small and medium-sized enterprises? SMEs often consider a legal obligation of the financial statements preparation as an administrative burden that usually, according to their opinion, exceeds their usefulness in management. At the same time they deem that they are important in business decision-making processes but still point out that the existing form of financial statements does not comply with their information needs. Therefore we can highlight that SMEs owners/managers need more structured information that will meet their specific information requirements. Results from a conducted empirical research in Croatia tend to support the usefulness of accounting information in enhancing business efficiency but there are some obstacles that minimize their wider usage. Respondents as the most important reason for infrequent use of accounting information in the SMEs management underline the fact that the owners/managers are not aware of the benefits derived from their usage. Also they are not familiar with the tools and techniques of financial statement analysis and primarily think in terms of cash basis rather than in terms of accrual basis. Finally accounting only generates information but it does not make concrete business decisions. This task is in the hands of management. Therefore, it is very important to achieve full interaction between accountants and owners/managers. Consequently they should be able to communicate accounting information systems capabilities as well as the management requirements for the adoption of, for the enterprise, the most suitable business decisions.
References 1 Tušek, B., Žager, L. Revizija. Drugo izmijenjeno i dopunjeno izdanje. Zagreb: Hrvatska zajednica
računovođa i financijskih djelatnika, 2007; 30. 2 Sikavica, P., Novak, M. Poslovna organizacija. Zagreb: Informator, 1999; 177-183. 3 Jarvis, R., Curran J., Kitching, J., Lightfoot, G. The use of quantative and qualitative criteria in the
measurement of performance in small firms. Journal of Small Business and enterprise Development, 7(2); 123-134.
4 Garengo, P., Biazzo, S., Bititci, U. S. Performance measurement systems in SMEs: A review for a research agenda. International Journal of Management Reviews. 2005, 7(1); 25-47.
5 Hudson, M., Smart, A., Bourne M. Theory and Practice in SME performance measurement systems. International Journal of Operations & Production Management. 2001, 21(8); 1096-1115.
6 Anggadwita, G., Mustafid, Q. Y. Identification of Factors Influencing the Performance of Small Medium Enterprises (SMEs). The 5th Indonesia International Conference on Innovation, Enterpreneurship and Small Business (IICIES 2013). Procedia – Social and Behavioral Sciences 115 (2014); 415-423.
7 Garengo, P., Biazzo, S., Bititci, U. S. Performance measurement systems in SMEs: A review for a research agenda. International Journal of Management Reviews. 2005, 7(1); 25-47.
8 Žager, K., Žager, L. Analiza financijskih izvještaja. Zagreb: Masmedia, 1999; 88, cited by FASB SFAC No. 2, prema Kieso, D. E., Waygandt, J. J. Intermediate Accounting, New York, John Wiley & Sons, 1986; 30.
9 Hilton, R. W. Managerial Accounting: Creating Value in a Dynamic Business Environment. Irwin: McGraw-Hill Companies, 2009; 592.
10 Nicoleta-Cornelia, Bran Stan, et al. Accounting and extra-accounting information – valences in meeting the financial analysis. Procedia – Social and Behavioural Sciences 2012; 62, 531-535.
11 Son, D. D, Marriott, N. i Marriott, P. Users’ Perceptions and Uses of Financial Reports of Small and Medium Companies (SMCs) in Transitional Economies (Qualitative evidence from Vietnam). Qualitative Research in Accounting & Management. 2006; 3(3), 218-235.
12 IFAC, Micro-Entity Financial Reporting: Perspectives of Preparers and Users. Small and Medium Practices Committee, IFAC, 2006; 19; cited by Barker, P., Noonan, C. Small company compliance

82 Proceedings of International Conference for Entrepreneurship, Innovation and Regional Development
ICEIRD 2014
with accounting standards: The Irish situation. The Institute of Chartered Accountants in Ireland, 1995.
13 Noor Fadzlina Mohd Fadil i Noor Fikri Mohd Fadhil, Managing company's financial among small and medium non-manufacturing companies. Far East Journal of Psychology and Business, 2010; 2(1), 17-36.
14 Nakamura, W. T., Oliviera, A. G., Müller, A. N. (2001) Small Firms Management: Use of Accounting Information for Managerial Purposes, 2001. Available on: http://www.pericia.pro.br/Artigos/Small%20Firms%20Management%20-%20English.PDF (24/03/2014)
15 Decman N., Računovodstvene informacije u funkciji upravljanja malim i srednjim poduzećima. Zagreb: Ekonomski fakultet, 2013.
83 Proceedings of International Conference for Entrepreneurship, Innovation and Regional Development
ICEIRD 2014
SMEs in the cloud: The impact of cloud adoption on economic growth and development
Evangelia Filiopoulou1, Persefoni Mitropoulou2, Christos Michalakelis3 1Harokopio University of Athens, 9 Omirou str., 177 78, Athens, Greece, [email protected]
2Harokopio University of Athens, 9 Omirou str., 177 78, Athens, Greece, [email protected]
3Harokopio University of Athens, 9 Omirou str., 177 78, Athens, Greece, [email protected]
The current economic crisis in Europe generated the need for new models of development, with Small-Medium Enterprises (SMEs) b eing a key solution and a growth driver. This could be achieved by the prom otion of technological innovation, as for example by the means of the clou d computing business model. Cloud computing is a rapidly evolving computational model and has the potential to become the upcoming technology event t hat will transform the economy’s production techniques. This work highlights the importance of the cloud co mputing adoption by the SMEs and its impact on the competitiveness of a sta te’s economy. It also explores the economic benefits of the new business model like cost reduction, creation of job positions and entrepreneurship prom otion, while it addresses the associated risks and concerns of adopting or mi grating to the cloud. Evidence from the European area is provided and the case of Greece is considered as an example.
Keywords Cloud computing, Economic crisis, Economic growth, Market competitiveness, SMEs
1. Introduction
It is evidence that the recent economic crisis has an impact on the European area, expressed not only in terms of banking and national debt but also in terms of a growth and competiveness crisis. All member states of the Eurozone are facing the recession in the real economy and they are seeking for solutions in order to build more competitive and more efficient European economies. A very promising solution key is to invest on the Small and Medium Enterprises (SMEs), improve their business environment and reveal their full potentials in global market and economy [1]. SMEs are the backbone of economy breeding industrial development [2] and their strategic importance derives from their contribution to economic growth and job creation, based mainly on their flexibility regarding the adoption of new working patterns and new business practices. Despite the fact that no clear, or unique, definition of the term SMEs exists, the benefits of growth in this business sector are

84 Proceedings of International Conference for Entrepreneurship, Innovation and Regional Development
ICEIRD 2014
significant, in each country. Indeed, the term SME is defined either in terms of the number of employees in the company (usually up to 250), or in terms of ownership and management. Their contribution to development and economy growth indicates that appropriate actions should be initiated and supported to help them adopt new technologies and improve their efficiency. Moreover, the use of Information and Communication Technology (ICT) is widely seen as critical for the competitiveness of SMEs in the emerging global market, since businesses must be able to process data and use information effectively. This, in turn, enables them to substantially gain competitive advantage, thus adding significant value, in terms of productivity increase and performance improvements. The growth of the Internet has provided even more opportunities, especially for the small to medium-sized businesses, enabling them to sell their products and services to a potential global market, making global trading available for almost all enterprises. Therefore, the establishment of an appropriate environment in which SMEs will be able to grow is critical for the development and expansion of businesses. ICTs play an increasingly important role in their growth. However and as a consequence of the recession, a vast number of SMEs may be too small to be able to employ a dedicated Information Technology (IT) expert [3, 4] or may lack resources and expertise in terms of management of new technologies [5]. This kind of problems can be adequately faced by an innovative ICT business model, the cloud computing, a state-of-the-art technological approach. Cloud computing is expected to assist the European market to be more efficient and productive by generating new jobs and enhancing economic growth. Europe’s economic recovery will very probably be boosted by business investments in cloud computing [6]. An increasing number of SMES are thinking of migrating to the cloud, or have already done so. Cloud is an attractive option for many SMEs, particularly in the current global economic crisis, due to its characteristics, mainly the flexible cost and the scalability [7]. The rest of the paper is structured as follows: In Section 2 the cloud computing business model is introduced. Section 3 is devoted to the exploitation of the economic benefits that derive by the adoption of the cloud, providing evidence from Europe and suggesting solutions to developing economies facing the recession. In Section 4 the risks and threats by the adoption of the cloud are presented and, finally, Section 5 concludes.
2. The Cloud Computing Business Model
Cloud computing is a type of computing that relies on sharing computing resources rather than having local servers or personal to handle. The term “cloud” denotes "the Internet", therefore cloud computing refers to a type of Internet-based computing model, where different services - such as servers, storage and applications - are delivered to an organization's computers and devices through the Internet. In simple terms, cloud computing can be defined as the set of hardware, networks, storage, services and interfaces combined to deliver aspects of computing as a service based on user demand [8]. It can also be perceived as the procedure of storing and accessing data and applications over the Internet, instead of the user’s computer hard drive [9]. A more precise and formal definition can be found in National Institute of Standards and Technology (NIST) [10].
85 Proceedings of International Conference for Entrepreneurship, Innovation and Regional Development
ICEIRD 2014
From a technical perspective, the structure of the cloud is composed of five essential characteristics, three service models, and four deployment models [11], introduced below.
2.1 Essential characteristics
• On-demand self-service. A consumer can unilaterally ask for the provision of computing capabilities as needed, such as server time and network storage, automatically, without requiring human interaction, or intervention of the service provider.
• Broad network access. Capabilities are available over the network and accessed through standard mechanisms that promote use by heterogeneous thin or thick client platforms (e.g., mobile phones, tablets, laptops, and workstations).
• Resource pooling. The provider’s computing resources (storage, processing, memory, and network bandwidth) are pooled to serve multiple consumers using a multi-tenant model, with different physical and virtual resources, dynamically assigned and reassigned according to the consumer’s demand.
• Rapid elasticity. Capabilities can be elastically and automatically provisioned and released, to scale rapidly outward and inward commensurate with demand.
• Measured service. Cloud systems automatically control and optimize resource use by leveraging a metering capability at some level of abstraction appropriate to the type of service (e.g., storage, processing, bandwidth, and active user accounts). Resource usage can be monitored, controlled, and reported, providing transparency for both the provider and consumer of the utilized service [11].
2.2 Service Models
• Software as a Service (SaaS). The capability to use the provider’s applications running on a cloud infrastructure. The applications are accessible from various client devices through either a thin client interface, such as a web browser, or a program interface. The consumer does not manage or control the underlying cloud infrastructure including network, servers, operating systems, storage, or even individual application capabilities.
• Platform as a Service (PaaS).The capability to deploy onto the cloud infrastructure languages, libraries, services, and tools supported by the provider. The consumer does not manage or control the underlying cloud infrastructure but has control over the deployed applications and possibly configuration settings for the application-hosting environment.
• Infrastructure as a Service (IaaS). The capability to process, storage, networks, and other fundamental computing resources where the consumer is able to deploy and run arbitrary software, which can include operating systems and applications. The consumer does not manage or control the underlying cloud infrastructure but has control over operating systems, storage, and deployed applications; and possibly limited control of select networking components [11].
2.3 Deployment Models
• Private cloud. The cloud infrastructure is provisioned for exclusive use by a single organization comprising multiple consumers (e.g., business units). It may be owned, managed, and operated by the organization, a third party, or some combination of them, and it may exist on or off premises.
• Community cloud. The cloud infrastructure is provisioned for exclusive use by a specific community of consumers from organizations that have shared concerns (e.g., mission, security requirements, policy, and compliance considerations). It may be owned,

86 Proceedings of International Conference for Entrepreneurship, Innovation and Regional Development
ICEIRD 2014
managed, and operated by one or more of the organizations in the community, a third party, or some combination of them, and it may exist on or off premises.
• Public cloud. .The cloud infrastructure is provisioned for open use by the general public. It may be owned, managed, and operated by a business, academic, or government organization, or some combination of them. It exists on the premises of the cloud provider.
• Hybrid cloud. The cloud infrastructure is a composition of two or more distinct cloud infrastructures (private, community, or public) that remain unique entities, but are bound together by standardized or proprietary technology that enables data and application portability (e.g., cloud bursting for load balancing between clouds) [11].
The above are graphically illustrated in Figure 1:
Figure 1 Cloud Computing Models
3. Economic Benefits of cloud computing to Business and SMEs
3.1 Benefits
The cloud computing business model can be used not only as a powerful technological tool but also as a business advantage, like the Internet once was, when it was first adopted by SMEs. In addition to all operational benefits this computational model offers, it can also provide a higher concentrated competitive advantage than ever before [12]. From a less technology-oriented perspective, SMEs need to respond to the changing market conditions and demanding customer wills, based on different cost models than the traditional [13]. The most efficient and low-risk way to enter new market segments and promote business development is to use the upcoming technology of cloud computing, combined with its supported services, thus obtaining important benefits and advantages. Cost-saving benefits are among the most important economic advantages to ICT consumers, as well as to businesses. Outsourcing services and resources can make data more accessible to end users, in terms of mobility and usage. Furthermore, moving all the necessary data and IT applications into the cloud reduces server and storage costs, software maintenance expenditures, as well as network and hardware expenses within an enterprise. This, consequently, offers low start-up costs, a “pay-as-you-go” cost structure and an environment for rapid innovation. Cloud computing adoption can eliminate internal operations and support costs, as well as cooling, power and other energy needs of a firm, resulting in a total IT cost budget reduction. The cloud is gaining popularity among businesses, since it promises new
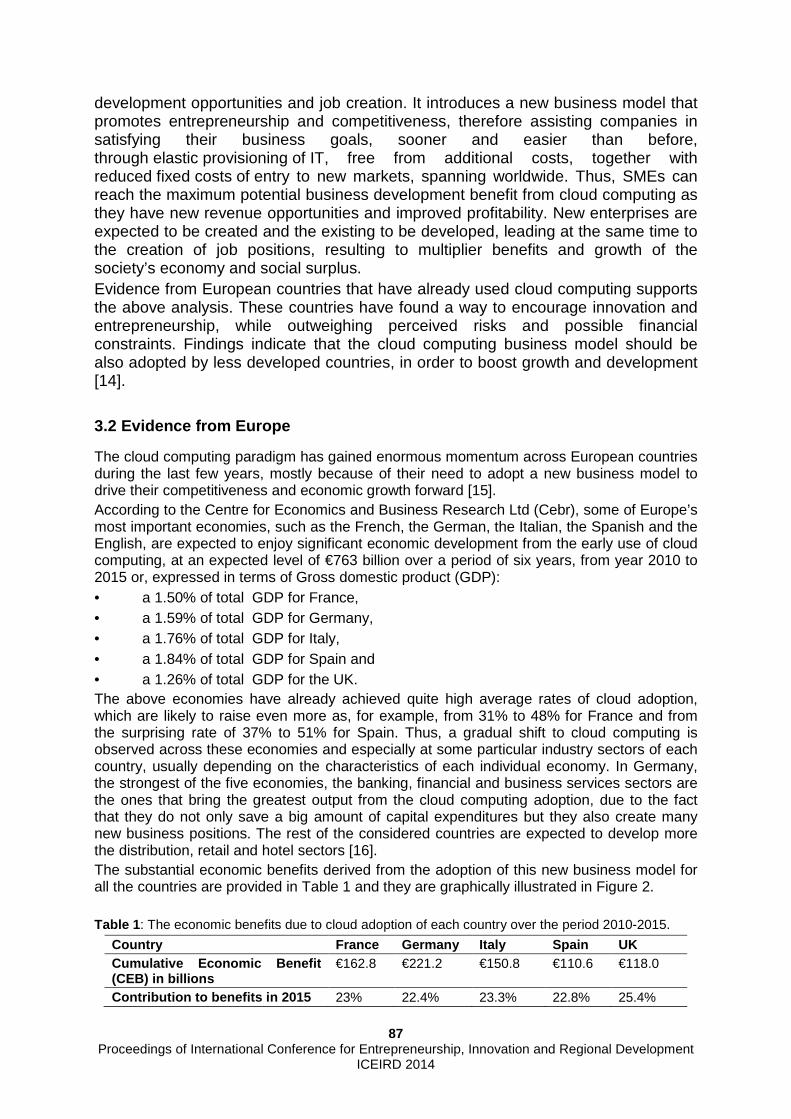
87 Proceedings of International Conference for Entrepreneurship, Innovation and Regional Development
ICEIRD 2014
development opportunities and job creation. It introduces a new business model that promotes entrepreneurship and competitiveness, therefore assisting companies in satisfying their business goals, sooner and easier than before, through elastic provisioning of IT, free from additional costs, together with reduced fixed costs of entry to new markets, spanning worldwide. Thus, SMEs can reach the maximum potential business development benefit from cloud computing as they have new revenue opportunities and improved profitability. New enterprises are expected to be created and the existing to be developed, leading at the same time to the creation of job positions, resulting to multiplier benefits and growth of the society’s economy and social surplus. Evidence from European countries that have already used cloud computing supports the above analysis. These countries have found a way to encourage innovation and entrepreneurship, while outweighing perceived risks and possible financial constraints. Findings indicate that the cloud computing business model should be also adopted by less developed countries, in order to boost growth and development [14].
3.2 Evidence from Europe
The cloud computing paradigm has gained enormous momentum across European countries during the last few years, mostly because of their need to adopt a new business model to drive their competitiveness and economic growth forward [15]. According to the Centre for Economics and Business Research Ltd (Cebr), some of Europe’s most important economies, such as the French, the German, the Italian, the Spanish and the English, are expected to enjoy significant economic development from the early use of cloud computing, at an expected level of €763 billion over a period of six years, from year 2010 to 2015 or, expressed in terms of Gross domestic product (GDP): • a 1.50% of total GDP for France, • a 1.59% of total GDP for Germany, • a 1.76% of total GDP for Italy, • a 1.84% of total GDP for Spain and • a 1.26% of total GDP for the UK. The above economies have already achieved quite high average rates of cloud adoption, which are likely to raise even more as, for example, from 31% to 48% for France and from the surprising rate of 37% to 51% for Spain. Thus, a gradual shift to cloud computing is observed across these economies and especially at some particular industry sectors of each country, usually depending on the characteristics of each individual economy. In Germany, the strongest of the five economies, the banking, financial and business services sectors are the ones that bring the greatest output from the cloud computing adoption, due to the fact that they do not only save a big amount of capital expenditures but they also create many new business positions. The rest of the considered countries are expected to develop more the distribution, retail and hotel sectors [16]. The substantial economic benefits derived from the adoption of this new business model for all the countries are provided in Table 1 and they are graphically illustrated in Figure 2. Table 1 : The economic benefits due to cloud adoption of each country over the period 2010-2015.
Country France Germany Italy Spain UK Cumulative Economic Benefit (CEB) in billions
€162.8 €221.2 €150.8 €110.6 €118.0
Contribution to benefits in 2015 23% 22.4% 23.3% 22.8% 25.4%

88 Proceedings of International Conference for Entrepreneurship, Innovation and Regional Development
ICEIRD 2014
Contribution to GDP 1.50% 1.59% 1.76% 1.84% 1.26% Net Cost Savings/ CEB (in billions)
16.2% (€26.3)
17.1% (€37.7)
18.9% (€28.5)
19.9% (€22.0)
22.2% (€26.2)
Business Development Benefits (in billions)
15.1% (€24.6)
14.8% (€32.6)
15.9% (€24.0)
15.3% (€16.9)
25.0% (€29.6)
Business Creation Benefits (in billions)
31.6% (€51.4)
31.4% (€69.5)
28.7% (€43.3)
28.0% (€30.9)
17.0% (€20.0)
a) b)
c)
Figure 2: Percentage contribution of a) Net Cost Savings, b) Business Development Benefits, c) Business Creation Benefits of cloud adoption to total economic benefits of each country over the period 2010-2015.
The lowest cumulative cost savings deriving by the cloud are expected to be met in France, constituting the 16.2% of its aggregate cloud share, whereas the UK is the country with the highest percentage contribution that amounts 22.2% of its cumulative cloud dividend. The UK shows a strong performance on business development, as a result of the high productivity of English SMEs. On the contrary, the rest of the countries do not differ significantly from each other, as the enterprises located there have shown a low productive performance. The cumulative business creation benefits in France and Germany are likely to exceed the level of 31% of their total cloud gain, whereas Italy and Spain have also a significant percentage contribution, estimated at about 28%. These results are fully justified by the large number of SMEs which are expected to be created or expanded. However, the UK is supposed to be a poor performer on business creation, due to the lack of new SMEs and job positions [16]. Despite the European economic crisis, the above predictions show that the diffusion of cloud computing can be critical for boosting the economic growth of a country and create a competitive environment for the SMEs to develop themselves and achieve economic success, contributing to the economic development by enhancing their productive performance [15].

89 Proceedings of International Conference for Entrepreneurship, Innovation and Regional Development
ICEIRD 2014
As a result, many new job positions and SMEs are expected to be created in many different industrial sectors in all the aforementioned countries, as shown in Table 2.
Table 2: Creation of new jobs and new business start-ups by 2015 (thousands)
Country New jobs New SMEs United Kingdom 289 35 Germany 789 39 France 469 48 Italy 456 81 Spain 393 55
3.3 Developing Countries - The Case of Greece
Based on the expected benefits of cloud computing across Europe, the adoption of the cloud is very likely to contribute substantially to the developing countries. The case of Greece is a characteristic example. The country’s economy is expected to be more efficient and productive, through the generation of jobs and the enhancement of economic development [15]. Cloud computing can affect the Greek economic environment in terms of both the governmental organizations and the SMEs of the private sector. They both constitute the key driver of investment and development [17] and this new business model can be an important macroeconomic factor to support the Greek economic growth, since there is already a significant number of established SMEs [14], ready to adopt the new technology. The majority of Greek companies make use of ICT, 43% of them provide IT services, whereas the rest of them have different activities, such as retail trade, telecommunications, manufacturing and software development. Depending on the cloud computing model (private, hybrid, public), a significant increase of potential IT cost savings is expected, because of the reduction of the overall IT capital expenditures by 17% up to 40%. Although the introduction of the cloud computing is really encouraged by their needs to reduce costs and add value to their services, adoption has not yet gained substantial popularity among the Greek firms, due to technical and non-technical difficulties [18]. According to IOBE’s macroeconomic study, savings in Greece as a result of cloud computing adoption can reach € 4.8 billion over the decade, between years 2010 to 2020. The expected annual net cost savings are estimated to be more than € 850 millions (Figure 3).

90 Proceedings of International Conference for Entrepreneurship, Innovation and Regional Development
ICEIRD 2014
Figure 3 : Contributions of the individual categories of savings to net cost savings from the adoption of cloud computing in Greece, over the period from 2010 to 2020. (Source: IOBE)
IT capital expenditure (IT CapEx) savings are expected to contribute at a level of more than 70% of the gross cost savings over this decade. About 20% of them will derive from the reduced IT operational expenses (IT OpEx) related to labor cost and productivity, whereas the rest (7.4%) will be the result of energy cost savings. Moreover, cloud computing adoption from the Greek SMEs offers all the other significant economic benefits mentioned above, such as new business development and creation. More specifically, it is predicted that the value of these benefits may be almost € 8.3 billion, adding an extra € 5.1 billion Gross Value Added (GVA) for Greece from 2010 to 2020, while the annual estimated economic impact on output is € 1.5 billion [14].
Figure 4: Contributions of the business development (Seasonal peaks, Scalability) and creation benefits of cloud computing adoption in the Greek economy over the period from 2010 to 2020. (Source: IOBE’ study)
As observed in Figure 4, about 42% of the economic Greek profit comes from increased scalability or the expansion of business and the entry to new markets. Additionally to the direct benefits, indirect and induced economic activity are expected as well, having multiplier impacts on the Greek economy [18]. The most important of these effects are the elevated intermediate demand and the household income, amounting at almost € 8 billion, with an additional € 5.5 billion GVA, which, combined with the business development and creation benefits, can give a total of € 16 billion of output gain. The total impact on the Greek GVA

91 Proceedings of International Conference for Entrepreneurship, Innovation and Regional Development
ICEIRD 2014
exclusively due to cloud computing adoption over the considered period of 10 years can reach a level € 15.4 billion (Figure 5). The Trade Sector is expected to contribute the most, as nearly 11.000 new positions are likely to be created out of the total of almost 38.000 new jobs, then the other business services sector comes, followed by the Manufacturing sector.
Figure 5: Contributions of the individual categories of economic benefits of cloud computing adoption to the total Greek GVA over the period from 2011 to 2020. (Source: IOBE’ study)
Concluding, it is really important that the Greek SMEs incorporate cloud-based solutions, so that they can equally compete with their key trade partners [15]. The faster they adopt the new business model of cloud the higher their expected cost savings and the better the relative price of their services will become.
4. Risks and Threats
Although cloud computing one of the most advancing solutions for SMEs to enhance their IT resources it is important to recognize the risks and threats that exist, in order to prevent several issues that may rise as a result of the implementation of the cloud. SMEs that proceed with adopting cloud computing services allow providers to access their data and applications. Because of the cloud construction and functionality as a shared resource, security is definitely of particular concern. SMEs feel threatened when providers access their confidential data and their intellectual property. They have to grapple with the decision of what data to move to cloud and when, knowing that vendors can utilize their machines [19]. Despite the numerous benefits of the cloud, employees are concerned about the changes that the adoption of cloud computing can bring. They are cautious about this new business technology model and worry about the possibility of losing their job or being unsuitable for managing the cloud [2]. Investing in cloud computing seems to be safe and profitable during the difficult days of recession, nevertheless all investments have risk, even the safe ones. There is always the possibility that an investment in cloud computing will fall through and the adoption of the cloud will not meet the initially set financial goals for growth and competitiveness. Some industry observers say that the rapid growth of cloud computing is threatened by the lack of standards. This restricts implementation by limiting interoperability among different cloud platforms “Interoperability between offerings and the portability of services from one provider to another is very important to the customer to

92 Proceedings of International Conference for Entrepreneurship, Innovation and Regional Development
ICEIRD 2014
maximize the expected [return on investment] from cloud computing,” explained IBM vice president for software standards Angel Luis Diaz [20]. Due to the increasing number of SMEs that empower their tasks to cloud providers, the complex nature of consumer demands and cloud computing immaturity, Service Level Agreement (SLA) between consumers and providers is vital [21]. SMEs migrate their corporate data to the cloud, so it is significant to be confident that they obtain an overall performance, availability and quality of the cloud provider’s services [19].
5. Conclusions
Cloud computing is an innovative business model to assist economies overcoming recession and economic crisis, by helping Small and Medium Enterprises, the backbone of economy, to grow and be more competitive and efficient. They can change their business model and benefit from the adoption of the cloud computing model, due to its flexible cost and scalability. As a result, they will have a competitive advantage and gain access to new markets and build improved customer relationships. There are plenty of economic benefits arising from the usage of cloud computing, the most important of which are the cost savings, the business development and the business creation. This is supported by evidence from a number of European countries that have already adopted this new business model to drive their development and economic growth forward. The majority of them are expected to have substantial gains to their economies from the early use of cloud computing, while encouraging at the same time innovation and entrepreneurship. These are the reasons why a gradual shift to cloud computing performed in countries that suffer most by recession, like the case of Greece, is expected as well to be more efficient and productive. Despite its many benefits, cloud computing also has some risks. Businesses, particularly the smaller ones must be aware of these issues before adopting the cloud. Security challenges, lack of standards, financial failure of the investment in the cloud are some of the risks that SMEs must take into consideration. With cloud computing adoption being in its early stages the risks are unavoidable, so it is important for SMEs to find ways to maximize the benefits and minimize the related risks. Abbreviations
Abbreviation Explanation
SMEs Small and Medium Enterprises
ICT Information and Communication Technology
IT Information Technology

93 Proceedings of International Conference for Entrepreneurship, Innovation and Regional Development
ICEIRD 2014
NIST National Institute of Standards and Technology
SaaS Software as a Service
PaaS Platform as a Service
IaaS Infrastructure as a Service
Cebr Centre for Economics and Business Research Ltd
GDP Gross domestic product
CEB Cumulative Economic Benefit
CapEx Capital Expenditure
OpEx Operational Expenses
GVA Gross Value Added
References
1. Commission E. Small and medium-sized enterprises (SMEs) European Commission2014.
Available from: http://ec.europa.eu/enterprise/policies/sme/.
2. Azarnik A, Shayan J, Alizadeh M, Karamizadeh S. Associated Risks of Cloud Computing for
SMEs. Open International Journal of Informatics. 2012;1:37-45.
3. Auger P, Gallaugher J. Factors affecting the adoption of an Internet-based sales presence
for small businesses. The information society. 1997;13:55-74.
4. Wymer SA, Regan EA. Factors influencing e-commerce adoption and use by small and
medium businesses. Electronic Markets. 2005;15(4):438-53.
5. Caldeira MM, Ward JM. Understanding the successful adoption and us of IS/IT in SMEs: an
explanation from Portuguese manufacturing industries. Information Systems Journal,.
2002;12:121-52.
6. Centre for economics and business research ltd. THE CLOUD DIVIDEND: Part One, The
economic benefits of cloud computing to business and the wider EMEA economy, France,
Germany, Italy, Spain and the UK. 2010.
7. Sultan NA. Reaching for the “cloud”: How SMEs can manage. International journal of
information management. 2011;31(3):272-8.

94 Proceedings of International Conference for Entrepreneurship, Innovation and Regional Development
ICEIRD 2014
8. Judith H, Robin B, Marcia K, Fern H. Available from: http://www.dummies.com/how-
to/content/what-is-cloud-computing.html.
9. Griffith E. What Is Cloud Computing? www.pcmag.com2013. Available from:
http://www.pcmag.com/article2/0,2817,2372163,00.asp.
10. Liu F, Tong J, Mao J, Bohn R, Messina J, Badger L, et al. NIST cloud computing
reference architecture. NIST Special Publication. 2011;500:292.
11. Mell P, Grance T. The NIST definition of cloud computing (draft). NIST special
publication. 2011;800(145):7.
12. Casas P, Schatz R. Quality of Experience in Cloud services: Survey and measurements.
Comput Netw. 2014;http://dx.doi.org/10.1016/j.comnet.2014.01.008.
13. Hugos M, Hulitzky D. Business in the Cloud. Hoboken, New Jersey: John Wiley & Sons,
Inc.; 2011. 226 p.
14. Danchev S, Tsakanikas A, Ventouris N. Cloud Computing: A Driver for Greek Economy
Competitiveness. Athens, Greece: FOUNDATION FOR ECONOMIC & INDUSTRIAL
RESEARCH, 2011 November 2011. Report No.
15. Etro F. The economic impact of cloud computing on business creation, employment
and output in Europe. Review of Business and Economics. 2009;54(2):179-208.
16. Centre for economics and business research ltd. THE CLOUD DIVIDEND: Part Two The
economic benefits of cloud computing to business and the wider EMEA economy.
Comparative analysis of the impact on aggregated industry sectors. 2011.
17. Alshamaila Y, Papagiannidis S, Stamati T. Cloud Computing Adoption in Greece. Paper
presented at the UKAIS Annual Conference, Oxford, UK. 2013.
18. Centre for economics and business research ltd. THE CLOUD DIVIDEND: Part One. The
economic benefits of cloud computing to business and the wider EMEA economy-France,
Germany, Italy, Spain and the UK. 2010 December 2010:89.
19. Dillon T, Wu C, Chang E. Cloud computing: Issues and challenges. 24th IEEE
International Conference on Advanced Information Networking and Applications (AINA):
Ieee; 2010. p. 27-33.
20. Ortiz S. The problem with cloud-computing standardization. Computer.
2011;44(7):13-6.
21. Patel P, Ranabahu AH, Sheth AP. Service level agreement in cloud computing. 2009.

95
ENTREPRENEURIAL LEARNING AND EDUCATION


97 Proceedings of International Conference for Entrepreneurship, Innovation and Regional Development
ICEIRD 2014
Entrepreneurial Knowledge and Educational Structures
Jörg Dötsch1 1Pollack Mihály tér 3, 1088 Budapest, Hungary, [email protected]
Most indices concerning regional competitiveness ag ree on the importance of knowledge. Only “knowledge-economies” seem to be ab le to create sustainable prosperity. However, the question is crucial, which kind of knowledge is decisive. The knowledge which ensures material prosperity has to be discovered by competition. At the same time, firms are confronted with the contin uously increasing dynamics of the global economy. More than ever it is the Schumpeter ian entrepreneur who is able to compete. To achieve sustainable competitiveness the n poses a serious challenge for education: to impart entrepreneurial knowledge, in addition to “traditional” expertise. This paper examines some dimensions of this element on the basis of evolutionary economics, competition theory and business economic s.
Keywords Competitiveness, Entrepreneurship Education, Evolutionary Economics, Knowledge Society
1. Introduction 1
Knowledge is one of the most extensively discussed resources. Economics has been interested in the phenomenon of knowledge since its very beginning. The activity of firms can be understood as a race for better knowledge about consumer wants. Novelty, in an economic sense, is always discovery. This concerns both the perspective of the customers, e.g. regarding the innovation or development of new goods, as well as the perspective of the firm, e.g. regarding new internal structures and processes. The discovered knowledge is a knowledge concerning potential demand. Hence this seems to be the very key factor of economic processes. The discovery of new technical knowledge can lead to decisive advantages in earnings, without changing good characteristics. This enables firms to invest more, for example in research and development. The usage of knowledge in a competitive context seems to cause nonlinear effects: “the winner takes it all”.
Regarding the macroeconomic level, recent global constellations seem to underpin this assumption. Economies with a high percent of know-how-intensive branches of industry are more successful in sense of GDP. Complex goods are more expensive and their prices increase faster. Furthermore, those economies are less prone to crisis. The correlation between the Knowledge Economy Index of the World Bank and the GDP of the states is significant [1].
We can notice similar constellations on the level of business. Technical know-how and market share correlate in many cases. The correlation between spending for research and
1 This research was supported by the European Union and the Hungarian State, co-financed by the European Social Fund in the framework of TÁMOP 4.2.4. A/1-11-1-2012-0001 ‘National Excellence Program’. The following considerations are based on a conference lecture at the 5th symposium for law and economics of the third sector in Hamburg, Germany.
98 Proceedings of International Conference for Entrepreneurship, Innovation and Regional Development
ICEIRD 2014
development and competitiveness is remarkable both on the level of firms and economies [2]. However, we should not jump to false conclusions: It is impossible to ‘buy’ market shares with a high percentage of expenditures for research and development. For the firms it remains the main challenge to search for the right knowledge and to develop appropriate structures. This challenge indeed becomes increasingly urgent in a globalized world. More and more companies are rivals in the race for shares. Product life circles get shorter and shorter. This means, that advantages in knowledge become increasingly important. But advantages in which kind of knowledge?
First and foremost fundamental question is, which knowledge creates an advantage in competition with an open end. It is the main function of competition to discover this knowledge. Though this “discovery procedure” (Hayek) is risky. Economics model this problem traditionally by means of the Schumpeterian entrepreneur. At a first glance this seems feasible. Indeed the dramatically accelerated, increasingly complex and interconnected global economy requires a model of new contexts and to import new, adequate differentiations. It seems not highly promising to leave it to the “Entrepreneurial Instinct” [3]. Anyhow, one thing is clear: the future development of business regions depends essentially on its approach to knowledge [4].
To foreclose roughly the framing assumptions of this article: due to the network effects of global competition, knowledge is the increasingly important key factor of the modern economy. The following sections present some preliminary considerations on the challenge of teaching people the competence, ability or skill to yield the right knowledge in a rapidly changing business environment.
2. Distinguishing Levels of Decisive Knowledge
2.1 The Macroeconomic Perspective: Knowledge and it s Effects on Wealth
Since the beginning of economics, nature and use of knowledge has been a core issue. It is the basic assumption of Adam Smith’s concept of the invisible hand: The entrepreneur who is able to satisfy consumer wants better will be able to generate bigger profits. In this basic situation the provider’s knowledge about consumer wants is decisive.
In their remarkable survey Pawlowski/Edvinsson [5] mention the Swedish economist Westerman, who observed the weak performance of the Swedish shipyards compared to those of the Netherlands in the 18th century. He highlighted a profound difference in “industrial knowledge”, as the ability to organize working processes and knowledge and to deploy new machines. Following this, the root cause for different economic positions of countries are differences regarding the availability and usage of knowledge.
In the 20th century’s early heterodox economics it was Friedrich August von Hayek’s educated guess that markets can process more knowledge than other forms of economies. It was Hayek who identified knowledge as the key factor of modern society. Hence he assumed that this phenomenon must be the base of the global success of the western industrial society [6]. The recent approach of the OECD is quite similar [7]. In a methodologically remarkable manner Hayek regarded the market processes themselves as embedded in social norms. He assumed that these – occidental – norms had survived in a
99 Proceedings of International Conference for Entrepreneurship, Innovation and Regional Development
ICEIRD 2014
process of cultural evolution. This argument is crucial, because they contained tacit knowledge, collected over many generations [8].
These three positions seem to be a plausible starting point for further considerations concerning decisive aspects of knowledge in the actual context outlined above. Each focuses on a different level: Smith’s classical concept is based on the relationship between supply and demand in explaining the emergent phenomenon of markets based on the division of labour. Westerman’s perspective faces the problems of knowledge in organizations and their impact on social wealth. Hayek’s theory embeds the conception of a knowledge-based economy in an environment of tacit knowledge developed through a process of cultural evolution [9]. All these aspects have in common that they focus on the phenomenon of economic advantages by means of knowledge. Social prosperity seems to be only possible by means of a ‘knowledge society’.
This leads us to the actual situation. The basic assumption of economic advantages by means of knowledge is significant for the actual discussion and policy as well. A representative example is the World Bank’s program “Knowledge for development”. The program‘s basic approach is to improve both the access to knowledge and the usage of available knowledge to achieve welfare-boosting effects [10]. The World Bank puts up a “Knowledge-Assessment-Methodology” (KAM) [11]. According to this a “knowledge society” is built upon four pillars: (1) The pillar of the “economic and institutional regimes”, which should set the right incentive for the effective utilization of the available knowledge, but on the other hand also foster entrepreneurial thinking. (2) The pillar “education and competence.” This depicts the assumption that human beings need to be facilitated with education and competences, which enable them to be creative. We will take up this topic later. Furthermore there is (3) the pillar of “information and communication infrastructure” and the “innovation system” as fourth pillar. Pillar (4) is composed from companies, research centers, universities and other organizations, who access global knowledge, to develop regional adaption strategies and new technologies. The “Knowledge Economy Index” of the World Bank ranks countries according to their preconditions for the thrift of a knowledge society.
This architecture of the critical factors for a successful (there knowledge-) society seems to be remarkable because of two reasons. First it focuses on the intermediaries, the facilitators of knowledge. Universities and research centers are named explicitly. At the same time it makes clear, that the pure existence of certain institutions does not guarantee success at all. Obviously it is not enough to tap the continuously growing amount of knowledge in global economy [12].
Furthermore there is a substantial necessity of “competence”, “incentives”, “efficiency”, and “entrepreneurial thinking”. But how can it be ensured, that these factors are available? And if we try to integrate these factors in the diagnosis of a lack of knowledge, how can they be accurately described? The third segment of this article is dedicated to examining this in more detail. But before that, the next section examines a dynamic aspect of knowledge by generating welfare: competitiveness.

100 Proceedings of International Conference for Entrepreneurship, Innovation and Regional Development
ICEIRD 2014
2.2 Knowledge as a source for competitiveness
Let us once again examine the three perspectives previously mentioned. There is competition among companies and economies as well. The cultural perspective can be neglected here [13]. The actual crisis in Europe launched a wide public discussion about the problem of competitiveness [14]. The ability to be competitive seems to be a basis for success, for prosperity of both firms and welfare. But how can competitiveness be ensured? There are very controversial answers to this question.
The perhaps best known starting point is the concept and ranking of the World Economic Forum. It defines competitiveness as “the set of institutions, policies, and factors that determine the level of productivity of a country“ [15]. Similar to the World Bank’s concept of knowledge societies, the World Economic Forum maps its view in the Global Competitiveness Index Framework. It is built on a 12-pillar structure, the “12 pillars of competitiveness” [16]. Remarkably, three pillars refer to the education systems. Innovation, as a particular pillar, is named as a key factor for knowledge-based economies explicitly. The pillar “Business sophistication” focusses on the network effects and sophisticated business practises:
“Business sophistication concerns two elements that are intricately linked: the quality of a country’s overall business networks and the quality of individual firms’ operations and strategies. These factors are particularly important for countries at an advanced stage of development when, to a large extent, the more basic sources of productivity improvements have been exhausted.” [17]
This context is remarkable, because sophisticated business practices require a highly skilled workforce. To pose the question here once again: skilled in which respect? Without introducing new differentiations we can summarize preliminarily, that the World Economic Forum’s concept of competitiveness is built on the same basic assumptions as the concept of the “knowledge society” of the World Bank. The main extensions are the factors of market efficiency (pillars 6,7,8 and 10) and macroeconomic development (pillar 3). The perspective is different, the argument is the same. Hence, the diagnosis here is not too promising as well: Europe is behind regarding entrepreneurship and “mobilizing talent”. What might an adequate approach be to change this situation? If the global economy is changing dynamically, it seems obvious that a new conceptual framework is needed to define more carefully which kind of skills, abilities, competences – in a nutshell: knowledge – is actually needed. Based on this, further considerations can be developed, how to create, to produce or how to teach this kind of knowledge. The following section takes up this question and tries to combine both the macroeconomic perspective and the perspective of the firms.
3. Entrepreneurial Knowledge and the Role of Educat ion
3.1 Framework
As outlined above, entrepreneurial activity is getting increasingly global. Correspondingly, economies develop towards a higher knowledge intensity [18]. Firms trying to benefit from processes of internationalization are confronted with complex and rapidly changing conditions both of customer wants and concerning the development of global value chains. Without reflecting on this in detail it is obvious that there is an increasing need for manpower

101 Proceedings of International Conference for Entrepreneurship, Innovation and Regional Development
ICEIRD 2014
with a particular intellectual disposition. To ensure success in this context, firms have an urgent demand for employees, which are able to comprehend these complex processes of change besides their ‘traditional‘ expertise. In continuously increasing complex value chains employees have to act effectively at any position. They have to adapt to dynamic contexts in internationally varying business models and organizational structures. They have to shape this change fast and to search for innovative customer solutions [19]. Easterby-Smith et al. [20] describe this precisely as dynamic capabilities, which derive in high velocity markets from “simple, experimental, unstable processes that rely on quickly related new knowledge and execution to produce adaptive but unpredictable outcomes” [21]. This specific competence is decisive both for innovations and the quality of the management [22]. Only those firms, which are able to create innovative strategies flexibly and fast are able to survive in a highly dynamic context [23]. These employees are the very basis of “business sophistication” in the sense of the World Economic Forum.
This particular form of intellectual ability, skill or competence is typically entrepreneurial. How could it be adequately theorized? To build up a realistic concept, recently there is no sound basis. Quite the contrary: from a methodological point of view the situation is blurry. There are only vague termini or partially overlapping notions regarding the teachability of those skills or the particular kind of knowledge, which is entrepreneurial. Inasmuch the phenomenon focused here is definitely an intellectual capability, we should use an approach both economic and knowledge-based. To depict the crucial phenomenon of increasing dynamics and knowledge-intensity, an appropriate approach should concern (1) the macroeconomic perspective, (2) the level of the individuals and (3) the level of the firms as well.
Regarding the level of the firms there is a vast literature on the topic of knowledge and especially business knowledge. Regarding knowledge managing systems rarely succeeding, Scarbrough [24] draws attention to the fact, that it is the combination both of business knowledge, ‘expertise’ in a traditional sense and the people’s capability to understand and manage contexts. We take the theoretical position here, that indeed there is a wide-ranged discussion, the notion of the decisive knowledge must be defined in a broader and slightly different sense. This notion must include certain aspects of typical, entrepreneurial abilities of individuals which match the economic situation roughly drawn in the section above.
Heterodox economics seem to deliver a fruitful approach to connect both the perspectives. Elias Khalil separates Entrepreneurship analytically from risk-taking [25]:
“Entrepreneurship (…) is nothing other than action per se – where action can be challenging, which is then called entrepreneurship in the strict sense, or less challenging, which is called entrepreneurship in general. That is, action by definition involves challenge and creativity [26], although different degrees.” [27].
By means of the aspect of creativity, Khalil [28] integrates the evolutionary perspective in his concept: “Let us define entrepreneurship as creativity and the evolution of novelty.” Hence entrepreneurship, used here in a broader sense, (…) is not restricted to profit-oriented goals. It encompasses political, military, artistic, and other goals as long as they involve the testing of ability” [29]. That is the point: Employees in knowledge-intensive economies have to be all this. Referring to the general economic situation and the challenges of firms, Khalil’s equal weighting of creativity and individual challenge seems to be adequate. Referring to the

102 Proceedings of International Conference for Entrepreneurship, Innovation and Regional Development
ICEIRD 2014
aspects discussed in the section above we will call the mentioned range of skills here, a preliminary auxiliary concept, entrepreneurial knowledge.
This approach can feasibly connect to the problems indicated by the empirical surveys of World Bank or World Economic Forum. If we conceptualize the problem as a new, but basic knowledge-problem we have to think about the aspects of teachability. This is why the World Bank’s Knowledge Assessment Methodology or the Global Competitiveness Index focuses on the (leverage-) effects of educational institutions. Qualification is without any doubt one of the most powerful driving forces in international competition [30]. The challenging question is, how to transfer the diagnosis of a critical need for appropriate knowledge or competence – for entrepreneurial knowledge – in educational structures.
3.2 Aspects of Learning
The problem of teachability of relevant knowledge occurred quite early in business literature with the focus on the processes of learning. There are several perspectives. From the point of view of traditional business management, intellectual capital theory is a possible way to outline this problem. It differs between human capital and organizational capital [31]. Sveiby [32] extends this perspective and differentiates between three dimensions as driving forces for growth, effectivity and stability: the external structure (immaterial relations to customers and suppliers), internal structure (patents, concepts, models, structures, explicit processes, informal powers as culture) and competence. Competence can be a part of the internal structure: it cannot be isolated from its creators [33]. Based on this point of view, Alwert defines three types of learning: “single-loop-learning”, which is an effect of every-day work. “double-loop-learning“ is the reflection of business processes as a whole [34]. “deutero-learning” is the implementation of the intellectual balance reflecting all elements of the organisation [35]. Though this is a helpful approach, Scarbrough [36] mentioned the limits of its applicability regarding Knowledge-Management-Systems. Accordingly it will not take us too far in the question of competence in the sense of creativiy – the ability to create internal structures.
3.3 The potential of (higher) education: a first ou tlook
Let us take a step back to the problem of competitiveness and the perspective of the educations systems stressed by both the World Competitiveness Index and the KAM of the World Bank. Without any doubt, good colleges are highly relevant for the attractiveness of business locations. Caniëls/van den Bosch [37] mention them as “regional system builders” [38]. Their importance grows accordingly to gradually increasing knowledge intensity of modern economies [39]. The most important point here is, that this is a mutual relationship. In the light of the problems outlined above, it seems to be urgent to reconsider existing structures. Simply more investment in education is not yet gaining much. The production of entrepreneurial knowledge is a much more complex challenge. But by means of which theory is it to be achieved?
On the one side, there are the aspects of business knowledge theory mentioned above. On the other side, there are a couple of views on the management of higher education. One perspective is to broach this issue as a question of transfer. Hamm/Jäger examined the critical success factors for knowledge transfer in Germany. As transfer they defined the

103 Proceedings of International Conference for Entrepreneurship, Innovation and Regional Development
ICEIRD 2014
process of transferring knowledge relevant for innovations to foster the industry’s economic power and capacity for innovation [40]. One of their findings was the relevance of a regional focus as well as the personal network of the teaching staff. They suggest a more intense cooperation with regional actors, strategic partnerships and integration in supra-regional networks of knowledge-transfer [41]. They stress the importance of cooperative projects as effective transfer-channels and the relevance of strategic partnerships [42].
From the perspective of economics of innovation the creation of “entrepreneurial knowledge” goes beyond the transfer of knowledge. Moreover, it is about the creation of an environment that can ensure synergies [43]. It seems fruitful to connect this problem to the insights of the cognitive approach to business knowledge mentioned above. Starting from Hamm/Jäger’s claim for a regional focus this perspective can easily be linked to the indexes of the Wold Economic Forum or World Bank. Only some topics: According to the research of Cooke [44] common strategies of industry and universities with regional focus provide a higher potential for the development of a regional innovation system. Regarding the institutional dimension, he mentions cooperative culture and types of interactive learning are key factors [45]. These outcomes lead to the assumption that business education should be shaped in a new way. – Though entrepreneurial knowledge is a decisive factor generally, there cannot be a “one size fits all” [46].
Corresponding to Knights [47] the role of the university’s privileged knowledge has increasingly challenged [48]. Besides other ‘providers’ of business knowledge like consultants, NGOs or think tanks, academic work seems “too analytical and insufficiently integrated or concerned with developing practitioners in terms of the ‘softer’ skills and leadership.” [49] He cites Simon [50], who announces a “failure of any integration between scientific analysis and the concerns of professional practice to synthesize a range of actions, processes, or structures to serve some specified purpose” [51].
Starting from the notion of entrepreneurial knowledge presented here, we have to make a clear distinction between traditional business knowledge and the crucial dimension of personal challenge and creativity. Mintzberg and Gosling [52] presented an alternative to the MBA, the “Master for Practicing Administrators” [53], which structures five “interventions” to improve management and leadership skills: (1) Managing self: the reflective mindset, (2) Managing organizations: the analytic mindset, (3). Managing context: the worldly mindset, (4) Managing relationships: the collaborative mindset and (5). Managing change: the action mindset [54]. This structure seems to be a feasible foundation or substructure, which could be integrated as a link between traditional business education on the one hand, and the realization of concrete collaborative research and teaching projects within regional education-industry-networks. The basis for this approach would always be the local focus on both the cultural preconditions and the concrete demand of local firms. This would be done by means of the specific shaping of collaborative research and work arrangements. There is a need for a dual approach, for systematic in-company training in addition to business education.
We take the position here, that – against the doubts announced by Knights – there is a privileged role of the university in that sense, that products as well as organizations and international business structures are getting more complex. To develop and teach the appropriate expertise is a key issue of the university. But nevertheless there is an urgent need to complete their traditional function by means of additional, new teaching forms and, if

104 Proceedings of International Conference for Entrepreneurship, Innovation and Regional Development
ICEIRD 2014
needed, new teaching subjects to foster the entrepreneurial knowledge. This for, the insights of management of higher education, of business knowledge in its broadest sense and of an appropriate theory of entrepreneurial knowledge would have to be combined and to be realized with a regional focus in collaborative concepts. Thereby, referring to Khalil’s notion of entrepreneurship, creativity management would not be a task for firms or a subject in business school, but rather the outcome of a common challenge.
4. Conclusion
The increasing dynamics of the economic environment as well as growing knowledge-intensity require a new concept concerning the ability to discover the decisive knowledge. As a still preliminary survey we tried to work out roughly an appropriate notion of entrepreneurial knowledge by means of heterodox economics, intellectual capital theory and business knowledge and based on recent empirical studies. It was presented as an outlook and approach for possible improvements in higher education.
This investigation shows, that there is still a lot of theoretical work to carry out. To enable concrete improvements for e.g. collaborative concepts in several business fields the notion of entrepreneurial knowledge has to be both more close-grained and to be firmed up by empirical research. For this, the main challenge will be to combine evolutionary theories (“competition as a discovery procedure”, tacit knowledge, problem solving, motivation, creativity) with findings of intellectual capital theory productively.
References
1 See the actual ranking at http://info.worldbank.org/etools/kam2/KAM_page5.asp (20.03.2014). 2 OECD. Trends Shaping Education. OECD Publishing 2013. 3 Metha, M. The Entrepreneurial Instinct. How Everyone has the Innate Ability to Start a Succesful
Small Business. New York 2013. 4 See Alwert, K. Auf dem Weg in die wissensbasierte Gesellschaft, in: Pawlowski, P., Edvinsson, L.
(Ed.). Intellektuelles Kapital und Wettbewerbsfähigkeit. Wiesbaden 2012: 97-134 5 Pawlowski, P., Edvinsson, L. Auf den Spuren des Intellektuellen Kapitals – Ansätze der IC
Forschung und Praxis, in: Pawlowski, P., Edvinsson, L. (Eds.). Intellektuelles Kapital und Wettbewerbsfähigkeit. Wiesbaden 2012: 12.
6 See Wohlgemuth, M.: Neuheit und Wettbewerb. Über das Neue in Hayeks Entdeckungsverfahren, in: Priddat, B. P., Seele, P. (Eds.). Das Neue in Ökonomie und Management. Wiesbaden 2008: 27-47., 32.
7 See OECD. Innovation in the Knowledge Economy. Implications for Education and Learning, Knowledge Management. OECD Publishing. 2004: 20.
8 See Hayek, F. A. Zur Bewältigung von Unwissenheit, in: Die Anmaßung von Wissen. Neue Freiburger Studien, ed. by Wolfgang Kerber. Tübingen 1996: 307-316.
9 See Khalil, E. Friedrich Hayek’s Darwinian theory of evolution of institutions: two Problems, in: Australian Economic Papers. 1996; 35: 183-201.
10 See http://web.worldbank.org/WBSITE/EXTERNAL/WBI/WBIPROGRAMS/KFDLP/EXTUNIKAM/0,,contentMDK:20584250~pagePK:64168427~piPK:64168435~theSitePK:1414721,00.html? (25.08.2013). See for the next segment Pawlowski, P., Edvinsson, L. (Eds.). Auf den Spuren des Intellektuellen Kapitals – Ansätze der IC Forschung und Praxis. Wiesbaden 2012: 16f.
11 See Chen, D. H. C., Dahlman, C. J. The Knowledge Economy, The KAM Methodology and World Bank Operations. The World Bank Institute Working Paper 37256. 2005.

105 Proceedings of International Conference for Entrepreneurship, Innovation and Regional Development
ICEIRD 2014
12 Pawlowski, P., Edvinsson, L. Auf den Spuren des Intellektuellen Kapitals – Ansätze der IC Forschung und Praxis, in: Pawlowski, Peter, Edvinsson, Leif (Eds.). Intellektuelles Kapital und Wettbewerbsfähigkeit. Wiesbaden 2012: 16
13 Mantzvavinos, C.: Individuals, Instuitutions, and Markets. Cambridge 2001. 14 There are debates regarding this topic since a longer time. See e.g. Nijkamp, P., Siedschlag, J.
(Eds.). Innovation, Growth and Competitiveness. Dynamic Regions in the Knowledge-Based World Economy. Heidelberg 2012; Tomáš, Verner. National Competitivess and Expenditure on Education, Research and Development, in: Journal of Competitiveness 2011, 2: 3-10; Causa, Orsetta, Cohen, Daniel. The Ladder of Competitiveness. How to Climb it. OECD Publishing 2007.
15 World Economic Forum. Insight Report. Rebuilding Europe’s Competitiveness. In Corporation with Roland Berger Strategy Consultants. Genf 2013: 8.
16 World Economic Forum. Insight Report. Rebuilding Europe’s Competitiveness. In Corporation with Roland Berger Strategy Consultants. Genf 2013: 4.
17 World Economic Forum. Insight Report. Rebuilding Europe’s Competitiveness. In Corporation with Roland Berger Strategy Consultants. Genf 2013: 7.
18 See OECD: Trends Shaping Education. OECD Publishing 2013: 62ff. 19 See Boes, A., Baukrowitz, A., Kämpf, T., Marrs, K. (Eds.). Qualifizieren für eine global vernetzte
Ökonomie. Vorreiter IT-Branche: Analysen, Erfolgsfaktoren, Best Practices. Wiesbaden. 2012: 11. 20 Easterby-Smith, M. Disciplinies of Organizational Leaning: Contributions and Critiques, in: Human
Relations 1997, 50,9: 1085-113. 21 Martin, J. A. Dynamci Capabilities. What Are They? In: Strategic Management Journal 2000, 21,
10-11: 1105-21. 22 See The OECD Innovation Strategy. Getting a Head Start on Tomorrow. OECD Publishing 2010:
76. 23 See Loch, C., Chick, S., Huchzermeier, Arnd. Managementqualität und Wettbewerbsfähigkeit. Was
Manager vom Industrial Excellence Award lernen können. Berlin, Heidelberg. 2009: 5. 24 Scarbrough, H. Introduction, in: Scarbrough, H. (Ed.). The Evolution of Busniess Knowledge.
Oxford. 2008: 5 25 Khalil, Elias L. A transactional view of entrepreneurship: a Deweyan approach, in: Journal of
Economic Methodology 2003, 10,2: 172. 26Joas, Hans. The Creativity of Action, trans. Jeremy Gaines and Paul Keast, Chicago 1996. 27 Khalil, Elias L. A transactional view of entrepreneurship: a Deweyan approach, in: Journal of
Economic Methodology 2003, 10,2: 172 170. 28 Khalil, Elias. Entrereneurship and Economic Theory. Munich Personal RePEc Archive. MPRA
Paper 501, posted 18. October 206: 1. http://mpra.ub.uni-muenchen.de/501/ (20.03.2014). 29 Khalil, E.. Buridan’s Ass, Risk, Uncertainty, and Self-Competition: A Theory of Entrepreeurship, in:
Kyklos 1997, 50, 2: 148 30 See Ehrke, M., Heimann, K., Vaerst, T. IT-Berufe als Prototyp moderner Dienstleistungsberufe und
die Anforderungen der modernen Arbeitswelt, in Boes, A., Baukrowitz, A., Kämpf, T., Marrs, K. (Eds.). Qualifizieren für eine global vernetzte Ökonomie. Vorreiter IT-Branche: Analysen, Erfolgsfaktoren, Best Practices. Wiesbaden. 2012: 139.; Scarbrough, H. Introduction, in: Scarbrough, H. (Ed.). The Evolution of Busniess Knowledge. Oxford. 2008: 1; OECD: Trends Shaping Education. OECD Publishing 2013: 11.
31 See Pawlowski, P., Edvinsson, L. Auf den Spuren des Intellektuellen Kapitals – Ansätze der IC Forschung und Praxis, in: Pawlowski, P., Edvinsson, L. (Eds.). Intellektuelles Kapital und Wettbewerbsfähigkeit. Wiesbaden 2012: 26.
32 See Sveiby, K.-E. The New Organizational Wealth: Managing and Measuring Kowledge-based Assets. San Francisco. 1997.
33 Sveiby, K.-E. A Knowledge-Based Theory of the Firm to Guide Strategy Formulation, in: Journal of Intellectual Capital, 2001, 2,4: 344-458; Pawlowski, P., Edvinsson, L. Auf den Spuren des Intellektuellen Kapitals – Ansätze der IC Forschung und Praxis, in: Pawlowski, P., Edvinsson, L. (Eds.). Intellektuelles Kapital und Wettbewerbsfähigkeit. Wiesbaden 2012: 26
34 See Alwert, K. Auf dem Weg in die wissensbasierte Gesellschaft, in: Pawlowski, P., Edvinsson, L. (Eds.). Intellektuelles Kapital und Wettbewerbsfähigkeit. Wiesbaden 2012: 109.
35 Alwert, K. Auf dem Weg in die wissensbasierte Gesellschaft, in: Pawlowski, P., Edvinsson, L. (Eds.). Intellektuelles Kapital und Wettbewerbsfähigkeit. Wiesbaden 2012: 109.
36 Scarbrough, H. (Ed.). The Evolution of Business Knowledge. Oxford. 2008.

106 Proceedings of International Conference for Entrepreneurship, Innovation and Regional Development
ICEIRD 2014
37 Caniëls, M., van den Bosch, H. The Role of Higher Education Institutions in Building Regional Regional Innovation Systems, in: Papers in Regional Science 2011, 90, 2: 271-287.
38 Hamm, R., Jäger, A.. Wissenschaft und Wirtschaft eng verzahnen. Standortvorteile für die Region nutzen – Eine Best-Practice-Analyse an Fachhochschulen, in: Wissensmanagement 2012, 5: 52.
39 See OECD: Trends Shaping Education. OECD Publishing. 2013: 62; Mittelstraß, J. Wissensgesellschaft und Hochschulentwicklung, in: Zeitschrift für Hochschulrecht, 2012, 11: 24.
40 Hamm, R., Jäger, A. Wissenschaft und Wirtschaft eng verzahnen. Standortvorteile für die Region nutzen – Eine Best-Practice-Analyse an Fachhochschulen, in: Wissensmanagement 2012, 5: 52.
41 Hamm, R., Jäger, A. Wissenschaft und Wirtschaft eng verzahnen. Standortvorteile für die Region nutzen – Eine Best-Practice-Analyse an Fachhochschulen, in: Wissensmanagement 2012, 5 56.
42 See Frank, A., Meyer-Guckel, V., Schneider, C. (Eds.). Innovationsfaktor Kooperation. Bericht des Stifterverbandes zur Zusammenarbeit zwischen Unternehmen und Hochschulen. Essen, Berlin. 2007; Uyarra, E. The Impact of Universities on Regional Innovation: A Critique and Policy Implications, in: Manchester Business School Working Paper 2008. 564.
43 See Hamm, R., Jäger, A. Wissenschaft und Wirtschaft eng verzahnen. Standortvorteile für die Region nutzen – Eine Best-Practice-Analyse an Fachhochschulen, in: Wissensmanagement 5, 2012: 27.
44 Cooke, P. Regionale Innovationssysteme, Cluster und die Wissensökonomie, in: Blättel-Mink, B., Ebner, A. (Eds.). Innovationssysteme. Technologie, Innovationen und die Dynamik der Wettbewerbsfähigkeit. Wiesbaden 2012: 87-116.
45 Cooke, P. Regionale Innovationssysteme, Cluster und die Wissensökonomie, in: Blättel-Mink, B., Ebner, A. (Eds.). Innovationssysteme. Technologie, Innovationen und die Dynamik der Wettbewerbsfähigkeit. Wiesbaden 2012: 87-116.
46 The OECD Innovation Strategy. Getting a Head Start on Tomorrow. OECD Publishing. 2010: 76. 47 Knights, D. What Knowledge or Knowledge for What? Reforming/Reinventin the Business School,
in: Scarbrough, H. (Ed.). The Evolution of Business Knowledge. Oxford. 2008: 89. 48 Delanty, G. Challening Knowledge: The University in the Knowledge Society. Buckingham: Society
fo Research into Higher Education. Open University Press 2001. 49 Delanty, G. Challening Knowledge: The University in the Knowledge Society. Buckingham: Society
for Research into Higher Education. Open University Press 2001: 93f. 50 Simon, H. A. The Business School: A Problem in Organizational Design, in Journal of Managemen
Studies 1967, 4: 14. 51 Knights, D. What Knowledge or Knowledge for What? Reforming/Reinventin the Business School,
in: Scarbrough, H. (Ed.). The Evolution of Business Knowledge. Oxford. 2008: 94. 52 Mintzberg, H., Gosling, J. Educating Managers Beyond Borders. Academy of Management
Learning and Education 2002, 1,1: 64-76. 53 Knights, D. What Knowledge or Knowledge for What? Reforming/Reinventin the Business School,
in: Scarbrough, H. (Ed.). The Evolution of Business Knowledge. Oxford. 2008: 96. 54 Knights, D. What Knowledge or Knowledge for What? Reforming/Reinventin the Business School,
in: Scarbrough, H. (Ed.). The Evolution of Business Knowledge. Oxford. 2008: 96.

107 Proceedings of International Conference for Entrepreneurship, Innovation and Regional Development
ICEIRD 2014
Capstone Design Courses as a Vehicle for Technology Transfer
Efthimia Staiou1 Sencer Yeralan2 , Murat Fadiloglu3
1YASAR University, Universite Cad. No:35-37, Agacli Yol, Bornova, Izmir, Turkey, [email protected]
2 YASAR University, Universite Cad. No:35-37, Agacli Yol, Bornova, Izmir, Turkey, [email protected]
3 YASAR University, Universite Cad. No:35-37, Agacli Yol, Bornova, Izmir, Turkey, [email protected]
Capstone design courses, at the Industrial Engineer ing department of Ya şar University in Izmir, prepare the student for a prof essional career, while providing a conduit for university-industry collaboration. Not only do the students benefit from their own project, but also from observing other pr ojects, each of which typically involving a different manufacturing or service indu stry. Technology transfer occurs in both directions, where the industry provides timely input to instruction and curriculum revisions. We report our experiences at Ya şar University undergraduate capstone design courses. We emphasize the different modaliti es of interaction and collaboration. .
Keywords Capstone design courses, technology transfer, University-industry collaboration, Industrial engineering.
1. Introduction
Yaşar University is located in Izmir, on the Aegean coast of Turkey. It was established in 1999 by the Selcuk Yaşar Sports and Education Foundation of Yaşar Holding. Yaşar University is considered to be a small but prestigious international institution of higher education with the mission of providing high quality education and research which sets up science culture and contributes to the development of society in both a local and global sense. The university has faculties of architecture, science and letters, art and design, economic and administration sciences, communications, engineering, and law. Yaşar University (YU) Industrial Engineering Department (IED) undergraduate curricula contain a two-course sequence in Systems Analysis and Systems Design. These two courses constitute the traditional capstone design courses fairly common among undergraduate industrial engineering curricula. There are aspects of the courses at Yaşar University that set these courses apart from the majority of capstone design courses. The Industrial Engineering Department’s capstone projects are at the business end of the university’s cooperation with industry. Yasar University is investing in a long-term relationship with Industry believing that such cooperation would be of mutual benefit. Capstone design courses are used not only as a vehicle to transfer technology from university to industry but also to benefit from the experience and the know-how of industry. These are valuable constructs which guide the improvements in curricular content, teaching methods, and desired skills and capabilities of university graduates. For the students participating in the program, capstone design courses are used as a vehicle, again in their passage from the

108 Proceedings of International Conference for Entrepreneurship, Innovation and Regional Development
ICEIRD 2014
“protected” or sheltered environment of the university to the real life environment, in which they will need to apply and develop the knowledge and skills acquired.
2. Capstone Design Courses in Engineering Education
2.1 Capstone Design Courses in Engineering Educatio n: Previous Experiences
A lot has been written in the literature on Capstone Design Courses or as it is sometimes referred to Senior Projects. This type of courses exists in engineering schools for many years. Capstone design courses are one of the ways that universities try to answer the criticism made during the past years concerning producing graduates that are not well prepared to work in industry. In a survey by Todd et al. [1] in 1994 to assess practices in Capstone education over a broad range of engineering disciplines across USA, 360 departments representing 173 schools in North America were studied. The results showed that capstone design courses have been highly regarded as important learning activities. They have also been strongly encouraged by industry. Industry demands that engineering education provides improved ways of preparing students for real-world engineering practices. Preliminary results from the survey mentioned above, were presented at the 1994 Advances in Capstone Education (ACE) Conference held at Brigham Young University in 1994. Together with 26 other peer-reviewed papers addressing a wide variety of Capstone issues and describing individual programs [1]. In a literature review research, conducted a few years later, in 1997, on teaching engineering design through project-oriented capstone courses, Dutson et al. [2] conclude that although the individual structure of capstone design courses are extremely diverse, the objective of nearly all such courses is to provide students with a real-life engineering design experience. Other objectives often include the development of interpersonal and communication skills, enhancement of student confidence, and improved university relationships with industry [2]. Since then, the 2005 National Survey of Engineering in Capstone Design Courses [3] presented in the American Society of Engineering Education Annual Conference and Exposition, in Chicago in 2006 discusses recent developments. More recent trends in the courses structure (2010 data), exploring current pedagogical practices are presented in the paper by Pembridge and Paretti [4]. Further research places emphasis on enhancing communication, training and students’ and industry’s involvement in the process of improving the courses’ implementation process [5]. According to W. Akili [6], the general structure of a capstone design course depends largely on the objectives of the course and the level at which the course is implemented. He distinguishes three major levels at which design courses can be offered: i) the engineering college level, ii) the engineering program level, or, iii) the engineering stem level. The engineering college level refers to courses that may include students from any engineering discipline within the college, while a course at the engineering program level includes students from one department or discipline. Likewise, a course at the engineering stem level focuses on one specific area within the particular department or discipline. The majority of capstone design courses, however, appear to fall in the engineering program level category. According to Akili the general trend towards increasing the design component in engineering curricula, through capstone design courses, is part of an effort to better prepare graduates for engineering practice [6]. Many examples describing individual programmes exist in the literature. The University of Detroit Mercy [7], in the Department of Electrical and Computer Engineering, with large experience in the field of capstone design courses (15 years of experience) integrate their capstone program with a competition, sponsored by an international organization outside
109 Proceedings of International Conference for Entrepreneurship, Innovation and Regional Development
ICEIRD 2014
their university, balancing at the same time team experience, individual assessment, design complexity, realism, writing content, and faculty workload. The authors, Paulik and Krishnan believe that this type of competition matches both the spirit and the practical needs of their capstone design course [7]. MIT has a graduate capstone course that uses inter-departmental teams [8]. The University of Dayton teaches product realization using interdisciplinary teams and concepts of concurrent engineering, integrating elements of innovation and entrepreneurship into their capstone courses [9]. As mentioned above, the idea of inter-departmental or engineering level programs is gaining space. Based on our literature survey, we believe that the following three characteristics are generally accepted and therefore common in the current trends:
1. Selecting real-world problems that are open-ended in nature 2. Working in close cooperation with an industry partner 3. Working with teams of students (acknowledging the importance of having students
learn how to work in teams).
3. Capstone Design Projects in Yasar University
3.1 Capstone Design Courses in the Industrial Engin eering Department of Yasar University
At Yasar University, according to the way the Capstone Design Course in the Industrial Engineering Department (IED) is designed, students are organized into groups of three or four. Industrial partners, some being companies within Yaşar Holding, and traditionally having a close cooperation with the university, are contacted to suggest projects. Students work on these projects in close cooperation with the company. Each team has a faculty advisor who acts both as an instructor and a consultant. The faculty advisor is also responsible for industry relations at a higher level and in many cases is the contact liaison that introduces a new company (not belonging in Yasar Holding) to the university. Students are expected to address and analyse the given problem, and then offer solutions. The expectation, however, goes beyond a successful analysis and solution. Students are also expected to showcase their knowledge in industrial engineering by combining what they have learned from their education into a seamless package that offers constructive approach towards a solution. According to Dym et al., “engineering design is a systematic, intelligent process in which designers generate, evaluate, and specify concepts for devices, systems or processes whose form and function achieve clients’ objectives or users’ needs while satisfying a specified set of constraints” [10]. In our capstone design course, engineering students are asked to do exactly this. Act as a designer, work in a systematic way; use their interdisciplinary knowledge and cooperate with their “client” in order to satisfy industry’s needs. During their two-semester course, students are requested to follow a prescribed timetable, with fixed milestones at which their performance and progress are evaluated. At the end of their course student-teams present to a general audience, with invited guests from industry and academia from other universities’ IE departments. Projects and the results achieved, are placed in a challenging competition to claim the title of the year’s best project. After their presentations, students will have the opportunity to speak with industry people face-to-face during the exhibition of their project’s final posters and possibly gain a position in the industry world. According to the authors, teaching a capstone design course in engineering is challenging The nature of the course is fundamentally different from traditional lecture courses. As mentioned above, it requires students working in teams, which creates a difficulty in the

110 Proceedings of International Conference for Entrepreneurship, Innovation and Regional Development
ICEIRD 2014
evaluation-grading procedure. The evaluator needs to deal with all team members that have different skills and capabilities. Each project is unique and has its own set of expectations. On the other hand, students themselves need to integrate a broad range of the knowledge acquired from courses during their studies. Furthermore, selected projects must be interesting to keep student motivation high. Capstone design courses also involve significant report writing and oral presentations, both to the academics and to the industry. In addition, usually there is substantial field work. All these are very demanding activities for both the students and the faculty members.
3.2 Survey of Yasar University’s Past Projects
The Yaşar University Industrial Engineering Department, has initiated the capstone design courses in 2012 in an attempt to invest in the university-industry collaboration with the belief that it this will be a win-win situation. During the first year, of the implementation of this new approach, 13 projects were completed. Under the supervision of 26 faculty members, 62 senior students participated in these courses. There were 11 different industrial partners, as 13 different industrial problems were addressed and analysed. After 9 months of work, these projects resulted in solutions and recommendations.
Table 1 Project topics of the capstone projects 2012-2013
No Project Title/ Theme Sector
1 The Rhythm of the Milk-Run Paint
2. Making Difference With Standardization Household Appliances
3 Generation of an Active Schedule at Metal Shop Household Appliances
4 Inventory Planning for Auxiliary Materials and Depot Layout Improvement at Pınar Süt
Food
5 Improving Energy Efficiency in the Sheet-FED Process Paint
6 Complexity Reduction in Conbi Boiler Hydrolic Group and Creating a Standard Definition
Household Appliances
7 Train Dispatching at the İzmir Metro Transportation System Logistics Service
8 Algorithm Design For Buffer Stock Management Household Appliances
9 Improvement of the Logistics Processes Paint
10 A Depot Location for the Retail Industry Retail
11 Modelling and Simulation of the LCD TV Assembly Line Household Appliances
12 Inventory Planning for Auxiliary Materials and Depot Design at Pınar Et
Food
13 Cut the Cable Minimize the Workload Automotive
In the second year, the number of the projects increased to 17. The number of faculty supervisors also increased to 29 while the number of students remained unchanged, since the graduating class is about the same size. The net effect of having more projects is reduced team sizes. The specific topics of the 17 projects for the Academic Year 2013-2014 are presented in Table 2 below.

111 Proceedings of International Conference for Entrepreneurship, Innovation and Regional Development
ICEIRD 2014
Table 2 Project topics of the capstone projects 2013-2014
No Project Title/ Theme Sector
1 Production Planning Automotive
2 Management of a Textile Supply Chain with Subcontractors Textile
3 Production Planning and Quality Control Textile
4 System Design of a Supplier Selection Procedure Household Appliances
5 Production System Simulation Electric
6 Operating Room Pricing Policy Healthcare
7 A Product Allocation and Order Picking Problem at a Warehouse
Household Appliances
8 Redesigning Order-Picking and Shipping Operations to Increase Delivery Efficiency at DYO Inks
Paint
9 Route Optimization and Site Selection Breeding
10 Improving Production Efficiency in Fish Production Breeding
11 Improving the Management of Raw Materials Paint
12 Improving Distribution Logistics at Viking Kagit Paper
13 Demand Forecasting Paint
14 Production Simulation Paint
15 Advanced Multi-Objective Optimization Techniques for Simultaneous Berth Allocation and Crane Scheduling Under Uncertainty
Logistics Service
16 Assignment and Scheduling at the DYO Paint Filling Unit Paint
17 Analysis of Material Handling Operations in a Just-in-Time Production Environment
Automotive
As can be seen from the table above, the projects involve the typical industrial engineering topics of inventory control, production planning, forecasting, optimization, quality control, location and plant layout, routing and scheduling, etc. The majority of the projects require an interdisciplinary approach to the problem, which gives students the opportunity to combine knowledge acquired from different disciplines. The majority, 87% of the projects are in the manufacturing sector. This can be easily explained by the fact that Yaşar University, which was established by the Selcuk Yaşar Sports and Education Foundation in 1999, has a direct link and an open communication line to the Yaşar Group of Companies. Also many of the fields of interest of Industrial Engineers are closer the manufacturing sectors listed above, although this does not mean that the other sectors are excluded. As seen in Figure 2 below, the service sector holds 10% of the projects with healthcare and logistics companies and there is also a retail company participating.

112 Proceedings of International Conference for Entrepreneurship, Innovation and Regional Development
ICEIRD 2014
10%3%
87%
Services
Retail
Industry
Figure 1 Capstone design projects by sector A closer look at the specific sector categories of the projects, shows us that a variety of companies exist in our sample.
Figure 2 Capstone design projects by company category
During the current academic year, 2013-2014, 21 more projects are being implemented by several other Yaşar Faculties other than engineering, in cooperation with companies inside and outside Yaşar Holding.
3.3 The Project Selection and Set Up Process
The projects are selected through ongoing contacts with industrial partners. This is a time-consuming activity, whose responsibility rests on the shoulders of the departmental faculty and the Dean of engineering. Although there are periodic formal project fairs as well as an industrial review and advisory board, most relations still rely on personal networks based on previous joint work. In this respect, the continuity of successful projects is quite important. The students may only be aware of their involvement, but from the perspective of the faculty,

113 Proceedings of International Conference for Entrepreneurship, Innovation and Regional Development
ICEIRD 2014
each project is another link in a long chain of projects, that strengthens the trust of industry in academia. The university is supporting the university-industry collaboration through its Research, Development and Implementation Centre. A web-site that has been developed enhances the communication between industry and academia and supports the implementation of the projects with an e-project management system. The YAGEM web site can be found in the following link: http://yagem.Yaşar.edu.tr/
4. Evaluation of the Program
The formal evaluation of the capstone analysis and design courses follow the guidelines set for all departmental courses, as explained in the Bologna process. This process sets up a framework where the learning outcomes are specified and the methods for student and course assessments are determined. As far as the capstone courses are concerned, the faculty view the Bologna framework as a starting point. Our experience in the process, along with extensive interviews and discussions with the various players of the process is now presented.
4.1 The Perspective of the Students
It is safe to say that the students have mixed feelings about the capstone analysis and design courses. On one hand, the students see themselves ready to graduate and start earning a living as professional engineers. On the other hand, they realize that they have no experience in being professional engineers. This is a transition for the students. They are somehow forced to leave the coup and the security of classroom instruction. Faculty advisors for the most part encourage this departure. In some cases, there is a “sink or swim” attitude. Knowing full well that the initial contact will leave the students perplexed, nonetheless, faculty ask the team to engage the industrial partner and start forming ideas. Of course, it is known that the faculty advisors and the department have a working relationship with the industrial partner. In some sense, the environment guaranteed to be secure and friendly. Moreover, many industrial partners may have employed former students from the same department. These graduates are often the personal link of the student to the company. Clearly, the function of a professional engineer involves much more than what is learned from classes and textbooks. People issues, personal conduct and the likes are to be discovered understood. Former graduates also act as excellent mentors in such cases. Besides the projects, the senior class is loaded with quite demanding advanced courses. Many students feel the pressures of the impending job search. In addition, this is the time for many students to be concerned with personal decisions such as relocation or marriage. In some sense, the demanding capstone analysis and design courses are taken at the point where the senior student has the least time. This pressure, in and of itself, constitutes a challenge that often stretches the nerves of the team members to the limit. Although it is useful in the long run for the student to go through an almost ritualistic initiation, at the time, it may be quite overwhelming. In this respect, we must not underestimate the anthropological implications of the process. The senior capstone analysis and design courses constitute, in the very sense of the concept, a “rite of passage.” Anthropologically speaking, the concept of the “rite of passage” as initially introduce by van Gennep [11] signifies the specific event at which time the status of an individual changes in the view of the larger society. As such, it is a concept closely related to the General Theory of Socialization [12]. Such rituals are often cumbersome, demanding, and testing. In fact, there is little difference between a tribal hunter being admitted to adulthood after his first successful hunt, and our capstone courses. In both cases, the person is somehow pushed to the limit with

114 Proceedings of International Conference for Entrepreneurship, Innovation and Regional Development
ICEIRD 2014
the understanding that such pressures would harden him enough to face the world on his own. Another issue arises from the fact that, in general, students, until the Capstone Design Course, have not had the experience to work in teams. The importance of teamwork and teams, which are so commonly used in industry, needs to be understood by academia. During their capstone projects, students experience teamwork and learn the difficulties, but also the advantages of teamwork.
4.2 The Perspective of the Instructors
The instructors are not graded in the evaluation. However, instructors, especially young faculty are often seen taking pride in their team and eager to assist the team to the extent possible without overtaking the project themselves. From the viewpoint of the instructor, the project is only one in a series of projects that make up the long-term relationship with industry. Faculty are eager to cultivate the industrial relationships since these provide funded research projects, and ideas for classroom instruction or research papers. It is always difficult to judge the level of assistance an advisor is to provide. This is complicated further by the fact that each individual student is a bit different, and each team has a different chemistry. After all, each graduating student will develop her own professional style. This project is an opportunity to let the student try different styles and develop one that suits them the best. In general, faculty are aware of the pressures on the seniors described in the previous section. Faculty advisors often find themselves not only assisting in technical engineering issues, but also in personal issues as the students are left to deal with the pressures of the initiation tasks. Finally, although supervising a capstone project usually requires a heavy workload and commitment, faculty seem to wholeheartedly support the capstone design projects, exhibiting their commitment often on a daily basis. Faculty believe that the “real-life” projects are very beneficial and valuable in helping their students to prepare for their future.
4.3 The Perspective of the Industrial Partners
The industrial partners display the largest variability in the process. Not only do we face a variety of dissimilar industry focus areas, but also a very wide range of corporate culture. Corporate culture in companies develops over decades and thus is relatively resistant to agile changes. The companies, by and large, are interested in cooperating with the university. There are other motives for companies, other than being good corporate citizens lending a helping hand to the process of producing the next generation of engineers. Corporations see outside involvement as a good way to review their operations. This may alert them to rather obvious omissions in their operation, which may be all too clear to an outsider. Moreover, since the outside reviewer, in this case is a university, it is not seen as a competitive threat. Corporations also view the presence of student interns as a refreshing event that often boosts morale. Of course, the research outcomes may provide to be useful to the company. However, most companies do not view student research to be as highly likely to produce results as their own research and development efforts, or what they receive from professional consulting services. The student work provides the company with an opportunity to see the students at work, and thus is a good way to screen potential future employees. Cases where students are hired by the companies where they did their summer practices or capstone analysis and design work are not uncommon. Perhaps the greatest benefit seen by industrial partners is the fact that such cooperative work expands their professional network and keeps them connected. With the advent of globalization and rapid changes in the corporate, economic, and financial landscapes, this connectivity is important more so than just a few decades ago.

115 Proceedings of International Conference for Entrepreneurship, Innovation and Regional Development
ICEIRD 2014
Overall, successful industry-academia projects, besides the benefit that they have for the students, help in increasing industry’s confidence in engineering education.
5. Future Plans for the Capstone Course
We feel that few faculty members in engineering are formally introduced to concepts such as “rite to passage” and thus act based on their personalities and personal experiences. An orientation for the faculty may be considered in the future to increase awareness, which will help to improve the objectives of the capstone analysis and design courses. We believe that training the instructor in the role of a “coach” will bring further improvements in the educational result of the capstone courses. Also, further work needs to be done in enhancing student and industry involvement through improving the communication between the industry partner and the team members. Experience shows that problems arise when this communication is poor. In addition the YU IE Department is willing to explore in the future, the possibility of extending the capstone design course in a parallel stream towards the interdepartmental direction, offering the Engineering Faculty students the opportunity to collaborate in projects addressing interdisciplinary real-life industry problems.
6. Conclusions
The importance for Universities and Industry collaboration is a necessity in the global knowledge economy. Nowadays, this necessity is intensified and the trend moves towards strategic partnerships that go beyond the traditional collaboration and the funding of discrete research projects [13]. Examples of world-class research universities, which are at the forefront of pioneering such partnerships, like IBM-ETH Zurich, Siemens-TU Berlin, MIT and Nokia-Aalto University, UC Berkeley are presented in the report, of the Science and Business Innovation Board, on how to make industry-university partnerships work [13]. In the same vane is the Review of Business–University Collaboration, conducted by Tim Wilson for the Department for Business Innovation and Skills, in the UK [14]. The words of Lord Dearing (Sept 2002) quoted in this review describe universities as “the source of strength in the knowledge-based economy of the twenty-first century”. In a local level, university–industry cooperation can become a reality through a successful implementation of a capstone design courses programme. Deep, long-term partnerships can be built between industry and academia and will result only in a win-win situation. In the paper, we presented our experiences with the industrial engineering capstone analysis and design courses at Yasar University. We believe that such courses are an important element in education, research, and technology transfer and thus, are truly a synergistic component of activity.
References
1 Todd R H, Magleby S P, Sorensen C D, Swan B R, Anthony D K. A Survey of Capstone Engineering Courses in North America. Journal of Engineering Education. 1995; 84(2): 165-174.
2 Dutson A J, Todd R H, Magleby S P, Sorensen C D. A Review of Literature on Teaching Engineering Design Through Project-Oriented Capstone Courses. Journal of Engineering Education. 1997 Jan; 86(1): 17-28.
3 Howe S, Wilbarger J. 2005 National Survey of Engineering Capstone Design Courses. In: American Society of Engineering Education Annual Conference and Exposition. 2006: Chicago, IL. p. 21.
4 Pembridge J, Paretti M, The Current State of Capstone Design Pedagogy. In: American Society for Engineering Education, Annual Conference 2010, Louisville, Kentucky.

116 Proceedings of International Conference for Entrepreneurship, Innovation and Regional Development
ICEIRD 2014
5 Trent J L, Todd R H. Bridging Capstone Design with Industry Needs through Communication, Training, and Involvement. Capstone Design Conference 2012. May 30 - June 1, 2012, Champaign-Urbana, Illinois, USA. (this one I haven’t mentioned it in the text….maybe erase it) http://www.capstoneconf.org/resources/2012%20Proceedings/Papers/index.html
6 Akili W. Teaching Civil Engineering Design using Project-Oriented Industry Driven Capstone Courses. Proceedings of the Canadian Engineering Education Association. (http://library.queensu.ca/ojs/index.php/PCEEA/article/view/3799) 2007.
7 Paulik M J and Krishnan M. A Competition-Motivated Capstone Design Course: The Result of a Fifteen-Year Evolution. IEEE Transactions on Education. 44 (1). 2001 Feb: 67-75.
8 Durfee, W K. Engineering education gets real. Technology Review. 1994 Feb-Mar; 97(2): 42-51, Feb/Mar.
9 Doepker P E, Enhancing The Product Realization Process By Emphasizing Innovation And Entrepreneurship. The Journal of Engineering Entrepreneurship. 2010 Jul; 1(1): 20-34.
10 Dym C L, Agogino A M, Eris O, Frey D D, Leifer L J. Engineering Design Thinking, Teaching, and Learning. Journal of Engineering Education. 2005; 94(1):103-120.
11 Gennep A. van, The Rites of Passage, 1909. University of Chicago Press, 1960. 12 Grusec J E. and Hastings P. D., Handbook of Socialization: Theory and Research, Guilford
Publications, 2008. 13 Edmondson G, Valigra L, Kenward M, Hudson R L, Belfield H. Making Industry-University
Partnerships Work: Lessons from Successful Collaborations. Brussels, Science|Business Innovation Board AISBL. 2012.
(http://www.sciencebusiness.net/assets/94fe6d15-5432-4cf9-a656-633248e63541.pdf) 14 Wilson T. A Review of Business–University Collaboration. Department for Business
Innovation & Skills. UK. 2012 Feb. (https://www.gov.uk/government/publications/business-university-collaboration-the-wilson-review)

117 Proceedings of International Conference for Entrepreneurship, Innovation and Regional Development
ICEIRD 2014
ICEIRD 2014: Developing University–SME Collaboration
Sinikka Seppänen1, Kristiina Lilja2 1Tampere UAS, Kuntokatu 3, Tampere, Finland, [email protected]
2Tampere UAS, Kuntokatu 3, Tampere, Finland, [email protected]
From ICEIRD 2014 conference topics, this paper addr esses Creativity, Complexity and Competitiveness Issues for Small and Medium Enterpr ises and more specifically SME business process modelling. The aim of this develop ing process was to create new kind of multidisciplinary collaboration between Tam pere University of Applied Sciences (UAS) and SME´s. After a fusion of two UAS in Tampere in 2010, Tampere UAS became the second largest UAS in Finland with 1 0 000 students, 800 staff members and seven faculties with 40 degree programs including e.g. culture, art and media, technology, ICT, health care, social service s, business and entrepreneurship. At the time of fusion a new customer oriented strat egy was created. Purpose of the strategy was to build a strong bond between UAS and SME´s in a customer oriented way. Collaboration with universities of applied sci ences is very sought after by enterprises in Finland. There is a great deal of re quests every year for collaboration, development work etc. by SME´s in different fields. In practice this kind of collaboration can be seen fragmented, non-concentra ted and very challenging to manage. By interviewing customers, gathering information fr om faculties and benchmarking common strategic partnership models a new customer oriented concept of collaboration was created to support both customer´ s and university´s strategic focuses. This partnership model classifies three ty pes of partnerships: educational partnership, development partnership and strategic partnership. In university – SME collaboration the focus is in development partnersh ip which is the type of partnership that best suits for SME´s needs for development and growth. This concentrated, systematic but flexible concept gathers together mu ltidisciplinary expertise for SME´s development work and benefit. As a conclusion, this new concept of partnerships r aises customer relationships into a new level of content. Development partnership off ers university – SME collaboration practical tools and common goals for multidisciplin ary development. SME´s are able to benefit more effectively the wide range of exper tise in Tampere UAS. From UAS point of view this model offers a multidisciplinary development and learning environment. At the same time it creates new value for all parties in a cost effective way.
Keywords Collaboration, Cost effectiveness, Customer orientation, Partnership, Regional development

118 Proceedings of International Conference for Entrepreneurship, Innovation and Regional Development
ICEIRD 2014
1. Introduction
The Ministry of Employment and the Economy in Finland emphasizes the importance of entrepreneurship as an essential factor for regional and national growth and internationalization. In Finland total amount of enterprises is approx. 263 000 and 99,8 % of them are SME´s [1]. In this situation universities play significant role for society as educator and developer. Universities are adopting new strategies and new ways of working with enterprises. At the same time politicians, industrialists and economists are beginning to see universities major agents of economic growth as well as creators of knowledge, developers of young minds and user driven research and problem-solving with local and regional companies [2]. The fundamental tasks, education, development and regional development, are written in Finnish law of universities [3]. Universities of applied sciences are especially concentrated in supporting entrepreneurships and growth of SME´s. According to Finnish research collaboration between SME´s and UAS´s has been proven to be cost effective and given a great input to regional development. The aim of this developing process was to create new kind of multidisciplinary collaboration between Tampere UAS and SME´s. After a fusion of two UAS in Tampere in 2010, Tampere UAS became the second largest UAS in Finland with 10 000 students, 800 staff members and seven faculties including e.g. culture, art and media, technology, ICT, health care, social services, business and entrepreneurship. At the time of fusion a new customer oriented strategy was created. Purpose of the strategy was to build a strong bond between Tampere UAS and SME´s in a customer oriented way. Collaboration with universities of applied sciences is very sought after by enterprises in Finland. There is a great deal of requests every year for collaboration, development work etc. by SME´s in different fields. All faculties in Tampere UAS get numerous of contacts in working life and community. In the beginning of this developing work there were no concentrated models of co-operation with SME´s or Customer Relationship Management platforms in use. Collaboration between Tampere UAS and SME´s was seen fragmented, non-concentrated and very challenging to manage.
2. Development process and the methods used
This development process and the methods used were based on the Tampere UAS new strategy of customer orientation. Tampere UAS´s vision is to be the most customer oriented UAS in Finland. In order to achieve this goal, Tampere UAS must create a common understanding of customer orientation and recognize the multidisciplinary possibilities for cooperation and partnership. In order to promote this customer oriented strategy in Tampere UAS ten customer oriented teachers were named as key account teachers. Together with other customer oriented professionals from R&D, information and recruitment services they formed a larger team of

119 Proceedings of International Conference for Entrepreneurship, Innovation and Regional Development
ICEIRD 2014
customer relations for implementation this customer oriented strategy work. In the lead of this strategy is a customer director and together with directors of faculties this customer oriented strategy work is being guided and supported. The development process was carried out by a questionnaire, by an interview and by benchmarking partnership models of other organizations from both theoretical and practical point of view.
2.1 Recognizing UAS partners by questionnaire
The first step was to recognize the most important partners of Tampere UAS by so far. The information was gathered by a questionnaire, which was designed for this purpose by the team of customer relations. The target group covered all the faculties in Tampere UAS. Main themes in the questionnaire were: • most important partners of the faculty • main activities in collaboration • contact person in UAS • contact person in partner organization The questionnaire made it possible to recognize the most active and customer oriented persons in each faculty and get a picture of their professional network.
2.2 Recognizing customer needs by interview
The second step was to gather information by an interview. The main purpose of the interview was to find out customers’ needs for growth and development and their expectations for collaboration. In order to get this more profound understanding of customer needs and expectations for collaboration with Tampere UAS, 22 customers were selected for interview. These customers were all named to be important partners of faculties in the questionnaire. Fourteen of them represented SME´s and eight were from public organizations or third sector actors. Each interview lasted approx. 30 minutes. A researcher from the team of customer relations interviewed customers in following themes: • background information from organization • experiences from past collaboration with Tampere UAS • customer satisfaction for collaboration • customer needs for growth and development • customer expectations for collaboration • interest to develop more profound partnership with Tampere UAS This method opened a large perspective of needs for customer oriented collaboration and different types of partnership models seemed to be needed.

120 Proceedings of International Conference for Entrepreneurship, Innovation and Regional Development
ICEIRD 2014
2.2 Benchmarking partnership models
Customers can be divided to different categories depending on their role in cooperation. The most common way is to see a client simply as a “buyer” or an object of services. In second level clients can be seen as subjects with more participating and consulting role. In third level clients can be seen as equal partners and the bounds between clients and service organisations disappear [4]. Ståhle and Laento [5] have divided partnerships into three dimensions: operational, tactical and strategic partnership. In operational partnership added value becomes on economic aspects. Tactical partnerships promote learning and make processes more effective. Strategical partnerships are the most innovative and offer a great opportunity to raise business into a whole new level [5]. Järvelin [6] analyses partnership models from Tampere University of Technology’s point of view in three categories: strategic partners, partners and others. Strategic partners share a common vision and there is a whole university level agreement. With partners there is a strong commitment from both sides and agreement is set up in department or research group level. Others do cooperation on a project basis [6]. During the developing process to create partnership model for Tampere UAS all three types of customers roles were recognized as Stårbacka and Lehtinen [4] above described. Also partnership dimensions that Ståhle and Laento [5] analyzed over ten years ago are still valid and significant in developing university – SME collaboration in Tampere UAS. In business to business partnerships the perspective and goals differ from partnerships where universities are involved. As Järvelin [6] noted it´s essential in what level the partnership is agreed in university.
3. Results
The results of the questionnaire showed that the amount of the most important partners in Tampere UAS is over 500. Most of the partners are SME´s. According to the questionnaire different faculties named very often same organizations as their most important partners, without knowing from each other’s partners. Partner organizations came from wider community representing companies and industry in different fields, public sector organizations and third sector actors. The questionnaire offered high coverage of different kind of partner organizations Tampere UAS has cooperated with.
All 22 selected persons for interview were contacted and interviewed as planned. They all had several years of experience in collaboration with Tampere UAS in different customer roles. All interviewed SME´s considered to have needs for growth and development in the future. Therefore they showed special interest for deepening collaboration towards development partnership. On the whole the results pointed out that organizations appreciated Tampere UAS as a trustful, professional and pleasant partner.
When benchmarking different partnership models it became obvious that Tampere UAS needed to create its own classification when developing collaboration with its customers in wider community, especially with SME`s. In Tampere UAS customers can be divided to

121 Proceedings of International Conference for Entrepreneurship, Innovation and Regional Development
ICEIRD 2014
different categories depending on their role in collaboration. Therefore also several partnership levels are needed to appreciate various needs of partner organizations and university´s assignments.
In order to create a new partnership model for Tampere UAS the team of customer relations analyzed all the results described above, set a goal to create a new model and started concrete actions in multidisciplinary workshops. The process was guided according to Brian Tracy´s framework [7] where the focus is in making clear goals and starting implementation rapidly.
3.1 Classification of partnerships
The partnership model (Table 1) created for Tampere UAS classifies three types of partnerships: educational, development and strategic based on the fundamental assignments of UAS written in Finnish law of applied sciences [3].
Table 1 Classification of partnership in Tampere UAS.
Partnership Main process Amount (1) Educational Learning over 500 (2) Development Developing annually 30 (3) Strategic Regional
developing and internationalization
less than 10
(1) Educational partnership is based on mutual understanding between partners. Typically these partners cooperate with single degree programmes. Educational partnership support student´s learning processes.
(2) Developing partnership is based on customer need for growth and development and multidisciplinary cooperation with several faculties. Developing partnership produces cumulative learning for both partner and university.
(3) Strategic partnership focuses on supporting regional developing and internationalization. It is based on university´s mission.
4. Conclusions
The results of the questionnaire pointed out that Tampere UAS has a very large and multidisciplinary network of partners, mostly SME´s. When the results were observed closely it became obvious that there is a strong need for concentrated and multidisciplinary approach for partnership model in Tampere UAS. This partnership model created for Tampere UAS classifies three types of partnerships: educational partnership, development partnership and strategic partnership. Especially development partnership offers university – SME collaboration practical tools and common goals for multidisciplinary development and value creation. Development partnership is the type of partnership that best suits for SME´s needs for growth and future development. This

122 Proceedings of International Conference for Entrepreneurship, Innovation and Regional Development
ICEIRD 2014
concentrated, systematic but flexible concept gathers together multidisciplinary expertise for SME´s benefit. As a conclusion this whole developing process has taken Tampere UAS towards better customer orientation and opened new possibilities for multidisciplinary development. Needs of customers can now been taken better into account. Satisfaction of all actors in partnerships has grown quite significantly. The actual benefits of this partnership model have now being both recognized and appreciated.
References
1 Ministry of Employment and the Economy. Yrittäjyyskatsaus 2012. Työ- ja elinkeinoministeriön julkaisuja. Helsinki. Työ ja yrittäjyys 46/2012. 2 Lockett N, Johnston L. 2008. Exploring the Role of Universities in Communities of Innovation: am Systems Approach. In Promoting Entrepreneurship by Universities. Ingle S & Neuvonen M-L, eds. Lahti University of Applied Sciences. Series C, part 59. 157-163. 3 Law of Universities of Applied Sciences. http://www.finlex.fi. 2009/564. 4 Storbacka K, Lehtinen J R. Customer Relationship Management – Creating Competitive Advantage Through Win-Win Relationship Strategies. McGraw-Hill, Singapore. 2001. 5 Ståhle P, Laento K. Strateginen kumppanuus – avain uudistumiskykyyn ja ylivoimaan. WSOY, Helsinki. 2000; 102-103. 6 Järvelin A-M. Tampere University of Technology (TUT) in Partnership. In Bringing Bright Minds Together Seminar. Tampere. 2013. 7 Tracy B. Full Engagement!: Inspire, Motivate and Bring Out the Best in Your People. AMACOM. 2011.
123 Proceedings of International Conference for Entrepreneurship, Innovation and Regional Development
ICEIRD 2014
Should I stay or should I go: is the leadership style important for the sector where it is performed? Gligor Stojkov1, Dusica Janevska2, Radmil Polenakovik3
1 FaSTO, bul. Ilinden 81/16 Skopje, Macedonia, [email protected] 2 FaSTO, bul. Ilinden 81/16 Skopje, Macedonia, [email protected] 3 Faculty of Mechanical Engineering, Ss. Cyril and Methodius University Skopje Macedonia, [email protected]
This paper presents an overview of the results of d esktop research of the scientific literature related to different leadersh ip styles. Special focus is dedicated to democratic, autocratic and laissez fai r as one categorization of the leadership styles and transformational and tran sactional leadership style as part of other category. It additionally presents the findings of the research conducted in 133 companies and governmental institu tions in the Republic of Macedonia. Participants of the research were owners or leaders employed in the companies in different industries as well as go vernmental institutions. Tailor made questionnaire including the Multifactor Leadership Questionnaire (MLQ) was used for data collection aiming identific ation of different leadership styles among participants. The research leads to co nclusion that major part of the participants practice democratic and transactio nal leadership style. The transformational leadership style is nearly not pra cticed at all. Finally the distribution of different leadership styles is very similar in private and public sector.
Keywords Leader, leadership styles, democratic leadership, transformational leadership, Multifactor Leadership Questionnaire (MLQ)
1. Introduction
Leadership is defined as the ability of a person, leader to guide others, to influence them to follow him or her in achieving the set goal and the desired and necessary changes. The leader is a person who has the ability to force other people to follow him or her, to do what he or she proposes. He knows how to recruit people for their work, that they follow his decisions.
Leaders are everywhere - in sports, politics, culture and business, in every human activity. Everywhere there are people who lead the organization forward, who are not satisfied only with the current good results, but they continuously think and challenge the possible changes in name of future good work and results.
Effective leading requires leaders to be good psychologists, good communicators and animators, to know how to work with people, to persuade and guide them towards the set goals. They must be good visionaries and predictors in order properly to set the further goals and needed changes and actions for their implementation. The leadership is a process in

124 Proceedings of International Conference for Entrepreneurship, Innovation and Regional Development
ICEIRD 2014
which one person - the leader affects the other members of the group - followers in order to accomplish the goals of the organization. Such behavior in this new form involves respect, trust and teamwork.
Leader is a person who is able to shape the vision and strategy, to design the operations and enterprise development, and to recruit employees to believe in the vision and strategy that would become devoted followers willing to invest further efforts for the realization of the set goals.
2. Leadership styles
2.1 Behavioral Approach
Given that it is impossible to isolate the treats that are exclusive to the leader, the further direction is identifying the behavior of the leader. The open question is whether there is something that the leaders do and the other people not. The starting point is if the treats of the leader cannot be identified, than the focus would be on the recognition of their attitude. This is a promising starting point, meaning that if the attitudes and behaviors can be identified then people can learn and adopt these behaviors, thus creating the opportunity for education and training of leaders.
Studies, however, showed that it cannot be identified specific behaviors that characterize only the leaders, thus taking them apart from non leaders. So it became clear that a universal approach to leadership will not give the expected results. However, although not leading to the desired goal, the studies of leadership still brought certain results – identification of different styles of behavior of leaders.
The performed studies on the subject [1] [2] showed that it can be identified different leadership styles and behaviors that can be classified in different ways and according to different criteria. First and simplest classification of styles of leadership is the result of research conducted at Iowa State University. Three basic styles of leadership are identified: autocratic, democratic and "laissez faire" (liberal or "Live and let others live"). [3] [4]
• Autocratic style is characterized by absence of any participation of the followers, i.e. the leader alone is the decision maker and thereby takes the consequences
• Democratic style where the leader allows to the followers a certain degree of autonomy in decisions (but still his opinion is crucial)
• Laissez faire style where the decision making initiative is in employees’ hands
Autocratic leadership style is characterized by the absence of any participation of subordinates. The leader alone makes decisions and takes responsibilities for the consequences. He determines how decisions will be implemented and very strictly directs the employees in the process of implementation. The application of the autocratic style gives the leader power that he usually unlimitedly uses. The leader acts independently in emergencies. Only he has certain knowledge, makes decisions alone and determines how to carry out the objectives. Collaborators are dependent on the leader and are rarely asked to give their opinion. Work situation is characterized by strong discipline, strong control and special costs control. This style is suitable for use with employees with low qualification structure. If running autocratic style extremely or repeatedly it can result in poor communication. Autocratic style is used for routine tasks. In the democratic leadership style, the leader has limited power and authority. The team may reject his authority and may supervise him. He has limited power in granting sanctions. This

125 Proceedings of International Conference for Entrepreneurship, Innovation and Regional Development
ICEIRD 2014
style is proved to be effective in “middle class” i.e. doctors, scientists, engineers. Democratic style means the leader initiate and guide discussion of subordinates, but also allows them to freely express their opinion. The final word in the decision making is the leader’s. During the implementation of the decision the leader allows a significant degree of autonomy to the employees. The working condition is characterized by so-called "umbrella" objectives with shared responsibility for their implementation which sometimes includes both real and potential risks. The team analyzes the problem, determines alternative solutions and makes the final decision. Democratic style enables the team work in the realization of goals. Too frequent use of this style can result in loss of the ability of individual initiative, but also can result in a contentious decision making. It is used for solving difficult creative tasks. Laissez faire style actually means abdication of the leader, given that he is withdrawn from the decision, leaving the members of the organization to decide alone. He is not interested in the implementation of the decisions thus leaving to the employees the initiative to complete the process. Characteristics of this leadership style are that the leader has no authority to force subordinates on action. The mandate is determined by the satisfaction of the group. The leader cannot impose sanctions on associates and does not possess specific information about the knowledge of the collaborators. The collaborators have more power than the leaders, they are unwilling to accept orders and will resist to anything they do not want to accept. They choose alone goals and methods of work and are liberally organized. Working situation becomes more complicated when there are no clearly stated objectives, leaving the power of the individual to choose the objective willing to work on. There is no leading structure.
2.2 Transformational leadership
The new paradigm of leadership captured the widespread attention. James MacGregor Burns [5] conceptualized the leadership as transactional or transformational. Transactional leaders are those who lead through social exchange. As Burns notes, the politicians for example, lead by "exchanging one thing for another: work for votes, or subsidies for campaign contributions". The same way transactional leaders offer financial rewards for productivity or abolish awards for lack of productivity. Transformational leaders are those who stimulate and inspire followers, in order to achieve extraordinary results, and in the process to develop their own leadership capacity. Transformational leaders help followers grow and develop in leaders by responding to their individual needs, with strengthening and alignment of their individual goals with the goals of the leader, the group, and the larger organization. More evidence is accumulated to demonstrate that transformational leadership can move followers to exceed expected performance and lead to higher levels of satisfaction and their commitment to the group and the organization [6]. Although previous researches demonstrated that transformational leadership is particularly powerful source in military settings [7-12], recent studies show that transformational leadership is important in every sector and in every setting [13].
Components of transformational leadership
Transformational leaders do more with colleagues and followers than just setting up exchanges or agreements [6]. They behave in a way to achieve superior results through engaging in one or more of the four basic components of transformational leadership that will be described later. To some extent, the components of transformational leadership evolved after

126 Proceedings of International Conference for Entrepreneurship, Innovation and Regional Development
ICEIRD 2014
improvements have been made in its conceptualization and measures. Conceptually, the leadership is charismatic and the followers seek to identify with the leader and imitate him or her. Leadership inspires followers through challenges and beliefs while providing meaning and understanding. Leadership is intellectually stimulating, expanding the use of the abilities of followers. Finally, leadership carefully provides the followers with support, mentoring and training. Each of these components can be measured by Multifactor Leadership Questionnaire (MLQ). Different studies [14-16] have identified the components of transformational leadership. The description of these components are presented in the following sections [6].
Idealized influence. Transformational leaders behave in ways that allow them to serve as a role model for their followers. Leaders are worshiped, respected and trusted. Followers identify with the leaders and want to imitate them; leaders are supported by their followers because they have unusual abilities, perseverance and determination. Thus, there are two aspects of idealized influence: the behavior of the leader and the elements that are attributed to the leader by followers and other associates. These two aspects measured by individual sub factors of MLQ, represent the international nature of idealized influence - they are embodied in the behavior of the leader and the empowerment given to the leader by followers. Example of the contents of MLQ which represents idealized influence in the behavior is "leader emphasizes the importance of having a collective sense of mission." Example of the idealized influence of the contributing factors is: "leader reassures others that obstacles will be overcame." In addition, leaders who have a great deal of idealized influence are ready to take risks and are more permanent than arbitrary. They can be expected to do the right thing, demonstrating high standards of ethical and moral leadership.
Inspirational motivation. Transformational leaders behave in ways that motivate and inspire those around them by providing meaning and challenge to the work of the followers. Team spirit awakens, while showing enthusiasm and optimism. Leaders include followers in the overlooking of future set, they create clearly outlined expectations that followers want to meet and also demonstrate commitment to common goals and vision. Example of the contents of MLQ for inspirational motivation is "leader expressed a clear vision for the future". Intellectual stimulation. Transformational leaders encourage the efforts of their followers, to be innovative and creative by questioning the assumptions, reframe problems, and by approaching the old issues in new ways. The creativity is encouraged. There is no public criticism of the mistakes of the individual members. New ideas and creative solutions to challenges are encouraged by the followers, who are involved in the process of addressing problems and finding solutions. Followers are encouraged to try new approaches, and their ideas are not criticized because they differ from the ideas of the leader. An example from MLQ that represents intellectual stimulation is "leader makes others see problems from many different perspectives." Individualized thinking. Transformational leaders turn attention to each individual need of the followers for achievement and growth by acting as a coach or mentor. Followers and colleagues are developed to a higher, more effective level of potential. Individual thinking is practiced when new learning opportunities are created along with the climate of support. The individual differences in terms of needs and desires are recognized. The behavior of the leader demonstrates acceptance of individual differences (for example, some employees receive more encouragement, some receive more autonomy, others firmer standards, while some receive more structural tasks). It encourages two-way exchange in communication and on job "workaround management" is practiced. Interactions between the followers are personalized (for example, the leader remembers previous conversations, is conscious of individual interests, and sees the individual as a complete person rather than just as an employee). The leader delegate tasks with regard to the development of the followers. Delegated tasks are monitored to see if the followers need additional direction or support, as

127 Proceedings of International Conference for Entrepreneurship, Innovation and Regional Development
ICEIRD 2014
well as to determine progress; ideally, followers do not feel they are controlled. Example of individual thinking in the MLQ scale is "leader spends time learning and training".
Effectiveness of transformational leadership
In the past 20 years, many studies have examined transformational leadership and performance over a wide range of parameters. For example, transformational leadership show positive effect on the performance of the companies in the United States and North American [17] [18], in Russian companies [19], in companies in Korea [20] as well as in New Zealand [21]. It is important in the military sector [22] [23], in the private sector [24] [25], the governmental sector [26], education [27] [28], and non-profit organizations [29]. Transformational leadership is linked to the performance of groups of vendors [30], healthcare staff [31], principals of secondary schools [32] and even athletes [33] and prison workers [34]. Analysis of correlation of satisfaction, motivation, performance of subordinates in terms of leadership style, transactional or transformational, [35] [36] lead to similar results in both surveys. The transformational leadership has a strong positive correlation with job satisfaction of subordinates, satisfaction with the leader, and the motivation of followers, but weaker correlation with organizational performance. It seems that transformational leadership positively affects performance, whether performance is outlined in a way that others in the organizational unit (for example, subordinates, superiors) understand it as performance. The critical element is to understand the process, how transformational leaders affect the followers and the performance of the unit.
Transformational versus transactional leadership
According to Stephen Covey [37], transactional leadership is a traditional model of leadership, whose roots are in the organizational or business perspective and concentrate on the "bottom line", while transformational leadership focuses on the "top line". The chart below presents a comparison between transactional and transformational leadership:
Table 1 Comparison between transactional and transformational leadership
Transactional leadership Transformational leadership
It is based on the need of the person to do the job and earn
It is based on the need of the person to obtain knowledge
Preoccupied with power and position, policies and benefits
Preoccupied with the goals, values, moral and ethics
Focused on everyday problems It goes beyond everyday problems
Short term and focused on facts Is oriented towards long-term goals without compromising human values and principles
Focus on tactical issues Focused on missions and strategies
Relies on human relations Liberates human potential through identifying and developing new talent
Follows and fulfills expectations trying to work effectively in current systems
Design and redesign jobs to make them meaningful and challenging
Supports structures and systems that enhance the result, maximize performance and ensure short-term profit
Supports internal structures and systems to reinforce the values and goals

128 Proceedings of International Conference for Entrepreneurship, Innovation and Regional Development
ICEIRD 2014
Transformational leadership aims to transform people and organizations in terms of change in mind and heart, to boost vision, views and understanding, to clarify goals. Transformational leadership is a process in which leaders are trying to raise awareness of colleagues about what is true and important, to increase their motivational maturity and to motivate coworkers to overcome self-interest for the good of the group, organization and society. Such leaders believe that the achieved target exceeds the exchange of rewards for efforts made. Transformative leaders are proactive (initiative and responsible) in many different and unique ways. These leaders are trying to optimize the development, not just performance. The development includes maturation of ability, motivation, attitudes and values. Such leaders want to raise the level of maturity of the needs of their employees. According Sergiovanni [38] transformational leadership is able to trigger the ability for members of the organization to understand the vision and achieve their goals. He adds that it is a moral dimension of leadership that allows the creation of shared values agreement, commitment and vision that can move members to develop effective and successful organization. Transformational leadership is expansion of transactional that crosses the boundary of a simple exchange and agreement.
3. Research methodology and data analysis
The research was conducted in the Republic of Macedonia. Companies from different industries and governmental institutions were participants in the study. The number of the participants in the research is 133 and they are employed on leading positions in private and public sector. The research was based on quantitative approach and questionnaire is used as data collection method with anonymous participation. In the first part of the questionnaire, respondents entered basic personal data and information about their work experience and the company or organization they work for. The second part of the questionnaire, i.e. the first 60 questions analyzed leadership styles of the participants. The questions from number 1 to number 39 define the first categorization, i.e. style1 in which the respondents practice autocratic, democratic or laissez fair leadership. Each leadership competence is described or explored by three questions with 5 levels Likert scale: never, rarely, sometimes, often and always as offered answers. In the following 21 questions, MLQ (Multifactor Leadership Questionnaire) questionnaire is used, in order to define other categorization of the leadership style – style2, i.e. whether the participant practice transformational, transactional or laidback leadership style. The structure of the questions and the offered answers are the same as previously described. The analysis of questionnaire data entry and their processing was performed with SPSS program for statistical data processing. The processing of the general data of the participants resulted in the following information. Fifty one point thirteen percent of the participants in the research are employed in the public and 48.87% in the private sector while 9.02% have up to 10 and 90.23% more that 10 years working experience. Twelve point seventy eight percent of the participants have PhD degree, 39.1% are masters of science, 45.86% have university degree and the rest 2.26% have secondary education. The participants’ age structure is the following: up to 35 year are 9.02%, between 35 and 45 are 51.88% and more than 45 have 39.10% of the participants. Sixty nine point seventeen percent are male and the rest 30.83% female. Seventy seven point forty four percent of the participants follow democratic leadership style, 15.79% autocratic while 6.77% laissez faire style. The major part of the participants, i.e. 69.12% practice transactional leadership style, 24.81% laidback, while 6.02% transformational style. The companies for which the participants in the research work are present on local, regional and/or global international markets.
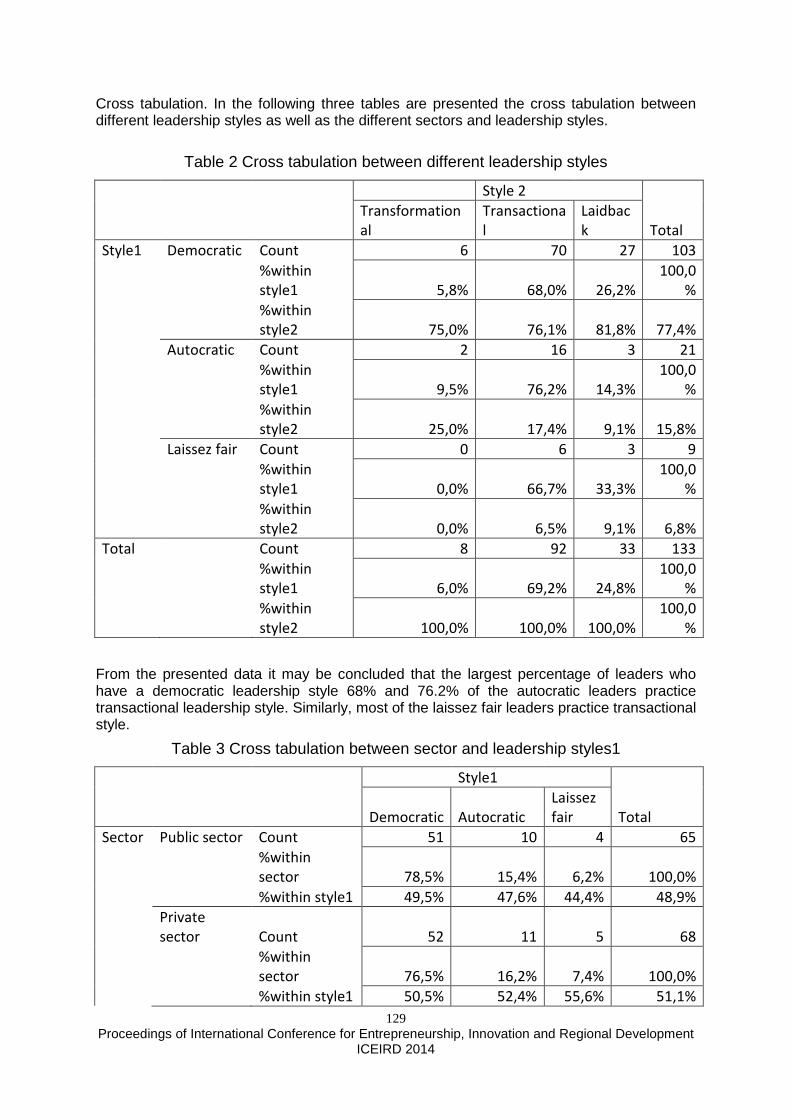
129 Proceedings of International Conference for Entrepreneurship, Innovation and Regional Development
ICEIRD 2014
Cross tabulation. In the following three tables are presented the cross tabulation between different leadership styles as well as the different sectors and leadership styles.
Table 2 Cross tabulation between different leadership styles
Style 2
Transformation
al
Transactiona
l
Laidbac
k Total
Style1 Democratic Count 6 70 27 103
%within
style1 5,8% 68,0% 26,2%
100,0
%
%within
style2 75,0% 76,1% 81,8% 77,4%
Autocratic Count 2 16 3 21
%within
style1 9,5% 76,2% 14,3%
100,0
%
%within
style2 25,0% 17,4% 9,1% 15,8%
Laissez fair Count 0 6 3 9
%within
style1 0,0% 66,7% 33,3%
100,0
%
%within
style2 0,0% 6,5% 9,1% 6,8%
Total Count 8 92 33 133
%within
style1 6,0% 69,2% 24,8%
100,0
%
%within
style2 100,0% 100,0% 100,0%
100,0
%
From the presented data it may be concluded that the largest percentage of leaders who have a democratic leadership style 68% and 76.2% of the autocratic leaders practice transactional leadership style. Similarly, most of the laissez fair leaders practice transactional style.
Table 3 Cross tabulation between sector and leadership styles1
Style1
Democratic Autocratic
Laissez
fair Total
Sector Public sector Count 51 10 4 65
%within
sector 78,5% 15,4% 6,2% 100,0%
%within style1 49,5% 47,6% 44,4% 48,9%
Private
sector Count 52 11 5 68
%within
sector 76,5% 16,2% 7,4% 100,0%
%within style1 50,5% 52,4% 55,6% 51,1%

130 Proceedings of International Conference for Entrepreneurship, Innovation and Regional Development
ICEIRD 2014
Total Count 103 21 9 133
%within
sector 77,4% 15,8% 6,8% 100,0%
%within style1 100,0% 100,0% 100,0% 100,0%
From the above presented data it can be concluded that in Macedonia in the public as well as in the private sector democratic style of management is prevailing with 78.5% i.e. 76.5% coverage, followed by autocratic style with presence of 15.4% in the public sector and 16.2% in the private sector. With negligible representation is laissez fair style present.
From Table 4 can be noted that in the two sectors, in public sector with 67.7% and in the private with 70.6% the transactional style is dominant. The second would be laidback with presence of 26.2% and 23.5% in public and private sector respectively, followed by transformational style that the public sector is represented by 6.2% and in private with 5.9 %.
Table 4 Cross tabulation between sector and leadership styles2
Style2
Transformation
al
Transactiona
l
Laidbac
k Total
Sector
Public
sector Count 4 44 17 65
%within
sector 6,2% 67,7% 26,2%
100,0
%
%within
style2 50,0% 47,8% 51,5% 48,9%
Private
sector Count 4 48 16 68
%within
sector 5,9% 70,6% 23,5%
100,0
%
%within
style2 50,0% 52,2% 48,5% 51,1%
Total Count 8 92 33 133
%within
sector 6,0% 69,2% 24,8%
100,0
%
%within
style2 100,0% 100,0% 100,0%
100,0
%
Further data analysis provides the following information. The comparison of the working experience and the leadership style, shows that most leaders practice democratic style. Eighty three point three percent of the leaders with 5 to 10 years experience practice democratic leadership style and only 16.7% autocratic. For leaders with over 10 years experience the distribution is similar. In 77.5% democratic style is evidenced, 15.8% are characterized by autocratic style, and only 6.7% have laissez fair style. Cross tabulation between working experience and leadership style2 evidence the dominance of the transactional style. For leaders with experience of 5 to 10 years transactional style is represented by 91.7%, while among leaders with experience over 10 years with 66.7%. For leaders with over 10 years experience there is a significant portion (26.7%) of prevalence of laidback style.

131 Proceedings of International Conference for Entrepreneurship, Innovation and Regional Development
ICEIRD 2014
From cross tabulation between gender and leadership style can be concluded that the most common is democratic style with 75% of males and 82.9% females. Regarding cross tabulation between gender and style2 the majority practice transactional style with 66.3% for males and 75.6% females. In males a significant percentage 29.3% practice laidback style, while in females the percentage is significantly lower 14.6%.
4. Conclusion
From the previously presented data, it can be concluded that leaders from the public and private sector largely involve subordinates in decision making. Further, an important trait for leaders from the public and private sectors is a high level of two-way communication with their subordinates. Additionally, it is evident the absence of transformational leadership style in both sectors. This leads to the identification of the area for improvement and broadening of the leadership capacities on a higher level with a focus on a long term objectives, vision, strategies, and values with maximal usage of human knowledge and potential. Finally, the distribution of different leadership styles among the sectors is very similar therefore migration of the leaders from private to public sector and vice versa is expected to go smoothly without significant changes in the leadership styles. [39]
References
1. PAUK WRIGHT, “LEADERSHIP AND THE NEW SCIENCE”, SAN FRANCISCO: BERRET-KOEHLER PUBLISHERS, INC, 1996
2. RICHARD M. STEERS, LYMN PORTER, & GREGORY BIGLEY, “MOTIVATION AND LEADERSHIP AT WORK”, NEW YORK: MCGRAW-HILL COMPANIES, INC, 1996
3. PHILIP SADLER , “LEADERSHIP”, KOGAN PAGE LIMITED, 2003 4. KURT LEWIN AND INCLUDED RON LIPPITT AND ROBERT WHITE, " PATTERNS OF AGGRESSIVE BEHAVIOR IN
EXPERIMENTALLY CREATED SOCIAL CLIMATES", JOURNAL OF SOCIAL PSYCHOLOGY, 1938 5. James MacGregor Burns, „Transforming Leadership”, Groove Press, 2003 6. Bernard M. Bass, Ronald E. Riggio, “Transformational Leadership”, Second Edition, Center for
Leadership Studies Binghamton University, LAWRENCE ERLBAUM ASSOCIATES PUBLISHERS, 2006
7. Bernard M. Bass, “Leadership and performance beyond expectations”, New York: Free Pres, 1985 8. Boyd, J. T., Jr. “Leadership extraordinary: A cross-national military perspective on transactional
versus transformational leadership”. Unpublished doctoral dissertation, Nova University, 1988 9. Gordon J. Curphy, “An empirical investigation of the effects of transformational and transactional
leadership on organizational climate, attrition and performance”, 1992. In Kenneth E. Clark, Miriam B. Clark, David P. Campbell , “Impact of leadership”, Center for Creative Leadership, 1992
10. Longshore, J. M. “The associative relationship between transformational and transactional leadership styles and group productivity”, Unpublished doctoral dissertation, Nova University, 1988
11. O’Keeffe, M. J. “The effects of leadership style on the perceived effectiveness and satisfaction of selected Army officers”, Unpublished doctoral dissertation, Temple University, 1989
12. Francis J. Yammarino & Bernard M. Bass, “Long-term forecasting of transformational leadership and its effects among naval officers: Some preliminary findings. In Kenneth E. Clark, Miriam B. Clark, “Measures of leadership”, Center for Creative Leadership, 1990
13. Bruce J. Avolio & Francis J. Yammarino, “Transformational and charismatic leadership: The road ahead”, Boston: JAI., 2002
14. Jane M. Howell, & Bruce J. Avolio, “Transformational leadership, transactional leadership, locus of control, and support for innovation: Key predictors of consolidated business-unit performance”, Journal of Applied Psychology, 1993
15. Peter Bycio, Rick D. Hackett & Joyce S. Allen, “Further assessments of Bass’s (1985) conceptualization of transactional and transformational leadership”, Journal of Applied Psychology, 1995
16. Bruce J. Avolio, Bernard M. Bass & Dong I. Jung, “Replicated confi rmatory factor analyses of the Multifactor Leadership Questionnaire”, Center for Leadership Studies, Binghamton University, 1997

132 Proceedings of International Conference for Entrepreneurship, Innovation and Regional Development
ICEIRD 2014
17. Rolland LeBrasseur, Robert Whissell & Abhoy Ojha, “Organisational learning, transformational leadership and implementation of continuous quality improvement in Canadian hospitals”, Australian Journal of Management, 27, 141–162, 2002
18. Joseph Seltzer & Bernard M. Bass, “Transformational leadership: Beyond initiation and consideration”, Journal of Management, 16, 693–703., 1990
19. Detelin S. Elenkov, “Effects of leadership on organizational performance in Russian companies”, Journal of Business Research, 55, 467–480, 2002
20. Dong I. Jung & John J. Sosik, “Transformational leadership in work groups: The role of empowerment, cohesiveness, and collective-effi cacy on perceived group performance”, Small Group Research, 33, 313–336, 2002
21. Ming S. Singer, “Transformational vs. transactional leadership: A study of New Zealand company managers”, Psychological Reports, 1985
22. Bernard M. Bass, Bruce J. Avolio, Dong I. Jung & Yair Berson, “Predicting unit performance by assessing transformational and transactional leadership”, Journal of Applied Psychology, 88, 207–218, 2003
23. Masi, R. J., & Robert A. Cooke, “Effects of transformational leadership on subordinate motivation, empowering norms, and organizational productivity”, International Journal of Organizational Analysis, 2000
24. Hater, J. J., & Bernard M. Bass, “Superiors’ evaluations and subordinates’ perceptions of transformational and transactional leadership”, Journal of Applied Psychology, 1988
25. Francis J. Yammarino & Alan J. Dubinsky, “Transformational leadership theory: Using levels of analysis to determine boundary conditions”, Personnel Psychology, 47, 787–811, 1994
26. Jerry C. Wofford, James L. Whittington, & Vicky L. Goodwin, “Follower motive patterns as situational moderators for transformational leadership effectiveness”, Journal of Managerial Issues, 2001
27. Steve Harvey Martin Royal & Dale Stout, “Instructor’s transformational leadership: University student attitudes and ratings”, Psychological Reports, 2003
28. Mary L. Tucker, Bernard M. Bass & Daniel, L. G., “Transformational leadership’s impact on higher education: Satisfaction, effectiveness, and extra effort”. In Kenneth E. Clark, Miriam B. Clark, “Measures of leadership”, Center for Creative Leadership, 1990
29. Ronald E. Riggio, Bernard M. Bass, & Smith S. Orr, “Transformational leadership in nonprofit organizations”. In Ronald E. Riggio & Smith S. Orr, “Improving leadership in nonprofit organizations” Jossey-Bass, 2004
30. Marvin A. Jolson, Alan J. Dubinsky, & Francis J. Yammarino & Lucette B. Comer, “Transforming the salesforce with leadership”, Sloan Management Review, 1993
31. Zvi D. Gellis, “Social work perceptions of transformational and transactional leadership in health care”, Social Work Research, 2001
32. Nancy R. Hoover, Joseph M. Petrosko & Robert R. Schulz, “Transformational and transactional leadership: An empirical test of a theory”, American Educational Research Association, 1991
33. Danielle Charbonneau, Julian Barling & Kevin E. Kelloway, “Transformational leadership and sports performance: The mediating role of intrinsic motivation”, Journal of Applied Social Psychology, 2001
34. Cyndi L. Walters, “Leadership in maximum/close custody prison settings”, Unpublished doctoral dissertation, Gonzaga University, 1998
35. Uldaricio Rex Dumdum, Kevin B. Lowe and Bruce J. Avolio, “A Meta-Analysis of Transformational and Transactional Leadership Correlates of Effectiveness and Satisfaction: An Update and Extension”, 2002
36. Timothy A. Judge & Ronald F. Piccolo, “Transformational and transactional leadership: A meta-analytic test of their relative validity”, Journal of Applied Psychology, 2004
37. Stephen Covey, „Principle-Centred Leadership”, RosettaBooks, 2009 38. Thomas J. Sergiovanni, “Adding value to leadership gets extraordinary results”, Educational
Leadership, 1990 39. G. Stojkov: “Comparison of leadership competencies and management styles of the managers in
public and private sector” (PhD thesis - unpublished work), Faculty of Mechanical Engineering, Ss. Cyril and Methodius University, Skopje, 2014

133 Proceedings of International Conference for Entrepreneurship, Innovation and Regional Development
ICEIRD 2014
The Impact of Student’s Entrepreneurship Education on Self-employment and Business Start-up Intentions: Research Results from Serbia
Srđan Bogetić1, Dejan Đorđević2, Dragan Ćoćkalo3 1Belgrade Business School, Kraljice Marije 73, Belgrade, Republic of Serbia, [email protected]
2University of Novi Sad, Technical Faculty „Mihajlo Pupin“, Đure Đakovića bb, Zrenjanin, Republic of Serbia, [email protected]
3University of Novi Sad, Technical Faculty „Mihajlo Pupin“, Đure Đakovića bb, Zrenjanin, Republic of Serbia, [email protected]
In this paper authors presents findings of the rese arch conducted among students in the Republic of Serbia in the 2010–2013 period, dea ling with student’s entrepreneurship, self-employment and business star t-up intentions. Research has included a total of nearly 2.800 examinees. The pop ulation is built on students from four universities and business schools directed tow ards business and management. The research has been conducted using a structured questionnaire. Most of the respondents, as the survey shows, is ready to join the entrepreneurial process. As reasons for not starting up business the respondent s give two statements most frequently: “insufficient financial means”, “insecu re political and economic situation”. In order to improve the quality of business and to start and manage one's own company certain knowledge is necessary and that sho uld be provided to youth whether through formal or informal forms of educati on. According to the results of this research, respondents most frequently cite thr ee fields in which they lack the appropriate knowledge for starting and managing the ir own business: elements of entrepreneurship and small business, elements of fi nance and accounting, and foreign languages. Unstable political and economica l situation, poor financial support to economy and too high taxes have been repeated fo r years which points at the lack of state’s readiness to solve these problems. Thats point out the fact that the state must have the key role in this sphere of Serbian ma rket through a creation of certain documents whose aim is promoting the concept of the young as entrepreneurs. A research of this scope has so far not been conducte d on the territory of the Republic of Serbia, and to the best of the authors’ knowledg e not even in the West Balkans region.
Keywords Young entrepreneurs, Entrepreneurship Education, Self-employment, Start-up intentions, Serbia.
1. Introduction
Entrepreneurship is one of the leading promoters of economic development and creation of new working places through starting new companies, working places, opening of new

134 Proceedings of International Conference for Entrepreneurship, Innovation and Regional Development
ICEIRD 2014
markets. Entrepreneurship, in educative meaning, represents a source of new skills, knowledge, experiences and possibilities. Entrepreneurship is especially emphasized in current conditions of global economic crisis which has caused great unemployment on the global level where entrepreneurship is observed as one of the ways for its reducing. First of all, it is related to young population – according to official statistics, we can notice the highest rate of unemployment. The problem of youth unemployment is a complex field but it is limited by several factors which make an appropriate ambience for their encouraging. They are: • Existence of appropriate programs for encouraging entrepreneurship of the young; • Existence of institutions for support of the young for starting their own business; • Existence of financial support to the young for business start-up; • Promotion of entrepreneurship of young people; • Creation of legal framework for youth entrepreneurship. Special attention is paid to achieving knowledge from the field of entrepreneurship of the young with the aim of their professional training. There is a great number of previous studies dealing with motivation [1], intentions [2] – elements which influence enterprising behaviour and starting-up business in different ways [3, 4, 5], in other words, enterprising behaviour of the young, students [5] and self-employment [6]. Particularly interesting dimension of researching enterprising behaviour of the young makes the studies whose focus is on [7]: self-employed parents – self-employed children. This trend is expanding, concerning time (historical) and space (geographical) dimensions. In the past ten years researches emphasize: • Creative and cognitive potentials which students achieve within institutional system, in
other words, focus on group of problems which students of different professional orientation have, [8].
• Motivation and models of entrepreneurship motivation for the intention of becoming entrepreneurs, [9].
• General attitudes, intentions and environment – themes of enterprising behavior, first of all, of young population, motivation, attitudes and intentions in interaction with the environment and education for entrepreneurship are obviously interesting topics to researchers all over the world; in this way, limited or cross-geographical/cross-cultural compared results give to these themes global character, [10, 11, 12, 13, 14, 15].
2. Youth unemployment – the EU and countries of the former Yugoslavia
The economic crisis is having an exceptionally severe impact on young people. According to data obtained from EU Commission [16, 17], the EU youth unemployment rate stood at 23.6 % in January 2013, more than twice as high as the adult rate. By the end of 2012, the rate of youth unemployment across the EU had risen from 22.6% in March to 23.4% (table 1). In the second quarter of 2012, 12.6% of youth were neither in employment nor in education or training, which is 2.3% higher than four years previously; 7.5 million Europeans aged 15-24 are neither in employment nor in education or training

135 Proceedings of International Conference for Entrepreneurship, Innovation and Regional Development
ICEIRD 2014
Table 1 Youth unemployment rates in most endangered counties, members of EU* [16]
Youth unemployment rate (in %) Number of young people
unemployed (in thousands) Mart 2012 Decembar 2012* Mart 2012 Decembar 2012**
Greece (EL) 52,2 59,4 161 186 Spain (ES) 51,2 55,6 931 957 Portugal (PT) 36 38,3 153 174 Italy (IT) 35,1 36,6 587 610 Slovakia (SK) 32,6 35,9 71 85 Ireland (IE) 31 30,2 70 68 Latvia (LV) 29,2 31,7 29 32 Lithuania (LT) 27,9 23,6 33 31
* Seasonally adjusted, based on the Labour Force Survey and census data ** Based on November data for EE and HU; October data for EL, LV, RO and UK
Unemployment represents one of the greatest problems in Serbia. Official statistics shows permanent increase of unemployment. According to the Statistical Office of the Republic of Serbia [18] in 2012 there were 701,138 unemployed people (310,123 women), and the total unemployment rate was the highest since 2000 and stood at 23.9% (Figure 1). Figure 2 presents the total unemployment rate for all the countries of the former Yugoslavia for the period 2009-2012. Compared to other countries, Macedonia has the highest total unemployment rate, Slovenia the lowest, while Serbia has the highest growth of total unemployment rate for this period (+7.8%).
Figure 1 Unemployed population aged 15 and over with total unemployment rate for the period 2000-
2012, Serbia [18]

136 Proceedings of International Conference for Entrepreneurship, Innovation and Regional Development
ICEIRD 2014
Figure 2 Total unemployment rate (in %) for all the countries of the former Yugoslavia in period 2009-
2012. (based on Labour Force Survey)
3. Research Methodology
The results of research which dealt with the analysis of attitudes of young people related to their involvement in entrepreneurial process as well as with their comprehension about success of business practice in Serbian companies, represented opinions of future experts and executives. The research in this form was being carried out for three years in a row (2010-2013) on the territory of Republic of Serbia in 16 towns and municipalities – Beograd, Bačka Palanka, Novi Sad, Subotica, Požarevac, Kragujevac, Šabac, Kraljevo, Čačak, Ivanjica, Sremska Mitrovica, Paraćin, Zrenjanin, Alibunar, Niš and Jagodina, during November and December. The survey is carried out by questionnaire. The population is built of students from four universities and business schools. It includes totally 2.796 students directed towards business and management. The average age of examinees is about 22 years. Around 38% men and 62% women participate in the sample. The research from 2013 was the most extensive and it involved 806 students. The research was based on the following initial assumptions: • Students in Serbia want to go into private business but: they do not have appropriate
knowledge and skills, they are suspicious that conditions and quality level are not good enough in private companies, they are not confident considering the ambience of work.
• Students accept the possibility of doing private business but they are aware of economic situation in which they live.
• Some skills and knowledge should be encouraged so the students could start and manage their own business successfully.
• The state is a key factor in providing ambience and support for business start-up.
4. Results
4.1 Preview of the results
Total data show that there are differences in frequency of answers given to the question “Would you start-up your own business?”. Respondents chose the answer “yes” more frequently (near 76%) – table 2. According to sex, male respondents were more willing (78.0%) to start-up their business than female respondents (73.9%). Considering their
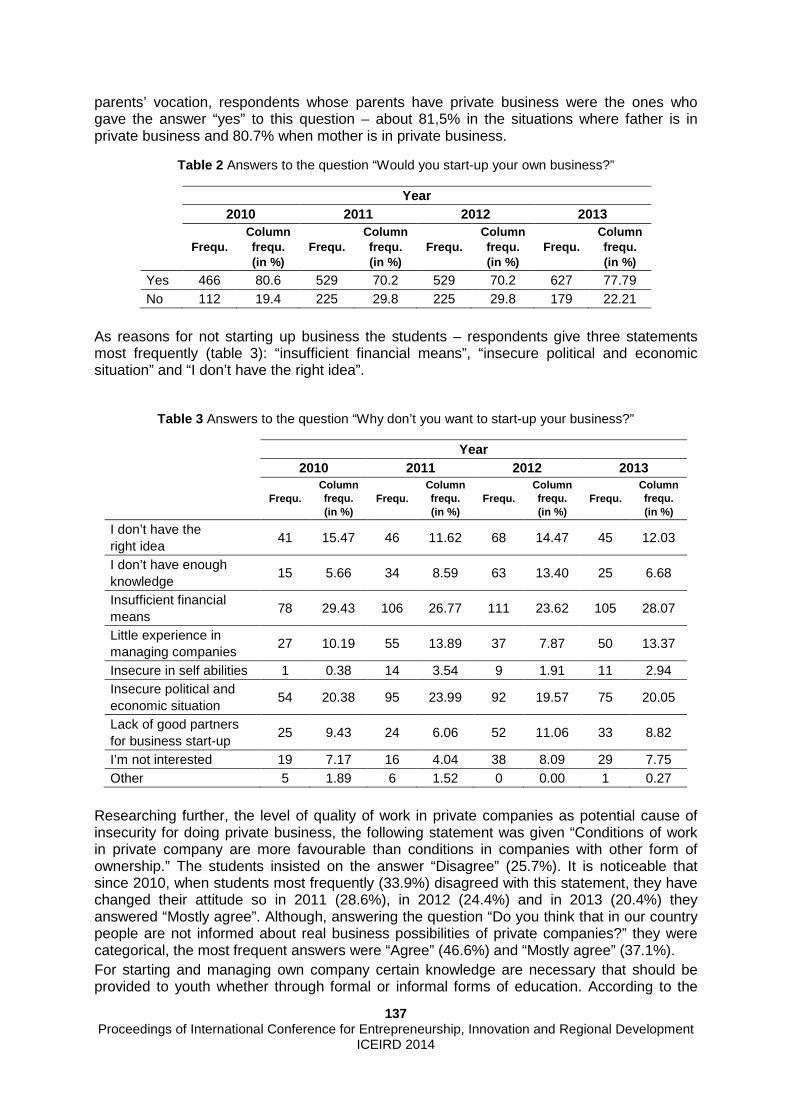
137 Proceedings of International Conference for Entrepreneurship, Innovation and Regional Development
ICEIRD 2014
parents’ vocation, respondents whose parents have private business were the ones who gave the answer “yes” to this question – about 81,5% in the situations where father is in private business and 80.7% when mother is in private business.
Table 2 Answers to the question “Would you start-up your own business?”
Year 2010 2011 2012 2013
Frequ. Column frequ. (in %)
Frequ. Column frequ. (in %)
Frequ. Column frequ. (in %)
Frequ. Column frequ. (in %)
Yes 466 80.6 529 70.2 529 70.2 627 77.79 No 112 19.4 225 29.8 225 29.8 179 22.21
As reasons for not starting up business the students – respondents give three statements most frequently (table 3): “insufficient financial means”, “insecure political and economic situation” and “I don’t have the right idea”.
Table 3 Answers to the question “Why don’t you want to start-up your business?”
Year 2010 2011 2012 2013
Frequ. Column frequ. (in %)
Frequ. Column frequ. (in %)
Frequ. Column frequ. (in %)
Frequ. Column frequ. (in %)
I don’t have the right idea
41 15.47 46 11.62 68 14.47 45 12.03
I don’t have enough knowledge
15 5.66 34 8.59 63 13.40 25 6.68
Insufficient financial means
78 29.43 106 26.77 111 23.62 105 28.07
Little experience in managing companies
27 10.19 55 13.89 37 7.87 50 13.37
Insecure in self abilities 1 0.38 14 3.54 9 1.91 11 2.94 Insecure political and economic situation
54 20.38 95 23.99 92 19.57 75 20.05
Lack of good partners for business start-up
25 9.43 24 6.06 52 11.06 33 8.82
I’m not interested 19 7.17 16 4.04 38 8.09 29 7.75 Other 5 1.89 6 1.52 0 0.00 1 0.27
Researching further, the level of quality of work in private companies as potential cause of insecurity for doing private business, the following statement was given “Conditions of work in private company are more favourable than conditions in companies with other form of ownership.” The students insisted on the answer “Disagree” (25.7%). It is noticeable that since 2010, when students most frequently (33.9%) disagreed with this statement, they have changed their attitude so in 2011 (28.6%), in 2012 (24.4%) and in 2013 (20.4%) they answered “Mostly agree”. Although, answering the question “Do you think that in our country people are not informed about real business possibilities of private companies?” they were categorical, the most frequent answers were “Agree” (46.6%) and “Mostly agree” (37.1%). For starting and managing own company certain knowledge are necessary that should be provided to youth whether through formal or informal forms of education. According to the

138 Proceedings of International Conference for Entrepreneurship, Innovation and Regional Development
ICEIRD 2014
results of this research, students-respondents state most frequently three fields in which they lack appropriate knowledge for starting and managing their own business (table 4): elements of entrepreneurship and small business, elements of finance and accounting and foreign languages.
Table 4. Answers to the question “What knowledge do you need for successful managing your own business?”
Year 2010 2011 2012 2013
Frequ. Column frequ. (in %)
Frequ. Column frequ. (in %)
Frequ. Column frequ. (in %)
Frequ. Column frequ. (in %)
Elements of management 60 9.06 132 14.80 123 11.26 79 8.10 Elements of marketing 52 7.85 99 11.10 120 10.99 65 6.67 Elements of entrepreneurship and small business
153 23.11 202 22.65 217 19.87 248 25.44
Elements of finance and accounting
142 21.45 172 19.28 184 16.85 199 20.41
Computer literacy 27 4.08 20 2.24 78 7.14 30 3.08
Foreign languages 143 21.60 160 17.94 251 22.99 220 22.56 Business communication 58 8.76 79 8.86 114 10.44 130 13.33 Other 27 4.08 28 3.14 5 0.46 4 0.41
Ambience which the state should provide in order to stimulate young entrepreneurs to start-up their business and manage it qualitatively represents a union of several elements among the most influential are: political and economic situation, legislation, organized market, tax policy, promotion of entrepreneurship and education for entrepreneurship. The results of the research show that for the time being there is no ambience appropriate for stimulating business start-up – 85.9 percents of the respondents said so. The most frequent obstacles for this are (table 5): lack of financial means, unstable political and economical situation and too high taxes.
Table 5 Answers to the question “What are the biggest obstacles for business start-up? (circle up to three answers)”
Year 2010 2011 2012 2013
Frequ. Column frequ. (in %)
Frequ. Column frequ. (in %)
Frequ. Column frequ. (in %)
Frequ. Column frequ. (in %)
Lack of financial means 321 32.26 424 31.59 407 30.08 593 28.51 Limited market 103 10.35 123 9.17 177 13.08 154 7.40 Unstable political and economic situation
296 29.75 388 28.91 401 29.64 641 30.82
Disloyal competition 66 6.63 84 6.26 119 8.80 139 6.68 Too high taxes 202 20.30 319 23.77 247 18.26 549 26.39 Other 7 0.70 4 0.30 2 0.15 4 0.19
Interviewed students mostly think (65.1%) that entrepreneur must rely on own financial means in business start-up. The reason may be the consequence of inadequate confidence in banks and other institutions which offer financial means for start-ups. The attitude of

139 Proceedings of International Conference for Entrepreneurship, Innovation and Regional Development
ICEIRD 2014
students supports this, namely (58.8%) of the interviewed said that start-up loans of commercial banks are not favourable, because they are loaded by high interest rates and long process for getting the means (table 6).
Table 6 Answers to the question “Why do you think that start-up loans of commercial banks aren’t favourable for young people?”
Year 2010 2011 2012 2013
Frequ. Column frequ. (in %)
Frequ. Column frequ. (in %)
Frequ. Column frequ. (in %)
Frequ. Column frequ. (in %)
High interest rates 236 48.07 320 42.38 322 45.10 398 48.83 Inappropriate instruments of securing loans
72 14.66 142 18.81 120 16.81 132 16.20
Big administration 75 15.27 156 20.66 126 17.65 141 17.30 Long process for getting financial means 91 18.53 116 15.36 139 19.47 129 15.83
Other 17 3.46 21 2.78 7 0.98 15 1.84 These indices point at inadequate policy of the state towards youth as potential entrepreneurs and the private entrepreneurship itself. Unstable political and economical situation, poor financial support to economy and too high taxes have been repeated for years which points at the lack of state’s readiness to solve these problems. These unsolved problems influence the existence of appropriate ambience for business start-up. Tax policy represents one of the greatest problems not only for those who want to start-up their own business but also for those who have been working in it for years. Associations of entrepreneurs have expressed certain remarks related to the work of tax administration and negative influence of some taxes on normal functioning of companies especially SMEs but, unfortunately, these problems are still present. In addition, there are no specialized institutions which support youth to start-up their own business, so there are many reasons for unsatisfaction with entrepreneurial ambience. Without appropriate encouraging ambience it is not possible to direct young people towards entrepreneurial behaviour seriously. The greatest number of interviewed, even 89.4%, think that the state must have key role in stimulating youth for business start-up. Respondents emphasize the following stimulatng measures which should be taken by the state (table 7, on the next page): favourable loans, education and laws/regulations related to youth as entrepreneurs.
4.2 Discussion of the results
For successful economic recovery of Serbian economy the priority is stable political and economic situation which would contribute to more secure business performance and also positive signal for birth of new companies. Unfortunately, there are lots of monopolistic and privileged companies which additionally discourages other companies to improve competition on Serbian market. Lack of financial means is an old problem not only for Serbian companies but also for companies in developed countries and EU as well. However, the solution may be found in more favourable offer of current loans and in encouragement of youth to team with others and in that way provide bigger financial means. For successful managing of companies knowledge is necessary, whether achieved in formal or informal education. In the Table 7 three fields which youth lack for managing their own business are presented: elements of entrepreneurship and small business, elements of finance and accounting and foreign languages. The first two fields point at the fact that at faculties and in school system in general students should be more concretely presented

140 Proceedings of International Conference for Entrepreneurship, Innovation and Regional Development
ICEIRD 2014
knowledge from this field. It means that they should achieve skills through practical work. The same is also valid for use of foreign languages which, beside information literacy, represent the basic condition for work in modern business.
Table 7 Answers to the question “How the state should have key role in stimulating youth to start-up business?”
Year 2010 2011 2012 2013
Frequ. Column frequ. (in %)
Frequ. Column frequ. (in %)
Frequ. Column frequ. (in %)
Frequ. Column frequ. (in %)
Favourable loans 343 28.70 399 27.67 364 25.33 553 25.80
Education 231 19.33 277 19.21 313 21.78 503 23.47
Laws/regulations related to youth as entrepreneurs
187 15.65 233 16.16 219 15.24 424 19.79
Development of new businesscentres and incubators
125 10.46 137 9.50 153 10.65 139 6.49
Regulation of market 146 12.22 185 12.83 195 13.57 238 11.11
Promotion of the concept of youth as entrepreneurs
158 13.22 204 14.15 189 13.15 281 13.11
Other 5 0.42 7 0.49 4 0.28 5 0.23
It can be concluded from everything said before that young people still do not have enough self-confidence for business start-up. There are lots of reasons for that and one of them is education of youth from the field of entrepreneurship. Current situation is unsatisfactory and new ways for education and promotion of entrepreneurship should be found. Young people in Serbia have a wish but they are not trained enough for developing entreneurial initiative and business start-up. Another reason for their lack of self-confidence is inappropriate ambience for encouraging entrepreneurship of youth.
5. Conclusions
Unemployment is a consequence of global economic crisis and it represents one of the most serious economic problems for every government. Young people are one of the most endangered age categories hit by economic crisis. European Commission, in the program Europe 2020, as one of economic priorities represents reducing unemployment of youth and also their encouragement for entrepreneurship and business start-up. In relation to this it has started certain programs for support of youth with the aim of achieving entrepreneurial knowledge and its practical use. Beside insufficient competitiveness of its economy, poor productivity and low technological level Republic of Serbia has high unemployment rate which represents one of the biggest economic problems. Young people in Serbia have problems to find job and according to National Employment Service statistics this trend is increasing especially related to youth. The issue of entrepreneurship is mentioned but more through individual activities of some NGO than through state institutions. Inspite of longlasting talking about youth and their problems relating to their involvement in business there is still inappropriate ambience for their realization. The research "Analysis of attitudes of the young in relation to own business start-up by implementation of corporative responsible business and improving company’s

141 Proceedings of International Conference for Entrepreneurship, Innovation and Regional Development
ICEIRD 2014
competitiveness" which was realized from 2010-2013 on the territory of Republic of Serbia proved several facts that have to be taken into account if we want to encourage the young towards entrepreneurship: • young people want to start-up their own business; • lack of financial means and unstable political and economic situation represent the
reasons for preventing young people from business start-up; • lack of financial means, unstable political and economic situation as well as bad tax
policy distract young people from business start-up; • young people think that education is necessary for improving their entrepreneurial
knowledge; • absence of appropriate ambience for business start-up and • key role of state in creating business ambience. The following state institutions have significant role in creating business ambience: Ministry of Education, Science and Technological Development, Ministry of Finance and Economy, Ministry of Sports and Youth, National Agency for Regional Development, SIEPA. Professional associations also have an important role: Association of entrepreneurs, Serbian Chamber of Commerce, Belgrade Chamber of Commerce, Association of Small and Middle enterprises and entrepreneurs of Republic of Serbia, state and private universities, NGO, international organizations. They all have to contribute to making more efficient system for encouraging young people for business start-up and for improving their entrepreneurial knowledge that will improve quality of business performance.
References
1 Scheinberg S, MacMillan I, editors. An eleven country study of the motivations to start a business. Frontiers of entrepreneurship research; 1988: Wellesley, MA: Babson College.
2 Crant MJ. The proactive personality scale as a predictor of entrepreneurial intentions. Journal of Small Business Management. 1996;34(3):42–9.
3 Gartner WB. Who is an entrepreneur? Is the Wrong Question. American Journal of Small Business. 1988;12:11–22.
4 Scherer RF, Brodzinski JD. Entrepreneur career selection and gender: A socialization approach. Journal of Small Business Management. 1990;28(1):37–44.
5 Johannisson B, Landström H, Rosenberg J. University training for entrepreneurship – an action frame of reference. European Journal of Engineering Education. 1998;23(4):477-96.
6 Kolvereid L. Organizational employment versus self-employment: Reasons for career choice intentions. Entrepreneurship: Theory and Practice. 1996;20(3):23–31.
7 Aldrich HE, Renzulli LA, Langton N. Passing on privilege : resources provided by self-employed parents to their self-employed children. Research in social stratification and mobility: the official journal of the ISA RC28 on Social Stratification and Mobility. 1998;16:291-317.
8 Berglund H, Wennberg K. Creativity among entrepreneurship students: comparing engineering and business education. Int J Cont Engineering Education and Lifelong Learning. 2006;16(5):365-79.
9 Segal G, Borgia D, Schoenfeld J. The motivation to become an entrepreneur. International Journal of Entrepreneurial Behaviour & Research. 2005;11(1):42 - 57.
10 Franke N, Lüthje C. Entrepreneurial Intentions of Business Students: A Benchmarking Study. International Journal of Innovation and Technology Management. 2004;1(3):269-88.
11 Bhandari NC. Intention for Entrepreneurship among Students in India. Journal of Entrepreneurship. 2006;15(2):169-79.
12 Harris ML, Gibson SG. Examining the entrepreneurial attitudes of US business students. Education + Training. 2008;50(7):568 - 81.
13 Schwarz EJ, Wdowiak MA, Almer-Jarz DA, Breitenecker RJ. The effects of attitudes and perceived environment conditions on students' entrepreneurial intent: An Austrian perspective. Education + Training. 2009;51(4):272 - 91.

142 Proceedings of International Conference for Entrepreneurship, Innovation and Regional Development
ICEIRD 2014
14 Boissin J-P, Branchet B, Emin S, Herbert JI. Students and entrepreneurship: a comparative study of France and the United States. Journal of Small Business and Entrepreneurship. 2009;22(2):101-22.
15 Gassea Y, Tremblayb M. Entrepreneurial Beliefs and Intentions: A Cross-Cultural Study of University Students in Seven Countries. International Journal of Business. 2011;16(4):303-14.
16 EUCommission. Entrepreneurship 2020 action plan. Reigniting the entrepreneurial spirit in Europe. [COMMUNICATION FROM THE COMMISSION TO THE EUROPEAN PARLIAMENT, THE COUNCIL, THE EUROPEAN ECONOMIC AND SOCIAL COMMITTEE AND THE COMMITTEE OF THE REGIONS ] Brussels: European Commission; 2013a [updated 9.1.20133.4.2013]; Available from: http://www.unescochair.uns.ac.rs/sr/docs/enterpreneurship2020ActionPlan.pdf.
17 EUCommission. Youth Employment Initiative. [COMMUNICATION FROM THE COMMISSION TO THE EUROPEAN PARLIAMENT, THE COUNCIL, THE EUROPEAN ECONOMIC AND SOCIAL COMMITTEE AND THE COMMITTEE OF THE REGIONS ] Strasbourg: European Commission; 2013b [updated 12.3.20133.4.2013]; Available from: http://eur-lex.europa.eu/LexUriServ/LexUriServ.do?uri=COM:2013:0144:FIN:EN:PDF.
18 RSNSZ. Mesečni statistički bilten br.125 i br. 126, Nezaposlenost i zapošljavanje u Republici Srbiji. Beograd, Republika Srbija: Nacionalna služba za zapošljavanje (RSNSZ); February 2013 [3.4.2013]; Available from: http://www.nsz.gov.rs/live/digitalAssets/0/425_bilten_nsz_-_januar_2013.pdf.

143
MANAGEMENT OF INNOVATION IN SMES


145 Proceedings of International Conference for Entrepreneurship, Innovation and Regional Development
ICEIRD 2014
Implementation of Environmental Management Systems into SMEs
Ruzena Kralikova1, Lydia Sobotova1, Miroslav Badida1
1 Technical University of Kosice, Letna 9, Kosice Slovakia, [email protected]
1 Technical University of Kosice, Letna 9, Kosice Slovakia, [email protected]
1Technical University of Kosice, Letna 9, Kosice Slovakia, [email protected]
The present contribution deals with the implementat ion of environmental management systems in small and medium-sized enterprises. At p resent, the EU's environmental policy is directed so as to allow future access to the market only to those companies that have an open environmental policy, i.e. that t he general public are able to to prove that their activities and production activities are environmentally acceptable and friends in relation to environmental protection. Th erefore, even small and medium enterprises need in the field of environmental poli cy, to adopt a strategy of adaptation to the new conditions of voluntary environmental le gislation.
Keywords Management, environment, environmental impact, aspect
1. Introduction
Environmental management system (EMS) is the part of management system that includes organizational structure, planning activities, responsibilities, practices, procedures, processes and resources for developing, implementing, achieving, reviewing and maintaining the environmental policy. In other words, the EMS is the management system of plans, implementation and monitoring of activities aimed on improving of environmental properties. The basis of this definition is the implicit assumption of the existence of a positive relation between environment and company performance [1]. In response to increasing demands set out in the legislation in the environment, many companies began to develop these processes.
2. Establishment of corporate environmental managem ent
Environmental legislation developed in the late 60's and beginning of 70's and it had the character of command and control. Over time, environmental regulations have become more complex and stringent. Firms respond to new environmental requirements by employing specialists and develop various kinds of programs to ensure compliance. In the 90's gradually developed corporate environmental management, whose approach to environmental protection has been systematic and proactive and was characterized by an increase in the total cost of environmental protection and regulatory compliance [1]. Systematic approach, management and control are no longer their only basis and emerging regulations have started to include economic instruments such as taxes, emissions trading, charges and pollution taxes on carbon fuels and others. Finally, the company's focus on local environmental problems in 1960 moved and focused on global threats, such as global warming or depletion of stratospheric ozone and to eliminate of companies impact on environment, their social and environmental responsibilities. By the same time the company environmental protection is more systematic and enters to the corporate strategy. Many

146 Proceedings of International Conference for Entrepreneurship, Innovation and Regional Development
ICEIRD 2014
companies have realized that entry to the process up to the end is ineffective for the environmental protection [2]. The top management in environmentally proactive companies already has environmental friendliness not only as a financial liability. Based on their awareness is to obtain the opportunities to gain a competitive advantage by improving the environment and by generating of savings by waste reducing, buying of raw materials and energy. This was the reason why a growing number of companies have introduced a system of environmental management tools. Many of EMS systems are based on the international standard ISO 14001 used mostly by industrial companies, but in recent years has extended to the sector services and the public sector. EMS is based on the development of several standards. The world's first standard for EMS was a British Standard (BS) 7750, which was developed and published by The British Standards Institute in 1992. BS 7750 standard was the model for a series of ISO 14000 standards and the development of EMS. It is also the basis for the European Union, its Eco-Management and Audit Scheme (EMAS). The Standards of environmental management in these systems are almost identical. There they include:
1. Establishing of environmental policy; 2. Determining of the general and partial objectives and targets; 3. Implementation of the program to achieve these goals; 4. Monitoring used to measure of its effectiveness; 5. Repair of problems; 6. Review of system to improve its overall environmental performance.
While the elements are more or less common, special information system must be generated for each company individually, with the aim to distinguish their EMS. One of the first industries that have realized the need for such a system is the chemical industry, which was subsequently, developed Responsible Care System. At the same time, the European Union worked the next version of EMS, Environmental Management and Audit Scheme (EMAS), which really is not a Standard, but voluntary EU Regulation. The registration to EMAS was originally available only to industry, but after the revision of the Regulation, it has been open to other types of organizations. These EMS Standards have been adopted by a majority of the industry. After the publication of the international Standard ISO 14001 in September 1996, the implementation of EMS began to be more frequent in industry. In recent years, the interest in EMS also increased in the service sector and the public sector. The development of environmental management is illustrated in Figure 1. [6]
Figure 1 History of the environmental protection [6]

147 Proceedings of International Conference for Entrepreneurship, Innovation and Regional Development
ICEIRD 2014
3. Environmental policy in the EMS context
The EU environmental policy is directed so that in the future will be allowed the admission to the market only those companies that have open an environmental policy, it means, they are capable to demonstrate to general public that their activities and production activities are environmentally acceptable, it means, friendly in relation to environmental protection. The companies are therefore encouraged by EU legislation to open environmental policy and therefore they reorganized its management structure in accordance with accepted environmental principles, mainly in environmentally sensitive issues - the protection of human health and protection of ecosystems. This tendency was also gradually extended to all sectors, which means that organizations will have to fulfill the requirements contained in the environmental management system EMS according to Standard ISO 14001, respectively EMAS III. The behavior of businesses subjects in the market environment, which is accompanied by the internationalization and globalization, is oriented to solve decisive objectives of product policy related to their competitiveness and ensuring of long-term profit and profitability. The environmental policy is part of state economic policy. Its aim is to join into the production and consumption decisions of products market operators with the aim to achieve the change of "the consumption patterns". This change implies the application of tools and methods that ensure the high environmental efficiency it means reduction of environmental damage in achieving the required economic efficiency, it means reduction of undesirable product in the economic system [6]. EMS is the effective tool in managing and reducing of negative impacts on the environment, which is gradually applied globally in many manufacturing companies, service organizations, but also in state and local governments. The benefits of the introduction of EMS in organizations can be divided into several groups [6], see Table.1.
Table1 The benefits from introduction of EMS in organizations
Groups of benefits
Outputs
Economic benefits
− energy saving, − waste minimization - reducing the cost of disposal − economic use of raw materials, recycling, use of waste as secondary raw materials − transparency and traceability of costs − minimizing of environmental charges and fines for environmental pollution − possible tax benefits, reducing of the cost for insurance
Benefits for firms
− tool for obtaining the data, necessary for planning and goal of settings − assess of the environmental impact and effectiveness of the measures − early identification and visibility of environmental issues and risks − reducing of the risk of violation of laws and criminal penalties − minimize the risk of environmental accidents − increase the morale of the organization
Employee relations
− reducing of the impact on workers' health − reducing of the workers' individual responsibility for damage to the environment − means for shaping of environmental awareness
Public relations
− the valuable communication tool with interest groups − improving of the image of the organization − good relations with the public and local administration
Business and marketing
- achieving of the certification according to Standard ISO 14001 − competitive advantages in world markets − improving of the image of the products

148 Proceedings of International Conference for Entrepreneurship, Innovation and Regional Development
ICEIRD 2014
4. Environmental importance of small and medium ent erprises
By the definition of the European Union is an organization regarded as small and medium enterprises (SMEs) with less than 250 employees and has an annual turnover of less than 40 million EUR or the annual total balance sheet not exceeding 27 million EUR. The company must be an independent enterprise, it means, 25% or more of the capital or voting rights must not have be held by the biggest businesses. The companies, which are suitable for the definition, create 99.8% of all EU companies, they make 66% of total employment and 65% of trade turnover [9]. The sector of small and medium-sized worldwide businesses represents about 70% of gross domestic product, although there are significant differences between the countries. The previous research has shown that SMEs are important not only in financial terms, but that this industry also has a significant impact on the environment. Some authors argue that small and medium enterprises are collectively responsible for a significant part of the total environmental burden and may contribute up to 70% s of the total industrial pollution. It should be noted that this figure is a rough estimate and is not based on empirical data. Besides a large collective impact on the environment a number of SMEs control over their effects [1]. These facts show that it is important that small and medium-sized businesses have access to tools that can help them to achieve compliance with the requirements and to improve their environmental activities. The need for instruments is even more enhanced by the fact that many small and medium-sized businesses are often located in light industrial areas, and are often located near residential areas. One of the tools that can be used by small and medium-sized businesses is the introduction of an environmental management system.
5. Barriers to the introduction of EMS
The EMS are often presented as a suitable tool for larger companies [5]. It is also clear that EMS was mainly adopted by large companies. Appropriateness of the EMS and its most common standard, ISO 14001 for small and medium-sized businesses is often discussed. There were even opinions and attitudes that small and medium-sized businesses were not taken into account in establishing of standards and therefore it is unsuitable for these companies. The strategies and tools designed especially for large organizations are often transferred to smaller organizations and EMS is no exception [3]. Although the appropriateness of the EMS according to specification in Standard ISO 14001 can be questioned for smaller firms, even under pressure from the customers and small and medium-sized enterprises, it pays to find the resources and time to implement this system and certify it. One of the example is the automobile industry, where car manufacturers, such as General Motors, Daimler-Chrysler, Ford, and Toyota, has adopted Standard ISO 14001 and require from their suppliers to do the same as a condition for further business [4]. Many of small and medium-sized enterprises complain about the complexity of the ISO 14001 standard and the high cost of system implementation and the certification. Really, the standard complexity and the lack of human and financial resources are often mentioned as reasons, why many small and medium-sized enterprises do not want to accept EMS. The small and medium-sized enterprises need the access to the implementation of which would be adapted for smaller firms to adopt EMS and to go for the certification. To overcome barriers to EMS implementation by small and medium-sized enterprises, there are a number of special requests, which are classified into the following four categories:
− standardized solution for EMS implementation, − partial approach with rewards on the road to the certification, − professional management, − common EMS and group certification.
The common approach has evolved in recent years and its popularity is growing among small and medium-sized enterprises. In Sweden, the common EMS and group certification

149 Proceedings of International Conference for Entrepreneurship, Innovation and Regional Development
ICEIRD 2014
gained a great attention and today there are many companies, where they work with shared EMS systems. Some of them have completed certification or planning to in the near future.
6. Conclusion
Environmental management in the field of manufacturing and services is one of the most effective tools of achieving the priority objective – it means minimizing negative impacts of production activities on individual components of the environment. Although in the Slovakia many progressive businesses has built in their service operations such systems, it is necessary that these activities have become more numerous, which can be achieved by their dissemination in the field of small and medium-sized enterprises. The basic strategic goal of every business entity is permanently successfully sell their products, meet the need, requirements and expectations of their customers by increasing of product quality and by degree of impact on the environment. And as a direct impact of a product or service on the environment for its use, as well as the overall environmental performance of the supplier and its image in the field. Every company needs for its long-term success a support of surroundings. If the neighborhood surroundings also must to support the company, it must be the firm action also from the view of protection of the environment and health of the population on the environment positively and it means by creating conditions for permanent improvement of its environmental profile, reducing the rate of endangering of the surrounding area, its employees and improving of the hygiene in the workplace. For MSEs is essential strategy in the field of environmental policy to accept the new conditions of voluntary environmental legislation. The small and medium enterprises can choose basically two ways to roll on a trajectory of acceptance of open environmental policy – to implement in EU accepted System of environmental management and audit (EMAS III), or certificate according to international standard ISO 14001 - EMS, which are base environmentally oriented production strategies. Acknowledgement The contribution was made by KEGA 032TUKE- 4/2012 References 1 Ammenberg J. - Hjelm O.: The connection between environmental management systems and
continual environmental performance improvements. Corporate Environmental Strategy, 2002; 9 (2). P. 183-192.
2 Feldman, S. J., Soyka, P.A., Ameer, P.G.: Does Improving A Firm's Environmental Management System and Environmental Performance Result in a Higher Stock Price? Jounal of Investing,1997, 6, (4): P. 87-97.
3 Gleckman H. - Krut R.: Neither international nor standard: The limits of ISO 14001 as an instrument of global environmental management. In Sheldon C, editor. ISO 14001 and Beyond: Environmental Management Systems in the Real World. Sheffield: Greenleaf Publishing Ltd, 1997.
4 Morrow D. - Rondinelli D.: Adopting corporate environmental management systems: motivations and results of ISO 14001 and EMAS certification. European Management Journal 2002:20(2):P. 159-171.
5 Palmer J. - Vorst R.: Are ‘Standards’ Right for SMEs?, Eco-Management and Auditing 1996;(3):P. 91-96.
6 Rusko, M. - Kralikova, R.: Implementation of Environmental Oriented Monitoring in the Manufacturing Company. In: Advanced Materials Research. Vol. 816-817 (2013), p. 1225-1230. ISSN 1662-8985
7 Kralikova, R - Wessely, E - Rusko, M.: The use of six sigma method within the framework of environmental management. In: Annals of DAAAM. Vienna, Austria. 2011. P. 0187-0188. ISSN 1726-9679
8 Kralikova, R - Rusko, M. - Wessely, E: Framework for applying six sigma methods within environmental management. In: DAAAM International Scientific Book 2012. Vol. 11, no. 45 (2012), p. 545-552. - ISSN 1726-9687

150
Proceedings of International Conference for Entrepreneurship, Innovation and Regional Development ICEIRD 2014
Debt management in small and medium -sized enterprises using financial ratios
Lajoš Žager1, Sanja Sever Mališ2, Ana Ježovita3 1 Faculty of Economics and Business - University of Zagreb, Trg J. F. Kennedyja 6, Zagreb, Croatia, [email protected]
2 Faculty of Economics and Business - University of Zagreb, Trg J. F. Kennedyja 6, Zagreb, Croatia, [email protected]
3 Faculty of Economics and Business - University of Zagreb, Trg J. F. Kennedyja 6, Zagreb, Croatia, [email protected]
Business decision making in small and medium-sized enterprises (SME’s) is a process focused on improvement of business efficiency. Cons idering that small and medium-sized enterprises are less complex systems, modelin g and implementation of decision making techniques is easier than in large corporati ons. Debt financing in performing business activities demands particular consideratio n of SME’s stakeholders to ensure continuity of operations and to avoid accompanying risks. Statement of financial position reports the structure of borrowed and owne d capital. Debt to asset ratio and equity to assets ratio do not give sufficient infor mation on the indebtedness quality of a company. Due to insufficiency of information base d only on capital structure it is suggested to use additional ratios for SME’s solven cy evaluation. In context of business solvency evaluation analyst can use profit ability ratios. The effect of financial leverage is crucial for determining abili ty to evaluate indebtedness of a company by using return on total assets and return on equity. The aim of this paper is to determine the existence of a relationship betwee n capital structure and capital costs relating to profitability ratios for the comp anies that use external sources of financing on the sample of Croatian SME’s. The cond ucted analysis confirms the existence of relationship between return on assets and return on equity in terms of efficient debt financing of business activities. Th e results of this analysis can be useful for company’s management but also for other stakeholders as a valuable tool for improving the efficiency and business developme nt of SME’s.
Keywords
business efficiency, external sources of financing, financial leverage, return on total assets, return on equity
Abbreviations
SMEs - Small and medium sized enterprises (SMEs) D/E - Debt to equity ratio ROA - Return on assets ROE - Return on equity WACC - Weighted average cost of debt and equity capital FL - Financial leverage NKD - National Classification of Activities FLG - Financial leverage gain ROI - Total borrowed capital relationship VIF - Variance inflation factors

151
Proceedings of International Conference for Entrepreneurship, Innovation and Regional Development ICEIRD 2014
1. Introduction
Accounting profession has an irreplaceable role in the management process of small and medium sized enterprises (SME’s). One of the most important assignments of an accounting profession is preparing and disclosure of financial statements. These financial statements make significant information potential for the decision making process of those interested in the management of small and medium sized enterprises. In other words, stakeholders must have relevant and material information on the company prepared on a timely, regular basis and prepared in accordance with high quality standards of accounting. Based on relevant and material information prepared in a timely and regular basis in accordance with high quality standards those interested in the management can evaluate the financial position, performance, cash flows of the SME’s. Also, financial statements present a great information potential for evaluating the indebtedness quality of the company.
Recent financial crises and bankrupts of many companies highlighted the need for evaluating the indebtedness quality of the companies. The recent financial and economic crises were the most severe in decades and deeply affected the business and financing environment all the entities but especially SME’s. In other words, changes in business environment and economic disruption have the great influence on the modern market economy, in general, but especially on the business position, performance and cash flows of small and medium sized enterprises (SME’s). It is a fact, considering small and medium sized enterprises, financing is one of the most important issues when performing business activities. Due to the bad quality of indebtedness, many SME’s were not able to repay their debts and they simply “disappeared” out of the market in recent financial crises. This was an incentive to explore indebtedness quality of the Croatian SME’s using the traditional financial ratios and reach some conclusion that can improve the stakeholder's business decision making process. The result of this analysis can be useful for those interested in the governance of the SMEs, when assessing the creditworthiness of small and medium sized enterprises.
2. Possibilities for improvement of management proc esses in SMEs
Business decision making in small and medium-sized enterprises (SME’s) is a process focused on improvement of an business efficiency. Considering that small and medium-sized enterprises are less complex, modelling and implementation of decision making techniques is perceived as easier than in large corporations. Those charge in governance need information regardless the level or function of governance in order to accomplish company’s aims. Information is created in accounting information system which records the business transactions. Financial statements are prepared as the final product of the accounting information system primarily intended for use of interested stakeholders. These financial statements are a base for evaluating the financial position, performance and cash flows of the company. In order to enhance the quality of information presented in financial statements, stakeholders use financial ratios as an instrument of business quality measurement. The business quality measurement based on the traditional financial ratios is widespread, cost-effective and efficient. In general, there is a perception that financial ratios are more applicable to large entities because of large volumes of transactions that tend to be predictable over time. However, due to the fact that application of financial ratios is cost-effective and easy to use method for evaluating the business position and performance it is inventible tool in managing small and medium sized enterprises. In performing business activities of SME’s financing is one of the most important issues. Often many business projects of SME’s fail because of its inability to financing. It is well recognized that SME’s are more dependent on debt financing than are larger enterprises,

152
Proceedings of International Conference for Entrepreneurship, Innovation and Regional Development ICEIRD 2014
which can turn to other types of finance, such as launching public offering for debt and equity. The narrow set of financing sources typically available to SME’s make them more vulnerable to the changing conditions in credit markets. When deciding to grant a loan to the SME’s, financial ratios can be used as an important instrument of the business quality measurement. In that sense, financial ratio analysis is of greatest importance. According to the research [1] it was noted that commercial loan departments give a high significance rating to selected ratios that primarily measure liquidity and debt. Debt to equity ratio is perceived by the commercial loan officers as the greatest significance and often included as a part of loan agreement [1]. In other words, when deciding about the sources of finance, the importance of leverage ratios needs to be stressed. However, focusing only on the leverage ratio in financing decisions made by management and other stakeholders, especially creditors, is not enough. In that sense, the importance of relationship between the leverage and profitability ratio is of extreme significance.
3. Usage of leverage and profitability ratios in bu siness decision making process
Financing sources of the company are reported in the balance sheet. Usually it is common to compare internal and external sources of financing. For this purpose leverage ratios are useful tool, i.e. debt to assets ratio which is calculated as proportion of total liabilities in total assets and equity to assets ratio which is calculated as proportion of total equity in total assets. From that point of view, together they represent the capital structure. Debt to equity ratio (D/E), calculated as relationship of total liabilities and total equity of the company, is important ratio. In relevant literature debt to equity ratio represents the financial leverage of the company. If debt to equity ratio is greater than 1 then a company uses more external sources of financing. In other case, when that ratio is less than 1, company uses more internal sources of financing.
In a focus of experts and analysts is to determine optimal capital structure for particular company. It is useful to combine analysis of leverage ratios with profitability ratios. „Profitability analysis evaluates whether managers are effectively executing a firm’s strategy“. [2] In other words, comprehensive overview of company's profitability is irreplaceable tool for evaluation of business strategy implementation and evaluation.
“In context of profitability ratios it is common to consider profit margin ratio, ROA ratio and ROE ratio”. [3] Robinson [4], et. al. profitability ratios divide into profitability of revenues and profitability of investments. Profitability of revenues are gross and net profit margin, while profitability of investments includes gross and net ROA and ROE. Palepu [5], et. al. and Gibson [1] emphasizes that ROE, ROA and profit margins are core ratios in business profitability analysis.
Generally, profitability represents the company’s ability to achieve specified yields in the context of meeting shareholders’ needs. „Rate of return measures presume that a certain amount of investment generates economic profits“. [2] The achievement of economic benefits links the concept of assets in a company and profitability ratios. The company uses its assets to achieve a certain level of economic benefits, which essentially represents required level of return for stakeholders, whether creditors or their owners. In that context there is important impact on profitability of the company with its capital structure. Key role in assessing company’s indebtedness using profitability ratios has ROA and ROE.
Return on assets (ROA) is a ratio that „tells how much profit a company is able to generate for each unit of assets invested“. [5] „ROA measures the company’s ability to utilize its assets
153
Proceedings of International Conference for Entrepreneurship, Innovation and Regional Development ICEIRD 2014
to create profits by comparing profits with the assets that generate the profits“. [1] „The rate of ROA measures a firm’s success in using assets to generate earnings independent of the financing of those assets“. [2]
„Operating ROA is a measure of how profitably a company is able to deploy its operating assets to generate operating profits. This would be a company’s ROE if it were financed with all equity“. [5] Operating income includes business capability for generating revenue from its main activity, i.e. it does not include financial activities of the company. Operating income is approximately obtained by adding interest expenses to net income. „Because accountants subtract interest expense when computing net income, the analyst must add it back when computing ROA. However, firms can deduct interest expense in measuring taxable income. Therefore, the incremental effect of interest expense on net income equals one minus the marginal tax rate times interest expense. That is, the analyst adds back the full amount of interest expense to net income and then subtracts, or eliminates, the tax savings from that interest expense“. [2]
It is possible to calculate ROA by using some derivate of assets like only the one that „include only interest-bearing debt along with the equity. That way, the ratio compares earnings available to owners and creditors to the assets that can be claimed by those owners and creditors“. [6] Even though companies usually have liabilities that don’t have explicitly specified costs they implicitly exist, for example, discounts from suppliers for early payments. „Despite the logic of adjusting income in the ROA calculation to account for implicit interest or adjusting total assets for indirectly invested capital, in all but extreme cases, the materiality of such theoretically correct adjustments is questionable and the degree of precision in estimating such amounts is low“. [2]
The fundamental objective of company’s business is generating added value which represents return for shareholders. Ratio which represents ability of a company to create added value for owners is return on equity (ROE). ROE „measures the return earned by a company on its equity capital, including minority equity, preferred equity, and common equity. As noted, return is measured as net income (i.e., interest on debt capital is not included in the ROE)“. [4] Ratio includes net income, which represents earnings for owners, and equity, which is amount of capital invested in business by owners of a company. „ROE is a comprehensive indicator of a company’s performance because it provides an indicator of how well managers are employing the funds invested by the company’s shareholders to generate returns”. [5] „ROE incorporates the results of a company’s operating, investing, and financing decisions“. [2]
There is a relationship between ROA and ROE. ROA measure the ability of the company to accomplish required return on total capital of a company. On the other side, ROE measure the ability of a company to generate earnings for owners of the equity. Accordingly, ROA includes total returns, in form of net income for shareholders and interest expenses for creditors.
Business efficiency often is evaluated comparing ROA and ROE. „ROE will exceed ROA whenever ROA exceeds the cost of capital provided by creditors and preferred shareholders. If a company can generate a higher return on capital provided by creditors and preferred shareholders than the cost of those sources of capital, the excess return belongs to the common shareholders“. [2] Usually it is defined that if a company is capable to achieve ROA higher than average cost of borrowed capital, it achieves ROE higher than ROA. Relationship can be explained using financial leverage. „Common business terminology refers to the practice of using lower-cost creditor and preferred stock capital to increase the return to common shareholders as financial leverage or capital structure leverage“. [2] „This economic effect of borrowing is positive as long as the ROA is greater than the cost of
154
Proceedings of International Conference for Entrepreneurship, Innovation and Regional Development ICEIRD 2014
borrowing. Companies that do not earn adequate operating returns to payoff its interest cost has impact to reduce their ROE by borrowing“. [5] Financial leverage means that the company achieves higher rates of returns by using external sources of financing, comparing to case when a company uses only equity.
ROA is managerial tool for assessment the long term business strategy. Preferred level of total profitability can be determined by identifying every single cost of debt in capital structure including preferred return for shareholders and by calculating average weighted average cost of debt and equity capital (WACC).
At certain level of earnings before interests, ROE is the same for every combination of financing options, i.e. combination of owned and borrowed capital. “At that efficiency level company achieves point of indifference using financial leverage. Determining the point of indifference represents a critical decision for choosing certain financial structure”. [7] Before that point there is no financial leverage effect because then ROA is not high enough to cover interests cost and opposite, after point of indifference, financial leverage begins to act positively and digressive character of interest cost is expressed. “From quantitative view, point of indifference of using financial leverage is achieved when ROA is equal to interest rate of a company”. [7] It is situation in which ROE is equal for every combination of using owned and borrowed sources of financing. „As long as a company is able to borrow at a rate lower than the marginal rate it can earn on investing the borrowed money in its business, the company is making an effective use of leverage and ROE would increase as leverage increases. If a company’s borrowing cost exceeds the marginal rate it can earn on investing, ROE would decline as leverage increased because the effect of borrowing would be to depress ROA“. [4]
According to Palepu [5], et. al. it is possible to decompose ROE using ROA, effective interest rate and financial leverage as follows:
NetincomeEquity = Netincome + InterestexpensesTotalassets + [Spread ∗ Financialleverage] [1]
Spread = Netincome + InterestexpensesTotalassets − effectiveinterestrate [2]
Financialleverage(FL) = Externalsourcesof%inancingInternalsourcesof%inancing [3]
It is possible to decompose ratios as noted when are known costs of using every single type of debt financing. In that case, ROE is possible to obtain as relationship of ROA, effective interest rate and financial leverage. Spread represents remainder of ROA after deducting known effective interest rate. Spread is realized yield on owned sources of financing which need to be corrected for company’s financial leverage and ROA. Financial leverage (FL) is obtained as relation of borrowed sources of financing and owned sources of financing and it is known as debt to equity ratio as mentioned earlier. „A company’s spread times its net financial leverage, therefore, provides a measure of the financial leverage gain (FLG) to the shareholders“. [5] Financial leverage gain represents realized increase in ROE as a result debt financing. Cases where total cost of borrowed capital is not known, for simplicity, it is possible to calculate, average cost of total borrowed capital as relationship of total interest expenses and total external sources of financing.

155
Proceedings of International Conference for Entrepreneurship, Innovation and Regional Development ICEIRD 2014
FLG = 'Netincome + InterestexpensesTotalassets − InterestexpensesTotalborrowedcapital* ∗ FL [4]
These relationship can be explained as coefficient which represents positive effects of using borrowed sources of financing in cases when is higher than 0 and negative effect of using borrowed sources of financing when that coefficient is negative.
4. Influence of leverage ratios on business profita bility in SMEs – empirical research from Croatia
Analysis of debt financing quality in business activities is performed on the sample small and middle sized companies in Republic of Croatia. Size of a company in Croatia is determined by Accounting Law1. Sample includes 335 Croatian companies from which 164 are considered as small companies and 171 as middle sized companies.
Companies are divided into four groups of activities which include all main real sector activities in Republic of Croatia. Clustering is performed according to the Croatian Bureau of Statistics which publishes structural business statistics covering industry, construction, trade and nonfinancial services presented according to the NKD (National Classification of Activities – 2007) activity classification in Republic of Croatia (Table 1). Conducted activities covers ‘business economy’ sector in Republic of Croatia.
Table 1 Groups of activities according to the Croatian Bureau of Statistics which publishes structural business statistics
A INDUSTRY B Mining and quarrying C Manufacturing D Electricity, gas, steam and air conditioning supply E Water supply; sewerage, waste management and remediation activities B CONSTRUCTION F Construction C TRADE G Wholesale and retail trade; repair of motor vehicles and motorcycles D NONFINANCIAL SERVICES H Transportation and storage I Accommodation and food service activities J Information and communication L Real estate activities M Professional, scientific and technical activities N Administrative and support service activities S95 Repair of computers and personal and household goods
Source: Croatian Bureau of Statistics
In Republic of Croatia in year 2011 in total 83.354 small and middle sized enterprises disclosed their financial statements to Financial agency (Table 2). Selected sample consist of
1 Accounting law in Republic of Croatia determines size of a company by following conditions: Small companies are those that do not exceed two of the following conditions: (1) Total assets 32,5 million HRK, (2) Total income 65 million HRK, (3) average number of employees during the financial year less than 50; Medium-sized companies are those that do not exceed two of the following conditions: (1) Total assets 130 million HRK, (2) Total income 260 million HRK, (3) average number of employees during the financial year less than 250; Large companies are those that do exceed two of the stated conditions for medium-sized companies

156
Proceedings of International Conference for Entrepreneurship, Innovation and Regional Development ICEIRD 2014
total 335 small and middle sized companies which represents share of 0,20% of total number of companies that delivered financial statements in year 2011.
Table 2: Number of companies in sample according to groups of activity in 2011 in Republic of Croatia
Group of activity
Number of companies that delivered financial statements in
2011 Number of companies in sample
Share of analyzed
companies in total number of
companies Small Middle size
Total Small Middle size
Total
A Industry 11.326 511 11.837 45 50 95 0,40%
B Construction 11.461 129 11.590 34 35 69 0,30%
C Trade 25.278 325 25.603 43 51 94 0,17% D Nonfinancial services 34.091 233 34.324 42 35 77 0,12%
UKUPNO 82.156 1.198 83.354 164 171 335 0,20%
Source: Croatian Bureau of Statistics
Analyzed companies in 2011 in Republic of Croatia had a mean debt to equity ratio (D/E) 4,46 with a standard deviation of 8,40 and high relative variability of 188,20% (Table 3). According to these results analyzed companies finance their businesses using mainly external sources of financing. Mean ROE is higher (24,80%) than mean ROA (9,95%). Mean interest expenses to total borrowed capital relationship (ROI) is lower than mean ROA. Accordingly, financial leverage gain (FLG) is positive (0,149). FLG of 0,149 represents increase of ROE due to using external sources of financing.
The highest range between minimum and maximum value had ROE, followed by financial leverage gain (FLG). ROI had stable values in all analyzed companies which suggest that small and middle sized enterprises in Republic of Croatia has little bargaining power in achieving a lower cost of external capital.
Table 3: Descriptive statistics of selected financial ratios for analysed companies in Republic of Croatia
VARIABLE DESCRIPTIVE STATISTICS
VALID N MEAN MINIMUM MAXIMUM STD.DEV. COEF.VAR.
D/E 335 4,464 0,000 64,600 8,401 188,204 ROA 335 9,95% 0,00% 82,67% 13,04% 131,0936 ROE 335 24,80% 0,00% 508,91% 41,00% 165,3414 ROI 335 4,03% 0,00% 71,23% 8,53% 211,5181 FL 335 0,149 -0,172 4,851 0,347 233,372
Table 4: Results of multiple regression analysis
N=335
Regression Summary for Dependent Variable: ROA R= ,70596329 R2= ,49838417 Adjusted R2= ,49383780 F(3,331)=109,62 p<0,0000 Std.Error of estimate: ,09279
b* Std.Err. (of b*) b Std.Err. (of
b) t(331) p-value
Intercept 0,048902 0,006904 7,08275 0,000000
ROE 0,635448 0,039226 0,202127 0,012477 16,19947 0,000000 ROI 0,259371 0,039139 0,396532 0,059837 6,62686 0,000000 D/E -0,224082 0,039435 -0,003479 0,000612 -5,68227 0,000000

157
Proceedings of International Conference for Entrepreneurship, Innovation and Regional Development ICEIRD 2014
Due to attempt to determinate the relationship of profitability and leverage ratios multiple regression analysis is conducted (Table 4). Dependent variable in the model is ROA while ROE, ROI and D/E ratios represents independent variables.
Measure of predictive accuracy for the regression model in terms of coefficient of determination 0,498 shows medium prediction ability. Adjusted coefficient of determination of 0,494 confirms conclusion on predictive ability. Statistical significance of the overall regression model is tested using F-test. According to the calculated F-value 109,62, with a critical value for a given alpha level 5%, and [3,331] degrees of freedom 2,60 reach the conclusion that the regression model does explain a significant proportion of the variation in ROA. Testing by p-value conclusion is the same.
Concluding that overall model is significant means that at least one independent variable explains a significant proportion of the variation in ROA. At the next phase it is necessary to determine significance of each independent variable using t-test and p-value at significance level 5%. Calculated p-value for each independent variable is less than alpha which means that null hypothesis is rejected and conclusion is that all independent variables are statistically significant in the conducted regression model. Both, the t-test and p-value test gave the same results.
Table 5: Correlations of dependent and independent variables in multiple regression model
Variable Correlations
ROE ROI KF ROA
ROE 1,000000 ROI -0,000048 1,000000 KF 0,122301 -0,102799 1,000000
ROA 0,608030 0,282376 -0,173030 1,000000
“Multicollinearity occurs when independent variables are correlated with each other and therefor overlap with respect to the information they provide in explaining the variation in the dependent variable”. [8] The most significant correlation (Table 5) was found between ROE and ROA (r=0,608). Using t-test it is concluded that correlation is statistically significant at significance level 5% (13,976>1,697)2.
Table 6: Redundancy of independent variables in multiple regression model
Variable
Redundancy of Independent Variables; DV: ROA R-square column contains R-square of respective
variable with all other independent variables
Toleran. R-square Partial (Cor.) Semipart (Cor.) VIF
ROE 0,984884 0,015116 0,664995 0,630627 1,015348 ROI 0,989273 0,010727 0,342248 0,257976 1,010843 KF 0,974476 0,025524 -0,298123 -0,221204 1,026192
Tolerance is measure of multicollinearity, “which is defined as the amount of variability of selected independent variable not explained by the other independent variables”. [9] Tolerance levels in multiple regression model are high, meaning that there is no
2 Significance of coefficient of correlation can be computed using following formula:
+ = ,-(. − 2)√1 − ,2
where t = empirical value, r= correlation coefficient, a N = sample size.

158
Proceedings of International Conference for Entrepreneurship, Innovation and Regional Development ICEIRD 2014
multicollinearity problem among variables (Table 6). Variance inflation factors (VIF) for independent variables confirms no multicollinearity problem due to their value lower than 5.
Scatterplot of FP against ROE-ROA
FP = -2,7756E-17+1*x
-1 0 1 2 3 4 5 6
ROE-ROA
-1
0
1
2
3
4
5
6
FL
G
Figure 1: Relationship between financial leverage gain and difference between ROE and ROA in analysed SME’s in 2011 in Republic of Croatia
Scatterplot of multiple variables against FP
ROA = 0,0803+0,1291*xROE = 0,0803+1,1291*xROI = 0,0442-0,0262*x
ROA ROE ROI
-1 0 1 2 3 4 5 6
FLG
-1
0
1
2
3
4
5
6
Figure 2: Scatterplot of selected profitability ratios and coefficient of financial leverage gain in analysed SME’s in 2011 in Republic of Croatia
Conducted multiple regression analysis confirmed the connection between the profitability and the leverage ratios in evaluation of debt financing validity. Financial leverage gain is directly connected to structure of financing sources in the balance sheet. In other words, it is a coefficient of change in ROE due to financing external sources (Figure 1).
159
Proceedings of International Conference for Entrepreneurship, Innovation and Regional Development ICEIRD 2014
In cases where return in equity is higher than ROA, coefficient of FLG will be positive, and vice versa (Figure 2). There is positive relation between difference of ROE and ROA comparing to coefficient of FLG. The greater the difference between to ratio is, the coefficient of FLG in higher. Higher financial leverage gain means greater increase of ROE due to using of external sources of financing.
5. Conclusions
Financial statements make significant information potential for the decision making process of those interested in the management of small and medium sized enterprises. Also, financial statements present a great information potential for evaluating the indebtedness quality of the company. Recent financial crises and bankrupts of many companies highlighted the need for evaluating the indebtedness quality of companies. Due to the bad quality of indebtedness, many SME’s were not able to repay their debts and they simply “disappeared” out of the market in recent financial crises. Financing sources of the company are reported in the balance sheet. Usually it is common to compare internal and external sources of financing. For this purpose it is practical to use leverage ratios. In a focus of experts and analysts is to determine optimal capital structure for particular company. It is useful to combine analysis of leverage ratios with profitability ratios. Given data of conducted analysis of SME’s in year 2011 in Republic of Croatia provided in scatterplot confirms results obtained by multiple regression analysis and conclusions maid using relationship between results. If ROA is higher than ROE then relationship of interest expenses and external sources of financing is higher than ROA and in that case coefficient of FLG is negative. In point of indifference when coefficient of FLG is equal zero, then all three profitability ratios are the same. In cases in which ROE exceeds ROA, relationship of interest expenses and external sources of financing is lower than ROA and coefficient of FLG is positive within SME’s.
References
[1] Gibson CH. Financial Statement Analysis. 12th ed. Canada: South-Western, Cengage Learning; 2011.
[2] Wahlen JM, Baginski SP, Bradshaw MT. Financial Reporting, Financial Statement Analysis, and Valuation: A Strategic Perspective. 7th ed. Mason: South-Western Cengage Learning; 2011.
[3] Žager K, Mamić Sačer I, Sever S, Žager L. Analiza financijskih izvještaja. 2nd ed. Zagreb: Masmedia; 2009.
[4] Robinson TR, Van Greuning H, Henry E, Broihahn MA. International Financial Statement Analysis. New Jersey: John Wiley & Sons, Inc.; 2009.
[5] Palepu KG, Healy PM, Bernard VL, Peek E. Business Analysis and Valuation: IFRS Edition - Test and Cases. London: Thomson Learning: 2007.
[6] Friedlob GT, Schleifer LLF. Essentials of Financial Analysis. New Jersey: John Wiley & Sons, Inc.; 2003.
[7] Orsag S. Vrijednosni papiri. Sarajevo: Revicon d.o.o.; 2003. [8] Groebner DF, Shannon PW, Fry PC, Smith KD. Business Statistics: A Decision Making
Approach. 8th ed. New Jersey: Prentice Hall; 2011. [9] Hair JFJ, Black WC, Babin, BJ, Anderson RE. Multivariate Data Analysis, A Global
Perspective. 7th ed. New Jersey: Pearson Education, Inc.; 2010.

160
Proceedings of International Conference for Entrepreneurship, Innovation and Regional Development ICEIRD 2014
Potential for the Improvement of Innovation Activities of SMEs
Prof. Dr. Miroljub Hadžić1, Petar Pavlović2 1Professor, Singidunum University, Belgrade, Serbia, Faculty of Business, [email protected]
2 Senior Advisor, Ministry of Regional Development and Local Self-Government of the Republic of Serbia, [email protected] In the course of 2013 Serbian economy was sending s ome good signals, such as a shift in business demography and positive trends in foreign trading. There were also welcome political events, like the granting of the EU candidate status to Serbia and the drafting of the National Integrated Innovation Support Program. However, one has to be aware that the level of competitiveness of Se rbian companies, including the SMEs, on the global market is low. These economic e ntities are faced with recession and, at the same time, with a deteriorating busines s climate as market reforms have lost their momentum. Given that innovation is seen as a key to the impro vement of competitiveness, a comparative analysis for Serbian SMEs vis -à-vis the region and a broader EU environment was done, as well as a dynamic analysis . It is suggested that comparative advantages of Serbian SMEs lie with inn ovators, financial support, ISO standardization, audio - visual services exports, I CT imports, costs of redundancy dismissal, secondary level education and graduation in science and engineering. At the same time there is room for improvement with hu man resources, linkages between business and research institutions, intellectual as sets, scientific system, tax payment system, investment and cluster development also nee d to be improved. In order to create a more encouraging business envi ronment particularly important is to continue with market reforms. Measures of genera l support to SME development should be strengthened in an aim to create critical number of small economic entities. Special measures should be implemented to dynamic S MEs. Keywords: innovation, competiveness, support, SMEs 1. Introduction The global economic crisis negatively affected Serbian companies in general, and SMEs were no exception. Economic activities overall were hampered, the number of the employed decreased, and the access to the world market was weaker. There were two factors that played an important role in this: the so–called ‘W effect’ (repeated recessions) in the EU and a prolonged crisis. Nevertheless, there were some positive, encouraging signals of recovery in 2013. After two years of negative business demography, the number of businesses increased again although shops were still suffering (their demography was negative). The second positive sign was an increasing foreign trade volume, with the export volume rising more than the import volume, and the foreign trade balance shrinking as a result. The third positive signal was sent when Serbia became the official candidate for EU membership and started negotiations. In order to address a low level of competitiveness of the national economy on the global market and a low technological level of products exported, in 2008 Serbia started to make a shift in policy support to SMEs development by introducing measures that bolster mainly fast-

161
Proceedings of International Conference for Entrepreneurship, Innovation and Regional Development ICEIRD 2014
growing companies, including the fastest ones called gazelles. The Innovation Union Scoreboard (IUS) is an instrument of the European Commission (EC) for assessing and making comparative analyses of innovation performances. It comprises 3 main groups of indicators (indicators of political support, indicators of performances of economic entities, and indicators of effects of innovation activities) and 8 dimensions, capturing in total 25 different indicators. Global Innovation Index (GII) relies on two sub-indices, the Innovation Input Sub-Index and the Innovation Output Sub-index, each built around pillars. Five input pillars capture elements of the national economy that enable innovative activities. Two output pillars capture actual evidence of innovation outputs. Each pillar is divided into sub-pillars and each sub-pillar is composed of individual indicators (84 in total). In order to identify room for improvement, the IUS and GII were carefully crafted to point to weaknesses of SMEs vs. companies within the region and in a broader EU environment. It is important to find opportunities for the enhancement of competitiveness, and innovation is seen as a key factor. The aims of the proposed paper are: to shed light on the present level of SMEs innovation development, to highlight both weaknesses and strengths of Serbian SMEs, and to summarize useful policy recommendation for SMEE support. 2. Research background - innovation by SMEs SMEs are, without a doubt, important for innovation in manufacturing and services. The role of SMEs in innovation was deeply analysed by and widely rests on the Schumpeterian growth theory – the explanation of the so-called waves of creative destruction and innovation, mainly based on mutual competition and innovation of small and medium-sized companies [1]. There are various channels through which SMEs make a difference with respect to innovations. Harrison and Watson point to the flexibility of SMEs, their simple organizational structure, and their low risk and receptivity as the essential features that facilitate their innovation [2]. In the time of the economic crisis companies with a relatively small number of employees and a low capital volume can transfer their sources from one industry to another, adapt to changing (worsening) conditions by reducing the number of employees, and respond to a changing demand on the market more easily than other companies (large ones). Another point has also been thoroughly examined and proved, namely that SMEs engage in technological innovation in a wide range of sectors and act as significant sources of employment and productivity growth [3]. It is widely recognised that the SME sector is the main source of both employment growth and productivity growth [4]. However, one should bear in mind that innovation in manufacturing sectors often turns out to be an especially complex process, which is reflected in the type of technology, the gap between the start-up size of a firm, and the minimum efficiency scale required to sustain a sector amid market uncertainty. This results in the process of selection in which new innovators replace older and less productive firms. Thus a pattern emerges in which young and small firms tend to be an important driver of innovation. The relation between the technological level of a company and employment was also examined. It seems that knowledge-intensive companies and sectors (KIS) are, on average, more likely to survive and have a longer lifespan than non-hi-tech and low knowledge-intensive firms. Companies in KIS sectors do not generate more employment at their birth than firms in the low KIS (LKIS) sectors, but the KIS companies do contribute to overall employment growth substantially. In KIS sectors relatively more companies are created, while relatively fewer companies fail. A higher survival rate suggests that even if the businesses do not grow over time, their share in total employment can rise [5]. 3. Innovation Union Scoreboard (IUS) and Global Inn ovation Index

162
Proceedings of International Conference for Entrepreneurship, Innovation and Regional Development ICEIRD 2014
The Innovation Union Scoreboard (IUS) is a tool of the European Commission for the evaluation and comparative analyses of innovation performances of the EU member states and acceding countries (Croatia until June 2013, Serbia, Iceland, FYROM, Norway, Turkey and Switzerland), and for the identification of strengths and weaknesses of their research and innovation systems. This instrument enables the monitoring of implementation of the Innovation Union as one of the seven most significant initiatives of Europe 2020: A European strategy for smart, sustainable and inclusive growth [6]. The Innovation Union Scoreboard (IUS) is developed largely following the methodology of the previous instrument, the European Innovation Scoreboard (EIS). It distinguishes between 3 main types of indicators (Enablers, Firm activities, and Outputs) and 8 innovation dimensions, capturing in total 25 different indicators. On the basis of aggregate indicators of the national innovation performance, a composite index is calculated – the Summary Innovation Index – which summarizes the performance of 25 IUS indicators. The IUS indicators include [7]: Support indicators - Enablers capture the main drivers of innovation performance external to the firm and differentiate between 3 innovation dimensions:
• Human resources – highly skilled and educated people. The indicators capture new doctorate graduates, population aged 30-34 with completed tertiary education, and population aged 20-24 having completed at least upper secondary education;
• Research systems – international competitiveness of the scientific base. This dimension includes 3 indicators and measures international competiveness of the science base by focusing on the international scientific co-publications and non-EU doctorate students;
• Finance and support – availability of finance for innovation projects and support of governments for research and innovation activities. The dimension includes 2 indicators and measures the availability of finance for innovation projects by venture capital investments and the support of governments for research and innovation activities by R&D expenditure by universities and government research organizations.
Company activities indicators – Firm activities capture the innovation efforts at the level of the firm and differentiate between 3 innovation dimensions:
• Firm investments – different types of enterprises' innovation investments. It includes 2 indicators of both R&D and non-R&D investments that firms make in order to generate innovations;
• Linkages and entrepreneurship – entrepreneurial efforts put into collaboration among enterprises – innovators as well as with the public sector. It includes 3 indicators that measure innovation capabilities by looking at SMEs that innovate in-house and collaboration efforts between innovating firms and research collaboration between the private and public sector;
• Intellectual assets – different types of protection of the Intellectual Property Rights (IPR). It captures different forms of IPR generated as a throughput in the innovation process, including PCT patent applications, community trademarks and community designs.
Indicators of the effects of innovation activities - Outputs capture the effects of firms' innovation activities and differentiate between 2 innovation dimensions:
• Innovators – the number of enterprises that have introduced innovations onto the market (a product/service or a production process innovation) or within their organizations. It includes 3 indicators, covering both technological and non-technological innovations and the presence of high-growth firms;
• Economic effects – economic effects on employment, exports and sales as a result of innovation activities. It includes 5 indicators and captures the economic success of innovation in employment in knowledge-intensive activities, the contribution of

163
Proceedings of International Conference for Entrepreneurship, Innovation and Regional Development ICEIRD 2014
medium and high-tech product exports to the trade balance, exports of knowledge-intensive services, sales due to innovation activities, and license and patent revenues from selling technologies abroad.
Based on innovation indicators and the analysis of innovation trends, countries fall into the following four categories [8]:
• Innovation leaders, with performance at least 20% above that of the EU-27 average;
• Innovation followers, with performance close to that of the EU-27 average, i.e. less than 20% above and less than 10% below that of the EU-27 average;
• Moderate innovators, with performance below that of the EU-27 average, i.e. between 10% and 50% below that of the EU-27 average, and
• Modest innovators – catching-up countries, with performances well below that of the EU-27 average, namely by more than 50%.
The Global Innovation Index (GII) relies on two sub-indices, the innovation Input Sub-Index and the Innovation Output Sub-Index, each built around pillars [9]. Five input pillars capture elements of the national economy that enable innovative activities: institutions, human capital and research, infrastructure, market sophistication and business sophistication. Two output pillars capture actual evidence of innovation outputs: knowledge and technology outputs and creative outputs. Each pillar is divided into sub-pillars and each sub-pillar is composed of individual indicators (84 in total). Sub-pillar scores are calculated as the weighted average of individual indicators; pillar scores are calculated as the weighted average of sub-pillar scores. The framework explained is revised every year in a transparent exercise to improve the way innovation is measured. 4. Comparative analysis of the innovation level of SMEs Based on innovation indicators and the analysis of innovation trends, observed countries fall into the following four categories [7]:
• Innovation leaders: Denmark, Finland, Germany, and Sweden, with performance at least 20% above that of the EU-27 average;
• Innovation followers: Austria, Belgium, Cyprus, Estonia, France, Ireland, Luxemburg, Netherlands, Slovenia and the UK, with performance close to that of the EU-27 average, i.e. less than 20% above and less than 10% below the EU average;
• Moderate innovators: Czech Republic, Greece, Hungary, Italy, Lithuania, Malta, Portugal, Slovakia and Spain, with performance below that of the EU-27 average, i.e. between 10% and 50% below the average, and
• Modest innovators–catching-up countries: Bulgaria, Lithuania, Poland and Romania, with performance well below that of the EU-27, namely by more than 50%.
The Republic of Serbia was first included and examined in such an analysis (IUS) in 2009, which represented an important step in the exploration of national innovation potentials and, in particular, the SMEE sector. The analysis of innovation performance is a starting point for further research and decisions about possible actions in steering innovation activities in companies in Serbia, especially where support activities on the part of the state are needed in line with objectives and priorities set out in strategic development documents.
It is a relatively satisfying fact that Serbia belongs to the third group of countries – moderate innovators with a below average performance. Such a score is encouraging to some extent considering that for other economic performances, including the international level of competitiveness, Serbia is ranked worse. In 2012 (as the last year estimated) Serbia was

164
Proceedings of International Conference for Entrepreneurship, Innovation and Regional Development ICEIRD 2014
well below the Summary Innovation Index (SII) – the EU-27 average composite innovation index (0.544 and 0.365, respectively) [7].
As for the Summary Innovation Index (SII), Serbia is by 1/3 below the EU average (at 67.1 if the EU-27 average is taken as 100). If we look at innovation performance scores per dimension (Graph 1), Serbia is well-ranked for Finance and support, and Innovators (levels 96.2 and 92.8, respectively). In comparison to the EU average, the poorest results were recorded for Intellectual assets and somewhat better ones for the Research system (only 3.1 and 46.7, respectively) [7].
Graph 1 Innovation performance per dimension In the comparative analysis of innovation performances, republics of former Yugoslavia are taken into consideration as control points. It is important to note that for several decades they pursued the same sort of planned-market economies but, in the meantime, all of them have started market reforms.
Looking at the Summary Innovation Index (SII) in the period of the current crisis (Graph 2), one can see that Serbia was improving its innovation performances year by year (from 0.255 to 0.365), on average by 6.8% per year, which is the most among the observed republics of the former Yugoslavia (FYROM, Croatia and Slovenia) [7]. It is worth noting that two of them, Slovenia and Croatia, are EU members. As regards the first dimension, Human resources, Serbia is by 1/3 below the EU-27 average (65.9 if EU-27 is considered as 100). Compared to other countries, it is at the same level as FYROM but below Slovenia and Croatia which is at the EU average (0.367, 0.367, 0.671 and 0.586, respectively) [7]. According to the indicator Youth with upper secondary education, Serbia is close to the EU-27 average but with two others, New doctoral graduates and Population with completed tertiary education, there is room for improvement. If one looks at development trends over the period under consideration, one can see that great improvement (above average) was made with the number of new doctoral graduates, and a modest one with tertiary level education.
00.10.20.30.40.50.60.7
Summary
Innovation
Index
Human
resources
Open, excellent
and attractive
research …
Finance and
support
Firm
investments
Linkages &
entrepreneurshi
p
Intellectual
Assets
Innovators
llow
EU27
SI
HR
RS
MK
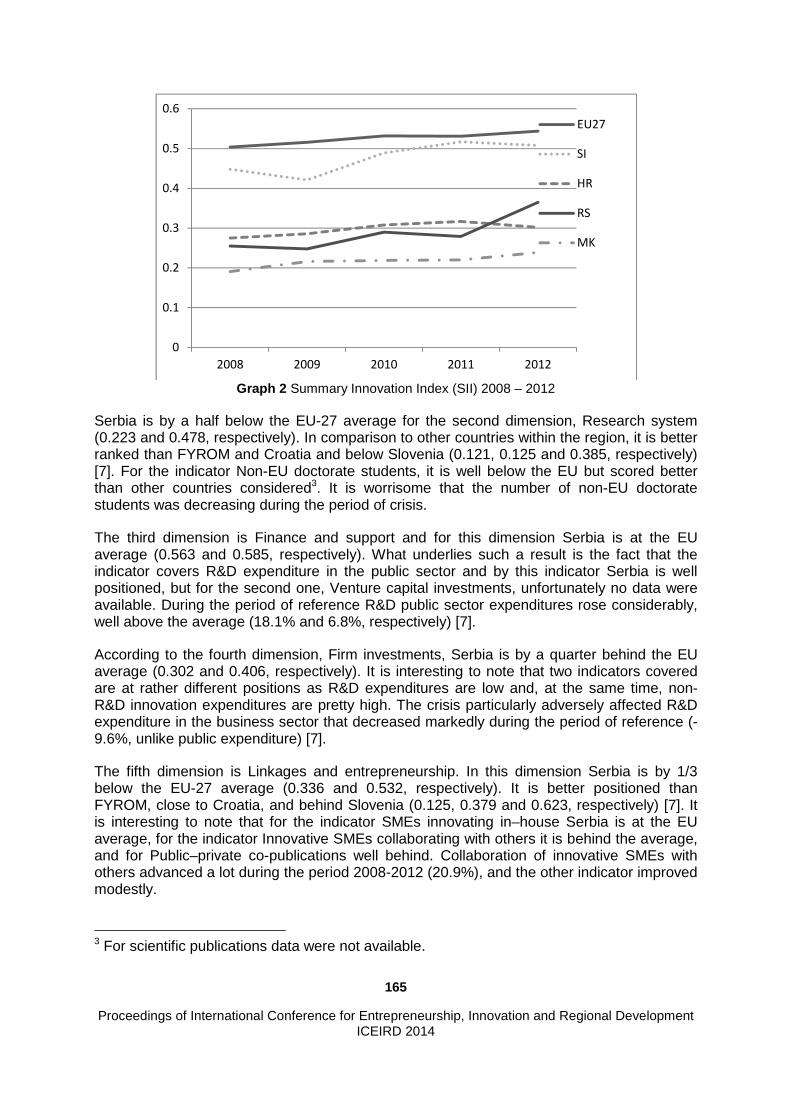
165
Proceedings of International Conference for Entrepreneurship, Innovation and Regional Development ICEIRD 2014
Graph 2 Summary Innovation Index (SII) 2008 – 2012
Serbia is by a half below the EU-27 average for the second dimension, Research system (0.223 and 0.478, respectively). In comparison to other countries within the region, it is better ranked than FYROM and Croatia and below Slovenia (0.121, 0.125 and 0.385, respectively) [7]. For the indicator Non-EU doctorate students, it is well below the EU but scored better than other countries considered3. It is worrisome that the number of non-EU doctorate students was decreasing during the period of crisis.
The third dimension is Finance and support and for this dimension Serbia is at the EU average (0.563 and 0.585, respectively). What underlies such a result is the fact that the indicator covers R&D expenditure in the public sector and by this indicator Serbia is well positioned, but for the second one, Venture capital investments, unfortunately no data were available. During the period of reference R&D public sector expenditures rose considerably, well above the average (18.1% and 6.8%, respectively) [7].
According to the fourth dimension, Firm investments, Serbia is by a quarter behind the EU average (0.302 and 0.406, respectively). It is interesting to note that two indicators covered are at rather different positions as R&D expenditures are low and, at the same time, non-R&D innovation expenditures are pretty high. The crisis particularly adversely affected R&D expenditure in the business sector that decreased markedly during the period of reference (-9.6%, unlike public expenditure) [7].
The fifth dimension is Linkages and entrepreneurship. In this dimension Serbia is by 1/3 below the EU-27 average (0.336 and 0.532, respectively). It is better positioned than FYROM, close to Croatia, and behind Slovenia (0.125, 0.379 and 0.623, respectively) [7]. It is interesting to note that for the indicator SMEs innovating in–house Serbia is at the EU average, for the indicator Innovative SMEs collaborating with others it is behind the average, and for Public–private co-publications well behind. Collaboration of innovative SMEs with others advanced a lot during the period 2008-2012 (20.9%), and the other indicator improved modestly.
3 For scientific publications data were not available.
0
0.1
0.2
0.3
0.4
0.5
0.6
2008 2009 2010 2011 2012
EU27
SI
HR
RS
MK
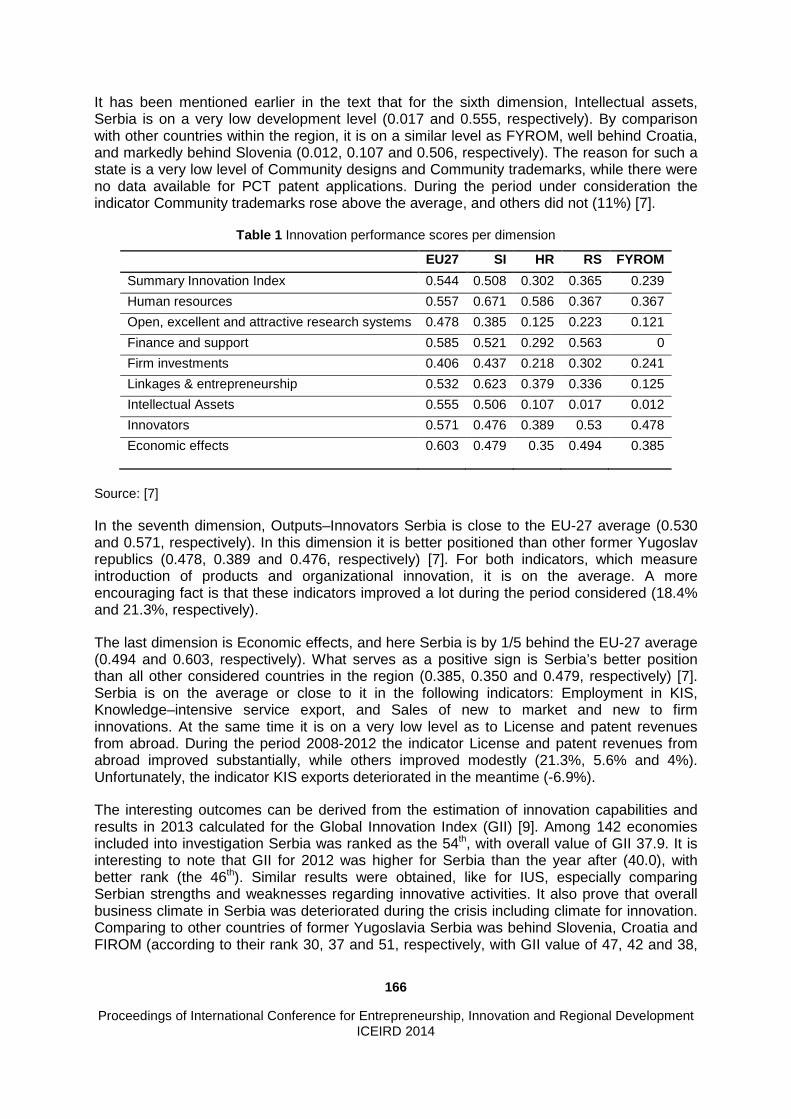
166
Proceedings of International Conference for Entrepreneurship, Innovation and Regional Development ICEIRD 2014
It has been mentioned earlier in the text that for the sixth dimension, Intellectual assets, Serbia is on a very low development level (0.017 and 0.555, respectively). By comparison with other countries within the region, it is on a similar level as FYROM, well behind Croatia, and markedly behind Slovenia (0.012, 0.107 and 0.506, respectively). The reason for such a state is a very low level of Community designs and Community trademarks, while there were no data available for PCT patent applications. During the period under consideration the indicator Community trademarks rose above the average, and others did not (11%) [7].
Table 1 Innovation performance scores per dimension
Source: [7]
In the seventh dimension, Outputs–Innovators Serbia is close to the EU-27 average (0.530 and 0.571, respectively). In this dimension it is better positioned than other former Yugoslav republics (0.478, 0.389 and 0.476, respectively) [7]. For both indicators, which measure introduction of products and organizational innovation, it is on the average. A more encouraging fact is that these indicators improved a lot during the period considered (18.4% and 21.3%, respectively).
The last dimension is Economic effects, and here Serbia is by 1/5 behind the EU-27 average (0.494 and 0.603, respectively). What serves as a positive sign is Serbia’s better position than all other considered countries in the region (0.385, 0.350 and 0.479, respectively) [7]. Serbia is on the average or close to it in the following indicators: Employment in KIS, Knowledge–intensive service export, and Sales of new to market and new to firm innovations. At the same time it is on a very low level as to License and patent revenues from abroad. During the period 2008-2012 the indicator License and patent revenues from abroad improved substantially, while others improved modestly (21.3%, 5.6% and 4%). Unfortunately, the indicator KIS exports deteriorated in the meantime (-6.9%).
The interesting outcomes can be derived from the estimation of innovation capabilities and results in 2013 calculated for the Global Innovation Index (GII) [9]. Among 142 economies included into investigation Serbia was ranked as the 54th, with overall value of GII 37.9. It is interesting to note that GII for 2012 was higher for Serbia than the year after (40.0), with better rank (the 46th). Similar results were obtained, like for IUS, especially comparing Serbian strengths and weaknesses regarding innovative activities. It also prove that overall business climate in Serbia was deteriorated during the crisis including climate for innovation. Comparing to other countries of former Yugoslavia Serbia was behind Slovenia, Croatia and FIROM (according to their rank 30, 37 and 51, respectively, with GII value of 47, 42 and 38,
EU27 SI HR RS FYROM
Summary Innovation Index 0.544 0.508 0.302 0.365 0.239
Human resources 0.557 0.671 0.586 0.367 0.367
Open, excellent and attractive research systems 0.478 0.385 0.125 0.223 0.121
Finance and support 0.585 0.521 0.292 0.563 0
Firm investments 0.406 0.437 0.218 0.302 0.241
Linkages & entrepreneurship 0.532 0.623 0.379 0.336 0.125
Intellectual Assets 0.555 0.506 0.107 0.017 0.012
Innovators 0.571 0.476 0.389 0.53 0.478
Economic effects
0.603 0.479 0.35 0.494 0.385

167
Proceedings of International Conference for Entrepreneurship, Innovation and Regional Development ICEIRD 2014
respectively) and better positioned than Bosnia and Herzegovina (ranked as the 56th, with GII value of 36).
According to Output Innovation Sub-Index Serbia was ranked as the 51st, with value of 34. This sub-index captures 5 pillars. For Institutions Serbia was modestly positioned: the 71st according to its rank, and value of index of 61. „Cost of redundancy dismissal, salary weeks“ was estimated as its strength. For human capital and research, it was much better estimated (the rank 50 and value 37), with three strengths: public expenditure per pupil, pupil – teacher ratio for secondary schools and percentage of graduate in science and engineering. For Infrastructure Serbia was estimated similar (the rank 50 and value 37), with satisfied level of implementation of ISO ecological standards, as its strength. Market sophistication can be pointed as the worst estimated pillar of Serbia (the rank 97 and value 41), with following weaknesses: investments, venture capital deals per PPPGDP, level of internal and external competition. For business sophistications Serbia was modestly ranked (the rank 73 and value 31), with following weaknesses: R&D financed by business, innovation linkages and by state of clusters development.
According to Input Sub-Index Serbia was ranked as the 63rd, with index value of 42. This sub-index captures two pillars. According to Knowledge and technology outputs Serbia was well positioned (the rank 41 and value 34), with following strengths: scientific and technical articles and the level of ISO certification. At the same time for Creative outputs Serbia was not well estimated (the rank 84 and value 35). “Intangible assets” and “Generic top-level domains”, was pointed as weaknesses and “Trademark registration” and “Audio visual and related services exports”, as strengths.
Table 2 SWOT analysis of innovation performance
Strengths Weaknesses
- Finance and support - Innovators
- Intellectual assets - Research system
Opportunities Threats - Humans resources - Linkages and entrepreneurship
- Economic crisis - Slow market reforms
5. Policy implications Small and medium-sized companies and shops in Serbia are facing severe limitations to development and introduction of innovation activities. This is an important obstacle to their growth, strengthening of their competitiveness, and their contribution to overall economic development. The business environment is not conducive to innovation, and thus most of the SMEs do not base their development on innovative products and solutions. These factors inevitably produce: low competitiveness, low profitability, orientation toward the domestic market exclusively, limitations to development and, consequently, a short lifespan of SMEs. In order to alter such an unfavourable environment, we need to create a business environment which is beneficial for and conducive to development and enhancement of innovative activities, and to speed up the involvement of domestic SMEs in national and international innovation and development flows.
Official development policies, strategies and other development documents in Serbia clearly promote development based on knowledge and innovation. These documents also define measures and activities, institutions and organizations, mechanisms and programs essential for the enhancement of innovative activities and development of all economic agents,
168
Proceedings of International Conference for Entrepreneurship, Innovation and Regional Development ICEIRD 2014
including SMEs [10]. Framework for SME development policy has been comprised of the Development Strategy of Competitive and Innovative Small and Medium – Sized Enterprises for the period 2008-2013. It defines medium-term priorities and directions of the development of entrepreneurship in Serbia. The aim of the Strategy is to develop entrepreneurial economy based on knowledge and innovation, which creates a sustainable, competitive and export-oriented SME sector. The Strategy is based on 5 pillars, including: Promotion and support of entrepreneurship and establishments of new enterprises; Human resources for competitive SME sector; Financing and taxation of SMEs; Competitive advantages of SMEs in export markets; Legal, institutional and business environment for SMEs. Good practice examples coming from different countries successful in innovation development show that efficient support to innovative SMEs consists of a wide range of activities and measures, programs and institutions, but there are no universal recommendations. What all successful countries have in common is a clear development orientation toward a knowledge-based society. This involves the creation of preconditions for innovation development, such as: the development of a financial sector that stimulates innovative SMEs, development and strengthening of capacities of scientific and research public and private institutions, and of different institutions for the support to and linkages between science and economic entities. Certain comprehensive mechanisms that help SMEs become innovative are: a) projects designed to develop a favourable environment for innovations; b) programs and instruments for direct support to SME in development and implementation of innovations, and c) projects and programs which indirectly contribute to innovation development within SMEs [11]. As regards findings of the research made, there is a fear that the economic crisis and slower market reforms could continue to negatively influence the national economy, including the SMEs. It is necessary to adjust business support policy for SMEs that are by their nature more sensitive to crisis conditions than large companies, and without a broader support they are not capable of engaging sufficient sources in a dynamic development: - Support measures for general SME development should be significantly strengthened; - Support measures for general SME development should be implemented in combination
with special measures for support the most dynamic companies and so-called gazelles; - A new growth model should be applied, based on export demand, increased
employment, investments, decreased public consumption, strengthening of the manufacturing sector simultaneously with the development of the services.
A special attention should be paid to development of dynamic entrepreneurship, as a part of overall SME support: - Establishing a complete support system and solving the main problems for enterprises
development in the growth and development stage; - Transfer for support policy for the overall SME sector into support policy for dynamic
entrepreneurship[p; - Changing prevailing financing method into combination of public and private sources
(including angels, venture capital and securities financing); - Giving advantage to dynamic entrepreneurship promising high growth when providing
access to resources; - Conducting regulatory reforms by combining removing barriers for new company
establishment with creating favourable conditions for dynamic companies and the most dynamic, so-called gazelles.
6. Conclusion The recovery of business demography of SMEs, positive developments in foreign trade, and the official EU candidate status are encouraging signals which suggest Serbian economy might be close to overcoming the crisis and recession. Given that innovation is a key factor in
169
Proceedings of International Conference for Entrepreneurship, Innovation and Regional Development ICEIRD 2014
improving competitiveness, the comparative analysis and the dynamic analysis were performed. The comparative analysis of innovation achievements of SMEs specified that their comparative advantages on the global market lie in innovators, financial support, costs of redundancy dismissal, secondary education, ISO standardization, ICT imports, audio-visual services exports and graduate in science and engineering. At the same time it indicated that there is room for improvement in human resources, investment, tax payment system, venture capital, cluster development, international and local competition, linkages between businesses and scientific and research organizations and entrepreneurs. Having in mind that market reforms have lost momentum during the crisis, the transition process needs to be accelerated so that the business environment would become attractive for all the economic agents, including SMEs. In order to increase number of small economic entities measures of general support to SMEs should be strengthened. Special attention should be paid to dynamic SMEs and the most dynamic one, called gazelles. References 1 Ateljevic J. – Schumpeterian growth theory: Entrepreneurship – a response to the economic downturn, Acta Economica, Banja Luka, No18, 2013 2 Harrison N.J. and Watson T. – The Focus for Innovation in Small and Medium Service Enterprises, Conference proceedings of the 7Th Annual Meeting of the Western Decision Sciences Institute, 7-11 April Reno, NV, USA 1998 3 Audretsch D.B. – Dynamic Role of Small Firms: Evidence from US, Small Business Economics, 18 (1) 1340, 2002 4 ECORYS – EU SMEs in 2012: at the crossroads. Annual report on small and medium sized enterprises in the EU 2011/2012, EC, 2012 5 Muscio A. – The Impact of Absorptive Capacity on SMEs Collaboration, Economics and Innovation and New Technologies, 16 (8), 653-668, 2006 6 EC – EU 2020: A European strategy for smart, sustainable and inclusive economy, EC 2010 7 EC – EU research and innovation scoreboard 2013, EC 2013 8 EC – EU research and innovation scoreboard 2011, EC 2012 9 Global Innovation Index 2013 – The Local Dynamics of Innovations, Dutta S., Lavin B., eds., Johnson Cornell University, Insead, WIPO, 2013 10 Zekovic S., Hadzic M. – Evaluation and integration of development projects into spatial plan of Republic of Serbia, ‘Sustainable spatial development of Danube region in Serbia’, Institute for Urbanism and Spatial Development of Serbia, Belgrade, 2012 11 Nikolic M. - SME's innovation activity as development factor of Serbia, PhD thesis, Faculty of Economics, Nis, 2013

170
Proceedings of International Conference for Entrepreneurship, Innovation and Regional Development ICEIRD 2014
Does Internationalization of Small and Medium Enterprises (SME-s) Determines the Allowance of Bank Loans for Investment – an overview of
Kosovo SME-s
Florin Peci1 1UNHZ, Elliot Engel, Peje, Kosovo, [email protected]
Abstract The present study determines firm and entrepreneurship characteristics in small and medium enterprises (SME-s) active in international trade to investment and growth. Through usage of data based on interviews from self-organized questionnaire with 180 SME-s in Kosovo, we investigated factors that influence the investment growth financed by bank loans. Econometric model of linear regression, indicates that a large number of firm and entrepreneurship characteristics significantly affect investment growth. The experience of SME-s in international trade as evidenced from used questionnaire is not show significant factor to obtain bank loans for relevant SME-s investment growth. Similarly, the sector of interviewed SME-s did not show our expectations –that the SME-s active in production and export are more prone to obtain bank investment loans. On the contrary banks have shown more interest to support financially through bank loans SME-s active in the trade sector. For most of the banks operating in Kosovo distribution of bank loans is based on SME-s, business plan, and audit statements. In particular, SME-s collateral is one of the determinant factors for bank decision on distribution of loans. Generally the commercial banks in Kosovo treat the SME-s activities as risky endower related with the payback of the bank loans. However, our findings suggest that there are some factor that do increase the prospects of SME-s to obtain bank loans. Education of SME-s managers have higher rate of financing sources through bank loan. The study concludes with respective findings translated in to recommendations to be considered by relevant stakeholders active in entrepreneurship and policy making.
Keywords SME-s, international trade, entrepreneurship, financing through debt, investment growth, Kosovo.
1. Introduction
It has been stated that SME-s are the engine of economic growth [1], [2]. SME-s generates employment, they do contribute to gross domestic product (GDP) and they do enhance technologic innovation [1]. The high relevance of SME-s has been confirmed for the post conflict countries ince they have a crucial role in over passing difficulties that are characteristic for transformation processes [3], [4], [5], [6].
The empiric studies of SME-s investment finance is of particular importance [7], [8], [9]. Access to finance, mainly bank financing remains the most crucial element in the

171
Proceedings of International Conference for Entrepreneurship, Innovation and Regional Development ICEIRD 2014
development of SME-s sector [10]. Moreover access to financing poses greater obstacle for the SME-s in transition countries that in a long run affects the growth of SME sector compared to larger firms [7], [8].
In trying to explain SME-s financing from the perceptive of supply side Beck et al. [11] on their survey of 91 banks in 45 countries found that banks consider SME-s sector as very profitable. The authors found little variances on the way how banks interact with SME-s based on developed economies and developing ones. Their conclusion is that enabling environment is more important than the size of the firm or bank [8].
A considerable number of scholars confirm that SME-s face much difficulties reaching loans, due to requests for unnecessary documentations which results with higher transaction costs [8]. According to Audretsch and Elston [12] small firms confront higher financial difficulties than large ones [8], [13]. Due to the information asymmetry SME-s rather use internal financial resources than external ones, i.e. bank loans in increasing investments growth [14], [15], [16], [17], [18], [19].
Kosovo as the newest state in the world undergoing transitional period is not exempt from financial constraints for SME-s growth. The bank sector in Kosovo is relatively new one. Currently it comprises of nine (9) newly established commercial banks, which among other businesses deal with SME-s financial support in the form of investment loans. In particular the investment loans are of higher relevance to the SME-s that operate in international trade aiming for development and expansion of their activities [20].
The objective of this study is to assess the role of the factors that influence the investment growth to the SME-s that operate in international trade. In order to study relevance of the main factors that impact investment growth through bank loans we have developed econometric model which defines key variables on investment growth of the SME-s active in international trade. The group of variables refers to firm characteristic, entrepreneurship and external sources of finance.
The organization of the work is structured as follows. The first section provides introduction, background of bank sector in Kosovo and internalization of Kosovo SME-s. In next section we discuss the theoretical aspect and literature review. In section three we provide the research hypotheses, data and model specification. In section four we discuss results. The paper concludes with findings based of research done.
1.1. Banking sector in Kosovo
The banking sector in Kosovo is a new one. It has been established after the conflict of 1999. The banking system in Kosovo is regulated by license issued by the Central Bank of Kosovo (CBK) that at the same time monitors and regulates the banking system. The banking sector in Kosovo comprises only one of financial institutions that are operating in Kosovo [20]. Entire number of financial sector counts in total 70 financial institutions, including banking industry, insurance companies, pension funds, and others [21].
The development of banking sector in Kosovo is characterized with the presence of foreign capital due to the fact that there was not a local capital in place in the beginning of establishment of banking system. It is to be noted that the first bank comprised of foreign and local capital was ProCreditBank that still operates in Kosovo as one of the most successful banks. Its success lies on the collection of deposits and latter the same has been used for loans. Currently around 72 percent of assets are managed by foreign banks. Seven from

172
Proceedings of International Conference for Entrepreneurship, Innovation and Regional Development ICEIRD 2014
nine banks operating in Kosovo are of foreign capital. While the presence of foreign financial institutions has had positive impact on the modernization of the banking system in Kosovo, there is a risk of dependency from foreign capital.
Since the establishment of the banking sector in Kosovo it was evidenced the growth of deposits which amounted almost 2.1 billion Euros recording an annual growth of about 8.5 percent [21], [22]. Activities of the commercial banks is dominated by loans out of which 67 percent go to SME-s, 30 percent went to households. The loan structure is comprised of 71 percent in the service sector out of which trade sector absorbed 73 percent. On the other hand the industry sector market 25 percent of total loans [21]. Agriculture sector holds the lower share to loans with only 3.5 percent of total loans [20].
One issue to be mentioned here is the fact that interest rate have remind high when compared to the interest rates in the region in contrary to the expanded loan volumes annually [20]. In practice it meant that SME-s were forced to obtain investment loans under very unfavourable interest rates as provided by the banks. The high interest rates in the banking sector in Kosovo is justified by banks themselves through stating that high rates are as result of insecurity with loan payback. The banks provided a several factors as country risk characterized by weak institution, corruption, non functional justice sector, information asymmetry, poorly developed business plan, insecurity related to collateral implementation, and others [20]. Despite the above stated there is general opinion of businesses in Kosovo that commercial banks have engaged in informal silent agreement for sticking to high interest rates for loan allowance. As a result SME-s sector are using bank loans for investment in businesses only when they do not have other alternatives. The businesses prefer usage of internal sources for investments.
1.2. Internationalization of Kosovo SME-s
The very young and dynamic economy of Kosovo is characterized by its transformation from centralized planned economy to the market economy with the end of the conflict of 1999. Before that, Kosovo economy was a typical agrarian, with slow development industry in 80s. The functionalization of the entrepreneurship in former Yugoslavia has been established under the Law on enterprises in 1988 which provided for basic conditions of established private businesses [23]. In fact SME-s in Kosovo are related to political situations in Kosovo due to the Serbian regime repression that involved expulsion of Kosovo Albanians from public enterprises. As a result SME-s have been established as a way of survival where families and community generated income for themselves and assisted the others.
After 1999, SME-s have been regulated by United Nations Mission in Kosovo (UNMIK’s) legal framework. It was this time when SME-s penetrated in international trade. At first, SME-s involvement in international trade is a result of high demand of imported goods due to the rebuilding of the country and high international presence. Public enterprises as inherited by previous system underwent privatization process under Kosovo Trust Agency (KTA). At this stage Kosovo engaged in Free Trade Agreement with neighbouring countries i.e. FYROM, Republic of Albania, Republic of Montenegro, BiH, etc. Later, this cooperation resulted with engagement in a general Free Trade Agreements with countries in region known as Central European Free Trade Agreement (CEFTA).After the declaration of the independence of Kosovo in 2008, UNMIK authorities for regulating international trade have been transformed to local authorities.

173
Proceedings of International Conference for Entrepreneurship, Innovation and Regional Development ICEIRD 2014
Kosovo in 2012 reached an amount of 3 billion Euros in trade flows, an increasing of 15 percent compared with a year ago. While, exports during the 2012 achieved around 312 million Euros that covers about 10 percent the total imports in Kosovo [20]. Still Kosovo main trading partners are European Countries (EU) and CEFTA Countries. Kosovo exports to the EU countries were about 45 percent in 2011 of the total exports which compared with the previous year is an increase of 5 percent [22]. Related export to CEFTA countries in 2011 we observe an increase of exports of 26 percent compared to previous years. On the other hand related to Kosovo imports to EU countries were 42 percent of the overall total imports which compared to previous year increased by 17 percent. Imports from CEFTA countries were 37 percent of total value, compared with previous year there was decrease of 7 percent.
In the process of export and import of Kosovo, it’s SME-s that are dominating as a most relevant factor. Currently there are around 110000 businesses registered SME-s [22], of which 28000 SME-s are engaged in international trade. In their daily business in international trade SME-s face many problems such as lack of experience, lack professionalism, limited business information, lack of institutional support, lack of financial means, and others. An evident obstacle is usage of existing bank loans. SME-s in international trade have more positive approach to bank loans for investment purposes. On the other hand since relevance SME-s operate in international trade banks are hesitate to grant bank loans due to the risk that those SME-s are exposed. Due to the expansion of SME-s in international trade there is a higher need for financial support in the form of bank loan. Overall, there is existing tension between a need of SME-s for financial support and bank loan schemes in Kosovo.
2. Theory and literature review
The theoretical framework to which most of the current research literature adheres has been quite helpful in understanding the financing of SME-s, which influences the performance of investments, their growth and development, their internationalization in developed and developing countries. The theoretical framework can generally be describes in terms of the static trade off theory by Modigliani and Miller [26], the pecking order theory [27], managerial theory of investments [28], agency theory by Jensen and Meckling [29] and extended by Stiglitz and Weiss [30].
Based on the neoclassical theory of investment (M-M) internal and external sources of financing are more relevant than the capital structure for the value of the firm. In the situations where there is a perfect functioning of the market, the choice between financing through capital or debt is irrelevant. Therefore, the cost of capital and the market value of the firm are independent from the value of the firm (Modigliani and Miller, 1958). The theory of M-M is starts at the following paradigms there are no taxes, there are no transaction costs, and there are no bankruptcy costs, the equal cost of debt for companies and for investors, symmetrical information in the market, there is no influence of debt in the profit of the company before interest and taxation.
Contrary to the M-M, Scott [31] firmly emphasized that 100% tax shield does not exist in reality, because of distress costs. Scot states that debt leads to legal obligation to pay interest and principal. Later Fatoki and Asah [32] conclude that if a firm cannot meet its debt obligation, it is forced in to bankruptcy an incurs associated costs [32]. This theory, in fact, does not take into the consideration all the other factors, such as: the costs of the bankruptcy of the firm, the costs of the agency, the impact of debt in profit, the asymmetry of information, and, therefore, this theory is challenged by other theories [33].

174
Proceedings of International Conference for Entrepreneurship, Innovation and Regional Development ICEIRD 2014
According to Pecking Order Theory (POT), the firm initially should prefer usage of internal sources of financing compared to the external ones. , and, regarding external sources, they prefer debt to capital [27]. Thus, initially SME-s should use the accumulated profit, amortization, debt, and, finally, the equity capital. This theory provides that the firms finance their investment requirements based on a hierarchic order. This can lead to existence of the asymmetry of information between managers (insiders) and investors (outsiders). Consequently, managers have more information then investors [27].
The Agency Theory, of Stiglitz and Weiss [30] describe the problem arising as a result of asymmetrical information, between managers and shareholders on one hand, and the problem among shareholders, managers and creditors, on the other. They argue that only SME-s are aware of their real financial structure, the real strength of their investment projects, and the tendencies for settling up the debt. Therefore, the firm possesses superior private information [34].
3. Data, research hypothesis, and model specificat ion
In this study datas have gathered from the questionnarie undertaken on 2012. The sample is comprised from only with the informations from SME-s that are involved in international trade. The SME-s has been taken randomly, from database at the Agency for Businesses Registration in the Ministry of Industry and Trade of Kosovo, and it is stratified in three basic sectors, in order to reflect eventual changes among the production, trade and service firms. Interviews were conducted directly (face to face) with owners/managers, or financial managers of the firms. The questionnaire was designed to obtain information’s on firm characteristics, entrepreneurship and the finance modalities through bank loans.
In this study we have build up this hypotheses:
H1: exporting SME-s are using more bank loans for investment growth than SME-s that are not exporting
H2: Those SME-s that have business plan are using more bank loans for investments than those SME that have not developed business plan
H3: SME-s that do poses colateral have more probability to use more bank loans for investments growth that SME-s that do not have colateral
H4:SME-s that are larger have more probability to reach bank loans than smaller SME-s
H5: SME-s with higher turnover have more probability to reach bank loan for investment growth
H6:SME that have regular transaction in international trade more easily gain overdraft for investment growth
H7: SME-s that have experience in international trade are better positioned to get bank loans for investment growth
H8:SME-s that are managed by educated managers have higher probability for geting bank loans for investment growths
H9: SME-s that obtain audit statements are better positioned to reach bank loans for investment growth
The model
LnINVESTGROWTH = 3 + β4 FIRMEXPORT + β2 LARGFIRMS + β5 AUDIT + β6 COLLATERAL + β7 TURNOVER + β8EXPERIENCE +β9 BPLAN + β: EDUMANAGER + β; REGULARTC

175
Proceedings of International Conference for Entrepreneurship, Innovation and Regional Development ICEIRD 2014
We have used linear regression to test the hypotheses. In this model the depend variable is logarithm of amount of finances received as bank loan by a given firm in 2012. In the group of independent variables are FIRMEXPORT as a dummy variable which shoes SME-s that export are using bank loans more frequently. The variable BPLAN as a dummy variable shows that SME-s that have detailed business plans have more chances to obtain investment loans. The variable COLLATERAL determined as a value shows that SME-s with high collateral a better positioned to obtain banking investment loans.
The variable LARGFIRMS as a result determined by the number of employee’s shows that larger SME-s are more prone to benefit bank loans. The variable TURNOVER determined as amount of turnover in Euros shows that SME-s that have higher turnover can access bank loans. The next variable REGULARTC as a dummy variable shows SME-s that have regular transaction a better positioned to obtain bank loans. Also here is included a variable EXPERIENCE measured through years active in international trade. The dummy variable EDUMANAGER shows that SME-s which are managed by education managers are more capable of getting bank loans. The variable AUDIT as a dummy variable shows that SME-s which are regular in keeping audit statements have more chance to obtain bank loans for investment growth. 4. Research findings In this study we have developed statistical analyses in STATA software. The method for measuring the impact of explanatory variables on depended variable is Ordinary Least Square (OLS). We considered as a more appropriate in order to evident the variation of variables. From the results obtained in the model on Table 2, it is evident that variable BPLAN have a positive impact on getting bank loan for firm investment. Also there is a correlation between achieving investments and audit statements that shows that firms which hold audit statements benefit higher investment bank loan [35]. Firms that have collateral have higher possibilities to obtain bank loans and this was confirmed by Maziku [36]. It is stating that the asymmetric information between the debt-seeking SME-s and the bank, is reflected in the incapability of the majority of SME-s to provide consistent financial data and coverage of bank risk through real estate. This has been confirmed also by other authors as a key instrument in the decision making regarding the use of banking loans by the firms [37], [38]. In addition there is a positive correlation between investment growth and education of managers (Table 1). The high level of professionalism of human capital (education and experience) impacts positively the growth of the firm. Young age and low level of education owners are more prone in using the external sources of financing. In the meantime the owners of more mature age and with higher education, the so called “wiser” ones, can be found as less interested for external sources of financing [39]. Based on the results, we conclude that the regression linear model mentioned above is specified good, given that R-squared 0.38, which shows that the variation in independent variables explains the variation in dependent variable for more than 38%. In continuation, the variables FIRMEXPORT, LARGFIRMS, EXPERIENCE and REGULARTC despite that they have positive sign are not significant in statistical aspect. This shows that the firms in Kosovo that export do not differ from other firms in international trade. Also larger and experienced SME-s in international trade are not significant in statistical aspect and this shows that the longer presence of those firms in international trade is not determined for getting loan for investment purposes. In addition, the statistical F-test, shows that rest of the independent variables, jointly are statistically significant, and different from zero.
Regarding the correlation analysis we can conclude that the problem of correlation in independent variables is not present in our data, given that there are not higher coefficients in our estimation. The dependent variable has a normal distribution and does not represent a statistical problem that requires treatment.

176
Proceedings of International Conference for Entrepreneurship, Innovation and Regional Development ICEIRD 2014
Table 1: Correlation between coefficients at 5% level of significance
FEXPORT
LFIRMS
AUD
COLLAT
TURNOV
EXPER
BPLAN
EDUMAN
REGTC
FIRMEXPORT 1.0000
LARGFIRMS 0.328 1.0000
AUDIT 0.0678 0.0684 1.0000
COLLATERAL 0.0888 0.0896 0.6603 1.0000
TURNOVER 0.0063 0.0064 0.1287 0.1580 1.0000
EXPERIENCE 0.0414 0.0417 0.3984 0.3036 0.2015 1.0000
BPLAN 0.0913 0.0904 0.2898 0.3770 0.1592 0.2558 1.0000
EDUMANAGER 0.0497 0.0501 0.1154 0.0341 0.0886 0.0784 0.2889 1.0000
REGULARTC 0.1456 0.1457 0.0955 0.1101 0.0656 0.2052 0.0936 0.6221 1.0000
Source: Own calculation
Table 2. Determinants of SME-s investments growth financing through bank loans.
LnINVESTGROWTH
Coef. Std. Err. t P>|t| [95% Conf. Interval]
FIRMEXPORT .0000428 .0000296 1.45 0.150 .0001013 .0000157
LARGFIRMS .000029 .0000198 1.47 0.144 9.98e-06 .000068
AUDIT .2188964 .0672564 3.25 0.001 .0861081 .3516846
COLLATERAL .21416 .0498338 4.30 0.000 .3125497 .1157702
TURNOVER .1286084 .0598119 2.15 0.033 .0105183 .2466984
EXPERIENCE .036652 .0490946 0.75 0.456 .1335824 .0602784
BPLAN .4111606 .0616921 6.66 0.000 .5329629 .2893583
EDUMANAGER .3444844 .0940774 3.66 0.000 .158742 .5302268
REGULARTC .104343 .0722254 1.44 0.150 .2469418 .0382558
_CON
N=180
R2 =0.38
.7006492 .2063279 3.40 0.001 .2932842 1.108014
Source: Own calculation

177
Proceedings of International Conference for Entrepreneurship, Innovation and Regional Development ICEIRD 2014
5. Conclusion
This paper aims to explore the factors which have an impact on investment growth for SME-s which are active in international trade. Internationalization of SME-s is a key factor in their growth and development and a country’s economy in general. Therefore SME-s in international trade are more in need for the bank loan which they use for increased investment in business expansion and export in other countries. The Ability of SME-s to develop proper growth strategy depends heavily on the SME-s potential to invest in the restructuring and innovations. They require capital investments, which usually is obtained through access to finance [34].
In our findings, especially bank loan for financing the face export and production is not attractive for banks, which is contrary to other research findings in this direction. This relates to the purpose of commercial banks in Kosovo which are not very interested in SME-s which relate debt repayment term longer than other SME-s whose cycle capital is faster and with this the return of bank loan. On the other hand SME-s that support audit and attest statements regular evidence not only for tax administration purposes but also for banking purposes are the most important factor in the allocation of bank loan for investment purposes in the case of Kosovo, especially SME-s are trading attractive. In the difficult position of getting bank loan for investment purposes are SME-s in the agricultural sector. To be attractive in sharing bank loan to SME-s must possess the sufficient collateral and which can be converted quickly into cash. We finally describe that despite some limitations that the SME-s sector results obtained can serve as recommendations for SME-s sector in Kosovo and policy making institutions.
References
1. Acs, Z. and Audretsch, D. (1990). “Innovation and small firms”. Cambridge: MIT Press.
2. Johnson. S., and Loveman, G.(1995).” Starting Over in Eastern Europe: Entrepreneurship and Economics Review, 48(3): 261-297.
3. Aidis, R and Estrin, S. (2006). Institutions, networks and entrepreneurship development in Russia: An exploration. Discussion Paper Series, IZA, DP No. 2161.
4. Audretsch, D .B. and Klepper, S. (2000). “ Innovation, Evolution of Industry and Economic Growht: Elgar reference Collection” , International Library of Critical Writings in Economics, Cheltenham, UK.
5. McMillan, J. and Woodruff, C. (2002). The Central Role of Entrepreneurs in Transition Economies. Journal of Economic Perspectives, 16 (3): 153-170.
6. Hoxha, D. (2009). Barriers to doing business in Kosova: an institutional approach. International Journal on Entrepreneurship and Small Business, 8 (2): 186-199
7. Schaffer, M. and Weder, B. (2001). Firm size and the business environment: Worldwide survey results. International Finance Corporation, Discussion Paper No. 4
8. Beck, T., Demirguc-Kunt, A., Laeven, L., and Maksimovic, V. ( 2006). “Financial and Legal Constraints to Firm Growth: Does Firm Size Matter”, Journal of Finance, 60: 137-177.doi.org/10.1016/j.jimonfin.2006.07.005.
178
Proceedings of International Conference for Entrepreneurship, Innovation and Regional Development ICEIRD 2014
9. Krasniqi, B.(2007). “Barriers to Entrepreneurship and SME Growth in transition: The case of Kosova”, Journal of Development Entrepreneurship, 12 (1):71-940.DOI:10.1142/S1084946707000563.
10. World Bank (2005). A better investment climate for everyone: World Development Report 2005. New York: The World Bank and Oxford University Press.
11. Beck, T.H.L., Demirguc-Kunt, A., and Levine, R. (2007).” Finance, Inequality, and the Poor”, Journal of Economic Growth, 12,.27-49.
12. Audretsch, D .B., Elston, J. ( 2006). “Does Firm Size Matter? Evidence on the Impact of Liquidity Constraint on Firm Investment Behavior in Germany ”. International Journal of Industrial Organization, 20(1) 1-17.
13. Oliveira, B., and Fortunato, A.(2006). “Firms Growth a Liquidity constrains: A dynamic Analysis”, Small Business Economics, 27(1), 139-56. http://dv.doi.org/10.1016/s0167-7187(00)00072-2.
14. Brinckmann, J., Salomo, S., & Gemuenden, H. G. (2011). “Financial Management Competence of Founding Teams and Growth of New Technology – Based Firms”, Entrepreneurship Theory and Practice , vol. 35, no. 2.DOI:10.1111/j.1514.6520.2009.00362.x.
15. Zhao, H., Wu, W., & Chen, X. (2006). “ What Factors Affects Small and Medium Sized Enterprise’s Ability to Borrow from Banks: Evidence from Chengdu City, Capital of South-Western China’s Sichuan Province”, working paper no.23, Berlin School of Economics.
16. Deakins, D., North, D., Baldock, R., and Whittam , (2008). “SMEs Access to Finance: Is Still Finance Gap?, Institute for Small Business & Entrepreneurship. Vol. 3 pp 11-19.
17. European Bank for Research and Development (1999).“ Transition Report: Ten Years of Transition, London, UK.
18. Pissardies, F., Singer, M. & Svenjar, J. (2003).“ Objectives and constraint of Entrepreneurs: Evidence from Small and Medium Sized Enterprises in Russia and Bulgaria”, Journal of comparative economics, vol. 31, no. 3pp 503-31.
19. Klapper, L., Sarria-Allende, V. & Sulla, V. (2002). “ SME Financing in Eastern Europe”, Washington D. C.: World Bank, Development research group.
20. CBK, (2012),”Annual Report “, Central Bank of the Republic of Kosovo. Prishtine
21. CBK, (2011),”Annual Report “, Central Bank of the Republic of Kosovo. Prishtine
22. MTI, (2009) “Trade Policy of Kosovo” Ministry of Trade and Industry . Prishtine.
23. Hoxha, D. (2008). Entrepreneurship, employment and fast-growing firms in Kosova. World Review of Entrepreneurship, Management and Sustainable Development, Vol. 4, Nos. 2/3, 2008
24. MTI, (2011) “Annual Report” Ministry of Trade and Industry . Prishtine.
25. MTI, (2013) “Annual Report” Ministry of Trade and Industry . Prishtine.
26. Modigliani, F., and Miller, M. (1958). “The Cost of Capital, Corporation Finance and the Theory of Investment “, American Economics Review, 48 (3): 261-297.
27. Mayers, S.C. & Majlyf, N.S. (1984). “Corporate Finance and Investment Decision: When Firms Have Information that Investors Do Not Have”, Journal of Financial Economics, 13, june, 187-222.
28. Marris, R. (1963).” A Model of the “Managerial” Enterprise”. Quarterly Journal of economics, 72 (2):1-33.
179
Proceedings of International Conference for Entrepreneurship, Innovation and Regional Development ICEIRD 2014
29. Jensen, M., and Meckling, W. (1976). “Theory of the Firm: Managerial Behavior, Agency Cost and Ownership Structure”, Journal of Financial Economics 3, 305-360.http://dx.doi.org/10.1016/0304-405x/76/90026-x.
30. Stigitz, J.E. and Weiss, A.(1981). “ Credit Rationing in Markets with Imperfect Information”, American Economic Review, 71: 393-410.
31. Scott, D.F. (1972). ”Evidence on the importance of financial structure” , Journal ofFinantial mangement, 1(3): 45-60.
32. Fatoki, O., & Asah, F. (2011). “The Impact of Firms characteristics on Access to Debt finance by SMEs in King Williams’ Town, South Africa”, International Journal of Business and Management, vo. 6, no. 8.http://dx.doi.org/10.5539/ijbm.v6n8p170.
33. Harris,M., and Raviv,A. (1991). “The Theory of capital Structure”, Journal of Finance 46, 297-355.
34. Mazzani , M. and Fatoki, O. (2012). “ Access to Finance in SME Sector: A South African Perspective “, Asian Journal of Business Management , 4(1): 58-67
35. Guffey, M. E. (2008). “ Business Communication: Process and Product: 6th Edition.
36. Maziku, M. (2012). “Credit Rationing for Small and Medium Scale Enterprises in the Commercial bank Loan market”, Dar es Salaam, Tanzania.
37. Zhang, G. (2008). “ The Choice of Formal and informal Finance. Evidence from Chengdu”, Journal of China economic Review, 19: 659-678.http://dx.doi.org/10.1016/j.chievo.2008.09.001.
38. Madura, J. (2007). ”Introduction to Business”, Fourth Edition, South Western :Thomson, USA.
39. Vos, E., & Yeh, A., & Carter, S., & Tagg, S. (2007). “The happy story of Small Business Financing”, Journal of banking and Finance, 31 , 2648-2672. http://dx.doi.org/10.1016/j.jbankfin.2006.09.011.


181
REGIONAL AND NATIONAL DEVELOPMENT STRATEGIES


183 Proceedings of International Conference for Entrepreneurship, Innovation and Regional Development
ICEIRD 2014
Cluster Policy and Cluster Governance in Croatia
Mirjana Dragičević1, Alka Obadić2 1 University of Zagreb, Faculty of Economics and Business - Zagreb, Sq. J.F. Kennedy 6, Zagreb, Croatia, [email protected]
2 University of Zagreb, Faculty of Economics and Business - Zagreb, Sq. J.F. Kennedy 6, Zagreb, Croatia, [email protected]
How to regain competitiveness, foster industrial re newal and exploit new economic opportunities has become the key question for Europ ean policy makers in these testing times of rapid globalisation and economic t ransformation. Cluster policies are of a huge importance for cluster emergence, growth and development. Generally, clusters have to be built according to specific eco nomic and social characteristics in each country. Each country should create its own cluster policy ac cording to its situation concerning the development of clusters an d its specific needs. So, generally, according to the literature on cluster policies, no standard cluster approach exists. These policies should be „tailored“ by national gov ernments and not just imitated from other countries. Their design and implementati on is closely connected with the model of governance. In this paper, specific situat ion according to cluster policies and the governance of regional clusters in Croatia woul d be analysed. After the analysis of existing national policies, the different models of regional policies and specific models of their governance should be evaluated. The crucial problem of clusters development in Croatia is regional and national non -coordination, according to cluster policies and their governance. The purpose of his p aper is to present how cluster policies and the governance should be created in th e small country - Croatia, in which regional disparities are very high. Dynamic bottom-up and interactive process between policy makers and practitioners in Croatia does not exist. National Coordination Body - National Cluster Centre stopped to work in 2010. During the last decade, there were significant efforts of Ministry of economy and of Croatian Association of Entrepreneurs, but the National Coun cil on Competitiveness does not exist. Some Regional development agencies made some initiatives on clusters, but, although some institutions know why clusters are im portant, there is no co-operation, coordination and no synergy between actors, nor mut ual trust between them. Our conclusion is that in Croatia there is a strong nee d to define institutional instruments for the policies implementation and monitoring of t he whole process. Cluster development asks for the new way of thinking and of acting between all stakeholders. The government bodies, as the creators of cluster d evelopment policies (i.e. integrated industrial and innovation policies) play a crucial role in fostering cluster development. In Croatia a huge task is still to be done, but it should be fast.
Keywords Cluster policy, Cluster governance, Cooperation, Croatia, Strategy
184 Proceedings of International Conference for Entrepreneurship, Innovation and Regional Development
ICEIRD 2014
1. Introduction
In the global economy that is constantly changing and that creates new challenges and threats for all economic agents, the importance of different types of networking among enterprise becomes one of the best forms for their future competitiveness growth. Today, there is enough empirical evidence (1) which demonstrates that innovations and competitiveness growth are mostly geographically concentrated. The importance of location and its context becomes more important for different stakeholders. In the global economy, location is one of the sources of differentiation among competitors, which cannot be simply imitated. Most enterprises all over the world are trying to create clusters. Clusters present the surrounding that stimulates the creation of the innovations and new knowledge. They are the specific kind of enterprise networking and of other supporting agents in specific industries and they strengthen a huge number of economic and non-economic advantages and even social capital in the regions. Regions with powerful clusters represent the regions- leaders of innovations, and the regions with a few isolated clusters, or even, without them, cannot reach such results. Globalization strengthens the benefits of strong clusters and the costs in the regions that do not realize clear profile of specialization. Strong clusters are emerging on the open market where, at the same time, coexist intensive competition and cooperation. They are emerging mostly in the regions where competitiveness stimulates enterprises and financial institution to choose some location /region for their future cluster activity. This is mainly the result of the attractiveness of some region, and not of the artificially created barriers on the international trade and investment. The globalization is widening the need to combine strong internal dynamics in clusters with relations among clusters and the markets on different locations (1, 2). As regional clusters present a specific form of networking between business, public sector and research and education organisations, the same as the civil sector organisations, due to the competitiveness growth of a region, they are based on the competition and cooperation. It demonstrates the local consensus and assumes the strategic networked relations among the stakeholders. The purpose of this paper is to research the situation dealing with cluster policies and cluster governance in a small, new member state of the European Union – Croatia. After introduction, the second part of the paper explains some general remarks on cluster policies and their governance. The third part of the paper presents the research results on cluster policies and their governance in Croatia. The last part gives conclusion which includes some proposals for the future development of cluster policies and their governance.
2. Cluster policies and cluster governance
Clusters are groups of independent companies and associated institutions that are (3): • Collaborating and competing; • Geographically concentrated in one or several regions, even though the cluster may
have global extensions; • Specialised in a particular field, linked by common technologies and skills; • Either traditional or knowledge based.
Clusters can be either institutionalised or non-institutionalised and they have a positive influence on: innovation and competitiveness, skill formation, information flows and growth,

185 Proceedings of International Conference for Entrepreneurship, Innovation and Regional Development
ICEIRD 2014
development and long-term business dynamics. They became the “key term” in new development initiatives, strategies and policies in last few years in Europe and in the globalised world. Cluster development does not allow the implementation of “one size fits all” models, but it should be “tailored” individually. Cluster approach is a part of the “family” of different approaches to innovative systems. Clusters require a new way of thinking on national, regional and local economies. In the European Union the cluster policy becomes the important component of economic policy. This is specially emphasized in the Lisbon strategy (6), which was accepted by the European Council in 2000 (4) and in the European strategy: Europe 2020 (3). Europe 2020 brings out the vision of the European social market economy for the 21 century. It suggests three priorities: 1. Smart growth, 2. Sustainable growth and 3., Inclusive growth (5). In the European Union it is considered that cluster development is correlated with prosperity and the competitiveness growth in some country (6), and according to this, cluster policies have a huge importance for further growth. In most strategic papers it is emphasized that cluster policy is not isolated and independent and that it embraces all the policies that affect the development of clusters. It has to take into the account the synergies and interchanges between policies, mainly between industrial and innovation policies that should (7):
• not be created like traditional, linear, separated ones; • be built to enhance linkages between the private industry and science community; • improve innovation - competitiveness nexus.
Cluster policy is very important for the creation and development of clusters. This policy could be defined as the efforts and government actions to support cluster development. Cluster policies could be found in different forms, but mainly as separate, or included in innovation and industrial policies. There is no “recipe” for cluster development, neither fixed successful “path” that should be strictly followed. Each country should create its own cluster policy according to its situation concerning the development of clusters and its specific needs. So, generally, according to the literature on cluster policies, no standard cluster approach exists. Clusters develop a new role of enterprises, the same as the new role of governments. There has to be created a new way of thinking of economic and social changes and processes that could present a shift from traditional, sequential thinking to comprehensive, long-term thinking and there is a need for a new way of acting among stakeholders, that will be materialised in a shift from selfish and individual to acting based on partnership, trust, collaboration, and cooperative competition. The public sector has a catalytic role. It has to identify the barriers and the limitations for cluster development and to strengthen the synergy between all areas of action policies. From a policy point of view, knowing what could become a cluster (with proper policy stimulations) is frequently more critical than knowing what is cluster. No fixed receipt for cluster development policies exists. The government has crucial impact on the whole infrastructure and it defines the rules of the game and gives financial support to cluster development. Cluster approach became a useful framework for the development and application of new role of government, in creation different forms of indirect support, instead of direct intervention strategies. For cluster policies to be successful: a “new wave” of those that create policies is needed. They have to combine

186 Proceedings of International Conference for Entrepreneurship, Innovation and Regional Development
ICEIRD 2014
analytical skills for the deep understanding of innovative dynamics and innovative style of some clusters and the flexibility to decide on their role in cluster development. This involves experiment and policies that are based. Generally, cluster policies should combine common and specific goals and the clustering process although frequently self-evolving, has to be governed efficiently.
3. Cluster policies and cluster governance in Croat ia
Cluster policy in Croatia is mainly adjusted with the main strategic guidelines in the European Commission strategies and policies. But, in Croatia, like in other post-transition countries, clusters and cluster initiatives are emerging in the last decade. The crucial problem of the emergence and the development of clusters arise from the statement of the “commodity with low supply” (8, p. 78), and that is the lack of trust among stakeholders in the economy. In Croatia, firstly, clusters and cluster policy were mentioned in the paper of the National Council on Competitiveness “55 recommendations for competitiveness growth in Croatia”. In the conclusion of this paper, National Competitiveness Council recognised cluster development as the priority in the innovation development (9). Ministry of Economy, Labour and Entrepreneurship cooperated with German association of technical cooperation (Deutsche Gesellschaft für Technische Zusammenarbeit – GTZ) on different projects, among which is the project of cluster managers education that started its realisation in 2005. In 2006 Ministry published the Cluster management – manual which consisted the results n cluster management and instruments for cluster managers. In spite of this, European Commission considered that Croatia there is a lack of attempts for cluster formation (10). The initial impulse for cluster development was given by the Croatian Association of Entrepreneurs, by founding the National Cluster Centre (NCC) in 2005. NCC signed the cooperation on the cluster development project with 12 Central and Easter European countries, and the contract with the European Commission: PRO INNO Europe and INNO NETS. NCC was the only representative from 2005 as the member of the EU cluster network “Pro Inno Europe Inno Nets”. This centre also created five Croatian clusters: small ship-building (28 members), automotive cluster (24 members), textile cluster (15 members), interior and furniture cluster (18 members) and agricultural mechanization (32 members). In 2007, Ministry of the economy, work and entrepreneurship and Croatian Association of Entrepreneurs signed Central and Eastern Cluster Agreement, as the part of the project: Central and Eastern European Cluster and Network Area. CEE cluster network is concentrated on the cooperation among eleven partner regions that have innovation policies concentrated on clusters and that use INNO network. In PRO INNO Europe project “INNO actions” 2009 – 2012, Croatia participates as the project partner in Cluster-Excellence.eu, project that supports excellence of cluster management, and training among cluster members (11, p. 147). The Croatian government initiated the strategy “Croatian Export Offense” in 2007, where the creation of six export oriented clusters was presented which could have the state financial support (12, p. 92):
• Cluster “Water” • Cluster “Small ship-building” • Cluster “Textile” • Cluster “ICT – resolutions” • Cluster “wood and furniture” • Cluster “Sea culture - Croatian fish”.

187 Proceedings of International Conference for Entrepreneurship, Innovation and Regional Development
ICEIRD 2014
In the beginning, cluster policy consisted of a few attempts in two approaches, used in the creation of many European clusters too: bottom-up and top-down approach. Croatian government supported some cluster initiatives that emerged among enterprise, with bottom-up approach. They included some cooperation on the local and regional level. The top-down approach was concentrated on the support to some strategically chosen clusters, especially those with export potential. Most clusters were initiated by top-down approach, mostly by MELE (Ministry of Economy, Labour and Entrepreneurship), and with the external expert support. But, bottom-up and top-down approaches have to be balanced. The huge problem in Croatia, is that even Regional development agencies at the county levels created Regional operation plans, mostly supported by EC (CARDS program), but they did not implemented these strategies, and the level of coordination and networking among agencies and some clusters that they have supported is very low. In the strategic paper: “Strategic development framework 2006 – 2013” the government stressed out the importance of cluster development and cluster policy as the instrument for competitiveness and innovations growth (13). All the initiatives dealing with cluster policy could be divided in a few periods in the last decade (11, p. 145):
• 2004 – 2005. - Croatian Association of Entrepreneurs- some cluster initiatives; • 2006 – 2007. - Ministry of economy, labour and entrepreneurship and Croatian Export
Offensive, and the foundation of Croatian Association of clusters (by Croatian Chamber of Commerce);
• 2010 – 2011. - Public invitation by Ministry of economy, labour and entrepreneurship – for project ”Clusters - with cooperation to success” and new project “Support for cluster development” started.
In 2011, “Strategy of Cluster Development 2011-2020 in Republic of Croatia” was accepted by the government. The main goals of this Strategy are presented in Figure 1. Figure 1. The main goals of The Strategy of Cluster Development in Croatia Source: Vlada RH (14, p. 12).
In this document, some general features, presented in many earlier cluster strategies are stressed, like:
• Strengthening cluster associations/networks; • Support to the improvement of cluster and cluster members competitiveness; • Supporting cooperation with the academic community – Research & Development;
Efficient use of EU funds
Improvement in governing the cluster
policy
Fostering innovations and new technology
transfers
Strengthening of cluster knowledge and skills
New markets and new clusters
Strengthening of clusters

188 Proceedings of International Conference for Entrepreneurship, Innovation and Regional Development
ICEIRD 2014
• Improving cluster competitiveness skills; • Efficient use of EU funds.
The goals of the Strategy include the improvement of cluster policy management, the fostering of innovations and strengthening of knowledge and skills for cluster development. In the part of the paper dedicated to the “Measures”, cluster mapping is especially stressed out. It is much deeper and more complex process of identification of possible connections among the participant on the market and should be carried out for the improvement of cluster policy management. The purpose of the mapping research is to give an overview of existing clusters ant their interconnected relations. The mapping should be carried out in three steps:
1. By National coordination on clusters and the creation of the national coordination body for clusters;
2. Specialization of regions and the creation of the regional cluster maps; 3. Informing and the promotion of cluster policy with the creation of communication
strategy. This Strategy includes different measures for the management coordination of the whole process. Ministry of economy should coordinate all other bodies dealing with cluster development. Very important goal of this Strategy is to create the framework for the evaluation of clusters and of their impact on the economy at the regional and national level. Finally, cluster policy should be integrated with the E$U policy EU-a (14, p. 13). But, in spite of all these efforts, cluster development in Croatia was not supported by the adequate cluster policy. The implementation of cluster policy is still not going on. In the whole process, separate efforts of some Ministries and government bodies exist, but this is not enough for the implementation of the comprehensive cluster policy implementation. There was a certain financial support given by the Ministry of economy and other government bodies, but the clusters are developing mostly with the support of some European projects and programs, mostly as the expert support (14, p. 9). Still, there is no coordination among these efforts. On the condition of the European Commission, the Agency for regional development was founded. It should become the factor for the implementation of the regional development policy in Croatia. But, again, this Agency is not focused on the implementation of cluster policy. Cluster mapping is still not carried out, and the crucial coordination organisation National Cluster Coordinating Committee does not exist anymore. Namely, National Cluster Centre existed from 2005 - 2010. Regional specialisation is still not researched too and cluster monitoring and evaluation is missing the same as the training system intended for all cluster members. It is obvious that cluster development that asks for a new way of thinking and of acting among all stakeholders is still missing in Croatia. From all aforementioned, comes out the statement that all the strategies and efforts were created as the consequence of externally driven activities in this field of the regional development. The Strategy (2011), was basically created for the purpose of the application on CIP “Programme on competitiveness and innovations”, F57 – Seventh programme on cooperation in the field of science and other programs of the European Union.
4. Conclusion and proposals

189 Proceedings of International Conference for Entrepreneurship, Innovation and Regional Development
ICEIRD 2014
Cluster policy is not isolated and independent. It embraces all the policies that affect the development of clusters and should provide a framework for dialogue and inter-firm co-operation, and co-operation between enterprises, higher education and research institutions, public and non-public organisations. Policies of cluster development are the means of promoting the economic development and structural changes for the rise of innovative capabilities. They strengthen the position of public administration as a mediator in the network development among firms in the creation and realisation of the projects. Industrial and innovation policies should define institutional instruments for the policies´ implementation and monitoring of the whole process. The government and its bodies, as the creators of cluster development policies (i.e. integrated industrial and innovation policies) play a crucial role in fostering cluster development. They have to coordinate the whole process of creating and implementing cluster policies. But in Croatia, policies that support cluster development, building business infrastructure and business support institutions - are defined, and by the support of the external knowledge (mainly from the EC experts) created as the documents, but, unfortunately they are still not implemented. The institutional framework for cluster development is adjusted with EU policies and practice. On the regional level, Regional strategies: Regional Operation Plans (ROPs) are created and mostly supported by EC (CARDS program). Their implementation is to be done by the regional development agencies (12). The huge problem is that Regional development agencies at the county levels do not coordinate their work among themselves and with the national Regional agency, and, as the consequence; the level of coordination and networking among all the government bodies both at national and regional level does not exist. At the same time, a small number of existing clusters has no real support for its further development. A huge disparity in competitiveness level among counties and regions in Croatia still exists. Although clusters are defined in the abovementioned Cluster strategy as the main tool for lowering this development gap, the implementation of this strategy is missing. These overview of the development of different /strategies and papers dedicated to the future cluster development, demonstrate a big problem due to the lack of mutual trust between stakeholders /trust is the commodity with low supply/ and the lack of institutional cooperation on clusters in Croatia. Dynamic bottom-up and interactive process between policy makers and practitioners does not exist. National Coordination Body - National Cluster Centre stopped to work in 2010. During the last decade, there were significant efforts of Ministry of economy and of Croatian Association of Entrepreneurs, but the National Council on Competitiveness does not exist. Some Regional development agencies made some initiatives on clusters, but, although some institutions know why clusters are important, there is no co-operation, coordination and no synergy between actors, nor mutual trust between them. According to this, the existing normative policy on regional clusters that should provide a framework for dialogue and inter-firm co-operation, and co-operation between enterprises, higher education and research institutions, public and non-public organisations, just exists but the gap between the reality - the lack of implementation - and the normative existing documents is widening. And, as we have explained in this paper, for regional cluster policies to be successful: a “new wave” of those who create policies is needed. They have to combine analytical skills for deep understanding of innovative dynamics and innovative style of some clusters as well as the flexibility to decide on their role in cluster development support. No fixed “recipe” for cluster development policies exists. In Croatia there is a strong need to define institutional instruments for the policies implementation and monitoring of the whole process. Cluster development asks for the new way of thinking and of acting between all stakeholders. The government bodies, as the creators of cluster development policies (i.e.

190 Proceedings of International Conference for Entrepreneurship, Innovation and Regional Development
ICEIRD 2014
integrated industrial and innovation policies) play a crucial role in fostering cluster development. In Croatia a huge task is still to be done, but it should be fast.
References
1 Andersson, T., Schwaag Serger, S., Sörvik, J., Hansson, E. W. (2004), The Cluster Policies Whitebook, IKED (International Organisation for Knowledge Economy and Enterprise Development, The Competitiveness Institute.
2 Dragičević, M., Obadić, A. Klasteri i politike razvoja klastera, Ekonomski fakultet Sveučilišta u Zagrebu, Zagreb, 2013. ISBN 978-953-6025-68-8 [cited 2014 Jan 10]. Available from: http://web.efzg.hr/repec/pdf/Clanak%2006-03.pdf
3 European Commission, EUROPE 2020 – A strategy for smart, sustainable and inclusive growth; Brussels, 3.3.2010, COM(2010) 2020: 1-37; 2010. [cited 2014 Jan 15]. Available from: http://europa.eu/press_room/pdf/complet_en_barroso___007_-_europe_2020_-_en_version.pdf
4 European Commission, OECD, Progress in the Implementation of the European Charter for Small Enterprise in the Western Balkans: 1-278; 2009 [cited 2014 Jan 22]. Available from: http://www.oecd.org/dataoecd/51/61/46583422.pdf
5 European Commission, Innovation Clusters in Europe: A statistical analysis and overview of current policy support, DG Enterprise and Industry report: 1-64; 2007 [cited 2014 Feb 10]. Available from: http://ec.europa.eu/enterprise/newsroom/cf/itemlongdetail.cfm?item_id=1072
6 European Council, Lisbon Strategy for growth and jobs, 2000. [cited 2014 Feb 10]. Available from: http://ec.europa.eu/archives/growthandjobs_2009/objectives/index_en.htm
7 Kersan-Škabić, I., Funkcioniranje klastera u hrvatskom gospodarstvu, u: Klasteri i gospodarski potencijalni istarske županije (ed. Kersan-Škabić, I., Afrić Rakitovac, K.): 91-129, Sveučilište Jurja Dobrile u Puli, Odjel za ekonomiku i turizam “Dr. Mijo Mirković”, 2011.
8 National Competitiveness Council, Godišnje izvješće o konkurentnosti Hrvatske 2006., Nacionalno vijeće za konkurentnost, Zagreb, June, 2007.
9 Porter, M. E., Building the Microeconomic Foundation of Prosperity. Findings from the Microeconomic Competitiveness Index. In: World Economic Forum. Global Competitiveness Report 2002-2003. Chapter 12. Microeconomic Competitveness Index. Geneva: WEF: 23-45; 2002.
10 Porter, M. E., The economic performance of regions. Regional Studies, 37(6,7), 549; 2003.
11 PRO INNO Europe web site. [cited 2014 Jan 12]. Available from: http://www.proinno-europe.eu/overview
12 Sölvell, O., G. Lindqvist, K. Ketels, The Cluster Intitiative Greenbook, The Competitiveness Institute (TCI) Vinnova: Gothenburg, 2003.
13 Vlada Republike Hrvatske, Strategija razvoja klastera u Republici Hrvatskoj 2011. – 2020., Vlada Republike Hrvatske, Ministarstvo gospodarstva, rada i poduzetništva, 2011. [cited 2014 March 10]. Available from: http://eobrazovanje.mingorp.hr/UserDocsImages/dokumenti/Strategija%20razvoja%20klastera%20u%20RH%202011%20do%202020%20usvojena%20na%20125%20sjednici%20Vlade%20RH%2028%2004%202011.pdf
14 Vlada Republike Hrvatske, Strateški okvir za razvoj 2006. – 2013., Središnji državni ured za razvojnu strategiju i koordinaciju fondova EU: 1-80; 2006 [cited 2014 March 11]. Available from: http://www.strategija.hr/datastore/filestore/16/Strateski_okvir_za_razvoj_2006_2013.pdf?sid=ad1999f43238f9e6b8c7487982911150

191 Proceedings of International Conference for Entrepreneurship, Innovation and Regional Development
ICEIRD 2014
The place of Russia in the Entrepreneurship and Innovative Development of BRICS countries
Svetlana Gusarova
National Research University «Higher School of Economics», Faculty of
Economics, Moscow, Russia, [email protected]
The development of entrepreneurship and innovations in BRICS countries (Brazil, Russia, India, China and the Republic of South Afri ca) is an important factor of steady rise of the national economies. Over the next 50 ye ars the BRICS economies (Brazil, Russia, India, China and the Republic of South Afri ca) could become the driving force in the world economy. China and India, respectively , will become the dominant global suppliers of goods and services while Brazil and Ru ssia will become similarly dominant as suppliers of raw materials. The share o f GDP of BRICS countries in 2012 was 27% of global economy. The leading position among BRICS countries in the Global Competitiveness Index is held by China (29 p lace out of 148 economies). Sustained innovation-led growth would help Russia t o solve the problem – in 2020 Russia is dreaming to take 20th place (moving up fr om 64th place from now) in the Global Competitiveness Index. China tops the list o f BRICS economies. The growth of BRICS countries will be promoted by an active intr oduction of innovation. The development of scientific and technical potential i s promoted by the increasing of the investment's role as the catalyst of scientific res earches. The main attention is paid to the state-private partnership in the formation of s cientific and technical potential. The essence of R&D spending in BRICS countries, their v alue in the world economy, main concepts of investment in the innovations are defin ed in the article. The share of BRICS countries in the world expenses on research a nd development in 2013 was more than 23%. China’s investment is now about 68,8 % that of the BRICS and 61% of U.S. . In 2018 China will surpass the combined R&D spending of Europe’s 34 countries and by 2022 China’s R&D spending is expected to su rpass U.S. and reach about $600 billion in R&D. China intends to evolve from manufa cturing model to an innovation-based economy. As on R&D's expenses and innovative development, Russia is considerably lags behind China, India and Brazil. T he Russia’s R&D financing was more than 7 times less that of China and 10% less t hat of India. The growth of R&D investments in BRICS economies was in information t echnology research, life science research, cost-effective energy-related research an d development, high-performance computing, software, chemicals and advanced materia ls research. Special attention is paid to the expansion of scientific researches and the development connected with nanotechnologies. To maintain BRICS countries competitiveness, the qu ality of the educational system needs to be improved further. Th e increasing of the education level is the important factor of the innovative dev elopment of BRICS countries. Among 500 best universities of the world in 2013 there we re 38 universities of BRICS countries, including 15 – of China, 8 – of Russia, 6 – of India, 16 – of Brazil, 3 – of South Africa. The main problems of the development of Russia’s economy are: poor financing of scientific research works, reducing nu mber of scientific researchers in Russia, low level of cooperation between universiti es and industrial companies.
Keywords

192 Proceedings of International Conference for Entrepreneurship, Innovation and Regional Development
ICEIRD 2014
BRICS economies, innovative development, R&D spending, competitiveness, R&D productivity
1. Introduction
The global financial crisis and the ensuing development have heightened the role of emerging economies in the world economy, first of all BRICS countries (Brazil, Russia, India, China, South Africa). BRICS countries have been important drivers of the global economic recovery. The acronym BRIC was proposed by the global economist of Goldman Sachs – Jim O’Neill [1]. On December 2010 South Africa officially became a member of BRICS. BRICS countries encompass 26% of the world's territory, more than 42% of the planet’s population and about 27% of world’s gross domestic product. Particularly important will be ability of BRICS economies to create new processes and business models through innovation. Relevance of the selected research is caused by the development of innovative processes in BRICS countries as a new paradigm of formation of further strong, steady and balanced growth of the national economies based on knowledge, and their integration into the world economy and the international market of the capital.
2. BRICS IN WORLD ECONOMY
BRICS economies hold a combined GDP (Gross Domestic Product) of more than 23,3 trillion USD, the share of GDP of the BRICS countries is 27,0% of global GDP. In 2012 the biggest GDP among BRICS countries was in China ($12269 billion), on the second place was India ($4716 billion), on the third - Russia ($3373 billion), fourth place took Brazil ($2327 billion) and on the last place among BRICS countries was South Africa ($576 billion). GDP of South Africa in 2012 was 21,3 times less than China’s economy, by 8,2 times – than GDP of India, by 5,9 times – than GDP of Russia, by 4 times less than GDP of Brazil [2].
Table 1 GDP of BRICS countries in world economy in 2012.
Countries 2012 (share,%) 2012 ($billion) Brazil 2,7 2327 Russia 3,9 3373 India 5,5 4716 China 14,2 12269 South Africa 0,7 576 BRICS 27,0 23261 World 100 86118,7
GDP per capita of Russia was $23501. The country leads the BRICS economies by a wide margin. It was twice more than in Brazil, 2.1 times more than in South Africa, 2.6 times more than in China and 6.2 times more than in India [3].
Table 2 GDP per Capita (PPP) of BRICS countries in 2012 ($).
Countries GDP per Capita (PPP) Brazil 11716 Russia 23501 India 3813 China 9083 South Africa 11255

193 Proceedings of International Conference for Entrepreneurship, Innovation and Regional Development
ICEIRD 2014
The economic potential of BRICS countries is such that they could become the most dominant economies by the year 2050. The development of BRICS countries will be promoted by an active introduction of innovation in their economies.
3. Competitiveness of BRICS Countries Scientific and technical capacity of the BRICS countries can be reflected by the Global Competitiveness Index (GCI index), which was created for the World Economic Forum in 2004 by Professor Xavier Sala-i-Martin at the Colombian University. Competitiveness analysis was based on the basic requirements tools: institutions, infrastructure, macroeconomic environment, health and primary education, higher education and training, goods market efficiency, labour market efficiency, financial market development, technological readiness, market size, business sophistication and innovation factors. The leading position among BRICS countries in the Global Competitiveness Index is held by China (in 2013-2014 its rank was 29 out of 148 economies). The country leads the other BRICS countries by a wide margin, once ahead of the Republic of South Africa (53rd), Brazil (56th), India (60th), while Russia (64th) has almost closed the gap [4].
Table 3 Ranks of BRICS Economies in Global Competitiveness Index in 2013-2014.
Countries Rank China 29 South Africa 53 Brazil 56 India 60 Russia 64
Russia moved up by three notches to 64th place in 2013-2014 (placing just behind Hungary, but before Sri Lanka). The country moves toward a more advanced stage of economic development. Russia is ranked 8th for the market size, which is based on large domestic market and its export. So, the country benefits from its large market size, which allows for significant economies of scale. Macroeconomic environment continues to be the country’s best area. Russia had low government debt and surplus of state budget, that’s why macroeconomic environment continued to improve (moved up twenty five notches to 19th place in 2013-2014). Russia also benefits from its reasonably developed infrastructure (took 45th place), particularly roads, air transport and electricity supply. The country continues to benefit from higher education, technological readiness (ranked 47th and 59th respectively). Russia considerably lagged behind other BRICS countries on many indicators. Some shortcomings remain with respect to the goods market, it is inefficient in Russia, its local companies are not intense (126th place). Russia must focus on increasing the efficiency of business sophistication (107th place) and reinforcing the efficiency and transparency of its public institutions (121st place). Institutional weaknesses in Russia include high levels of corruption and organized crime. As to the Russian financial market development, it is not sufficient developed to provide needed finance for business development (121st place), because of the lack trust in the financial system. Inefficient allocation of Russia’s vast resources hampered high levels of productivity in the economy. Moreover, inefficient anti-monopoly policies led to the weak level of competition.

194 Proceedings of International Conference for Entrepreneurship, Innovation and Regional Development
ICEIRD 2014
Sustained innovation-led growth would help Russia to solve the problem – in 2020 Russia is dreaming to take 20th place (moving up from 64th place from now) in the Global Competitiveness Index.
4. R&D Spending in BRICS Countries
In order to become the leaders of the world economy, the BRICS countries are trying to implement innovations in different branches of the economy. As BRICS countries move towards the innovative-driven stage of development, they will have to focus more strongly on the developing capacities in R&D and business sophistication. Strong R&D orientation of companies, easier access to venture capital, and intensified collaboration between universities and the private sector would help BRICS countries to move toward a more future oriented development path. The proper funding is very important for the innovation. The share of BRICS countries in the world expenses on research and development in 2013 was 23.07% (the forecast for 2014 is 24,97%). The R&D (Research and Development) financing of BRICS countries in 2013 were $375 billion (1,6 times more than in 2010). In 2014 they will increase to $407 billion (8,5% more than in 2013) [5]. China’s role continues to increase, the country tops the list of BRICS economies, continues its unmatched economic growth and R&D increases. In 2011 China surpassed Japan’s overall spending. In 2013 the greatest amount of financing of research and development among BRICS countries was again in China, it made 68,8% of R&D expenses in BRICS countries. China is investing heavily to create an innovation infrastructure that will allow to develop advanced products market, moving beyond its established position as a cost-effective manufacturing for high technology products. China’s investment is now about 61% that of the U.S. China has fixed a microeconomic goal of spending 2,2% of GDP on R&D by 2015 toward becoming an innovation-based economy by 2020. China will surpass the R&D spending of 34 European countries in 2018. China’s R&D spending is expected to surpass U.S. by 2022 (both countries are likely to reach about $600 billion in R&D). China intends to evolve from manufacturing model to an innovation-based economy. Its R&D investment directed on industrial growth, stable domestic evolution to an advanced economy and international prestige.
Table 4 R&D Expenses in BRICS countries in 2013-2014 ($ billion).
Margin 2013 2014 (forecast) Brazil 31 33 Russia 38 40 India 42 44 China 258 284 South Africa 6 6 BRICS 375 407
Russia is considerably lags behind China and India. The Russia’s R&D financing was more than 7 times less that of China and 10% less that of India. One of the main indexes of science intensity of the economy is the ratio of R&D spending as a share of GDP. In BRICS countries it was 1,55% in 2013. Ratio of R&D spending of BRICS countries as a share of the global R&D in 2012 was the following: China –13,7%, India – 2,8%, Russia – 2,56%, Brazil – 2,04%, the Republic of South Africa – 0,38%. The growth of R&D investments was in information technology research, life science research, cost-effective energy-related research and development, high-performance computing, software, chemicals and advanced materials research. Rapid industry-scale

195 Proceedings of International Conference for Entrepreneurship, Innovation and Regional Development
ICEIRD 2014
economic growth could be stimulated by the nanotechnologies. For example, China implemented many important projects that will influence the global innovative development, such as the designing and building state-of-the-art next-generation nuclear power plants, space station, high-speed rail systems, military and commercial aircraft. Special attention is paid to the expansion of scientific researches and the development connected with nanotechnologies.
5. Higher Education in BRICS Countries
To maintain BRICS countries competitiveness, the quality of the educational system needs to be improved further. The increasing of the education level is the important factor of the innovative development of BRICS countries. One of the main innovative index is the number of students per 1000 people of BRIC countries in 2013: Russia – 42 students – the biggest number [6], China – 23 students (1,8 times less than in Russia), India – 17 students (2,5 times less than in Russia), Brazil – 10 students (4,2 times less than in Russia) [7]. Among 500 best universities of the world in 2013 there were 38 universities of BRICS countries, including 15 – of China, 8 – of Russia, 6 – of India, 16 – of Brazil, 3 – of South Africa [8]. In China in 2011 there were 2409 Universities (2,3 times more than in 2010). The best Chinese Universities in 2013 were: Peking University, Tsinghua University, Fudan University, Shanghai Jiao Tong University, Nanjing University, University of Science and Technology of China, Zhejiang University, Xian Jiaotong University, Renmin (Poeople's) University of Chaina, Nankai University, Wuhan University, Sun Yat-sen University, Spanqhai University, Beihang University (former BUAA), Tongji University. In 2012 in 1046 Russian institutions of higher education were studied 6075,4 thousand students. The best Russian Universities in 2013 were: Lomonosov Moscow State University, St. Petersburg University, Moscow State Institute of International Relations (MGIMO University), Novosibirsk State University, Bauman Moscow State Technical University, Moscow Institute of Physics and Technology State University, St. Petersburg State Polytechnic University, People’s Friendship University of Russia. In 2012 there were 221 Indian universities (including 16 national), about 11 thousand colleges (6.5 million students). The best Indian Universities in 2013 were: Indian Institute of Technology Delhi, Indian Institute of Technology Bombay, Indian Institute of Technology Kanpur, Indian Institute of Technology Kharaqpur, University of Delhi, Indian Institute of Technology Roorkee. The following six universities were the best in Brazil in 2013: San Paulo's University (Universidade de Sao Paulo), Campinas State University (UNICAMP - Universidade Estadual de Compinas), Federal University of Rio de Janeiro (Universidade Federal do Rio de Janeiro), Federal University of Minas Gerais (Universidade Federal de Minas Gerais), San Paulo Federal University (Universidade Federal de Sao Paulo), Federal University of San Paulo (Universidade Federal de Sao Paulo), Paulista State University (Unuversidade Estadual Paulista «Julio de mesquite Filho» (UNESP). In 2011 there were 24 higher educational institutions in South Africa (11 universities, 6 technical institutes, 7 institutions of higher professional education). In 2013 the best Universities in South Africa were: University of Witwatersrand, Stellenbosch University, University of Pretoria.
6. Research and Development Productivity in BRICS E conomies

196 Proceedings of International Conference for Entrepreneurship, Innovation and Regional Development
ICEIRD 2014
The innovative development of BRICS countries depends on productivity of researches and development. The quantity of Patent inventions in BRICS countries in 2012 was: China – 93706 items, Russia – 22481 items, India – 7539 items, Brazil – 2451 items. In 2012 in Russia 41211 demands for issuing of patents were submitted, 32880 of them were granted. In China 101267 demands for issue of patents were submitted (2,5 times more, than in Russia), 82240 patents were granted (2,5 times more, than in Russia). By the number of patents on inventions on 1 million people, Russia outstripped Brazil and India (the 43rd place in the world). Index of inventive activity (number of Russian demands for issuing of patents for inventions per 10 thousand people) in 2013 was 2,1, it will be increased to 2,8 in 2020. In the nearest future Russia is planning to be among the world leaders on this indicator [6]. The biggest number of patents in China was received for inventions in the electronics and communication equipment (62,3%). On the second place there were patents for the inventions connected with electronic computers and office equipment (13,6%), on the third – patents for inventions in medicine and pharmacology (12,8%), on the fourth – patents for inventions of the medical equipment and tools (9,5%) [9]. The quality and importance of the scientific research is confirmed by the number of links to their works in the international editions. 320354 links in the international editions were made to Chinese scientific works (13,9% to the works in the field of chemistry, 9,2% - to the works connected with computer technologies, 9,1% – to the works in the field of electronics, communication and automation [9]. In 2013 the share of publications of Russian researchers in total quantity of global publications (indexed by WEB of Science) was 2,3%, it is planned to increase it to 3% by 2020 [10].
7. Innovative Development in BRICS countries
Innovation is particularly important for economies. Countries can improve their productivity by using progressive technologies and innovations, by sufficient investments in research and development, especially by the private sector. China remains the best performer within BRICS countries. China leads the BRICS economies in innovative development (32nd place in the world), once ahead of South Africa (39th), India (41st), Brazil (55th), while Russia (78th) has almost closed the BRICS list [11].
Table 5 Innovative Development Indexes in BRICS countries in 2013.
Indicators Place the world rating Capacity for Innovation Brazil 36 Russia 64 India 41 China 30 South Africa 33 Quality of scientific research Institutions
Brazil 42 Russia 65 India 37 China 41 South Africa 35 Company Spending on R&D
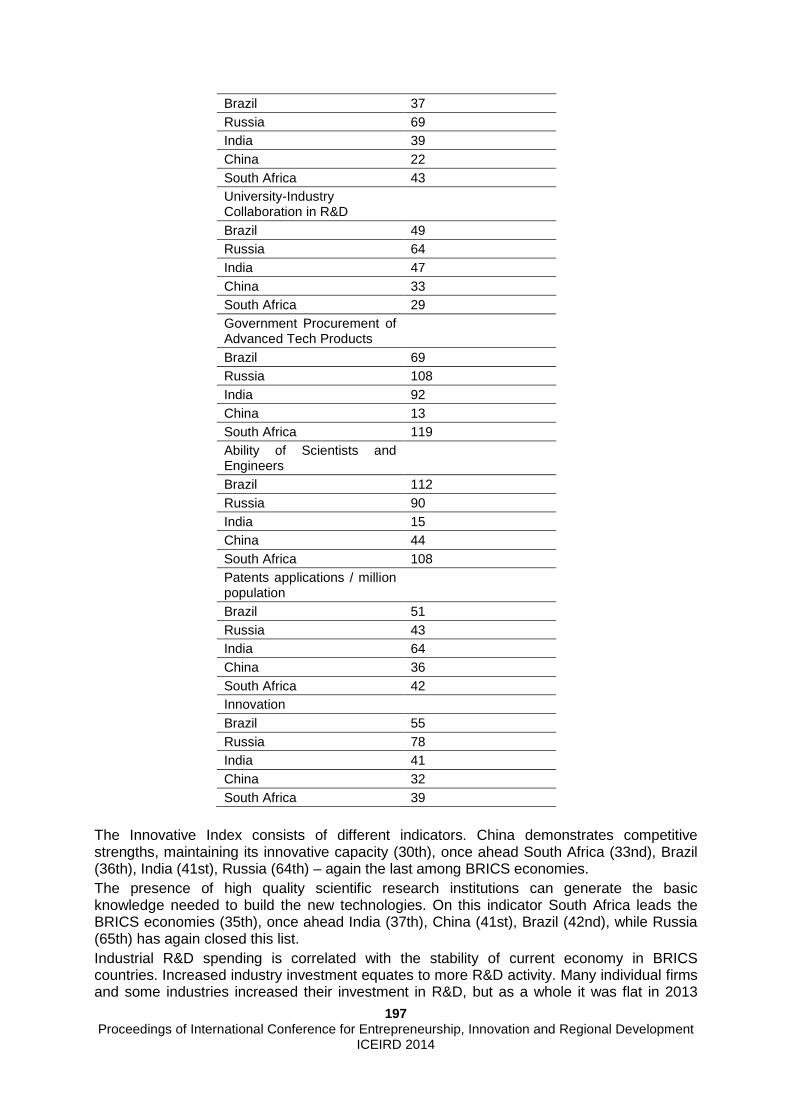
197 Proceedings of International Conference for Entrepreneurship, Innovation and Regional Development
ICEIRD 2014
Brazil 37 Russia 69 India 39 China 22 South Africa 43 University-Industry Collaboration in R&D
Brazil 49 Russia 64 India 47 China 33 South Africa 29 Government Procurement of Advanced Tech Products
Brazil 69 Russia 108 India 92 China 13 South Africa 119 Ability of Scientists and Engineers
Brazil 112 Russia 90 India 15 China 44 South Africa 108 Patents applications / million population
Brazil 51 Russia 43 India 64 China 36 South Africa 42 Innovation Brazil 55 Russia 78 India 41 China 32 South Africa 39
The Innovative Index consists of different indicators. China demonstrates competitive strengths, maintaining its innovative capacity (30th), once ahead South Africa (33nd), Brazil (36th), India (41st), Russia (64th) – again the last among BRICS economies. The presence of high quality scientific research institutions can generate the basic knowledge needed to build the new technologies. On this indicator South Africa leads the BRICS economies (35th), once ahead India (37th), China (41st), Brazil (42nd), while Russia (65th) has again closed this list. Industrial R&D spending is correlated with the stability of current economy in BRICS countries. Increased industry investment equates to more R&D activity. Many individual firms and some industries increased their investment in R&D, but as a whole it was flat in 2013

198 Proceedings of International Conference for Entrepreneurship, Innovation and Regional Development
ICEIRD 2014
due to the slow global economy. Chinese companies were the best among BRICS countries and the most innovative in the world, spending heavily on Research and Development (22nd) and displaying a high capacity for innovation. But Russia again was the last among BRICS economies (69th). Brazil took 37th place, India – 39th, South Africa – 43rd. Extensive collaboration in research and technological development between universities and industry is very useful for the innovative development. On this indicator South Africa leads the BRICS countries (29th), once ahead China (33rd), India (47th), Brazil (49th), Russia once again closed the gap (64th). Government Procurement of Advanced Tech Products plays an important role in the development of innovations. Russia took the 108th place – ahead only South Africa (119th), which was the last. Other BRICS countries were once ahead of them – China took the 13th place, Brazil – 69th place and India – 92nd place. The support of the innovative companies by the government and the development of state-private partnership is very important for the innovative development of BRICS countries. But private sector continues to account for a small place in the research activity (especially, in Russia). The role of government in the research funding in BRICS countries prevails. Most of R&D activity is funded by the government. The involvement in the R&D investments of the private sector isn't enough for the innovative economic development. On ability of scientists and engineers Russia took the third place among BRICS countries, once ahead of South Africa and Brazil. In Russia scientific researches and development in 2012 was carried out by 372,6 thousand researchers in 3566 organizations. The share of scientific researches and development in Russia by research and development organizations is 48,4% of all organizations, design offices (9,5%), the project and design organizations (0,9%), experimental plants (1,7%), universities and institutions of higher education (15,7%), research and development departments of the organizations (7,7%). Despite increase of the number of organizations conducting scientific researches in Russia in 2012, the number of researchers was reduced (to 372,6 thousand). Only 5,3% of scientists (19,9 thousand people in 489 organizations) executed researches in the field of nanotechnologies (10,8% more than in 2010). Special attention is paid to the expansion of scientific researches and the development connected with nanotechnologies. The number of Russian researchers in the field of nanotechnologies grew up by 1,4 times (during the period of 2008-2012), the internal spending of carrying out researches of the organizations connected with nanotechnologies, increased by 2,4 times [6]. As to China and India, they produce large numbers of Scientists and engineers, but the general population is growing at a faster rate, that’s why the scientists and engineering ratios continue to lag those of developed countries. In China eight of nine members of China’s Standing Committee of the Political Bureau have engineering degrees. Leaders support China in expanding its science and technology infrastructure through investments in its academic research institutions. Scientific researches and development in 2011 in China was made by 511175 scientists (1,4 times more, than in Russia) from 5941 scientific institutions (1,6 times more, than in Russia). The biggest share of scientific researchers in China was developed in the field of the electronic and communication equipment (53,2%), medicine, pharmacology (18,3%) and the medical equipment (12,5% of researchers). In China 511,2 thousand researchers were engaged in scientific work in the field of high-tech (28,6 times more than in Russia) [9]. Patents applications show the productivity of researches and development in BRICS countries. Russia was the third among BRICS countries on this indicator (43rd place) – after China (36th) and South Africa (42nd), Brazil (51st) and India were the last (64th).
8. Conclusions

199 Proceedings of International Conference for Entrepreneurship, Innovation and Regional Development
ICEIRD 2014
The development of innovative process is connected with improvement of quality of scientific researches in the leading branches of knowledge, broad introduction of innovations in the production, with the improvement of the quality of student’s training. The most problematic factors for doing business in BRICS economies are:
• Tax regulation and rates. • Inefficient government bureaucracy. • Corruption. • Inadequate supply of infrastructure. • Insufficient capacity of innovation. • Poor financing of scientific research works (in South Africa, Brazil and Russia). • Low level of cooperation between universities and industrial companies. • Inflation. • Policy instability.
Further enhancing competitiveness will require a significant upgrading of the main directions of the development of innovative processes in BRICS:
• Strengthening innovation potential through efficient investments in science, technology and other intangible assets, such as advanced management techniques.
• The acceleration of the translation from research to development. • The improvement of the quality of education in the Universities. • Liberalization of the markets. • The increase efficiency of financial and labour market. • The development of university-industry collaboration in R&D. • The increase of the quality of the scientific research institutions. • The development of the patent business. • The increasing of R&D funding not only by the government, but by the private sector
too. • The increasing of government procurement of the innovative products. • Institutional reforms. • Political stability.
References
1 Dreaming With BRICs: The Path to 2050 // Goldman Sachs. Global Economics Paper #99. – 2003. – 1 October. – 24 p. 2 Gross Domestic Product 2012, PPP / World Development Indicators Database // World Bank. – 2013. – 17 December. – 4 p. http://databank.worldbank.org/data/download/GDP_PPP.pdf 3 GDP per Capita, PPP (current international $) // World Bank. – 2013. http://data.worldbank.org/indicator/NY.GDP.PCAP.PP.CD 4 The Global Competitiveness Report 2013-2014 // World Economic Forum. – Geneva, Switzerland, 2013. – P.18-22. 5 2014 Global R&D Funding Forecast // R&D Magazine. – 2013. –December. – 36 p. 6 Российский статистический ежегодник. 2013: Стат. сб. / Росстат. – М., 2013. – 717 с. 7 Education, Science and Technology / China Statistical Yearbook 2012 // National Bureau of Statistics of China www.stats.gov.cn. 8 2013/14 QS World University Rankings Report www.topuniversities.com. 9 China Statistical Year Book 2012. – China Statistics Press, 2012. 10 Государственная программа Российской Федерации «Развитие науки и технологий» на 2013-2020 годы / Распоряжение Правительства Российской Федерации от 20 декабря 2012г. №2433-р. – С. 28. 11 The Global Competitiveness Report 2013-2014. Full Data Edition / Professor Klaus Schwab – Editor // World Economic Forum. – Geneva, Switzerland, 2013. – P.134-347.
200 Proceedings of International Conference for Entrepreneurship, Innovation and Regional Development
ICEIRD 2014
Research and development - a potential growth drive r of the European economy
Tomislav Herceg1, Marina Dabic2, Davor Vlajcic3
1 Faculty of Economics and Business Zagreb, J.F.Kennedy Square 6, Zagreb, Zagreb, Croatia, [email protected]
2 Faculty of Economics and Business Zagreb, J.F.Kennedy Square 6, Zagreb, Zagreb, Croatia, [email protected]
3 Faculty of Economics and Business Zagreb, J.F.Kennedy Square 6, Zagreb, Zagreb, Croatia, [email protected]
Abstract The main characteristics of the European economy in the recent years are declining or stagnating national incomes of the most of the Euro pean Union countries. Hence this paper investigates an impact of the well-known grow th boosters on the European income: research and development, and foreign direc t investment. A cross section model is tested, which has shown a significant relation between GDP per capita growth and the ratio of Rese arch and Development and Foreign direct investment (FDI) in the GDP. The mod el is tested in the pre-crisis year of 2007, and the mid-crisis year of 2011. Furthermo re, additional survey was made to show which of the Research and Development financie rs was the most efficient: entrepreneurial sector, government sector or high e ducation sector. The findings show that foreign direct investment a nd research and development should have a crucial role in the recov ery of the European weak economy; results show that a single percent increas e in the share of the foreign direct investment and a research and development in gross domestic product would have caused a 3 and 2 digit increase of the GDP per capi ta in 2007 respectively. Secondly, it is shown that the significance and the impact of R& D and FDI in 2011 has changed, crowding out all the other factors making them insi gnificant compared to the R&D and FDI. Finally, the survey has shown that the entrepr eneurial segment of the research and development has the most of the desired benefic ial effects, while higher education and government sector R&D appear to be al most irrelevant for the GDP per capita growth. These findings suggest that policy makers should i nvest huge efforts to encourage foreign direct investment flows and corpo rate R&D investments since it is the fastest and the most effective way for recovery of the Old continent. Keywords
European countries, FDI, GDP per capita, RnD, RnD investors

201 Proceedings of International Conference for Entrepreneurship, Innovation and Regional Development
ICEIRD 2014
1. Introduction
Recently, the widespread belief was developed that investment in research and development (R&D) results in positive externalities which results in increasing yields to investments [1]. The similar effect arises due to the increase of foreign direct investment (FDI) in the host countries. The increasing number of multinational corporations (MNCs) setting up subsidiaries in emerging markets, are resulting with the growing importance of foreign direct investment in the past decades [2]. It further resulted in a growing interest of researchers for empirical research of linkages of R&D and FDI on economic progress. Since foreign direct investment (FDI) are representing an important channel for knowledge and technology transfer to the host country, attracting foreign investment is a highly ranked task on the agenda of national policy makers [3]. For achieving a common level of growth and convergence of the EU countries, policy of attracting the foreign direct investment and investment in R&D should be harmonized in all the member states. All the countries do not invest the same amounts in R&D, as well as they differ in the efforts invested to attract foreign direct investment. For example, it can be seen that in 2006 the average EU investment in R&D amounted to 1,84% of total GDP. However, investment within the European Union varied, so Portugal investment was 0,83% of GDP while investment in research and development in Sweden was 3.73% of GDP. It is interesting to note that at the same time R&D investments in Croatia were 0,87% of GDP. Recognizing the importance of investment in R&D, European Commission brought a new objective in 2002 and at the Lisbon Convention decided that investment in R&D by 2010 should increase to 3%. The influence of FDI on economic growth has been interesting for empirical research for a long time. FDI directly affects economic growth through the accumulation of capital and a transfer of new technologies. Indirectly it affects GDP growth through the growth of knowledge in the recipient country and the adoption of new skills. Unfortunately, the impact of FDI on economic growth is not so controversial in the theoretical, but primarily in the empirical studies. 2. Theoretical framework
2.1. Effects of Research and Development on Recipie nt Economy
First of all, it is important to note that R&D plays an important role in the economic literature in several ways. One of them suggests how, through R&D, companies acquire new market shares and maintain dominance in the existing markets. On the other hand, investment in R&D is viewed as an investment in knowledge which results with technological change and technological change represents one of the basic factors in the newer growth models. R&D plays a major role in the recent models of economic growth, called endogenous growth models. As defined by the Frascati Manual [4], R&D “comprise creative work undertaken on a systematic basis in order to increase the stock of knowledge and the use of this stock of knowledge to devise new applications”. According to them, growth does not come by itself, but can be explained as a result of a new product and knowledge which is a consequence of research and development [1]. Investment in R&D is strongly linked to the maintenance of the current and future competitiveness of industries. If one takes into account the limited economic resources, innovation and R&D are the best way for economic progress. Therefore, it is not surprising, that investment in R&D has become a common policy and goal of all European governments. All important theoretical and empirical research has pointed to the fact that investment in R&D is the key to the economic growth. R&D activities together with other core business activities are usually prefer to take place at the firms’ headquarters in the home country [5]. However, recent literature have documented an increase in the
202 Proceedings of International Conference for Entrepreneurship, Innovation and Regional Development
ICEIRD 2014
internationalization of R&D (R&D offshoring) and inventive activities [6], with the accent on usage of the potential benefits of host country and transfer them to home country (reverse technology transfer) [7]. Among the important theoretical models [1], [8], [9], R&D is the main engine of growth, which is also the reason why the government is so strongly interested in achieving the optimal levels of investment in R&D. Economic growth is a result of the more efficient combination of capital and labor, and investment in R&D is a way to find the most effective combination of these two factors. Interestingly, research was conducted in the U.S., where increased expenditure on R&D pointed to the growth of domestic production level. Specifically, the increase in the investment in R&D by 0.5% of GDP in the USA would increase USA’s production by over 9% in the long term, which in our case is fifteen years [10]. Bayoumi, Coe, Helpman [10] also come to the conclusion that the rate of return on investment in R&D is almost five times higher than the rate of investment in physical capital. Despite the fact that any form of investing in R&D affects economic growth, it is important to distinguish investments of business sector, government and high education. Recently some authors began to add and observe a new category of R&D investments, foreign direct investment in R&D [11]. These studies show that foreign direct investment in research and development yield the best results, but it is beyond the scope of this paper to go deeper into it. The Republic of Croatia is a case of small country where the majority of investment in R&D comes from the state, while for the bulk of investment in R&D in the EU accounts for business sector. Foreign direct investment in research and development sector does not represent a novelty. However, just recently they have become attractive for observation. [12] showed that in 1930 the largest American and European companies recorded about 7% of their total R&D abroad. This figure continuously grows and in 1980 it was recorded that these companies realized 19% of their R&D abroad. This kind of internationalization of R&D was partially expected and partially unexpected. It was expected because it is a logical sequence of activities that follows after an increase in productivity of multinational corporations in developing countries. However, the internationalization of R&D is not expected because the R&D represents the knowledge and skills that meet the developed countries, not developing countries. Falk and Unterlass [13] in their study used calculations for 21 OECD countries, apart from invariably finding a link between R&D and per capita economic performance, identified a positive and significant correlation coefficient between R&D expenditure and the population’s skills level, measured in terms of average years of education. 2.2. Effects of Foreign Direct Investment on Recipi ent Economy
Romer [1] shows that FDI directly contributes to the accumulation of capital and technology transfer, accumulation of capital generates economic growth and the transfer of new technologies also contributes to the generation of growth [14]. Latest literature significant importance puts on knowledge transfer, and indentifies horizontal and vertical knowledge spillovers as two main categories of knowledge spillovers [3]. Horizontal knowledge spillovers often refer to the undeliberately leakage of knowledge to firms in the same industry and in that way affect the subsidiary’s local competitors improving their productivity. On the other hand, vertical knowledge spillovers, represents diffusion of knowledge that the MNC subsidiary deliberately realises to local suppliers and customers [15]. Recent research shows that vertical knowledge spillovers are often a result of linkages and relationships that the MNC subsidiaries have established with their local customers and suppliers [16]. Most countries have reduced barriers to FDI and many aggressively offered tax incentives and subsidies, believing that FDI promotes growth. Economic theory [17], [1]

203 Proceedings of International Conference for Entrepreneurship, Innovation and Regional Development
ICEIRD 2014
points to technical change as the major source of productivity growth in the long run. Neo-classics dispute Solow and Swan claiming, driven by the law of diminishing returns to capital in the long run, that FDI affects growth, but only in the short run. On the other hand [18] dispute neo-classics, emphasizing that FDI, which causes a permanent transfer of knowledge, affects economic growth in the long term. Hejazi and Safarian [19] find that both trade and FDI play important roles in promoting international technology diffusion in their investigation of both FDI and trade as channels for R&D diffusion from G7 countries to other OECD countries plus Israel. Research of Blomstrõma, Lipseya and Žejane [20] showed the great importance of foreign direct investment inflows on accelerating economic growth, but only in countries with higher income in the period from 1960-1985, while in the countries with lower income showed that foreign direct investment did not have a significant impact on economic growth. It also coincides with the statement that favourable economic and social situation in the recipient country is a prerequisite for FDI to impact economic growth. So if country wants to profit from the FDI inflow it must be rich with human capital, good infrastructure, economic stability and market liberalization. Coe and Helpman [21] find that domestic R&D contributes significantly to productivity growth and that this impact is substantially higher for the G7 than for other developed countries Borensztein et al [22] studied the effect of FDI on economic growth in the cross-country regressions, using data on flows of FDI from industrial countries to 69 developing countries in the past 20 years. Their conclusion is that FDI is a key factor in technology transfer, contributing to the growth more than domestic investment. Similarly, Ciruelos and Wang [23] find that there exist different effects of FDI and trade on R&D diffusion in developed countries (DCs) and less developed countries (LDCs). Both trade and FDI have positive and significant impacts on international R&D diffusion among the 20 OECD countries in their sample. Additionally they found out that FDI from DCs to LDCs does not promote technology improvement in host LDCs unless the human capital passes a certain threshold level in LDCs. FDI also affects economic growth by increasing total investment through encouraging domestic investment and causing "crowding-in" effect. This occurs most likely due to the negative impact of FDI on a domestic competition and by encouraging them to further investment. In this way, FDI contributes to economic growth by increasing capital accumulation in the recipient country. However, different analysis does not show the same results; there is a range of studies that dispute the impact of FDI on economic growth and suggest a very weak correlation of two variables. One such study was conducted by De Mello [24], which use analysis of time series and panel analysis (fixed effect) estimated the sample of 32 developed and developing countries. 2.3. R&D and FDI effects on the economic performanc e in European Union
The theoretical framework given in this paper arose several questions: how do FDI and R&D affect economic growth in Europe and Croatia? Do all R&D investments affect European and Croatian economy equally? Is Croatian economy as effective in transforming FDI and R&D into growth as the European countries on average? Majority of the studies presented in the literature overview suggest that both R&D and FDI strongly boost an economy’s growth, but different sectors of R&D investors are not equally efficient. Hence a survey on the effects of R&D and FDI on GDP per capita in the EU countries will be made, comparing the results of a prerecession year 2006 and a year 2011 in which most of the EU countries were in recession. Afterwards, a survey will examine the R&D's expenditure-labour ratio and the source of R&D funding affects the effectiveness of a

204 Proceedings of International Conference for Entrepreneurship, Innovation and Regional Development
ICEIRD 2014
R&D transformation into GDP growth. Based on these grounds, the following hypotheses are made:
H1: Gross domestic product per inhabitant (measured in Euros) in the EU countries, depends on the investments in research and development in the country, and on the openness of the economy to the foreign direct investment. H2: The crisis has changed the effects of FDI and R&D on GDP per capita. H3: Investment of the business sector (among higher education and government) is the most effective in the gross domestic product per inhabitant boost. H4: R&D sector in Croatia has lower expenditure-labour ratio than in Europe on average.
First step of the analysis is formation of the model of GDP per capita in the EU with variables R&D investment and FDI. The same model will be estimated for two years: 2006 and 2011 and it will be used for testing hypotheses H1 and H2. The source of data is Eurostat (accessed on 19 January 2014) and Croatian National Bank. A simple OLS method will be used. R2 shows the changes in the joint impact of R&D and FDI in a recession and a prerecession period and the values of the regression coefficients will show what are the changes in the effects of FDI and R&D on GDP formation.The choice of the most representative R&D investment variable is chosen during the process of the model estimation; Eurostat has R&D broken in three segments, depending on the financier: business, higher education and government. Also, a total R&D investment value is taken into consideration. The model with best estimation results will be a criteria for the appropriate variable choice which will in turn test the H3 hypothesis. Finally, a plain descriptive statistics as well as the z value test will show where Croatia settles in the R&D expenditure - R&D labour ratio with respect to the EU average. Using these results it will be possible to interpret Croatia's (in)efficiency of the available input transformation. The data for the analysis, R&D expenditures and R&D labour, are also supplied by Eurostat.
3. Findings
The basic model tested for both 2007 and 2011 data is:
iiii uFDIRNDGDPpc +++= 210 βββ (1) where GDPpc stand for GDP per capita, RND for per capita R&D expenditures (in Euros) and FDI for share of the foreign direct investment into domestic economy in GDP. R&D expenditures are broken in three segments, as described previously. The best estimates are obtained when only business research and development variable is used, showing that H3 should not be rejected. Also, the constant appeared to be insignificant for both years. The following estimates were obtained:
070707 25.71555.53 FDIRNDbGDPpc += (2)
In the prerecession year 2007 in the EU (without Luxemburg) every €1 the enterprises invested in research and development transformed into an increase of GDP per capita by €53.55.Also, an increase in the foreign direct investment share in GDP by 1 percentage point caused an increase of GDP per capita by €715.25.
205 Proceedings of International Conference for Entrepreneurship, Innovation and Regional Development
ICEIRD 2014
In the recessive year 2011 there were some changes:
111111 62.188759.44 FDIRNDbGDPpc += (3) The results show that a €1 increase in the entrepreneurial R&D spending caused an increase of GDP per capita by €44.59. Although still significant, one should note the decline in the effect of R&D expenditures on GDP per capita. However, the recession changed the distribution of R&D expenditures and there could be the answer why the decline happened: In 2007 the R&D expenditure per R&D worker was on average €96 401.75 , while four years later it fell down to €65 117,14. In Dabić, Herceg and Vlajčić [25] the authors warned the R&D financers on the problem of low R&D expenditure-labour ratio showing that the efficiency of transformation of R&D investments in majority of European countries was highly related to the R&D expenditure-labour ratio. Those results have shown that majority of European emerging economies, including Croatia, had both low expenditure-labour ratio and below the average transformation of R&D expenditures into GDP per capita. Unfortunately, policy makers did not see that peril. As a result, the bad model that first appeared in the CEE countries due to the lack of funding, was spread all over Europe due to the extreme contraction of European economies in 2011. The equation (3) also shows that the significance of FDI more than doubled: a 1% point increase in the FDI-GDP ratio caused on average an increase of GDP per capita by € 1887.62. The determination coefficient shows that the model became stronger: while before the crisis FDI and R&D dynamics explained 84% of the variation of GDP per capita, in 2011 more than 88% of the variation was explained with the same model. Therefore one can conclude that crisis indeed changed the impact of R&D and FDI on the EU economies, which indicates H2 should not be rejected. Since both (2) and (3) show that FDI and R&D are significant in the model, the H1 also fails to be rejected. 4. Conclusions
Per capita income in European Union strongly positively depends on the levels of FDI share in GDP and the R&D expenditures share in GDP in the observed country. Results show that a 1% increase in the share of FDI in GDP caused a €715 increase in GDP per capita in 2007, and €1887 only four years after. These findings suggest that European Union craves for foreign investments, but due to its inefficient, costly and passive economic systems it appeared to be a hardly reachable goal. Hence GDP per capita slumped in most of the EU countries in 2011. Furthermore, the conducted analyses have shown that the entrepreneurial R&D is the most representative segment of R&D. Secondly, it is shown that a 1% increase in the share of R&D expenditures per inhabitant caused €55 increase in GDP in 2007, but fell down to €44 in 2011. It shows that the R&D expenditures lost some of its beneficial impact on GDP per capita which is due to the fall in the expenditures per R&D worker by more than a third. Third, the results implied that the model proves stronger in describing GDP per capita differences in 2011 than in 2007; almost 90% of the GDP per capita data variation is explained by a simple model that included R&D and FDI as the only repressors. However, FDI is cheaper to attract than convincing business sector to invest more in R&D. Finally, Croatia still lags behind the majority of the EU members in terms of R&D expenditure - labour ratio; while Croatia had less than €20 000 of expenditure per R&D employee, the EU average was more than € 65 000. However, while this ratio in Croatia fell by only 5% between the years 2007 and 2011, the EU average fell by more than 35%, narrowing the gap between Croatia and the EU average. It might suggest that Croatia could catch up, but so far this gap contraction occurred only during the economy contraction.

206 Proceedings of International Conference for Entrepreneurship, Innovation and Regional Development ICEIRD 2014
Appendix: Database Table 1: The database for the analyses
R&D investment (EUR per inhabitant) - enterprise
R&D investment (EUR per inhabitant) - enterprise
R&D investment (EUR per inhabitant) - government
R&D investment (EUR per inhabitant) - government
R&D investment (EUR per inhabitant) - higher education
R&D investment (EUR per inhabitant) - higher education
R&D investment (EUR per inhabitant) - total
R&D investment (EUR per inhabitant) - total
R&D expenditure (€Mill)
R&D Personnel Total
R&D expenditure per worker (EUR)
R&D expenditure (€Mill)
R&D Personnel Total
R&D expenditure per worker (EUR)
GDP per capita (EUR)
GDP per capita (EUR)
FDI-GDP ratio (%)
FDI-GDP ratio (%)
time 2007 2011 2007 2011 2007 2011 2007 2011 2007 2007 2007 2011 2011 2011 2007 2011 2007 2011 Country\variable
RNDEPCB7
RNDEPCB11
RNDEPCG7
RNDEPCG11
RNDEPCH7
RNDEPCH11
RNDEPCT7
RNDEPCT11
RNDME07
RNDL07
RNDEPL07
RNDME11
RNDL11
RNDEPL11
GDPPC07
GDPPC11
FDIperc07
FDIperc11
Belgium 368,70 446,80 133,00 173,90 16,60 21,30 600,60 742,806356,9
3 8354076094,
46 8171 9442486535,
20 30200 29800 20,30 11,70
Bulgaria 6,30 5,00 10,50 11,60 0,20 0,10 18,40 29,80 139,61 199337003,9
1 219 2081010523,
79 3400 3700 29,40 3,50Czech Republic 82,90 91,70 78,50 101,50 1,50 2,30 175,60 243,40
1801,08 73081
24645,04 2552 82283
31014,91 11500 11600 5,80 1,10
Denmark 657,90 775,50 279,20 371,60 0,00 0,001077,70 1287,105870,5
5 6838685844,
34 7156 8537583818,
45 39900 37500 3,80 3,90
Germany 508,80 606,20 205,50 275,50 0,00 0,00 746,90 923,5061481,
9872171
285189,
08 7550183331
690603,
08 29000 30000 2,40 1,30
Estonia 53,80 158,30 59,00 94,20 1,10 0,80 129,30 287,70 173,65 927618720,
14 384 1013137903,
46 9900 9100 12,40 1,50
Ireland 277,60 285,20 181,70 178,60 9,30 4,80 560,40 589,702432,0
0 3085678817,
73 2696 3644273980,
57 41000 36500 9,50 10,40
Greece : 40,90 : 61,60 0,00 2,80 120,10 125,101341,6
0 : : 1391 7022919806,
63 18900 16200 0,70 0,40
Spain 135,40 134,70 130,10 135,20 9,90 12,10 297,90 303,9013342,
3733119
240285,
91 1418435391
140077,
87 21800 20600 4,50 1,80
France 322,80 381,00 235,60 245,10 7,90 7,90 617,50 692,8039303,
0944739
187849,
52 4502754267
182972,
92 28200 27800 3,70 1,40
Croatia 27,80 29,10 39,50 36,80 2,40 1,30 78,40 76,20 348,00 1705820401,
10 336 1725819469,
23 9200 8600 8,40 2,40Italy 129,60 147,30 136,50 136,90 3,90 2,90 308,30 326,80 18231, 33450 54502, 19811 34700 57091, 25100 23500 1,90 1,60

207 Proceedings of International Conference for Entrepreneurship, Innovation and Regional Development ICEIRD 2014
40 3 95 5 40
Cyprus 15,30 11,60 59,90 74,70 2,60 4,10 92,90 105,80 70,38 249528206,
41 89 278831922,
53 19400 18100 10,20 9,60
Latvia 20,70 16,90 28,40 15,30 0,50 1,10 56,90 67,80 125,60 1107611339,
47 141 1010813949,
35 7200 6400 8,10 5,10
Lithuania 23,50 26,10 33,60 39,10 0,10 0,90 71,60 92,60 232,59 1846712595,
12 283 2239112639,
01 7700 7700 5,10 3,40
Hungary 42,60 57,30 43,10 46,00 0,00 0,00 97,10 120,60 977,49 4948519753,
32 1205 5538621756,
40 9200 8900 2,90 4,20
Malta 40,40 59,30 20,00 33,10 0,00 2,40 77,90 114,30 31,58 155020374,
19 47 216121749,
19 12900 13500 13,20 2,70Netherlands 308,40 363,90 240,40 259,10 1,20 2,30 632,20 728,90
10342,00
113723
90940,27 12141
170913
71036,14 33700 33200 15,30 2,40
Austria 403,80 454,60 267,80 352,10 5,20 6,60 829,10 984,806867,8
2 8945876771,
39 827610794
976665,
83 31800 32100 8,30 2,60
Poland 15,80 20,70 27,10 41,10 0,10 1,80 46,30 73,601763,6
212162
314500,
69 283613455
121077,
51 7300 8300 5,50 4,00
Portugal 88,10 108,60 83,50 103,10 1,30 15,40 187,30 246,501972,7
3 6275231436,
97 260611215
523235,
70 15100 14700 1,30 4,70
Romania 8,30 12,20 20,70 16,00 0,40 0,40 30,90 32,50 652,82 4248415366,
14 657 4236315508,
82 4400 4600 5,80 1,40
Slovenia 145,10 267,10 88,60 137,40 0,90 1,00 249,00 436,20 500,51 1431134973,
80 894 2154841488,
77 16100 15400 3,80 2,00
Slovakia 16,70 29,40 25,30 43,20 0,10 1,60 46,90 86,90 252,10 2343710756,
50 468 2859616365,
93 8500 9200 4,80 3,60
Finland 806,80 893,10 284,50 333,60 3,10 2,001183,00 1332,706242,6
7 7950778517,
24 7163 8081788632,
34 32700 31300 5,10 1,00
Sweden 799,40 794,60 313,80 383,80 9,90 13,001273,70 1386,6011607,
6611567
8100344
,56 1305612513
0104339
,49 35100 35200 6,20 1,70United Kingdom 275,00 229,50 185,00 152,40 7,40 5,80 598,30 500,60
36529,06
499191
73176,52 31647
565769
55936,26 32500 30600 6,50 1,90
Total 3625,50 4037,00 2263,40 2584,00 56,90 82,606775,20 7710,10228990
,8823753
8196401,
75 25893739764
8065117,
1454170
052410
0 204,90 91,30

208 Proceedings of International Conference for Entrepreneurship, Innovation and Regional Development
ICEIRD 2014
Reference list
1. Romer P M. Endogenous Technological Change. Journal of Political Economy 1990; 98(5): 71-102
2. Tian X, Slocum J W. What determines MNC subsidiary performance? Evidence from China. Journal of World Business 2013; in press
3. Hallin C, Lind C H. Revisiting the external impact of MNCs: An empirical study of the mechanisms behind knowledge spillovers from MNC subsidiaries. International Business Review 2012; 21: 167–179
4. OECD. Economic Outlook - Annual Projections for OECD Countries. 1993: No 54 - December
5. Belderbos S, Leten B, Suzuki S. How global is R&D? Determinants of the home country bias in R&D investments. In: Paper Presented at the DIME Final Conference, 6–9 April 2011. UNU-MERIT & School of Economics and Business, Maastricht University.
6. Picci L. The internationalization of inventive activity: a gravity model using patent data. Research Policy 2010; 39 (8): 1070–1081
7. Castellania D, Pieri F. R&D offshoring and the productivity growth of European regions. Research Policy 2013; 42 (2013): 1581– 1594
8. Grossman G, Helpman E. Innovation and Growth in the Global Economy. Cambridge: MIT Press, 1991
9. Aghion P, Howitt P. A Model of Growth Through Creative Destruction. Econometrica 1992; 60(2): 323-351
10. Bayoumi T, Coe D T, Helpman E. R&D Spillovers and Global Growth. Journal of International Economics 1999; 47: 399-428
11. Guellec D, Van Pottelsberghe De La Potterie B. From R&D to Productivity Growth: Do the Institutional Settings and the Source of Funds of R&D Matter?, in: Oxford Bulletin of Economics and Statistics 2004; 66(3): 353-378
12. Cantwell J. The Globalisation of Technology: What Remains of the Product Cycle Model?. Cambridge Journal of Economics 1995; 19(1): 155-74
13. Falk M, Unterlass F. Determinanten des Wirtschaftswachstums im OECDRaum, in: Aiginger K, Tichy G, Walterskirchen E. WIFO-Weißbuch: Mehr Beschäftigung durch Wachstum auf Basis von Innovation und Qualifikation, Teilstudie 1, Vienna, 2006: 1-60
14. Herzer D, Klasen S, Nowak-Lehmann D F. In search of FDI-led growth in developing countries: The way forward. Economic Modelling 2008; 25(5): 793-810
15. Javorcik B S. Does foreign direct investment increase the productivity of domestic firms? In search of spillovers through backward linkages. American Economic Review 2004; 94: 605–627
16. Giroud A, Scott-Kennel J. MNE linkages in international business: A framework for analysis. International Business Review 2009; 18(6): 555–566
17. Solow R M. Technical Change and the Aggregate Production Function. Review of Economics and Statistics 1957; 39: 312-320
18. Barro R, Sala-i-Martin X. Capital Mobility in Neoclassical Models of Growth. American Economic Review 1995; 85: 103-115
19. Hejazi W, Safarian E B. Trade, Foreign Direct Investment and R&D Spillovers. Journal of International Business Studies 1999; 30(3): 491-511

209 Proceedings of International Conference for Entrepreneurship, Innovation and Regional Development
ICEIRD 2014
20. Blomström M, Lipsey, R E, Zejan, M. Is Fixed Investment the Key to Economic Growth?. CEPR Discussion Papers 870, C.E.P.R. Discussion Papers, 1993
21. Bayoumi T, Coe D, Helpman E. R&D Spillovers and Global Growth. Journal of International Economics 1999; 47: 399-428
22. Borensztein E J, Lee J W. How Does Foreign Investment Affect Economic Growth?. Journal of International Economics 1998; 45: 115-35
23. Ciruelos A, Wang M. International Technology Diffusion: Effects of Trade and FDI. Atlantic Economic Journal 2005; 33: 437–449
24. De Mello L R. Foreign Direct Investment-led Growth: Evidence from Time Series and Panel Data, Oxford Economic Papers 1995; 51: 133-154
25. Dabić M, Herceg T, Vlajčić D. The Effects of R&D and FDI on GDP per Capita Growth in EU and EU Accession Countries”. Proceedings of the Conference “Entrepreneurship without borders, The College of Management, Academic Studies, Rishon Lezion, Israel, November 16-18 2009, ISBN-10: 932-6025-953, ISBN-13: 932-6025-953-978, p. 22

210 Proceedings of International Conference for Entrepreneurship, Innovation and Regional Development
ICEIRD 2014
''EUROPE 2020'' Strategy As A Global Imperative For SEE Countries
Andjelko S. Lojpur1, Milivoje Radovic2, Ana Lalevic-Filipovic3
1Faculty of Economics, 37 Jovana Tomasevica, Podgorica, Montenegro, [email protected]
2 Faculty of Economics, 37 Jovana Tomasevica, Podgorica, Montenegro, [email protected]
3 Faculty of Economics, 37 Jovana Tomasevica, Podgorica, Montenegro, [email protected]
Abstract In an contemporary increasingly complex environment, globalization has shown to have resulted in the change of the kernel of achieving competitive advantage. The key novelty reflects itself through nations ''dedicated to knowledge'' taking the lead against the industrial countries. The focus of the productivity growth is thereby shifted towards the so-called non-price factors, whereas generating efficient usage of knowledgde has levied itself as the most bountiful source of reaching and sustaining competitve advantage at the natonal level. On the other hand, in accordance with the European social market economy vision for the XXI century, written in the strategic document ''Horizon 2020'', the EU economy should be: intelligent, sustainable and integrational. In this respect, when it comes to the SEE countries on the way towards the EU and the ones already acceded, the authors’ aim is to point out the necessity of accepting the knowledge in which competitive environment will be based on more complete implementation of the „new economy“ principle. More precisely, their governments have to accept the new way of thinking and develop their own innovation strategy in which crucial base will be the management of knowledge. Key words: Competitiveness, Knowledge Economy, Knowledge, Transition. 1. Introduction The three-decade-long experience of countries in transition has shown that the majority of these countries viewed through the aspect of the scope of industrial production and the level of productivity and competitiveness, on the one hand, as well as the sum of social welfare, on the other hand, still get by beyond the available means. In addition to that, systemic transition which should have allowed for the transformation from the socialist into the market form of economy, as an integral part of all-encompassing political and ideological changes in eastern Europe, showed itself to be a very painful and unfinished process. Simultaneously, the imposed stream of globalization and the entire dynamics of international economic relations slow down reforms and additionally affect the loss of their initial and, sometimes, heavily acquired competitive positions. The ongoing global economic crisis has, in the form of ''emergency exit'', imposed a requirement on both developed and developing countries to improve their innovation and applied knowledge. This has raised a question, among SEE countries the EU accession negotiations in which have commenced or are close to commencing, of how to combat the fear of integration inherited from the past, how to overcome obstacles between

211 Proceedings of International Conference for Entrepreneurship, Innovation and Regional Development
ICEIRD 2014
local/domestic and legal heritage (acquis communautaire) of the EU and effectuate as much as possible the salient strength of the EU appeal?
2. Has progress been truly achieved in countries in transition?
Globalization means that the world has become a global supermarket where ideas and products have become available everywhere at the same time.
R. M. Kanter Taking into consideration the aim of this work, the question that deserves additional focus is the key notion set previously in the introduction of the latest report of the European Bank for Reconstruction and Development. In the 21th century, as pointed out by M. Dragicevic, there is need to think and act in a completely new way, different from its record not only in business but also in the region, the state, the individual and the world [1]. The question is: ''Can countries in transition (region) ever catch up with the living standard of most of the developed market economies?'' [2]. In this document, it is clearly stated that the economy growth of this group of countries is still below the level prior to the crisis, that many of them ''turned their back'' on reforms which could lift the economies of the former-eastern-block countries. The thereby mentioned ''shock'', as stated in the report further, brings about suspicion in the capabilities of those countries in terms of getting back on track of reforms, which undermines their ability of keeping up with the developed countries in regard to the living standard. Beside the claim put forward that the entire region ''has gone awry'' in the midst of the transition process, the report comprises a certain dose of optimism saying that the ''vicious circle'' of stagnation and slow progress in transition can be stopped in such as way as to ''let those countries go back to their reforms or start from scratch, but before that they have to turn to international integrations, domestic leadership and broad social change.'' On the other hand, the global challenges the EU is facing have remained the same, though they have grown in complexity and significance, namely: continuous economic strengthening of the developing countries, reorganization of finances at the global level, climate change and scarcity of resources. The above-mentioned tendencies, reported in the shape of EU developmental documents such as ''Strategy 2020'' have particular relevance in EU countries which have already acceded to the EU but are frequently referred to as ''poor relatives''. To uphold the claims, Table 1 gives an overview of the progress achieved by a group of countries in transition depicted in the form of the so-called transition indicator, as well as an overview of the transitional country ranking in align with the achieved progress in comparison to priorities established by ''Strategy 2020''. EBRD defines this indicator since 1994, and accompanied by a period of 1989. Indicator of the transition (Transition Country-level indicators) shows that countries thrive in transition coverage on several grounds (columns) and allows comparison between them. Indicators are the grades ranging from "little or no progress in transition" (indicator 1) until the "end of transition", the equalization of the country at that element with advanced market economies (indicator 4 plus).

212 Proceedings of International Conference for Entrepreneurship, Innovation and Regional Development
ICEIRD 2014
Table 1 Progress achieved in the group of countries in transition
Country
Enterprises Trade and market
Large -scale privatization
Small -scale privatization
Management and
restructuring
Price liberalization
International trade
Competitive policy
Albania 4- 4 2+ 4+ 4+ 2+ Bosnia and Herzegovina
3 3 2 4 4 2+
Croatia 4+ 4+ 3+ 4 4+ 3 Bulgaria 4 4 3- 4+ 4+ 3 Estonia 4 4+ 4- 4+ 4+ 4- FYR Macedonia
3+ 4 3- 4+ 4+ 3-
Hungary 4 4+ 4- 4+ 4+ 4- Lithuania 4 4+ 3 4+ 4+ 4- Montenegro 3+ 4- 2+ 4 4+ 2 Poland 4- 4+ 4- 4+ 4+ 4- Romania 4- 4- 3- 4+ 4+ 3+ Russia 3 4 2+ 4 4 3- Serbia 3- 4- 2+ 4 4 2+ Slovenia 3 4+ 3 4 4+ 3- Ukraine 3 4 2+ 4 4 2+ Turkey 3+ 4 3- 4 4+ 3 Source: EBRD, Transition Report 2013 p.112
Table 2 Country rankings by “Strategy 2020” priorities
Country
Intelligent growth Integrative growth Sustainable growth
Enterprise environment
Digital Agenda
Innovative Europe
Education and training
Labor market and
employment
Social inclusion
Environment protection
Sweden 5,05 6,13 6,12 5,75 4,65 6,40 6,31 Croatia 3,30 4,72 3,14 4,27 3,55 4,24 4,83 Estonia 4,13 5,94 4,07 5,03 4,66 4,66 4,67 Macedonia 3,70 4,17 2,72 3,84 3,98 3,36 3,47 Hungary 3,61 4,60 3,53 4,51 3,97 4,52 3,70 Lithuania 3,53 5,35 3,49 4,81 4,69 3,75 4,59 Montenegro 3,95 4,74 3,62 4,37 4,67 4,79 4,60 Poland 3,65 4,44 3,39 4,89 4,01 3,97 4,20 Romania 3,44 4,08 2,89 4,14 4,00 4,03 3,97 Serbia 3,12 4,10 2,79 3,81 3,53 3,85 3,49 Slovenia 3,73 4,88 4,08 4,95 4,26 5,19 5,04 Turkey 3,90 4,27 3,29 4,01 3,42 4,01 3,32 Source: WEF; The Europe 2020 Competitiveness Report: Building a More Competitive Europe, Edition 2012
Sweden is included here, as EU member, for comparison with countries in transition because of these seven columns. Sweden takes the first place in four of them as the highest-ranked (enterprise environment, innovative Europe, social inclusion, environmental sustainability), once ranked as the second (digital Agenda), one third (education and training) and one as eleven (labor market).
Based on the insight into tables above, it is evident that transitional countries lag behind in terms of some of the key pillars of developement, for instance: management and restructuring, competition, education and training, innovative Europe and so on, bearing in mind that the factors given are the so-called ''soft'' factors or the so-called no price factors of competitiveness. There certainly are several causes of this lag; however, both this and similar reports reveal the main reason for the insufficiently rapid progress of this country group: slow influx of foreign capital imposed as the crucial trigger of progress in the initial

213 Proceedings of International Conference for Entrepreneurship, Innovation and Regional Development
ICEIRD 2014
stages; then, a lack of the ''second'' generation reforms, etc. Therefore, regardless of of their ''proximity'' to the EU, countries in transition are faced with requirements, focal points of the revised Lisbon strategy, some of which shortly are: to ensure knowledge and innovation for growth by increasing and enhancing research investment and development, to encourage innovation, improve and implement ICT, to use resources with sustainability and so on. This means that in contemporary increasingly complex environment, enterprises competition is based on knowledge and it is exactly by knowledge that they reach key competitive advantage, which, from an objective point of view, further complicates the cirrcumstances in transitional countries in respect to their future, but it also urges governments to be more (Lojpur,A.3).
3. Countries in transition and the choice of develo pmental model
Bearing in mind experiences of developed countries, it becomes more evident that what lies ahead in the XXI century is a radical break-away from the past and a search for a “new” developmental model in the process of EU integrations and the globalization as a whole. What this means is that we should start thinking and acting in a completely new way, different from the current one, not only in the realm of individual enterprise management, but also at the level of the state, an individual and the entire globe. In the contemporary global arena, economic power is no longer in the hands of those rich in natural resources i.e. ''countries rich in capital'', but is already being transferred to the hands of the ''intellectually rich''. The foundation of today's battle for the increase of the national competitiveness rate is in knowledge, or, as pointed out by P. Drucker some time ago: ''This world is becoming more and more of a world in which people not only do not work intensively and do not consume resources and energy intensively, but a world in which people educate themselves more intensively and apply the acquired knowledge more intensively.'’ This furthermore means that innovation-based growth, underpinned by investments in a broad range of knowledge-based capital (KBC), is central to raising long-term living standards. Indeed, investment in KBC has been increasing, and in some countries is larger as a share of GDP than investment in physical capital. KBC - assets that have no physical embodiment, such as computerized information, innovative property and economic competencies. Investment in KBC differs greatly across countries; according available data suggests that English speaking countries – particularly the US – Japan and Sweden invest in the vicinity of 10% of GDP in KBC, investment in KBC in Italy, Portugal and Spain typically amounts to less than 5% of GDP [3].
What is more, total contemporary social-economic reality increasingly formed under the influence of ICT on all segments of human life is most occasionally uniformed and termed as ''informational society'', while the economic sub-system developed under the afore-mentioned influences is referred to as ''knowledge economy''. Dominant as such economy is in an extensively open and global economy, the issue of competitiveness has undoubtedly taken the pivotal role. Consequently, R. M. Kanter for instance addresses the question of abandonment of the existing paradigm from the 1980s and says: ''It is evident that people back then were not considered as the most significant capital. Nevertheless, today's enterprises in mature economies have altered their attitudes towards the meaning of human capital, which redefines them as even greater competitor.''
Even before the EU crisis, the focus of the EU had been to improve its system of innovations in order to reduce the fall-behind rate in relation to the US and in terms of competitiveness. What goes in favour of the statement that the issue of competitiveness has supra-national character by relevance is ultimately the EU's relation towards this issue, namely, the introduction of the so-called Lisbon agenda. To become the most competitive and dynamic knowledge-based economy, capable of sustainable economic growth with more and quality jobs and greater social cohesion ". Initially, the proclaimed goals of the Lisbon Strategy were political and economic initiatives founded on the previously accepted European standards. In align with the asserted development vision, as the starting point of the ''Europe 2020

214 Proceedings of International Conference for Entrepreneurship, Innovation and Regional Development
ICEIRD 2014
Strategy'', it was adopted that the economy of the EU should be: intelligent, sustainable and integrational, with the thereby established priorities: • Intelligent growth; economy based on knowledge and innovations. • Sustainable growth; economy which efficiently manages resources, is environmentally
moderate and competitive. • Integrational growth; economy has a high employment rate and social and territorial
integration.
"New Economy" is the result of the following processes: 1) informatics, 2) privatization, 3) deregulation, and 4) globalization [4]. The previously mentioned strategy ''Europe 2020'' show that we are technically at the crossroads of the thus far dominant ''mass economy'' which has rested on mass production and the consumption of energy resources, on the one hand, and the so-called ''knowledge economy'', on the other hand. At the same time, when it comes to underdeveloped countries,in both theory and practice of economics, two basic concepts of development are to be differentiated [4]. The first ones, in accordance to which development can be achieved through maximum use of the production potential at one country's disposition, are: an abundance of cheap labour, bountiful natural resources, the possibility of a specific monopolistic position, etc. However, according to the second concept, undeveloped countries have to turn to the implementation of the most contemporary technology and scientific achievements in order to follow in the footsteps of developed countries. In practice, the second conceot has proven itself to be more realistic and effective. It has particulalrly shown to be realistic in case of Japan and a group of newly-industrialiased countries of South-East Asia (the so-called ''small Asian tigers''), wth their rapid emergence explained through appreciation and consistent implementation of the ''new economy'' principles. 4. The new way of thinking in the competitiveness d omain The World Economic Forum (WEF) has been looking into the competitiveness of countries for three decades now and it defines the national competitiveness as a sum of indicators, institutions and factors affecting the level of productivity of a single state and conduct sustainable middle-term level of economic prosperity [5]. With the aim of having a more comprehensive insight into the cirrcumstances in terms of the level of competitiveness reached in the region, we give a comparison overview of the achieved level of global competitiveness of one group of transitional countries in the region for the 2013-2014 period in Table 3.

215 Proceedings of International Conference for Entrepreneurship, Innovation and Regional Development
ICEIRD 2014
Table 3 Ranking of the countries from the region in accordance with the competitiveness index for the 2007-2013 time period
Year Albania B&H Croat. Greece Hungary Maced. Monten. Roman. Serbia Slovac. Sloven. 2007 109 106 57 65 47 94 82 74 91 41 39 2008 108 107 61 67 62 89 65 68 85 46 42 2009 96 109 72 71 58 84 62 64 93 47 37 2010 88 102 77 83 52 79 49 67 96 60 45 2011 78 100 76 90 48 79 60 77 95 69 57 2012 89 88 81 96 60 80 72 78 95 71 56 2013 95 87 75 91 63 73 67 76 101 78 62 Source: The Global Competitiveness Index 2013-2014; WEF.
Overview of the ranking of leading developed countries and the countries in transition in accordance with the innovation index (Global Innovation Index Raking) is given in Table 4.
Table 4 Leading developed countries and countries in transition in accordance with the global
innovation index (Global Innovation Index Rankings)
Ranking Developed countries Countries in transition
Global list ranking
1 Swizerland Estonia 25 2 Sweden Czech Republic 28 3 UK Slovenia 30 4 Netherlands Hungary 31 5 USA Latvia 33 6 Finland Slovakia 36 7 Hong Kong Croatia 37 8 Singapore Lithuania 40 9 Denmark Bulgaria 42 10 Ireland Montenegro 44
Source: Ranking; The top most competitive economies in Europe, 2012
Based on the data from the Tables 3 and 4, the following can be inferred: • 2013/2014 Report comprising 148 countries has pointed out that, for the fifth time in a
row, Swizerland remains in the leading position, with Singapore following the lead as second third time in a row; Sweden has sunk from ranking place number 4 to number 6, the USA jumped from number 7 to number 5, whereas Germany made it from place number 4 to number 2.
• Estonia (32) is the leader among transitional countries; it has improved its ranking position by one in comparison to the previous year; the following are the Czech Republic (46), Lithuania (48), Latvia (52), Bulgaria (57) and others. Among the neighbouring countries in 2013 – table 1, Slovenia stands as the best ranking country (62), then Hungary (63), Montenegro (67), Croatia (75), Romania (76), Serbia is 101st, bearing in mind, however, that Slovenia was 39th in 2007 and Montenegro 49th in 2010, which was its best ranking by that year.
• When it comes to the innovation and sophistication ranking list [6], what is evident is the stagnation in the group of transitional countriesi: Estonia occupies the leading position among the transitional countries, but is also 25th on the global list; the Czech Republic is second, but also 28th on the global list; Montenegro comes 44th, Macedonia 51st, Serbia 54th, B&H 62nd and so on.
Within the context of the previously analysed, there are numerous pieces of research following the conditionality of the economic development based on the knowledge factor and the foundation of certain economies on knowledge. Therefore. The top-ranking countries on the latest list of the so-called Knowledge Economy Index (KEI) in 2012, in sequence, were: Sweden, Finland, Denmark, the Netherlands, Norway, New Zealand, Canada, Germany,

216 Proceedings of International Conference for Entrepreneurship, Innovation and Regional Development
ICEIRD 2014
Austria, Swizerland, Ireland, USA, Taiwan, UK, Belgium, etc. In Table 5 a review of top 10 economies is given, categorised by all the KEI ''pillars''.
Table 5 Top 10 economies categorised by each KEI pillar1
Ranking EIR Innovation Education ICT 1 Singapore Swizerland New Zealand Bahrein 2 Finland Sweden Australia Sweden 3 Denmark Finaland Norway Luxembourg 4 Sweden Singapore Korea UK 5 Hong Kong Denmark Greece Netherland 6 Swizerland USA Sweden Finland 7 Canada Netherlands Island Sweizerland 8 Norway Israel Taiwan Germany 9 Luxembourg Taiwan Ireland Taiwan 10 Austria Canada Spain Hong Kong
KEI (The Knowledge Economic Index) shows the extent to which environment stimulating affect for the effective use of knowledge, and presume the valuation of the four variables (pillars): economic incentives and institutional framework (EIR), education and human resources, system innovation and information and communication technology (ICT). Based on the data from several previous table, the following emerges as salient: a) there is a high rate of positive corelation between the achieved level of global competitiveness (GCI) and innovaton factor; for instance, Swizerland stands out as first by both of the parameters, Finland is third by the first parameter and second by the innovation parameter, Germany is forth by both and so on.; b) there is a high rate of positive corelation between the GDP and KEI. Perhaps guided by the same goals, but also by the acknowledgement that the ''Strategy 2020'' refers to EU member states, OECD started the initiative of creating the Strategy for SEE Development by 2020 (Strategy SEE), the goals of which were derived from the former one. In the introduction of the document it is states: ''the strategy reflects determination of the governments of SEE countries to implement the policy which will encourage faster socio-economic development, improvement of the citizens' prosperity and a growing number of job opening, as well as greater access to the EU market''. Strategy SEE should enable the realization of the following general goals [7]: • Increase in average GDP per capita in SEE countries in relation to the EU average: from
36.4% (2010) to 44% (2020) • Increase in the overall trade of goods and services: from 94.4 billion EUR (2010) to 209.5
billion EUR in 2020 • Decrease in the trade deficit in SEE countries: from -15.7% (2008-2010 average) to -
12.3% GDP in 2020 • Creation of one million job opening in SEE countries by 2020. Looking upon the EU member states, Montenegro developed and adopted the strategy called ‘’Directions of Development in Montenegro 2013 - 2016’’ which formulates strategic priorities, the direction of development, and also the domain of policies and sub-policies with solid measures and public investments contributing to the economic and societal development. Making and adopting this strategy, Montenegrin Government aimed to enable consolidation of the middle-term investment and development plan, which will initiate the realization of developmental priorities and underpin economic growth in the country. Realization of public
1 KEI (The Knowledge Economic Index) shows the extent to which environment stimulating affect for the effective use of knowledge, and presume the valuation of the four variables (pillars): economic incentives and institutional framework (EIR), education and human resources, system innovation and information and communication technology (ICT).

217 Proceedings of International Conference for Entrepreneurship, Innovation and Regional Development
ICEIRD 2014
investments/measures for developement, the contribution of the economic performance would reflect itself in:
• Return to the economic growth above the potential, i.e. real GDP growth of 3-4%; • Deficit decrease in public finances and a balanced budget by 2016; • Decrease in informal economy participation;
In align with the long-term needs of the Montenegrin economy and society, six PR priorities have been indentified: 1) Science and education; 2) Smal and medium-size enterprises; 3) Labour market; 4) Spatial planning; 5) Transportation i 6) Efficient state. The goals and priorities given, as well as the Development Strategy in Montenegro 2013-2016 suggest the following allocation of means within the limitation of the available financial resources: a) smart growth – 25%; b) sustainable growth – 65%, c) inclusive growth – 10%. Taking into account the previously stated, it remains to be concluded, first of all, that the Lisbon strategy was revised at the time when it was already perfectly clear that its goals could not be accomplished, and neither the SEE Developement Strategy. The creators of the development policies at the regional and national (Montenegro, as an example) came to the decision that there is a need to move the focus of attention to the issues addressed and stressed in this document. The main reason for that is the fact that innovation strategy "Europe 2020" which is similar to current one in the United States or in developing countries like China is the response to the economic crisis and its primary objective is to overcome structural weaknesses [8]. The requirements from the above-mentioned documents tranferred into the form of developmental goals followed by detailed action plans could be phrased as the following- ensuring knowledge and innovations for growth, which will inrease and enhance investment in research and development, spur further innovation, impove and implement ICT sector, encourage sustainable usage of resources, and more. Broadly looking, when it comes to the position of the state within the entire social reality advocated, that is, the advocacy of the government, this aspect requirs change and the adoption of the new mindset, a new ''way of thinking'', as presented in Table 6.
Table 6 ''New'' government action-taking mindset
Role / Way of thinking
Way of thinking Liberatization
mindset Modernization mindset KB economy
Mindset
Is about Undoing things Building things
Building winning oportunities
Creates
Freedom Fluidity Even playing field
Modern institutions Rule of law Good basic business Environment
Vision A winning mentality Clusters A vibrant home base for business
Main Focus
Stability Incetives
Productivity Catch-up
Becoming globally competitive
Domain Economy Economy Society
Society
Government's role
Get out of the way Stop being an operator
Become a good regulator Become a challenger Become an integrator
Finally, as key morals in respect to the role innovation and knowledge should take in the process of constructing a new development scenario of transitional economies, we can shed light on the fact that the increasingly globalised and technological revolution during the last few decades knowledge has undoubtedly becomes the key competitiveness factor. It is based on this that new contemporary models of growth are established. Countries that wish to progress along this path must develop the KEI programme of change management, which
218 Proceedings of International Conference for Entrepreneurship, Innovation and Regional Development
ICEIRD 2014
is pragmatic and which appreciates individual country's particularities. This requires broad national concensus and an enviable level of social cohesion with parallel combination of top-down approach to reforms and well-communicated KEI vision, which means that the government is expected to play the pivotal motivational role (strong facilitative role) in leading the development process. 5. Conclusion
We have hereby underscored that the EU economy, in align with the vision of the European social market economy, should be intelligent, sustainable and integrational. In addition, in strategic documents, it is emphasized that there is a broad concensus on the implementation of these three priorities by 2020, with each of them underpinning the other, with the aim of abiding the particularilities of each member state in practice. Undoubtedly, this issue is simultaneously intertwined with the reforms which are imposed on the countries in transition, especially countries of the SEE which are willing to acede the EU. The rapid recovery of these countries and their progress is only possible by establishing appropriate development strategies so that these groups of countries collapse all those stages of development experienced by the developed countries. Seen in the long run, the ultimate success of the transition countries in the process of catching up with the developed countries will depend on their willingness to abandon the traditional factors of economic growth and embrace the development pattern based on the “economy of knowledge”.

219 Proceedings of International Conference for Entrepreneurship, Innovation and Regional Development
ICEIRD 2014
References
1 Dragicevic M. Konkurentnost, projekat za Hrvatsku. Skolska knjiga, Zagreb 2012; 16. 2 Drucker P. Menadzment za buducnost. Asee Books. Novi Sad 2006; 2 – 56. 3 Study. Strategija razvoja za Jugoistocnu Evropu do kraja 2020. godine – otvaranje radnih
mjesta i prosperitet u evropskoj perspektivi. The Government of Montenegro 2013; 1. 4 Ilic B. Perspektive razvoja zemalja u tranziciji, Economics Annals, Belgrade 2005; 187, 2, 203. 5 World Economic Forum, http://www.gcr.weforum.org/, The Global Competitiveness Report,
2013/2014. 6 Global Cometitiveness Index. Report 2013-14; 16. 7 The general objectives of the SEE 2020 Strategy JEE development by the end of 2020. 8 Henke J. Da li je inovaciona politika Srbije spremna za clanstvo u EU, editor Trbovic A,
Singidunum Belgrade 2012. 9 Lojpur A, Pekovic S. Znanje i inovaciona politika zemalja u tranziciji kao mjera spremnosti za
ulazak u EU. Economics & Economy. Vol.1 . No.2. 61-75. 10 Lojpur A. Da li je ikako moguc oporavak privrede u uslovima globalizacije. Acta Economica.
Faculty of Economics, Banja Luka. No20. 2014. 39-58. 11 Porter M, Rivkin J. The looming Challenge to US Competitiveness Harvard Business review,
No3. 2012. 12 Tapscott D. Rethinking in a Netw (or Why M.Porter is Wrong about Intenet). Strategy +
BusinessIssue 24. 2001. 13 Stiglitz J. Globalization and its Discontents W.W.Norton & Company. New York 2002. 14 Study. Pravci razvoja Crne Gore 2010-2016. The Government of Montenegro. Ministry of
Finance. Podgorica 2013. 15 Study. Strategija razvoja za Jugoistocnu Evropu do kraja 2020 – otvaranje radnih mjesta i
prosperitet u evropskoj perspektivi. The Government of Montenegro. 2013. 16 Building Knowledge Economies. Advanced Strategies for Development. WB. Washington
2007. 17 Global Competitiveness Report 2013/14. The World Economic Forum. 18 Raising the returns to innovation. Structural policies for a Knowledge-based Economy. OECD
2013. Economics Department Policy Notes. No 17. 2013. 19 WEF The Europe 2020 Competitiveness Report. Building a More Competitive Europe. Edition
2012. 20 Transition Report Stuck in transition. European bank for Reconstruction and Development
2013. 21 on Competitiveness Report 2013. European Commission 22 Knowledge Economy Index (KEI) Rankings, The World Bank 2012. 23 Ranking: The top most competitive economies in Europe 2020. 24 Global Entrepreneurship Monitor, GEM Report 2012.
220 Proceedings of International Conference for Entrepreneurship, Innovation and Regional Development
ICEIRD 2014
THREE YEARS OF GEM IN BUCARAMANGA: A COMPARATIVE ANALYSIS
Maryi Cadrazco1, Gladys Rueda2
1Director of the Entrepreneurship Unit UPB, member of the Management Research Group, Universidad Pontificia Bolivariana de Bucaramanga, Colombia. [email protected]
2Research Director of the School Strategic Sciences, Leader of the Management Research Group, Universidad Pontificia Bolivariana de Bucaramanga, [email protected]
ABSTRACT
Global Entrepreneurship Monitor (GEM) is a network of research in entrepreneurship globally recognized to measure the performance of the enterprise and entrepreneurs, as well as associated factors. This article attempts from the reports submitted by the GEM model in Colombia during the years 2010 - 2013, specifically the report of the city of Bucaramanga developed by the Pontifical Bolivarian University, Autonomous of Bucaramanga University, Northern University, The School of Management and Business, and Cooperative University of Colombia.
Keywords Entrepreneurs, Entrepreneurship, Global Entrepreneurship Monitor TEA, Technologies.
1. Introduction
The report prepared for the city of Bucaramanga, is emphatic in stating that its main objective is to contribute to a greater understanding of the relationship between entrepreneurial activity and economic development of countries and localities. (GEM, 2011) Therefore focuses on three specific objectives: • Measure the differences in attitudes, aspirations and entrepreneurial activities among
participating countries and localities. • Identify the determinants and the level of national or local entrepreneurial activity. • Identify policy implications to foster entrepreneurship. According to this, the report will focus on comparing the first element during the years of completion of the report, for the target city. It should be noted that this document is descriptive, as part of a picture set and the principal porpoise is to report the results.

221 Proceedings of International Conference for Entrepreneurship, Innovation and Regional Development
ICEIRD 2014
2. Theoretical review 2.1. The GEM model The GEM model aims to study the entrepreneur, in order to analyze the factors associated with their personality and family variables, social and economic environment that influence the time to start a new business idea. According to the characteristics of entrepreneurs and the time is their business ideas, the GEM model proposes the following classification: potential entrepreneur, entrepreneur development, emerging entrepreneur, new entrepreneur, entrepreneur established. Furthermore, the model takes into account the context of entrepreneurship and entrepreneurial young age profile, as shown in Figure 1.
Tabla 1. GEM - Conceptual Model
Source: Colombia GEM Report 2012 -2013, p. 13 [1]
2.2. Analysis: Total Entrepreneurial Activity (TEA) in Bucaramanga Bucaramanga is a city of Colombia, and also Capital of the Department of Santander. According to the National Administrative Department of Statistics it has approximately 526,940 habitants [2]. The measurement of business activity in the participating cities of Colombia regionals GEM studies include the following indicators: rate of new entrepreneurial activity, TEA by chance, TEA by necessity, rate of nascent entrepreneurs, new entrepreneurs rate, rate of established entrepreneurs and discontinuous entrepreneurs [3] In accordance with the topics that are going to be work in the following article, and according to the Chamber of Commerce of Bucaramanga, in 2012, the results generally show that

222 Proceedings of International Conference for Entrepreneurship, Innovation and Regional Development
ICEIRD 2014
14,264 companies were formed in the 81 municipalities of Santander, where this entity has control, representing an increase of 36% compared to companies that were registered in 2011. This indicates a growing need for people to generate income. However the level of informality is still high, and growth shown in 2012 includes a high proportion of businesses already operating in the market and saw a good opportunity in the law to register with different campaigns by the chamber of Commerce of Bucaramanga to encourage enrolment, including formalization highlights Brigades [4].
2.2.1 Total Entrepreneurial Activity (TEA)
Bucaramanga in 2010, presents a TEA of 17.4%. During the first year of studio, this figure was considered as an intermediate in the report, and distant by ten percentage points over the region with the highest TEA, which was in this case the Caribbean, formed by the cities of Barranquilla, Cartagena, Santa Marta and Sincelejo.
In 2011 the TEA was 21.0%, an increase of 20.7% over the previous year, and in 2012, this measure was 22.5% above the previous average by 7.1%.
Tabla 1. TEA 2010-2013 in Bucaramanga
YEAR TEA % CHANGE
2010-2011 17,4% 2011-2012 21,0% 20,7% 2012-2013 22,5% 7,1%
Source: APS-GEM Colombia 2010-2013 [1][3]
2.2.2 TEA by Chance Vs. TEA by necesity
According to GEM, opportunity entrepreneurs are those "Individuals who make the decision to start a company by having full knowledge of the environment for entrepreneurship and envisioned a business opportunity, and chose this option rather than other income-generating opportunities they had alternatives." Also, catalogued entrepreneurs by necessity, as “individuals at the time of making the decision to start a company did not have other job opportunities that this new business was their only option to generate revenue." By 2010, with respect to the motivation to undertake, in accordance with the GEM study, the relationship TEA necessity vs. opportunity reveals that the city recorded a greater number of enterprises motivated by the opportunity, 12.7 % compared those of necessity, 4.6 %. For

223 Proceedings of International Conference for Entrepreneurship, Innovation and Regional Development
ICEIRD 2014
2011, the TEA by chance was 15.5 % and TEA by necessity was 5.0%. For 2012 Bucaramanga TEA by chance was 18.7 %, while TEA by necessity was 3.8 %. The TEA opportunity varies in the period 2011 compared to 2010 by 22% while in 2012 with respect to the previous year variation is 20%. This could be explained by various factors such as changes in government policies or taxes. On the other hand, the TEA must have a variation of 8.7 % in the period 2011 with respect to 2010, and a significant decrease of 24% in the period 2012 compared to 2011. Given the above, it can be inferred that the city shows a positive environment for entrepreneurship by opportunity, and that company’s need generated by increasingly represent a smaller percentage [3]
Tabla 2. TEA by chance Vs. TEA by necessity
YEAR TEA BY CHANCE
% CHANGE
TEA BY NECESSITY
% CHANGE
2010-2011 12,7% 4,6% 2011-2012 15,5% 22,0% 5,0% 8,7% 2012-2013 18,7% 20,6% 3,8% -24,0%
Source: APS-GEM Colombia 2010-2013. [5]
2.2.3. Established entrepreneurs
Employers established according to GEM are the "percentage of population between 18-64 years of age who own or manage a company, and paid salaries in cash or in kind, by a period between 3 and 42 months ". The city of Bucaramanga in 2010 has a rate of 20.9% established entrepreneurs while in 2011 is 7.0% and in 2012 this figure is 6.9%, still slightly above the national average rate (6.7%). It follows that people with this type of activity decreased dramatically in 2011 with respect to 2010 at 66.5%, and in 2012 also showed a decrease of 1.4%.
Tabla 3. Established entrepreneurs
YEAR ESTABLISHED ENTREPRENEURS
% CHANGE
2010-2011 20,9% 2011-2012 7,0% -66,5% 2012-2013 6,9% -1,4%
Source: APS-GEM Colombia 2010-2013. [5]

224 Proceedings of International Conference for Entrepreneurship, Innovation and Regional Development
ICEIRD 2014
2.2.4 Discontinuous entrepreneurs
For GEM, discontinuous entrepreneurs are those "between 18 - 64 has discontinued, sold, liquidated or withdrawn from an entrepreneurial activity which owned or participated in its administration."
According to the above, the rate of discontinuous business for 2010 in Bucaramanga is 3.5%, while the data for 2011 are not available, and in 2012 the rate was 4.2%. It is inferred based on the results of the study that the trend is increasing, and those employers who have been an active part of a company as owners or administrators, and they are not, is significantly high.
Tabla 4 Discontinous entrepreneurs
YEAR DISCONTINUOUS ENTREPRENURS
2010-2011 3,5% 2011-2012 2012-2013 4,2%
Source: APS-GEM Colombia 2010-2013.
3. Conclusions
It is important to show that this article seeks to highlight the work of the GEM report conducted in the city of Bucaramanga in the years 2010-2013.
By studying one of its components, called by the same consortium (GEM) as Total Entrepreneurial Activity (TEA), is that while initially 14% of the population between 18 and 64 had the propensity to undertake, this figure has been increasing in subsequent years, reaching 22.5%. This is explained by government programs that have been developed around the issue and supported in the additional fact that Colombia has a general law of Entrepreneurship called 1014.
Also the TEA by chance is higher than the TEA by necessity, which represents not forced by circumstances, but aware of the options offered by the positive market environment and a population with the capacity and desire to undertake, and convinced of the regional potential.
On the other hand, while established entrepreneurs are a vital part of the fabric, entrepreneurs established decreased dramatically in the three years of study.
Finally, discontinuous entrepreneurs have increased percentage in the three years of study, this represents an important front for generating programs that allow business survival action, and continuity.

225 Proceedings of International Conference for Entrepreneurship, Innovation and Regional Development
ICEIRD 2014
References
[1] F, Pereira; F, Osorio; L, Medina; R, Vesga; R, Quiroga; L, Gómez; J.G., Restrepo; R,
Varela; y J.D., Soler. Reporte GEM Colombia 2011 -2012. Ediciones Sello Javeriano, Universidad de los Andes, Universidad del Norte, Universidad ICESI, ISBN: 978-958-8347-70-7. 2012, 76 p. Disponible en [http://www.gemconsortium.org/docs/download/3086]
[2] Departamento Administrativo Nacional de Estadística, - DANE. Boletín Estadístico,
Colombia, 2012 – 2013. Disponible en [http://www.dane.gov.co/index.php/industria-busqueda]
[3] F, Matiz; R, Zarate; L, Parra; L. Gómez; J, Restrepo; I, Negrette. Informe GEM
Bucaramanga 2011-2012, editado por Universidad del Norte. Editorial Graficas del Litoral Barranquilla. 2012. ISBN 978-958-741-141-6. Disponible en [http://www.academia.edu/2197192/Informe_GEM_Bucaramanga_2011_-_2012]
[4] Cámara de Comercio de Bucaramanga, Servicio para emprendedores, 2014.
Disponible en Ley 1429 de 2012. Revisado en [http://www.camaradirecta.com/index_oficina.php?Id_Master=11&Id_Seccions=13&OpciVerm=0]
[5] L, Gómez; P, Martínez; C, Figueroa; F, Pereira, R.F., Quiroga; R, Varela; L.M.,
Álvarez. Reporte GEM Colombia 2010, ISBN 978-958-741-142-3. 2011. © 2011, Universidad del Norte, Pontificia Universidad Javeriana Cali, Universidad de los Andes, Universidad Icesi (entidades participantes/patrocinadoras). Disponible en [https://www.dnp.gov.co/LinkClick.aspx?fileticket=eQ4Bq-h2Mxk%3D&tabid=809]


227
ENHANCING THE COMPETITIVENESS OF SMES THROUGH INNOVATION


229 Proceedings of International Conference for Entrepreneurship, Innovation and Regional Development
ICEIRD 2014
Intrapreneurial management profiles of Chief Executive Officers in SMEs
Bidyut Baruah1, Anthony Ward2
1University of York, Department of Electronics, Heslington, York, United Kingdom, [email protected]
2University of York, Department of Electronics, Heslington, York, United Kingdom, [email protected]
Small Medium Enterprises (SMEs) are considered to b e the power houses of European businesses. For these SMEs, an innovation culture t hat can be attained through intrapreneurial initiatives can add significant com petitive advantages to their organizational framework especially in the current economic environment which is getting progressively more competitive, demanding a nd challenging. Intrapreneurship as an organizational concept has e volved substantially over the years and although it is frequently compared with e ntrepreneurship, its position as a distinct concept applicable in any firm regardless of their size or age has been established in recent literature. However, one of t he key research gaps here is the role of a Chief Executive Officer (CEO) in the process o f guiding, facilitating and managing intrapreneurial initiatives in SMEs. There are no c lear researches that identify any distinctive profiles of a CEO in the process of int rapreneurship management. This paper specifically addresses this gap and explores different intrapreneurial management profiles of CEOs in SMEs and how the ado ption of these profiles can influence the innovation dynamics of the overall or ganization. Based on literature review and our earlier detailed study on CEOs from intrapreneurial firms, we identified three key management profiles. We observed that CEOs in some organizations act as the facilitator of intrapreneu rship providing different intrapreneurs the support, guidance, resources and an environment to innovate. In cases where entrepreneurs start their own organizat ion, they usually act as the CEO and in such circumstances they dominate as the lead innovator strategizing all the major innovation decisions themselves. In other cas es, CEOs tend to have a combination of these two distinct profiles, shuffli ng in and out of their roles as a facilitator and an innovator based on situational d emands. As evidence this paper presents case studies of three successful SMEs from the UK and highlights these varying profiles of their CEOs. Using the qualitati ve methodology of in-depth interviews, the research sheds light on this unexpl ored area and the results show the importance of an intrapreneurial culture and how pr ioritizing it in organizational strategies can help in building and escalating inno vation in SMEs. Understanding these distinctive management roles will benefit bot h CEOs and different organizations in practising intrapreneurial initiatives in an eff ective manner.
Keywords Intrapreneurship, Intrapreneurs, Innovation, CEO, Organizational management, SMEs
1. Introduction
Intrapreneurship in simple terms can be defined as the innovative initiatives undertaken by employees inside an organization to perform new business activities [1]. Intrapreneurs within

230 Proceedings of International Conference for Entrepreneurship, Innovation and Regional Development
ICEIRD 2014
these firms act as the smart innovators who work on the design and creation of new ideas, products, ventures and business models. Lankinen et al [2] observe that intrapreneurs have the potential to find new combinations of resources that helps in attaining a competitive advantage. According to Seshadri and Tripathy [3] intrapreneurship makes it possible to tap the entrepreneurial potential inherent among different employees and thereby unleashing their passion to generate new avenues for business growth or identify radical business alternatives. Mohanty [4] believes that the concept of intrapreneurship provides an approach that can be systematically adopted in an attempt to define specific strategies and action plans that can help in order to incorporate significant employee contributions. When the concept of intrapreneurship first arose, some authors did not realize or acknowledge its potential. For instance, Duncan et al [5] called intrapreneurs the 'latest figment of journalist's imagination'. They strongly believed that the conventional corporation will not be able to supply and cope with the needs and requirements of intrapreneurs. However, authors such as Silva et al [6], Jong and Wennekers [7] and Camelo-ordaz et al [8] have observed a strong relationship between intrapreneurship and technological innovations and therefore intrapreneurship today is considered to be a characteristic of successful organizations [9]. The term ‘intrapreneurship’ was first coined by Gifford and Elizabeth Pinchot in 1978 [10]. Miller [11] gave new insights to the field of intrapreneurial research by highlighting the concept of entrepreneurship at the enterprise level. However, initial research on intrapreneurship was mostly focused on large firms as seen in the prominent works of Schollhammer [12], Norburn et al [13], Pinchot [10] and Rule and Irwin [14]. New light was shed on the intrapreneurial dynamics of small and medium sized enterprises (SMEs) by Carrie [15] who highlighted the differences in terms of characteristics between SMEs and large firms. Antoncic and Hisrich [16-17] then gave significant evidence to demonstrate that intrapreneurship has substantial impact on organizational and economic development regardless of the size of an enterprise.
2. Prospects of intrapreneurship in SMEs
SMEs are considered to be the power houses or shining stars of European businesses. However, Narula [18] claims that although SMEs continue to have the advantages of flexibility and rapid response, the traditional disadvantages due to size limitations still exist. Now with the current economic environment which is getting progressively more competitive, demanding and challenging, organizations especially SMEs are struggling with the management of certain complexities. The traits of modern society such as extensive globalization, revolutionary changes in technologies and standard of living act as catalysts in enhancing such complexities. For SMEs, there are the challenges of keeping up with a balance of innovation dynamics and efficient resource management as per market competition and then there is the need for creating an interesting and creative working environment. Managing this innovation challenge can be complex and iterative but it can be subsequently dealt with via prioritized vision and support from top-management leaders. For Hambrick and Mason [19] organizations are a reflection of their top managers and therefore Chief Executive Officers (CEOs) can address these organizational complexities in SMEs with the right strategies and approaches. Rosenbusch et al [20] propose that developing and embracing an innovation orientation can help SMEs lead towards more ambitious goals, allocate resources in areas that can create more value and inspire a challenging firm culture. Intrapreneurship is one of the effective strategies for promoting efficient innovation orientation and thereby addressing the organizational complexities [21]. For SMEs, an innovation culture that can be attained through intrapreneurial initiatives can add significant competitive advantage to their organizational framework especially in the current economic environment where the demand for multiple technological competences and increased competition otherwise might make innovation quite challenging to keep up with.

231 Proceedings of International Conference for Entrepreneurship, Innovation and Regional Development
ICEIRD 2014
3. Purpose of this research study One of the key research gaps in the intrapreneurship literature is the role of a CEO in the process of managing intrapreneurial initiatives in SMEs. The intrapreneurial spirit of employees can be disoriented and damaged if there are any inconsistencies, sporadic enthusiasm or lack of commitment of the top management [3]. However, there are no substantial researches that clearly identify any distinctive profiles of a CEO in the process of intrapreneurship management. Therefore, it is difficult to access the influence CEOs have in the process of initiating and developing intrapreneurship and intrapreneurs. This paper specifically addresses this gap and explores different management profiles of CEOs in SMEs and how the adoption of these profiles can influence the innovation dynamics of the overall organization. Identifying these distinctive profiles will help organizations understand and address different strategies for successful innovation practice and can serve as guidelines for different CEOs in implementing their management roles and in promoting, facilitating and leading innovations. 4. Research methodology As part of our PhD research, we conducted an earlier study where we interviewed twelve CEOs from different industrial backgrounds in the UK. We utilized a qualitative investigation through semi-structured interviews with these CEOs and our results illustrated the significant role they play in the process of initiating, nurturing and managing various aspects of intrapreneurship. Our findings also indicated some distinct and consistent management approaches that CEOs tend to adopt while managing intrapreneurship and intrapreneurs and these profiles tend to vary from being an innovation facilitator to acting as the innovator themselves. This particular study is aiming to illustrate these intrapreneurial management profiles of CEOs from SMEs. Using our earlier study as a framework [22], we are now utilizing a case study methodology to illustrate different intrapreneurial management profiles of CEOs in SMEs. We are presenting three cases of successful intrapreneurship management which have been constructed from data derived from semi-structured interviews with the CEOs and different employees from these SMEs, website information, annual reports and site visits. 5. Intrapreneurial management profiles of CEOs As discussed earlier, intrapreneurship adds a competitive advantage for SMEs to manage organizational complexities. However, the learning aspects of an intrapreneurial environment are influenced by the structure of the organization according to Lankinen et al [2] and intrapreneurs learn by significantly engaging with it and seeking information. The roles played by CEOs in any organization are vast in terms of their involvement with creativity and innovation and their influence in shaping this intrapreneurial environment. They can utilize their management strategies to create the right opportunities within this organizational environment for developing intrapreneurs and their ideas. Parker [23] questions if organizations can strategically groom prospective and future intrapreneurs. Facilitating and grooming intrapreneurs in any organization can be a challenging task for CEOs and one of the challenges pointed out by Pinchot [10] is that there are no set formulas for determining in advance who can or cannot be an intrapreneur. Every business needs the right people in the right jobs and successful ideas within an organization occur due to the tireless persistence and practical imagination of the intrapreneur [24]. Based on the organizational framework and innovation requirement, the management profiles of CEOs tend to vary. There are cases when the CEOs have to lead the innovations playing a dominant role as a leading intrapreneur and in other cases they guide the innovation process acting more as facilitators
232 Proceedings of International Conference for Entrepreneurship, Innovation and Regional Development
ICEIRD 2014
for different intrapreneurs. In some cases, they tend to shuffle in and out of these roles. Carrie [15] supports this by indicating that in SMEs the owner-managers themselves can be the main inhibitors or best catalyst for intrapreneurship progression. Based on our investigation, we hereby propose three management profiles of CEOs associated with intrapreneurial activities in SMEs:
1. Profile 1- The Facilitator 2. Profile 2- The innovator 3. Profile 3- The facilitator and innovator- a combination profile
CEOs occupy the most powerful position in a corporation adopting different management profiles but as Calabria [25] says becoming and staying powerful is no easy task. Yadav et al [26] argue that innovation is more than just product development and that CEOs in different firms must first learn to detect technological opportunities and then proceed towards refining and extending these products for deployment. Charan [27] believes that CEOs must have the capability to link business needs with different intrapreneur’s natural talent. One of the benefits in SMEs according to Carrie [15] is that intrapreneurs have easier access to the top management and if the CEOs are acting as facilitators then this can be used as an efficient opportunity to identify their specific needs and aspirations and thereby motivating and guiding them. Mohanty [4] found intrapreneurship to be successful only when intrapreneurs are motivated to take action and value an innovation policy projecting the organization's culture and operating principles. Tappin and Cave [28] believe that CEOs are far-sighted leaders who have the ability to paint a sophisticated and compelling picture of the future for their employees, customers and shareholders.
5.1 The Facilitator
The first intrapreneurial management profile is that of a facilitator and CEOs with this profile are largely focused on creating an innovative environment to give intrapreneurs the right opportunities and platform to be creative. Although the CEO might participate with innovation their role predominantly is that of supervising innovators. Tappin and Cave [28] highlight that the best CEOs have the ability to simplify and prioritize different strategies thereby giving their teams and business an efficient clarity and this is something the facilitator specializes in. They have the capabilities to efficiently lead teams, build projects, divide tasks and facilitate the innovation. It must be noted that without the right people in the right jobs, a company cannot grow and thrive. For instance, Charan [27] highlights that if the person making crucial organizational decisions is not suited to the job, the quality of the decisions will be poor thereby leading the whole company to suffer. CEOs as influential facilitators will therefore use their time and efforts to place different intrapreneurs where their strengths can have the most impact within the innovation framework of the company.
As intrapreneurship facilitators, these CEOs will emphasize on building an organizational culture to allow and appreciate failures for encouraging intrapreneurs. They will make a conscious effort to reduce negative consequences of failure in intrapreneurial activities. CEOs with this management profile tend to be very approachable and encouraging. They have good communication skills which makes intrapreneurs trust them and confide in them with their ideas or projects. They have a certain degree of credibility which makes them efficient with networking and associating with other colleagues, employees or organizations. 5.1.1 Case profile of a Facilitator: Professor Nicola Spence, Chief Executive, Science City York Science City York is a leading provider of business and innovation services with a successful history of over 14 years specializing in developing SMEs and new infrastructure to support the region’s growth sectors, facilitating early stage businesses, helping them reach their

233 Proceedings of International Conference for Entrepreneurship, Innovation and Regional Development
ICEIRD 2014
goals and leading events to support business and innovation. ‘Creating value through innovation’ is their vision and true to this statement, Science City York led by Professor Nicola Spence as CEO has been transforming the innovation framework of several businesses. Prof Spence says "There is a massive opportunity for York to be a city that leads Europe in certain technologies and certain business clusters”. With an exceptionally talented intrapreneurial team, this organization has utilized an innovative mentoring scheme to help several successful SMEs like Shakespeare Hydraulics Ltd, Kiroco, Comfizz, Uniqua, Little Barn bakery, Gordon Rhodes or Chillipeeps to name a few. 5.1.2 Prof Spence as the Facilitator- management profiled CEO Prof Spence points out that as a small company everything they do is very visible and open and therefore she tries to lead by example through her commitments and priorities. She says “innovation has always been a part of our priorities in terms of how we are doing things differently”. She feels that employees won’t be encouraged to be innovative unless they see it as a priority and therefore as CEO she believes in encouraging innovation and rewarding and promoting its credentials and impact. She emphasizes this by saying “You have to be focused on higher vision of what you are doing and then organize yourself so that you got people who are focused on delivering those things”. She found creative intrapreneurs to be chaotic with their innovation approach and delivery and getting them to change these approaches will only result in the loss of their creativity and originality. So as mentor she accepts their chaotic approach by managing their creative skills within a team. She adds “You got to give the innovators the tools, technologies, gizmos or apparatus and whatever it is they need and you have to trust them…. …and they got to deliver and once you are confident that they will deliver, you have to keep on giving them the state of the art equipments…then they will deliver tremendous value”. She highlights that her job as a leader here is also to challenge these innovators to deliver and a lot of it involves “brokering the expectations of an innovator with the needs of a business”. She says “We are very problem driven and opportunity driven”. She brings together small group of people with different skills to try and tackle a problem or innovation and instead of allocating specific roles, she encourages people to identify themselves as being interested in that team/project or any specific roles. This approach she confirms has worked quite well so far which is why they are quite committed to it. Science City York is working across different sectors such as energy, health, environment, gaming and education but as a small company Prof Spence points out that they may not have all the skills and insights to solve different problems. Therefore with her unique mentoring approach she brings in a lot of external talents and specialist expertise to enhance their innovation process and thereby be transformative. As a facilitator, she adopts this open innovation scheme where she believes that innovative ideas can come from anywhere citing examples where crucial innovations in Science City York have actually sprung from ideas developed by their administration team. She is currently mentoring an open innovation forum in their website where they post different challenges and anybody can participate to put forward their innovative solutions. Prof Spence also helps in setting up different innovation training workshops to up-skill City of York Council, SMEs, universities and Third Sector organisations. Apart from running different yearly events to promote innovation and networking such as APPtitude, Venturefest Yorkshire and Innovation Showcase, Prof Spence is also managing several projects to encourage innovative companies: SMEs or micro-businesses to gain investments for development and growth. ‘Innovate York’ is one such example which collaborates with the City of York Council to create a catalyst of innovative changes in the city and thereby strengthens and enriches the whole York community. Three of her intrapreneurial team members are now participating in this particular project as key catalysts to deliver innovative services and instead of working with just the council employees, Prof Spence also tries to involve the whole community to break down barriers that traditionally hold back progress.

234 Proceedings of International Conference for Entrepreneurship, Innovation and Regional Development
ICEIRD 2014
5.1.3 Adopting this management profile Within an organization, Prof Spence believe that a CEO has to be someone that people would want to follow and go on a journey with and therefore her priorities are dedicated towards creating, supporting and driving a culture which will make people contribute to the common goals and mission of the organization. She believes that a CEO has to be authentic in terms of who they really are otherwise people won’t believe and follow their credibility. She has wide experience in academia for over 20 years with an MSc and a PhD. This academic career she reveals had given her tremendous creative opportunities to design experiments or projects. Before Science City York, Prof Spence worked primarily as the chief scientist at the Food and Environment Research Agency (FERA) in Sand Hutton. Here as a leading researcher, she got several opportunities to manage scientific projects, programs and other scientists putting together multi disciplinary teams for delivering scientific solutions. Nicola credits her academic background with giving her some basic skills and experiences to understand many issues relevant to business. She feels that these experiences have given her good intuition to identify people who have the credibility to generate ideas and turn them into practical solutions and what technique or approach motivates these intrapreneurs. She adds “You take with you all sort of skills and experiences while along the way…..now I can stand back and understand things from a technical, political and economic perspective and I wouldn’t be able to do that if I hadn’t actually had that experience”. 5.2 The innovator The second intrapreneurial management profile is that of a CEO who acts as a key innovator within the organization. The definition of an entrepreneur is someone who “is an undertaker who notices and seizes opportunities; converts those opportunities into commercial ideas; adds value via processes, effort, capital, or capabilities; and confronts the risks of the competitive market to apply those ideas” [29]. There are several organizations where an entrepreneur starts their own company and then takes the overall charge as the CEO with thorough knowledge of their business metrics. As Pinchot [10] says, people seem to become intrapreneurs when circumstances drive them to an act of will and decide to make a new business concept into a reality within their company. So, CEOs with this management profile act predominantly as the intrapreneur innovating for their company. Charan [27] strongly believes that because a CEO has the insights of how the organization really works and how to link people’s actions and decisions to the right priorities and strategies, their active participation with innovation will add significant advantage to progress the level of intrapreneurship. So, the innovator here is highly active in leading the innovations, spotting break through opportunities and usually share many characteristics as that of an intrapreneur. 5.2.1 Case profile of an innovator: Christopher Ian Wilson, Chief Executive, Bransby Wilson Parking solutions Bransby Wilson Parking solutions has for over 23 years specialized in car park management. Mr Christopher Ian Wilson is leading the innovation framework of this business as the Chief Executive. What is unique about their approach is that they deliver a personal service to every customer and as Mr Wilson says, “We take a creative and entirely bespoke approach to every customer requirement - because every car park is different”. Their approach involves helping customers plan, build, run and improve their car parks by considering layout, pricing structure or parking behaviour patterns. Bransby Wilson Parking solutions also provide technological solutions such as the installation of high quality Pay & Display machines, ANPR (Automatic Number Plate Recognition) technology, Pay on foot machines, Keyboard entry registration systems, pay by phone systems or Vehicle Registration Systems

235 Proceedings of International Conference for Entrepreneurship, Innovation and Regional Development
ICEIRD 2014
(VRS). They also provide control and enforcement services via their associate company- Minster Baywatch. With their practice having a national coverage in the UK, Bransby Wilson Parking solutions is one of the leading businesses in its niche market with a range of loyal customers that involves organizations such as the NHS, the Rank group, W Boyes and Co Ltd to name a few. 5.2.2 Mr Wilson as the innovator- management profiled CEO
Mr Wilson has been leading the innovation for the company all these years bringing together people who need car park spaces with people who have spare places. The great thing about their business as Mr Wilson admits is that it is a new concept and after 23 years, there are still no set criteria to run it. He observes that they follow a flexible approach and says “whatever the client wants, whatever the market wants, we could supply…..so, it is about changing our product around”. For over 9 years he remarkably worked alone as the sole employee in his company doing everything in terms of marketing, sales, finance and innovation. As a small company he says growing, restructuring and prioritizing innovation can be a big challenge especially as they have no R&D team. He says “Innovation has to be worked…..why we succeeded I believe is actually getting the right idea and it worked…It was the right research and straight away you got a great product, a great service that is different and people take notice of”. He believes that innovation spread around individuals and the business as a whole. As a CEO what really excites Mr Wilson is new ways of doing things and having proactive consideration of what the market might require in 2 or 3 years time. Now as the leading innovator in the SME he reveals that he has to wear different hats several times a day signifying the management of different organizational roles. Mr Wilson uses his expertise and experience to individually review car parking operations and policies for his clients and in implementing appropriate car park management, space optimisation and revenue generation systems. His role as the CEO also involves auditing, designing and installing new signs, marketing and management of monthly permit systems. He also leads the process of designing and installing of Vehicle Registration Systems, Pay & Display machines and providing patrolled enforcement and control services.
5.2.3 Adopting this management profile
This company was established in 1991 by Mr Wilson when he saw an opportunity after finishing his university studies in Physical education and sport studies from York St John University. He says starting a company was never a plan but this business concept occurred when he observed car parking spaces being left vacant in different locations in York whereas there were other people desperately looking for parking spaces. He was quick to identify this niche market 23 years ago and embark on a sole trading business. Mr Wilson reveals that because the concept was so new and unique in the early 90s, he had a hard time convincing people about it. He adds, “The concept was very different, not something easy for people to get their head around…If you say you are an accountant or a builder, people will know what you are but if you say you let parking spaces or you are a space manager, it was very difficult to explain to people”. The initial phase he says wasn’t easy as a novice entrepreneur as he faced a lot of challenges mostly due to his lack of business knowledge and expertise. He believes that as the business progresses, the CEO will eventually have the strength, knowledge and experiences which will count a lot in progressing the innovation track of the company. However, he feels that expecting the staff to have the same motivation and interest in the business as him is very rare as he feels that his connection with the company is very deep, having established and worked on its every aspect and dynamics for over 23 years now.

236 Proceedings of International Conference for Entrepreneurship, Innovation and Regional Development
ICEIRD 2014
5.3 The Facilitator and innovator- a combination profile The final management profile is a combination of a facilitator and innovator. CEOs with these profiles find a good balance with characteristics associated with facilitation of innovation and leading innovation. They have the capabilities and talent to adapt in this dynamically changing environment responding efficiently to the market and customer demands along with the needs of the business, adopting the appropriate role. 5.3.1 Case of a combined management profile-Facilitator and innovator: Methven Forbes, Chief Executive, Robin Lane Medical Centre Methven Forbes, the Chief Executive from Robin Lane Medical Centre has been associated with this health firm for over 10 years. This organization has transformed from a small practice to an innovative health firm delivering services fit for modern 21st century lifestyles and Mr Forbes has played a pivotal role in shaping and facilitating this entire developmental process. As a medical centre, their vision isn’t restricted to a traditional health and wellbeing approach but it also incorporates delivering proactive education programmes led by clinicians to prevent and delay the development of health conditions. Over the years he has managed to bring in several innovative services that breaks the traditional norms of an appointment based health service and this includes a smart phone app, an Urgent Care walk-In service, the Pudsey Wellbeing Centre, a community newspaper and a café house called ‘CafeLux’. Mr Forbes tries to bind this health centre with different community projects and charitable trust events in order to promote a platform for wider innovation. With over 55 employees and more than 40 volunteers, this health centre situated in Pudsey, a small town of Leeds has made a remarkable name in the field of health innovation which is why it has recently been awarded the GP enterprise award 2013 for outstanding practice and for improving quality and production in health innovation. 5.3.2 Mr Forbes as the combined management profiled CEO Being an innovative leader and facilitator can be a challenge and Mr Forbes feels that a CEO shouldn’t be the only one doing all the creative thinking themselves but they must also ensure that there is enough capacity within an organization to innovate and implement different ideas. People within an organization can come up with different ideas but the role of an innovative CEO according to Mr Forbes is to facilitate genuine and practical ideas that will make a difference in the firm. He adds, “I won’t encourage everyone to be innovative … I would encourage everyone to be participative and that’s the critical thing”. He suggests that an organization should not be utterly wired only with creativity and innovation as nothing will get done and there is a risk that the organization and talent within will get fatigued and therefore collapse. Mr Forbes says, “It is really important that people are encouraged to innovate and come up with new ways of doing things and it is equally important to give them the opportunity to implement them without any fear of punishment if it doesn’t work…..Failure is a good thing if it is within the right framework…that’s how people learn”. As a facilitator, Mr Forbes applies a unique strategy of creating an eco-system that offers enough guidance, framework and security to develop ideas. Emphasizing this he adds, “You can’t prescribe innovation but you can prescribe an eco-system that allows innovation”. Within this eco-system he found that one can harness the natural strengths of everyone. He points out how by bringing stakeholders, health members, volunteers and community members together in the same innovation platform, binding and creating a strong network of talent has empowered their organization to explore new ideas and deliver extensive innovation services thereby enhancing overall performance and growth. According to him, CEOs who are doing the innovation have very strong personalities and as they are shakers and movers, they tend not to play by the rules. In Robin Lane medical Centre, Mr Forbes as an innovator has
237 Proceedings of International Conference for Entrepreneurship, Innovation and Regional Development
ICEIRD 2014
helped the organization evolve and grow. For instance, he has utilized his visionary leadership skills and global perspectives to create a smart phone app that allows patients to book appointments, order prescriptions, send secure text messages to clinicians and set appointment reminders. He also initiated the development of a café house and local community newspaper which he believes is the heart and soul of the well being centre. 5.3.3 Adopting this management profile Mr Forbes highlights that building a management profile is a gradual process of learning from different experiences and creating a mental portfolio with information of what works and what doesn’t. He firmly believes that CEOs who have experiences with different positions and roles are much more accommodating and challenging in terms of transformation and thinking differently. Reflecting on his background, Mr Forbes emphasizes how his upbringing in an impoverished city of Dundee, amidst a family of labourers, tradesmen, carpenters and bakers had a major influence on his work ethics now. Mr Forbes admits that he has never been quite bright at school with no consistent record of good grades. However, when he was 17 he got an opportunity to work for a fading memorabilia shop that was on the verge of collapse with the owner having run out of options for creativity and new innovative ideas. Mr Forbes used this opportunity to bring in several new innovative changes in terms of stock control, merchandising and design and it transformed the entire business around in just over a year impressively paving way for further business expansion. Mr Forbes then moved to Cornwall where he worked for a bus company mostly in the administration aspects adding creative elements to the operational designs and here he was supervised and trained by a national award winning Director which again had a massive impact on his personality. He then worked for the NHS as a practice manager in a small rural health centre in Cornwall and this is where he credits to have got managerial opportunities to build up his executive profile characteristics. Working with different teams, national leaders, politicians or stakeholder organizations Mr Forbes gradually developed those practical skills required in an Executive role such as pitching for finances, planning and designing projects or managing staff. 6. Conclusion
Intrapreneurship in today’s economic environment can be used as an effective organizational strategy to enhance the innovation progression in any organization regardless of their size. It is an established field of organizational management research with an impressive history of around 25 years. Although it is frequently compared with entrepreneurship, its position as a distinct organizational concept is clearly documented in literature. This paper explores one of the key research gaps, the intrapreneurial management profiles of CEOs from SMEs and their impact in the organizational innovation dynamics. The management profile of a CEO tends to be either that of a lead innovator or the facilitator of intrapreneurship and in some cases, a combination of both. This paper presents case studies of three successful SMEs from the UK and highlights their varying CEO profiles. The benefits that firms can derive from intrapreneurship are tremendous and especially in a competitive and challenging economic environment, the adoption and practice of intrapreneurial initiatives should be highly encouraged by CEOs today to attain a competitive advantage.
Disclaimer
All participants in this research signed a document confirming that they understood the objectives of the research and that information gained from the interviews could be used for any publications.

238 Proceedings of International Conference for Entrepreneurship, Innovation and Regional Development
ICEIRD 2014
References
1 Bosma, N., Stam, E., and Wennekers, S. Intrapreneurship- an international study, Scientific Analysis of Entrepreneurship and SMEs, Zoetermeer. 2010; 12, 1-29. 2 Lankinen, L., Taimela, E., Toskovic, T., and Wallin, G. Intrapreneurship-act different. [Online]. 2012; Available at: http://users.tkk.fi/toskovt1/intrapreneurship/intrapreneurship_finland.pdf [Accessed on 04/11/2013] 3 Seshadri, D.V.R and Tripathy, A. Innovations through Intrapreneurship: The Road Less travelled. VIKALPA. 2006; 31(01), 17-29. 4 Mohanty, R.P. (2006). Intrapreneurial Levers in Cultivating Value-innovative Mental Space in Indian Corporations. VIKALPA, 31(01), 99-105. 5 Duncan, W.J., Ginter, P.M., Rucks, A.C. and Jacobs, T.D. Intrapreneurship and the reinvention of the corporation. Business Horizons,1988; 16-21. 6 Silva. F.G.D., Hartman, A., and Reis, D.R.D. The relationship between the intrapreneurial culture and the degree of technological innovation in the productive organizations: a test for the tools, Third International Conference on Production Research –Americas’ Region. ICPR-AM06, 30 July-2 August 2006; Curitiba/PR - Brazil 7 Jong, J.D. and Wennekers, S. Intrapreneurship; conceptualizing entrepreneurial employee behavior. Scientific Analysis of Entrepreneurship and SMEs (SCALES), Zoetermeer: EIM. 2008; 1-47. 8 Camelo-Ordaz, C., Fernández-Alles, M., F., Ruiz-Navarro. J., and Sousa-Ginel, E. The intrapreneur and innovation in creative firms. International Small Business Journal. 2011; 1-23. 9 Antoncic, B. Intrapreneurship: a comparative structural; equation modelling study. Industrial Management & Data Systems. 2007; 107(3), 309-325. 10 Pinchot III, G. Intrapreneuring: You Don’t Have to Leave the Corporation to Become an Entrepreneur, 1st ed. New York: Harper and Row; 1985. 11 Miller, D. The correlates of entrepreneurship in three types of firms. Management Science. 1983; (29), 770-791. 12 Schollhammer, H. Internal Corporate Entrepreneurship. In C. Kent, D. Sexton and K. Vesper (eds.), Encyclopaedia of Entrepreneurship, Prentice Hall, Englewood Clipp, NJ. 1982. 13 Norburn. D., Manning. K. and Birley. S. Beyond intrapreneurship: The metamorphosis of large corporations. (Working paper). Cranfield School of Management. Bedford; 1985. 14 Rule, E.G and Irwin, D.W. Fostering Intrapreneurship: the new competitive edge. The journal of business strategy. 1988; 9(3), 44-7. 15 Carrie, C. Intrapreneurship in Large Firms and SMEs: A Comparative Study. International Small Business Journal. 1994; 12(3), 54-61. 16 Antoncic, B., and Hisrich, R.D. Intrapreneurship: construct refinement and cross-cultural validation. Journal of Business Venturing. 2001; 16 (5), 495-527. 17 Antoncic, B., and Hisrich, R.D. Clarifying the intrapreneurship concept. Journal of Small Business and Enterprise Development. 2003;10(1), 7-24. 18 Narula, R. R&D collaboration by SMEs: new opportunities and limitations in the face of globalisation. ELSEVIER Technovation. 2004;153-161. 19 Hambrick, D.C., and Mason, P.A. Upper echelons: the organization as a reflection of its top managers. Academy of Management Review. 1984; 9(2), 193-206. 20 Rosenbusch, N., Brinckmann, J. and Bausch, A. Is innovation always beneficial? A meta-analysis of the relationship between innovation and performance in SMEs. Journal of Business Venturing. 2011; 26, 441-457. 21 Baruah, B. and Ward, A. Metamorphosis of intrapreneurship as an effective organizational strategy. International Entrepreneurship and Management Journal. 2014; (DOI: 10.1007/s11365-014-0318-3) 22 Baruah, B. and Ward, A. Can CEOs be influential facilitators? Voice of Research. 2013; 2 (3), 47-54. 23 Parker, S. Intrapreneurship or entrepreneurship?. Journal of Business Venturing. 2011; 26 (1). 19-34. 24 Pinchot, G. and Pellman, R. Intrapreneuring in Action. 1st ed. San Francisco: Berrett-Koehler Publishers, Inc.; 1999. 25 Calabria, D.C. CEOs and the Paradox of Power, Business horizons.1982; January-February 29-31. 26 Yadav, M.S., Prabhu, J.C. and Chandy, R.K. Managing the future: CEO attention and innovation outcomes. Journal of Marketing. 2007; 71, 84-101. 27 Charan, R. What the CEO wants you to know. 1st ed. New York: Crown Business; 2001. 28 Tappin, S. and Cave, A. The new secrets of CEO.1st ed. London: Nicholas Brealey Publishing; 2010. 29 Kuratko, D.F. Introduction to Entrepreneurship, 8th ed, South-Western Cengage Learning, Canada; 2009

239 Proceedings of International Conference for Entrepreneurship, Innovation and Regional Development
ICEIRD 2014
Business Membership Organizations as a policy approach to increase SMEs’ EU funds absorption
Tobias Stolz1, Tine Schrammel2 1GIZ, Rua António Simbinenº 211, Sommerschield-Maputo, Mosambik, [email protected]
2FH Stralsund, Zur Schwedenschanze 15, Stralsund, Germany, [email protected]
The transition economies in Southeast Europe rely h eavily on small and medium enterprises (SMEs) as larger companies are rare. Th e international competitive position of these SMEs is, however, still limited, which negatively affects the overall economic position of these countries. The EU suppor ts SMEs’ competitiveness in the candidate countries through numerous funding scheme s. However, the absorption rate of these EU funds is unsatisfying and research on the reasons of this fact is limited. The paper analyzes how the access to these EU funds for SMEs can be facilitated and which factors influence the absorpt ion capacity. It demonstrates with a qualitative approach that intermediary institutions in the candidate countries, which support the access to these EU funds for SMEs, are missing or are insufficiently designed. Due to limited resources, SMEs are more d ependent on specialized intermediaries that provide information and human c apital than larger companies. The paper shows that the focused capacity building of a business membership organization, which steps in as a surrogate interme diary, was an efficient policy approach to increase SMEs’ absorption capacity of E U funds. The findings add to two scarcely endowed literature streams, that on busine ss membership organizations and that on SMEs’ absorption capacity of EU and donor f unds. The paper implies structural deficiencies as reasons for the unsatisf ying absorption rate of EU funds. It provides first insights of the role of business mem bership organizations, such as clusters, as an opportunity for closer cooperation between South East European SMEs in this context.
Keywords Business Membership Organizations, EU funds absorption, Small and Medium Enterprises, Transition Economies
1. Introduction and Research Objectives
In times of economic crises especially small and medium sized enterprises (SMEs) are in the need for rapid innovative progress in order to stay competitive on the global market. The economy of the current candidate countries in Southeast Europe relies heavily on the SMEs as larger companies are rare. The European Union (EU) supports SMEs’ competitiveness in the candidate countries through numerous funding schemes to support the competitive position of the countries on their way to EU membership. However, especially the SMEs from EU candidate countries show limited absorption capacity. Many of the EU funds remain unused while on the other hand the SMEs in these countries struggle to survive in the intensifying global competition. On top of that, EU applicant countries like Serbia pay annual contributions to EU fund access like FP7. If less successful fund applications are filed than

240 Proceedings of International Conference for Entrepreneurship, Innovation and Regional Development
ICEIRD 2014
the country pays access contributions, then it is actually a negative game for the countries and the access contributions are sunk costs. The recent examples from Bulgaria and Romania demonstrate that the superior competitive position of the local economy is a baseline requirement for a smooth and efficient EU integration for the candidate countries. The question is thus, on how the access to these EU funds for SMEs can be facilitated. This paper demonstrates a successful approach with a case study from the Serbian ICT sector. The ICT sector is one of the most dynamic and promising sectors in the Serbian economy. This is reflected in the comparatively high number of applicants for EU-funds. Yet one of the major challenges for SMEs in the sector is the lack of institutionalized support structures.
Serbia has the status of an EU accession candidate. Several EU programs are open to applicants from Serbia. However, the number of Serbian applications to these EU programs and their success varies from program to program. In particular, SMEs are struggling to access the available programs. Serbian SMEs are often not aware of the availability of these support programs. Furthermore, the administrative burdens and challenges in the application process are rather high, in particular for SMEs, while support structures are lacking.
2. Theoretical Background
2.1 EU Funds and their Absorption
The transition economies in Southeast Europe are European Union (EU) candidate countries or potential candidates. As such they are entitled to receive funds from the EU in their pre-accession phase. These funds are to support the countries on their way to become full EU member. Among others, these funds aim at strengthening the competitiveness of these countries in international trade.
Difficulties in the absorption of development funds in general and EU funds in particular are widely known and discussed, however, a clear framework to evaluate the absorption capacity and detailed numbers are missing [1], [2], [3]. Some publications are mainly concerned with the quantitative aspect of pure utilization of allocated funds, while other researchers regard the effectiveness of the used funds in relation to the allocated funds, when discussing absorptive capacity. Some see absorption difficulties as soon as the allocated funds deviate from the amount of funds used, others use target plans as a reference point [1], [2], [4], [5]. Some research demonstrated that Serbia’s absorption rate in the 2000-2006 funding period was even below Southeast European average with 85.73% [4], while other calculate that by 2010 Serbia had one of the highest absorption rates per capita [6].
We will not delve further into this discussion but stay with the general consensus that absorption rates in the candidate countries are not at a satisfactory level. Examples have shown that many candidate countries or new EU members have substantial difficulties in absorbing EU funds [7]. Their increase would be beneficial for the overall economic development.
Small and Medium enterprises (SMEs) are the cornerstone of most transition economies. They make up to 99.8% of the businesses in Serbia and generate 66% of the jobs [8]. However, especially the SMEs in transition economies face difficulties with trade liberalization that comes along with the EU integration process. Most SMEs lack behind their European counterparts in terms of innovation, productivity and hence are in a competitive disadvantage [8]. Many EU funds are targeted at this problem, however, the SMEs have

241 Proceedings of International Conference for Entrepreneurship, Innovation and Regional Development
ICEIRD 2014
substantial difficulties to absorb EU funds, with some researchers stating absorption rates of SMEs of below 10% [3].
2.2 Intermediaries
Transition economies, such as Serbia, face rapid institutional change from a centrally planned economy on the way to a market economy. Therefore, weak institutional setups are repeatedly reported for transition economies in the literature and empiric studies [9], [10], [11]. Most literatures describe changes such as “massive privatization of state owned firms” [12: 271] and removal of market entry barriers on the way to capitalize the economy, but on the other hand re-nationalist tendencies are often observed as well. These changes in the overall institutional setup in turn lead to lacking or insufficient intermediaries.
Reasons for this mis-development are various, such as other laws restricting the evolvement of intermediaries and/or a general lack of knowledge why intermediaries are necessary and how they work. Part of this development is rooted in the monitoring gap that evolves during such drastic changes in the formal institutional setup. While privatizing state companies, the state withdrawals from its monitoring functions on specific business and therefore reduces its monitoring function on the overall economy. However, in most cases, the economy did not have sufficient resources to fill in these gaps immediately. Even if new and adequate intermediaries evolve to fill these gaps, it needs time to build them up, and might it ‘only’ be because they are interlinked with other or former institutions [12], [13], [14], [15], [16]. Thus, while the change of the institutional setup is in progress the institutional environment is unstable per se and specialized intermediaries are absent or insufficiently designed [17], [18], [19].
Ricart et al. (2004) elaborate that in such environments ‘institutional voids’ are present. These voids “occur when specialized intermediaries are absent” [20]. Intermediaries are framed as trade facilitators that become necessary with the increasing complexity of a transaction. The authors name three concrete examples of specialized intermediates: (1) a contract guarantor, (2) someone or something providing specialized information and (3) an intermediary facilitating the search for trading partners [20], [21]. Khanna and Palepu (2003) mention two more function of intermediaries that of (4) capital provision and of (5) talent search [22].Thus, intermediates are specific kinds of institutions that act as rationality surrogates in transactions in which, due to the behavioral assumptions acquainted to the economic actor such as bounded rationality and disposedness to opportunism, transaction costs are high or even prohibitive. In such cases, specialized intermediaries – act as trade facilitator through reducing transaction costs. In environments of institutional voids these specialized intermediates are absent and hence bounded rationality and opportunism lead to high or prohibitive transaction costs.
The SMEs perspective of the need of specialized intermediaries is straightforward: a firm achieves a competitive advantage either by increasing the willingness to pay of the prospective consumer or by decreasing the cost of production. To increase to willingness to pay a firm might need specialized market information. As market information on i.e. special consumer preferences is a complex field, gaining this information will come at costs. Especially for SMEs these are high or even prohibitive costs, as due to their size, SMEs face limited resources in terms of financial and human capital [23]. Thus, the firm can engage another company that is specialized in supplying consumer information. This firm is than an intermediate [21].
It is obvious that the absence of such intermediaries leads to different decisions than in a situation with existing intermediaries. As described above, acquiring specialized market

242 Proceedings of International Conference for Entrepreneurship, Innovation and Regional Development
ICEIRD 2014
information will come at high costs for the company. Thus, the absence of intermediaries increases transaction costs, therefore influencing the choices and decisions of the economic actors.
Our proposition one is that the above described limited absorption capacity of SMEs in transition economies is related to missing intermediaries. Surprisingly this has not been given attention in the academic literature. It is commonly observed that companies rely on external intermediaries to support their EU funds application process. These intermediaries generally offer services on consultancy, information provision, and partner search, all the way to writing the project application and managing the bureaucratic aspects of the projects. These intermediaries are - in European countries - either private companies or private-public institutions such as associations or research support institutions at universities. If these intermediaries are now absent or insufficiently designed, it becomes more costly in terms of transaction costs for SMEs to apply to an EU fund. The SME has to internalize the services usually provided on the market and might hence conclude that such an internalization of services is more costly than the expected gains form the potential EU project. Hence, the SME might refrain from applying for EU funds at all.
Furthermore, in order to be competitive on a global market, companies situated in an environment with less specialized intermediaries available must find effective methods to compensate for the cost induced by missing intermediaries. To do so, there are – simplified – two ways. Either these companies find innovative practices that fill in the institutional voids to minimize organizational costs or they access specialized intermediaries from environments that already developed these [21].
Our proposition two is hence that a Business Membership Organization (BMO) is such an innovative practice. Some research defines BMOs as generally any organization where businesses are members [24], however, we focus on a more narrow perspective. For us BMOs are generally established bottom-up and focus on providing specialized services that their members actually demand [25].
We aim to demonstrate in chapter 4 that SMEs in Serbia lack the support of specialized intermediaries to facilitate their access to EU funds and that the support to a BMO is a sufficient policy approach to increase SMEs’ EU funds absorption.
3. Case Study
A single case study from Serbia will demonstrate one such innovative practice. A Business membership organization (BMO) was successfully supported to establish itself as a specialized intermediary concerning EU funds absorption for SMEs. Before we detail on the case we will briefly explain our research method.
We followed a qualitative, exploratory approach with our research. The case was selected for revelatory rationales [26] as we had unique access to the BMO and background information on the development and actors, due to our previous working and research environment. During the research process we followed the literature’s advice on rigor criteria for case research [27], [28]. We can ensure construct validity by data triangulation with data from interviews, participant observer sessions, and secondary data. Furthermore, reliability can be insured as a case study protocol and a database was maintained to ensure transparency and replication. We can also ensure contextual understanding of the data as both researchers lived and worked in Southeast Europe for several years.
243 Proceedings of International Conference for Entrepreneurship, Innovation and Regional Development
ICEIRD 2014
Data was collected between mid-2011 and mid-2012. Interviews were digitally recorded and transcribed. For the observations we prepared research notes. Interviews were conducted only by one researcher in order to avoid difficulties with different contextual understanding in case of multiple interviewers [28]. Interviews were conducted with top management representatives of ICT companies and the manager of the BMO. We followed the grounded theory approach when coding the interview data [29]. However, we follow mainly the understanding of Strauss with regard to theoretical sensibility [30].
The Business Membership Organization (BMO) was founded in 2010 by a regional network of ICT companies. The companies participating in the BMO are local SMEs, some are local branches of international companies. The BMO was supported with capacity building by an international donor in order to manifest its structures and capacities for 2 years. The capacity development included mainly the setting up a “project office” for EU Fund (and other) applications and capacity building of staff in the unit. The staff received capacity building concerning the scanning for right calls, writing proposal, and administrative handling of EU fund/projects. In the following we will demonstrate the efficiency of that support and the efficiency of the provided BMO services.
4. Results
This section focuses on the results of our case study. It differentiates between the results of the two propositions.
4.1. Missing Specialized Intermediaries
Following our first proposition “the absorption capacity of SMEs in transition economies is related to missing intermediaries” we found that two areas of intermediary services are especially critical for EU funds absorption in the perspective of the SMEs. We will detail on these two services separately in the following. Intermediaries for information provision A major factor in our observations was missing or insufficient providers of information. These concerned mainly general information on EU funds’ potentials and application processes, but also specific information crucial to successful fund application.
Serbia is relatively well endowed with intermediaries compared to other countries in the region [8]. According to research, Serbia is the country which the highest proportion of EU funds going to national intermediaries rather than to foreign consultancies [6]. However, only a few intermediaries actually offer information on EU calls and/or trainings for EU application writing. Moreover, constantly new intermediaries are established top-down and vanish as fast as they appear. Most of the intermediaries active in this field in 2012 had already disappeared by the end of 2013. The interviewed companies consider some of these intermediaries as insufficient:
“And chamber of commerce, personally I expect much more from them, they are not so active.” SR UN 3, para. 114.
The Gallup Organization states that 37,4% of the Serbians have confidence in business organizations [31]. However, international reports state that the attitude towards free expression and objective information provision has declined [32]. And also interviewees reported that information is often acquired through informal connections. The interviewed companies stated difficulty on access to information concerning EU funds and in general. One company explicitly stated:

244 Proceedings of International Conference for Entrepreneurship, Innovation and Regional Development
ICEIRD 2014
“The situation with data in Serbia in general is not so good. We do have statistical office etc. […] but, I don't know why, but sometime it's very hard to get certain types of data from them.” SR CM, para. 10. “So you have to gather information that actually the government should have. So in my opinion you waste too much time getting to the different institutions and trying to get some confirmation about some information.” SR NM, para. 54
Again, academic literature on the influence of information providers on the absorption capacity is limited. Current research focuses on similar issues in Romania that found that SMEs’ EU funds absorption is related to the transparency of information [3], [33]. Our observations showed that especially micro companies are discouraged to apply for EU funds. They fear the high administrative burden of preparing the fund proposal and regard their chances of receiving funds as limited. These feelings are based on very limited information about the funds in general and limited support infrastructure by intermediaries in specific.
Intermediaries for human capital provision The second factor that seemed to affect SMEs’ absorptions capacity was missing specialized know-how for the application process, which relates to missing intermediaries for human capital provision. The application process of EU funds is very specific and demands specialized knowledge. Recent research of Romania has shown that SMEs have difficulties in filling out the forms and formulating the application. Structural errors on SMEs’ applications are common [3]. This situation is influenced by several factors.
First, as many countries in Southeast Europe, Serbia suffers a severe brain drain as graduates receive higher wages and have good opportunities in EU countries [32], [34]. Second, the general education is at an unsatisfactory level [31]. Companies report that the foundation of knowledge received at the universities is not adequate for market demand and that substantial training is needed before the employee can be considered productive.
“The needs that we have are much more than universities deliver. On one hand the number of the graduates that come from the faculties nowadays are not enough, on the other hand the quality of those that do come is not on a satisfactory level.” SR CM, para. 151. “They have good general knowledge in IT, but they are not specialized enough in some technologies, they didn't have a chance to participate in many different projects, to get familiar with various technologies, so usually, when we hire someone it takes three to six months to make them productive.” SR UN 3, para. 74. “So in my opinion it means one to two years to produce a good worker.” SR NM, para. 66.
More pressing than the actual technical skills gap seems to be the lack of soft skills. In 2008 companies stated that around 64% of the IT professionals are lacking soft skills and 12% lack basic skills such as appearance in contrast to 24% that lack technical skills. “Among the soft skills, the most common shortcomings were in communication, problem solving, time management and negotiations.” [35: 35]. These soft skills are one critical factor in the EU funds application process.
Furthermore, a limited provision of EU funds application writing trainings is observed. Research among Romanian SMEs demonstrated that SMEs have limited knowledge of the writing style and structure in EU funds application which leads to a higher declining rate [3]. Our observation furthermore revealed that human resources with the critical knowledge of EU funds is very limited in Serbia. Hence, local trainers are hard to reach and expansive. Foreign trainers are also too costly for SMEs.
Again literature on knowledge intermediaries to support SMEs EU funds application is scarce. Most literature focuses on knowledge transfer within EU projects but not with the know-how directly related to the application process.

245 Proceedings of International Conference for Entrepreneurship, Innovation and Regional Development
ICEIRD 2014
4.2 Business Membership Organization as an Instrument
To counter the observed difficulties, an international donor agency, in cooperation with the Serbian government, supported the capacity building of a BMO to sharpen their profile as an intermediary for EU funds applications. The BMO was set up in 2010 as a Serbian business association. 28 ICT companies and five research institutions from the region are organized in the BMO. It employs 1,5 full-time equivalents in form of a director and a head of the project office and two volunteers. The objective of the donor was to enhance the absorption of EU-funded innovation programs by building up capacities within the BMO to support SMEs in the application process. In order to support SMEs an internal service and competence unit, the “Project Office” (PO), was established. Its services and know-how are available to BMO members and external clients (non-members) for a higher fee.
In order to ensure the sustainability of the Project Office, the costs of the unit were to be covered mainly by fees from its services. As experts for EU funds are in high demand in Serbia and therefore expensive, the donor supported the BMO to develop local staff to become an expert on, and trainer for, EU programs. The BMO furthermore established a service catalogue with services relevant for EU program applications and their fees, as depicted in Table 1.
Table 1: List of services provided by BMO
1. Screening 1.1. Screening of national calls for proposals and tenders 1.2. Screening of bilateral funds and opportunities 1.3. Screening of EU calls for proposals and tenders 1.4. Screening of successful projects for business opportunities 2. Database 2.1. Access to the database of successful projects 2.2. Information gathering and distribution on current calls 2.3. Provision of business intelligence on technologies and
developments relevant for different project calls 3. Coordination & Consortia 3.1. Coordination among VOICT members participating in calls 3.2. Coordination with applying parties outside the cluster 4. Project Development 4.1. Project development 4.2. Project proposal writing 4.3. Project implementation support and monitoring 4.4. Project management during project development 5. Project Management
5.1. Project management during project implementation 6. ICT Service Provider 6.1. Service provider of ICT products and services to successful projects
to expand domestic market for members 7. Lobbying and Awareness 7.1. Lobbying with national authorities and bodies to introduce necessary
changes and modifications in call procedures 8. Trainings 8.1. Introductory Training 8.2. Proposal Writing Training
The services are well received by the companies. One company directly stated:
“The project office helps our companies to apply for European funds (..). This is a really good opportunity” SR UN 3, para. 46.

246 Proceedings of International Conference for Entrepreneurship, Innovation and Regional Development
ICEIRD 2014
The project started with an inception phase where the staff was trained for EU programs and their management procedures. In this phase, the BMO mainly applied for projects in its own name. Hence, at the time of the interviews no EU projects for companies had been realized but the BMO managed to acquire external funds of 155.911,19 EUR.
The interviewed companies highlighted mainly the lobbying services that the BMO provides: “There is one, a maybe not formally defined, service: providing information, different consultations. I can ask the cluster manager to provide me some information from our government or governmental institutions. He is the link between other IT companies of other clusters in Serbia. So if we need to establish contact with someone to get some information it's a good channel to use the cluster manager.” SR UN 3, para. 46. “And also with some government agencies so we do have influence in some parts of the law”. SR UN 1, para. 41.
Additionally, the cluster provides trainings through the established cluster academy. Some of the trainings directly target certification processes that would otherwise be too costly for the single companies. [35], (SR UN 2;3).
The list in table 1 demonstrates that the BMO focuses on the issues identified to hampering the absorption capacity. Service categories 1 and 2 focus on information provision and services 3 – 8 focus on the capacity development of human capital. Both service groups are valued by the member companies, as the BMO could in the first two years of its existence generate 33.912,50 € of revenue from membership fees and services.
5. Conclusions
Even though SMEs are the main economic actor in transition economies and all EU (potential) candidate countries have difficulty to absorb their EU funds, research on the factors influencing the absorptive capacity of SMEs in these countries is very limited. With our qualitative approach we could demonstrate that the limited absorptive capacity of SMEs in the candidate countries is related to missing intermediaries. We can show that there are two main influencing factors: (1) missing information providers and (2) missing human capital providers. Furthermore, we can show that a BMO can be a sufficient policy approach. The BMO, as it is specially focused on the needs of its members, steps in as a surrogate intermediary.
Furthermore, our case shows that some external help was necessary to enable the BMO to act as a specialized intermediary. Conceptual support of the donor was required for the development of the concept and business plan and in the beginning. Later, consulting and coaching support was needed for the implementation of further business plan elements. As a business mind-set of the BMO management staff as well as transparency is a crucial factor for success, it was essential to set the right incentives towards its beneficiary to overcome the potential risk of donor reliance on BMO’s side. The approach to acquire EU projects for the PO itself could secure additional funding for the PO and the BMO itself, which provided the basis for financial sustainability and it raised the PO’s credibility as a dialogue partner significantly. Gathering an increasing amount of fact-based experience helped PO staff formulate precise proposals and policy initiatives.
Our research implies that (1) a research gap in the understanding of SME’s absorptive capacity of EU funds exists, (2) the absorptive capacity of SMEs is closely related to the existence of specialized intermediaries, and (3) a business membership organization can function as such a specialized intermediary. Nevertheless, there are limitations in this our approach, which call for further research. Especially, as we conducted a single case study, more empirical data from other settings is necessary in order to generalize our findings.

247 Proceedings of International Conference for Entrepreneurship, Innovation and Regional Development
ICEIRD 2014
References
1. Horvat A. Why does nobody care about the absorption? Some aspects regarding
administrative absorption capacity for the EU Structural Funds in the Czech Republic, Estonia, Hungary, Slovakia and Slovenia before Accession. WIFO Working Papers; 2005.
2. Ivandić V, Kandžija V, Kandžija J. Absorption Capacity of European Union Pre-accession Programs in Croatia. Economic Analysis. 2013;46:53–71.
3. Marinescu N. The Process of Attracting EU Funds by SMEs: Lessons From The Past. Journal Studia Universitatis Babes-Bolyai Negotia. 2013.
4. Knezevic I. Absorption Capacity of Serbia for Use of EU Funds: Practical Lessons from Slovakia. Slovak-Serbian EU Enlargement Fund. Pontis Foundation. 2011.
5. Horvat A, Maier G. Regional development, Absorption problems and the EU Structural Funds: Some aspects regarding administrative absorption capacity in the Czech Republic, Estonia, Hungary, Slovakia and Slovenia. ERSA conference papers; 2004.
6. Denti D. Did EU candidacy differentiation impact on the performance of pre-accession funds? A quantitative analysis of Western Balkan cases. Croatian International Relations Review. 2013;19:61–91.
7. Zaman G, Cristea A. EU Structural Funds Absorption in Romania: Obstacles and Issues. Romanian Journal of Economics. 2011;32:60–77.
8. SME Policy Index: Western Balkans and Turkey 2012. OECD Publishing: OECD Publishing; 2012.
9. van Ees H, Bachmann R. Transition economies and trust building: a network perspective on EU enlargement. Cambridge Journal of Economics. 2006;30:923–39.
10. Roth K, Kostova T. Organizational coping with institutional upheaval in transition economies. Journal of World Business. 2003;38:314–30.
11. Schrammel T. Competiveness in Transition Economies: Reducing Institutional Voids with the Cluster Approach. Journal of Emerging Markets Studies. 2013;1.
12. Khanna T, Palepu KG. The Future of Business Groups in Emerging Markets: Long-run Evidence from Chile. Academy of Management Journal. 2000;43:268–85.
13. Kapeliushnikov R, Kuznetsov A, Demina N, Kuznetsova O. Threats to security of property rights in a transition economy: An empirical perspective. Journal of Comparative Economics. 2013;41:245–64.
14. Krasniqi B. Barriers to Entrepreneurship And Sme Growth In Transition: The Case of Kosova. J. Dev. Entrepreneurship. 2007;12:71–94.
15. McNulty JE, Harper JT. Obstacles to Financial Development in Transition Economies: A Literature Survey. Financial Markets, Institutions & Instruments. 2012;21:203–40.
16. Svejnar J. Transition Economies: Performance and Challenges. The Journal of Economic Perspectives. 2002;16:3–28.
17. Meyer KE. Institutions, Transaction Costs, and Entry mode Choice in Eastern Europe. Journal of International Business Studies. 2001;32:357–67.
18. Koford K, Miller JB. Contract enforcement in the early transition of an unstable economy. Economic Systems. 2006;30:1–23.
19. Smallbone D, Welter F. The Role of Government in SME Development in Transition Economies. International Small Business Journal. 2001;19:63–77.
20. Ricart JE, Enright MJ, Ghemawat P, Hart SL, Khanna T. New frontiers in international strategy. J Int Bus Stud. 2004;35:175–200.
21. Khanna T. Local Institutions and Global Strategy. Harvard Business School Note 702-475. 2002.
22. Khanna T, Palepu KG. Multinationals as Global Intermediaries. Harvard Business School Note 703-428. 2003.
248 Proceedings of International Conference for Entrepreneurship, Innovation and Regional Development
ICEIRD 2014
23. Picot A, Dietl H, Franck E, Fiedler M, Royer S, editors. Organisation: Theorie und Praxis aus ökonomischer Sicht. 6th ed.: Schäffer-Poeschel Verlag für Wirtschaft Steuern Recht; 2012.
24. Meier R, Pilgrim M, Luetticken F. Building the Capacity of Business Membership Organizations: Guiding Principles for Project Managers. Washington, D.C; 2005.
25. Gibson A, Havers M. Supporting small business membership organizations. Small Enterprise Development. 1995;6:27–37.
26. Eisenhardt KM, Graebner ME. Theory Building from Cases: Oppertunities and Challanges. Academy of Management Journal. 2007;50:25–32.
27. Gibbert M, Ruigrok W, Wicki B. What passes as a rigorous case study? Strategic Management Journal. 2008;29:1465–74.
28. Yin RK. Case study research: Design and methods. 2nd ed. Thousand Oaks: Sage Publications; 1994.
29. Glaser BG, Strauss AL. Grounded theory: Strategien qualitativer Forschung. 2nd ed. Bern: H. Huber; 2008.
30. Strauss AL, Corbin JM. Grounded theory: Grundlagen qualitativer Sozialforschung. Weinheim: Beltz, PsychologieVerlagsUnion; 1996.
31. BalkanMonitor 2010: Insights and Perceptions. The voice of the Balkans; 2010. 32. BTI Transformation Index 2012 - Serbia Country Report. Gütersloh; 2012. 33. Zaman G, Georgescu G. Structural Fund Absorption: A New Challenge for Romania?
Romanian journal of economic forecasting. 2009;1:136–54. 34. Munzinger Report Serbien; 2011. 35. Kappenmann J, Matijević M. ICT in Serbia at a Glance. Novi Sad; Belgrad; 2012.

249 Proceedings of International Conference for Entrepreneurship, Innovation and Regional Development
ICEIRD 2014
Role of International Financial Reporting Standards for small and medium sized entities in the quality of business information Ivana Mamić Sačer1, Ivana Sever2 1 Faculty of Economics and Business - University of Zagreb, Trg J. F. Kennedyja 6, Zagreb, Croatia, [email protected]
2 Faculty of Economics and Business - University of Zagreb, Trg J. F. Kennedyja 6, Zagreb, Croatia, [email protected]
The appearance of the globalization process has aff ected all segments of each society, and also a financial reporting system that gives users essential information about business entity’s performance and liquidity. Absolute harmonization of financial reporting is still impossible to achieve due to the many differences between countries, among which the most significant are different econ omic environments and different legal systems. Accounting standards have one of the most important roles in the financial reporting harmonization process, among wh ich the most significant are International Financial Reporting Standards. Those standards represent the most important instrument for the harmonization of liste d and large companies. At the global level, harmonization is mostly achieved for this category of enterprises, while small and medium sized enterprises in most countrie s continue to use national accounting standards. Due to the fact that small an d medium-sized enterprises operate outside national borders increasingly, it i s necessary to pay more attention to the harmonization of financial reporting of this ca tegory of enterprises. Accordingly, appropriate scientific methods will be used in this paper to explore the role of IFRS for SMEs in preparing comparable and consistent financi al statements at the international level, which is a basic assumption of quality finan cial reporting, and is important in obtaining relevant and reliable business informatio n that users use in decision-making process.
Keywords
IFRS for SMEs, financial reporting, decision making process, harmonization
1. Introduction International Financial Reporting Standards are primarily focused on the financial reporting of companies in profit sector. In this sense, their main task is to meet the information needs of a wide range of users of financial statements. Consequently, IFRS are extremely complex and comprehensive standards that are primarily intended for the use of large and more complex business systems, and are less adapted to the needs of SMEs. Small and medium enterprises in different countries generally apply national accounting principles that are much simpler in comparison to International Financial Reporting Standards. Accordingly, a high

250 Proceedings of International Conference for Entrepreneurship, Innovation and Regional Development
ICEIRD 2014
degree of financial reporting harmonization for SMEs at the international level has not been achieved yet. In the European Union, the highest degree of financial reporting harmonization has been achieved for listed companies that prepare consolidated statements in accordance with the Regulation of the European Parliament and of the Council [1] which requires the application of IFRSs for such companies. In the EU, only a few states encourage companies that are not listed on the capital markets to use IFRS [2]. Furthermore, International Accounting Standard Board, as a standard setting body issued IFRS for SMEs with the intention to simplify accounting principles for the majority of companies which are recognized as small and medium sized entities. The main goal of this project was to understand the specifics of SMEs and make simpler accounting rules whose benefits will exceed costs of generating quality accounting information. Quality accounting information can contribute business decision making process so accounting information system is a prerequisite for generating such information.
2. Quality of accounting information of small and m edium-sized entities
Accounting information is the output of accounting information system. Each entity has implemented an accounting information system in order to prepare accounting information or externalized i.e. outsourced accounting activity. Regardless the size of entity it is important that accounting information serves business management. Consequently, it is expected that accounting information systems of small and medium-sized entities generate quality accounting information which will satisfy different users’ need. When it comes to SMEs the most important users of their accounting information, among owners, are government and banks. Owners of small entities usually find the accounting activity as cost and they are usually not interested in wide range of information which accounting information system can produce. In this context it is obvious that quality accounting information should consist of information generated for servicing tax purposes as well as information about entity’s creditworthiness i.e. liquidity, solvency etc. However, the significance of accounting information rises with the size of enterprises. So, medium-sized entities will be interested in different accounting reports which reflect some parts of business or represent the enterprise as a whole.
Accounting information should meet some features to be recognized as quality information. International Financial Reporting Standards define the quality accounting information as understandable, relevant, reliable and comparable information. Furthermore, US Generally Accepted Accounting Principles set forth primary and secondary qualitative features of accounting information [3]. When information is relevant and reliable than it means that satisfies primary level of quality. According to standards, relevant accounting information is information which has a value and is of significance to users, is accessible on time, has got a prognosis value and a feedback connection (to compare planned and accomplished value). Accounting information which does not consist of mistakes and there is an evidence of business events arising, i.e. which is true and impartial is reliable accounting information. Secondary qualitative features of accounting information are comparability (accounting information has to be consistent and formed in such a way that it can be compared to other information) and consistency. Besides, main features of financial statements’ quality are formal and material features [4]. Formal features of quality are balance sheet schemes that terminated form i.e. shape of statements. Usually, the forms of financial statements for SMEs are simplified in comparison to large entities. Moreover, EU suggests even more simplified financial statements forms for micro-entites. Material features are related to accounting

251 Proceedings of International Conference for Entrepreneurship, Innovation and Regional Development
ICEIRD 2014
policies. The fact is that the SMEs usually apply those accounting policies which are accepted for tax purposes.
Seeing that accounting information is a part of the whole information system it can be noticed that basic features of AIS's quality should mostly be attuned to features of the whole information system’s quality. Due to accounting information system functioning it can be stress that the quality of accounting information depends on input quality, data processing quality and quality of outputs. The main inputs of AIS are documents, so the controls of documents can improve the quality of accounting information. Further, data processing quality and quality of outputs (financial statements) depend on accounting standards, accounting acts and other associated regulatory framework. Usually, small entities outsource this part of accounting and pay for accounting services to accounting firms. Finally, the basic mathematical model for accounting information quality measurement takes into consideration the benefits of accounting information and the costs of its production:
accounting information quality =
where; benefits > costs [5]
This model, where quality accounting information is information which benefits are greater than its costs of production, is a basic model of accounting information quality measurement. Many governments take into consideration this model of accounting information quality when thinking on accounting regulation for SMEs. IFRS for SMEs in comparison to ‘’full’ IFRS are based on this principle as well.
3. International Financial Reporting Standards for sma ll and medium sized entities International Financial Reporting Standards are most widely used standards all over the world. However, many states create national accounting standards or develop national generally accepted accounting principles with intention to simplify the process of preparing and publication of financial statements for small and medium sized entities. Usually, national accounting principles and standards are based on IFRSs, which leads to the national IFRS adjustments and deviations in relation to the original standards. This results with incomparable financial statements of SMEs. In order to solve this problem and to achieve a higher degree of harmonization in accounting systems of small and medium-sized enterprises, in 2009 the IASB issued IFRSs for SMEs. The process of developing global and international standards with the need to reconcile different accounting solutions as well as the specific economic activities of different countries is not a simple and easy task. This is illustrated by the chronology of events related to the adoption of these standards (table 1) [6].
Table 1 Chronology of adopting IFRS for SMEs
Chronology of adopting IFRS for SMEs
September 2003. Study on international accounting standards creators.
June 2004. Publication of the discussion paper (DP) Preliminary Views on Accounting Standards for Small and Medium-sized Entities;
April 2005. Staff Questionnaire on Possible Recognition and Measurement Modifications for Small and Medium-sized Entities (SMEs).
October 2005. Public round-table discussions with the Board on recognition and measurement simplifications.
benefits of accounting information
costs of accounting information production

252 Proceedings of International Conference for Entrepreneurship, Innovation and Regional Development
ICEIRD 2014
January 2006. The working group reviewed the draft completed and given over 80 written recommendations to the IASB (about 75% of the recommendations has been incorporated into the published draft).
February 2007. Publication of the ED (English language); comment deadline 30 November 2007.
June 2007. Field-testing of the ED with the participation of 116 small companies in 20 countries
November 2007. End of the comment period; 162 comment letters received.
March-April 2008. Staff present to the Board an overview of the main issues raised in the comment letters and field tests.
May 2008. – April 2009. Board redeliberations of the proposals in the ED at 13 public Board meetings.
April 2009. Board decides that the name of the final standard will be International Financial Reporting Standard for Small and Medium-sized Entities (IFRS for SMEs), as proposed in the ED.
June 2009. 13 Board members vote in favour, 1 dissenting opinion.
July 2009. Publication of the IFRS for SMEs .
October 2013. Issued draft of revised IFRS for SMEs.
The second half of 2014. or the first half of the 2015.
It is expected to be issued a final version of the revised IFRS for SMEs.
2016. Expected start of implementation of revised standards.
Immediately after the publication of standards International Accounting Standards Board has started with the intensive promotion of IFRS for SMEs in order to inform the public about the content and benefits of the application of these standards. One of the key questions was to determine what is meant by small and medium enterprises and which companies should implement these standards. In accordance with the provisions of IFRS for SMEs, small and medium sized entities are those that: • do not have public accountability and • publish general purpose financial statements (example of external users include owners
who are not involved in the process of managing the business, existing and potential creditors and credit rating agencies).
An entity has public accountability if: • it debt or equity instruments are traded in a public markets or it is int he process of
issuing such instruments for trading in a public market (a domestic or foreign stock exchange or an over-the counter market, including local and regional markets), or
• it holds assets in a fiduciary capacity for a broad group of outsiders as one of its primary businesses This is typically the case for banks, credit unions, insurance companies, securities brokers/dealers, mutual funds and investment banks.[7]
International Financial Reporting Standards have been created primarily for the purpose of meeting the information needs of market participants and therefore they are extremely extensive and complex in its provisions. SMEs consider the application of such standards as heavy load that eventually becomes larger and larger as the scope and detail of the standards increases. Therefore, the International Accounting Standards Board wanted with the IFRS for SMEs to meet the information needs of small and medium-sized enterprises, balancing the costs and benefits of the preparing financial statements. The purpose of adoption of these standards is to provide a significantly simpler set of accounting standards tailored to the needs of small and medium-sized enterprises that are harmonized with full IFRS in their general provisions. Some standards that are not relevant for SMEs, such as

253 Proceedings of International Conference for Entrepreneurship, Innovation and Regional Development
ICEIRD 2014
Earnings per Share and Segment reporting, are not included in IFRSs for SMEs. Most of complex solutions from the "full" IFRS were also abandoned (for example, property, plant and equipment can be measured only by using cost model, while the revaluation model is not allowed, capitalization of borrowing cost is also not allowed unlike the full IFRS). The IFRS for SMEs simplify principles for recognition and measurement of assets, liabilities, revenues and expenditures (for example, goodwill should be depreciated, for accounting treatment of joint ventures should be used cost method, all research and development costs should be expensed immediately and fair value method is significantly less used compared to full IFRSs). Table 2 shows structure of IFRS for SMEs.
Table 2 Structure of IFRS for SMEs
Standard The title of standard IFRS for SME 1 Small and medium sized entities IFRS for SME 2 Accounting Principles and Standards IFRS for SME 3 Presentation of Financial Statements IFRS for SME 4 Statement of financial position IFRS for SME 5 Statement of comprehensive income and income statement IFRS for SME 6 Statement of changes in equity and statement of comprehensive and retained IFRS for SME 7 Statement of Cash Flows IFRS for SME 8 Notes to Financial Statements IFRS for SME 9 Consolidated and Separate Financial Statements IFRS for SME 10 Accounting Policies, Estimates and Errors IFRS for SME 11 Basic financial instruments IFRS for SME 12 Other financial instruments IFRS for SME 13 Inventories IFRS for SME 14 Investment in subsidiaries IFRS for SME 15 Investments in joint ventures IFRS for SME 16 Investment property IFRS for SME 17 Property, plant and equipment IFRS for SME 18 Intangible assets except goodwill IFRS for SME 19 Business combinations and goodwill IFRS for SME 20 Leases IFRS for SME 21 Provisions and contingent assets IFRS for SME 22 Liabilities and capital IFRS for SME 23 Revenues IFRS for SME 24 Government grants IFRS for SME 25 Borrowing costs IFRS for SME 26 Share based payments IFRS for SME 27 Impairment of assets IFRS for SME 28 Employee benefits IFRS for SME 29 Income taxses IFRS for SME 30 The Effects of Changes in Foreign Exchange Rates IFRS for SME 31 Hyperinflation IFRS for SME 32 Events After the Reporting Period IFRS for SME 33 Related party disclosures IFRS for SME 34 Extracted activities IFRS for SME 35 Transition to the IFRS for SME

254 Proceedings of International Conference for Entrepreneurship, Innovation and Regional Development
ICEIRD 2014
International Financial Reporting Standards for SMEs characterizes: 1. reduced number of alternatives in standards, 2. elimination of standards that are not relevant for this category of companies, 3. simplifications of recognition and measurement methods
resulting in a significantly smaller volume of these standards in relation to the "full" version of International Financial Reporting Standards (by 85%). Issuance of these standards is the biggest step in achieving comparable financial statements at the international level prepared by small and medium-sized enterprises. However, the question is which countries have positive attitude to adopt these standards in the near future. Results of previous researches show that national accounting standards in some segments significantly differs from IFRSs and the adoption of IFRS for SMEs would significantly affect the company’s profits.[8] In the countries, tax and financial accounting are closely linked and reorientation from national accounting standards to IFRS for SMEs would result in numerous difficulties in determining taxable income and would potentially create additional education costs. So far, over 80 countries in the world adopted IFRSs for SMEs or intend to adopt these standards in the next three years. Figure 1 shows some of these countries.
Figure 1 Adoption of International Financial Reporting Standards for Small and Medium Businesses in the World [9]
The adoption of the IFRS for SMEs is interesting for private companies for many reasons, among which the most significant are:
• improved access to capital, • improved comparability, • improved quality of reporting as compared to existing national GAAP (in many
countries, local GAAPs for private entities are very limited), • the focus on the needs of users of SME financial statements, • less of a burden for entities in jurisdictions where „full“ IFRS or full national GAAP
are required at present.[10] With regard to the simplification of accounting regulations should be noted that the European Union had continuously maintained consultations related to the audit IV. and VII. Directive and, among other things, proposes to exempt micro-enterprises from the obligation of such a complex financial reporting system [11]. Despite the fact that global accounting standards are relevant to all countries of the world, it's time to come that will show how the harmonization of this segment of business in our region will be achieved. In 2013 European Union issued new accounting directive replacing Fourth and Seventh EU Directive. Directive 2013/34/EU of the European Parliament and of the Council on the annual financial statements, consolidated

255 Proceedings of International Conference for Entrepreneurship, Innovation and Regional Development
ICEIRD 2014
financial statements and related reports of certain types of undertakings still does not require the implementation of IFRS for SME in national accounting systems of EU member states.
4. Influence of IFRSs on national accounting standa rds
Financial statements prepared in one country are often used in many other countries for different purposes. As a result, it would be helpful that the national accounting standards i.e. accounting principles used in different countries are structured in a way to insure quality accounting information, such as understandable and comparable financial statements. On the other hand, national standards usually reflect specific accounting practices of individual countries and are directed mainly to those businesses that are predominantly oriented to the national markets. That is why there is a constant tendency towards the global harmonization of accounting standards created in the different countries. On the other hand, national regulators require from standard setters to take into account their specific national accounting rules. The most important role in the international harmonization of accounting standards primarily have the bodies that bring the accounting rules (standard setters) and those who prepare and use financial statements. Investors and financial analysts would like to understand the financial statements of companies from different countries if they are interested to purchase their shares. Companies that want to issue their shares on foreign markets also recognize many benefits of financial reporting harmonization. Small and medium sized entities that operate outside national boundaries could also benefit from higher level of comparability of their financial statements. Harmonization of accounting rules at the international level significantly reduces the efforts that accounting professionals invest in the preparation of individual, but especially in consolidated financial statements. Similarly, the preparation of internationally comparable information about the effectiveness of enterprises in different countries will be much simpler. Harmonization brings many benefits to decision makers and managers. The valuation of foreign companies will be much simpler for the potential takeovers and investors. International companies will also considerably easier transfer accounting information from one country to another. As a result, the accounting information will be comparable and reliable. The most important instruments that are used for financial reporting harmonization for large companies at the international level are International Financial Reporting Standards and EU Regulation issued in 2002. Until nowadays, harmonization of financial reporting is much more achieved for large companies than for small and medium sized companies. With a purpose of achieving higher level of comparability of financial statements of small and medium sized entities at the international level, International Accounting Standards Board issued in 2009. IFRSs for SMEs. The adoption of these standards has brought some changes to the financial reporting of certain countries. In some countries, these standards will be the reason for the abolition of national standards while other countries continue to insist on the use of their national accounting solutions. This is especially important for many European countries that could be obligated, according to European Regulations and Directives, to use IFRSs for SMEs. Currently the EU does not require the application of these standards.
Issuance of the Regulation of the European Parliament and of the Council, represents a big step towards the harmonization of financial reporting in the European Union, primarily for large enterprises. The Regulation requires the application of full IFRSs since 1.1.2005. for all companies whose shares are quoted on the regulated capital markets in the EU and prepare the consolidated financial statements. Regulation is a binding instrument for all EU member states. First step in the direction of achieving a greater degree of harmonization of accounting rules in the EU, has been made in 1978. when the 4th EU Directive was adopted.

256 Proceedings of International Conference for Entrepreneurship, Innovation and Regional Development
ICEIRD 2014
EU directive that is directly related to accounting and auditing is also 7th EU Directive. The publication of accounting directives was followed by process of harmonization of national accounting laws with rules defined in those directives. IV. Directive includes minimum accounting requirements that member states should implement in their national accounting laws, while Member States may add certain detailed rules. These requirements are primarily related to the presentation of financial statements, the permitted recognition and measurement methods, and to disclosure requirements. 7th EU Directive released in 1983. includes the rules for preparing consolidated financial statements. In the 80’s of the 20th century, the consolidation of the financial statements was more exception than the rule [12]. It was conducted only in a few EU countries. In other parts of Europe, the consolidation of the financial statements was very rare. The European Union has left many options to its Member States related to implementation of VII. EU directives into national laws, because this Directive introduced a completely new legal requirements aimed at the Member States.
After IFRS for SMEs had been issued, European Commission carried out a consultative study on the adequacy of the application of these standards in the EU [13]. The results of the study showed that the 13 countries considered these standards suitable for use at the national level (Cyprus, Czech Republic, Denmark, Estonia, Greece, Spain, Ireland, Malta, Netherlands, Poland, Portugal, Sweden, United Kingdom), while nine of them did not consider this standards as appropriate for the financial reporting of small and medium sized entities (Austria, Belgium, Bulgaria, Germany, Finland, France, Italy, Slovakia and Slovenia) [14]. A possible reason for the negative attitude against the adoption of the IFRS for SMEs can be found in the high degree of correlation between existing national accounting standards and tax regulations (for example in Germany). Such change in accounting regulations would bring to some countries additional costs of adapting new set of accounting standards. Table 1 shows the potential advantages and disadvantages of adopting the IFRS for SMEs in the EU countries.
Table 3 Advantages and disadvantages of adopting IFRS for SMEs from the perspective of the respondents [15]
Advantages Disadvantages Opinion of users who prepare financial statements
• IFRS for SMEs are suitable for: a. companies with subsidiaries in different
EU countries b. subsidiaries of multinational companies
that prepare financial statements in accordance with IFRS
c. companies "looking" for foreign financing, quoted on unorganized markets
d. companies that are planning to come out to foreign markets or on organized capital market
e. ensuring comparability for investors, business partners and creditors, enabling lower cost of capital
Opinion of users of financial statements • insure international comparability • use the unique "accounting language"
• strong correlation between financial accounting and tax accounting hinders the implementation of the IFRS for SMEs - the only compromise would be its application to the consolidated financial statements
• duplication of administrative burden if the tax system of a Member State requests additional reports
• complexity of the Standards for those who prepare financial statements as well as for those who use them
• are not useful for companies that do business locally
• users are used on the current national accounting rules
• some industry / legal forms of business enterprises are not covered by these standards
• the problem of frequent changes in legislation New Accounting Directive replaces IV and VII EU directives that represented a synonym for harmonization of national accounting systems in EU for a few decades and should be implemented in the national legislation by 20/07/2015. Directive will enter into force on the

257 Proceedings of International Conference for Entrepreneurship, Innovation and Regional Development
ICEIRD 2014
beginning of 2016. The accounting directive recognizes a category of micro enterprises which gives the possibility of exemption from the requirement of presenting accruals in the balance sheet, the disclosure of all information in the notes to the financial statements and the preparation of management reports. The new Directive gives to micro-enterprises possibility to publish abbreviated balance sheet that will simplify the process of preparation and presentation of financial statements that could lead to certain savings for this category of enterprises. Small businesses in accordance with the new directive, will prepare an abbreviated form of the balance sheet and profit and loss account, and medium-sized enterprises are given the possibility of preparing abridged balance sheets and abridged notes to the financial statements. The new Directive repeals the 24th and 26th article of 4th EU Directive and the number of allowed forms of profit and loss account is reduced from four to two alternatives which may have a positive impact on the comparability of financial statements. Additionally, there are reduced allowed alternatives for presentation of certain positions in the balance sheet form. The positive influence on financial reporting harmonization also could be found in provisions about the standardization of disclosure information in the notes to the financial statements. Still, the new directive does not require the mandatory use of IFRS for SMEs at EU level. Despite the fact that the latest European Union directive does not require the application of IFRSs for SMEs, several countries have voluntarily adopted the standards set in the original or modified form, namely the United Kingdom, Switzerland and Ireland. Germany did not change the attitude about the adoption of IFRSs for SMEs, which could be supported by the fact that the German revised its Companies Act in 2009, as an alternative to the adoption of IFRS for SMEs, which showed that Germany has no intention in the near future to abolish national accounting solutions for the benefit of international standards. However, it is interesting that Germany translated these standards into the national language [16]. Although it was expected that United Kingdom will adopt full IFRS for SMEs, in 2013 they issued national accounting standards based on IFRS for SME but with significant modifications. United Kingdom allowed application of some alternatives for initial recognition and measurement of financial statement elements that are allowed in full IFRSs, but not in IFRS for SMEs. These standards also apply to businesses in the Republic of Ireland. Switzerland allows, but does not require the application of these standards for SMEs. Statutory financial statements in Switzerland must be prepared in accordance with the rules prescribed by the Swiss Code of Obligations; those statements are the authoritative basis for the distribution of dividends, for tax purposes and for determining insolvency. Countries that are not EU members, and are located on the territory of Europe, which have adopted IFRS for SMEs are Bosnia and Herzegovina and Macedonia. Bosnia and Herzegovina does not require the preparation of the cash flow statement and statement of changes in equity in the separate financial statements prepared according to IFRS for SMEs (it adopted the standards with some modifications). Macedonia has adopted these standards on a national level without significant modification [17]. In general, so far the IFRS for SMEs are not yet fully adopted as an instrument of harmonization of financial reporting of SMEs in the European Union. 5. Conclusion A successful business operation requires the quality business information and a proper accounting information system can insure quality accounting information. The quality of accounting information depends on several features, among others, on the application of financial reporting standards. The most widely used standards, IFRS, influence the quality of accounting information. National accounting standards i.e. national accounting principles reflects the specifics of the countries and are on the certain level converged with IFRS. The biggest step in achieving comparable financial statements at the international level prepared

258 Proceedings of International Conference for Entrepreneurship, Innovation and Regional Development
ICEIRD 2014
by small and medium-sized enterprises was the issuance of IFRS for SMEs. Although, the EU has not obliged their Member States to apply IFRS for SMEs by issuing the new Accounting Directive, some European countries have changed their national accounting principles under these standards and some others still decide to apply IFRS for SMEs. IASB has taken some activities to increase the application of IFRS for SMEs. However, the future will show how many more countries will decide to implement IFRS for SMEs. References 1 Regulation (EC) No 1606/2002 of the European Parliament and of the Council. Available on:
http://eurlex.europa.eu/LexUriServ/LexUriServ.do?uri=CELEX:32002R1606:EN:NOT [05.03.2014.] 2 Barone, J, Kothari, J (2011) Advanced Financial Accounting, Pearson, Edinburgh, p. 28 3 Žager, K., Žager, L., (1999). Analiza financijskih izvještaja, MASMEDIA, Zagreb, p. 88. Quoted
towards FASB SFAC No.2., according to D.E. Kieso-J.J.Weygandt, 1986., Intermediate Accounting, New York, John Wiley & Sons, p.30
4 Žager, K. et.al, (2008) Analiza financijskih izvještaja, Masmedia, p. 87. 5 Mamić Sačer, I., Oluić, A., Information Technology and Accounting Information Systems' Quality in
Croatian Middle and Large companies, Original Scientific Paper, rad na engleskom jeziku, Journal of Information and Organizational Sciences, Vol. 37, No.2, PP.77-144,University of Zagreb, FAculty of Organization and Informatics, Varaždin, December 2013, p. 117-126.
6 Adjusted towards: http://www.ifrs.org/IFRS-for-SMEs/histroy/Pages/History.aspx [10.02.2014.] 7 Barone, J, Kothari, J (2011) Advanced Financial Accounting, Pearson, Edinburgh, p. 28 8 PWC (2009) GAAP 2000: A survey of National Accounting Rules in 53 countries,
PriceWaterhouseCoopers and others, London, p. 6 9 PriceWaterhouseCoopers: www.pwcinform.pwc.com [15.01.2014.] 10 Barone, J, Kothari, J (2011) Advanced Financial Accounting, Pearson, Edinburgh, p. 29 11 Nobes, C. (2010) On Researching into the Use of IFRS by Private Entities in Europe, accounting
in Europe, Vol. 7, No. 2, 213-226, p. 213. 12 Choi, F. i Meek, G. (2008) International Accounting, Pearson Prentice Hall, Sixth Edition, New
Jersey.p. 297. 13 Document available on:
http://ec.europa.eu/internal_market/consultations/2009/ifrs_for_sme_en.htm. [14.6.2013.] 14 European Commission (2010) Summary Report: of the responses received to the Commission's
Consultation on International Financial Reporting Standard for Small and Medium-sized Entities. Available on: 2010-05-31_ifrs_sme_consultation_summary_en.pdf [10.02.2014.]
15 Žager, K., Dečman, N., Promjene regulative financijskog izvještavanja u EU i utjecaj na izvještavanje u RH, HZRFD, Računovodstvo i financije, 7/2010., p. 35-39
16 Document available on: http://www.ifrs.org/Use-around-the-world/Documents/Jurisdiction-profiles/Germany-IFRS-Profile.pdf [10.02.2014.]
17 Document available on: http://www.ifrs.org/Use-around-the-world/Documents/Jurisdiction-profiles/Macedonia-IFRS-Profile.pdf [10.02.2014.]

259
Proceedings of International Conference for Entrepreneurship, Innovation and Regional Development ICEIRD 2014
Valuing and Dealing Patents in High-Tech Industries – Implications for SMEs
Zeljko Tekic1, Milana Vitas2, Miroslava Drazic3, Dragan Kukolj4, 1University of Novi Sad, Faculty of Technical Sciences, Trg Dositeja Obradovica 6, Novi Sad, Serbia, [email protected]
2 RT-RK, Institute for Computer Based Systems, Narodnog fronta 23a, 21000 Novi Sad, Serbia, [email protected]
3 RT-RK, Institute for Computer Based Systems, Narodnog fronta 23a, 21000 Novi Sad, Serbia, [email protected]
4 University of Novi Sad, Faculty of Technical Sciences, Trg Dositeja Obradovica 6, Novi Sad, Serbia, [email protected]
Specialized patent dealers (e.g. Intellectual Ventu res, Rambus, Rembrandt IP, Acacia Technologies) have changed the IP playground in man y industries. As market intermediaries who have no interest in producing pr oducts, they accumulate and deploy their IP threatening producers with litigati on in order to generate supra-normal returns on patent-protected technology. The entranc e of non-producing patent dealers to the high technology market brought the strategy of “being infringed” as the new stream in the strategic use of patents. The new str ategy and new players changed the basic postulates in understanding the use and value of patents. Patent dealers affect companies of all sizes in many industries, but espe cially in the high technology sector. Therefore, it is of value for companies acr oss industries to understand their modus operandi and to create IP strategy to prevent being surprised by a litigation threat. This paper shades more light on current pra ctice of valuing and dealing patents on the high-tech market and implications of this practice for SMEs. We do so by analyzing a recent case of patent infringement l awsuit between Lumen View Technology, a Delaware-based patent holder, and Fin dTheBest.com, a California- based start-up and identifying the main challenges for start-ups and other SMEs under new circumstances.
Keywords Patent dealers, patent value, infringement, litigation, case study
1. Introduction
A patent is defined as an exclusive right of limited duration over a novel invention capable of industrial application. In return for publication of a technical invention, patent system promises to the owner the right to a temporary monopoly on that invention. Nevertheless, the fundamental idea and intention of the patent system have evolved over time towards more strategic forms of business use of patents [1]. As a result, the patent system increasingly gained a strategic significance independently of invention and innovation [2]. Patents were used for a long period of time mainly in two basic strategic manners – as exclusion rights [3], or in cross-licensing negotiations with competitors [4]. Patents have been

260
Proceedings of International Conference for Entrepreneurship, Innovation and Regional Development ICEIRD 2014
used to provide the period of monopoly and an opportunity for extra profit in discrete industries, as chemistry and pharmacy, excluding others from the use of patented intellectual property. On the other side, in complex product industries, such as telecommunications, semiconductor industry, or consumer electronics, innovation is complex and dependent on information from a multitude of sources. In this industries firms have been patenting to cross-license, trade, negotiate, or to prevent litigation [4]. Patents are used here as so-called bargaining chips which allow companies to enter cross-licensing negotiations that are crucial for the survival of a company within these sectors. The high technology market has changed irreversibly with the appearance of non-producing patent dealers (e.g.: Intellectual Ventures, Rembrandt IP, Acacia Technologies) at the beginning of the 21st century. They have accelerated transactions between patent owners and patent users introducing the strategy of being infringed [5]. This new strategy is built on idea to license or sell patented technology to a manufacturing firm by creating threat of litigation. There are various business models that have emerged from the new strategy [6]. Patent dealers are sometimes also known as patent aggregators and patent distributors, even as patent trolls and sharks [6, 7]. Their common characteristic is that they deploy originally developed or acquired intellectual property, rather than to produce goods, to earn the majority of their revenues [8]. Since the mutual threat of legal actions among competitors does not exist anymore, the new strategy changes the whole system in complex industries. That is, new competitors cannot infringe patents of others, because they do not make or sell any products [9]. Even though patent dealers have appeared a while ago, their impact on business has recently reached an exceptional scale and scope [10]: • between 2004 and 2013 the number of patent lawsuits that involve patent dealers rose
14 times; • patent dealers affect companies in many industries not only in the high technology sector
(hardware, software, semiconductors, communications, and consumer electronics); and • the users and sellers of technology, especially companies in retail and financial services,
automation and transport industries, are increasingly targeted. Lawsuits initiated by patent dealers affected 2,150 different companies through 5,842 lawsuits and totalled about $29 billion in direct cost (including the costs of non-litigated assertions, but excluding indirect costs such as diversion of resources, delays in new products, and loss of market share) in 2011 [11]. Although, large and high-profile companies are still primary targets, patent dealers in recent years increasingly seek to enforce their patents against start-ups, and other small and medium-sized companies. Knowing that recent start-up, IDrive, which produces an online-backup service, has spent more than $2 million on legal and settlement fees, as well as a year's worth of employee time defending itself [12] it is not surprising that SME sector accounts for 37% of the above mentioned direct costs [11]. The principal objective of this paper is to shade more light on current practice of valuing and dealing patents on the market and implications of this practice for SMEs. We do so by analyzing a recent case of patent infringement lawsuit between Lumen View Technology, a Delaware-based patent holder, and FindTheBest.com, a California- based start-up. Reflecting the objective, the remainder of the paper is structured as follows: after briefly reviewing literature about patent dealers and presenting a new concept of value and its main driver, the case study is presented. The paper then describes and discusses the main learning points and concludes with implications.

261
Proceedings of International Conference for Entrepreneurship, Innovation and Regional Development ICEIRD 2014
2. New Value Driver
Measuring the value of patent rights is principally hard since patents are present in a blind market characterized by high information asymmetry [13]. At the same time their value depends on exceedingly idiosyncratic details, including the strategic function they play in competitive surroundings [3]. Assessing patents under the strategy of threatening with litigation is based on recognizing the use-value [14] which others would grasp using the specific patent. High exchange (monetary) value can be obtained (because of the threat of an injunction) if high use-value is identified, like in the case where a patent covers one component of a complex, profitable and well-known product. It is shown that a profitable strategy for patent holders is to wait to be infringed rather than to offer a license before the product is developed [5]. The common practice of courts concerning royalty and damage rules encourages the patent holder to wait for infringement settlements and make many times more money than from offering ex ante technology for licensing [5]. When companies face the possibility to end production enforced immediately and other harmful consequences when a patent infringement is detected, they do everything in their power to reduce the risk. Nevertheless, this is very difficult in a case of complex technology, where a product is covered by many patents, generally held by several firms. As a result, even on ambiguous demonstration of infringement, this product complexity creates a chance to threaten competitors and to make transaction in the patent market. In this situation patent value is not defined any longer by the firm’s market value or the owner’s willingness to pay renewal fees on the patent, but by the aptitude to make a credible threat of litigation [15, 7]. The value of patents relates merely the prospect of infringement, not to actual infringement by other companies [2]. Many recent litigation cases, including Microsoft vs. Alcatel (e.g. [16]) and NTP vs. Research in Motion (e.g. [5]) have shown how damaging consequences can be if infringement is detected. We argue that under the new strategy patent value is predominantly driven by the following rule: the higher the threat of litigation, the higher the (monetary) value of the patent, even though it is needed to consider prices, costs and quantities of patent-protected products sold by the infringers to come up with the monetary value of a patent [17]. Finally, patents that create a higher threat of litigation have the following characteristics [18]: they are older, they cover a (small) part of mainstream technology which is currently used, they are broadly drafted, and it is possible to offer ambiguous evidence about their infringement. Tekic and Kukolj [18] found that the combination of these factors makes for a high threat of litigation. Namely, broadness makes differentiation between patented inventions harder, while long life and closeness to mainstream technology make it possible to relate a patent to many existing products and so make infringement claims easier. Finally, while the aim is to threaten competitors it is more important to provide ambiguous data that a patent is infringed than compelling evidence to that effect.
3. Lumen View Technology vs. FindTheBest.com
Lumen View Technology, a Delaware-based patent holder, in May 2013 sued FindTheBest.com, a California- based start-up that helps shoppers to compare things across categories, for infringing patent 8,069,073 [19]. FindTheBest.com matches users with goods or services according to criteria they enter (e.g. prices). It is based on a data-driven comparison engine that organizes and presents data for making decisions. Since it launched in 2010, has raised about $17 million in venture capital
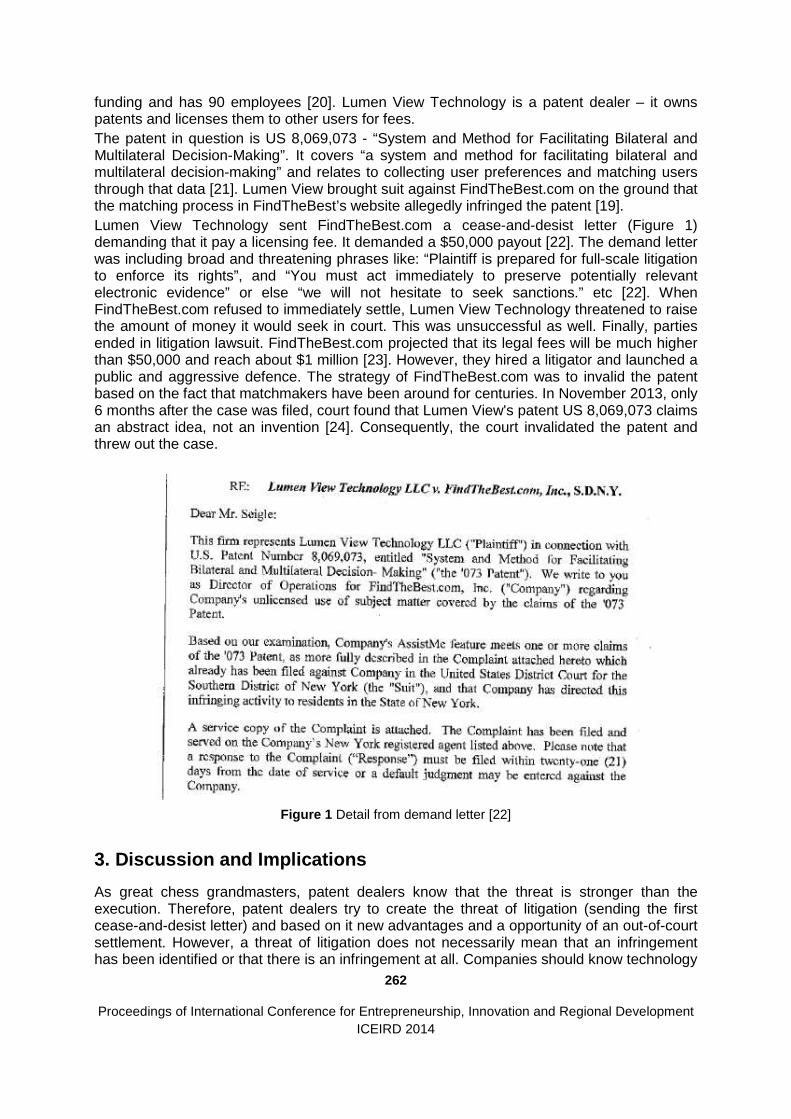
262
Proceedings of International Conference for Entrepreneurship, Innovation and Regional Development ICEIRD 2014
funding and has 90 employees [20]. Lumen View Technology is a patent dealer – it owns patents and licenses them to other users for fees. The patent in question is US 8,069,073 - “System and Method for Facilitating Bilateral and Multilateral Decision-Making”. It covers “a system and method for facilitating bilateral and multilateral decision-making” and relates to collecting user preferences and matching users through that data [21]. Lumen View brought suit against FindTheBest.com on the ground that the matching process in FindTheBest’s website allegedly infringed the patent [19]. Lumen View Technology sent FindTheBest.com a cease-and-desist letter (Figure 1) demanding that it pay a licensing fee. It demanded a $50,000 payout [22]. The demand letter was including broad and threatening phrases like: “Plaintiff is prepared for full-scale litigation to enforce its rights”, and “You must act immediately to preserve potentially relevant electronic evidence” or else “we will not hesitate to seek sanctions.” etc [22]. When FindTheBest.com refused to immediately settle, Lumen View Technology threatened to raise the amount of money it would seek in court. This was unsuccessful as well. Finally, parties ended in litigation lawsuit. FindTheBest.com projected that its legal fees will be much higher than $50,000 and reach about $1 million [23]. However, they hired a litigator and launched a public and aggressive defence. The strategy of FindTheBest.com was to invalid the patent based on the fact that matchmakers have been around for centuries. In November 2013, only 6 months after the case was filed, court found that Lumen View's patent US 8,069,073 claims an abstract idea, not an invention [24]. Consequently, the court invalidated the patent and threw out the case.
Figure 1 Detail from demand letter [22]
3. Discussion and Implications
As great chess grandmasters, patent dealers know that the threat is stronger than the execution. Therefore, patent dealers try to create the threat of litigation (sending the first cease-and-desist letter) and based on it new advantages and a opportunity of an out-of-court settlement. However, a threat of litigation does not necessarily mean that an infringement has been identified or that there is an infringement at all. Companies should know technology

263
Proceedings of International Conference for Entrepreneurship, Innovation and Regional Development ICEIRD 2014
they use to be able to rapidly assess the threat and define whether or not company is infringing the patent referenced in the demand letter. It is required to have a careful due diligence around every piece of technology the company uses as well as awareness of its competitors’ technology. Since patents once considered not aggressive could become a source of litigation surprises, particular attention should be paid when patents change ownership, especially when the patentee is bankrupt [18]. SMEs should be more aware of patents. They should actively use patent information for diverse purposes, mainly in business intelligence core areas [25]. Additionally, it is of great importance for all companies, particularly for start-ups, to distinguish amateur patent trolls from the professional ones, and to plan their legal strategy accordingly. Proof of infringement is typically weak and unclear. Nevertheless, to create a vulnerable position for company it is sometimes enough only to manipulate with ambiguous facts about infringement. For some technologies it is very difficult to provide reliable proof of infringement – especially for broadly drafted software and business model patents, and when chip-level reverse engineering is needed to prove infringement since only a few companies in the world have the resources and willingness to do this [18]. This is the reason why the greatest number of threats will never be followed up with a serious threat of suit or litigation itself. However, patent litigations are extremely costly and unsure. FindTheBest.com had about $200,000 in legal fees for six-month case [26] that is four times more than Lumen View Technology settlement demand, but with high likelihood to get compensation from Lumen View. Even more important, FindTheBest.com won publicly and any future patent trolls should rethink their decision of coming to their doorstep. Specialized patent dealers have changed the IP playground with their appearance as market intermediaries who have no interest in producing products. To generate supra-normal returns on patent-protected technology, they accumulate and deploy their IP, threatening producers with litigation. Patent dealers affect companies of all sizes in various industries, particularly in the high technology sector. Therefore, companies across industries need to understand their modus operandi and to create IP strategy to prevent being surprised by a litigation threat.
Acknowledgements
This work was partially supported by the Ministry of Education, Science and Technology Development of the Republic Serbia under Grant number TR-32034, III-44009; and by the Provincial secretary of Science and Technology Development of Vojvodina Province under Grant number 114-451-2434/2011-03.
References
1 Tekic, Z., Kukolj, D., Drazic, M., Vitas, M. (2013) Towards understanding the role and value of patents in a knowledge-based economy. DAAAM International Scientific Book 2013, pp. 389-416, B. Katalinic & Z. Tekic (Eds.), DAAAM International, Vienna, Austria
2 MacDonald, S. 2004. When means become ends: considering the impact of patent strategy on innovation. Information Economics and Policy 16(1): 135-158.
3 Cohen, W. M., Nelson, R. R., and Walsh, J. P. 2000. Protecting their intellectual assets: appropriability conditions and why firms patent or not? Cambridge, MA: NBER Working Paper No. 7552. www.nber.org/papers/w7552 (Accessed March 19, 2014).
4 Hall, B. H., and Ziedonis, R. H. 2001. The patent paradox revisited: an empirical study of patenting in the US semiconductor industry, 1979-1995. RAND Journal of Economics 32(1): 101-128.
5 Reitzig, M., Henkel, J., and Heath, C. 2007. On sharks, trolls and their patent prey: unrealistic damage awards and firms' strategies of "being infringed". Research Policy 36(1): 134-154.
264
Proceedings of International Conference for Entrepreneurship, Innovation and Regional Development ICEIRD 2014
6 Millien, R., and Laurie, R. 2007. A summary of established & emerging IP business models. Proceedings of the eight annual Sedona Conference on patent litigation 1–16, Sedona, AZ, www.ip-strategy.com/downloads/Sedona_2007_Paper.pdf (Accessed March 12, 2013).
7 Detkin, P.N. 2007. Leveling the patent playing field. The John Marshall Review of Intellectual Property Low 6: 636-644.
8 Yanagisawa, T. and Guellec, D. 2009. The emerging patent marketplace. OECD STI Working Paper 2009/9. www.oecd.org/dataoecd/62/55/44335523.pdf (Accessed July 5, 2013)
9 Rivette, K., and Kline, D. 2000. Discovering new value in intellectual property. Harvard Business Review 1: 54–66.
10 Patent Freedom. 2014. All about NPEs. www.patentfreedom.com/about-npes/ (Accessed March 5, 2014)
11 Bessen, J., and Meurer, M. 2012. The direct costs from NPE disputes. Boston University School of Law, Law and Economics Research Paper No. 12-34. http://ssrn.com/abstract=2091210 (Accessed July 2, 2012)
12 Jeremy Quittner 2013 The Time to Fight Patent Trolls is Now, Inc.com www.inc.com/jeremy-quittner/scotus-fighting-patent-trolls.html
13 Lemley, M., and Myhrvold, N. 2008. How to make a patent market. Hofstra Law Review 36: 257–259.
14 Marx, K. (1867) 1976. Capital. Volume 1. New York: Penguin Books. 15 McDonough, J. 2007. The myth of the patent troll: an alternative view of the function of patent
dealers in an idea economy. Emory Law Journal 56: 189-228. 16 Lemley, M. 2008. Ignoring patents. Michigan State Law Review 19: 19-34. 17 Harhoff, D., Scherer, F., and Vopel, K. 2003. Citations, family size, opposition and the value of
patent rights. Research Policy 32: 1343–1363. 18 Tekic, Z., Kukolj, D. (2013) Threat of litigation and patent value - what technology managers
should know, Research-Technology Management, 56 (2): 18 – 25 19 www.businessweek.com/pdfs/Lumen_View_vs_FindTheBest.pdf 20 www.google.com/patents/US8069073 21 Rebecca Grant, 2013 FindTheCompany releases data on 30M businesses to clue in consumers,
http://venturebeat.com/2013/06/18/findthecompany-releases-data-on-30m-businesses-to-clue-in-consumers/
22 www.adlervermillion.com/PDF/2013-LumenView-v-FindTheBest-PatentLitigation/2013.05.30-LVsDemandLetter.pdf
23 www.businessweek.com/articles/2013-09-17/troll-fighting-anatomy-of-a-patent-lawsuit 24 http://cdn.arstechnica.net/wp-content/uploads/2013/11/FTB.Lumenview.order_.pdf 25 Tekić, Z., Kukolj, D., Nikolić, Lj., Pokrić, M., Dražić, M., Vitas, M. (2012) SMEs, Patent Data and
New Tool for Business Intelligence, Proceedings of 5th International Conference for Entrepreneurship, Innovation and Regional Development ICEIRD, Sofia, pp 855 – 863, ISBN 978-954-07-3346-3, St. Kliment Ohridski University Press
26 Startup Shuts Down a Patent Troll, http://adlervermillion.com/blog/startup-shuts-down-a-patent-troll/
265
Proceedings of International Conference for Entrepreneurship, Innovation and Regional Development ICEIRD 2014
IMPROVING AND DEVELOPING THE QUALITY OF SME BUSINESS OPERATIONS AIMED AT THE ECONOMIC DEVELOPMENT OF THE REPUBLIC OF SERBIA
Srdjan Bogetić1, Zorana Antić2, Milka Ivanović3 Maja Đurica4
1Belgrade Business School, Kraljice Marije 73, Belgrade, Republic of Serbia, [email protected] 2Belgrade Business School, Kraljice Marije 73, Belgrade, Republic of Serbia, [email protected] 3Belgrade Business School, Kraljice Marije 73, Belgrade, Republic of Serbia, [email protected] 4Belgrade Business School, Kraljice Marije 73, Belgrade, Republic of Serbia, maja.djurica @bbs.edu.rs
Abstract
The authors of this paper are trying to call attent ion to the importance of productivity and innovation, both of which together affect the q uality of business operations in contemporary economy. Owing to the implementation o f new technologies, the application of the quality management system, as we ll as continual innovation incentives, we may speak of productivity and busine ss quality within an enterprise. The experience of developed countries has shown tha t small and medium-sized enterprises (SMEs) can be important for economic de velopment, as well as a driver of innovation. However, for the successful encourageme nt of innovation and productivity in the Republic of Serbia, a necessary prerequisite is the presence of institutions and government regulations supporting these activities. Keywords SME, business operations quality, innovation, QMS, productivity
1. Introduction
Innovation and the emergence of innovations are often considered as a prerequisite for entrepreneurship. In addition, economic policy makers and theorists for small companies often assume that small firms have a comparative advantage when it comes to certain types of industrial innovation. As innovators small businesses have some advantages over larger companies. These benefits are in fact related to behavior and are associated with the internal organization of activities and the way small businesses communicate with customers and markets. Flexibility, adaptability and speed are the basis for innovative advantages of small firms. However, small businesses are faced with some limitations. It is clear, taking into account the high percentage of small firms that do not innovate. Researching conducted on small firms consistently show that more than 40 % of companies do not introduce new

266
Proceedings of International Conference for Entrepreneurship, Innovation and Regional Development ICEIRD 2014
products or processes in the period covered by the survey - whether it is a innovation in the industry or just for the company. It seems that such restrictions or barriers to innovation are largely related to resource: skills, finance, information, etc. Therefore, the level of innovation in small firms, as the goal of development policy, is likely to require measures aimed at improving access to resources, that will also contribute to the preservation of organizational flexibility [1, p . 149-150 ].
However, for successful economic development of the national economy it's important to work on developing the quality of operations of small and medium-sized enterprises. Increasing the productivity of SME, the use of new technologies in the production process and the implementation of quality standards contribute to the development of the national economy. In these activities the state has a major role because through its support systems may help SMEs in accepting of necessary changes and their business.
A country’s competitiveness is a complex concept that has been widely studied from different perspectives. Given that the competitive performance depends on the formation of intellectual capital and society’s capacity to innovate, economic research has identified innovation and productivity as key engines for the increase of competitiveness. There are several alternatives approaches for measuring innovation, productivity, and competitiveness [2, p. 199].
2. Competitiveness as a prerequisite for economic d evelopment
In modern business conditions, is difficult to acquire, but easy to lose competitive ability. Rapid technological progress has enabled the technology is available to everyone in the world and at reasonable terms. On the other hand, the global economic crisis have clearly pointed to the fact it is necessary to develop new business models in order to establish competitiveness on the global market [3, p. 332].
The global depression has led to changes and transformations. Economic ones standing first on the list, socioeconomic, political and legal changes are eventuating consecutively in the world. According as ongoing the recession caused by the Global Crisis, decision units seek for increasing the level of savings in the economy hence productivity and competitiveness come into prominence. Increasing competition level in the world economy has important effects on the countries and firms. Both firms and countries adjust themselves against hard competition to survive [4, p. 453].
Structure of the Report of the World Economic Forum on Competitiveness, includes 12 pillars divided in three groups of parameters, each linked to the level of development of the country. Innovation and business sophistication are part of the third group of parameters. Measuring the development of the countries in this area is important because innovations significantly affect the economic development of countries. According Reinert [5, p. 55-56], it is necessary to understand that innovation and new knowledge is essential driving force in the history of economic development.
The level of innovation in a country significantly affects the competitiveness of the national economy, but in some countries is not used enough. As can be seen in Tables 1 and 2 level of competitiveness is not at the same level as the level of innovation. What is interesting is the fact that Switzerland is high in both categories.

267
Proceedings of International Conference for Entrepreneurship, Innovation and Regional Development ICEIRD 2014
Table 1 The level of innovation in the most competitive countries
Country Competitiveness rank Innovation rank Switzerland 1 2 Singapore 2 9 Finland 3 1 Germany 4 4 USA 5 7 Sweden 6 6 Hong Kong 7 23 Netherlands 8 10 Japan 9 5 United Kingdom 10 12
Source: World Economic Forum, The Global Competitiveness Report 2013-2014
Table 2 Competitiveness and innovation in the countries of South Eastern Europe
Country Competitiveness rank Innovation rank Bulgaria 57 105 Slovenia 62 40 Hungary 63 47 Montenegro 67 54 Macedonia 73 86 Croatia 75 79 Romania 76 97 Bosnia and Herzegovina 87 63 Serbia 101 112 Source: World Economic Forum,The Global Competitiveness Report 2013-2014
Tables 3 and 4 show the ratio of the SEE countries towards research and development, and how much the state invests in this area. It also gives a list of the top ten countries towards investing in research and development. As can be seen in Table 4, by investing in research and development Montenegro and Slovenia rank high compared to other countries in the region, while Bulgaria and the Republic of Serbia occupy the last two places. The Republic of Serbia is in last place in terms of investment in research and development.
Table 3 Investments in R&D of SEE countries
Country Rank Montenegro 54 Slovenia 62 Croatia 65 Bosnia and Herzegovina 86

268
Proceedings of International Conference for Entrepreneurship, Innovation and Regional Development ICEIRD 2014
Macedonia 91 Romania 104 Hungary 108 Bulgaria 107 Serbia 127
Source: World Economic Forum, The Global Competitiveness Report 2013-2014
According to the World Economic Forum (WFO) in the top five countries by investing in R&D, there are three country from Europe, the U.S. and one from Asia, and in the top ten countries most are from Europe (6) and from Asia.
Table 4 The top ten countries in the world by investment of the companies in R & D
Country Rank Switzerland 1 Japan 2 Finland 3 Germany 4 USA 5 Israel 6 Sweden 7 Singapore 8 Qatar 9 Denmark 10
Source: World Economic Forum,The Global Competitiveness Report 2013-2014
As we see in Table 4, Japan is ranked second in relation to the amount of their investment in research and development. However, the latest data from the market, points to the great problems Japan faces in the field of technology, although it has been technological giant recently. The reason for this lies in the fact that the leading companies in this field are in serious losses and fail to find a way to overcome this problem. As an example we can take the company Sony, which is a symbol of innovation in the field of technical devices. Sony is supposed to close 3,000 job positions, and let go 10,000 workers but even that will not be enough, because Sony like other Japanese manufacturers missed many trends lately. Attempts to buy in "panic" or collaborate with other companies, such as Ericsson (mobile) had resulted in the necessary change in the structure of the business. Also, all manufacturers have a dilemma about household appliances that have long been an important product for these companies. However, data from the market show that these companies are losing money on these products now, and through some savings are trying to make their products more accessible to its consumers.
The problem of Japanese companies is the fact that due to its failure to adjust to the market conditions they were not able to adequately respond to the growing competitors from South Korea and China, which significantly increased its share on the market.

269
Proceedings of International Conference for Entrepreneurship, Innovation and Regional Development ICEIRD 2014
Unlike Sony, successful companies such as Google, finds that the only way to keep its place of pioneer in this field is constant product innovation. This can largely be attributed to Google’s unique procedure for new product development, which is based on a number of small autonomous teams. Each of these teams is hoping to create something new in the field of search, or to create a new and irreplaceable service for Internet users. The logic of Google's loose interconnections and multi-faceted approach to the development of new products is simple: a host of flexible independent teams increases Google’s chance to stumbles on next revolutionary product [7, p. 121].
However, to improve the competitiveness of enterprises, it is essential aside from innovation, to apply the quality management system. The company, thanks to the implementation of certain international standards (eg. ISO 9001, ISO 14001, ISO 22000, HACCP, etc.), allows itself more efficient and productive operations and thus becomes more competitive on the market.
3. The role of innovation in improving the competit iveness of companies in the market of the Republic of Serbia
Competitive position of Serbian companies in terms of a good reputation in the world market is extremely bad. Serbian companies mostly do not invest in appropriate business efforts in building good reputation, though it is an element that influences their market position and competitive abilities [8, p. 10879].
According to the research of the Institute of Statistics (SORS) on the innovative activities of business entities in the Republic of Serbia for the period 2008-2010., on a sample of 3,982 business entities, the most of them is facing with innovation. Specifically, the total number of surveyed enterprises, 47.9 % has a participation in some form of innovation. When we talk about innovation, in Table 6 we can see that the big companies in this segment are dominant in relation to small and medium enterprises. Also, manufacturing companies devote more attention to innovation in relation to the service companies.
Report of the National Agency for Regional Development (NRDA) on the status, needs and problems of entrepreneurs in Serbia in 2013, on a sample of 2,500 surveyed MSPP (small and medium-sized companies and entrepreneurs), shows that every fifth company conducts its own innovative activities, and every sixth realizes innovative cooperation with other economic entities. The largest number of innovative companies operates within the surveyed small and medium enterprises. Innovative cooperation of the undertakings is greater in medium-sized enterprises. Innovative cooperation is most common between undertakings in the field of information technology (48 %) and intellectual services (30 %) [9, p. 37].
Table 5 Businesses of the Republic of Serbia according innovation business and the size of the market (2008-2010)
Total innovators business subjects that
did not innovate participation of innovators %
in total 12.141 5.812 6.329 47,9 Small businesses 9.347 4.143 5.204 44,3
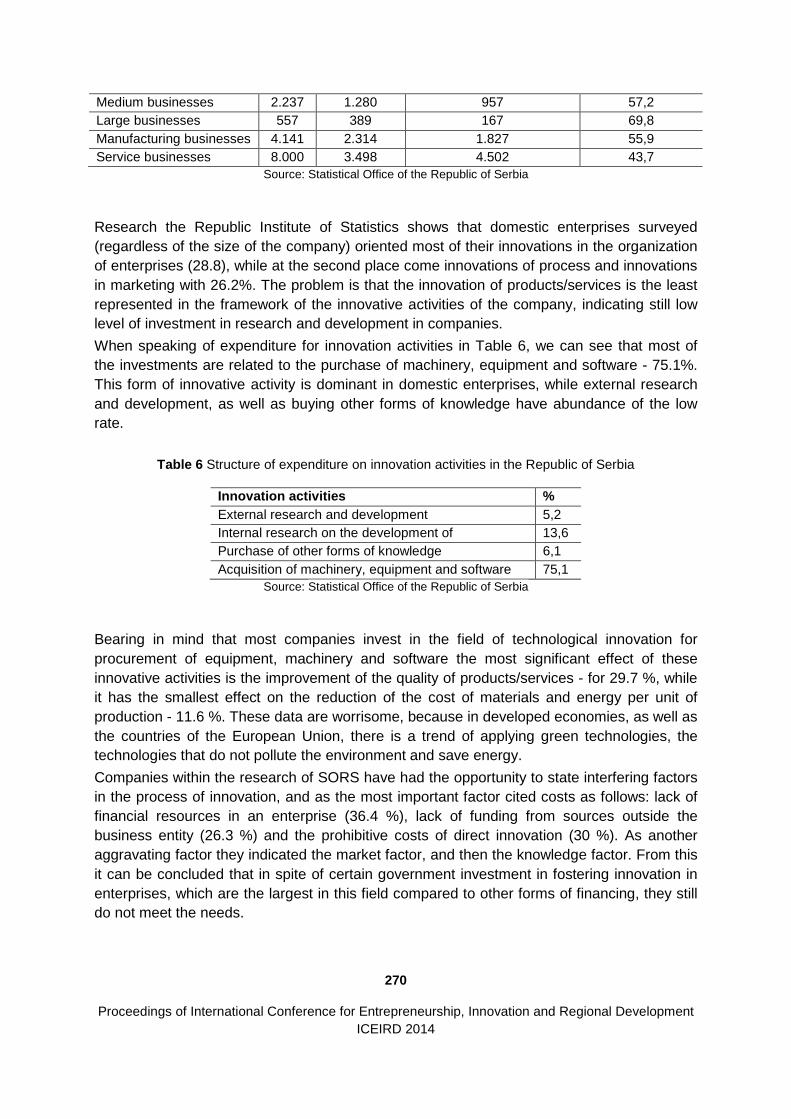
270
Proceedings of International Conference for Entrepreneurship, Innovation and Regional Development ICEIRD 2014
Medium businesses 2.237 1.280 957 57,2 Large businesses 557 389 167 69,8 Manufacturing businesses 4.141 2.314 1.827 55,9 Service businesses 8.000 3.498 4.502 43,7
Source: Statistical Office of the Republic of Serbia
Research the Republic Institute of Statistics shows that domestic enterprises surveyed (regardless of the size of the company) oriented most of their innovations in the organization of enterprises (28.8), while at the second place come innovations of process and innovations in marketing with 26.2%. The problem is that the innovation of products/services is the least represented in the framework of the innovative activities of the company, indicating still low level of investment in research and development in companies.
When speaking of expenditure for innovation activities in Table 6, we can see that most of the investments are related to the purchase of machinery, equipment and software - 75.1%. This form of innovative activity is dominant in domestic enterprises, while external research and development, as well as buying other forms of knowledge have abundance of the low rate.
Table 6 Structure of expenditure on innovation activities in the Republic of Serbia
Innovation activities % External research and development 5,2 Internal research on the development of 13,6 Purchase of other forms of knowledge 6,1 Acquisition of machinery, equipment and software 75,1
Source: Statistical Office of the Republic of Serbia
Bearing in mind that most companies invest in the field of technological innovation for procurement of equipment, machinery and software the most significant effect of these innovative activities is the improvement of the quality of products/services - for 29.7 %, while it has the smallest effect on the reduction of the cost of materials and energy per unit of production - 11.6 %. These data are worrisome, because in developed economies, as well as the countries of the European Union, there is a trend of applying green technologies, the technologies that do not pollute the environment and save energy.
Companies within the research of SORS have had the opportunity to state interfering factors in the process of innovation, and as the most important factor cited costs as follows: lack of financial resources in an enterprise (36.4 %), lack of funding from sources outside the business entity (26.3 %) and the prohibitive costs of direct innovation (30 %). As another aggravating factor they indicated the market factor, and then the knowledge factor. From this it can be concluded that in spite of certain government investment in fostering innovation in enterprises, which are the largest in this field compared to other forms of financing, they still do not meet the needs.
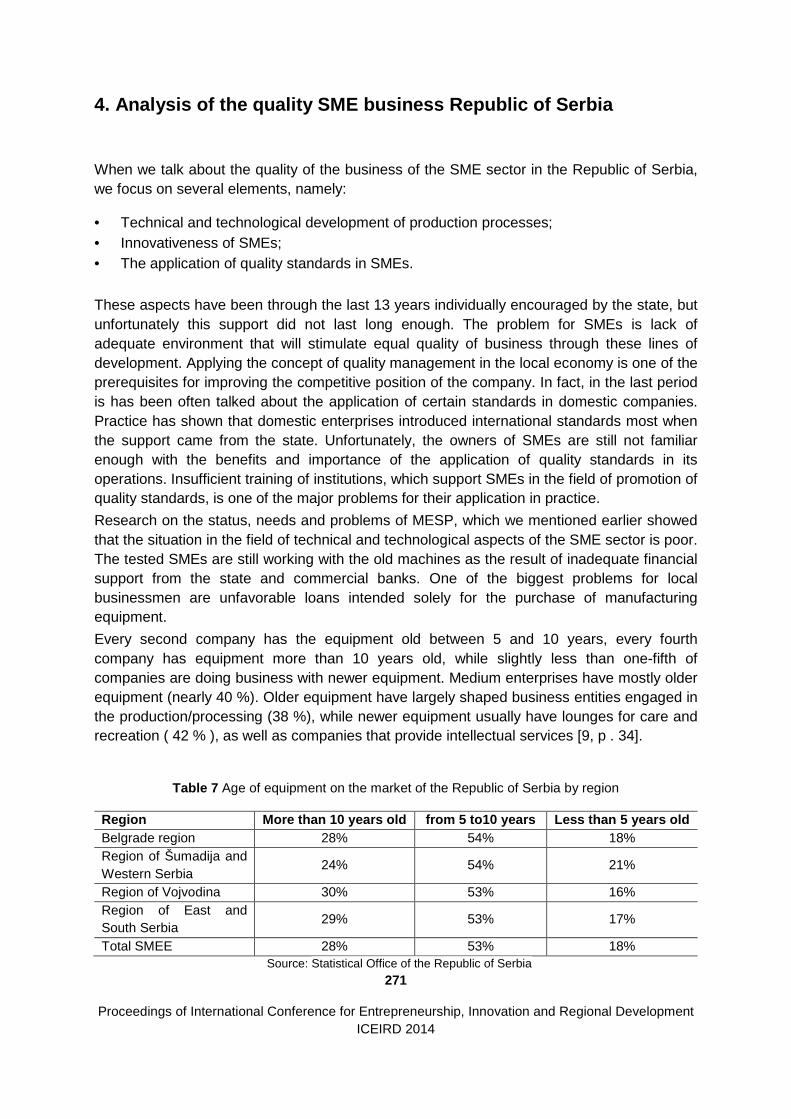
271
Proceedings of International Conference for Entrepreneurship, Innovation and Regional Development ICEIRD 2014
4. Analysis of the quality SME business Republic of Serbia
When we talk about the quality of the business of the SME sector in the Republic of Serbia, we focus on several elements, namely:
• Technical and technological development of production processes; • Innovativeness of SMEs; • The application of quality standards in SMEs.
These aspects have been through the last 13 years individually encouraged by the state, but unfortunately this support did not last long enough. The problem for SMEs is lack of adequate environment that will stimulate equal quality of business through these lines of development. Applying the concept of quality management in the local economy is one of the prerequisites for improving the competitive position of the company. In fact, in the last period is has been often talked about the application of certain standards in domestic companies. Practice has shown that domestic enterprises introduced international standards most when the support came from the state. Unfortunately, the owners of SMEs are still not familiar enough with the benefits and importance of the application of quality standards in its operations. Insufficient training of institutions, which support SMEs in the field of promotion of quality standards, is one of the major problems for their application in practice.
Research on the status, needs and problems of MESP, which we mentioned earlier showed that the situation in the field of technical and technological aspects of the SME sector is poor. The tested SMEs are still working with the old machines as the result of inadequate financial support from the state and commercial banks. One of the biggest problems for local businessmen are unfavorable loans intended solely for the purchase of manufacturing equipment.
Every second company has the equipment old between 5 and 10 years, every fourth company has equipment more than 10 years old, while slightly less than one-fifth of companies are doing business with newer equipment. Medium enterprises have mostly older equipment (nearly 40 %). Older equipment have largely shaped business entities engaged in the production/processing (38 %), while newer equipment usually have lounges for care and recreation ( 42 % ), as well as companies that provide intellectual services [9, p . 34].
Table 7 Age of equipment on the market of the Republic of Serbia by region
Region More than 10 years old from 5 to10 years Les s than 5 years old Belgrade region 28% 54% 18% Region of Šumadija and Western Serbia
24% 54% 21%
Region of Vojvodina 30% 53% 16% Region of East and South Serbia
29% 53% 17%
Total SMEE 28% 53% 18% Source: Statistical Office of the Republic of Serbia

272
Proceedings of International Conference for Entrepreneurship, Innovation and Regional Development ICEIRD 2014
From Table 7 it is clear that companies in Vojvodina and Eastern and Southern Serbia, are unfortunately, still using technology older than 10 years (30 %), indicating their lack of competitiveness and poor production. This raises the question of how such a companies can take care of their business when their quality in technology at the very beginning is worse compared to the competition. Companies from Šumadije and Western Serbia are using in their work process newer equipment (24 %).
Research has shown that the SME sector in the past three years had significantly invested into improvement of its operations. Of the total number of SMEs surveyed, 45 % had a significant investment, which is not a significant percentage, but it provides a good basis for future plans. According to the size of companies, those that invested the most are from medium (65 %) and small businesses (53 %). The focus of these investments is mostly oriented towards equipment 68 % and 27% of office space. The good side that showed in this research is the desire of even 53.3 % of SMEs for investment in the next three years, and this applies to the medium (71.3 %) and small businesses (59.2 %). Equipment (65 %) and office space (30 %) will still be required focus. What should worry the country is the fact that in the past, invested funds of planned investments for patents and licenses were only 4%.
The question of the implementation of quality standards in the SME sector is a serious problem. In fact, as we have already seen the total number of certified companies according to the version of ISO 9001 for the year 2012 was 3,066 companies, which is extremely low compared to neighboring countries. Therefore it is no surprise that out of the total number of SMEs 23% are applying, and only 10 % plan to apply new standards of quality. These data indicate that support in this area was insufficient, although at one time there was a financial support of the Ministry of Agriculture of the Republic of Serbia. Statistically, medium enterprises are the most often engaged in the implementation of quality standards (58 %), which is 10 % higher than the previous year, followed by the representation of small businesses - 33%. Unfortunately, when we talk about the plans for the introduction of new standards of quality, only 27 % of medium enterprises plan to improve their business processes in the future. The most used Quality standards are ISO 9001 and HACCP.
Companies that have certificates are usually those that deal with the production/ processing (37 %), information technology (32 %) and catering industry (28 %), and those that deal with recycling (4 to 6 surveyed companies). Unlike other economic activities, a large number of companies involved in the catering industry are certified with HACCP [9, p. 36]. The reason for the presence of HACCP lies in the fact that is obligatory by law for all companies involved in the production of food, regardless of size.
Conclusions
SMEs play an important role in the economic development of the Republic of Serbia and in this sense it is necessary to encourage the improvement and development of their business. The local SMEs encounter in practice with unfinished business environment that discourages and prevents them to have an active role in improving the quality of its operations. This applies particularly to inadequate credit policy of the government and its financial institutions and commercial banks, which thus prevents SMEs purchase of new equipment intended to increase their productivity and efficiency.

273
Proceedings of International Conference for Entrepreneurship, Innovation and Regional Development ICEIRD 2014
Also, a serious problem is the unwillingness of owners of SMEs to implement quality standards due to lack of awareness of the benefits that their use brings to their business, and the lack of involvement of institutions for standardization in the field of intensive promotion of those standards among entrepreneurs and SMEs. Innovation is very important both for companies and for the economy. However, State must stimulate this through the creation of an environment for research and development of new products or services. According to the national Statistics of SMEs in Serbia invest very little in innovation because of distrust of those companies in market mechanisms and because of the lack of involvement of the state in encouraging the creation of innovation in the local economy. One solution is the creation of special credit lines to encourage innovative activities in SMEs, but also by stimulating creating the association of SMEs in clusters and greater cooperation with universities and institutes that will provide to the companies what they need the most - knowledge.
References
1. Dreakins D., Freel M, Entrepreneurship and small firms, DATA STATUS, Belgrade, 2012. 2. E. Carayannis, E. Grigoroudis, Linking innovation, productivity, and competitiveness: implications
for policy and practice, The Journal of Technology Transfer, April 2014, Volume 39, Issue 2, pp 199-218
3. Đorđević D., Ćoćkalo D., Bogetić S., The analyses of competitive ability of domestic companies in the light of new global trends, International Journal “Total Quality Management & Excellence“, Vol. 38 No, 1, 2010., pp. 332-335
4. Sefer Şener, The competitiveness of Turkish economy within the scope of WEF Global Competitiveness Index, Procedia - Social and Behavioral Sciences 75 (2013), pp. 453 – 464
5. Rejnert Erik, Spontant kaos, Čigoja press, Belgrade, 2009 6. World Economic Forum, The Global Competitiveness Report 2013-2014 7. Gary Hamel,The Future of Management, ASEE, Novi Sad, 2007 8. Djordjević D, Ćoćkalo, Sajfert Z, Bogetić S., Klarin M., Competitive abilities and students’
entrepreneurial behaviour,The research results from Serbia, African Journal of Business Management Vol. 5(26), pp. 10878-10884, 28 October, 2011, Available online at http://www.academicjournals.org/AJBM,
9. Istraživanje o stanju, potrebama i problema preduzetnika (MSPP) u Srbiji, http://narr.gov.rs (poslednja poseta 15.02.2014)
10. Indicators of innovative activities in the Republic of Serbia, 2008-2010, National Bureau of Statistics, No. 347, Vol. LXI, 30.12.2011


275
PATHWAYS TO FUNDING – FINANCIAL TOOLS


277 Proceedings of International Conference for Entrepreneurship, Innovation and Regional Development
ICEIRD 2014
Crisis, Co-Financing, and Crowdfunding: Igniting Regional Development.
Thomas Müllerleile1, Dieter William Joenssen2, Andreas Müllerleile3 1Ilmenau University of Technology, Helmholtzplatz 3, Ilmenau, Germany, [email protected]
2Ilmenau University of Technology, Helmholtzplatz 3, Ilmenau, Germany, [email protected]
3Loughborough University, Epinal Way, Leicestershire, United Kingdom, [email protected]
The economic crisis’ impact on the Eurozone is bein g felt especially in structurally weak regions due to public investment reductions. T his reduction further accelerates the rural exodus, gentrification, and emigration, w hich in turn leads to further reductions in public investments. Parallel to this development, public investments have seen public support waning, e.g., Stuttgart 21 . These two problems are archetypical for challenges that public investors m ust overcome in the future. Crowdfunding may offer solutions to both challenges . This paper offers insights into possible applications of Crowdfunding in conjunctio n with EU co-financing schemes for regional development. Further, the proposed sch eme’s potential is calculated for selected eastern German districts.
Keywords broadband, crowdfunding, EU co-financing schemes, public support, regional development
1. Motivation
The economic crisis in the late 2000s has had a lasting impact on the economy, policy making and the society in many countries [1]. Turmoil on the financial markets, caused by the sub-prime crisis, recession, and incorrect bookkeeping by some European Union (EU) member states, hindered many EU member states in refinancing their debt. As a result, the EU and the IMF implemented austerity measures and stability mechanisms for the affected states. While several states are now in the position again to refinance their debt on the open market, the crisis has not yet been fully solved. The austerity measures may help the countries in organizing their finances, but at the same time economic growth and innovation is reduced through cuts in public spending [2]. This results in severe consequences for the society in the affected countries, such as further disenchantment with politics, rural exodus, migration of skilled labor, and euro skepticism throughout the EU. These problems may be ameliorated by economic development in structurally weak regions. However, countries affected by the austerity measures are unable to provide public project funding needed for economic recovery. At the same time there has been a prominent debate amongst the EU member states in respect to the spending capacity (absorption capacity) of funds allocated under the EU cohesion policy. Absorption capacity can be defined as “the extent to which a country is

278 Proceedings of International Conference for Entrepreneurship, Innovation and Regional Development
ICEIRD 2014
capable of effectively and efficiently spending its Structural Funds allocation, and is expressed in percentage of the total allocation” [3]. Current co-financing schemes of the EU’s cohesion policy dictate a matching of EU funds by member states or regional authorities, to which a low absorption rate may be partially attributed. Data compiled by the European Commission (Figure 1) shows that the “absorption capacity” is a problem across the EU, even countries such as the Netherlands seem to struggle with matching EU funds. Somewhat unsurprisingly, the absorption capacity of countries that are hardest hit by the economic crisis, such as Greece, Ireland, Cyprus, and Italy, are relatively low. In addition, a second group of countries with a low absorption capacity, consisting of countries that joined the EU in the latest enlargement rounds (Romania, Bulgarian, Czech Republic, Slovakia, Latvia, Malta), exists. Further, reasons for the low absorption capacity of some EU member states are diverse, and can be linked to the economic crisis or insufficient administrative capacity in the matching authorities [4]. In response to this, the cohesion policy framework has already responded with several regulatory amendments on the EU level, increasing the flexibility within funding streams on the national and regional level. However, the real impact of the economic crisis may only become visible in the 2014-2020 funding period, as austerity measures are often spread over several budgets and are progressively implemented over several years.
Figure 1: Percentage of project selection (2007-11) and paid expenditure (2007-Jan. 2013) [5]
Further, large, publically funded projects garner a disproportionate amount of attention from decision makers and the media. Thus, decision makers come under heavy public pressure to approve funding for big infrastructure projects, such as S21, which resulted in major budget overspending and political scandals [6]. However, these projects are partially rejected by the public, because the projects don’t cater to the needs of the regional population, or feature questionable price performance ratios, e.g., the infamous “bridge to nowhere” in Alaska. This rejection leads to distrust in public infrastructure projects. In turn, several e-government initiatives were conceived to include the public in the decision process. For example, the city of Cologne offers its citizen a web-platform to propose smaller infrastructure projects, such as new playground, and vote for them [7]. These extant problems, public distrust in funding allocation mechanisms, low absorption rates, and lack of funding by regional and national authorities, may be partially addressed by a crowdfunding based co-financing scheme. To this end, this paper introduces crowdfunding as a concept, gives a brief overview of the EU cohesion policy, and discusses how crowdfunding may be integrated in this policy as a new co-financing scheme. Potential of this new co-financing approach for structurally weak regions is demonstrated in a scenario considering eastern Germany. Insights gained are presented and discussed in the final section.

279 Proceedings of International Conference for Entrepreneurship, Innovation and Regional Development
ICEIRD 2014
2. Crowdfunding as a Co-Financing Scheme
The following Section 2.1 gives an overview and definition of crowdfunding to establish a required, common terminology. This is complemented by a short introduction in Section 2.2 to the EU cohesion policy. The established concepts are then used in Section 2.3 to discuss the integration possibilities for crowdfunding into various levels of the existing EU cohesion policy.
2.1 Definition of Crowdfunding
Crowdfunding has received much media attention in the last years. The concept of crowdfunding in itself is well established and has only now seen such a boon due to the facilitation of communication technology. The notion of integrating stakeholders in the financing process and soliciting their input in the decision process is as old as the East India companies. Crowdfunding can be considered “[…] a process where commercial or non-commercial projects are initiated in a public announcement by organizations or individuals to receive funding, assess the market potential, and build customer relationships. Pledgers may then contribute individual amounts of monetary or non-monetary resources, during a specified time-frame, using offline or online campaign platforms that utilize different pay-out schemes, in exchange for a product specific or unspecific, material or immaterial reward” [8]. While the main application area of Crowdfunding is currently in consumer goods, the principle may be seamlessly applied to infrastructure projects. An extraordinary example of this is a successful project to connect remote villages in England with broadband internet (internet access with a communication bandwidth greater than one Gigabit per second) [9]. Crowdfunding was necessary, because telecom operators refused development, citing high expected costs and uncertain demand. Financing was achieved through a mixture of monetary and non-monetary, e.g., property access and contractor services, resources contributed by the stakeholders. Through the application of crowdfunding, the communities were able to increase the standard of living and economic prospects. By now, broadband internet constitutes an important factor for public participation and economic growth by improving locational factors [10], and attracting new companies. It can be argued that without this initiative, the residents would still not have broadband internet access. Therefore, crowdfunding may be an applicable alternative to finance infrastructure projects if companies are unwilling or public sector entities are unable to provide adequate funding. This is especially true for countries where austerity measures are implemented.
2.2 EU Cohesion Policy
The cohesion policy of the EU is a policy framework that aims to reduce economic disparities between Europe's regions. The policies principle is to promote convergence between regions, boost regional competitiveness, employment, and increase European territorial cooperation. The cohesion policy is “the EU's only explicitly redistributive policy” [1] and amounts to 35.7 % of the total EU budget or 348bn € between 2007 and 2013 [11]. The European Commission itself defines the policy as “an investment policy [that] supports job creation, competitiveness, economic growth, improved quality of life and sustainable development” [12]. Despite the focus on regional disparities, the scope of the cohesion policy has changed over the years and now also includes macroeconomic aims linked to the Lisbon Agenda or Euro membership. The cohesion policy framework consists of five main structural and investment funds: the European Regional Development Fund (ERDF), the European Social Fund (ESF), the Cohesion Fund (CF), the European Agricultural Fund for Rural Development (EAFRD) and

280 Proceedings of International Conference for Entrepreneurship, Innovation and Regional Development
ICEIRD 2014
the European Maritime and Fisheries Fund (EMFF). The ERDF and the ESF are designed for regions with a per capita GDP below 75 % of the EU average; the CF is aimed at countries whose per capita GNI is below 90 % of the EU average. All funds have different aims and different eligibility criteria, but all projects funded through those funds need national co-financing. The cohesion policy follows several distinct principles that can explain the purpose and functioning of the policy. The policy programming takes place in strategic, multi-annual plans (the latest funding period covers 2014-2020) in which strategic priorities are set. Although the focus lies on the least developed regions, some elements of the EU cohesion policy apply to more developed regions. One of the main principles of the policy is “additionality”, also known as the co-financing principle where EU funding needs to be matched by funding provided by national and regional actors (normally 40 – 50 % of any given project). The planning, implementation, and monitoring of cohesion policy follow a “shared management” approach that involves the European Commission and member state authorities.
2.3 Prospects for Crowdfunding in the EU's cohesion policy
Possibilities for integrating crowdfunding in the EU’s cohesion policy may fundamentally exist on two layers. These levels, the EU level and the regional level, are analyzed in following to identify these possibilities.
The EU Level
The policy cycle on the EU level, which takes place every seven years, is mainly focused on the strategic direction of the framework and does not necessarily include the detailed implementation rules at the regional level. The budget for the all structural fund is decided by the Council and European Parliament, on the basis of a proposal from the Commission; the Commission also proposes the strategic guidelines for the cohesion policy. Each member state then prepares a “National Strategic Reference Framework” (NSRF), which contains a list of operational programs (OP). The European Commission validates both, the NSRF and each of the OP. Member states and their regional authorities have to implement the programs. However, there is some flexibility for each managing authority regarding the rules of the implementation. Based on the NSRF and the OPs, the European Commission commits the expenditure and pays the allocated expenditure to each member state. Monitoring is carried out by the Commission as well as the member states. Succinctly stated, the EU level is mainly concerned with the overall strategic direction, the allocation of funds towards the regional level, technical assistance, and general rules of how to access structural funds. There have been some encouraging reforms that could have a positive effect on new funding mechanisms and could be the basis to include crowdfunding elements in the next funding period 2020-2027. The reforms implemented for the 2014-2020 funding period include a standard rulebook for financial management of all funds as well as more use of digital technology and general simplification of operational procedures. These reforms are hoped to increase absorption of EU funds and allow a more effective use of the available funding. The new funding framework for 2014-2020 also introduces a more non-prescriptive policy (in terms of sectors, beneficiaries, etc.) and a new range of implementation options. In the previous funding period between 2007 and 2013, the European Commission developed four “special support instruments” that provided technical assistance and facilitated links to additional funding: JASPERS (technical assistance for new EU member states), JEREMIE (support for SMEs to access structural funds), JESSICA (support for urban development), and JASMINE (support for micro-finance institutions). In 2014-2020 these schemes will be streamlined in the new Technical Assistance Platform (TAP). Both the new focus on flexibility within the financial instruments and the development of a technical assistance platform could

281 Proceedings of International Conference for Entrepreneurship, Innovation and Regional Development
ICEIRD 2014
be a potential opening for the promotion of crowdfunding solutions, possibly in the next funding period. If crowdfunding solutions were included as an option in the existing cohesion policy, the EU could provide technical assistance, share best practices and develop guidelines how to manage the process. Including crowdfunding in the general rules of the cohesion policy would be more limited in scope. An inclusion in this area would introduce more uncertainty in the financial management, which in turn could have a negative impact on absorption capacity. In essence, projects that lack funding, but could be funded through crowdfunding campaigns would need to be considered. The ability of present structures to facilitate this is unclear. Introducing new finance possibilities would add to the complexity of the cohesion policy, as project proposals are normally approved only with a sound budget proposal. However, crowdfunding by its very nature is an expression of the stakeholders’ needs, which may not equate to a sound budget. Changes to the general rules, acknowledging this new level of uncertainty about the funding process, would thus require significant political will. A more ambitious crowdfunding agenda could involve a separate crowdfunding scheme independent from existing program management structures. Here, the EU could develop a new funding instrument and an online platform to facilitate crowdfunding co-financing. This crowdfunding possibility would require a new funding line, a new rulebook, and could already be implemented for the next funding period. The new EU crowdfunding scheme would allow citizens and regional actors to directly interact with EU funds and crowdfund the regional or national co-financing part. However, this would, by its very nature, cut out the managing authority and greatly increase the direct influence of EU citizens on the EU cohesion funding. This ambitious crowdfunding agenda would require significant political will not only in the European Commission, but would also require the consent of all EU member states in the Council. It could however provide an innovation boost in the EU's cohesion policy and tackle the absorption problem of the existing policy.
The Regional Level
Given the level of complexity on the EU level, and the significant political will required, crowdfunding may need to start on the regional level. A simpler strategy focusing on the regional level, requiring consent by less administrative authorities may be a more promising strategy. Individual projects are designed by regional actors and then submitted to the regional managing authority. The detailed management of programs under the various structural funds is the responsibility of the member states. For every program, member states have to authorize a managing authority, which will be in charge of the specific projects and monitor general implementation. It is important to note that “national co-financing does not have to be paid to the financial instrument upfront but may be provided at later stages of financial instrument implementation. It has to be provided before the end of the eligibility period” [7]. This gives regional actors flexibility when organizing their part of the funding. Two participatory elements could be implemented without changing the overall framework of cohesion policy. First, regional actors could include crowdsourcing processes in the consultation phase of projects and programs. Processes could include the public in selection and prioritization of projects. This would increase the sense of ownership among the public. As a positive by product the general aims of the cohesion policy to develop “collaborative policy networks” or “local enterprise partnerships” would be supported. Second, regional actors could start crowdfunding processes without changing the general framework of cohesion policy. In order to be eligible for structural funds, projects need to be developed and funded well before application deadlines. This could be done with minimal administrative and legal changes on the regional level. The changes need only ensure that the managing authority accepts the basic principles of crowdfunding. However, this option requires local and regional actors to develop a thorough planning process, put additional effort into the project management, and could lead to develop additional administrative capacity.

282 Proceedings of International Conference for Entrepreneurship, Innovation and Regional Development
ICEIRD 2014
Notwithstanding, these requirements would lessen with every region wishing to adapt their process, as a best practices and technology standards could easily be established and shared among the managing authorities.
3. Co-Funding Potential: Eastern German Broadband
So far, the potential for integrating crowdfunding in the EU cohesion policy and the abstract benefits, which this integration would offer, have been discussed. In following, a scenario, considering three eastern German districts, is examined. Scenario construction aids in the understanding, due to the plastic representation of information and development of knowledge through the evaluation of examples. The analysis of the presented situations, using high quality data, where uncertainties are well defined, simplifies the analysis of future cases with larger uncertainties.
Figure 2 Disparity in available income and population density, Germany.
Districts in eastern Germany were selected, because eastern Germany combines some particular characteristics needed for an effective scenario. On the one hand, Germany’s reunification at the end of the previous century makes it a sort of microcosm of the EU at large. Several types of disparity extant within the EU, which the EU cohesion policy seeks to remedy, also exist within Germany. Even 25 years after the Iron Curtain’s demise, several disparities remain. First and foremost, there exists a substantial difference in available income between east and west Germany (cf. Figure 2, left). Second, there exists a sizeable east-west gradient in population density (cf. Figure 2, right). This gradient grows each year due to a rural exodus, which is especially detrimental because eastern Germany has relatively few urban centers. Both points combined suffice to discourage infrastructure investments, because low incomes and negative population growth result in less profitable investments and larger investment risks, respectively. On the other hand, many, high quality statistics are freely available at relatively low aggregation levels for Germany as a whole. This degree of accessibility is not offered by many European countries, and greatly facilitates the reproducibility of the study.
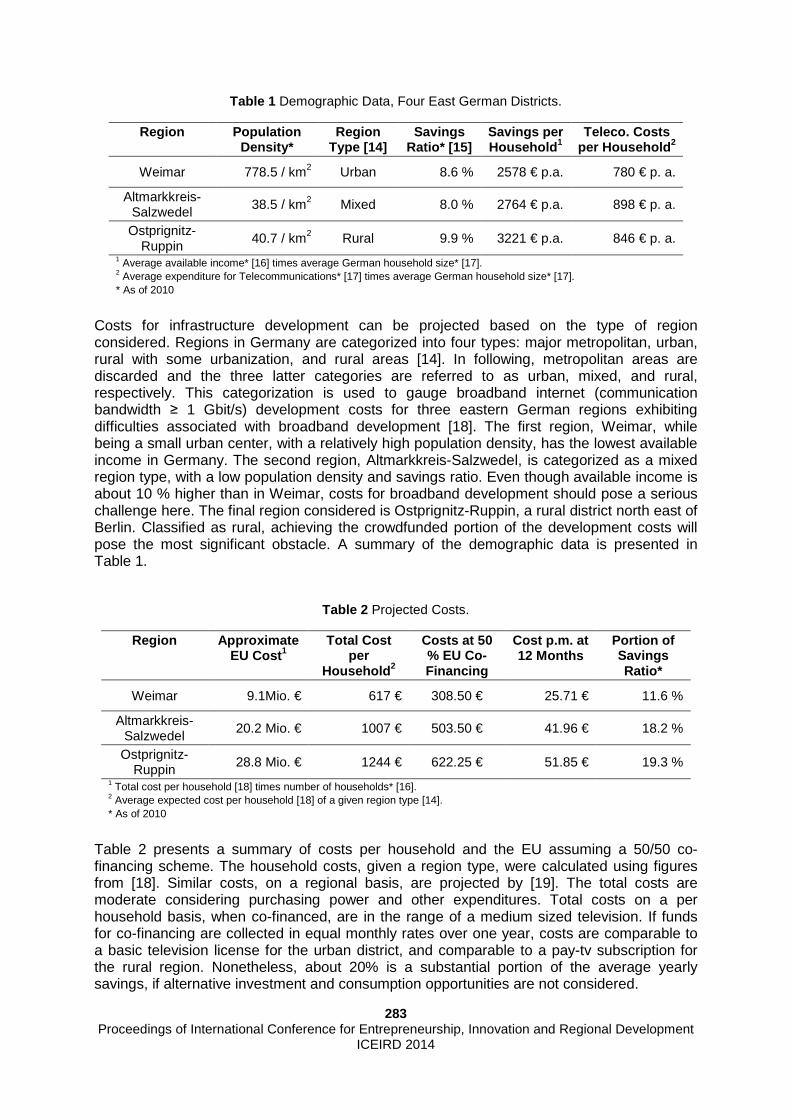
283 Proceedings of International Conference for Entrepreneurship, Innovation and Regional Development
ICEIRD 2014
Table 1 Demographic Data, Four East German Districts.
Region Population Density*
Region Type [14]
Savings Ratio* [15]
Savings per Household 1
Teleco. Costs per Household 2
Weimar 778.5 / km2 Urban 8.6 % 2578 € p.a. 780 € p. a.
Altmarkkreis-Salzwedel
38.5 / km2 Mixed 8.0 % 2764 € p.a. 898 € p. a.
Ostprignitz-Ruppin
40.7 / km2 Rural 9.9 % 3221 € p.a. 846 € p. a. 1 Average available income* [16] times average German household size* [17]. 2 Average expenditure for Telecommunications* [17] times average German household size* [17]. * As of 2010
Costs for infrastructure development can be projected based on the type of region considered. Regions in Germany are categorized into four types: major metropolitan, urban, rural with some urbanization, and rural areas [14]. In following, metropolitan areas are discarded and the three latter categories are referred to as urban, mixed, and rural, respectively. This categorization is used to gauge broadband internet (communication bandwidth ≥ 1 Gbit/s) development costs for three eastern German regions exhibiting difficulties associated with broadband development [18]. The first region, Weimar, while being a small urban center, with a relatively high population density, has the lowest available income in Germany. The second region, Altmarkkreis-Salzwedel, is categorized as a mixed region type, with a low population density and savings ratio. Even though available income is about 10 % higher than in Weimar, costs for broadband development should pose a serious challenge here. The final region considered is Ostprignitz-Ruppin, a rural district north east of Berlin. Classified as rural, achieving the crowdfunded portion of the development costs will pose the most significant obstacle. A summary of the demographic data is presented in Table 1.
Table 2 Projected Costs.
Region Approximate EU Cost 1
Total Cost per
Household 2
Costs at 50 % EU Co-Financing
Cost p.m. at 12 Months
Portion of Savings Ratio*
Weimar 9.1Mio. € 617 € 308.50 € 25.71 € 11.6 %
Altmarkkreis-Salzwedel
20.2 Mio. € 1007 € 503.50 € 41.96 € 18.2 %
Ostprignitz-Ruppin
28.8 Mio. € 1244 € 622.25 € 51.85 € 19.3 % 1 Total cost per household [18] times number of households* [16]. 2 Average expected cost per household [18] of a given region type [14]. * As of 2010
Table 2 presents a summary of costs per household and the EU assuming a 50/50 co-financing scheme. The household costs, given a region type, were calculated using figures from [18]. Similar costs, on a regional basis, are projected by [19]. The total costs are moderate considering purchasing power and other expenditures. Total costs on a per household basis, when co-financed, are in the range of a medium sized television. If funds for co-financing are collected in equal monthly rates over one year, costs are comparable to a basic television license for the urban district, and comparable to a pay-tv subscription for the rural region. Nonetheless, about 20% is a substantial portion of the average yearly savings, if alternative investment and consumption opportunities are not considered.
284 Proceedings of International Conference for Entrepreneurship, Innovation and Regional Development
ICEIRD 2014
4. Conclusion
The present paper introduces a new financing scheme by linking crowdfunding to EU co-financing. The potential of this new approach is demonstrated using data from three districts in eastern Germany. 25 years after reunification these districts still struggle to ignite growth and fight rural exodus. Therefore, they can be considered archetypical for other structurally weak EU regions. Broadband development is selected as an exemplary topic for contemporary infrastructure development projects, suitable for crowdfunded co-financing. Crowdfunding as a policy could be implemented on both EU levels of the cohesion policy. Changing the existing mechanisms would be challenging, but feasible. Currently, the existing mechanisms on the EU level are not designed to accommodate crowdfunding solutions and new mechanisms integrating crowdfunding in the cohesion policy framework should be established. The regional level is more flexible and the potential for establishing crowdfunding inside currently available structures is greater, as regional procedures need to comply with national frameworks. The efforts of integrating crowdfunding at any level would boost feelings of ownership and responsibility for citizens involved in the crowdfunding. Further positive effects could include less skepticism towards politics or the EU. Additionally, projects funded by crowdfunding tackle specific needs of the community and are therefore less prone to misallocation of taxes. Further benefits of using crowdfunding in EU projects include advantages from economies of scale and the facilitation of cooperation under the EU cohesion policy framework. The scenario showed that crowdfunding in conjunction with EU co-financing is indeed a suitable instrument for infrastructure projects. Projects, such as presented in the paper, can ignite growth and increase the standard of living. Many more project types that can be successfully co-financed with crowdfunding may exist at various levels, in almost all EU regions. Some important limitations should be considered in reaching conclusions from this paper. The goal of the crowdfunding effort in the examples is to provide internet access by installing fiber optic cables. Inevitably, property rights, maintenance cost handling, and the formation of a suitable legal entity have to be discussed. Further, the crowdfunding effort’s financial type was not considered. On the one hand, it may be argued that financing the crowdfunding project equates to consumption, as would be the case for connection fees for conventional telecommunications. On the other hand, it can be reasoned that financing should be considered an investment. The common ground found in this discussion would determine whether the relative costs of the crowdfunding should be considered high or low by the households. Estimates for financing should be considered conservative. The data, stemming from 2010, is still largely affected by the 2008 recession. Since then, personal incomes have grown in Germany. Thus, the costs, relative to savings, have declined. The telecommunication costs have also declined, freeing up more capital for consumption. Further, broadband network development is heavily dependent on regional factors and technology used. More recent data, which includes the price declines that have occurred in the field since 2008, will result in a better price performance ratio of the project. In the presented scenario only households were considered. Additionally, the inclusion of businesses, which are normally more concentrated and exhibit more negotiating and purchasing power, into the analysis could also influence the calculation’s outcome positively. In future research, macroeconomic aspects of utilizing crowdfunding to co-finance EU investments could be considered. Possible positive impacts of the proposed scheme on deflation risks, by increasing the gross private domestic investments, could be investigated. Further research could also highlight aspects of accounting and taxation for crowdfunded infrastructure projects.

285 Proceedings of International Conference for Entrepreneurship, Innovation and Regional Development
ICEIRD 2014
References
1 Allen D. The structural funds and cohesion policy. In: Wallace H, Pollac MA, Young AR, editors. Policy-making in the European Union. Oxford University Press; 2010. p. 230-252.
2 Pescatori A, Leigh Dl, Guajardo J. Expansionary Austerity New International Evidence. IMF Working Papers [serial on the Internet]. 2011 [cited 2014 Mar 27]; [about 40 p.]. Available from: http://ssrn.com/abstract=1886910.
3 Library of the European Parliament. The (low) absorption of EU structural funds. Library Briefing 1/10/2013 [serial on the Internet]. 2013 [cited 2014 Mar 27]; [about 6 p.]. Available from: http://www.europarl.europa.eu/eplibrary/The-low-absorption-of-EU-Structural-Funds.pdf.
4 Healy A, Bristow G. Economic crisis and the structural funds. ESPON 2013 Article [serial on the Internet]. 2013 [cited 2014 Mar 27]; [about 12 p.]. Available from: http://www.espon.eu/export/sites/ default/Documents/Press/PressReleases/2013-Article/OD-ECR2-article_Economic-Crisis-and-the-Structural-Funds.pdf
5 European Commission. Cohesion policy: Strategic report 2013 on programme implementation 2007-2013. 2013 [cited 2014 Mar 27]. Available from: http://ec.europa.eu/ regional_policy/how/policy /doc/strategic_report/2013/strat_report_2013_en.pdf
6 Novy J, Peters D. Railway megaprojects as catalysts for the re-making of post-industrial cities? The case of Stuttgart 21 in Germany. Res Urban Soc. 2013; 13: 237-262.
7 City of Cologne [homepage on the Internet, cited 2014 Mar 27]. Available from: https://buergerhaushalt.stadt-koeln.de/.
8 Müllerleile T, Joenssen DW. Key success-determinants of crowdfunded projects: an exploratory analysis. In: Bock HH, Gaul W, Vichi M, Weihs C, editors. Studies in classification, data analysis, and knowledge organization. Springer; 2014. (accepted)
9 Cellan-Jones R. Fast fibre: a community shows the way. BBC News. 2013 Feb 14 [cited 2014 Mar 27]. Available from: www.bbc.co.uk/news/technology-21442348.
10 Czernich N, Falck O, Kretschmer T, Woessmann L. Broadband infrastructure and economic growth. Econ J. 2011; 121: 505-532.
11 European Commission [homepage on the Internet]. Financial framework 2007-2013 [cited 2014 Mar 12]. Available from: http://ec.europa.eu/budget/figures/fin_fwk0713/fwk0713_en.cfm#cf07_13.
12 European Commission [homepage on the Internet]. What is regional policy? [cited 2014 Mar 27]. Available from: http://ec.europa.eu/regional_policy/index_en.cfm
13 European Commission. Financial instruments in ESIF programmes 2014-2020 - A short reference guide for Managing Authorities. EC Working Document Ref. Ares (2014) 401557 [serial on the Internet]. 2014 [cited 2014 Mar 27]; [about 19 p.]. Available from: http://ec.europa.eu /regional_policy/thefunds/fin_inst/pdf/fi_esif_2014_2020.pdf.
14 German Federal Institute for Research on Building, Urban Affairs and Spatial Development [homepage on the Internet]. BBSR Homepage - Siedlungsstrukturelle Kreistypen - Laufende Raumbeobachtung – Raumabgrenzungen [cited 2014 Mar 27]. Available from: http://www.bbsr.bund.de/cln_032/nn_1067638/BBSR/DE/Raumbeobachtung/Raumabgrenzungen/Kreistypen4/kreistypen.html
15 Federal Statistical Office and the statistical Offices of the Länder [homepage on the Internet]. Regional Accounts VGRdL, Savings ratio of private households in Germany by Bundesländer [cited 2014 Mar 27]. Available from: http://www.vgrdl.de/Arbeitskreis_VGR/tbls/tab.asp?tbl=tab15#tab05
16 Federal Statistical Office and the statistical Offices of the Länder [homepage on the Internet]. “Regionaldatenbank Deutschland” Database [cited 2014 Mar 27]. Available from: https://www.regionalstatistik.de/.
17 German Federal Statistical Office [homepage on the Internet]. GENESIS-Online Database [cited 2014 Mar 27]. Available from: https://www-genesis.destatis.de/.
18 Analysys Mason. Final report for the Broadband Stakeholder Group: The costs of deploying fibre-based next generation broadband infrastructure, Final report. 2008 [cited 2014 Mar 27]. Available from: http://www.broadbanduk.org/wp-content/uploads/2012/08/http___www-broadbanduk6.pdf.
19 Broadband for the Rural North Ltd. B4RN Business Plan, v5.2. 2013 [cited 2014 Mar 27]. Available from: http://b4rn.org.uk/wp-content/uploads/2011/11/B4RN-Business-Plan-v5-2.pdf

286 Proceedings of International Conference for Entrepreneurship, Innovation and Regional Development
ICEIRD 2014
Emerging VC industry: do market expectations play the most important role in project selection? Evidence on Russian data
Ivan Rodionov1, Alexander Semenov2, Eleonora Gosteva3, Ekaterina Eremeeva4 1NRU HSE, 26 Shabolovka st., bl.3, Moscow, Russia, [email protected]
2NRU HSE, 26 Shabolovka st., bl.3, Moscow, Russia, [email protected]
3NRU HSE, 26 Shabolovka st., bl.3, Moscow, Russia,[email protected]
4NRU HSE, 26 Shabolovka st., bl.3, Moscow, Russia,[email protected]
Currently, the venture capital becomes more and mor e advanced and effective source of the innovation project financing, connected with a high risk level. In the developed countries it plays a key role in transforming innov ation projects into successful businesses and creating prosperity of the modern ec onomy. Actually in Russia there are many necessary preconditions for creation of th e effective venture investment system: the network of the public institutes for in novation financing operates, there is a significant number of the small and medium-sized enterprises, capable to sell production with good market potential. However the current system does not confirm the necessary level of efficiency in practice that can be substantially explained by the absence of the accurate plan of action to form the national venture model and by the lack of experience of successful venture deals with profitable exits in Russian economy. This paper studies the influence of variou s factors on the venture industry development by the example of the IT-sector in Russ ia. The choice of the sector is based on the fact, that this segment is the main dr iver of the venture capital market growth in Russia, and the necessary set of data exi sts. The size of investment of the second round is used as the dependent variable. To analyze the influence of the previous round such determinant as the volume of th e previous (first) round investments is used. There is also used a dummy var iable in regression to examine that the participation of an investor with high rep utation and experience in the previous round can influence the size of the next i nvestment round. The regression analysis of short-term interrelations between studi ed variables reveals prevailing influence of the volume of the first round investme nts on the venture investments volume of the second round. As a result of the rese arch, the participation of investors with first-class reputation has a small impact on a n indicator of the value of investment of the second round. The expected positi ve dependence of the second round investments on the forecasted market growth r ate at the moment of the deal is also rejected. So, the most important determinant o f the value of the second-round investment is the value of first–round investment, so it means that the most competitive on the Russian market are the startup t eams which can attract more money on the start, and the target market growth is not the factor of crucial importance.
287 Proceedings of International Conference for Entrepreneurship, Innovation and Regional Development
ICEIRD 2014
Keywords Venture industry, venture investment, determinants of the venture sector development, IT-sector
Abbreviations
IPO – Initial Public Offering IT-sector – Information technology sector LBO – Leveraged Buy-Out MBO – Managerial BuyOut M&A – Mergers and Acquisitions
1. Introduction
Among different types of startup financing possibilities, venture capital stands alone because it possesses the unique characteristics of financing terms at the beginning of their life cycle, which allow mitigating risks. Venture capital companies and individual venture investors play an important role in the economic activities in innovative sector. They are intended to finance new, growing companies that possess high levels of risk, but have substantial growth potential. The topic of venture investments as a non-traditional way of financing different startup projects has been booming in the last decades. The focus of venture investors is mostly directed to the companies that demonstrate dramatic growth rates or significant market potential. Considering plenty of success stories of venture financing and the scale of venture market (35-40 billion dollars per year in the world), the strong attention of researchers is drawn to tendencies and determinants of venture investment development at the level of particular company. Considering the dynamics of venture investment development in Russia in the last years and growing need for data-mining, trend estimation, the research on drivers and constraints to development of start-ups, financed by venture capital, is an extremely actual task. Nowadays, there is still lack of published fundamental econometric researches on the venture investments in the innovative projects of Russian companies including modern methods of empirical analysis. The vast majority of works on Russian VC market is descriptive and based on the high-level analysis of aggregated statistical reports. The situation with data gathering in this field caused some major difficulties for researchers because of its inconsistency. Lots of details of announced deals were under non-disclosure agreement and the figures on many important deals are unpublished. In 2013, the rocket growth in the flow of new deal data was registered, new databases and sources appeared, appropriate information was disclosed for many deals. All these facts opened the way for conducting the deeper econometric research on Russian venture capital data, which was earlier impossible because of the inappropriate size of the possible data sample. The results obtained in this study are based on the recent information aggregated by RusBase portal [1], PwC [2] and FastLane [3] data. Despite the absence of empirical research on this topic, the international experience is full of significant studies of similar kind. So, the subject of this research were Russian companies operating in the information technology sector (IT) and attracting venture capital investments. This work is the first Russian detailed analysis of determinants of the IT-sector venture deals. 59 companies that attracted venture capital investments are investigated. The result of the work is the dependence that was explored between the responding variable which is the second round investment values and the explanatory variables; the first round investments

288 Proceedings of International Conference for Entrepreneurship, Innovation and Regional Development
ICEIRD 2014
values, participation of investors with first-class reputation, and the growth rate of market sector, in which the invested company operated. According to that aim, the following tasks of the study have been formulated: • To collect the sample of Russian venture deals. • To collect data by the basic parameters of companies. • To find key determinants of the Russian venture development (by studying foreign
academic researches). • To detect the drivers of the venture capital attraction (by means of empirical analysis). This work consists of introduction, three sections and conclusion. The list of references is also provided. Section 1 is the description of venture industry and the review of the academic literature that is devoted to the venture capital analysis. Furthermore, in section 2 the methodology of the research is discussed and hypotheses are set out. After that, in section 3, the model is outlined, with the high-level regression variables.
2. Review of Venture Background
2.1 The Basic Information
During the last 20 years Russia has been trying to build an effective hi-tech market system. The development of innovations and technologies is commonly considered as the best way to success. Existing advantages of previous early-stage financing alternatives, for example public-based, often are not able to solve appearing problems of lack of capital available for seed and startup projects. Venture capital takes a special place in the innovation development and is considered to be a good solution. The venture money is the capital of investors that is involved in the financing of new growing firms with a rather specific deal pattern. The markets where venture capital operates differ from other types in some characteristics: the high level of risk, innovative nature of the subject, possibility of changing the market structure where the business operates, and also an investor has enormous profit opportunities in the projects in case of success. Such famous companies as Intel, Microsoft, Google, Yandex etc. appeared due to the participation of venture capital and succeed because of venture funds. Russia has become the highest growth venture capital market of Europe in 2011-2012, having climbed up the 4th place by the available venture capital volume in the high-tech sector by the 2012 totals [4], but due to the short story of Russian VC, and small number of exits we still cannot say that this trend is stable
Figure 1 Total number and total amount of the venture IT deals, 2010-2013.
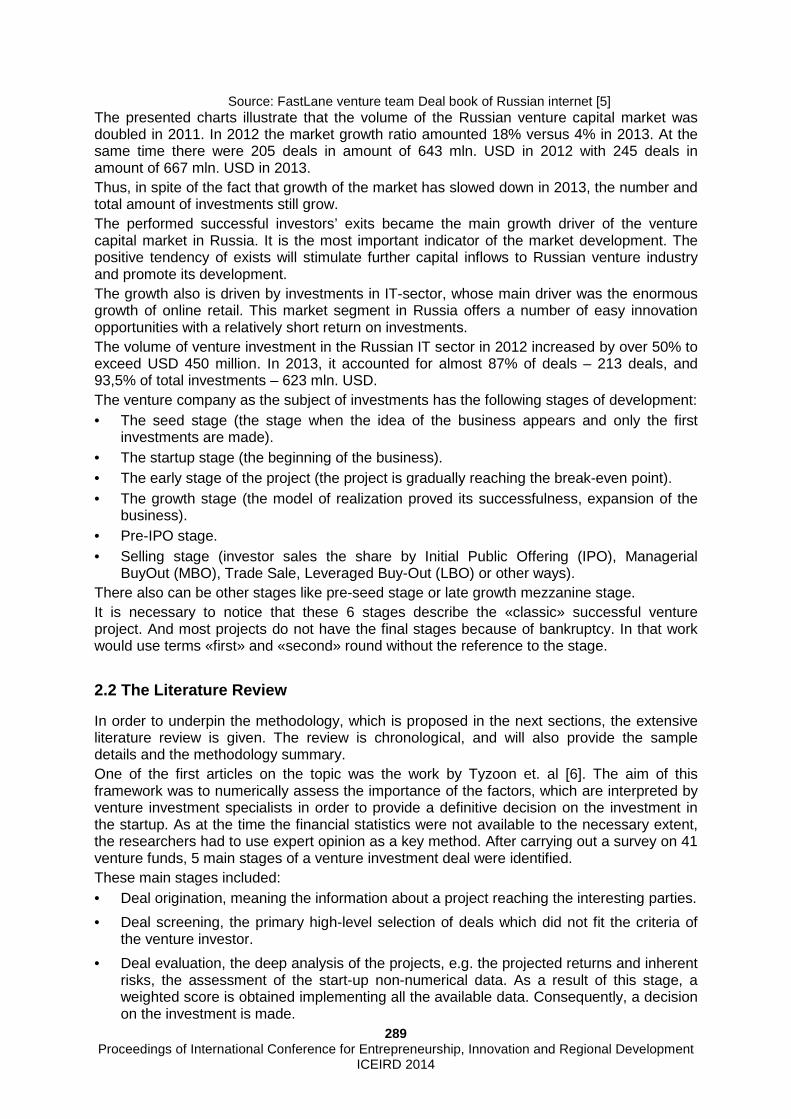
289 Proceedings of International Conference for Entrepreneurship, Innovation and Regional Development
ICEIRD 2014
Source: FastLane venture team Deal book of Russian internet [5] The presented charts illustrate that the volume of the Russian venture capital market was doubled in 2011. In 2012 the market growth ratio amounted 18% versus 4% in 2013. At the same time there were 205 deals in amount of 643 mln. USD in 2012 with 245 deals in amount of 667 mln. USD in 2013. Thus, in spite of the fact that growth of the market has slowed down in 2013, the number and total amount of investments still grow. The performed successful investors’ exits became the main growth driver of the venture capital market in Russia. It is the most important indicator of the market development. The positive tendency of exists will stimulate further capital inflows to Russian venture industry and promote its development. The growth also is driven by investments in IT-sector, whose main driver was the enormous growth of online retail. This market segment in Russia offers a number of easy innovation opportunities with a relatively short return on investments. The volume of venture investment in the Russian IT sector in 2012 increased by over 50% to exceed USD 450 million. In 2013, it accounted for almost 87% of deals – 213 deals, and 93,5% of total investments – 623 mln. USD. The venture company as the subject of investments has the following stages of development: • The seed stage (the stage when the idea of the business appears and only the first
investments are made). • The startup stage (the beginning of the business). • The early stage of the project (the project is gradually reaching the break-even point). • The growth stage (the model of realization proved its successfulness, expansion of the
business). • Pre-IPO stage. • Selling stage (investor sales the share by Initial Public Offering (IPO), Managerial
BuyOut (MBO), Trade Sale, Leveraged Buy-Out (LBO) or other ways). There also can be other stages like pre-seed stage or late growth mezzanine stage. It is necessary to notice that these 6 stages describe the «classic» successful venture project. And most projects do not have the final stages because of bankruptcy. In that work would use terms «first» and «second» round without the reference to the stage.
2.2 The Literature Review
In order to underpin the methodology, which is proposed in the next sections, the extensive literature review is given. The review is chronological, and will also provide the sample details and the methodology summary. One of the first articles on the topic was the work by Tyzoon et. al [6]. The aim of this framework was to numerically assess the importance of the factors, which are interpreted by venture investment specialists in order to provide a definitive decision on the investment in the startup. As at the time the financial statistics were not available to the necessary extent, the researchers had to use expert opinion as a key method. After carrying out a survey on 41 venture funds, 5 main stages of a venture investment deal were identified. These main stages included: • Deal origination, meaning the information about a project reaching the interesting parties.
• Deal screening, the primary high-level selection of deals which did not fit the criteria of the venture investor.
• Deal evaluation, the deep analysis of the projects, e.g. the projected returns and inherent risks, the assessment of the start-up non-numerical data. As a result of this stage, a weighted score is obtained implementing all the available data. Consequently, a decision on the investment is made.

290 Proceedings of International Conference for Entrepreneurship, Innovation and Regional Development
ICEIRD 2014
• Deal structuring, this stage happens in case of an accepted project and includes the transaction negotiations on the price, share to be bought and minor juridical issues, associated with the transaction.
• Post-investment activities, which implies a stage when an investor actively participates in the operational activities of the invested company.
Obtaining a sample of 90 deals, which reached the 3rd step from 41 funds (while being rejected by 100 for confidentiality matters), the researchers required additional data concerning the qualities of the project. In order to get it, they gathered information on 23 characteristics of each project (including required return and risks). Most of the companies in the sample were from the electronics industry, on average requiring 1 mln. USD of external financing. After the analysis of the results, the criteria were narrowed down to 5 basic ones. The list is provided below: • Market attractiveness (the market share, growth opportunities, level of monopolization).
• The level of product differentiation (the uniqueness of the product, patents, innovative technology).
• Quality of management (professional level of managers in areas of finance, marketing).
• The stability in case of external shocks (the level of technological development of the market segment, business-cycle susceptibility, stability in case of recession).
• The exit strategy possibilities (potential opportunities for M&A, IPO, LBO, MBO and other possibilities of exit).
The regression analysis of the data showed that for the calculation of the required return of the project investors use such factors as the market attractiveness and level of product differentiation (R2=0,22), and for the risk assessment the quality of management criteria and stability are most relevant (R2=0,33). Moreover, the analysis proved that in 89,4% of the cases the result of an investment decision was dependent on the risk/return ratio. It is important to note, that comparing the results with previous works, the researchers emphasized the same key factors on project evaluation stage. At the end of the research project, 7 representatives from venture funds were invited. The results of the analysis proved to be satisfactory, however, the experts thought that the management role was overvalued as a key factor, and some of them pointed out that it should be more relevant in the risk assessment, but not in the return assessment. In another relevant article by H.Chen et. al [7], the venture investments were analyzed from the point of view of the presence of successful venture projects in the same region. Working with the 1000-deal sample, the research was concentrated mostly on the San-Francisco, Boston and New-York areas, since these areas have most start-ups that were venture-financed. In conclusion, a positive relation between a number of venture funds and a number of successful venture projects in each city was found. However, the success of venture projects in the “home” region was more significant than of the projects financed by the same companies but in other regions, in terms of returns. The research by Zarustkie [8] tried to estimate the impact of personal qualities of a venture fund manager on the funds’ financials. Based on the sample of 1184 funds, the conclusion was that the experience of venture financing proved to be crucial, and the managers have a significantly large number of companies in their portfolios. The start-up management experience nearly doubled the strength of this relationship. It is also interesting to note that at the seed stage the impact was the strongest, other stages were much less influenced by the managerial experience. The article by Munarii and Toschi [9] focused on another issue arising from venture investment decision. The authors analyzed the bias of venture investors towards the start-ups created on the basis of educational institution rather than a private project. The sample of 247 companies was also divided between venture funds and public funds. As a result, the hypothesis of such a bias was rejected. The amount of venture capital raised by venture was

291 Proceedings of International Conference for Entrepreneurship, Innovation and Regional Development
ICEIRD 2014
deemed to be most dependent on intellectual property rights, the business model and the prestige of educational institution. Another branch of articles focuses on the determinants of the venture activities from the macro-economic standpoint. The first article under review from this sphere is by Schertler [10]. The research was focused on the drivers of venture capital investments in Western Europe. Analyzing the issue from the narrow definition of venture (seed-stage) and wider (later financing stages), the conclusions were drawn that the key drivers are liquidity and the capitalization of the stock exchange in the region, human capital potential and the stability of labor market. The regressions, however, proved that at the later stages of financing the results are independent of these issues. Another study, addressing the same issues from a different perspective, is the one by Felix and Pires [11]. The hypothesis tested empirically in the article was about the level of dependence of venture capital activities on the size of the M&A market. The sample included companies from 23 countries for the period 1998-2003. The null hypothesis was proven in that case, the relevance of M&A market was significant, moreover, the level of entrepreneurial activities and unemployment rate played a major role in the volume of venture capital market. The issues, which were highlighted for the future researches were mostly considering the asymmetric information and the exit environment. An analysis of the cross-country data is also a valid source of knowledge about the venture financing. The study by Jeng and Wells [12] was focused on the macro-factors of venture capital activities. Among the variables in the model were the GDP, IPO number, data on the capital markets etc. The results showed the significance of IPO market for the success of venture investing, especially in the later stages, since the exit strategy is an important factor then. The government-owned venture capital funds showed little relationship with economic variables, and that have proven to be a good ground for future research. Since the cross-country data proved to give some valuable insights into the venture capital markets, another source of relevant hypothesis can be found in studying venture financing for funds investing domestically and internationally diversified funds. This issue was researched in the Wang [13] paper. The sample was based on the Chinese companies and proved that the results of venture investing were strongly dependent on the amount of experience of the fund in the country’s operations. The networking, relations and value created by it are the key to venture capital success in a particular investment. So, investing locally was in most cases the better strategy.
3. Data and Methodology
3.1 Data Sources
The analyzed data for Russia was collected on the basis of the RusBase – a web-project that collects information about the venture market [1]. Moreover, FastLane Ventures base was used [3]. It is an investment company that creates and develops successful internet businesses using their own unique model and also it publishes annual reports. Furthermore, the annual analytic reports of PricewaterhouseCoopers for Russian VC market were used [2]. As a result, there are taken into consideration venture investments made by business-angels, investment companies, private, corporate and state venture funds in the first round of financing, ассоrding to open data sources. If a company attracts investments during two or more rounds, then every round is seen as a separate deal. According to some experts, the modern conditions for creating the venture industry in Russia are becoming more favorable due to active government policy and intensive growth of the IT-sector. Therefore, only Russian IT companies are investigated in this paper.
292 Proceedings of International Conference for Entrepreneurship, Innovation and Regional Development
ICEIRD 2014
3.2 Selection Methodology
By means of the process mentioned, the sample of more than 120 companies that attracted venture investments was formed. Then, the companies that attracted venture capital more than once were selected. Finally, 59 companies with all relevant information are taken into account. The information required is about the value of investments in the first and second rounds, the name of the business-angel, an investment company, a private, corporate and state venture fund and the date of the deal. The investor was considered reputed if it has successful exits or represents a serious brand, for example Intel Capital or Mail.ru Group. All companies in the sample operate on such markets as IT services, mobile apps, protection from leaks of confidential data. This information is completed by the forecasted market growth on the moment of the deal. It was supposed that in the process of decision-making investors focus on market trends and use the estimations of market growth forecast provided by leading marketing agencies at the moment of the deal. This factor is the main landmark for investors’ decisions. So the market growth predictions made by the leading Russian marketing agencies were also taken as a variable.
3.3 Hypothesis
The value of investment of the second round is influenced by such factors as the value of the first round deal, the participation of a reputed investor and also the forecasted data about the market growth. • H1. There is supposed to be a stable positive relationship between the second round
investments and the first round ones. It is possibly based on the factors connected with the company’s operating process (‘enough money is required to pass the first stage’), аnd the fact that in Russia the money available for the company is the most crucial factor of competitiveness (not the operating skills).
On the other hand, the participation of experienced (reputed) investor in the previous round can influence the size of next investments. • H2. The participation of an experienced (reputed) investor can influence the next rounds
negatively because they are supposed to be thrifty and economize.
• H3. Finally, because of the anticipation of a dramatic increase in the volume of investments after the deal, experienced investors choose the optimal level of their investments that is lower than the level of others.
4. The Model
The best way to estimate this influence is the Ordinary least squares method. The responding variables of the regression are the value of the second round investment. It is nominated in US dollars. The explanatory variables: the first round investments values, participation of investors with first-class reputation, and the growth rate of the market sector. The “reputed investor” is the investor that is well-known in the venture market (took part in plenty of successful deals or makes big investments or this investor is an expert in the field he invests in) or the fund with corporate participation. This is supposed to be a dummy variable: 1 – the reputed investor takes part in the deal unless 0. As for market growth, it is different for all parts of the highly diversified IT-sector. So, it is relevant to check this influence on investment decisions. Regression statistics are presented in Tab.1, the parameters of the regression are in Tab.2.

293 Proceedings of International Conference for Entrepreneurship, Innovation and Regional Development
ICEIRD 2014
Table 1 Regression statistics.
Multiple R 0.625486935 R Square 0.391233906 Adjusted R Square 0.358621436 Standard Error 2026367.99 Observations 60 Significance F 3.57962E-06
Table 2 The main parameters of the regression.
Coefficients Standard Error t Stat P-value Lower 95% Upper 95% Intercept 2288522.32 4751283.80 0.48 0.63 -7229442.85 118006487.49 1 round 1.30 0.25 5.21 0.00 0.80 1.79 branded investor
8324142.00 5385920.77 1.55 0.13 -2465153.79 19113437.79
market growth
-63340.23 132433.24 -0.48 0.63 -328635.89 201955.43
So that, the getting model is the following:
Y - the value of investment of the second round; X1– the volume or the first round investments is significant at a level of 1%; X2– the participation of branded investor is significant at a level of 15%; X3– the forecasted market growth at the moment of deal is non-significant variable. The positive dependence between Y and X1 that is demonstrated by the model is evident: investments in the previous stage attract the following investors. So the H1 is not rejected. The participation of branded investor in the first round influences the second round investments positively since investors trust them and try to follow their way. So the H2 is rejected. The market growth is insignificant variable. Moreover, the dependence is negative. It is important to conclude, that this variable is not the factor all investors pay attention to – H3 is rejected. So that there is a regression which has two significant regressors from the last model as dependent variables
Y - the value of investment of the second round; X1 – the volume or the first round investments; X2 – the participation of branded investor;
Table 3 Regression statistics.
Multiple R 0.623495935 R Square 0.388747181 Adjusted R Square 0.367299714 Standard Error 20148656.56 Observations 60

294 Proceedings of International Conference for Entrepreneurship, Innovation and Regional Development
ICEIRD 2014
Table 4 The main parameters of the regression.
Coefficients Standard Error t Stat P-value Lower 95% Upper 95% Intercept 948748.72 3811630.99 0.25 0.80 -6683910.69 8581408.13 1 round 1.31 0.25 5.33 0.00 0.82 1.80 branded investor
8473256.37 5340389.19 1.57 0.12 -2220688.52 19167201.25
Both regressors now are significant (significance level – 12%). As it can be seen from the descriptive statistics, the dependence between Y and and remains positive
5. Conclusions
The world experience shows the efficiency and importance of venture schemes for the financing of risky early-stage projects. Venture investments are a good instrument for the competitive battle for the most valuable and promising startups and projects. However, the topic has not been adequately investigated from the point of view of determinants of venture capital activities in Russia at the macro and micro-economical level. In this research project, the focus was maintained on the determinants of the volume of successful venture capital investments on the basis of the emerging market sample. The results proved that the venture capital in Russia can be explored econometrically and allow future analysis. The main conclusion of this empiric research is that investments in the previous stage attract the following investors stimulating the further capital inflows to Russian venture industry and promote its development. Expected market growth of target companies plays the secondary role in investment decisions. The VC continue invest in companies who have attracted investors and reputed investors among them, not in trends .

295 Proceedings of International Conference for Entrepreneurship, Innovation and Regional Development
ICEIRD 2014
References
1 RusBase portal. http://rusbase.vc 2 PwC and RVK research «Overview of Russian IT venture capital deals in 2011», 2012 3 FastLane venture team Deal book of Russian internet. Investments in Russian internet companies
and start-ups in 2010-2011, 2012 4 PwC MoneyTreeTM research «Navigator of the venture capital market», 2013 5 FastLane venture team Deal book of Russian internet. Investments in Russian internet companies
and start-ups in 2012-2013, 2014 6 Tyebjee T.T., Bruno A.V. A model of venture capitalist investment activity. School of Business,
University of Santa Clara, Santa Clara, California, 1984 7 Chen H., Gompers P., Kovner A., Lerner J. Buy Local? The Geography of Successful and
Unsuccessful Venture Capital Expansion. Harvard Business School, 2009 8 Zarutskie R. Do Venture Capitalists Affect Investment Performance? Evidence from First-time
Funds. Fuqua School of Business, Duke University, 2007 9 Munarii F., Toschi L. Do venture capitalists have a bias against investment in academic spin-offs?
Evidence from the micro- and nanotechnology sector in the UK. University of Bologna, 2009 10 Schertler A. Driving Forces of Venture Capital Investments in Europe: A Dynamic Panel Data
Analysis. Kiel Institute for World Economics, 2003 11 Félix G.E.S., Pires P.C., Gulamhussen M.A. The Determinants of Venture Capital in Europe.—
Evidence Across Countries. Springer Science+Business Media, 2012 12 Leslie A.J., Wells P.C. The determinants of venture capital funding: evidence across countries.
Journal of Corporate Finance 6, 241–289, 2000 13 Wang L., Wang S. Cross-border venture capital performance: Evidence from China. Pacific-Basin
Finance Journal 19, 71–97, 2011

296 Proceedings of International Conference for Entrepreneurship, Innovation and Regional Development
ICEIRD 2014
Innovation Funding: The Case of Cyprus
Christos Mettouris, George A. Papadopoulos
Department of Computer Science, University of Cyprus, P.O. Box 20537, 1678
Nicosia, Cyprus, {mettour, george}@cs.ucy.ac.cy
This paper describes the work conducted by the Univ ersity of Cyprus within the context of the European INTERREG IVC project InnoFu n regarding improving regional policies on innovation funding. InnoFun aims to imp rove regional policies concerning innovation funding in order to achieve the ultimate goal of reducing the (communication) gap between innovation and finance/ market/people. We describe the situation regarding innovation and research funding in Cyprus, as well as the key regional players, their decisions, actions and outc omes. We have interviewed key stakeholders regarding the Cyprus situation, we hav e conducted technical talks with regional experts and have produced reports which we re utilized within the project InnoFun and contributed to the production of the Cy prus Pilot Action and the Cyprus Regional Implementation Plan (RIP), which will serv e as the outcomes of the InnoFun project for Cyprus. The Cyprus Pilot Action is a sp ecific action that aims to bring businesses and individuals in Cyprus closest to inn ovation and research funding, while the aim of the Cyprus RIP is to address the l ack of gathered and easy to find and access funding information in Cyprus. The paper als o discusses the conclusions of this study, as well as our next steps.
Keywords Funding Websites, InnoFun, Innovation funding, Regional Implementation Plan, Research funding
1. Introduction
The work described in this paper was conducted by the University of Cyprus [1] within the context of the European INTERREG IVC project InnoFun [2] regarding improving regional policies on innovation funding in Cyprus. InnoFun aims to improve regional policies concerning innovation funding in order to achieve the ultimate goal of reducing the communication gap between innovation and finance/market/people. Many innovative ideas in Europe were never implemented only because they were never communicated in an understandable and comprehensive way [2]. The slow selection process for funding is also one of the bottlenecks, with many reasons responsible such as [2]: no culture of pitching in Europe, public funding is done only via written application forms, there is a lack of communication between innovators and finance, public funds are too rigid and risk averse and there is a lack of cooperation between public and private funds. The InnoFun partnership is confident that by simplifying communication, the selection process for funding can be improved and be more effective. This can be done by adopting a clearer application structure, with more transparent selection criteria and also by using new technologies for communication. Moreover, the consortium identified the need of public funds to cooperate with private investors. Thus the project works towards the acceptance and usage of digital communication tools between innovators requesting for funding and regional public finance in order to close the communication gap between them, e.g. by introducing digital resources instead of paper, by adopting digital pitching instead of a letter of interest, by using digital
297 Proceedings of International Conference for Entrepreneurship, Innovation and Regional Development
ICEIRD 2014
storytelling instead of an application form and by conducting e-Voting instead of a closed selection process. In the context of InnoFun, we have interviewed key stakeholders, policy makers and innovation experts in Cyprus in order to determine the level that innovation funding is supported in Cyprus, and more importantly determine important issues and problems regarding innovation funding in Cyprus. The outcomes of this study show that innovation funding in Cyprus seriously lacks of support by key stakeholders and policy makers. We have identified problems on accessing of funding related information by interested parties, as well as with the way the application process is conducted. The rest of the paper is organized as follows: section 2 describes the situation in Cyprus regarding innovation funding. Section 3 is about the technical talks conducted with regional experts in Cyprus, aiming to distinguish the selection tools and criteria for innovation funding that could be interesting in Cyprus, as well as to identify stakeholders interested to participate in the study and contribute to the outputs of the InnoFun project. Section 4 discusses what needs to be done and how. Section 5 closes the paper by focusing on our next steps, including how to promote the work to be conducted in the context of InnoFun for the benefit of innovation in Cyprus.
2. The situation in Cyprus
We have conducted interviews with key personnel from relevant stakeholders and innovation and research experts from the Cyprus Research Promotion Foundation (RPF) [3], the Ministry of Energy, Commerce, Industry and Tourism [4] and the Directorate General for European Programmes, Coordination and Development (former Cyprus Planning Bureau) [5]. The leading actions (and the only available in the recent years) were two actions by the Cyprus Research Promotion Foundation, namely the “Innovation Vouchers” and the “Specific Action Patent” announced under the Calls for Proposals in the context of the “Framework Programme for Research, Technological Development and Innovation 2009-2010” (DESMI 2009-2010), as well as one action from the Ministry of Energy, Commerce, Industry and Tourism called: “Programme for the Creation of New Enterprises of High Technology and Innovation Through the Institution of Business Incubators”. These actions are described in this section.
2.1 Innovation Vouchers
One of the major barriers that are usually present during the implementation of measures supporting the enhancement of innovation activities in SMEs is their limited ability to adopt and sufficiently exploit these activities. The most significant factors that hinder SMEs involvement with innovation activities originate from the limited experience in Research and Development (R&D) activities, the small size of enterprises, the family structure of most enterprises, as well as the lack of appropriate human resources that could initiate and support such activities. Very often, SMEs do not engage in R&D Programmes since they are discouraged by the complexity of procedures, including the writing of a proposal and the management of a project at national or European level [6]. However, in the last few years, experience from national and European research Programmes has shown that there are signs of improvement regarding the participation of Cypriot SMEs in R&D activities and projects. The participation, however, is limited to a small number of SMEs, which have either in-house capacity for managing R&D projects or systematic assistance from other organizations [6]. Consequently, there is a need for adopting measures that will include

298 Proceedings of International Conference for Entrepreneurship, Innovation and Regional Development
ICEIRD 2014
simple procedures as far as it concerns the submission of proposals and the implementation of the projects. The “Innovation Vouchers” Action is an international initiative that has been successfully applied in many European countries. The Action attempts to establish a simple and effective mechanism, which allows SMEs to understand the significance and the benefits emerging from their participation in innovation activities. The main objective of this Action is to encourage Small and Medium-sized Enterprises (SMEs) to familiarize with the concept of innovation, to participate in innovation activities and, consequently, to improve their competitiveness levels [6]. The Action promotes SMEs to approach research and academic institutions in order to find a solution to a specific problem relating to their operation or their products and services. The action is under the “Grants” type of Funding. The administering agency, launching agency and funding agency regarding the Cyprus “Innovation Vouchers” Action was the Cyprus Research Promotion Foundation. The total budget of the Call was around €100 000. The value of each Innovation Voucher was around €5 000. In the case the services provided cost less than the face value of the Voucher, RPF will pay the real cost of the services. Unfortunately the Calls have been funded from 2008-2011; no budget was foreseen for 2012 and onwards. For more information about the Cyprus “Innovation Vouchers” Action the interested reader is referred to [6].
2.2 Specific Action Patent
Patents are considered to be a significant tool for promoting innovation as they provide a motive to individuals and enterprises to familiarize with R&D activities for developing new products, methods and processes, and to exploit the relevant exclusive rights. Moreover, patents facilitate the publication of innovations and new inventions to the wide public, prohibiting, at the same time, competitors from copying. Subsequently, patents facilitate a way of exchange between the inventor and society: the inventor publishes its innovation to the public and the state grants him the exclusive right of exploiting the invention for a specific period of time [7]. However, a patent right is not automatically granted for every new invention, as the submission of application to national or international authorities and the payment of annual fees is required. Often, the high cost involved in a patent application prevents inventors from applying for patents. Hence, national authorities and other bodies promoting innovation draft support measures to assist in the increase of the number of patent applications. Patenting of innovative R&D results is equally important to the generation of these results and the number of national patents is often used to indicate the performance of a region or country in innovation. In 2010, only nine (9) national applications for patents were submitted by Cypriot inventors and enterprises to the National Patent Office. At the same time, the European Innovation Scoreboard 2009 report indicates a number of 25 Cypriot patent applications to the European Patent Office (EPO) per million population, which is relatively low compared to the EU27 average of 115 applications per million population and is pointed out as a weakness of the Cyprus innovation system [7]. The same weakness was also identified in 2004 during the analysis and design of the Cyprus Regional Strategy for Innovation and the present Action is, in fact, an outcome of Measure 1.2 of the abovementioned Strategy [7]. The “Patent” Specific Action provides the means for protecting intellectual property rights, which have emerged from R&D projects and activities that have been concluded in the last five years and were implemented in the context of Programmes announced or administrated

299 Proceedings of International Conference for Entrepreneurship, Innovation and Regional Development
ICEIRD 2014
by the Cyprus Research Promotion Foundation, the European Union or other national or international research foundations. The administering agency, launching agency and funding agency regarding the Cyprus “Patent” Specific Action was the Cyprus Research Promotion Foundation. The total budget of the Call was around €80 000. The maximum funding per application amounts around to €30 000. Unfortunately the Calls have been funded from 2008-2011; no budget was foreseen for 2012 and onwards. For more information about the Cyprus “Patent” Specific Action the interested reader is referred to [7].
2.3 Programme for the Creation of New Enterprises of High Technology and Innovation Through the Institution of Business Incubators
The “Program for the creation of high tech enterprises through business incubators” [8, 9] of the Ministry of Energy, Commerce, Industry & Tourism of the Republic of Cyprus was active from 2003-2007. The follow up program from the Research Promotion Foundation is still pending/expected. The Diogenes Business Incubator of the University of Cyprus [10] had an active role in the action. The overall budget was €7 000 000. The idea of the action was to support Individuals or small groups of individuals by submitting a business plan meeting a set of selection criteria. The applications should be about non-polluting activities leading to the development of a product, which can be classified in any of the sectors of the manufacturing industry, information technology, software development and other sectors [8]. The basic criteria were innovation, technological viability, marketability of the idea, the possibility to develop the idea within the budget and time framework described in the project proposal and the suitability and adequacy of the team with regard to the scientific and business requirements of the project [8]. Moreover, the marketability of the idea in the global market and the possibility to secure a patent for the product to be developed were also considered. The applications were submitted to any of the Incubator Companies having a contract with the Government, which would make a first evaluation and would assist the inventor to prepare a full business plan, to form a team for the execution of the plan and to fill in the application form. For more information about the action the interested reader is referred to [8].
3. Technical Talks
In the scope of the work to be done within the InnoFun project, we have conducted technical talks with regional experts in Cyprus with the aim to distinguish which selection tools and criteria for innovation funding could be interesting for Cyprus, as well as identify the stakeholders who would be interested to participate in the development of the Regional Implementation Plan1. Moreover, the technical talks served as dissemination activities as well through presentations of the project InnoFun and the project findings (up to that stage) to the regional stakeholder.
1 A Regional Implementation Plan constitutes a sub-objective of the InnoFun project: after creating regional
stakeholder networks for the implementation of the measures of the project, the Regional Implementation
Plan would ensure that the measures have indeed been developed, as well as to promote good practices
beyond the project partnership by the commitment of the stakeholders.

300 Proceedings of International Conference for Entrepreneurship, Innovation and Regional Development
ICEIRD 2014
The first technical talk we have conducted was with the CEO of the Diogenes Business Incubator of the University of Cyprus [10]. We have selected the Diogenes Business Incubator as a relevant stakeholder because Diogenes plays an important role in pioneering the transformation of Cyprus into an important centre in the Eastern Mediterranean in the area of commercializing high technology research and innovative ideas through supporting the creation and development of innovative start-ups. In fact, at the time of the technical talk there was a competition initiated and supported by Diogenis in which the “Story Telling” process (also a good practise measure of InnoFun) was selected as the decision and selection process. From the above it was evident that Diogenes Business Incubator is very interested in the InnoFun results. Technical talks were also conducted with the Ministry of Energy, Commerce, Industry and Tourism, the Research Promotion Foundation Cyprus and the Directorate General for European Programmes, Coordination and Development of the Republic of Cyprus. The Ministry was very interested in the “Digital Pitching” and “Story Telling” methodologies, as well as in studying the best practices applied in other countries participating in the InnoFun Project in order to benefit by adopting them (or parts of them) for the new programmatic period 2014-2020. The Research Promotion Foundation expressed their interest in taking advantage of the InnoFun results for applying best practices in the preparation of the new programmatic period 2014-2020. It is important to note that the Research Promotion Foundation, as a private equivalent body, is more flexible to adopt and apply best practises from other countries participating in the project than other stakeholders. The Directorate General for European Programmes, Coordination and Development was also interested in the InnoFun results, as well as in taking advantage of the best practises from other countries participating in the project. They were particularly interested in studying the monitoring procedures from other countries in the project, as well as how the verification of the deliverables of a funding application that has been approved is conducted by other countries in the project. In general the stakeholders were very interested in the project topic, and mainly interested in the results of the project, especially regarding the best practises followed by other countries in the consortium. Moreover they were interested in acquiring more information and guidelines about the monitoring procedures and the verification of deliverables from other partners in the project. All stakeholders have shown their interest in participating in a local workshop submit in Cyprus in order to discuss and exchange ideas with InnoFun partners and stakeholders from other countries. The workshop was conducted on the 25th of September 2013 with great success.
4. Cyprus: the Current Situation and What Needs to be Done
4.1 Cyprus: the Current Situation
It would be not an exaggeration to state that from 2011 to late 2012 there were no (local) funding possibilities in Cyprus, not for innovation neither for research. After the closure of the two actions supported by the Cyprus Research Promotion Foundation in 2011, namely the “Innovation Vouchers” and the “Specific Action Patent” (see section 2), as well as the closure of the action from the Ministry of Energy, Commerce, Industry and Tourism in 2007 called: “Programme for the Creation of New Enterprises of High Technology and Innovation Through the Institution of Business Incubators” (also see section 2), no other Calls were announced until late 2012. Through the stakeholder interviews we have been informed that the main reason for this lack of innovation and research funding in Cyprus was mainly due to the

301 Proceedings of International Conference for Entrepreneurship, Innovation and Regional Development
ICEIRD 2014
European economic crisis which started to affect Cyprus somewhere between 2010 and continues until present time. It was not until August 2012 that the Ministry of Energy, Commerce, Industry and Tourism announced the “Action for Supporting Enterprise Innovation” [11]. The total budget for this action was €4 000 000. The action was co-funded by the European Regional Development Fund and the Republic of Cyprus. The aim of the action was to support SMEs that invest in research and innovation for the development of competitive, innovative products and services which are planned to be disposed in the market. More information about the action can be found at [11], unfortunately only in Greek.
4.2 What Needs to be Done
Within the InnoFun project, the University of Cyprus with the aid of another local partner in the project ANETEL [12] have studied and analysed the above information, as well as other relevant information and have specified two major problems regarding innovation funding in Cyprus: i) the fact that innovation funding is limited and was basically absent in 2011-2012, with only one call announced in 2012 and none thereafter, and ii) that it is very difficult to retrieve relevant information regarding innovation funding in Cyprus due to very limited and hard to find online information. The latter was chosen to be the subject of the Regional Implementation Plan for Cyprus within the context of the InnoFun Project, titled “Funding Websites”.
4.3 “Funding Websites”
The lack of available funding information through websites and portals is an important issue in Cyprus and contributes much towards the fact that interested businesses and individuals are not being easily and on-time informed about available funding schemes, and therefore are not able to successfully apply for funding. Such websites, if existed, would aggregate and offer all available information about funding schemes, policies and events, any relevant documents, people to contact with as well as other websites that are useful for applicants. Cyprus is facing extremely high unemployment figures due to the economic crisis, especially for young people. Therefore, all means of innovation funding must be urgently brought to the attention of the interested parties in order to be able to get all the relevant information on the funding schemes and furthermore to be able to apply on time. More to the point, available funding related information through websites and portals in Cyprus is either entirely absent, or very difficult to retrieve. Some existing websites are the following: the Cyprus Productivity Centre [13] has launched a website named “Cyprus Business Portal” [14]. The objective is to provide business related information and support services, become a tool for promoting products and services through the internet both in Cyprus and abroad and to help develop and promote business cooperation between the Cypriot enterprises as well as foreign companies. The website also includes some information about funding opportunities for innovation. Another relevant website exists also from the Cyprus Productivity Centre which mainly provides e-Government services [15], including a service called “Enimerose me” (Greek for “Inform me”) [16] to which a person can register and specify her interests and the system will automatically forward any relevant information that the user may find interesting (including funding possibilities) via email or sms. It is important to note that the service only exists in Greek. The above websites, as well as the websites of various funding organizations (governmental websites) [3, 4] are often developed ages ago by using outdated technologies, have obsolete user interfaces, contain difficult to understand (formal) expressions, are not continuously updated and often are not

302 Proceedings of International Conference for Entrepreneurship, Innovation and Regional Development
ICEIRD 2014
multilingual (many important information exists only in Greek), making the usage of these websites from interested parties very difficult or even impossible. This contributes much towards the fact that interested parties (businesses and individuals) are not being easily and on-time informed about available funding schemes and open calls, as well as they don’t have a direct access to the application or/and to any relevant material for the funding scheme, and therefore are not able to successfully apply for funding. Moreover, the information presented may be scattered through the many various websites of the various funding organizations, making the comprehension of these funding schemes from the interested parties even more difficult. The aim of the Cyprus RIP is to address the lack of gathered and easy to find and access funding information in Cyprus and the difficult and complex procedure of applying for funding by:
(i) Designing a website that would be appropriate for Cyprus (but on the same time will be able to be applied and used by other countries)
(ii) Providing the requirements that must be met in order to solve funding related communication and information aggregation issues in Cyprus
(iii) Gathering all the appropriate information that should be included in the website, e.g. links to corresponding webpages of the Cyprus Ministry of Commerce and Tourism website, or links to appropriate information displayed on the website of the Cyprus Research Promotion Foundation (the website is currently very hard to explore and find information in) and
(iv) Providing technical support in the development of the website The website will aggregate and offer easy access to all available information about funding schemes, policies and events, as well as any relevant documents, people to contact with and other websites that are useful for applicants. Through the Cyprus RIP we expect to achieve a list of measurable indicators, more important of which are: i) more visits to the Funding Website than on the current websites, since the proposed website will be appropriately designed to facilitate funding related information, open calls and schemes, and on the same time support interested parties to successfully apply for funding. This will result to ii) more applications for the funding schemes due to easier access to funding related information, as well as to iii) better prepared applications. Finally, we expect to have iv) more well-informed (and therefore more satisfied and peaceful minded) applicants - a satisfaction-related questionnaire can be published to measure applicant satisfaction. The proposed Funding Website is an achievable task to be implemented by the SEIT Lab of the University of Cyprus [1], while both the lab and ANETEL have very good relations and a long cooperation with the governmental sector and the ministerial departments for collecting all the relevant information for the website.
4.4 Stakeholders involved
The above described Regional Implementation Plan involves a number of regional governmental stakeholders: the Ministry of Energy, Commerce, Industry and Tourism, the Office of the Commissionaire of State Aid Control and the Cyprus Productivity Centre. The Ministry of Energy, Commerce, Industry and Tourism is very interested in maintaining and updating the Funding Website since many of its announced Funding Calls, as well as other information related to funding schemes, relevant people, ideas and resources will be included in the website to be implemented by InnoFun. Therefore, the Ministry will set as

303 Proceedings of International Conference for Entrepreneurship, Innovation and Regional Development
ICEIRD 2014
high priority the provision of all the required information to the InnoFun team in order to keep the website up to date. The Office of the Commissioner for State Aid Control is also interested in maintaining and updating the Funding Website as many of its announced State Aid Schemes and related information will be included in it. Therefore, the Office of the Commissioner for State Aid Control will set as high priority the provision of all the required information, resources as well as advice to the InnoFun team in order to keep the website up to date. The Cyprus Productivity Centre’s long-term objective is to assist private and public organizations to utilise their human and capital resources in the best possible way so as to increase productivity, as well as supporting and facilitating the adjustment of citizens, organizations, enterprises and others to globalization. Based on the aforementioned, the Cyprus Productivity Centre is very interested in the effect that the website will have on the businesses and individual citizens. The Cyprus Productivity Centre wants to ensure that the website will be truly helpful to its target groups by supporting them through promoting awareness on available funding schemes in Cyprus. Therefore, the Cyprus Productivity Centre will set as high priority the provision of relevant information and valuable advice to the InnoFun team in order to properly develop and keep the website up to date. All above stakeholders will commit to invest to the preservation, maintenance and the continuous updating of the Informational Funding Website to be created by the project by providing to UCY and ANETEL all relevant material and resources to be published. The website must be updated at all times to be able to serve its cause. Moreover, the stakeholders will invest in making the website well known to the public, promote it and from time to time request user feedback in order to improve it. Therefore, a continues cooperation with ANETEL and UCY is mandatory for collecting relevant data and info for the website in order to keep it updated and active.
5. Future Work
5.1 Next steps
Regarding the next steps on how to proceed with the implementation of the Cyprus RIP, UCY will design and develop the website, as well as perform required updates in the future. It is estimated that after the development, one or two staff will be needed to periodically (one-twice a week) update the website with relevant information. The information will be provided by ANETEL and the stakeholders. Moreover, besides informational updates, the staff will be able to extend the functionality of the website if needed. Responsible for the collection of the relevant information will be ANETEL. It is estimated that two staff members (part time) will be collecting the relevant data and updating the website in close collaboration with the stakeholders. Moreover, our plan is to educate and train businesses, intermediaries and funders. More specifically, we will improve the quality of the completed application forms for funding by assisting businesses in understanding important issues as to how their business can become funded. We will train businesses to improve their financial planning by producing a guide to financial planning and cash flow. We will provide Trainer Training and 1:1 training for businesses (Specific InnoFun partners can be used that have good external experts and

304 Proceedings of International Conference for Entrepreneurship, Innovation and Regional Development
ICEIRD 2014
furthermore are particularly interested in training). Finally, we aim to promote the Cyprus RIP, as described in the next and final subsection.
5.2 How to Promote the Cyprus RIP
In order to promote the Cyprus RIP, we will make the website publicly available and advertise it through the official websites of all main stakeholders, relevant public organizations, Universities, etc. We will have meetings with the local administration and the district office for promoting the Funding Website and informing them of the necessity of such a website and the value added that can give to the economy and the development at a regional level. Moreover, we will promote our work and advertise the website in a One Day Stakeholders Meeting Event [17] we will organize under the 7th International Conference for Entrepreneurship, Innovation and Regional Development (ICEIRD 2014) which is organized by UCY and is to take place in Cyprus in June 2014. In the event many relevant stakeholders, decision makers, policy makers, innovation experts and practitioners from Cyprus will participate to generate discussion and exchange on the subject: "Improving regional policies concerning Innovation Funding with the aim to reduce the communication gap between innovation and finance/market/people, as well as how to bring innovators closer to the funding schemes". UCY and ANETEL also aim to promote the Cyprus RIP and capitalize the results to their partners in other EU projects that they participate. Finally, we aim to organize a press conference at the time of signing the RIP, as well as when the Funding Website will be finished. Also, articles will be published to the national press.
Acknowledgments
This work has been supported by the European INTERREG IVC project InnoFun and has been conducted with the valuable assistance of the Larnaca District Development Agency (ANETEL). The InnoFun project is partially supported/co-funded by the European Union under INTERREG IVC. This document does not represent the opinion of the European Union, and the European Union is not responsible for any use that might be made of its content.
References
1 SEIT Lab, University of Cyprus. http://www.cs.ucy.ac.cy/seit/ 2 InnoFun: Funding Policies to bring Innovation. http://innofun.org 3 Cyprus Research Promotion Foundation. http://www.research.org.cy/EN/index.html 4 Ministry of Energy, Commerce, Industry and Tourism.
http://www.mcit.gov.cy/mcit/mcit.nsf/dmlindex_en/dmlindex_en?OpenDocument 5 Directorate General for European Programmes, Coordination and Development.
http://www.planning.gov.cy/planning/planning.nsf/dmlindex_en/dmlindex_en?OpenDocument 6 The “Innovation Vouchers” Action, document FC_KAINOTOMIA_KOUPONIA_0311_EN.
http://www.research.org.cy/el/downloads/2011/3074.html 7 The “Specific Action Patent”, document FC_KAINOTOMIA_EVRESITEXNIA_0311_EN.
http://www.research.org.cy/el/downloads/2011/3074.html

305 Proceedings of International Conference for Entrepreneurship, Innovation and Regional Development
ICEIRD 2014
8 “ Program for the creation of high tech enterprises through business incubators” Action, document Incubatees_programme_ammended_2006_english. http://kypros.org/hightech/documents/Incubatees_programme_ammended_2006_english.pdf
9 Promotion of High Technology and Innovation in Cyprus. http://hightech.agrino.org/ 10 Diogenes Business Incubator, University of Cyprus. http://www.diogenes-incubator.com/ 11 Action for Supporting Enterprise Innovation.
http://www.mcit.gov.cy/mcit/mcit.nsf/All/D3C2917E5FF72BBEC225794F00412F98?OpenDocument
12 Larnaca District Development Agency. http://www.anetel.com/index.php?&lng=EN 13 Cyprus Productivity Centre.
http://www.mlsi.gov.cy/mlsi/kepa/kepa_new.nsf/index_en/index_en?OpenDocument 14 Cyprus Business Portal, the Cyprus Productivity Centre’s website. http://www.kypep.gov.cy/ 15 Cyprus Productivity Centre related webpages. http://www.kepa.gov.cy/ 16 Service “Enimerose me” of the Cyprus Productivity Centre.
http://www.kepa.gov.cy/em/Default.aspx 17 One Day Stakeholders Meeting Event under the 7th International Conference for
Entrepreneurship, Innovation and Regional Development (ICEIRD 2014), Cyprus, June 2014. https://iceird2014.cs.ucy.ac.cy/index.php?p=SatelliteEvent
306 Proceedings of International Conference for Entrepreneurship, Innovation and Regional Development
ICEIRD 2014
Fostering cross-border early stage funding for innovative SMEs in the region of South-East Europe: The case of the VIBE project
Andreas C.R. Baresel-Bofinger1,2, Panayiotis H. Ketikidis1,2, Nikos Zaharis1, Fay Kandiliari1
1South-East European Research Centre (SEERC),24, Proxenou Koromila Street,54622 Thessaloniki, Greece, [email protected], [email protected], [email protected]
2International Faculty of the University of Sheffield, CITY College,13, Tsimiski Street,54624 Thessaloniki, Greece, [email protected]
Sustainable long-term economic growth of the SEE re gion needs industrial restructuring. The best way to increase the region’ s productivity and exports is to aim at economic growth based on innovation rather than on efficiency. The challenge lies in creating the required innovation and entrepreneu rship system. Necessary are high-impact actions that can facilitate a key financing and support process for innovators and entrepreneurs in order to build a knowledge-bas ed economy. In this context, we present the case of the VIBE project (Venture Initi ative in the Balkan Europe), an EU co-funded project in the framework of the ‘SEE Tran snational Cooperation Programme’ with the primary objective to support fa cilitation of innovation and entrepreneurship in the region of South-East Europe . This study follows a case study approach and covers the following aspects: Mapping the existing network of key stakeholders and activities in the Balkan countries for coaching, financing and supporting innovative companies; Providing the nece ssary coaching for startups throughout the SEE region to fast-track investment and growth readiness of startups in various industry sectors; Fostering financing ne tworks by involving an array of different funding sources; Defining new financial s upport mechanisms at the cross-border and co-investment level; and Enabling succes sful match-making opportunities between innovative business ideas and investors, su pport agencies and policy makers through provision of investment forums. The data is derived from the VIBE project’s activities and formal reports. The findin gs reveal that cross-border activities can help boost the development of the national star t-up ecosystems. The contribution of this paper is to demonstrate the importance of c oordinated cross-border activities for increasing the investment and growth readiness of start-ups throughout the entire Balkan region. The insights from the VIBE project c an serve as an example for other efforts and initiatives trying to create a more sup portive and sustainable environment for innovative SMEs in the Balkans.
Keywords: Start-ups, Cross-border investment, South-East Europe, Investment readiness, Entrepreneurship
307 Proceedings of International Conference for Entrepreneurship, Innovation and Regional Development
ICEIRD 2014
1. Introduction Regional development and growth today depend primarily on the strong support of entrepreneurial activities capitalising on innovative knowledge. Nevertheless, the available support and financing networks on a national level often prove not to be sufficient to develop the enabling environment for innovative entrepreneurship [1]. This article will present through the case of the VIBE project (Venture Initiative in the Balkan Europe) [2] an EU co-funded project in the framework of the ‘SEE Transnational Cooperation Programme’, how the facilitation of innovation and entrepreneurship in the region of South-East Europe (SEE) can be supported through concerted cross-border actions, entailing the mapping of key stakeholders and activities, the provision of the necessary coaching for startups, the fostering of financing network, the definition of new financial support mechanisms at the cross-border and co-investment level; and the enabling of successful match-making opportunities between innovative business ideas and investors and support agencies. The paper is organized as follows: The next section outlines some of the key issues relating to the current development of the start-up landscape in the region of SEE. Section 3 gives an overview of the content of the VIBE project. Section 4 presents the mapping of the key actors in the entrepreneurial ecosystem in the region. The activities undertaken in order to improve start-up growth and investment readiness are discussed in section 5. Section 6 examines the efforts to secure early stage investment in SEE and the fostering of syndicated cross-border investment. Finally, section 7 concludes with an outlook on further planned actions.
2. Background
2.1 Creation of a sustainable entrepreneurial lands cape in the SEE region It is a known fact that small and medium sized enterprises (SMEs) are a fundamental part of a dynamic and healthy economy [3]. The highest rate of new jobs is created by small and young firms [4]. Also for the sustainable long-term economic growth of the SEE region the key role of entrepreneurship and SMEs has been again recently pointed out in the South East Europe Regular Economic Report of the World Bank [5]. Innovative SMEs are seen as crucial for the necessary shift from an efficiency driven economic growth to an innovation driven economic growth, having the flexibility to respond quickly to changing market conditions and the capability to promote technological and organisational innovation and change [1]. The challenge lies in developing the innovation and entrepreneurship system in the SEE through a high-impact action of enabling a key financing process for innovation and entrepreneurship, which is crucial to the development of a knowledge-based economy. According to the South-East Europe Regular Economic Report 2011 [6], in the Global competitiveness index the SEE6 countries have the lowest performance in the categories of innovation and financial market development. In order to reverse this situation the most important challenges to be immediately addressed would be to accelerate commercialization of research and deepen collaboration with the business sector, as well as to promote higher levels of private R&D investments and facilitate innovative start-up companies. Furthermore, solving these issues on a regional scale is complex and costly, especially if done in a fragmented manner.
2.2 Importance of securing financing for start-ups Many authors [1,7,8] have argued that a major obstacle to entrepreneurial development is the lacking supply of external financing for start-up. According to Kuntchev et al. [9] the lack of appropriate financing is the most severe hindrance to small firms’ growth rate. In their study they confirmed that SMEs are more likely to be credit constrained than large firms. Wang [10] emphasizes the necessity of VC to finance startups, foster innovations and boost entrepreneurship. He also points out that there are an increasing number of cross-border VC

308 Proceedings of International Conference for Entrepreneurship, Innovation and Regional Development
ICEIRD 2014
investments as a crucial enabler for growth-oriented but high-risk new ventures, especially in countries where the domestic supply of private equity is limited. Manolova et al. [11] make the observation that a higher degree of an entrepreneurial venture’s financial network correlates positively with a higher degree of competitive success of new and small business ventures in the context of transition economies based on the insight of Smith [12] who states that against classic theory many new firms are financed to a large extent by other sources of financing than through investments made in company stocks. In order to facilitate a good match between start-up and investor it is also crucial that both sides are aware of the conditions and expectations related to the different sources of funding, which could be linked, for example, to type of product or level of risk [13]. Regarding VCs’ cross-border co-investing Daia et al. [14] have found out that foreign VCs may be bigger and more experienced than local ones but due to geographic distance and cultural differences they may have greater difficulties in gathering necessary information and monitoring their investments. This leads to the situation that foreign VCs on their own tend to seek investments in more information-transparent start-ups while syndicated investment with local VCs can help the perspectives of local ventures to find easier exit possibilities.
3. The VIBE project
The VIBE (Venture Initiative in the Balkan Europe) project aims at supporting the facilitation of innovation and entrepreneurship and at fostering the creation and growth of innovative SMEs and start-up companies in various industry sectors in the SEE region through a wide array of activities. VIBE is an EU co-funded project in the framework of the ‘SEE Transnational Cooperation Programme’. The partnership of the project consists of a variety of organisations, institutions and agencies that belong in various fields of activity around technology, research, innovation and entrepreneurship. The VIBE partnership is composed of 20 partners from 12 different countries of the SEE region (Slovenia, Greece, Italy, Romania, Hungary, Former Yugoslav Republic of Macedonia, Serbia, Albania, Bosnia and Herzegovina, Croatia, Bulgaria, and Montenegro). VIBE started in January 2013 and has a duration of two years The VIBE project follows a simple but strong and innovative methodology to achieve its objectives. The activities of the project address both the challenge of start-ups to access finance by gathering a critical mass of available funding sources across the region and the problem of fragmentation of the markets by providing collaborative platforms (an online web platform as well as off-line events), such as the bi-annual Balkan Venture Forum, investor workshops, investor webinars, and coaching tracks. These project activities lead to increased networking and match making opportunities for all the stakeholders: investors, entrepreneurs and policy makers. The activities of the VIBE project include: Mapping existing actors, activities and needs for coaching, financing and supporting innovative companies; Coaching companies throughout the SEE region to fast-track investment and growth readiness of selected showcase companies in various industry sectors through a combination of peer group seminars/webinars, assignments and expert and peer group feedback; Fostering financing networks by involving business angels, regional funds, corporate investors, banks and venture fund investors; Discussing, defining and testing pragmatic new potential investment incentives support actions by public support agencies especially at the cross-border (co-)investment level; and Partnering with the organizers of the bi-annual Balkan Venture Forum (BkVF). VIBE offers a transnational integrated approach. It avoids unnecessary duplication, it mobilizes a critical mass of the regional investment and innovation agencies and provides investors, policy makers and agencies and high-growth entrepreneurs across the SEE region with efficient support.
309 Proceedings of International Conference for Entrepreneurship, Innovation and Regional Development
ICEIRD 2014
4. Mapping key actors
4.1 Objective One of the main objectives of the VIBE project is to address the problem of deficiency in innovation and financial market development, by reinforcing the collaboration within the business sector and by promoting high levelled private investments on sectors that will boost the productivity and innovation of the region leading to a more robust, innovation-driven growth of the business environment that will be characterized by increased industrial added value and more high-tech exports. For this reason, the project realizes the mapping of existing financing actors for innovative SEE companies, along with key policy actors and support mechanisms. The pool of these entries is offered via an easily accessible and user-friendly web-based directory which functions as a search engine and requires minimum input to provide maximum results. This web-based tool aims at facilitating interested stakeholders to access up-to-date information on key actors of the entrepreneurial ecosystem in the SEE. More specifically, the project offers through this activity an efficient overview of, and web link access to, key actors for innovative companies and their potential investors providing: policy incentives; coaching/incubation/support services; investment/financing sources. In this way, the scattered information is gathered in one place facilitating and accelerating the solution to the needs of new entrepreneurs.
4.2 Methodology The project partners were advised how to identify the relevant actors. In order to ensure a holistic approach a classification matrix was created and offered to the rest of the partners so as to create a detailed overview of every single actor of the SEE entrepreneurial ecosystem. The actors are classified according to ownership (public, private, public-private), geographic provenance (International, EU, National, Regional, Local) and type of activity (Policy, Finance, Support). Authenticity of the sources ensured the validity and reliability of the input. The input was gathered via online and offline research, enquiries and shared sources. For the collection of data for each identified a template was created for each activity level (policy, financing, support service) where the information for key actors could be sorted according to their most suitable characteristics. The third step aimed at ensuring the completeness and the correctness of the entries gathered. The actors that were entered in the directory were approached and asked via email to check the details inserted for their entity as well as to provide additional relevant material (presentations, success stories, newsletters etc.) to enrich the information provided by the web-based searching tool.
4.3 Results The web-based directory is being updated every month with new entries, amendments and alterations where necessary. The current status of the entries available is presented in Table 1.

310 Proceedings of International Conference for Entrepreneurship, Innovation and Regional Development
ICEIRD 2014
Table 1 Current entry statistics in VIBE web directory
CountryPolicy
Level
Finance
Level
Support
LevelTotal
Private
Financ
e
Public-private
finance
Public
finance
International 0 2 1 3 0 0 2
EU 2 7 5 14 0 0 7
Albania 0 0 3 3 0 0 0
Bosnia 5 6 9 20 0 0 6
Bulgaria 1 2 2 5 2 0 0
Croatia 1 3 0 4 0 0 3
FYROM 6 5 11 22 1 0 4
Greece 5 9 9 23 7 0 2
Hungary 3 9 11 23 0 5 4
Italy 6 6 6 18 5 0 1
Montenegro 1 1 4 6 0 1 0
Romania 2 2 34 38 0 0 2
Serbia 3 10 44 57 0 0 10
Slovenia 4 8 9 21 0 6 2
Total 39 70 148 257 15 12 43
4.4 Benefits and challenges The online directory provides an easy, efficient and simple way to access key information about the most important and relevant actors in the SEE region for all interested parties. It presents the most (cost) effective means for supplying those with limited knowledge on available sources for financing and support with easy access to information on an array of opportunities. While such information is partly available at national level it has not been so far provided at cross-border level for the region and not with such detail of information. The directory could be refined through an expansion of identified providers of specified services for start-ups, such as marketing experts, intellectual property law offices, and others, maybe even related to smaller regional entities, such as municipalities, to achieve a maximum effect. Another aspect is the possible enrichment through the provision of visual mapping of the actors as it can be seen in some available national mapping tools (http://startupmapgreece.com/ or http://mappedinisrael.com/service.php). Otherwise, the quality of the directory depends entirely on its being up-to-date and as complete and accurate as possible. Regular control and user involvement should provide for that.
5. Increasing start-up growth and investment readin ess
5.1 Objective Following the main strategic objectives of the VIBE project, attention has been drawn to the reinforcement of startup growth and investment readiness. The focus is on the development of best practices for improving investment readiness of start-ups, on knowledge and experience exchange between participants and experts from the region and on the provision of the necessary know-how so that every start-up can have the opportunity to become a sustainable company and seek investment support.

311 Proceedings of International Conference for Entrepreneurship, Innovation and Regional Development
ICEIRD 2014
5.2 Means of implementation The VIBE project provides for the increase of the start-up growth and investment readiness three main – and at many levels complementary – channels: the Balkan Venture Forum initiative and the venture academy and the coaching tracks. The Balkan Venture Forum (BkVF) is a bi-annual venture capital, private equity and investment forum that rotates through the SEE region. It brings together the relevant key actors of the region, Europe and beyond, and enables successful match-making between innovative business ideas with investors, support agencies and policy makers. A variety of events and relevant stakeholders guarantee the high quality of the forum. There are plenary discussion sessions, keynote speeches by representatives of the industry sector, high level policy meetings and pitching competitions during which promising pre-selected start-ups present their businesses to experts juries, VCs, corporate investors and business angels. The VIBE project is co-organizer of the event for the years 2013-1014. The Venture Academy offers mentoring and coaching to pre-selected start-ups a day before the Balkan Venture Forum. It aims at assisting entrepreneurs to prepare for their pitches and meetings with the investors, while experienced coaches guide them towards the creation of a fine-tuned business plan. The tracks in which it specializes are primarily: ICT, Life Sciences and Clean Tech. Both the Balkan Venture Forum and the Venture Academy initiative foster the entrepreneurial ecosystem by providing a robust framework for improving practical sides of a business, networking and match-making opportunities and investment opportunities. Apart from this, they reinforce the entrepreneurial culture and they kindle the entrepreneurial spirit in the region where they take place. The Coaching Tracks undertake the coaching of innovative SMEs through a combination of peer group seminars/webinars, home assignments and expert and peer group feedback. Each track involves a defined number of entrepreneurs, experts and moderators/trainers, consisting of a introductory kick-off seminar, briefing and assignment webinars with interactive polls and discussions between entrepreneurs and experts on key investment topics, with home work assignments for participating SMEs, and webinar-based feedback sessions between the experts and entrepreneurs..Entrepreneurs can also apply and take part in live presentations to potential venture investors. The startups and experts taking part in the coaching track are mixed across the project partner countries and sector-focused.
5.3 Effects Both the Balkan Venture Forum and the Venture Academy initiative foster the entrepreneurial ecosystem by providing a robust framework for improving practical sides of a business, networking and match making opportunities and investment opportunities. Apart from this, they reinforce the entrepreneurial culture and they stimulate the entrepreneurial spirit in the region where they take place. The results of a survey among the Greek participating start-ups of the Balkan Venture Forum in May 2013, in Sofia, Bulgaria and of the Balkan Venture Forum in November 2013 in Tirana, Albania. show that both events along with the Venture Academy sessions that preceded them left the participants satisfied as they rated them ‘Very Good’ in terms of: organization (Sofia: 87.5%, Tirana: 72.7%), overall experience (Sofia: 87.5%, Tirana: 81.8%), the quality of experts (Sofia: 62.5%, Tirana: 81.8%). Additionally, all the participants from both events would recommend the event to a friend/colleague and all the participants of the BkVF in Sofia and 81.8% of the participants of the BkVF in Tirana would participate in a similar event in the future. The qualitative data that was collected via the questionnaires show that the Forums provided start-ups with opportunities to understand what investors want, good networking possibilities with key players in the region, interesting feedback from the expert juries and the Venture

312 Proceedings of International Conference for Entrepreneurship, Innovation and Regional Development
ICEIRD 2014
Academy coaches, useful tips and exchange of knowledge and experiences with start-ups from other regions. These activities of the VIBE project affects positively the learning curve of start-ups and offers the empowerment and preparation needed for investment readiness. Match making and networking opportunities among start-ups, experts and investors complement the overall impact of the project. The effects of the VIBE project activities are also reflected in regard to changes and improvements in the entrepreneurial landscape happening after the completion of the Balkan Venture Forum in each country due to the event. The Balkan Venture Forum in Sofia, Bulgaria achieved to be the biggest start-up event so far in the country gathering more than 500 international participants and gave a boost to the activities of the local start-up scene. The Balkan Venture Forum in Tirana, Albania led to the initiative to create an incubator with the help of foreign investors having been present at the Forum. Co-operation between start-ups and successful match-making of start-ups with investors boost the communities.
6. Securing early stage investment in SEE and the c ase for syndicated cross-border investment
The VIBE project foresees the organization of local investor workshops in each partner country to discuss relevant issues related to the project objectives primarily from the investor point of view. These workshops are complemented by a series of investor webinars that bring together investors across the SEE discussing key investment issues in innovation sectors across the region of SEE and compare portfolio companies for cross-border partnering. One of the investor workshops was organized in Thessaloniki in February 2014 that brought together Greek investors and start-up support organizations to discuss the following major topics: South East Europe is a region lagging behind in creation of new business, especially high-risk innovative ones. The region phases a challenge in building an environment that encourages creativity and risk taking. Would the development of investment instruments that transcend countries present a possible solution to the fragmentation and small size of the regions’ innovation ecosystem? What would be the conditions and the policy initiatives that can encourage investors and creators to come together over the borders and help overcome small size by creating a truly SEE innovation landscape? The ideas that were expressed during the workshop had the following content: Although Greece has a quite different economic development profile than the rest of SEE in the last 50 years and is an old EU member state, it shares a lot of common characteristics with most of those countries that have recently joined the EU or are into negotiations to become Member States. Regarding the innovation ecosystem Greece and the rest of the SEE countries are characterized by a lack of strong ties between academia/ research and industry/ society and a high aversion towards risk taking. Although entrepreneurship is praised by politicians and opinion makers there are still very negative connotations accompanying it and the general environment remains negative presenting various bureaucratic obstacles as testified by the ranking of all the SEE countries in various studies. For example, according to the World Economic Forum Global Competitiveness Report 2012-13, all the SEE countries with the exception of Slovenia rank from the position 69 to the position 124 in the sub-index ‘innovation and sophistication factors’ out of 144 countries listed. Slovenia ranks rather higher at number 36. The economy of the SEE countries including the start-up ecosystem is characterized by a larger than average concentration to the capital cities creating a huge center-periphery gap. The start-up ecosystem is in its infancy and is characterized by an emphasis on creating “business plans” rather than focusing on how to create enterprises. There is a lack of experienced mentors, lack of available funds especially at the seed level and lack of mechanisms that will encourage the creation of new high risk innovative

313 Proceedings of International Conference for Entrepreneurship, Innovation and Regional Development
ICEIRD 2014
business. Further problems that the start-up ecosystems in Greece and the SEE countries are facing can be summarized as follows: • Entrepreneurs and intermediate organizations (i.e. organizations involved in organizing
innovation competitions) focus their efforts on creating business plans rather than developing business strategy.
• Start-ups have a difficulty to recognize their actual market and their competition (market positioning).
• There is little recognition of forms of innovation beyond technological innovation. However it needs to be emphasized that the different background conditions, history and experience of the SEE countries do not allow for a “copy/paste” of experiences from countries like US and the UK. The challenge is to create a unique SEE approach towards innovation and entrepreneurship that will creatively absorb lessons from other countries and apply them into the unique conditions of SEE. Solutions and policy level interventions that can enhance the viability of the local innovation ecosystem include: • Address the problems that early stage companies phase, especially with costs related to
the regulatory environment such as social security contributions, permits’ fees etc • Create special kind of tax incentives adapted to the needs of the start-ups including tax
incentives for capital repatriation • Re-examine and modernize bankruptcy laws in order to allow failure which is one of the
basic ingredients of start-up success • Help the creation of a business angel’s mentality and grass roots networks of business
angels by carefully designed tax incentives and regulatory modifications. • Encourage the engage of the Diaspora as investors, mentors, advisors, creators and
brokers. • Examine the establishment of a flexible regulatory framework to support crowd-funding Creating investment flow across the border, in a form of syndicated cross-border investment, in a region where investment is scarcely available at the local level, can be seen as a “mission impossible”. However it can also be the solution in a lot of cases where talent, ideas, funds and opportunities are not available in one place, while geographic proximity, common culture and the opportunity for access to larger markets may bring people and resources together. In order to encourage the creation of networks of investors that act in a cross-border fashion and invest in countries other than those of their origin, policy makers should examine: • Negotiating bilateral agreements that will address issues of taxation, profit repatriation,
alignment of available incentives • Offer strong motives in terms of tax incentives and use of available funds like the new
Western Balkan Investment Facility • Creatively use mechanisms like crowd-funding to facilitate cross-border flows of funds • Pull together resources to propose the creation of an EIF backed cross-border fund that
will complement local investments with clear cross-border scope. • Emphasize a shift from competition to complementarity and cooperation.
7. Conclusion and outlook
The VIBE project is an example of how concerted cross-border action can foster the entrepreneurial landscape of the region of South-East Europe. The paper has made the attempt to exemplify through a number of project activities the positive effect that was achieved in regard to increasing the investment and growth readiness of start-up companies as well as the positive impact that has been observed so far in the project partner countries’ entrepreneurial ecosystems and the cooperation capacities of the key players in the SEE region. At the same time it is understood that the full reach of the project’s potential has not

314 Proceedings of International Conference for Entrepreneurship, Innovation and Regional Development
ICEIRD 2014
yet been achieved. With policy makers actively involved in some of the project’s actions the future objective would be to prepare the way for establishing new investment incentives and policies and the creation of a cross-border funding facility specifically targeting innovative SEE ventures, also with the support of key EU and international actors. So far it has become apparent during the project work that initiatives such as the VIBE project have the power to inspire people to engage in cooperation on various levels and between various categories of key players. New communication channels are opened, new networks are formed, and new synergies are created across the SEE region. The idea is that projects such as VIBE, by offering across the SEE region collaborative methodologies and physical and virtual platforms for innovative entrepreneurs, their regional supporters and investors in specialized innovation sectors, such as life science technologies, clean tech, and clever new ICT solutions, can help to overcome, at least partially, the high degree of fragmentation of the SEE region. For the facilitation of sufficient investment capacity for innovative SMEs in SEE there is a need for networks of active investors throughout the region and from the wider EU which give them the opportunity to discuss and finally also execute cross-border co-investment syndicates which would strengthen the governance, the value-added role of the investors and the potential returns.
References 1 Hashi, I, Krasniqi, B.A. Entrepreneurship and SME growth: evidence from advanced and laggard
transition economies. International Journal of Entrepreneurial Behaviour & Research (2011);17(5): 456 – 87.
2 https://www.vibeproject.eu 3 The Power of Many, Realizing the socioeconomic potential of entrepreneurs in the 21st century,
McKinsey, Oct 2011 4 Ayyagari, M, Demirgüç -Kunt, A, Maksimovic, V. Small vs. young firms across the world:
contribution to employment, job creation, and growth. Policy Research Working Paper Series 5631, 2011
5 South East Europe Regular Economic Report of the World Bank http://documents.worldbank.org/curated/en/2013/06/17872878/double-dip-recession-fragile-recovery June 2013
6 South-East Europe Regular Economic Report of the World Bank http://documents.worldbank.org/curated/en/2011/11/15528711/south-east-europe-regular-economic-report-main-report June 2011
7 Gorodnichenko Y, Schnitzer M. Financial constraints and innovation: Why poor countries don’t catch up. IZA Discussion Paper No 4786. Bonn: Institute for the Study of Labor.2010
8 Isenberg, D J “How to Start an Entrepreneurial Revolution, Harvard Business Review. June 2010 9 Kuntchev, V, Ramalho, R, Rodriguez-Meza, J, Yang, J. What Have We Learned from the
Enterprise Surveys Regarding Access to Credit by SMEs? World Bank Policy Research Working Paper No. 6670. http://ssrn.com/abstract=2344038 October 2013).
10 Wang L, Wang, S. Cross-border venture capital performance: Evidence from China. Pacific-Basin Finance Journal (2012);19(1):71-97.
11 Manolova, T S, Manev, I M, Gyoshev, B S. Friends with money? Owner’s financial network and new venture internationalization in a transition economy. International Small Business Journal http://isb.sagepub.com/content/early/2013/04/04/0266242613482482 April 2013
12 Smith, S W. Beg, Borrow, and Deal? Entrepreneurs' Choice of Financing and New Firm Innovation.http://ssrn.com/abstract=1573685 March 2011
13 Daia, N, Hoje, J, Kassiciehc, S. Cross-border venture capital investments in Asia: Selection and exit performance. Journal of Business Venturing (2012); 27(6):.666-84.
14 Saublens, C. All Money is not the Same. EURADA. http://www.eurada.org/files/All%20Money/All%20money-E%20Rev_5.pdf March 2013
315 Proceedings of International Conference for Entrepreneurship, Innovation and Regional Development
ICEIRD 2014
The Presence of Venture Capital in Less Developed Regions - a Key Cultural Necessity?
Aron Jinaru1, Alexandru Caragea2, Roxana Voicu-Dorobantu1, Thomas Straub2, Stefano Borzillo3
1Academy of Economic Studies, Bucharest, Romania, [email protected]
1Academy of Economic Studies, Bucharest, Romania, [email protected]
1Academy of Economic Studies, Bucharest, Romania, [email protected]
2University of Applied Sciences, Fribourg, Switzerland, [email protected]
3SKEMA Business School, France., [email protected]
Abstract
Entrepreneurial performance is closely linked to th e quality and intensity of social motivation and the structure and quality of individ ual motivations, these two planes being found in a relation on the nature-nurture lin k and on the link, through a complex feedback process: mood → (valuing ) → attitudes → (exigency) → abilities → (transfer) → behaviours → (valuing) → acquirement → (exigency) → performance → (transfer) → mood. The absence of venture capital for this proc ess affects all three essential nodes: the valuing, exigency and transfer of best practices. The results of our new study, involving 385 aspiring entrepreneurs , provides important clues to this process.
(This work has been supported by SNF - Switzerland and UEFISCDI - Romania within the Romanian-Swiss Joint Research Project IZERZ0 _142306 / 1)
Keywords action-learning loop, complex feedback, entrepreneurial learning, regional innovation, venture capital
1. Introduction
Since nurture can supplement and supplant nature, this allows experience and culture to profoundly influenced our minds. Prinz [22], Pinker [21] and Damasio [8] provide many arguments supporting this phenomenun. On the other hand, the mind of a single man can profoundly influence humanity’s entire experience and culture. The will and vision of a single nurtured person can change the nutritioner, which will subsequently influence all other nurtured people and the relationships between them. The great figures of religion, politics, art, and science have validated this assertion. Between individuals and the diversified entities (organisations, institutions, etc.) that they create, there is a complex relation on nature/nurture, which becomes more evident when we refer to entities that are less organic and more organisational. In the case of entrepreneurial phenomenon, this becomes increasingly noticeable. The reality of the last half century has shown that a disruptive enterprise, started in a garage, may change a

316 Proceedings of International Conference for Entrepreneurship, Innovation and Regional Development
ICEIRD 2014
culture and a society, and that this experiential change is becoming increasingly incorporated into this individual level. Such developments require on-going search for models that will, as easily as possible, capture the representation and analysis of the rapidly growing complexity phenomenon. This paper briefly presents a model that addresses entrepreneurship from an evolutionary process perspective. Such an evolutionary process proceeds from an action learning stage to action research. Further, we use the model to analyse the characteristics of a profile of Romanian students aspiring to be entrepreneurs. The profile we use results from field research conducted for the project IZERZ0_142306/1: “The Role of Venture Capital to support Entrepreneurship,” which comprises combined Swiss and Romanian research and which is co-financed by the Swiss National Science Foundation and UEFISCDI (Romanian Funding Agency).
2. Entrepreneurship as a cognitive process grounded on will and driven by specific motivations
2.1 Entrepreneurship – an action-learning process
According to Sandu [26], “Being entrepreneur in an emerging market economy is a social innovation. It means learning a new role that is far from what communism taught the people to be. Learning in an adverse environment a new role - this is the great challenge of the (not only) rural entrepreneurs in Romania. The environment of the early 1990 was a deterring one by the economic poverty of the countryside, the decreasing demand on the urban markets due to the general economic decline and the downfall of the agriculture (and other economic industries) in the transition process from the inefficient agricultural cooperatives to a private farming”. In general, entrepreneurs are very special types of thinkers and learners – they specifically use nonlinear (intuitive, creative, emotional, informal, action-oriented) thinking and learning styles and rarely linear (analytical, rational, logical) styles. Pragmatically, entrepreneurship can be viewed as a way to respond to environmental, cultural, social, legal, economic, financial, managerial, technical, etc. challenges. That is, it can be viewed as an action-learning process in which the will factor plays a major role and in which specific intrinsic (passion) and extrinsic motivations are decisive. As Lebret [14] shows, the (innovative) entrepreneur needs “passion and ambition; [a] pioneering spirit which accepts uncertainty and risk-taking, which tolerate failure; innovation via a trial and error process; [a] feeling of urgency and patience from the social environment; rapid growth and [a] critical mass; ..motivation, hard work, connections, personal networks, mentors; ...experienced teams backing the founders and motivated by [an] optimised capital structure”.
2.2 The Action-learning loop (A-LL)
We call the model presented here the action learning loop (A-LL). This model allows an understanding of the dynamics of the complex interaction between motivating and motivation in learning action. In addition the model is an adaptation of two other models: one by Colceag [5] and the other by Caragea [3]. A. The first part of this cognitive process has a Piaget-type architecture. Learning a new ability (1) occurs on the assimilation layer. Once developed, the new ability is transferred {T} to the enaction level where an experiential/experimental behaviour on the (dis)integration layer practices it. On this (dis)integration layer, it comes into conflict with the old cognitive structures/routines, which can be destructured/disintegrated; in some cases, cognitive lacunas can be emphasised. This process leads to a validation/valorisation {V} of

317 Proceedings of International Conference for Entrepreneurship, Innovation and Regional Development
ICEIRD 2014
the new cognitive experience, after which, the accommodation and concretisation process of the new cognitive acquisition occurs on the enaction level (3), by means of what Piaget [20] calls the “équilibration majorante”. The latter is a process dictated by a need for cognitive optimisation, through which, as Broche et al. show [2], it naturally results (more or less consciously) in "the introduction of a new maximum compatible with the maximum preservation of acquisitions already validated". The result is a leap in ability to respond to new demands expected/required {E} at the enaction level together with jumps in performance (4). This time, however, we can refer to the success or failure of the learning sequence – of the cost-benefit ratio after the learning process –, which required an inherent investment effort and strongly influences the mood for and attitude to attempt new sequences.
Fig 1. The Action-Learning Loop (A-LL)
B. The second part of the illustrated process highlights the effects and consequences of success that is beyond expectation, one that is below expectations, and of failure (integration failure and/or failure to accommodate the new ability that was superficially learned earlier, and/or failure due to insufficient cognitive prerequisites). b.1 Any personal success or failure is inevitably emotionally perceived and is embodied, integratively or disintegratively (depending on the case), according to the pre-existing mood (5). Successes and failures therefore inevitably affect mood (this sequence is therefore depicted as a distinct cognitive process).Further, the successes or failures of others affect the audience deeply, sometimes even more than the protagonists who have experienced these. Think of the many times that a competition audience is even sadder than the competitor who loses a competition? b.2 On the other hand, it is known that mood affects attitude (6) towards learning but cannot change this attitude permanently, unless favourable circumstances occur to at least encourage a switch to the enaction level. Such circumstances should facilitate the expression of additional intrinsic motivation, which a successful experience and the perception of the possibilities {V} to enhance the learning effort’s efficiency should create. Further, the change of attitude towards the learning goals and towards the behaviour requirements {E}, which the goals and requirements inherently impose, facilitates the entire learning process. For example, for our purposes, Rogers [24] identifies the learning climate change’s particularly strong influence on the attitude towards learning. Tenenbaoum [29] shows that a change in attitude leads to temporarily choosing to pay more selective attention, in the sense targeting an objective, which facilitates assimilation of the learning material.

318 Proceedings of International Conference for Entrepreneurship, Innovation and Regional Development
ICEIRD 2014
"What he will learn is determined in part by his readiness to receive" remarks Mill. [17] in respect of this process. Finally, any measurement based on a questionnaire or an interview, even if they measure aspects related to skills, only measures the knowledge acquisition already validated and not new abilities. b.3 A learning process can take place with or without the assistance of a mentor (teacher, instructor, trainer, etc.). If the process is assisted, the tutor – to a lesser or greater extent – takes control of the sub processes located at the (self)-regulating level {V, T, E}. For example, he may interfere with sub-process {E} by imposing topics, documentary sources, thresholds, performance targets, and even the learning style or practice. In respect of the sub-processes {T}, a supervisor can decide on switching exercises, a workout, etc., can provide performance role models that should be followed, or can mitigate the impact of the transfer of failures in a bad mood state. b.4 Intervention in the sub-process {V} is, however, often limited. At this point, the pedagogy interferes with psychotherapy and psychological counselling, especially if the “l' équilibration majorante” fails, or in cases of neuroticism associated with transition from the actual level of personal development to the next one, which Dabrowsky [7] emphasises. In the case of a sub-process {V}, the easiest method of intervention is by encouraging and creating the right climate for enjoyment, or for mitigating the influence of a bad mood on attitudes towards learning. With regard to unassisted (informal) learning, learners mostly make these interventions subconsciously, sometimes consciously, especially in the case of those who manage or have previously learned to use a second, reflective loop learning. In this case, learning becomes a type of action research, a process with two feedback loops [1]. As noted in 2.1 entrepreneurs are inclined to learn unassisted and metacognitively. By seeking niches and new situations in which to learn, they are actually action researchers in the sectors of the socio-economic reality in which they are and which are poorly explored. Therefore, in their case, assisting learning is geared towards accelerating learning regarding how to learn and how to conduct action research in other frameworks than those specific to formal education. For entrepreneurs, the best way to learn is from practice to conceptualisation, and not vice versa. In Romania, entrepreneurship education is overwhelmingly focused on conceptual exercises and are far removed from practice. This explains entrepreneurship’s lack of performance in general rather well, and especially innovative entrepreneurship.
2.3 How are individual and social motivations inter connected?
Finally we can glimpse one of the benefits of this model: It allows a better understanding of the feedback and control mechanisms through a learning process that can be modulated, stimulated, or inhibited in assisted and unassisted processes. If we consider society and the socio-economic environment as factors that constrain or facilitate some learning processes rather than others (what essentially makes a teacher?), we can more generally see the interests and intentions of a culture. To do so, we need to take into account the content of paragraphs b.3 and b.4 to see that intervention through incentives and/or inhibitory elements {V} (in the background layer of dis(integration) and at the (self)regulating) level, when the own intentions and interests interfere with educational factors. And if we define culture from an epigenetic perspective as “a set of abilities and practices that allow members of one generation to learn and change and to pass the results of that learning on to the next generation” [10], we see that we cannot really talk of unassisted processes; the social instructor, namely the culture, constantly interferes with any learning process.
2.4 Venture capital as a social instructor

319 Proceedings of International Conference for Entrepreneurship, Innovation and Regional Development
ICEIRD 2014
We can regard any business as a cognitive process whose performance is aimed at moving from one board to another one by passing the exam of activity report, whether it requires mainly a financial profit, a certain social and/or environmental impact, or a mix of all three. Venture capital intervenes in a business when there is an internal motivation to grow, which requires a capital contribution. The capital that venture capital supplies is more than money. Venture capital also enters a business with a new body of valuable knowledge aimed at increasing the scale: specific expertise and a portfolio and collateral trust relationship. This is attractive for any entrepreneur. There is also a part that only appeals to a certain category of entrepreneurs – VC requires new standards for working and management to be adopted in exchange for capital. VC acts as a very strict educator. And this role is enacted even before the investment negotiations have been completed. Consequently, entrepreneurs really seeking venture capital always prepare learn their lessons in advance. Especially in the early stages of a pre-start-up and a start-up wish to attract VC but few succeed. The presence of VC a region is socially perceived as a “wanted examiner”. This affects entrepreneurs, giving them an opportunity to consistently write exams with real stakes. These stakes are so enticing that they accept the new rules and make an effort to meet the VC exam’s requirements – their unassisted learning becomes more systematic, better structured and thematically more focused. Moreover, they become more aware of the necessity of non-formal education (consulting, mentoring, training, etc.), therefore actively searching for such opportunities. From this perspective, venture capital:
• accelerates and catalyses the healthy growth of learning processes and/or impacts entrepreneurship.
• creates demand for a broad suite of knowledge-intensive services. VC’s potential influence on the entrepreneurial environment is more efficient and more impact effective than any other investor, who is likely to act bureaucratically and rigidly, only attracting entrepreneurs with money and not with components beyond capital. We thus see that the absence of venture capital in a region affects all three essential nodes on the (self)regulating level of the entrepreneurial, continuous action-learning process: valuing, exigency and the transfer of best practices. The process and the facts presented here are valid for all forms of profit-oriented and/or impact investments that function on the operating principles of venture capital.
3. The absence of venture capital in Romania – effe cts on the entrepreneurial action-learning loop (A-LL)
This section deals with relevant research findings from the A-LL model perspective. Our research project, from which these findings are taken, is aimed at better understanding and valuing the role of venture-capital-driven innovation policies when building a favourable environment for the sustainable growth (development) of underdeveloped Romanian regions by generating creative and innovative economic and/or social enterprises. The project is organised into several sub-projects with different objectives and results. The objectives of the sub-project , from which we present these findings, are:
• to determine the perceptions of representatives – with an active role in the innovation system – of the historical and actual factors pertaining to the business environment, culture, and education system that contributes negatively to the development of innovative entrepreneurship in underdeveloped Romanian regions,
• to identify the characteristics of the entrepreneurial profile of Romanian youth aspiring to be entrepreneurs by primarily seeking to highlight the most striking non-entrepreneurial characteristics,

320 Proceedings of International Conference for Entrepreneurship, Innovation and Regional Development
ICEIRD 2014
• to understand how to intervene when informal, non-formal and formal levels are formed in order to facilitate the development of innovative entrepreneurship in Romania’s specific conditions.
3.1 The precariousness of entrepreneurship in Roma nia - historical factors
In Romania, the most important factors which explain the precariousness of entrepreneurship, are: a) The historical-cultural legacy
• The precariousness of the interwar entrepreneurship history, together with a deficiency of modernity in Romania, and the non-existence of (legal) entrepreneurship during the communist period. The exception was a short period from 1968 to 1971 - when private entrepreneurs and trustees (a form of semi-private trade organised as small businesses) delayed the development of true entrepreneurial behaviour);
• The burden of the ”bișniță” entrepreneurial type during the communist period, which was a phenomena of the black and grey markets.
b) The situation during the transition period
1. The precariousness due to objective factors such as the poverty; the regional disparities; the lack and/or inadequacy of capital resources (primarily financial, social, and cultural capital); insufficient abilities, capabilities, behaviours, and knowledge of specific entrepreneurial free markets; the national and/or regional markets were relatively small (especially for growth entrepreneurship)
2. The precariousness due to subjective factors such as the corruption, uncertainty, adverse or inappropriate legislation; negative terminology, for example, "entrepreneurship hyena", "entrepreneurship eagle/vulture", "entrepreneurship captures a weak state”; the lack or inadequacy of the public policies for the development of entrepreneurship in general, especially of innovative entrepreneurship
Romania’s entrepreneurship development became stagnant after its accession to the EU, due to the economic crisis, and especially due to inadequate policies and corruption. Nevertheless, in recent years, the country has run entrepreneurship training projects, which have been mostly inadequate, too formal and too didactic, and which were funded by the EU through the HRD programme. According to different EU and global entrepreneurship and innovation measures and indexes during the last few years, Romania is still in the same precarious situation, as it is positioned last in the annual rankings of comparative evaluations such as the Global Entrepreneurship Monitor, the Global Competitiveness Report, the Innovation Union Scoreboard, the Global Venture Capital & Private Equity Country Attractiveness Index, etc.
3.2 Perception of the innovation experts and stake holders
In open interviews conducted with 38 business, government and university representatives with an active role in the strategic design of innovation and competitiveness at national and regional levels, we deduced the following conclusions with regard to our first study objective: Regarding the entrepreneurial culture perception more than 33 of the 38 respondents indicated that:
• The Romanian society and culture does do not encourage an entrepreneurial spirit. • The cultural profile of the region discourages an entrepreneurial spirit.

321 Proceedings of International Conference for Entrepreneurship, Innovation and Regional Development
ICEIRD 2014
• Failure is seen rather as a barrier to future business projects. Regarding the education and training perception, more than 31 of the 38 respondents indicated that:
• Students need to follow a specific training in order to become entrepreneurs. • Very few universities present academic programmes and or initiatives that promote
the success stories of young entrepreneurs.
3.3 Some relevant findings of the quantitative rese arch
One of the premises from which we started the research was that in less developed countries and regions without an entrepreneurial tradition that evolved naturally over time, or that was interrupted by almost half a century of communism, it is inadequate to merely adopt models as turnkey solutions. These models aim to stimulate an entrepreneurial culture and to develop creative entrepreneurs, but they are mostly taken from the countries with a developed economy and with a rich and uninterrupted tradition of entrepreneurship. In these less developed countries and regions, radical innovation is necessary, perhaps even a disruptive one. Consequently, in the first research cycle, we chose a questionnaire as our method for further comparative investigation. This questionnaire would be from the perspective of entrepreneurship in a developed country and would allow the characterisation of en entrepreneurial profile. After a bibliographic overview, we chose a questionnaire similar to that which the Business Development Bank of Canada offers as a tool for self-evaluation [30]. We applied this questionnaire to young Romanians that aspire to entrepreneurship, from three development regions. The questionnaire was originally applied to 522 participants, but we only collected valid responses from 385 participants. This questionnaire allows for the characterisation of the entrepreneurial profile of a population investigated from three main perspectives: motivations, attitudes and aptitudes, each of which focuses on two or more specific categories as in the following: Motivations
• Need for achievement/success – the desire to progress, excel, perform. • Power/control appeal - the desire to lead and influence. • Need for challenges/ambition - constantly looking for ways to take on different
projects, to achieve dreams and constantly manifesting a need to learn. • Self-sufficiency/freedom - being able to make decisions independently.
Attitudes • Perception of acting on one’s destiny – it is typical for entrepreneurs to believe that
they can influencing events through the actions they take. • Action oriented - the fundamental characteristic of an entrepreneur.
Aptitudes • Perseverance/determination – the capacity to persist in one’s efforts to find solutions
to problems. • Self-confidence/enthusiasm - a person with self-confidence knows his own value, and
is optimistic about his ability to achieve • Tolerance towards ambiguity/resistance to stress – the capacity to tolerate ambiguity
and to handle and manage the stress created by uncertainty. • Creativity/imagination – being curious, inquisitive, able to anticipate and to imagine
various solutions to a problem. The results obtained from aspiring young Romanian entrepreneurs are shown in Figure 2.

322 Proceedings of International Conference for Entrepreneurship, Innovation and Regional Development
ICEIRD 2014
3.4 Discussion
As can be seen from this graph, the main non-entrepreneurial traits of Romanians are related to:
• motivation – specifically the aspects “being able to make decisions independently (freedom)” and “the desire to progress, excel, perform ... (success)”
• natural aptitude related to the “capacity to tolerate ambiguity and to handle and manage the stress created by uncertainty (resistance to stress)”
The findings of the questionnaire-based research were translated into a diagnostic. The graph below shows that:
• there is distrust in the own ability to complete tasks and reach goals, or specific performances. This manifests itself as a lack of desire combined with a lack of ability to tolerate ambiguity, to handle and manage the stress created by uncertainty – this is an image that can be translated as an indication of a bad mood.
Figure 2 – Entrepreneurial Profile Chart If we see motivation as a process used to allocate energy to maximise the satisfaction of needs, the above situation becomes clear. The environmental uncertainty and the difficulty of obtaining resources for start-up entrepreneurship are particularly great, if a region or a country is poor, the social and economic environment is unstable, and because the transition is not yet complete. All of these are true in respect of Romania, which has the second lowest GDP/capita in the EU. The personal effort involved in a start-up in Romania is much higher and this leads to demotivation, which includes aspects such as the "need for achievement". In Table 1, the eight questions in the questionnaire to which the participants’ responses were predominantly non-entrepreneurial (with a score greater than 0.5), the first four refer to motivations. Of these, three are related to "self-sufficiency" and one to "need for achievement" (in terms of a financial resource). The remaining four questions about the "need for achievement" were located in positions 9, 28, 36, 40 of the total of 50. This could mean that improving portential young Romanian entrepreneurs’ access to finance could radically increase their motivation for entrepreneurship and trigger a positive
Success
Ambition
Control appeal
Freedom
MOTIVATION (All)
Action oriented
Acting upon one's destiny
ATITUDES (All)
Imagination
Determination
Enthusiasm
Resistance to stress
APTITUDES (ALL)
0 0,1 0,2 0,3 0,4 0,5 0,6
Entrepreneurial Profile ChartThe Main Non-Entrepreneurial Characteristics
(coloured red)
Non-Entrepreneurial Score
385 R
om
ani
an E
ntrepr
eneur
ship
Aspirants
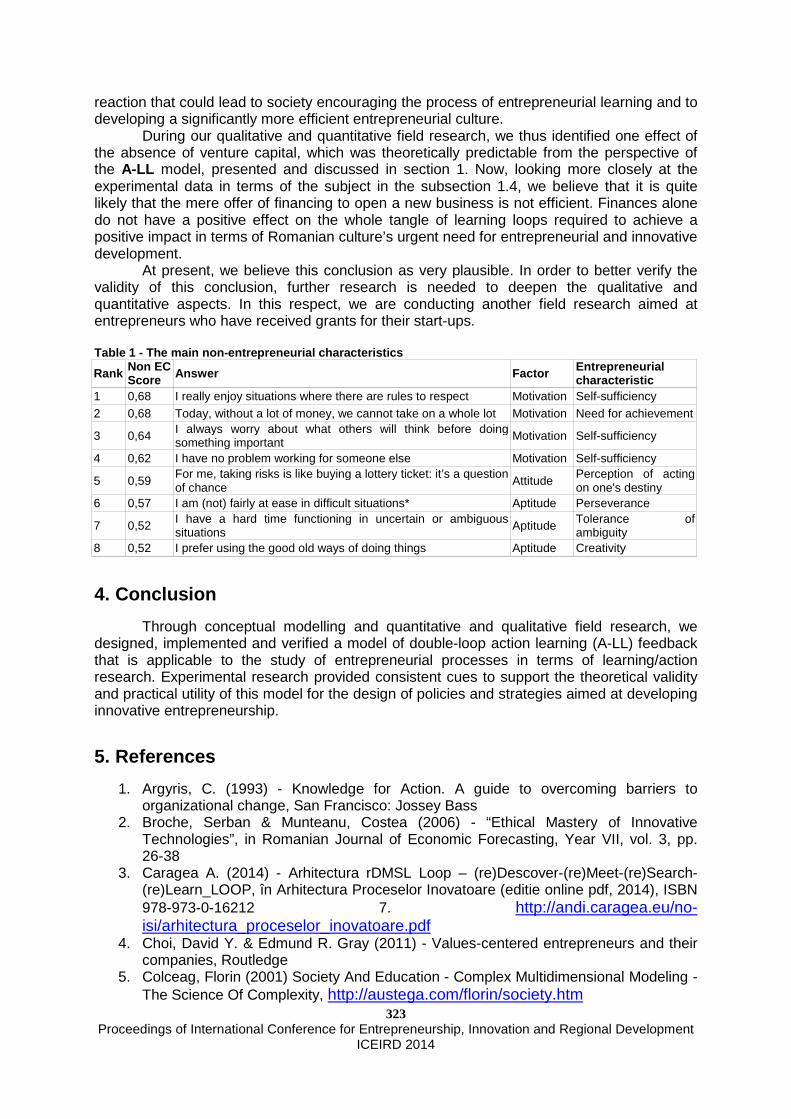
323 Proceedings of International Conference for Entrepreneurship, Innovation and Regional Development
ICEIRD 2014
reaction that could lead to society encouraging the process of entrepreneurial learning and to developing a significantly more efficient entrepreneurial culture. During our qualitative and quantitative field research, we thus identified one effect of the absence of venture capital, which was theoretically predictable from the perspective of the A-LL model, presented and discussed in section 1. Now, looking more closely at the experimental data in terms of the subject in the subsection 1.4, we believe that it is quite likely that the mere offer of financing to open a new business is not efficient. Finances alone do not have a positive effect on the whole tangle of learning loops required to achieve a positive impact in terms of Romanian culture’s urgent need for entrepreneurial and innovative development. At present, we believe this conclusion as very plausible. In order to better verify the validity of this conclusion, further research is needed to deepen the qualitative and quantitative aspects. In this respect, we are conducting another field research aimed at entrepreneurs who have received grants for their start-ups. Table 1 - The main non-entrepreneurial characterist ics
Rank Non EC Score Answer Factor Entrepreneurial
characteristic 1 0,68 I really enjoy situations where there are rules to respect Motivation Self-sufficiency 2 0,68 Today, without a lot of money, we cannot take on a whole lot Motivation Need for achievement
3 0,64 I always worry about what others will think before doing something important Motivation Self-sufficiency
4 0,62 I have no problem working for someone else Motivation Self-sufficiency
5 0,59 For me, taking risks is like buying a lottery ticket: it’s a question of chance Attitude
Perception of acting on one's destiny
6 0,57 I am (not) fairly at ease in difficult situations* Aptitude Perseverance
7 0,52 I have a hard time functioning in uncertain or ambiguous situations Aptitude Tolerance of
ambiguity 8 0,52 I prefer using the good old ways of doing things Aptitude Creativity
4. Conclusion
Through conceptual modelling and quantitative and qualitative field research, we designed, implemented and verified a model of double-loop action learning (A-LL) feedback that is applicable to the study of entrepreneurial processes in terms of learning/action research. Experimental research provided consistent cues to support the theoretical validity and practical utility of this model for the design of policies and strategies aimed at developing innovative entrepreneurship.
5. References
1. Argyris, C. (1993) - Knowledge for Action. A guide to overcoming barriers to organizational change, San Francisco: Jossey Bass
2. Broche, Serban & Munteanu, Costea (2006) - “Ethical Mastery of Innovative Technologies”, in Romanian Journal of Economic Forecasting, Year VII, vol. 3, pp. 26-38
3. Caragea A. (2014) - Arhitectura rDMSL Loop – (re)Descover-(re)Meet-(re)Search-(re)Learn_LOOP, în Arhitectura Proceselor Inovatoare (editie online pdf, 2014), ISBN 978-973-0-16212 7. http://andi.caragea.eu/no-isi/arhitectura_proceselor_inovatoare.pdf
4. Choi, David Y. & Edmund R. Gray (2011) - Values-centered entrepreneurs and their companies, Routledge
5. Colceag, Florin (2001) Society And Education - Complex Multidimensional Modeling -The Science Of Complexity, http://austega.com/florin/society.htm

324 Proceedings of International Conference for Entrepreneurship, Innovation and Regional Development
ICEIRD 2014
6. Crossan, M. M., Lane, H. W. & White, R. E. (1999) - An organizational learning framework: From intuition to institution. Academy of Management Review, 24(3)
7. Dabrowski, K & Piechowski, M.M. (1977) - Theory of levels of emotional development (Vols.1 & 2). Oceanside, NY: Dabor Science
8. Damasio, Antonio (2005) - Descartes' Error: Emotion, Reason, and the Human Brain, Putnam, 1994; revised Penguin
9. Drucker, Peter (1993) - Innovation and Entrepreneurship, New York, NY : Harper-Collins
10. Gopnik. A (2014) - Time to Retire The Simplicity of Nature vs. Nurture – The Wall Street Journal, Jan. 24, http://online.wsj.com/news/articles/sb10001424052702304302704579334954138196792
11. Gruber, M., MacMillan, I. C. & Thompson, J. D. (2012) - From minds to markets: How human capital endowments shape market opportunity identification of technology start-ups. Journal of Management, 38
12. Haynie, J. M. & Shepherd, D. A. (2009) - A measure of adaptive cognition for entrepreneurship research. Entrepreneurship Theory and Practice, 33(3)
13. Kahneman, D. (2011) - Thinking, fast and slow. London: Penguin 14. Lebret, Herve (2007) – Start-up What we may still learn from Silicon Valley, EPFL
Lausanne, p. 183 15. Lowe, Janet. (2009) - Google speaks: secrets of the world’s greatest billionaire
entrepreneurs 16. MacDonald, Robert W. (2008) - Beat the system : 11 secrets to building an
entrepreneurial culture in a bureaucratic world, John Wiley & Sons, Inc., 17. Mill, R. Cyril (1960) - Attitudes Affect Pupil s Learning, Educational Leadership 17:
212, January 18. Mitchell, R. K., Busenitz, L., Lant, T., McDougall, P. P., Morse, E. A., & Smith, B.
(2004) - “The Distinctive and Inclusive Domain of Entrepreneurial Cognition Research.” Entrepreneurship Theory & Practice, 28(6)
19. Nandram S.Sharda & Karel J. Samsom (2006) - Spirit of Entrepreneurship, Springer Verglag
20. Piaget, J., (1967) - Biologie et connaissance. Essai sur les relations entre les régulations organiques et les processus cognitifs, Paris: Gallimard (Idées)
21. Pinker, Steven (2002) – The Blank Slate: The Modern Denial of Human Nature, Viking
22. Prinz, Jesse J. (2012) – The Conscious Brain How Attention Engenders Experience, Oxford University Press
23. Pritchard, R. & E. Ashwood (2008) - Managing Motivation. New York: Taylor & Francis Group
24. Rogers, R. Carl (1959) – Significant Learning in Therapy and in Education, Educational Leadership 16: 232, January 1959
25. Sadler-Smith, E. (2010) - The intuitive mind: Profiting from the power of your sixth sense. West Sussex: John Wiley & Sons Ltd.
26. Sandu Dumitru (2000) – Entrepreneurship and Social Capital in Romanian Villages, Romanian Journal of Sociology, XI, 1-2, Bucharest
27. Schön, D. A. (1983) - The Reflective Practitioner. How professionals think in action, London: Temple Smith
28. Stenholm, Pekka, Z. Acs & R. Wuebker (2013) - Exploring country-level institutional arrangements on the rate and type of entrepreneurial activity, Jour/ of Business Venturing, 28,
29. Tenenbaoum, Samuel (1959) – ”Carl R. Rogers and Non-Directive Teaching”, Educational Leadership 16: 296, February

325 Proceedings of International Conference for Entrepreneurship, Innovation and Regional Development
ICEIRD 2014
30. Web site (2013) of Business Development Bank of Canada www.bdc.ca/EN/advice_centre/benchmarking_tools/Pages/entrepreneurial_self_assessment.aspx


327
FOSTERING ENTREPRENEURSHIP AND INNOVATION

329 Proceedings of International Conference for Entrepreneurship, Innovation and Regional Development
ICEIRD 2014
A Methodology Guide for the Transformation of Research to Innovation
Athanasios P. Kalogeras1, Christos Anagnostopoulos1
1Industrial Systems Institute, PSP Building, Stadiou, 26505 Platani, Patras, Greece (Tel: +302610910308; email: [email protected] ; [email protected]).
The present paper presents a methodology guide for the transformation of research results into innovations. This methodology guide pr ovides a detailed break-down of the process for the transformation of research to i nnovation into its distinct steps and identifies the different skills that are needed for the implementation of each step. The steps of the process that needs to be followed for the transformation of research to innovation comprise the Business Scheme Selection, the Market Research elaboration, the innovation Analytical Design for t he determination of its Technical Feasibility, the Detailed Design and Testing of the innovation, the potential Redesign and Production of the innovation and finally the in novation Marketing and Distribution. The paper maps the process for the transformation o f research to innovation on different axes comprising the technological aspects of the innovation, its market aspects and the business aspects of the overall end eavor. The presented methodology has been elaborated out of the analysis of successful experiences relevant to innovations mainly but not limited to t he industrial informatics and embedded systems sectors. It presents the process t hat may be followed by a research team / would-be entrepreneurs in order to proceed and launch successfully to the market an innovation out of some research re sult. Finally, the paper deals with the issue of Intellectual Property and the differen t forms of protection of Intellectual Property rights of a prospective innovation stemmin g out of some research result. Work presented in this paper has been financed in t he framework of the South East Europe Transnational Cooperation Programme and supp orted by the KRIPIS VISETAK project.
Keywords Innovation, Intellectually Property, Modeling, Process.
1. Introduction
Innovation represents a challenge for research teams, Small and Medium Enterprises (SMEs), large industries and economies in general, as it is viewed as a catalyst for competitiveness in an increasingly competitive world. Reaching significant research results and achieving technological progress does not by each own create a competitive advantage. A further step is needed in order to transform research to innovation and turn research results into innovative products and services. It has been identified since 1995 [1] that the real problem in Europe is not the lack of ideas or solid research work but the lack of entrepreneurs and innovators specifically. Even though, there are people who have the qualifications to develop the right ideas, there are very few people who can take these ideas and transform them to innovations. This phenomenon has been described as the “European paradox” and results in loss of competitiveness, growth and jobs for Europe as well as of quality of live, new products and services for its citizens.
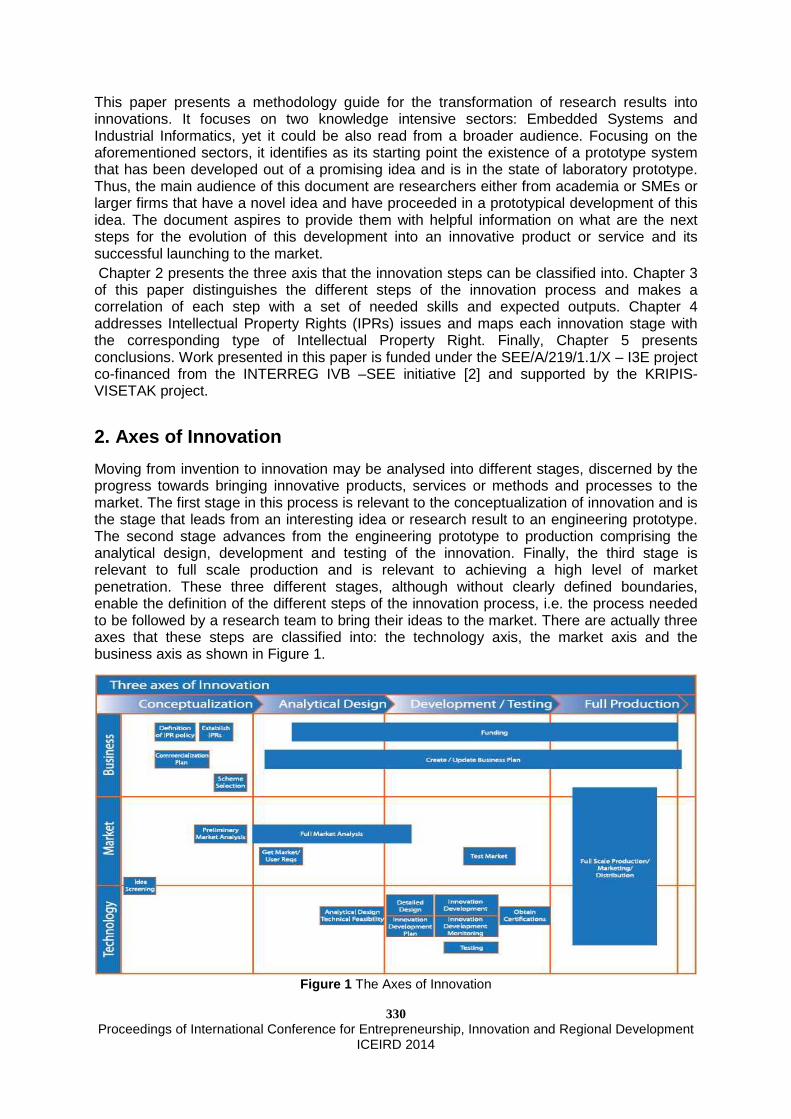
330 Proceedings of International Conference for Entrepreneurship, Innovation and Regional Development
ICEIRD 2014
This paper presents a methodology guide for the transformation of research results into innovations. It focuses on two knowledge intensive sectors: Embedded Systems and Industrial Informatics, yet it could be also read from a broader audience. Focusing on the aforementioned sectors, it identifies as its starting point the existence of a prototype system that has been developed out of a promising idea and is in the state of laboratory prototype. Thus, the main audience of this document are researchers either from academia or SMEs or larger firms that have a novel idea and have proceeded in a prototypical development of this idea. The document aspires to provide them with helpful information on what are the next steps for the evolution of this development into an innovative product or service and its successful launching to the market. Chapter 2 presents the three axis that the innovation steps can be classified into. Chapter 3 of this paper distinguishes the different steps of the innovation process and makes a correlation of each step with a set of needed skills and expected outputs. Chapter 4 addresses Intellectual Property Rights (IPRs) issues and maps each innovation stage with the corresponding type of Intellectual Property Right. Finally, Chapter 5 presents conclusions. Work presented in this paper is funded under the SEE/A/219/1.1/X – I3E project co-financed from the INTERREG IVB –SEE initiative [2] and supported by the KRIPIS-VISETAK project.
2. Axes of Innovation
Moving from invention to innovation may be analysed into different stages, discerned by the progress towards bringing innovative products, services or methods and processes to the market. The first stage in this process is relevant to the conceptualization of innovation and is the stage that leads from an interesting idea or research result to an engineering prototype. The second stage advances from the engineering prototype to production comprising the analytical design, development and testing of the innovation. Finally, the third stage is relevant to full scale production and is relevant to achieving a high level of market penetration. These three different stages, although without clearly defined boundaries, enable the definition of the different steps of the innovation process, i.e. the process needed to be followed by a research team to bring their ideas to the market. There are actually three axes that these steps are classified into: the technology axis, the market axis and the business axis as shown in Figure 1.
Figure 1 The Axes of Innovation

331 Proceedings of International Conference for Entrepreneurship, Innovation and Regional Development
ICEIRD 2014
The technology axis is relevant to the technical development of the innovation, starting from an idea, which could be based on research results or identified market needs, and leading to an engineering prototype during the conceptualization stage, moving to product or service during the second stage and to full scale production during the last stage. The market axis is relevant to the interaction with the market throughout the development of the innovation starting from a preliminary analysis during the first stage, moving to full market analysis, sales and distribution during the second stage and increasingly complex marketing, distribution and market response during the last stage. Finally, the business axis is relevant to the business steps needed including IPRs protection, commercialization and business scheme selection during the first stage, business formulation and access to financing during the second stage and business development during the third stage. It is evident that the three axes activities interrelate throughout the innovation process as market and technology have to go hand by hand throughout the specification, design, and development of a product or service, in order for it to be a success, while the business aspects determine the framework under which the development of innovation takes place.
3. Innovation Steps: Skills and Outputs
The modelling and the formalizing of the innovation process are crucial for the understanding of the path that needs to be followed for the transformation of and invention to innovation. Based on the “chain-link” model proposed by Kline and Rosenberg [3], the following process workflow, as illustrated in figure 2, depicts the steps that have to be taken by the innovator in order to generate innovation out of a research result.
Figure 2 Innovation Process workflow [4]
With reference to the aforementioned model, each step of the innovation process can be associated with a set of outputs expected and skills needed for its successful completion.
3.1 Scheme Selection
The inventor/researcher and the innovator may be the same or different entities. At this early point of the innovation process, the innovator has to decide which path to take in order to commercialize his/her idea or research result. The following list includes the most important alternatives and describes the new role of the inventor/researcher in the schema:

332 Proceedings of International Conference for Entrepreneurship, Innovation and Regional Development
ICEIRD 2014
• Selling the research result: the inventor/researcher identifies the intellectual assets of his/her work, protects them by identifying the corresponding type of IPR, markets them in order to find an interested third party, and finally he/she sells them. The buyer will now play the role of the innovator.
• Licensing: in this case the inventor/researcher follows the actions taken in the previous alternative, but he/she does not sell the IPRs. Instead, he/she receives licensing fees by the licensees for exploiting his/her work for a predefined time period. The role of the innovator is shared among the inventor/researcher and the licensees.
• Creating a partnership: the innovator/researcher seeks for partnership in order to exploit his/her research work. The role of the innovator is now played by the allied partnership.
• Creating a start-up: the inventor/researcher undertakes the whole burden of the innovation process by creating a start-up company.
3.2 Market Research
In this step a market research is conducted in order to identify if the product, service or process. The output of this step would be a Market Analysis and Plan. This document, providing the market aspects, should be regularly updated throughout the innovation process and be part of the overall Innovation Business Plan. Marketing skills are needed for the implementation of this step. There is a high possibility that the innovator/entrepreneur does not have such skills. In this case external expertise should be sought. The task of market research and analysis is complex and there are different tools and methodologies that could help to this end, including: • Statistical models offering a higher understanding of the market and its characteristics. • Advanced concepts, like User Driven Innovation focusing on what a customer/user
regards as an innovation, the necessary skills to analyze the user needs and the methods to collect these needs. Another example of such advanced concept is the Market Pull – Technology Push paradigm that services market needs through innovative products and services or innovative characteristics of existing products and services.
• Advanced methods to gather user feedback such as: a) intensive use of social media allowing collective intelligence for an anticipated innovation to be captured, organized and shared in a fast way or b) the adoption of the Open Innovation model which utilizes whatever knowledge is available in order to ba) better understand the market and get its feedback as well as bb) enhance the anticipated product and service through existing and available innovations that could be incorporated and further enhance its characteristics.
• Advanced strategy tools allowing to identify market strategies and focus, such as: a) Blue Ocean strategy aiming not at out-performing competition in an existing industry but rather creating a new market space (the blue ocean) and thus making the competition irrelevant, or b) the Boston Consulting Group (BCG) matrix method that focuses on long-term value creation determining priorities in a product portfolio.
3.3 Analytical Design – Technical Feasibility
Based on the user requirements and their mapping to the initial specification of the research result an analytical design has to take place detailing the functional specification of the expected innovation. This analytical design is expected to provide the needed input for the elaboration of a technical feasibility study of the innovation, i.e. to answer the question whether the envisaged research result is possible to be developed taking into account the current state of technology.

333 Proceedings of International Conference for Entrepreneurship, Innovation and Regional Development
ICEIRD 2014
The main outputs of this step comprise the Functional Specification of the innovation, the Technical Feasibility Report that maps the system specification to specific technological solutions and proves that the innovation is technically feasible or identifies the existing technical barriers, and the Preliminary Innovation Business Plan which maps the Market Analysis and Plan conducted in the previous step to the innovation characteristics and costs. In this context at the end of this step a major milestone is reached answering whether the project is technically and economically feasible. At this point a decision is taken to either drop the project or continue with the detailed design and development phase. Different skills are needed during this phase including Technical skills, Engineering skills (production relevant), Accounting Skills (cost analysis), Business Management skills (innovation project architecture, elaboration of business plan). The innovator/entrepreneur might not have all the necessary skills to efficiently complete this step. It is usual that the technical skills required are present in the innovator entity and represent one of its strengths. In this context it is expected that most of the technical activities during this phase, such as state-of-the-art survey or system/sub-system break down, are done in-house. Whatever missing skills should be outsourced or allocated to external experts.
3.4 Detailed Design and Test
The innovator can prove the technical feasibility of the innovation since he has created the feasibility study. In addition, the elaborated business plan can show the expected profitability of the project. Therefore, the next step should be the actual development of the innovation and its testing. Moreover, this is the phase when substantial financing is needed. During this phase, a set of skills and qualifications is required, including Engineering skills (production and production safety), Marketing & Cost Analysis skills, and Management skills. The innovator/entrepreneur should seek external expertise for those skills that are not present in the innovation business scheme and should outsource the relevant activities. The major output of this phase is the Production Prototype itself that is the result of the innovation development process following an Innovation Development Plan, as well as an Updated Innovation Business Plan taking into account market iteration (e.g. test marketing). At the end of this phase the production prototype will be available and the innovator will have to enter the phase of actual production and distribution to the market. In the case of non-validation of the prototype a redesign might be needed or a discontinuation of the project might be decided.
3.5 Redesign and Production
The result of the previous step could be either a validated prototype, which means that the innovator will move to a full scale production, or a non-validated prototype, which results to the redesign of the product. Moving to a full scale production is a complex task that is out of the scope of this paper. The skills required for this task comprise Engineering skills, Complex Management skills, Strategic Planning Skills, Specialty & Systems Engineering.
3.6 Distribution and Marketing
Even though marketing is the final step of this guide, the marketing activities last throughout the whole lifecycle of the innovation, even before the innovation is implemented. At this point the innovation needs to be officially launched to the market and the innovator has to prepare and update a Market Plan that details the marketing actions needed. Skills associated with this phase include Marketing skills, Sales Analysis skills, Market Forecasting skills, Long-term financial projection skills and Strategic Planning skills. Most of

334 Proceedings of International Conference for Entrepreneurship, Innovation and Regional Development
ICEIRD 2014
these skills will not be present in the innovator and need to be outsourced or external expertise should be sought.
4. Protecting Innovation
The innovator has to identify at an early stage the different types of intellectual property (IP) that are embodied in his/her invention or research work. A set of exclusive rights are given to the IP creator/holder for a defined period of time depending upon the type of IP and national/international legislation, which are called Intellectual Property Rights. These rights begin to exist either automatically, when certain legal requirements are met, or upon request to a relevant authority which is responsible for granting or registering IPRs. In the latter case a predefined and occasionally time-consuming process has to be followed. IP legislation grants the owner the exclusive right to commercially benefit from his/her intangible intellectual asset and prohibits all others from exploiting his/her IP without the prior consent of the owner. Even though a uniform international IP legislation system does not exist and it is difficult to be established, the international community has made a substantial effort towards implementing it. According to World Intellectual Property Organization IPRs can be divided into two main categories [5]:
1. Copyrights, which include literary and artistic work (e.g. poems, novels, architectural designs etc.) and computer software.
2. Industrial property, which includes inventions (patents), trademarks, industrial designs, and geographical indications.
However, there are other ways to protect intellectual assets that do not lie under the IP laws. These methods usually include contracts (e.g. non-disclosure, confidentiality etc.), trade secrets, costumer relation management policies, restriction on access to knowledge etc. IPRs are critical to fostering innovation, due to the fact that protecting and controlling knowledge diffusion provides the IP owners the ability to reap the full benefits of their intellectual work while giving them and incentive to innovate further, and reduces the overall risk for the players involved in the innovation process. IPRs add value at every stage of the innovation process, from research to product release and commercialization, since they constitute a competitive advantage over competitors in the same domain. The initial step in creating an IP management policy, which should protect IPs during their entire life-cycle, is the identification of IPs and the estimation of their current and potential value. These properties may include further intangible intellectual assets that cannot be categorized under the formal IPs and therefore protected by IP legislation. These assets may include confidential information, technological know-how, trade secrets etc. The next step must be the selection of the proper method of protection for the identified assets, mainly legally, physically, and technologically. Further steps should include a threat assessment of the IPs, a development of mechanisms to handle IP issues, licensing, and the technical along with physical implementation of the policy. In Table 1, a non-exclusive list of IPRs is associated with each step of the innovation model described earlier. IP legislation by nature creates monopolies and restrains knowledge diffusion. However, in the current rapidly changing environment in terms of technological development, the value of an IPR diminishes constantly. The traditional strategy of managing IPs and the whole innovation process inside the company may not give the expected competitive advantages. The decision to selectively “open” the innovation cycle may yield great innovative potentials to the company.

335 Proceedings of International Conference for Entrepreneurship, Innovation and Regional Development
ICEIRD 2014
Table 1 IPRs in each Innovation Phase
Innovation Phase Type of IPR
Research Patents, Industrial Designs, Trade Secrets
Scheme/Entity Selection Non-Disclosure Agreements, Trade Secrets
Development/Implementation Non-Disclosure Agreements, Patents, Copyrights, Industrial Designs, Trademarks
Marketing/Distribution Trademarks, Geographical Indications, Patents, Copyrights, Ind. Designs
The Open Innovation [6] model provides an alternative approach to the issue of handling IPRs, since the company decides to renounce some of its IPRs in the expectation of significant financial and technological returns in the future. Common practices include participation in R&D consortia, collaboration with universities or research institutes, collaboration with other companies on specific areas, and crowdsourcing.
5. Conclusions
The work presented in this paper aims at providing a methodology guide for the transformation of an invention or research work to an innovative product, service or process. It aspires to provide the audience with helpful information on what are the steps and the skills associated with the evolution from an initial assessment of the intangibles assets of a research work to the successful launch of a product or service to the market.
References
1 European Commission. Green Paper on Innovation. [Online].; 1995 [cited 2014 3 10. Available from: HYPERLINK http://europa.eu/documents/comm/green_papers/pdf/com95_688_en.pdf ]
2 Kalogeras A. Promoting Innovation in the Industrial Informatics and Embedded Systems Sectors through Networking. 2009. I3E SEE/A/219/1.1/X Application Form, INTERREG IVB SEE
3 Kline SJ, Rosenberg N. An Overview of Innovation. In Rosenberg RLaN, editor. The Positive Sum Strategy: Harnessing Technology for Economic Growth. Washington D.C: National Academy Press; 1986. p. 275-304
4. Kalogeras AP, Anagnostopoulos C. Innovation Modelling: Understanding the Fundamentals of the Transformation of Research to Innovation. In ESCIT 2012 : 1st IFAC Conference on Embedded Systems, Computational Intelligence and Telematics in Control,; 2012; Wurzburg, Germany.
5 WIPO portal. [Online]. [cited 2012. Available from: HYPERLINK "http://www.wipo.int" ] 6 Chesbrough, Henry William (2003). Open Innovation: The new imperative for creating and profiting
from technology. Boston: Harvard Business School Press. ISBN 978-1578518371

336 Proceedings of International Conference for Entrepreneurship, Innovation and Regional Development
ICEIRD 2014
A Guide to assessing the impact of innovation and technology transfer in the economic and social plan Sorin Mircea Axinte1, Bogdan Ciocanel2 Gheorghe Bala³ 1RAI,126A Erou Iancu Nicolae str,Bucharest,Romania,[email protected]
2IRECSON-CIT 66-68,Franceza str,Bucharest, Romania, [email protected]
3NME, 23-25,Mendeleev str, Bucharest, Romania, [email protected]
The guide is a tool for assessing the impact of inn ovation and technology transfer (ITT) in the economic and social plan. The guide outlines a methodology for the evaluation of the impact of the TTI in economic and social plan with a view to: • adjust the policies to the needs of regional inno vation; • increase the level of knowledge of the representa tives of the local authorities (the local public Authorities at the County, regional de velopment agencies (RDA), chambers of Commerce and industry, the district. on innovation at the regional level; • present the potential of each region in TTI field in order to quantify competitive advantages of innovative regions.
Keywords Guide, impact, innovation,
1. Introduction
The guide presents a model for the evaluation of the impact of Innonation and Technology Transfer (ITT) at the level of the development regions of Romania in conjunction with their potential to create and maintain an environment that supports innovation at the level of the economic operators. To get an overview of the impact of innovation in the regions, a valuation model based on 68 indicators of innovation presented in Table 1 has been elaborated.
The analysis will be able to enter the most recent available data for the indicators of innovation. The data will be obtained from the National Institute of statistics, in the register of the results of research and statistical surveys. Statistical surveys can be conducted in the enterprise and among the representatives of the local authorities (the local Public Administration, chambers of Commerce and industry, the regional development agencies), and the results thereof must be accompanied by error of estimate as low thus ensuring a high representative data.
The relatively large number of criteria used in the Guide, provides a clear picture of the ITT impact on the regional economies, and serves as safety if a particular criterion is misinterpreted. The impact of a single factor analysis is limited. The guide can be considered a point of access to the assessment of innovation at regional level, being an instrument , and its use provides milestones and objectives regarding innovation trends. It can also be considered a point of reference for the development of
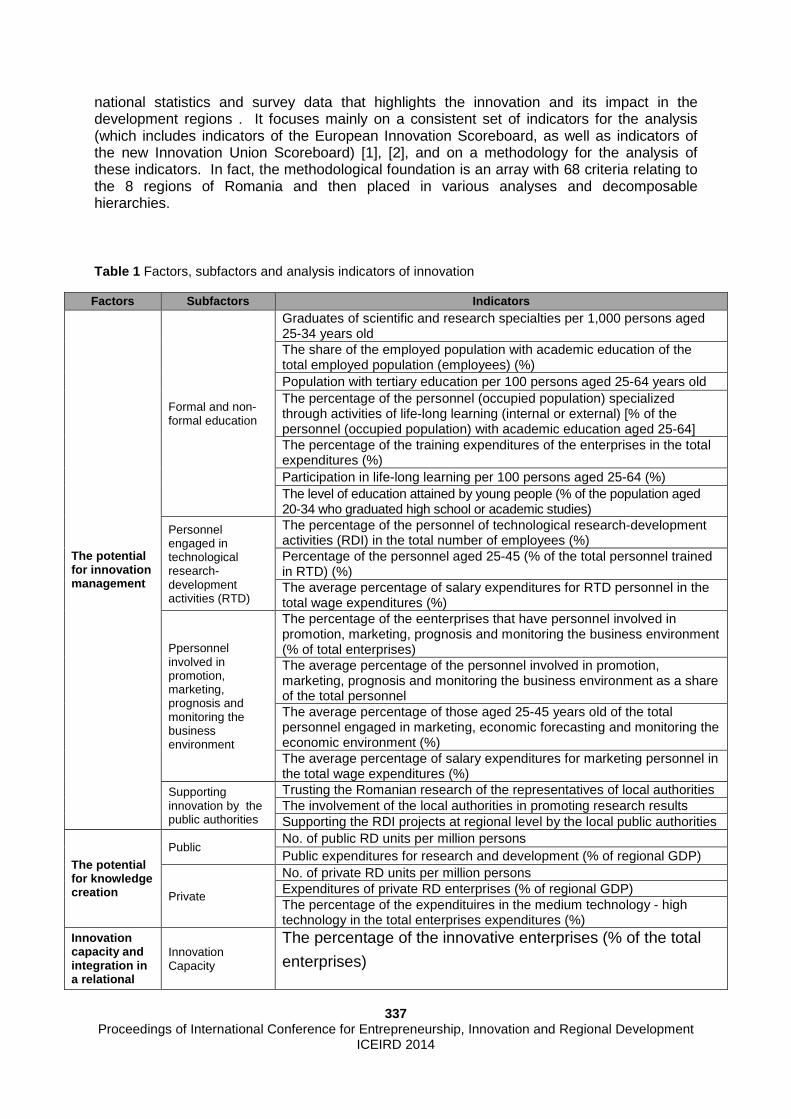
337 Proceedings of International Conference for Entrepreneurship, Innovation and Regional Development
ICEIRD 2014
national statistics and survey data that highlights the innovation and its impact in the development regions . It focuses mainly on a consistent set of indicators for the analysis (which includes indicators of the European Innovation Scoreboard, as well as indicators of the new Innovation Union Scoreboard) [1], [2], and on a methodology for the analysis of these indicators. In fact, the methodological foundation is an array with 68 criteria relating to the 8 regions of Romania and then placed in various analyses and decomposable hierarchies.
Table 1 Factors, subfactors and analysis indicators of innovation
Factors Subfactors Indicators
The potential for innovation management
Formal and non-formal education
Graduates of scientific and research specialties per 1,000 persons aged 25-34 years old The share of the employed population with academic education of the total employed population (employees) (%) Population with tertiary education per 100 persons aged 25-64 years old The percentage of the personnel (occupied population) specialized through activities of life-long learning (internal or external) [% of the personnel (occupied population) with academic education aged 25-64] The percentage of the training expenditures of the enterprises in the total expenditures (%) Participation in life-long learning per 100 persons aged 25-64 (%) The level of education attained by young people (% of the population aged 20-34 who graduated high school or academic studies)
Personnel engaged in technological research-development activities (RTD)
The percentage of the personnel of technological research-development activities (RDI) in the total number of employees (%) Percentage of the personnel aged 25-45 (% of the total personnel trained in RTD) (%) The average percentage of salary expenditures for RTD personnel in the total wage expenditures (%)
Ppersonnel involved in promotion, marketing, prognosis and monitoring the business environment
The percentage of the eenterprises that have personnel involved in promotion, marketing, prognosis and monitoring the business environment (% of total enterprises) The average percentage of the personnel involved in promotion, marketing, prognosis and monitoring the business environment as a share of the total personnel The average percentage of those aged 25-45 years old of the total personnel engaged in marketing, economic forecasting and monitoring the economic environment (%) The average percentage of salary expenditures for marketing personnel in the total wage expenditures (%)
Supporting innovation by the public authorities
Trusting the Romanian research of the representatives of local authorities The involvement of the local authorities in promoting research results Supporting the RDI projects at regional level by the local public authorities
The potential for knowledge creation
Public No. of public RD units per million persons Public expenditures for research and development (% of regional GDP)
Private
No. of private RD units per million persons Expenditures of private RD enterprises (% of regional GDP) The percentage of the expendituires in the medium technology - high technology in the total enterprises expenditures (%)
Innovation capacity and integration in a relational
Innovation Capacity
The percentage of the innovative enterprises (% of the total
enterprises)

338 Proceedings of International Conference for Entrepreneurship, Innovation and Regional Development
ICEIRD 2014
Factors Subfactors Indicators system The percentage of the small innovative enterprises (% of the
total small enterprises)
The percentage of the medium innovative enterprises (% of
the total medium enterprises)
The percentage of the innovative LE in the total LE (%) Innovation expenditures (% of GDP) Enterprises that have introduced organizational innovation (% of the total enterprises) SMEs that have introduced organizational innovation (% of the total SMEs) Enterprises that have introduced a product innovation (% of the total innovative enterprises) SMEs that have introduced product innovation (% of the total innovative SMEs) LEs that have introduced product innovation (% of the total innovative LEs) Enterprises that have introduced a process innovation (% of the total innovative enterprises) SMEs that have introduced process innovation (% of the total innovative SMEs) LE that have introduced product innovation (% of the total innovative LE) Enterprises that have introduced a marketing innovation (% of the total enterprises) SME which introduced a marketing innovation (% of total SMEs) No. ITT entities reported to 100 UCDs
Cooperation and colaboration
Enterprises that have made innovation activities in cooperation (% of the total innovative enterprises) SMEs that have developed in cooperation innovation activities (% of the total innovative SMEs) Enterprises that have made innovation activities in cooperation with UCDs (% of the total innovative enterprises) ICT expenditures (% GDP)
The performance of the innovation activities
Accomplishing products/technologies or services new/modernized on the market or implementing new/modernized technologies at the organization level
Employment in medium-technologic or high manufacturing sector (% of the total workforce). Employment in medium-technologic or high manufacturing sector (% of the total workforce). The average percentage of the expenditures on new products / services or modernized ones in the total expenditures (including here products / services new on market and products / services for enterprises) (%) The average percentage of CA exports of goods / services of the total CA (This includes both market new products and new products for businesses) (%) Direct export of high technology products as part of total exports (%) The average percentage of the expenditures for new or modernized technology of the total expenditures (%)
RTD Activities
Expenditures of RD enterprises (% of total expenditures) No. RTD results (products, technologies, patents, industrial designs and drawings, articles, studies, etc..) per 1 million inhabitants The percentage of the results in manufacturing or recoverable through input operation, of RTD activities of the total RTD results (%)
Consultancy activities
The percentage of the eenterprises that received consultancy (% of total enterprises)

339 Proceedings of International Conference for Entrepreneurship, Innovation and Regional Development
ICEIRD 2014
Factors Subfactors Indicators (services) The average percentage of the total expenditures on consultancy in the
total expenditures of the enterprises which have received consultancy (%) The percentage of the companies that offered consultancy in the total enterprises (%) The average percentage of the expenditures in consultancy from the total expenditures (%)
Promoting, marketing and distribution activities
The percentage of the companies that have conducted promotional activities, marketing and distribution services for export products, in the total enterprises (%) The average percentage of the expenditures for promoting, marketing and distributing the products / services for export, in the total expenditures of the enterprises with export activity (%)
Intellectual property
Technical-economic documentation (documentation on obtaining products/services,market studies, business pland, technical economical projects...)
No. of economic and technical economic documentation developed per 1 million inhabitants
No. of economic and technical economic documentation acquired by 1000 enterprises
The percentage of the capitalized documentation in the total acquired documentation
Patents
No. of patents + registered applications per 1 milion inhabitants
No. of acqired patents per 1000 enterprises
The percentage of the capitalized patents in the total number of patents (%)
Patterns and designs
No. of patterns and industrial designs + patterns and industrial designs applications per 1 milion inhabitants
No. of patterns and industrial designs per 1000 enterprises
Other (copyright, trade mark, formulas, geographic indications, specii plant and animal species, etc.).
No. of obtained copyright + applications registered per 1 million inhabitants
No. of trade marks + applications registered per 1 million inhabitants
No. of formulas, geographical indications, plant and animal species, etc.. recorded + applications per 1 million inhabitants
2. The conceptual model for the evaluation of the i mpact of innovation and technology transfer
The conceptual model approached, suggests the assessment of the ITT impact through comparative analyses of the regions analyzed from the perspective of innovation. Thus, it is proposed an approach to assess the impact of ITT in the region compared with other regions analyzed from the perspective of innovation [3], [4].

340 Proceedings of International Conference for Entrepreneurship, Innovation and Regional Development
ICEIRD 2014
Figure 1 „Inputs and outputs" of the conceptual model to assess the ITT impact
The model considered best for the implementation uses the following methodology of innovation in decomposition factors (components), subfactors (criteria) and indicators:
Figure 2 Application model to assess the ITT impact The factors, subfactors and evaluation indicators were established as a result of preliminary research which has used economic literature, appraisals of the world academic and business community, and thorough research project INNOREG 92-079/2008. Table 2 Analysis factors of innovation, associated subfactors and their weightings in the assessment of innovation at regional level
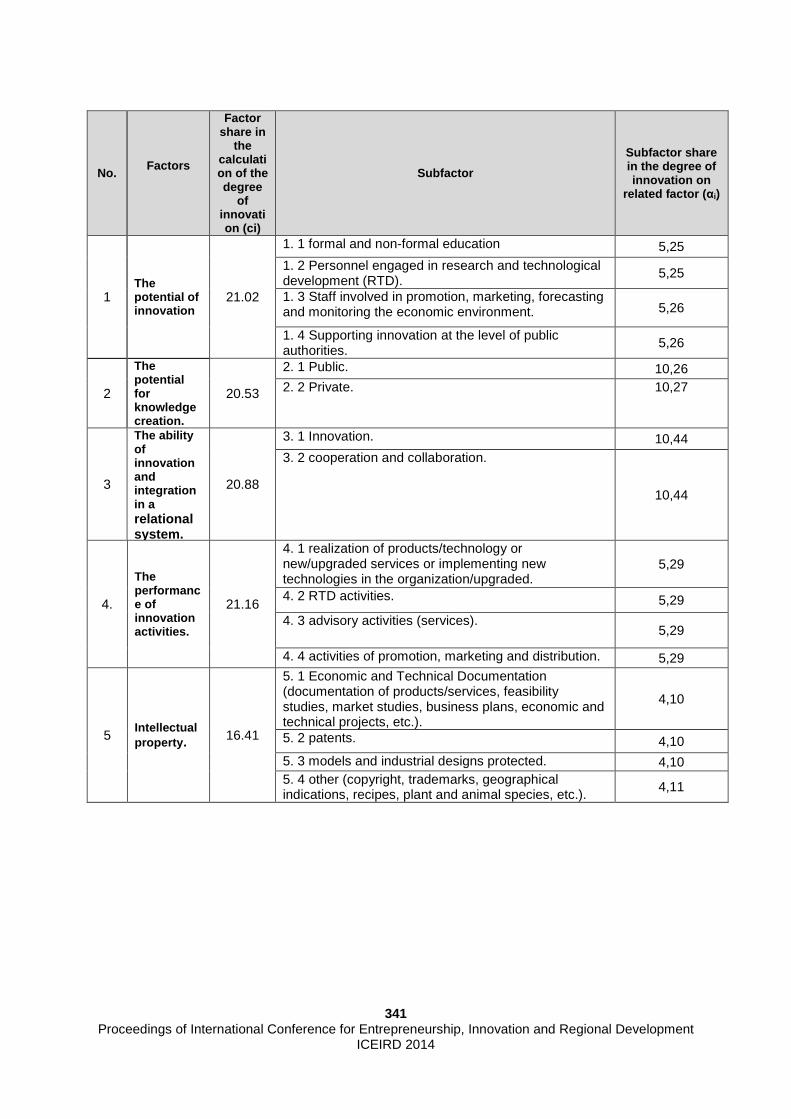
341 Proceedings of International Conference for Entrepreneurship, Innovation and Regional Development
ICEIRD 2014
No. Factors
Factor share in
the calculation of the degree
of innovation (ci)
Subfactor
Subfactor share in the degree of innovation on
related factor ( αi)
1 The potential of innovation
21.02
1. 1 formal and non-formal education 5,25 1. 2 Personnel engaged in research and technological development (RTD).
5,25
1. 3 Staff involved in promotion, marketing, forecasting and monitoring the economic environment. 5,26
1. 4 Supporting innovation at the level of public authorities.
5,26
2
The potential for knowledge creation.
20.53
2. 1 Public. 10,26 2. 2 Private. 10,27
3
The ability of innovation and integration in a relational system .
20.88
3. 1 Innovation. 10,44 3. 2 cooperation and collaboration.
10,44
4.
The performance of innovation activities.
21.16
4. 1 realization of products/technology or new/upgraded services or implementing new technologies in the organization/upgraded.
5,29
4. 2 RTD activities. 5,29
4. 3 advisory activities (services). 5,29
4. 4 activities of promotion, marketing and distribution. 5,29
5 Intellectual property . 16.41
5. 1 Economic and Technical Documentation (documentation of products/services, feasibility studies, market studies, business plans, economic and technical projects, etc.).
4,10
5. 2 patents. 4,10
5. 3 models and industrial designs protected. 4,10 5. 4 other (copyright, trademarks, geographical indications, recipes, plant and animal species, etc.).
4,11

342 Proceedings of International Conference for Entrepreneurship, Innovation and Regional Development
ICEIRD 2014
3.The performance of the Romanian regions in the fi eld of innovation development
Place
Development region Score*
1 Bucharest - Ilfov 72,96
2 North East 37,19
3 Center 31,43
4 South 30,95 5 South East 28,84
6 South West 28,75
7 North West 27,13
8 West 25,11 * According to the Innobarometer study 2013
Figure 3 The degree of innovation of the innovation regions
• Bucharest-Ilfov Region is a true leader in the ITT field with a score of approximately two times greater than the area that is situated on the second place (North East region).
• The situation is more balanced in the case of the degree of innovation of the development regions by "the potential of innovation", Bucharest-Ilfov region is on the first place, but the difference between it and the second place (the northeast region) is of 8,97 points. The third place is occupied by the southwest region with 52,61 points, a score very close to that of the North-East region. At a higher distance is situated a platoon consisting of the rest of the regions, that is, surprisingly, the West region.
• The knowledge creation potential (public and private) in an overwhelming proportion is concentrated in the region of Bucharest-Ilfov and far too little compared with this, it is distributed in other regions.
• The innovation capacity has a relatively more balanced distribution across regions, except for the Southwest region, that, even though it has a high potential of innovation (as seen above), it has some problems in putting the innovation into practice.
• A high "capacity for innovation and integration in a relational system" is not necessarily generating a performance as in the business of innovation. Thus, regions with a relatively high innovation capacity as the North-East region (2nd at this factor) have not obtained at least similar performance in ITT activity (with only the 7-th place in "performance of ITT activities").
• The Central region has a low potential of creating knowledge (even the lowest of the region) but manages to move towards the interests of ITT for intellectual property, but the difference between it (second place) and Bucharest-Ilfov region (I) is about 4 times higher.

343 Proceedings of International Conference for Entrepreneurship, Innovation and Regional Development
ICEIRD 2014
3. Conclusions
The completion of the process of harmonization of national policies in the field of ITT, in order to meet the EU'S 2020 Strategy requirements, should be a strategy in the field of ITT at national level. Excellence and skills are essential to the reference area, in particular those relating to the reporting and assessment of the impact of policies should be especially developed for ANCS employees, local and central administrative authorities, in a first phase (project), and thereafter the abilities related to entrepreneurship, creativity, innovation to be developed, in particular for SMEs. The presented model establishes as an appropriate method for the development of dynamic models to deal with the structural and functional complexity of the innovation processes at a national and regional level. This study integrates the simulation discipline and the theory of nonlinear dynamics and feedback control into a dynamic consideration of the NIS. The approach provides an ‘‘experimental’’ tool to reproduce historic results, test the efficiency of alternative innovation-policy scenarios both individually and in combination, and reveal effective policy suggestions. The paper also presents an application of this experimentation for the case of Romania. The key finding is that the institutional conditions have shown the greatest impact on innovation performance; however, aggressive upgrading policies still result in partial innovative behaviors.
References
1. European Innovation Scoreboard, 2012. INNO-METRICS. Pro-Inno, Europe 2. Innovation Framework Report, 2004. Measuring Innovation for National Prosperity.
Version 3.0. 3. Samara E, Georgiadis P, Bakouros I,. The impact of innovation policies on the
performance of national innovation systems: A system dynamics analysis. Technovation-Elsevier, 2012; 32, 624-638.
4. Carlsson B, Jacobsson S, Holmen M, Rickne A, Innovation systems: analytical and methodological issue, Reasearch Policy 2002,31(2), 233-245
5. Huizingh, E K R E, Open innovation: state of the art and future perspectives. Technovation, 2012 31 (1), 2–9.
6. Filippetti A., Archibugi D., Innovation in times of crisis: National Systems of Innovation,structure and demand. Research Policy 2011, 40 (2), 179–192.

344 Proceedings of International Conference for Entrepreneurship, Innovation and Regional Development
ICEIRD 2014
Sustaining Entrepreneurial Ecosystems with ebarts
Yasmine Arafa, Miriam Joy Morris and Cornelia Boldyreff
ebartex Ltd, London, UK, {yasmine.arafa, miriamjoymorris, cornelia.boldyreff)@ebarts.com
ebarts is a global, digital currency, based on the provision of a better means of bartering. It is a social currency that is neither bought nor issued, but is created by users in trusted exchanges. All transactions are fa cilitated through a multi-platform app. The service is cross-border to support entrepreneur s and facilitate the creation of ecosystems of complementary social economies. Many entrepreneurs have great ideas, energy and skills, but lack cash. Expertise, spare capacity, and goods/services procurement can be financed with ebarts. New networ ks created through trusted exchange will sustain and promote businesses, and i n communities. The goal of ebarts is democratisation of money.
Keywords Digital Currency, Social Currency, Mutual Exchange, Entrepreneurial Ecosystems, Social Economy
1. Background and Introduction
Europe is not suffering from natural disaster - there has been no famine, earthquake or plague. We still have our resources: people, land, food, businesses, infrastructure, heritage, etc. What we lack is an efficient and reliable means of exchange, without actual money or reference to conventional currency values. Since the 2008 financial crisis, barter is increasingly being used as an alternative means of exchange all over the world. Although barter is a lifeline for the people involved, by its nature it is exclusive and inflexible, and therefore limited. Unlike conventional money barter currencies do not have a standardised measure of value, nor are they universal – they can only be traded within closed groups. The ebart has been developed as a global digital currency to bring about the step change required to achieve a new parallel exchange economy based on exchanges of goods and services for ebarts. As a social currency ebarts are usable by local exchange communities but also universally accessible worldwide wherever people have access to mobile technology and the internet. To achieve this breakthrough, we face three major challenges: 1. Realisation of the ebarts concept - to lay the foundation of a radically new exchange
economy, one which matches unmet needs to unused resources.

345 Proceedings of International Conference for Entrepreneurship, Innovation and Regional Development
ICEIRD 2014
2. Actualisation of the concept - to develop a multi-platform that will provide the basis for implementing exchange of ebarts.
3. Deployment of the concept - to demonstrate that the ebart and the multi-platform app are viable and sustainable in use in real communities through pilots in the UK and across the EU.
Participation in the Bethnal Green Ventures Accelerator has enabled our company, ebartex (see Appendix A), to realise the ebarts concept and develop a demonstrator of the associated multi-platform app that we intend to deploy and further develop in pilots planned for later on this year and next [1].
2. How ebarts Works
An ebarts multi-platform app has been developed to demonstrate ebarts to potential user communities. The app makes it possible for ebarts users to trade via their mobile phones and the web. A web plug-in is also being developed to enable other trading websites to allow the use of ebarts. A user-centred design approach has meant that early on use cases and user-interface screen shots have already been developed in consultation with potential users. Once registered users can list any items or services they wish to exchange for ebarts. Exchanges can either take place either by selecting from the list or transacted directly peer-to-peer as shown in Figure 1 below.
Figure 1 Screenshot of ebarts app for listings and peer-to-peer transactions

346 Proceedings of International Conference for Entrepreneurship, Innovation and Regional Development
ICEIRD 2014
Users open an ebarts account at no cost using the freely available ebarts app. Each user account is opened with the promise that ‘I will give back what I take’. Individuals, businesses and community groups can open accounts. Accounts start on zero, and a trading limit is set. This is like an overdraft limit, but it also restricts the amount of credit in an account. This is in order to keep the ebarts circulating. ebarts are simply a ‘medium of exchange’. There is no point in hoarding or saving ebarts. Traders set the price of goods and services exchanged. Transactions in ebarts are made by debiting the buyer’s account and crediting the seller’s account by the same amount. Every debt is balanced by a credit, making the sum total of all ebarts accounts zero. Account-holders do not have to earn ebarts before they spend them, they can go into ‘debt’. When they spend they are creating an IOU: a promise to repay their debt to the system. This is the way currency is created. A healthy ebarts account will have a high throughput and fluctuates regularly either side of zero. Figure 1 below shows how this is represented.
Figure 2 Screenshot of ebarts app showing account history
Account-holders will also have a ‘credit rating’. ebarts is based on trust, the system is transparent and ebart accounts are self-regulating. The user’s graphic trading history and credit rating will be visible to all other account holders. Furthermore, all transactions must be confirmed by both buyer and seller, or the donor and recipient. There is no obligation to trade with someone; transactions can be turned down if there is doubt. Every account-holder will have a profile on ebarts.com where they can advertise what they have to offer and what they want. Account holders can also trade on participating websites

347 Proceedings of International Conference for Entrepreneurship, Innovation and Regional Development
ICEIRD 2014
through an ebarts plug-in. ebarts will also be exchangeable in shops, markets and face to face between traders via mobiles and hand-held devices. Many transactions will be dual currency, as ebarts is intended to be used by local retailers and businesses as part-payment for goods and services. Businesses and individuals can donate to Community Groups, who in turn can use ebarts to reward volunteers. The ebarts currency has no value outside the system. It is not underwritten or backed by the platform provider, its value lies entirely in the mutual trust between traders. Because of no one is compelled to trade, along with the transparency of trading in the system, and the fact that every credit is linked to a debit, the opportunities and incentives for fraud are limited.
3. Helping Entrepreneurs and Connecting Entrepreneu rial Ecosystems
ebarts can provide a cross-border service to support web entrepreneurs, connecting existing local web entrepreneurship ecosystems and hubs and other entrepreneurs across the EU. Working collaboratively, further cross-border support services can be co-developed by several local web entrepreneurship ecosystems and hubs. ebarts has been promoted as a cross-border service allowing usage of the digital currency ebarts and multi-platform app by web entrepreneurs and start-ups. Under the WP2014-15 Web Entrepreneurs Challenge [2], there is call for services to create exposure to new financing opportunities. ebarts is potentially a very powerful tool and offers new financing opportunities, but only if it is used by real people, to create a real economy, which meets real needs. An ebarts exchange could be a means of sharing start-up mentoring support across the EU, and creating a peer-to-peer, self-help network for entrepreneurs. But more than this, ebarts can help cash-strapped start-ups to survive. Many entrepreneurs have great ideas, energy and skills, but very little cash. With ebarts they can sell their idle resources, spare capacity, excess inventory and skills, and buy the goods and services they need - all without having to spend any of their cash. This would accelerate web entrepreneurship throughout Europe. By using the ebarts, new social economies that are complementary to the existing trading communities will be created. Our company, ebartex, is both an ebarts service provider and integrator. The ebarts API can be utilised as a cross-border service co-developed by partners in several local web entrepreneurship ecosystems and hubs working together with us. We have proposed a customised "ebarts for entrepreneurs" portal for existing platforms that currently support entrepreneurs. This portal would allow web entrepreneurs across the EU can trade services and goods with each other and also exchange ebarts for specific services such as mentoring, legal advice, marketing expertise, financial advice, and any other services that underlying ecosystems and hubs have on offer to entrepreneurs. For example, an entrepreneur could provide web development to other entrepreneurs in exchange for ebarts and then use these within a hub to obtain mentoring. The hub could then use their ebarts to reward volunteers providing mentoring, who in turn could use them to obtain 3D printing services from another entrepreneur. Once the portal is in use, full analysis of the data obtained from monitoring the "ebarts for entrepreneurs" portal will be possible, thus providing a measurable guide to the impact of ebarts on the entrepreneurial ecosystem.

348 Proceedings of International Conference for Entrepreneurship, Innovation and Regional Development
ICEIRD 2014
4. Conclusions and Future Work ebarts enables people to trade without money, in a flexible and friendly way The new cross-border networks created through trusted exchange will sustain and promote new entrepreneurial businesses online, and in local communities. ebarts will enable a new social economy, supporting businesses, communities and individuals allowing cross-border trade especially with entrepreneurial ecosystems. The next stage of ebarts development is to pilot ebarts in a variety of communities; we are targetting students and entrepreneurs as first adopters. Over the coming year, we plan to run major pilots with both of these potential user communities. Feedback from these pilots will drive the future development of ebarts and our exchange app.
References
1 Arafa Y, Morris M and Boldyreff C. ebarts – demoncratic money. Proceedings of #CHIMoney: Financial Interactions, Digital Cash, Capital Exchange and Mobile Money. April 2014.
2 WP2014-15 Web Entrepreneurs Challenge http://ec.europa.eu/digital-agenda/en/news/wp2014-15-web-entrepreneurs-challenge (accessed
March 2014).
Appendix A. EBARTEX Ltd Details
ebarts is the idea of Miriam Morris, a Marketing and Communications Director with experience in urban regeneration, housing and social service provision. The concept has been developed over the past three years with Cornelia Boldyreff, a Professor of Software Engineering, and Dr Yasmine Arafa, an experienced software engineer and senior researcher specialising in affective computing, artificial intelligence and user-interface design. Miriam, Cornelia and Yasmine are the Founding Directors of ebartex Ltd, a start-up based in London, and they are alumni of the Bethnal Green Accelerator Programme. The multi-platform app we have developed is an ebart exchange where users create ebarts as they trade goods and services.
To find out more, go to our website ebarts.com or contact us on [email protected]

349 Proceedings of International Conference for Entrepreneurship, Innovation and Regional Development
ICEIRD 2014
Overcoming Crisis: from Offshore to Online
Alexander Zelitchenko
Institute of Higher Psychology, Web Enterprise, P.O.Box 42615, Larnaca, Cyprus, [email protected]
In era of Internet when the most important sphere o f economy becomes economy of information and when economy of information becomes economy of knowledge, even a state without modern industry, without developed human resources, without raw materials and last but not least, which is for deca des in the state of endless war, has a chance to overcome hardest crisis and to become a p owerful participant of international economic life. Internet makes world n ot only much more united but also much more “virtual”. Industry of information produc es software creating infrastructure of informational processes. Much of what was already done here were connected with facilitating traditional forms of hu man activity – trade, manufacturing, media, interpersonal communications etc. Internet t ransformed these fields crucially but did not change their essence. However, in cours e of time Internet becomes a substrate of what may be metaphorically called Worl d Brain, where informational processes not only serve traditional economic & soc ial activities but also produce new knowledge. Moreover, this function of Internet becomes more and more important. Thus, the new industry emerges – industr y of knowledge. To become a home for this new industry a state does not need so me special resources, but mainly a political will. The first part of the article pre sents four directions of industry of knowledge I consider as important ones: 1) virtual enterprises and banks of ideas; 2) continuous distance learning and virtual univers ities; 3) online personal development and online counselling; 4) expert porta ls and depositaries of knowledge. The second part describes the measures a state can take to benefit in fullest from new industry: 1) devising special Internet legislation; 2) state’s support of Internet enterprises in the earliest phase of their life cir cle; 3) migration policy stimulating an import of new informational technologies; 4) change s in the bank law and creating bank infrastructure that answers the needs of Inter net entrepreneurs.
Keywords Industry of knowledge, Governmental policies on entrepreneurship, Internet economy, Network projects, Virtual enterprises
1. Introduction. Economy of Information Becomes Eco nomy of Knowledge
What options to overcome hardest economical crisis and to become a powerful participant of international economic life has a state, which is without modern industry, without developed human resources, without raw materials and after all last but not least, which is for decades in the state of endless war, at least, legally (and to a significant degree psychologically)? No options besides to wait when the powerful international players propose to him a new “Marshall Plan” – a huge amount of money to save dying economy? Such answer was correct before era of Internet changed the face of world making world not only much more united but also much more “virtual”. However, it is not right more, in our time when the most important sphere of economy becomes economy of information and when economy of information becomes economy of knowledge.

350 Proceedings of International Conference for Entrepreneurship, Innovation and Regional Development
ICEIRD 2014
Economy of information manufactures software that creates the infrastructure for informational processes, which are filing overall human life. Much of what was done here in previous years was connected with facilitating traditional forms of activity – trade, manufacturing, media, interpersonal communications etc. Internet transformed these fields crucially but did not change their essence. However, in course of time Internet becomes a substrate of what may be metaphorically called World Brain, where information processes produce new knowledge. Thus, new sphere of economy emerged – the industry of knowledge. To become a home for this new industry a state does not need some special resources, but mainly a political will. The article presents some directions of economy of knowledge, which seem to me potentially valuable, and describes the measures a state can take to benefit in fullest from new economy.
2. Economy of Knowledge
Since many people spend a big part of their lifetime in front of monitor, there are a lot of these people’ needs and desires, which may be fulfilled through Internet. For fulfilling many of these needs people are ready to pay. This is one branch of Internet economy. Retailers were the first who recognized the potential of Internet and who benefited from organizing online marketplaces, shops and agencies. Virtual libraries, online dictionaries and encyclopaedias, depositaries of video and music, distance learning, online counselling, experts’ advices formed the other and perhaps now still less developed part of the same branch. The other branch is a manufacturing – a traditional manufacturing of goods and an innovative manufacturing of ideas and knowledge. Here two lines of Internet economy meet: a manufacturing of knowledge becomes a most important service man needs – manufacturing of new man, who is more educated, more knowledgeable, more conscious, and more spiritually developed. Below are some lines of developments of these branches, which I consider as promising.
2.1 Virtual Enterprises and New Generation of Socia l Networks – Networks of Co-doing. Banks of Ideas
Putnik with colleagues [1] has elaborated the idea of virtual enterprise as a new way of integration of manufacturing process – a synthesis of large manufacturing partnerships, where the geographical location of participants is less important than their functional complementarity. Thus, the different parts of the whole manufacturing organism may be located in different countries, while the whole organism is in nowhere, in Internet only. The social networks of new generation with the idea that is close to one of virtual enterprise were proposed by me [2, 3]. These social networks unite not people socially interacting for own pleasure (as, for example, Facebook does) but they unite ideas, or projects. Conditional name for such social networks is Banks of Ideas. The author of idea describes the project of its realization in special formal language [3] and, in particular, describes the vacant roles in the project, which have to be filled by people and/or organizations interested in the project. Such social networks aim creating infrastructure not for exchange of information as usual social networks do, but for organizing common activity of users.

351 Proceedings of International Conference for Entrepreneurship, Innovation and Regional Development
ICEIRD 2014
2.2 Continuous Distance Learning and Virtual Univer sities
A manufacturing of new man is an important task both of man himself and of society he lives in. Internet opened here an opportunity (theoretically for everybody) to learn distantly from the best teachers. However, now this possibility is used only insignificantly comparing with its full potential. Indeed, today centres of distance learning are usually traditional universities, which propose to extern students their courses in form of audio record of lections together with traditional testing of academic success. In [4] I analyse some disadvantages of this approach and propose the ways of improvement. For example the lectures of best teachers must be done in the form of video- rather than audio-records with multi-language subtitles, animated illustrations, which disclose for student the essence of dynamic processes. I devised the prototype of platform for preparing such lectures as well as for testing students’ knowledge [4]. The platform may be used right now however some modifications seem to be useful in course of its further development. For example, it is worth to add the option of annotation when students formulate their questions about the content of lecture, and these questions are discussed later with a tutor or schoolmates. The reference to textbooks and other literature where a student may find deeper exploration of subject has also to be added. But development of e-lecture software itself cannot compensate all disadvantages of e-lectures comparing with courses students receive in traditional universities. The special modes of representation of lectures for small groups, where students have an opportunity to discuss the content of lecture, as well as the untraditional for universities forms of controlling knowledge are necessary. Of course, the significant organizational efforts to prepare corresponding distance learning courses and the significant technical efforts to devise corresponding infrastructure are necessary. But these efforts seem to be rewarded by the increase of quality of online learning. This is why such efforts have to be undertaken by universities themselves or by specialized distance learning companies. But this is only a part of agenda. Education is a very long process (maybe even life-long one), and to prepare an excellent professional we need to start work with him in secondary school when he/she is not much older than 10 and to continue growing him/her during about 20 years up to finishing his/her post-doc work. Naturally, the forms of education during so big span of time are different: from detecting abilities, their early development and forming educational/professional plans of young teenager through the university course to the scientific work under supervision of recognized scientists in course of preparing Master and Doctoral theses and post-doc work. In the late stages a process of learning becomes also a process of manufacturing new knowledge, and virtual university becomes not only a centre of continues learning but also a research centre as every “normal” traditional university is. It worth to note that most participants of such educational centres besides youngest and oldest ones act simultaneously in two roles: as a student of senior teacher and as a teacher for junior students. For example, high school student may teach secondary school students who is younger him 3 years and be taught by bachelor student who is 3 years older him. In this way a chains of “teacher-student” are formed, which creates scientific schools and facilitate research significantly.

352 Proceedings of International Conference for Entrepreneurship, Innovation and Regional Development
ICEIRD 2014
2.3 Online Counselling and Online Personal Developm ent
Continues learning is only a part of more general process of personal development – backbone of human life. The core of this process is a growth of both awareness and self-awareness: man learns him(her)self – his/her abilities, potential, destination, goals etc. This is a very complex process, which often demands an assistance of a qualified psychologist. Such professionals are not always available and are not available in all locations. Moreover, there are only very few good counsellors respectively demand. As result, many people’s only chance to find necessary help is Internet. Online counselling provide access to the service of best professionals who may live thousands kilometres away from a client. Online psychological/spiritual counselling started not today. There are big portals specialized in these services (for example, [5]). But most of them do not propose long systematic assistance. Usually client simply formulates his particular question and gets specific answer. Of course, in this mode the real help is possible only in rare cases. Alternative approach was devised in [6], where counsellor proposes systematic assistance in client’s inner work. Of course, this is more expensive service, but also much more effective one, since the problems of personal development are difficult and they demand long or even permanent inner work to deal with them. Besides personal interaction “client-counsellor”, which is realised today by such services as Skype or chat, this work demands some special instruments of psychological assessment and self-assessment, which allow monitoring personal development. These instruments not only provide respondents with the knowledge about the state of his/her personal development but they also form his/her self-awareness. Two examples of such assessment/forming techniques were devised by me in [7] and [8].
2.4 Expert Portals and Depositaries of Knowledge
From philosophical point of view, one of the main functions of Internet is sharing knowledge. This is why the problem of knowledge representation is so important for overall Internet industry. There are many forms of knowledge representations. The most known from them is a text in natural language. This made processing of natural languages [9] and web content mining [10] very popular directions of both research and application. However, the text on natural language is not neither only form of representation of knowledge nor most important form from the point of view of computer science. The graph based knowledge representation [11] is most well-known form of computer-oriented models of knowledge, which is used for example in semantic web. However, graph models used more for representation of how experts see world rather than how they act in world. At the same time, the knowledge about expert’s way of doing often is more practically valuable. In other words, pragmatics of expert’s knowledge is often more important than its “pure” semantics. To get this sort of knowledge the different types of models as well as the special procedures to extract the knowledge are necessary. Often expert cannot express verbally how he does what he does skilfully because he reflects his own expertise only partially at the best. Formalizing expert’s knowledge in such cases

353 Proceedings of International Conference for Entrepreneurship, Innovation and Regional Development
ICEIRD 2014
becomes separate important task if we are going to share this knowledge with somebody who is not an expert. One of the approaches here is to explore the logics of expert, i.e. his logical rules, which an expert uses (of course without clear recognizing them) when he made decisions [11]. The obvious minus of this approach is that an expert logic is very complex – very flexible and in many cases very fuzzy and usually researchers has no adequate instruments to reconstruct it more or less completely. The alternative approach is to appeal not to an expert’s logic directly but to his experience. In this approach we are trying to reconstruct the way how the expert makes his conclusions basing on what he knows about precedents. To do this we represent the expert’s knowledge not as a set of logical rules, but as a set of descriptions of objects of knowledge together with information about categories, to which each object belongs [12]. For example, if the objects of two different classes (say, two different medical diagnoses) are described in terms of their traits (say, presence of some symptoms), the expert’s knowledge is represented in a form of the matrix of descriptions of the objects, which are known to expert “trait i of object j” and a matrix of predicates “Object j belongs to class k”. Methods of pattern recognition (for example [12]) allow use this information to learn the algorithms, which after learning may determine the classes, to which unknown objects belong, that is to reproduce expert’s activity (“to model expert”). Moreover, usually algorithm learned on the experience of some expert determines the classes for unknown objects more accurately than the expert himself does. Besides, many algorithms give some information about how expert makes his decision, for example what symptoms or groups of symptoms he used. To build an expert portal or depositary of knowledge we have to collect expert experience in the above form from many experts (organizations of experts) and to supplement this collection with pattern recognition algorithms. The functions of such portals are to provide expert conclusions (both human-based and algorithm-based) for customers and to provide for experts the tools to grow the self-awareness of their own professional expertise.
3. Options for State: from Offshore to Online. What Has to Be Done
How to stimulate development of Internet economy if a country does not possess necessary human resources? Internet to a significant degree is exterritorial – it is located nowhere. With modern tools of communication developers may live in different countries but to work together. However each enterprise needs some legal framework that provides for entrepreneurs defence from the potential risks – legal, financial, organizational and others. For example, an enterprise has to be tax resident of some state and is interested to pay reasonable taxes especially in the beginning of its activity. The state that creates most favourite conditions for Internet business will collect under his roof (or more precisely – under his “umbrella”) many enterprises. The situation is exactly same as with offshore business: like money comes to the places with most favourite conditions, creators of ideas and developers come to the places where there is an infrastructure favourable for their interests.

354 Proceedings of International Conference for Entrepreneurship, Innovation and Regional Development
ICEIRD 2014
3.1 Internet Law
There are many things developers need, and obviously the special law about Internet business will be necessary. This law has to include in particular: • The small or even null taxes at least for initial period of activity, perhaps some “tax
credit”, which will be paid only when the company becomes profitable (the same benefits must be for management and for venture capital companies involved in Internet business).
• Easy procedure of forming enterprise that allows to do this even online. • Effective intellectual property rights regulations including innovative patent law. • The regulation of natural and convenient relationships inside companies, which provides
to all participants the effective guaranties of their rights. • The regulation of relationships between authors of ideas and developers, on the one
hand, and venture capital companies and management companies, on the other.
3.2 Assistance in the Beginning: from Idea to Start -up
There are many brilliant ideas, which stay ideas only not because they cannot be realised, but because their authors are able to create ideas but they have no practical skills how to transform own ideas into life. The problem here is the absence of contacts between authors of ideas, project managers, and venture capitalists. These three are looking each for others, but often cannot find. Among many problems prevented success of such interconnections there are mutual confidence and security of idea. Developers afraid to advertise their ideas since these ideas are their only capital and this capital may be easy stolen. Thus, developers need legal defence of their ideas. Traditional patent law often does not response their demand, in particular, because of long and difficult procedure of getting patent and even more complex procedure of defence from violations of patent rights. This law is good for big companies, but not for individuals without a huge budget for legal assistance. The other problem is an informal character of relationships between author of idea and manager who organize the process of idea’s implementation. Here again the old laws need a further development. To stimulate authors of potentially valuable ideas to put them into Bank of Ideas a state has to guarantee the safety of ideas as well as other interests of authors, and first of all an assistance in realization of ideas. This proposes, in particular, that access to the Bank of Ideas is granted only to users who agree to consider in local courts all possible disputes about intellectual rights on content of Bank of Ideas. Correspondingly, the new intellectual property law has to be elaborated and possibly special “intellectual property courts” has to be established.
3.3. Migration Law
Of course, this is in interests of state to attract most creative professionals not only to work under state’s jurisdiction but to bind them by stronger ties becoming state’s citizens. In case of Cyprus this would demand changing not immigration law itself, but factual immigration politics. Indeed some years ago Council of Ministers approved the criteria for provision of citizenship by exemption to applicants who introduced innovative technologies or created a research centre. However, in practice, the realization of this decision has demanded from

355 Proceedings of International Conference for Entrepreneurship, Innovation and Regional Development
ICEIRD 2014
applicants to invest money rather than to invest ideas, ignoring completely the well-known fact that investment of ideas may be more valuable for state in the terms of potential benefits.
3.4 Bank Infrastructure and Small Payments
The other forms of supporting Internet business may include the further development of bank infrastructure for easy and convenient customers’ transactions. This may demand changing some rules of bank regulation and introducing new forms of banking which are necessary for Internet business. For near 20 years of Internet many things were done to create, to support and to facilitate development of Internet business: standard software for on-line shops, big market places with infrastructure that support all phases of retailing – from marketing to shipping and management of customer relationships, including of course the online payment system as PayPal, for example. But, of course, there are many other things, which developers’ community needs. Below is only one example of such still unresolved problems – the problem of infrastructure for small payments. The real problem with digital rights today is that consumer often is ready to pay a small amounts to read some text or to see some video, but cannot do this, first, because he is asked to buy expensive subscription for many texts most of them he does not need, and second, because the procedure of payment is rather complex. This complexity results from first of all the demand of security of internet transactions. If we want to activate small internet transactions, which are crucial for some applications, we need modifying present payment systems or create specialized systems for Internet business with a huge amount of customers where each customer is expected to pay only small sum on irregular basis (for example, the online newspapers, where readers pay to authors of articles they liked, or the film depositaries, which show films of customer’s choice, etc.). In these systems customers determine the maximum amount they may spend daily (for example, not more than $10) and get the icon on the screen, which allows them to pay small amounts by 1-2 clicks without login in payment system, or even entering credit card data, or waiting confirmation code etc.
4. Conclusions
Several things are necessary for a state who wants to become a big international player in Internet market. The first is a political will, a principal decision to develop this segment of economy. The second is stable social conditions and satisfactory living standards. The third is developed infrastructure and in particular banking infrastructure. And the fourth is the possibility to mobilize the team of high-qualified lawyers, who are able to draw the necessary legislation in the reasonable time. In Cyprus we have the stable society, the high living standards, more or less developed infrastructure and a lot of qualified lawyers. Thus, the only thing we need to implement this transition from offshore economy to online economy is the political will.
References
1 Putnik G., Cunha M.M. (Eds.), 2005. Virtual enterprise integration: technological and organizational perspectives. Hershey, London: Idea Group Publishing.

356 Proceedings of International Conference for Entrepreneurship, Innovation and Regional Development
ICEIRD 2014
2 Zelitchenko A., 2009a. Web 2.010 - Social Network “Make Difference Together” with Pragmatic Description of Projects in the Standard of European Commission’s Framework Programme. In: Proceedings of I-Know '09, 9th International Conference on Knowledge Management and Knowledge Technologies", 4-6 September 2009 Graz, J.UCS Conference Proceedings Series.
3 Zelitchenko A., 2009b. The semantic-pragmatic descriptions of manufacturing processes and social networks for the integration of manufacturing systems of new generation (virtual enterprises) International Journal of Computer Integrated Manufacturing, Volume 23, Issue 8, pp.739-746
4 Zelitchenko A., 2014. E-lectures: Minuses and Pluses. https://docs.google.com/document/d/191OCMatMbGHLDSmQfOWJB_IPO-hlN8YEtwOkQUZkyxI/pub .
5 LIVEPERSON. http://www.liveperson.com/professional-counseling/ 6 SEXOLOGY AND AGAPOSOPHY.(In Russian) http://sexologonline.com/ 7 Coat of Soul. http://www.coat-of-soul.com/ 8 “Dukhovnyy Rostomer [“Spiritual Meter”] (In Russian) http://coat-of-soul.com/rostomer.html 9 Jurafsky D. and Martin J.H., 2008. Speech and Language Processing, 2nd edition. Pearson
Prentice Hall. 10 Liu B., 2007. Web Data Mining: Exploring Hyperlinks, Contents and Usage Data, Springer. 11 Brachman R. and Levesque H., 2004. Knowledge Representation and Reasoning, Morgan
Kaufmann. 12 Zhuravlev Yu., Ryazanov V., Senko O., 2006. RECOGNITION. Mathematical methods. Software.
Applications. MOSCOW.
357 Proceedings of International Conference for Entrepreneurship, Innovation and Regional Development
ICEIRD 2012
University Research and Development Projects in a Rapidly Changing Technology Environment
Sencer Yeralan1 , Efthimia Staiou2
1 YASAR University, Universite Cad. No:35-37, Agacli Yol, Bornova, Izmir, Turkey, [email protected]
2YASAR University, Universite Cad. No:35-37, Agacli Yol, Bornova, Izmir, Turkey, [email protected]
Traditionally, university research has been mostly seen to fulfil the long-term needs of industry by providing basic research. However, the increased speed of technological development has made a qualitative difference in th e view of industry of university research. Exceedingly fast turn-around times for n ew technology implementations has become a corporate advantage which manifests it self as market-dominating competitiveness. Accordingly, industry seeks univer sity research which would provide this speediness to market through ultra-fas t-paced research and development. In short, although industry research and development is not traditional basic research, ultra-fast development requires sim ilar qualities and innovativeness as basic research.
Keywords Basic research, market-dominating advantage, research and development, technology transfer, university-industry partnership.
1. Introduction
University research has traditionally been focused on basic research. While there may be differing reasons underlying faculty motivation to engage in industry-related research [1], the defining characteristics, for this paradigm, are self-paced, non-specific as it comes to the final product, and involve an innovative component that is also suitable for classroom demonstration, or graduate student thesis work. Universities often use relevant industry work as a measure of their success towards excellence [2]. Quite a lot of statistics is available for the various metrics that measure university-industry relations [3]. In fact, such data is often used for purposes of benchmarking among universities [4]. Much university research in engineering still revolves around these basic qualities. Often, due to the sheer number of graduate students in modern academia, university research becomes abstracted not only from the final implementations, but also from any expected implementations. Professors and institutions quite incorrectly overlook this by claiming that their engineering research is basic research. This view is subject to much criticism, since engineering, by definition, is an applied field of study. Moreover, as more and more doctoral students are produced with such paradigms, the pool of engineering faculty who are sensitive to the requirement that engineering work needs to somehow contribute to engineering implementations in the long run is becoming shallower by the decade. A new twist that somehow counterbalances this trend has been observed by the authors. Extremely compressed product development cycles have become commonplace in industry. Companies who cannot develop quickly to be the first to reach the market have suffered not
358 Proceedings of International Conference for Entrepreneurship, Innovation and Regional Development
ICEIRD 2012
only profits but future prospects of their market share. Thus, industry once again solicits the university to help with extremely fast-paced research and development. As an analogy, a mechanical engineer may consider drilling a hole in a metal piece quite mundane. But if one is to take the task to the extreme and ask for a hole only a few microns in diameter but several tens of meters in length, then the task is no longer mundane, and naturally invites research. The contribution of this work is twofold. First we investigate the different modalities of university-industry relations in the current climate of extreme global competition, especially vis-à-vis concerns of time to market. Next, we present an example that is akin to a case study and report our first-hand experiences with the actual process of technology transfer. The further insights provided by observations made during the process are generalized and abstracted so as to increase its intrinsic value to other such applications.
2. The Project
2.1 Yasar University
Yasar University, located in Izmir, on the Aegean coast of Turkey is established through a foundation of Yasar Holding. Yaşar University is considered to be a "boutique university," that aims to be a small but prestigious international institution of higher education. The engineering departments at Yasar University are fully on board with the policies, offering courses such as globalization, sustainability, and philosophy, quite seldom seen in engineering. As such, the engineering departments at Yasar University are inherently interested in, and in search of, new paradigms of industry cooperation. This is further aided by the fact that many of the Yasar Holding companies are accessible to the university and its engineering students for industry-university reciprocity.
2.2 The Research and Development Project
A research and development project emerges through contacts with the poultry division of Yasar Holding. The company raises poultry from eggs through contract farms. The product is then processed at company facilities and distributed nationally and internationally. The poultry farms are scattered around the Aegean region. The company provides guidance while maintaining oversight through technical and veterinarian support. Oversight includes tracking the process of growth in the multitude of farms and triggering actions such as feed selection and harvesting. Perhaps the most obvious measure to determine product maturity is the weight. Accordingly, the oversight practice involves weighing the birds periodically to plot their weight gain. At any given time, the weight of the flock displays a distribution which is quite close to the normal distribution. Although different farms display different growth trajectories, qualitatively, the processes are similar. Having a graph of the growth curve for each farm, along with the standard deviation captures much of the information needed to make managerial and operational decision. The process of weighing poultry by hand is slow, cumbersome, and prone to error. The possibility of automated weighing systems were entertained and pilot tested, but the harsh environment of poultry farms were seen to be too inhospitable for computerized systems. Added to that, most farms are located at remote areas where internet services are not available, and the typical farmers do not have the time or interest in maintaining a computerized system that uploads information to the corporate servers. The request to rapidly develop a robust internet-connected autonomous weighing system was raised as our team expressed interest in meeting the challenge.

359 Proceedings of International Conference for Entrepreneurship, Innovation and Regional Development
ICEIRD 2012
2.3 Specific Considerations and Preliminary Systems Design
It is most important that all components of the system be built robust to withstand the physical and chemical hazards of the environment. Special attention is to be given to protecting the system components from corrosion. Following this urge, we chose wireless Bluetooth [5] connectivity to the scale. Similarly, Internet connectivity is decided to use a smart phone, so that remote locations where wired or Wi-Fi Internet connections may not be available are still accessible.
The weighing system needs to be totally automated. That is, at any time, the user should be able to interrogate the system and see the current weight distribution (average weight and standard deviation). The following block diagram shows the fundamental components of the envision system.
Figure 1 The System Components
2.4 Prototype Development
Through rapid prototyping practices yielded a prototype which was developed in under a week. The prototype used an industrial grade battery powered scale with a Bluetooth unit to communicate its readings. The scale was chosen among the available models. It is not the ideal product for use in the long run. However, it has the necessary Bluetooth connectivity to work well in demonstrating the proof of concept. The scale was purchased and used to save development time, since it was available off-the-shelf.

360 Proceedings of International Conference for Entrepreneurship, Innovation and Regional Development
ICEIRD 2012
Figure 2 The Scale
The major development effort was in software development. The software consists of two major components:
1. Smart phone application software. 2. Remote data processing software.
The smart phone application is written for the Android operating system using the standard open-source development tools [6]. The programming language is Java. The development environment comes with a wealth of libraries which simplifies software development.
Figure 3 Smart Phone Application

361 Proceedings of International Conference for Entrepreneurship, Innovation and Regional Development
ICEIRD 2012
The smart phone application has three major components: Bluetooth connectivity, FTP connectivity, and data collection and packaging. The connectivity aspects are handled by separate threads in the Android operating system, since requesting and making connections are blocking tasks. The software essentially has three threads, a user interface (UI) thread which also processes and packages data, a Bluetooth thread, which establishes and maintains the connection to the scale, and an FTP thread that establishes and maintains connectivity to the server. The FTP thread is invoked to make the connection and upload the compiled data file to the server. Once the data is uploaded, the connection is closed, and the thread terminates. The thread is periodically activated to upload the accumulated data. This way, time on the Internet is limited to reduce charges from the telephone company. Bluetooth connectivity, on the other hand, is established and kept open, unless there is a disruption, such as a power failure. If the Bluetooth connection is lost, the thread immediately tries to re-establish it. The data that are collected are written to a file and saved locally on the smart phone. This file is then subsequently uploaded to the corporate server by FTP (File Transfer Protocol). The file name used to upload the data contains the time-stamp of the file. For example, the file 2014_03_20_09_48_57.txt contains data collected and uploaded at 9:48:37 in the morning of March 20, 2014. A separate program that is run on a PC is then used to retrieve the raw data file from the server and process it. In this respect, the smart phone is used as a reliable and ubiquitous data link to the server. The data is sent as is, without processing. The actual data processing takes place off-line via separate programs.
Figure 4 Reading Data from the Server and Off-Line Processing
The first attempt to show the proof-of-concept was to present the data on a web page so that anyone on the Internet may have access to it on a read-only fashion.

362 Proceedings of International Conference for Entrepreneurship, Innovation and Regional Development
ICEIRD 2012
Figure 5 Data Presented as a Web Page
In this paper, we report such a task and make recommendations following our experiences, while providing insights into the process.
3. Conclusions
Rapid industrial research and development has its own priorities and motives, which lend themselves to new methodologies and paradigms of university engineering research. First, since time is of paramount importance, systems integration must make use of available components as much as possible. In prototype development, this means using components that are functionally equivalent to the desired components. A clear understanding of what is readily available and what is to be custom developed is important. This requires knowledge about the state of the art components. This, in itself, is somewhat removed from basic research. It requires the faculty to be up-to-date with current technology. In fact, it could be further claimed that familiarity with the state of the art is insufficient. The faculty must have a good sense of what technologies are just over the horizon, so that the developed system takes advantage of the newest developments when it is ready to be deployed. Our use of a smart phone illustrates the point. Not only do we build a secure data link, but we do so with the cheapest and most readily available components. It does not require local Internet availability. Moreover, since there are many vendors that offer the same type of smart phone (in this case Android), our approach is cost effective and flexible.
References
1 D’Este P, Perkmann M. Why do academics engage with industry? The entrepreneurial university and individual motivations. J Technology Transfer 2011; 36; 316–339.
2 Altbach P G, Salmi J editors. The Road to Academic Excellence: The Making of World-Class Research Universities, May, 2014.
3 Centre for Science and Technology Studies, http://www.cwts.nl/University-Industry-Research-Connections-2013 2013.
4 Tijssen R J, van Leeuwen T N, van Wijk E. Benchmarking university-industry research cooperation worldwide: performance measurements and indicators based on co-authorship data for the world's largest universities. Research Evaluation Volume 18, Issue 1 13-24.
5 Blutooth, https://www.bluetooth.org/en-us May, 2014. 6 Android Development Tools, http://developer.android.com/tools/index.html March, 2014.

363
PROMOTING ENTREPRENEURSHIP AND INNOVATION FOR COMPETITIVE REGIONS


365 Proceedings of International Conference for Entrepreneurship, Innovation and Regional Development
ICEIRD 2014
Impact of using unique resources of the regions classified by rurality for higher value added and new jobs creation
Zivile Gedminaite-Raudone
Lithuanian Institute of Agrarian Economics, V. Kudirkos g. 18-2, Vilnius, Lithuania, [email protected]
This paper aims at analysing impact of using unique resources of the regions classified by rurality for creating higher value ad ded and new jobs in the rural regions. Rapid changes in the world economy required revisio n of the rural policy paradigm and adaptation to the values of post-industrial soc iety and necessity to find new tools to ensure prosperity of rural regions. Unique cultu ral, historic and natural resources of the region can be used as a tool to increase reg ional economic growth by creating higher value added and new jobs.
Typology for classifying regions by rurality and un iqueness index was developed for the assessment of impact of using unique resources of the region as economic advantage. In the next stage value added and jobs c reation possibilities were assessed. The results revealed that classification of the regions by rurality using uniqueness index of each rural region can be used f or identification of groups of the regions within a country that can serve as a basis for creation regional support strategy that can be applied by various governmenta l institutions with the aim to create higher value added and new jobs creation usi ng unique cultural, historic and natural resources. This analysis has been conducted at the national level. From a policy perspective, recommendations for the regiona l policy to define important insights for the programming period 2014–2020 in th e EU can be applied.
Keywords Jobs creation, regional policy, rural policy, rural regions, unique resources, value added.
1. Introduction
Rapid changes in the world economy required revision of the rural policy paradigm and adaptation to the values of post-industrial society. The challenges of the post-industrial development stage of society calls for a shift from rural policy based on the functional-sectoral approach to the integrated policy, which deals with not only agricultural problems, but also with all those relating to the rural territory, specified as the rural region. New paradigm is based on the concept that regional policy should assess new economic and social features of the 21st century that can have a significant influence on the further development of the region’s leading to the successful development and reducing disparities of the regions [1], [2], [3], [4]. The new “place-based” paradigm requires important changes for setting rural policy measures that intend to have multi-level approach and orientation towards sustainable development of the entire rural region rather than support to an individual farm or a settlement [5], [6], [7], [8], [3], [4]. This paradigm also emphasizes the importance of “learning region” concept, networking and cluster formation, innovation and the most importantly – to support not the lagging regions but to exploit regions “basic skills” and

366 Proceedings of International Conference for Entrepreneurship, Innovation and Regional Development
ICEIRD 2014
to use “competitive advantage of the region” [9]. EU member states also need to do adjustments along new trends in rural policy and administer these policies effectively [10], [11], [12], [13].Traditionally rural policy decisions were based on the regional typologies where the main criterion is population density and/or number of inhabitants in the settlement. The methodology of the OECD was most often applied for the classification of the regions by rurality for governance purposes where regions are divided into three groups to predominantly urban, intermediate and predominantly rural regions [3]. This methodology in the last decade became the subject of criticism. New forms for classifying regions by rurality were developed with the aim to create typologies of the regions not competing internally and with the aim to be complementary than alternative for the needs of public administration. In recent decades European regions were facing new challenges not only for high demand of new rural paradigm but also for its sustainable social and economic development. European regions were usually affected by different socio-economic situation within the regions, different quality of infrastructure, remoteness of the regions, social and economic changes, social deprivation, high unemployment and other factors. These reasons explained why regional policy in the European Union played very important role from the establishment of the European Union [13]. Additionally to the above mentioned challenges, globalization and also European integration processes influenced development of the regions often leading to loose or decrease economic advantages of the regions on competitiveness side because of convergence of the regions. That is why the delivery of the Europe 2020 relies heavily on the new governance structures and processes that the European Union has been putting in place since 2010. These cover employment, education, research and innovation, social inclusion and poverty reduction, climate and energy [14]. Regions can be listed as very important object influenced by these new social and economic challenges and the results of the globalization and regionalization. This impact is measured by increased significant economic, social and territorial disparities that still exist between Europe’s regions. Disparities are apparent not only at the regions within one country but also between the European Union member states regions. These disparities could undermine some of the cornerstones of the European Union and the “Europe 2020” strategy which identifies the European Union to become a smart, sustainable and inclusive economy [14], [15]. Competiveness of regions is one of the most important policies formulating regional policy. The new focus on the specific features of the region and its competiveness encourages using the regional policy measures reflective of broader conception of the rural areas [16]. The following situation encourage to investigate this problem and finding for new solutions that would help to ensure successful development of the regions by helping less developed regions or regions facing structural problems to increase their competitiveness and promote sustainable development of economic activities. The most important possible solutions to increase competitive advantages of the regions are significant use of local resources, increased specialization of the regions and support investment policy. Existing cultural, historical and natural resources of the region can be identified as region‘s unique resources and their use in economic activities can also contribute to the regions value added, creation of new jobs and other significant results. The role of uniqueness becomes important as it can be named as a new success factor in this period and their use in economic activities can help to increase economic advantages of the region by using unique resources existing in the region, in other words – their strengths or „basic skills“ that are unique comparing with other regions. Adding new concept of economic assessment of regional uniqueness to the EU regional policy would increase its effectiveness and could ensure smoother use of existing unique resources of the region, will provide assumptions for new unique features creation and increase value added of the region and jobs growth. Classification of rural regions by rurality can help to identify groups of the regions with this potential where in the next stage can be used for administrative purposes by the state institutions responsible for regional policy to encourage the following group of the regions to use unique resources to create higher value added and more new jobs. Regions must be

367 Proceedings of International Conference for Entrepreneurship, Innovation and Regional Development
ICEIRD 2014
differentiated by the factors that enhance the region's competitiveness, and other important social-economic development criteria. Uniqueness becomes important element for creation of regional prosperity. Use of unique resources of the region can lead to regional economic benefit using new success factors. Unique resources of the region used in the economic activities can make the region very specific and thus reaching its competitive advantage based on sustainable development, cooperation and responsible environment principles [17].
2. Methodology
The typology for classification regions by rurality and uniqueness index methodology were developed for assessment of unique resources of rural regions using uniqueness index and their economic assessment. Theoretical framework of research was based on systemic approach to reveal specifics of each region type based on three aspects of higher order systems:
– Values of post-industrial society. – New “place-based” rural policy paradigm. – Economic and social situation and institutional structure within the country.
2.1 Typology for classification regions by rurality
This typology is based on the idea that cities are the primary regional and national economic growth poles and they affect development of the region. Usually, economic and social situation of the regions with no metropolis city in the region is worse than in the region having metropolitan city. Regional distribution by metropolitan and non-metropolitan regions is the most prevalent in most countries. Defining regions with metropolitan cities, the main criteria are population size in the largest city of the region. Size of population in metropolitan city should be defined by the state situation. For Lithuanian case 50 thousand inhabitants in the city define metropolitan city. In this case region is urban region. City with 50 thousand residents is commonly used in the world practice defining limit for the metropolitan city. In Lithuania cities having 50 thousands residents are considered as large cities and classifies as city municipalities (with exception of Palanga city with about 18 thousands of residents). Defining the line for rural and semi-rural, according to the population of the largest city within the region, in addition to 50 thousand population criteria, statistical clustering method was used. Size of the city in terms of population, which has become a line between the two groups, was based on the calculation of the length of the interval group by G. Sturges formula by eliminating extremes values of indicators.
Note: i – group interval length; N – number of municipalities; – maximum value of indicator; – minimum value of indicator. For the case of Lithuania, line for rural and semi-rural region is city with 15 thousand residents. Any Lithuanian region can belong to the one of the following types:
– rural region, if number of residents in the largest city of the region is less than 15 thousand;
– semi-rural region, if number of residents in the largest city of the region is between 15 and 50 thousand;

368 Proceedings of International Conference for Entrepreneurship, Innovation and Regional Development
ICEIRD 2014
– urban region, if number of residents in the largest city of the region is higher than 50 thousand.
All rural regions classified by rurality in the next stage are divided into 3 groups by G. Sturges formula using results of uniqueness index (more detailed explanation in the next paragraph). Economic results for higher value and new jobs creation is based on region classification by rurality and uniqueness index results using only rural regions grouped into 3 groups by rurality.
2.2 Assessment of unique resources of the regions u sing uniqueness index and economic assessment of rural regions – higher v alue added and new jobs creation
The main results of economic assessment of regional uniqueness in the context of the EU integration process are to assess added value and new jobs creation by using unique resources in the region. Changes are evaluated using following functions:
∆PVit=f(∆MIit); i = 1, …, n; t = 1, …, n; ∆DVit=f(∆MIit); i = 1, …, n; t = 1, …, n;
Note: PV – value added, DV – jobs creation, MI – investments in fixed tangible assets, i – regions, t – year. The logic of theoretical concept is provided in Figure 1.
Figure 1 The logic of theoretical concept for economic assessment of regional uniqueness
This part consists of 2 stages. In first stage unique resources of the region is assessed
by using uniqueness index. In second stage economic assessment of regional uniqueness is performed analysing economic indicators, added value and jobs creation perspectives. Economic assessment tool by using the uniqueness index is devoted for various types of uniqueness. According to the needs assessment can be implemented by 2 levels: 1) assessment at the country or union level (for example, the European Union level) by ranking regions from the highest to the lowest ranking points; 2) assessment within one region with the aim to rank various uniqueness types by highest to the lowest points.
Assessment of uniqueness of the regions: groups of indicators are defined including all dimensions needed for the assessment of this type of uniqueness. Developing indicators for the uniqueness index the holistic approach was applied to ensure that all dimensions and indicators would operate as a system rather than a set of its components. Supply and demand side should reflect the set of indicators (see Figure 2).
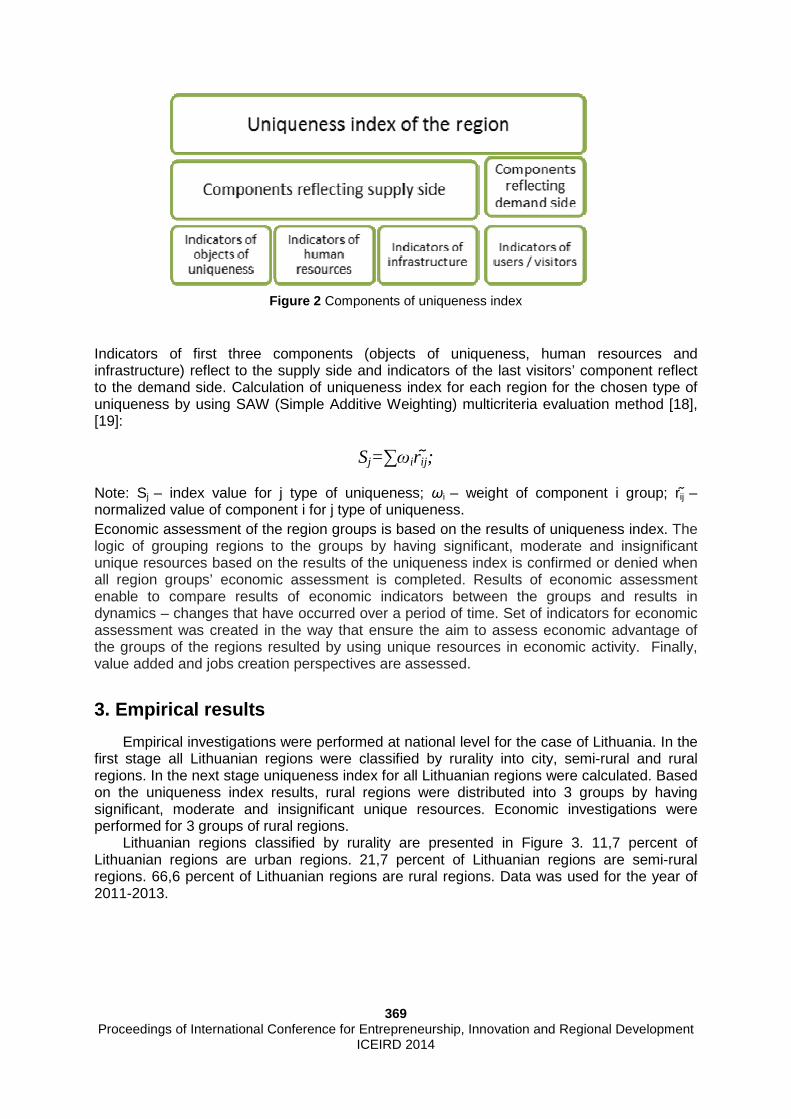
369 Proceedings of International Conference for Entrepreneurship, Innovation and Regional Development
ICEIRD 2014
Figure 2 Components of uniqueness index
Indicators of first three components (objects of uniqueness, human resources and infrastructure) reflect to the supply side and indicators of the last visitors’ component reflect to the demand side. Calculation of uniqueness index for each region for the chosen type of uniqueness by using SAW (Simple Additive Weighting) multicriteria evaluation method [18], [19]:
Sj=∑ωir᷉ij;
Note: Sj – index value for j type of uniqueness; ωi – weight of component i group; r᷉ij – normalized value of component i for j type of uniqueness. Economic assessment of the region groups is based on the results of uniqueness index. The logic of grouping regions to the groups by having significant, moderate and insignificant unique resources based on the results of the uniqueness index is confirmed or denied when all region groups’ economic assessment is completed. Results of economic assessment enable to compare results of economic indicators between the groups and results in dynamics – changes that have occurred over a period of time. Set of indicators for economic assessment was created in the way that ensure the aim to assess economic advantage of the groups of the regions resulted by using unique resources in economic activity. Finally, value added and jobs creation perspectives are assessed.
3. Empirical results
Empirical investigations were performed at national level for the case of Lithuania. In the first stage all Lithuanian regions were classified by rurality into city, semi-rural and rural regions. In the next stage uniqueness index for all Lithuanian regions were calculated. Based on the uniqueness index results, rural regions were distributed into 3 groups by having significant, moderate and insignificant unique resources. Economic investigations were performed for 3 groups of rural regions.
Lithuanian regions classified by rurality are presented in Figure 3. 11,7 percent of Lithuanian regions are urban regions. 21,7 percent of Lithuanian regions are semi-rural regions. 66,6 percent of Lithuanian regions are rural regions. Data was used for the year of 2011-2013.

370 Proceedings of International Conference for Entrepreneurship, Innovation and Regional Development
ICEIRD 2014
Figure 3 Mapping of Lithuanian regions by rurality
The uniqueness index methodology was applied for the assessment of uniqueness as economic advantage of the regions. This analysis has been conducted at national level to calculate uniqueness index for the Lithuanian regions by its potential in unique resources. In the next step only Lithuanian rural regions classified by rurality were divided into 3 groups by potential of unique resources: in 1st group rural regions with significant unique resources, in 2nd group rural regions with moderate unique resources and 3rd group rural regions with insignificant unique resources. Distribution of Lithuanian rural regions into these 3 groups is shown in Table 1.
Table 1 Grouping of rural regions of Lithuania by unique resources
Lithuanian rural regions by unique resources
Number of Lithuanian rural regions in the group (ranking place and index value)
Significant resources 14 regions Ranking place from 1 to 14 Ranking values from 0.53 to 1.19
Moderate resources 19 regions Ranking place from 15 to 33 Ranking values from 0.27 to 0.50
Insignificant resources 7 regions Ranking place from 34 to 40 Ranking values from 0.06 to 0.24
Significant unique resources that can give economic advantage for the rural regions are placed in regions close to the regions with metropolitan cities or having resort status cities. 35 percent of Lithuanian rural regions have significant unique resources. 47,5 percent of Lithuanian rural regions have moderate unique resources. 17,5 percent of Lithuanian rural regions have insignificant cultural unique resources.

371 Proceedings of International Conference for Entrepreneurship, Innovation and Regional Development
ICEIRD 2014
Economic assessment results of uniqueness of three Lithuanian rural regions groups, having significant, moderate and insignificant resources, are provided in Table 2. In this assessment, the results of the average value of the indicators in the period from 2005 to 2011 for each group of the rural regions were conducted. Results of relative values of indicators are presented in the table with total indicator value in this economic activity.
Table 2 Results of economic assessment of the groups of Lithuanian rural regions
Results of economic assessment
I group of the
regions*
II groups of the
regions*
III group of the
regions* Proportional part of economic entities in operation ***, from 2009 to 2013, group average, in percent.
5.2 3.5 3.3
Proportional part of employees ***, from 2005 to 2010, group average, in percent.
5.5 3.1 2.8
Proportional part of turnover ***, from 2005 to 2010, group average, in percent.
2.4 0.9 0.6
Proportional part of value added at factor cost ***, from 2005 to 2010, group average, in percent.
3.2 1.4 1.2
Proportional part of investments in fixed tangible assets ***, from 2005 to 2010, group average, in percent
2.4 0.6 0.3
Number of implemented projects from the EU structural funds for the tourism development from 2007 to 2013**
2.3 1.4 1
Support size from the EU structural funds for the tourism development from 2007 to 2013**, million Litas.
7.7 1.8 0.9
* Lithuanian rural regions having significant unique resources belong to the 1st group of rural regions. Lithuanian rural regions having moderate unique resources belong to the 2nd group. Lithuanian rural regions having insignificant unique resources belong to the 3rd group.
** Assessment of the projects for tourism development and support size from the EU structural funds in based on the results from 2007 to 20 March 2013.
*** <… in accommodation and food service activities comparing with economic entities in operation in all economic activities>.
The results in the table confirms that the highest value of economic indicators and biggest use of the EU support for tourism development is in the first Lithuanian rural region group having significant resources of uniqueness. This group performs highest value added from this activity comparing with other 2 groups of the regions. Lower position belongs to the second group of the regions of Lithuania; in the last place – 3rd group of rural regions of Lithuania.
Results of value added and value added of new jobs creation differs in all three groups of Lithuanian rural regions. First group of Lithuanian rural regions having significant unique resources had no relation between investments and value added. So at the time of assessment it is difficult to make a conclusion if it is efficient to make investments to have higher value added in these regions in the future. Second group of the Lithuanian rural regions having moderate unique resources confirmed highest potential of value added and value added for new jobs creation – 1000 Lt investments gives 1,65 coefficient for value added and 0,08 coefficient for value added of new jobs creation. Third group of the Lithuanian rural regions having insignificant resources have no relation between investments and value added and low impact for value added for new jobs creation – 1000 Lt investments gives 0,01 coefficient for value added of new jobs creation.

372 Proceedings of International Conference for Entrepreneurship, Innovation and Regional Development
ICEIRD 2014
4. Conclusions 1. Economic assessment of regional uniqueness should become an important element
in the 21st century in the implementation of new regional policy paradigm by using unique features and strengths of the region to achieve competitive advantage rather than supporting lagging activities within the region. Unique resources of the region can be used as a tool to help the region to create economic advantage using local resources, increased specialization of the region and supporting investment policy. Results of economic assessment of regional uniqueness identifying potential of value added of the region and jobs growth are important elements for implementation of the EU regional policy and at member states level, aiming to increase EU policy effectiveness and to deliver the EU 2020 strategy aims.
2. Multilevel process of economic assessment of regional uniqueness helped to identify potential of unique resources of the rural regions to use it for higher value added and more new jobs creation in the case of Lithuania using two assessment stages in the methodology where in the first stage assessment of unique resources of the regions and in the second stage economic assessment of regional uniqueness were performed. Using methodology results in the practice can help to identify regions having similar unique resources that in the next stage can cooperate by implementing common activities aiming to create higher value added, ensuring more effective distributions of EU structural and cohesion funds and purposeful use of resources. The methodology can be applied in different countries with possibility to add new indicators.
3. Results of empirical investigations for the case of Lithuania identify common indications for unique resources of the regions that in the next stage can be used as one of the instrument helping to identify unique resources. Results shows that classification of the regions by uniqueness helps for decision-making process for regional policy that ensure more effective use of unique resources within the region, higher value added and more jobs creation in the regions. Assessment results of Lithuania case can be used as additional support differentiation tool for decision-making process in regional policy.
4. Further research development on economic assessment of regional uniqueness should be continued developing the concept of regional uniqueness and trying to explore new dimensions for economic assessment considering the fact that use of uniqueness becomes one of the solutions, trying to increase competitiveness of the regions, using local resources, increasing specialization of the regions and supporting investment policy.
References
1 Herrschel, T. 2005. “Competing Regionalisation” Through Territory and Cluster Networks: Experiences from Post-Socialist Eastern Germany, GeoJournal, Vol. 62, No. 1, p. 59–70.
2 O’Conner, D. 2006. Driving rural development: policy and practice in seven EU countries. Building Competitive Regions: Strategies and Governance, OECD Publishing.
3 OECD. 2006. Rural Policy Reviews. The New Rural Paradigm: Policies and Governance. OECD Publishing.
4 OECD. 2006. Reinventing Rural Policy. The OECD Policy Brief. [May 25, 2010]. Available via Internet: <http://www.oecd.org/dataoecd/18/9/37556607.pdf>.
5 Baldock, D.J.; Dwyer, P.; Lowe, J.; Petersen, N. 2001. The Nature of Rural Development: Towards A Sustainable Integrated Rural Policy in Europe, A Ten-nation Scoping Study for WWF and the GB Countryside Agencies. Institute for European Environmental Policy.
6 Copus, A.; Clare Hall, C.; Andrew Barnes, A. 2006. Study on Employment in Rural Areas. A study Commissioned by European Commission Directorate General for Agriculture. SAC.
7 Benaki, V.; Alexandrakis, E.; Apostolopoulos, C. 2007. Entrepreneurial Parameters and Classification – Typology for Rural Areas, ICAS papers. [July 12, 2013]. Available via Internet: <http://www.stats.gov.cn/english/ ICAS/papers/P020071114317657343748.pdf>.
8 OECD. 2005. Building Competitive Regions: Strategies and Governance. OECD Publishing.

373 Proceedings of International Conference for Entrepreneurship, Innovation and Regional Development
ICEIRD 2014
9 Organisation for Economic Cooperation and Development (OECD). 2009. How Regions Grow. Trends and analysis. OECD Rights and Translation unit (PAC), Paris.
10 Storti, D.; Henke, R.; Macri, M.C. 2004. The new European rural policy: a comparative analysis across regions. 87 Seminar of the European Association of Agricultural Economists Assessing Rural Development Policies of The CAP, Vienna, 21-24 April 2004.
11 Diakosavvas, D. 2006. Coherence of Agricultural and Rural Development Policies. OECD Publishing, Paris.
12 Dijkstra, L.; Ruiz, V. 2011. OECD Extended Regional Typology: The Economic Performance of Remote Rural Regions, OECD Regional Development Working Papers, No. 2011/06. OECD Publishing. [November 4, 2012]. Available via Internet: <http://dx.doi.org/10.1787/5kg6z83tw7f4-en>.
13 Melnikienė, R.; Vidickienė D.; Gedminaitė-Raudonė. Ž.; Ribašauskienė, E. 2011. Lietuvos regionų tipologijų pagal kaimiškumą tinkamumas regioninei politikai. Vadybos mokslas ir studijos – kaimo verslų ir jų infrastruktūros plėtrai, 5(29): 126–134.
14 Europe 2020 Strategy. [October 15, 2012]. Available via Internet: <http://ec.europa.eu/europe2020/index_en.htm>.
15 Baltic Sea region strategy. [November 20, 2012]. Available via Internet: <http://www.balticsea-region-strategy.eu/pages/what-is-the-eusbsr>.
16 Sepic, D. 2004. The regional competitiveness: some notions Russian–European Centre for Economic Policy. Moscow: RECEP.
17 Gedminaite-Raudone, Z. 2014. Economic assessment of uniqueness of the regions in the context of the European Union / Zivile Gedminaite-Raudone // Procedia - Social and Behavioral Sciences. The 2-dn International Scientific conference „Contemporary Issues in Business, Management and Education 2013". Amsterdam : Elsevier Science Ltd. ISSN 1877-0428. 2014, Vol. 110, p. 259–266.
18 Figueira, J., Greco, S., Ehrgott, M. 2005. Multiple criteria decision analysis: state of the art survey. Springer.
19 Ginevicius, R., V. Podviezko. 2008. A Feasibility study of multicriteria methods application to quantitative evaluation of social phenomena. Business: theory and practice. Vol. 9(2), 81–87 p.

374 Proceedings of International Conference for Entrepreneurship, Innovation and Regional Development
ICEIRD 2014
Social Enterprises in Regional Innovation Systems Satu Rinkinen1, Tuija Oikarinen1, Helinä Melkas1 1Lappeenranta University of Technology, Lahti School of Innovation, Saimaankatu 11, 15140 Lahti, Finland, [email protected]
There are many expectations towards social enterpri ses. The EU, for instance, expects them to be a source of new and innovative solutions to the persistent problems of society, to allow a better inclusion of workers and consumers, and to produce ‘laboratories’ of social innovations, especially at local or community levels. More research is however needed to understand the condit ions under which social enterprises can contribute effectively and efficien tly to solving social challenges in a sustainable way.
The aim of this paper is to identify whether and in what way social enterprises are communicated as an innovative solution and as a sou rce of innovations for economic and development activities through regional strateg ies. The data consists of regional innovation and business strategies from all Finnish regions, analyzed by using qualitative content analysis. According to the resu lts, explicit references to social enterprises are few, but the social perspective is, in some form, present in most of these strategies.
The role of social enterprises in regional strategi es arises most often in the context of promoting cultural change. It is mainly manifested in concepts such as communality, wellbeing, social perspective, social responsibilit y, and good working life. They are related to the cultural aspect of social transforma tion emphasizing more communal ways of doing things and striving for individuals’ comprehensive wellbeing. Social enterprises are not so often connected to tr ansforming economic and political contexts as they are to the cultural contexts in th e strategies studied. Promoting responsible business, production of new wellbeing s ervices, cross-sectoral cooperation and urging the third (NGO) sector to mo re business-like activities reflect certain economic aspects of social transformation. Political aspects come out mainly in the aims to consider social responsibility in pu blic procurements and to foster cooperation between public, private and third secto rs.
This paper emphasizes the potential of social enter prises in innovation, employment, social cohesion and mobilizing human capital in new ways. Regional innovation and business strategies show that the rising themes of, e.g., new kind of entrepreneurship, wellbeing and responsibility have been acknowledged at the regional policy level. Social enterprises could have a special role in reg ional innovation activities and policies, and in realizing new innovation policies such as regional smart specialisation strategies. The challenge lies first of all in defi ning social enterprise and making it clear and visible in the society, and in perceiving it not as a project or workshop-like activity but as sustainable entrepreneurial activit y that has its own role in regional innovation and business ecosystems.
Keywords Regional Development, Regional Strategies, Social Enterprises, Social Innovation

375 Proceedings of International Conference for Entrepreneurship, Innovation and Regional Development
ICEIRD 2014
1. Innovation and regional policy
The European Union is struggling to rise from its economic crisis with the help of the new Europe 2020 growth strategy that focuses on smart, sustainable and inclusive growth [1]. Smart growth refers to an economy based on knowledge and innovation. The aim is to invest more in research, innovation and entrepreneurship. Sustainability deals with not only environmentally sustainable, efficient and competitive solutions, but also underpins economic, social and territorial cohesion. The inclusiveness objective emphasises fostering a high-employment economy delivering economic, social and territorial cohesion. It involves raising Europe's employment rate, helping people invest in training, and modernising labour markets and welfare systems ensuring that the benefits of growth reach all parts of the EU. Careers should be extended, which again raises questions concerning the quality of working life and the well-being of the employees.
At regional level the growth strategy and related innovation policies are implemented in the form of regional innovation strategies for smart specialisation. Every European region is obligated to create their smart specialisation strategies in order to benefit from the new ERDF (European Regional Development Fund) funding period [2]. These strategies are meant to mobilise the innovation potential of all EU regions in the future. The smart specialisation approach promotes entrepreneurship, making use of regional assets and utilising top level expertise. It embraces innovation as a broad concept, including not only the manufacturing sector but also design and creative industries, social and service innovation and practice-based innovation. It contributes to growth by “strengthening territorial cohesion and by managing structural change, creating economic opportunity and investing in skills development, better jobs and social innovation” [3].
Finland can be considered a forerunner when it comes to developing innovation policies and creating new innovation strategies. The Finnish innovation policy has also adopted the idea of a broad-based innovation policy including not only the traditional science and technology based innovation activities but also the more practice-based mode of innovation. Some experiences in regional (smart) specialisation have been gained during the previous nationwide regional innovation policy programme, the Centre of Expertise Programme [4, 5]. In a wider perspective, the policy discussion has called for more place-based policies and policies focusing not on clusters but on innovation and business ecosystems [6, 7, 8, 9, 10]. Current economic situation poses challenges in both policy planning and practice. These challenges include finding and defining regional strengths in global competition, creating new courses of action, activating people and better exploiting the innovation potential embedded in regional characteristics and people in order to create both wealth and wellbeing.
2. Social Enterprises
2.1 Expectations for Social Enterprises
In seeking for smart, sustainable and inclusive growth, many expectations are set for social enterprises. Social enterprises are perceived to be a source of new and innovative solutions to the persistent problems of society, as well as a means to allow a better inclusion of workers and consumers [cf. 11]. They are also acknowledged as a major producer or ‘laboratory’ of social innovations, especially at local or community level. [12]
Social enterprise (SE) is considered as a business model that can simultaneously address issues of economic growth, employment and quality of life; and as a source of solutions to certain illnesses of our modern societies – wicked problems. The utility of SE as an

376 Proceedings of International Conference for Entrepreneurship, Innovation and Regional Development
ICEIRD 2014
instrument for governments has much been emphasized but the actual utilization is unclear. There is poor understanding of functioning, lack of visibility of its local, domestic and international role, inadequate access to resources, and inappropriate legal environments – which all prevent SE from realizing its full potential [12].
The concept of social enterprise is vague [13]. SEs can neither be defined by their legal form, nor by their sector of activity or by any other fixed criteria. Moreover, the social aspect may concern the input used (workers or working conditions) or the output produced (goods or services to a target group in need). Therefore, it is almost impossible to obtain concise statistical information on the social enterprise sector. [14] Thus the evaluation and assessment of the impacts as well as comparisons of SEs is very demanding, and general guidelines for how to promote their functioning are hard to outline.
The definition of EMES is used in this study to frame SE [15]. The EMES’ definition distinguishes between, on the one hand, social enterprise criteria that are more economic and entrepreneurial, and, on the other, indicators that are predominantly social. The four dimensions related to the economic and entrepreneurial criteria are: • A continuous activity producing goods and/or selling services. In contrast to some non-
profit organizations with advocacy activities or in charge of redistribution of money, the provision of goods and services is a main reason for the existence of the social enterprise.
• A high degree of autonomy. Social enterprises are often (co-)financed, but never managed by public authorities. This autonomy is also apparent in the right of ‘voice’ and ‘exit’.
• A significant level of economic risk. The founders of a social enterprise assume the major part of the economic risk; the financial viability depends on the efforts of the members and workers.
• A minimum amount of paid work. Social enterprises can combine monetary and non-monetary resources, voluntary and paid workers, but they are not only operating with volunteers.
The social criteria are: • An explicit aim to benefit the community. One of the principal aims of social enterprises is
to serve the community or a specific group of people. In the same perspective, a feature of social enterprises is their desire to promote a sense of social responsibility at local level.
• An initiative launched by a group of citizens. Social enterprises are the result of collective dynamics involving people belonging to a community or to a group that shares a well-defined need or aim.
• Decision-making power not based on capital ownership. This generally refers to the principle of ‘one member, one vote’ or at least to a decision-making process in which the voting power in the governing body with the ultimate decision-making rights is not distributed according to capital shares. Moreover, although the owners of the capital are important, decision-making rights are generally shared with the other stakeholders.
• A participatory nature, which involves the various parties affected by the activity. Representation and participation of users or customers, stakeholder influence on decision-making and participative management are often important characteristics of social enterprises. In many cases, one of the aims of social enterprises is to further democracy at local level through economic activity.
• Limited profit distribution.
In Finland, there are two main types of social enterprises. On the one hand, there are work integration social enterprises (WISE) which offer employment to disabled and long-term unemployed people and which are provided for by law (Act on Social Enterprises,

377 Proceedings of International Conference for Entrepreneurship, Innovation and Regional Development
ICEIRD 2014
1351/2003). On the other hand, there are organizations which have adopted a social enterprise business model and are therefore eligible for the social enterprise mark. [16]
The EU has been a strong actor in promoting research and program support for SE. In Western European countries, the support of SE is tied to governments and the EU. Government support includes legislation, coordination, policy work and programs. Much of the government support, in terms of public policy and financing, is however narrowly focused on work integration social enterprises (WISE) and often targeted and limited to start initiatives and to make up for the temporary unemployability of the disadvantaged persons to labour markets. [17] At present, the public view of WISE and SE more generally is much too narrow; it is not a question of employing, for instance, ‘marginalised’ people only, but also others who are, for some reason, outside of the ‘traditional’ labour market. These enterprises are directly relevant with regard to intangibles (e.g., human and social capital) [18, 19].
2.2 The Role of Social Enterprises in Regional Inno vation
The expectations for SEs as social innovators are high. The EU defines social entrepreneurship as referring to “an activity whose primary purpose is to pursue social goals, produce goods and services in a highly entrepreneurial, innovative and efficient manner to generate benefits for society and citizens, use surpluses mainly to achieve social goals, and accomplish its mission through the way in which it involves workers, customers and stakeholders affected by its business activity”. [12] SE is seen as something new and distinct from classical business and traditional non-profit activity, combining to different extents elements of the social purpose, market orientation, and financial performance standards of business [20].
Not only the concept of SE is complex and multifaceted; there is significant conceptual obscurity concerning the concept of social innovation, too. In some countries, social innovation refers to the object of innovation; its application to social context, social needs (A). In other countries – and very often in research literature – social innovation refers to the actions of social entrepreneurs (B). In others it refers to the integration of social value in the quest for private profits (e.g., corporate social responsibility, eco-friendly firms) (C). According to OECD, differing concepts may well limit policy learning, exchange, development and evaluation. “Well-structured views and ideas about social/societal innovation and their role within innovation policy are lacking and are in high demand” [21, 22]. It also needs to be noted that in the research literature, social entrepreneurs and social entrepreneurship have been emphasized, whereas social enterprises as entities, ‘communities of practice’ have received far less attention, although this would reflect the present wider understanding of innovation.
This paper follows the notion that solutions to social problems often demand fundamental transformations in political, economic, and social systems. SEs may be seen as a way to catalyse social transformations well beyond solutions to the initial problems. SEs may create innovative solutions to immediate social problems, and mobilize the ideas, capacities, resources, and social arrangements required for sustainable social transformations. [23]
However, in general, SEs are rather small-sized, act at a local level and depend on public funds. Their development is influenced by external barriers and driving forces, such as legal and taxation frameworks, public policies and budgets, demographic developments and unemployment rates. Thus, the promotion and development of SEs concern several policy sectors, such as social, employment and industrial policy. [14]
It is obvious that SE needs the support of the external environment and the use of a wide range of resources. The role played by the surrounding external social, economic, cultural,

378 Proceedings of International Conference for Entrepreneurship, Innovation and Regional Development
ICEIRD 2014
and institutional (political) environment is crucial. Alvord, Brown and Letts [23] identified how strategies intended to generate social transformation focused on cultural, economic or political arenas. To foster cultural change implies, e.g., reshaping cultural assumptions about the roles and appropriate behaviours of how to take initiatives, solve problems and influence key decisions. Economic interventions focus on, e.g., lending money and enhancing productivity. Political transformation may be leveraged, e.g., by education and influence on decision-making.
3. Research Design and Methods
The aim of this study is to explore whether and in what way SE is communicated as an innovative solution and also source of innovations for economic and development activities through regional strategy documents. Regional business and innovation related documents were thus found to be the most useful data for this research purpose.
Concerning Finnish regions, regional strategies and INKA applications express the region’s future goals concerning economic development and the means to achieve these goals. The INKA (Innovative Cities) programme is the central part of policies aiming at strengthening regional innovation centres in today’s Finland. The INKA programme was launched in the beginning of 2014, and it replaces the previous Centre of Expertise Programme. All city regions in Finland were invited to send their applications to the programme, and five city regions were finally chosen to the programme as the lead regions, together with seven other partner cities.
The data covers all the regions in Finland. It consists of the latest regional innovation and business strategies (22), applications to the new national innovation programme INKA (18) and the final proposals of the lead city regions (5) to the INKA programme (see Table 1). The regional innovation and business strategies used were the latest operative strategies available at the time the data was collected (December 2013). The strategies have varying time spans within the time frame of 2005–2025. The INKA applications are from 2012, and the final INKA proposals from 2013.
Table 1 The data collected. Region Regional innovation /
business strategy INKA
application Final INKA proposal
Helsinki X X Hämeenlinna X Joensuu X X X Jyväskylä X X X Kajaani X X Kokkola X X Kotka X X Kouvola X X Kuopio X X KUUMA region (10 municipalities) X Lahti X X Lappeenranta X X Mikkeli X X Oulu X X X Pori X X Raahe X X Rovaniemi X X Savonlinna X Seinäjoki X X

379 Proceedings of International Conference for Entrepreneurship, Innovation and Regional Development
ICEIRD 2014
Tampere X X X Turku X X Vaasa X X X
The data was analysed by using content analysis [24]. This study utilised the qualitative method in which data is categorized inductively, and the goal is to reduce the data into manageable segments in order to understand the phenomenon [24,25]. The data was first read through by using search words. This was done in order to effectively find the text parts that could possibly relate to the research theme. These parts were then analysed in depth. The text parts gathered were divided into two categories: the ones that had explicit references to social enterprises, and the ones that contained the ‘spirit’ of the social perspective on business and regional development. As the ‘spirit’ part contained much more data than the explicit references, the categories were further divided into nine different sub-categories representing the content of these text parts (see Table 2). The left side column of Table 2 presents the name of the sub-category and the right side column lists in more detail what kind of talk the strategies actually contain in these sub-categories.
Table 2 Sub-categories of the social perspective.
Sub-category Content Communality Aim to create new kind of communality; cohesion; affinity; communities
formed by different actors; joint activities; communality among residents; communal ways of working; participatory urban planning
Wellbeing Individuals’ wellbeing as a success factor; working and living environment’s effect on wellbeing; new wellbeing services; exercise and health; promoting wellbeing
Social sustainability Social harmony; social effects are considered along with economic and environmental effects; social sustainability along with economic and environmental sustainability
Social responsibility Social responsibility in actions; social responsibility in public procurements Cross-sectoral cooperation
New experiments and forms of cooperation between sectors; the third sector is encouraged to act in a more entrepreneurial manner; cross-sectoral cooperation especially in the health and wellbeing sector; the interface of private and public sector
Social innovation The ability to produce social innovations along with technological innovations; social innovations supporting technological innovations; research on social innovations
Changing values The general changes in values and lifestyles in the future Working life Creating a good working atmosphere; the joy of working; maintaining the
ability to work; research regarding the quality of working life Responsible business Staff policy; financial responsibility; ecological responsibility in business
activities; sustainable economic growth
4. Results 4.1 Explicit References to Social Enterprises The explicit references to social enterprises in the strategies are few. Only two explicit references were found from the regional strategies of Kuopio and Lappeenranta. The city of

380 Proceedings of International Conference for Entrepreneurship, Innovation and Regional Development
ICEIRD 2014
Kuopio has created an employment action plan which focuses on developing social employment. Lappeenranta’s strategy, again, presents founding a social enterprise as one of its objectives under the larger theme of “Urging into active working life and education”.
The INKA applications also had altogether two explicit references. Pori’s application emphasises the role of Diaconia University of Applied Sciences as a central organisation in social enterprise related research and development work in Finland. Pori’s application is the only document among all the research data where the concept of SE is defined. The definition is as follows: “Social enterprises work for social good. With the help of their business they strive to solve social or ecological problems and to further social objectives. Social enterprises use more than half of their profit for producing social good that matches with their objectives and business idea. Their business model is also characterized by their customer orientation, investing in workers’ wellbeing and transparency of their business.” Oulu’s INKA application and final INKA proposal only mentions a certain enterprise, labelled as a social enterprise, which helps start-ups find premises and organise events.
4.2 Thematic References to Social Perspective on Bu siness and Regional Development
As described in Section 3, the text parts containing references to the ‘spirit’ of social perspective on business and regional development were further divided into different sub-categories. These nine sub-categories are presented and their contents are opened up in Table 2.
Communality was brought up in 10 of all the 21 regions. The strategy talk of communality refers more precisely to aims to create new kind of communality and communities formed by different actors. Communality also refers to new, communal ways of working and doing things together. Also the notions of the importance of integrating residents in different planning activities were regarded as an expression of intent of exploiting communal ways of developing the region.
Another quite common theme was that of wellbeing. Wellbeing was the general context when talking about working and living conditions, new wellbeing services, exercising and health, and general promoting of people’s wellbeing. Wellbeing was noted as an important factor behind individuals’ success and thus was also connected to working life.
Social sustainability also showed through the data. This theme refers to the talk about social harmony, social effects and sustainability which were often mentioned along with economic and environmental effects and sustainability. All in all, the triangle of economy, environment and society was brought out.
The need for future cooperation between the public, private and third sector was brought out in six regions. The interface between these sectors was seen as potential for new innovations and finding new ways to do things and organize especially the health and wellbeing services. Social responsibility was mentioned in few regions, also regarding public procurements. The concept of social innovation was mentioned a couple of times in the documents. In the INKA application of Turku, it was noted that technological innovations need supportive social innovations. However, none of the documents shows attempts to define this concept.
The themes of working life, changing values and responsible business were the least visible themes in the documents analysed. The strategy talk referring to working life dealt with, e.g., creating a good working atmosphere, the joy of working, and maintaining employees’ ability to work. The general ongoing and future social change of values and lifestyles was noted in
381 Proceedings of International Conference for Entrepreneurship, Innovation and Regional Development
ICEIRD 2014
the economic and business strategies of Hämeenlinna and Raahe. The increasing importance of responsible business was mentioned only in the Pori region.
5. Conclusions
The results show that the spirit of the social perspective on development, innovation and business is present in regional policy documents, but the explicit references to social enterprises are very few.
According to our results, the (hidden) role of SE in regional strategies may be regarded as centred around promoting cultural change. The visible themes of communality, wellbeing, social sustainability, social responsibility, changing values and good working life are all related to the cultural aspect of social transformation, which in this case may be seen as meaning transformation towards promoting more communal ways of doing things, individuals’ comprehensive wellbeing, taking into account the social effects of different public and private activities, and focusing on the quality of working life in the future. The analysis thus shows that some signs of this cultural transformation may be observed at the regional level in Finland.
Economic and political aspects are not as visible as the cultural aspect in the results. Promoting responsible business, production of new wellbeing services, cross-sectoral cooperation and urging the third sector to more business-like activities show some economic aspects of social transformation. Political aspects come out mainly in the aims to consider social responsibility in public procurements and to foster cooperation between the public, private and third sector.
This paper emphasizes the potential of SE in regional innovation, employment, social cohesion and mobilising human capital in new ways. The ‘spirit’ of SE found in the regional innovation and business strategies shows that the rising themes of, e.g., new kind of entrepreneurship, wellbeing and responsibility have been acknowledged at the regional policy level. The paper points out that SE could have a special role in regional innovation activities and policies, and in realizing new innovation policies such as regional smart specialisation strategies. The challenge lies, first of all, in defining SE and making it clear and visible in the society, and in perceiving it not as a project or workshop-like activity but as sustainable entrepreneurial activity that has its own role in regional innovation and business ecosystems.
Current business and business support environment is used to traditional enterprises, which poses several policy challenges. How to regard SE? How to take into account the social effects in both public and private procurements? How to measure the value produced by social enterprises? How do SEs contribute to regional development and growth? Growth strategies at all policy levels (local, regional, national, supranational) emphasize entrepreneurship and employment. Concerning the objectives of growth, SE is directly connected to employment, innovation, entrepreneurship and extending working careers with the help of flexible forms of work and entrepreneurship.
The vision of how to encourage social innovations by social enterprises in regional development should be enriched. The focus could be widened from employing purposes to other social and environmental aspects, too. SEs alone cannot generate social transformation. The core is cooperation structures to bring together public, private and third sector organizations to encourage sustainable social innovation.
382 Proceedings of International Conference for Entrepreneurship, Innovation and Regional Development
ICEIRD 2014
References
1 European Commission. Europe 2020: A strategy for smart, sustainable and inclusive growth.
Communication from the Commission, Brussels. 2010. Available at: http://eur-lex.europa.eu/LexUriServ/LexUriServ.do?uri=COM:2010:2020:FIN:EN:PDF
2 European Commission. Research and innovation strategies for smart specialisation. Cohesion policy 2014-2020. Factsheet 2011 October. Available at: http://ec.europa.eu/regional_policy/sources/docgener/informat/2014/smart_specialisation _en.pdf
3 Foray D, Gobbard J, Beldarrain X G, Landabaso M, McCann P, Morgan K, Nauwelaers C, Ortega-Argilés R. Guide to research and innovation strategies for smart specialisation (RIS3). European Commission. 2012. Available at: http://ec.europa.eu/regional_policy/sources/ docgener/presenta/smart_specialisation/smart _ris3_2012.pdf
4 Jauhiainen J S. Regional innovation policies in Finland: Towards convergence and/or mismatch? Regional Studies 2009:42: 7: 1031–1045.
5 Edquist C, Luukkonen T, Sotarauta M. Broad-based innovation policy. In www.evaluation.fi: Evaluation of the Finnish National Innovation System—Full Report 2009.Taloustieto Oy, Helsinki.
6 Barca F. An agenda for a reformed cohesion policy: A place-based approach to meeting European Union challenges and expectations. Independent report prepared at the request of Danuta Hübner, Commissioner for Regional Policy. 2009.
7 Tödtling F, Trippl M. One size fits all? Towards a differentiated regional innovation policy approach. Research Policy 2005: 34: 8: 1203–1219.
8 Adner R. Match your innovation strategy to your innovation ecosystem. Harvard Business Review 2006: 84: 4: 98–107.
9 Wessner C W. Entrepreneurship and the innovation ecosystem policy lessons from the United States, Discussion papers on Entrepreneurship, Growth and Public Policy. 2004. Max Planck Institute for Research into Economic Systems.
10 Wallin J, Laxell P. Alueet globaaleissa ekosysteemeissä. The final evaluation of the Centre of Expertise Programme. Publications of the Ministry of Employment and the Economy, Innovation department, 19/2013. (In Finnish)
11 Campi S, Defourny J, Grégoire O. Multiple Goals and Multiple Stakeholder Structure: The Governance of Social Enterprises. In Nyssens M. (ed.) Social Enerprise. Routledge. 2006: 29-49.
12 EU 2012. Work programme 2013, Cooperation, Theme 8, Socio-economic sciences and humanities, European Commission C 4536 of 09 July 2012 http://ec.europa.eu/research/participants/portalplus/static/docs/calls/fp7/common/32764-annex_11_to_the_decision_ssh_for_cap_en.pdf (accessed 27 July 2012).
13 Bacq S, Janssen F. The multiple faces of social entrepreneurship: a review of defitional issues based on geographical and thematic criteria. Entrepreneurship & Regional Development 2011: 23:5/6: 373-403.
14 Heckl E, Pecher I, Aaltonen S, Stenholm P. Study on Practices and Policies in the Social Enterprise Sector in Europe. Final Report. KMU FORSCHUNG AUSTRIA. 2007
15 Defourny J. Introduction. From Third Sector to Social Enterprise. In Borzaga C, Defourny J. 2004. The Emergence of Social Enterprises. London, Routledge.
16 Finnish Ministry of Employment and the Economy. Yhteiskunnallisen yrityksen toimintamallin kehittäminen. Työ- ja elinkeinoministeriön julkaisuja 4/2011. Helsinki: Finnish Ministry of Employment and the Economy. (In Finnish.)
17 Kerlin J A. Social Enterprise in the United States and Europe: Understanding and Learning from the Differences. International Journal of Voluntary and Nonprofit Organizations. Published online 28 September 2006. http://link.springer.com/article/10.1007/s11266-006-9016-2/fulltext.html

383 Proceedings of International Conference for Entrepreneurship, Innovation and Regional Development
ICEIRD 2014
18 Lev B. Sharpening the intangibles edge. Harvard Business Review 2004: 82:6: 109-116. 19 Andriessen D. Making Sense of Intellectual Capital – Designing a Method for the Valuation of
Intangibles. Elsevier Butterworth-Heinemann. 2004. 20 Young D. Alternative perspectives on social enterprise. In Cordes, J. J. and Steuerle, E.C.
(eds), Nonprofits Business. Washington, DC. The Urban Institute Press. 2008. 21 Cervantes M. Draft terms of reference on “Social Innovation”. Presentation, OECD, Paris, 26-
27 June 2012. OECD, Country Studies and Outlook Division. 22 OECD. 39th Meeting of the Working Party on Innovation and Technology Policy, 26–27 June
2012: Draft terms of reference for the TIP activity on social innovation. Room Document 2. Paris OECD.
23 Alvord S H, Brown D L, Letts C W. Social Entrepreneurship and Societal Transformation: An Exploratory Study. The Journal of Applied Behavioral Science 2004: 40:3: 260-282.
24 Miles M B, Huberman A M. Qualitative data analysis: an expanded sourcebook. Thousand Oaks Sage Publications. 1994.
25 Morgan D L. Qualitative content analysis: A guide to paths not taken. Qualitative Health Research 1993: 3: 1: 112–121.

384 Proceedings of International Conference for Entrepreneurship, Innovation and Regional Development
ICEIRD 2014
The impact of the EU cohesion policy on the regional convergence process of the new member states in the European Union
Radmila Jovančević1, Tomislav Globan2 1Faculty of Economics and Business, University of Zagreb, J. F. Kennedy square 6, Zagreb, Croatia, [email protected]
2Faculty of Economics and Business, University of Zagreb, J. F. Kennedy square 6, Zagreb, Croatia, [email protected]
This paper analyses the impact to the cohesion poli cy in the process of convergence of the EU new member states (NMS). It starts from t he Cohesion policy and analyses the allocation of Structural and Cohesion Funds to the NMS towards the objectives of economic convergence. The analysis focuses on two p eriods of the financial perspective 2000-2006 and 2007-2013. Correlation an alysis of received EU funds and GDP per capita convergence proved that financial cr isis has had an impact on the weaker convergence of NMS with the old EU-15 in the period 2007-2013. Taking into account economic indicators, GDP per capita at PPP and the inflow of FDI in the NMS, the authors show that the impact of FDI on the conv ergence of NMS was strong in the whole period of analysis (2000-2012), however it wa s less pronounced in the second period (2007-2013), after the crisis, which resulte d in poor results for economic development. Th e problem of creating capacity for the withdrawal o f funds from the Cohesion Fund remains highlighted, in particular in those NMS that so far have not significantly participated in the program for the p romotion of competitiveness and employment.
Keywords Cohesion policy, convergence, EU new member states, foreign direct investment, regional development
1. Introduction
In times of financial and economic crisis, experts and citizens are increasingly worried about their future, more discussion about the role of government but also on regional policy and the effects of cohesion policy to overcome differences within the EU. This article will explore the convergence of the new Member States as measured by GDP per capita, FDI inflows and the impact on employment and the effectiveness of cohesion policy in the new member states (NMS) after the recession. Under the impact of the financial and economic crisis, the European Commission is under pressure to propose appropriate macroeconomic policies, create a favourable micro-economic environment and institutional framework as a precondition for stimulating economic growth, creating jobs, reducing social exclusion and to introduce structural changes. Cohesion policy of the EU plays a significant role in achieving these objectives.

385 Proceedings of International Conference for Entrepreneurship, Innovation and Regional Development
ICEIRD 2014
The paper is structured as follows. Section 2 deals with the evaluation of the EU cohesion policy in the period 2007-2013 and its impact on the NMS. Section 3 focuses on the economic development of NMS after the crisis, while Section 4 examines the role of foreign direct investment in the convergence of NMS with EU-15 countries. Section 5 exlpores the impact of the crisis on the development process of regions in EU NMS, while Section 6 concludes the paper.
2. EU Cohesion policy 2007-2013
Neofuncionalist approach integration implies that the real convergence of economic union occurs through a process of "peripheral dominance of" less developed regions, which will encourage them to catch up with the developed regions. Liberalization of trade and factor mobility should encourage convergence of regions. However, it is also likely that when economic integration has progressed, consistent trade liberalization in the absence of increasing returns and of agglomerations economies cannot accelerate convergence, it may intensify the existing problems of regional disparities. In the beginning, EU regional policy is defined by the Rome Treaty of the EEC (in 1957) where the promotion of regional policy is mentioned as one of the tasks of the Community. Regional policy became more active after the first enlargement of the Community in 1973. Each major step in integration of the EU, such as enlargement in 1986 (Spain and Portugal) and the largest one in 2004/2007 (when 12 NMS entered), or the development of a single market and economic and monetary union (EMU) - paved the way for the creation of new instruments by the European Union. This was done in order to counteract the negative effects on the most vulnerable populations or regions. EU regional policy experienced major changes in recent times [1]. Policy convergence began in 1988 when an official document "Single European Act" was introduced, which should achieve "economic and social cohesion", a goal that was incorporated in the Treaty of the EU. This policy was formulated due to concerns that some areas will not be able to achieve rapid economic development that other parts of the Community enjoyed after the creation of the single market. In order to achieve the objectives of social policy, the European Social Fund (ESF) was created, with the main purpose to achieve an active policy on the labor market - to combat long-term and high unemployment, the integration of young people in the workforce and further education of the labor force in line with technological changes. Cohesion policy is not a simple mechanism of redistribution between countries and regions; its intention is directed by financial transfers towards achieving two objectives: regional development and economic catch-up. There is a growing disparity between EU countries - the "Centre" and "Periphery". The policy highlights the necessity of finding a solution with respect to the issues arising as a consequence of development disparities among two unequal regions. After the last expansion, there has been a reform of the Structural Funds. Within the financial framework 2000-2006, around 260 billion EUR was secured for the instruments of cohesion. The multiannual financial period 2007-2013, 35.7% of the EU budget was allocated for cohesion policy. Through the Structural Funds and the Cohesion Fund, the EU has allocated 348 billion EUR of budget funds for programs that encourage competitiveness and employment by promoting balanced development of rural and urban areas (http://ec.europa.eu/regional_policy). Out of the total, 283 billion EUR were allocated for achieving convergence, of which 70 billion goes to the Cohesion Fund, and 54.96 billion EUR

386 Proceedings of International Conference for Entrepreneurship, Innovation and Regional Development
ICEIRD 2014
were aimed at increasing regional competitiveness and employment. To encourage the European territorial cooperation an amount of 8.7 billion EUR was committed [2]. However, despite the wide range of investment and use their resources to economic and social development, the European Union is still characterized by great economic inequalities which are evident especially after the economic crisis. Thus, it is understandable that in each new financial perspective, there is a proposal for new reform plans whose main goals are to eliminate or reduce constraints. The Commission adopted a proposal for the reform of cohesion policy within the 2007-2013. The proposed reform differs mainly in the reduction of the number of financial instruments and more flexible rules and regulations with an emphasis on economic growth and employment, and decentralization of responsibilities. The reform of the cohesion policy should be put at the service of the Lisbon strategy and make it a leverage for sustainable economic growth in the EU, which is much more than a policy of balanced regional development. EU contributes to sustainable economic growth by directing member countries to the EU funds, and hence national resources towards investment priority projects with significant economic impacts, and the introduction of higher quality approach to developing the national practice of the Member States. Reformed cohesion policy for the period 2020, should be focused on growth and creating jobs, combating climate change and energy dependence and the reduction of poverty and social exclusion, for which 351.8 billion will be available. This will be helped by targeting the ERDF in key priorities, such as support for small and medium enterprises which aim to double the aid of 70 to 140 billion EUR over 7 years [3]. Our analysis shows that in the period 2007-2013 about 174.84 billion EUR was at the disposal for EU NMS through the Structural and Cohesion Fund. Out of this amount, only 78.5 billion EUR, or 43.8 per cent, has been actually utilized and paid to EU NMS [3]. The correlation between the approved funds from the EU Cohesion Fund and the convergence of NMS with EU-15 is shown in Figure 1. Analysis shows a significant relationship between financial resources from the Structural and Cohesion Fund of the EU and the changes in GDP per capita which indicates that NMS achieved significant convergence with the EU-15 in the financial period 2000-2006. However, it is evident that the financial crisis has had an impact on the weaker convergence of NMS with the old EU-15 in the period 2007-2013.
(a) 2000-2006 (b) 2007-2013
Source: own calculations based on IMF WEO Database (2013); Eurostat, 2013
Figure 1 Received EU funds vs. convergence of EU NMS with EU-15

387 Proceedings of International Conference for Entrepreneurship, Innovation and Regional Development
ICEIRD 2014
For the convergence objective in the period 2007-2013 European Commission decided to allocate 283.8 billion EUR, out of which only 49.26% was paid. For the objective of regional competitiveness and employment 54.9 billion EUR was decided, out of which 56% was paid. For both objectives the Commission decided to allocate 174.8 billion EUR to EU-10 states (Table 1). The largest amount of funds per capita was recorded by the Lithuania, Estonia and Hungary, while the newest member states, Bulgaria and Romania, withdrew the least. In some countries there has been a slower rate of absorption of funds due to the introduction of the n+3 rule (for the NMS), and funds were paid within three instead of two years after the approval of a specific program. In the new financial perspective, the policy will try to eliminate these deficiencies, i.e. to speed up the withdrawal of funds from the Cohesion and Structural Funds. However, the problem of securing national resources of NMS to co-finance EU projects still remains, due to the impact of the economic crisis but also because of the unsettled public finances in many of them. Table 1 The allocation and utilization of Structural and Cohesion Fund in NMS, 2007-2013, until 2013
Population in million
EU funds decided in million EUR
EU funds paid in million EUR
EU funds paid per capita in EUR
Paid/decided in per cent
Bulgaria 7.65 6,673 2,414 315.7 36.2% Czech Rep 10.32 26,539 10,045 973.4 37.9% Estonia 1.34 3,403 2,087 1,558.1 61.3% Hungary 10.05 24,921 11,006 1,095.2 44.2% Latvia 2.27 4,530 2,364 1,041.7 52.2% Lithuania 3.37 6,775 4,264 1,265.5 62.9% Poland 38.12 67,185 35,185 923.0 52.4% Romania 21.54 19,213 4,310 200.1 22.4% Slovakia 5.4 11,498 4,714 873.0 41.0% Slovenia 2.02 4,101 2,063 1,021.5 50.3% Croatia 4.3 - 124 28.8 - EU-10 106.38 174,840 78,574 9,296.0 44.9%
Note: EU funds include ERDF, CF and ESF, up until 2013. Data for Croatia include the pre-accession IPA fund.
Source: European Commission
It should be emphasized that the funds from the structural and cohesion funds, which are allocated to member countries of the EU, are not crucial for economic development. For example, Romania received 200 euros per capita in the period 2007-2013 for the objective of Convergence and Competitiveness, while the country's gross fixed capital formation amounted to 27% of GDP in the same period. Meanwhile, Czech Republic, Estonia, Hungary, Latvia, Lithuania experienced an increase in gross fixed capital investment in the period 2000-2007. However, after the crisis of 2008, the reduction in gross fixed investment in per cent of GDP is evident in most analyzed countries.
Table 2 Investment in fixed capital in per cent of GDP
2000 2007 2008 2009 2010 2011 2012 2013
Bulgaria 17.98 34.09 37.54 29.37 22.89 21.92 23.83 21.16
Croatia 20.35 29.42 31.33 25.90 21.90 21.38 20.54 20.53

388 Proceedings of International Conference for Entrepreneurship, Innovation and Regional Development
ICEIRD 2014
Czech Rep. 29.93 29.80 28.94 23.85 24.84 24.37 23.58 22.66
Estonia 28.39 38.64 29.97 18.72 19.74 26.77 28.18 26.99
Hungary 27.10 22.43 23.54 18.02 18.68 19.51 17.43 16.73
Latvia 23.14 39.96 31.22 20.51 19.85 24.88 25.90 25.68
Lithuania 18.49 31.23 27.05 11.43 17.76 20.48 17.10 18.12
Poland 24.85 24.45 23.90 20.35 20.99 22.06 20.66 20.15
Romania 19.37 30.98 31.26 25.37 25.57 26.93 27.03 26.06
Slovak Rep. 25.98 27.82 27.69 19.55 22.56 23.93 20.77 18.03
Slovenia 27.42 32.02 31.79 22.07 20.64 20.14 17.50 16.18
Source: IMF WEO Database (2013), http://www.imf.org/external/pubs/ft/weo 3. The economic development of EU NMS after the cri sis Eurostat data shows that GDP growth in the old member states in the period from 2004 to 2008 averaged 2.2%, but on the other hand recorded a significant increase in the NMS, with 3.4% in the period 1999-2003 to 5.6% in the period 2004-2008, after the accession [4]. This growth was influenced by higher trade openness, increasing inflow of foreign direct investment up to 2008, and institutional adjustments during the EU accession process. The highest average growth rate of real GDP in the period after accession to the EU, from 2005-2008, was recorded in Lithuania (7.08%), Slovakia (7.81%) and Latvia (6.90%), followed by poorer countries such as Romania (6.42%) and Bulgaria (6.38%). The lowest average real GDP growth rate in the analysed period experienced Croatia (4.09%) and Hungary with 2.22% (Figure 2).
Source: Authors’ calculations based on IMF WEO Database (2013)
Figure 2 Real GDP growth in the new EU member states, before and after joining the EU (average
per year, in percentage). In the period 2009-2013, after the global financial crisis, there was a shift in the majority of the new EU members; only three countries had a positive growth rate of GDP - Poland, Slovakia and Estonia. Poland was the only economy in Europe to avoid a recession during the global crisis, benefiting from a depreciated real exchange rate, large domestic market, relatively low exposure to international trade, low household and corporate sector debt

389 Proceedings of International Conference for Entrepreneurship, Innovation and Regional Development
ICEIRD 2014
leverage and simulative fiscal and monetary policy. As a result, in 2012 Poland’s GDP was almost 20 percent higher than at the beginning of the crisiss [5]. Figure 3 reveals that by 2013, Czech Republic and Slovenia were most convergent countries among analyzed NMS, with roughly 80% of GDP per capita recorded in EU-15. Meanwhile, Bulgaria (with 42%), Romania (38%) and Croatia (52%) recorded the slowest convergence vis-a-vis GDP-per capita in EU-15.
Source: own calculations based on IMF World Economic Outlook Database
Figure 3 GDP per capita in PPP in EU NMS, EU-15=100
4. Foreign direct investment flows in EU NMS Joining the EU has provided many new members greater access to foreign investment thanks to the single market and the inclusion of the EU acquis in practice. FDI can contribute to the effectiveness, transfer of innovative technologies and greater productivity in the receiving countries [6]. Although FDI plays an important role in the less developed member states as an incentive to create jobs and modernize their economies, these inflows were reduced after the crisis of 2008 and had strong effects on the slowing catching up process with the core countries of the EU.
Source: UNCTAD
Figure 4 FDI in EU NMS in 2012 (inflows in per cent of GDP) 2000-2007, 2008-2012
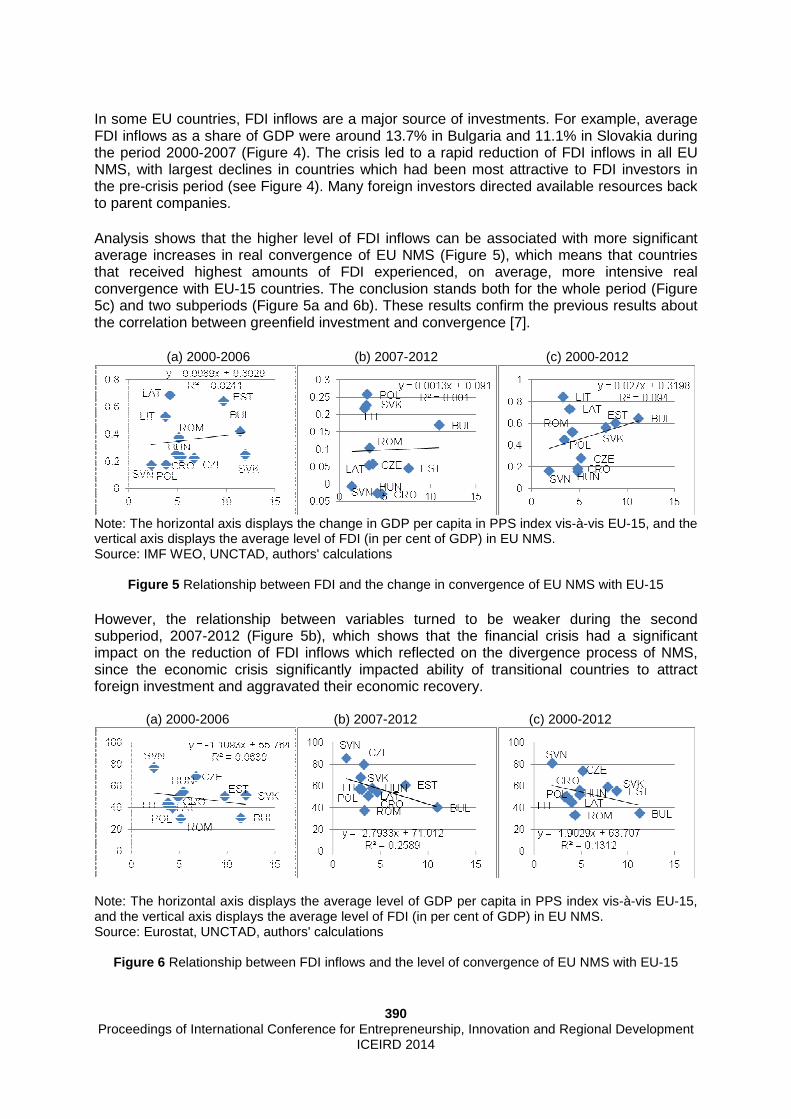
390 Proceedings of International Conference for Entrepreneurship, Innovation and Regional Development
ICEIRD 2014
In some EU countries, FDI inflows are a major source of investments. For example, average FDI inflows as a share of GDP were around 13.7% in Bulgaria and 11.1% in Slovakia during the period 2000-2007 (Figure 4). The crisis led to a rapid reduction of FDI inflows in all EU NMS, with largest declines in countries which had been most attractive to FDI investors in the pre-crisis period (see Figure 4). Many foreign investors directed available resources back to parent companies. Analysis shows that the higher level of FDI inflows can be associated with more significant average increases in real convergence of EU NMS (Figure 5), which means that countries that received highest amounts of FDI experienced, on average, more intensive real convergence with EU-15 countries. The conclusion stands both for the whole period (Figure 5c) and two subperiods (Figure 5a and 6b). These results confirm the previous results about the correlation between greenfield investment and convergence [7].
(a) 2000-2006 (b) 2007-2012 (c) 2000-2012
Note: The horizontal axis displays the change in GDP per capita in PPS index vis-à-vis EU-15, and the vertical axis displays the average level of FDI (in per cent of GDP) in EU NMS. Source: IMF WEO, UNCTAD, authors' calculations
Figure 5 Relationship between FDI and the change in convergence of EU NMS with EU-15 However, the relationship between variables turned to be weaker during the second subperiod, 2007-2012 (Figure 5b), which shows that the financial crisis had a significant impact on the reduction of FDI inflows which reflected on the divergence process of NMS, since the economic crisis significantly impacted ability of transitional countries to attract foreign investment and aggravated their economic recovery.
(a) 2000-2006 (b) 2007-2012 (c) 2000-2012
Note: The horizontal axis displays the average level of GDP per capita in PPS index vis-à-vis EU-15, and the vertical axis displays the average level of FDI (in per cent of GDP) in EU NMS. Source: Eurostat, UNCTAD, authors' calculations
Figure 6 Relationship between FDI inflows and the level of convergence of EU NMS with EU-15

391 Proceedings of International Conference for Entrepreneurship, Innovation and Regional Development
ICEIRD 2014
The next part of the analysis examines the relationship between the level of FDI inflows and the level of real economic convergence in CEE countries. Figure 6 reveals that the relationship has a negative sign, i.e. largest amounts of FDI inflows were, on average, attracted by least converged countries, while most converged countries, like Slovenia and Czech Republic, recorded considerably less FDI flows. This is in line with the neo-classical theory, which hypothesizes that capital will move from "north" to "south", i.e. from more developed to less developed countries, due to higher marginal product of capital in the "south". In Figure 6, it is evident that the relationship is relatively strong in all analysed periods for NMS countries, especially during the second subperiod. 5. The regional impact of the crisis The crisis brought to an end a long period during which regional disparities in GDP per capita and unemployment were shrinking. Between 2000 and 2008, regional disparities measured by coefficient of variation of GDP per capita dropped every single year from 115% to 80% (see Figure 7). In 2009, those reductions in disparities came to a halt and grew in 2010 and 2011 to 102.2%. Furthermore, unemployment in NMS behaved similarly in the pre-crisis period, after which unemployment disparities between NMS and EU-15 countries also slowly began to rise.
Source: IMF WEO Database, authors' calculations
Figure 7 Regional convergence and the crisis Enlargement has had a greater impact on disparities between regions than between countries themselves. Degree of achieving real and nominal convergence is undoubtedly the result of the quality of the pre-accession process and progress during the integration process. Eurostat data shows that the regions with the highest GDP per capita are found in southern Germany, in the south of the UK, Italy and Belgium, Luxembourg, the Netherlands, Austria, Ireland and Scandinavia. Regions around certain major cities, Madrid, Paris, Prague and Bratislava, also fall into this category [8]. Less developed regions are concentrated in the southern, south-western and south-eastern periphery of the Union, in Eastern Germany and the NMS, such as Croatia. There are also significant differences of GDP per capita within the EU regions that range from 28.6% of the

392 Proceedings of International Conference for Entrepreneurship, Innovation and Regional Development
ICEIRD 2014
EU-28 average (7,200 PPS) in the region Severozapaden in Bulgaria to 320.3% (80,400 PPS) in the region of Inner London in the United Kingdom [8]. Data on the most developed and least developed NUTS 2 regions in NMS show that the division between the most developed and least developed regions is relative (Figure 8). Specifically, the graph shows that the least developed region in Slovenia (Vzhodna Slovenia) and Czech Republic (Stredni Morava), bearing in mind the level of GDP per capita, is more developed than Latvia, Lithuania and Estonia. This result speaks of great disparities among EU NMS regions.
Source: Eurostat, authors' calculations
Note: Dark columns-the most developed NUTS 2 regions, White Columns-least developed NUTS 2 regions
Figure 8 GDP per capita by purchasing power (PPS), in the most developed and least developed
NUTS 2 regions in the new EU member states, in 2011 Figure 8 shows that some regions recorded above average level of GDP per capita relative to the average in the EU-28 (25,200 PPS): Bratislavsky kraj (46,600 PPS), Praha (42,900 PPS), Bucureşti-Ilfov (30,700 PPS), Közép-Magyarország (27,600 PPS) and Mazowiecke (26,700 PPS). On the other hand, some regions, although included in the category of the most advanced regions in the NMS, however, are still far behind compared to the average of the EU-28: Estonia (17,400 PPS), Lithuania (16,900 PPS), Kontinentalna Hrvatska (15,600 PPS) and Latvia (15,000 PPS), which is merely 60% of the EU-28 average. Despite all the efforts of the European Union to overcome regional disparities, EU enlargement with the NMS accounting for about 20% of the EU population, has resulted in growing socioeconomic differences on the level of countries and at the regional level of the Union [9]. 6. Conclusion In 2014, the Cohesion Policy programming period will start in the aftermath of the worst recession of the last fifty years. The crisis has reversed the process of convergence of regional GDP per capita and within the EU which will have implications for the increase of the unemployment in most NMS.

393 Proceedings of International Conference for Entrepreneurship, Innovation and Regional Development
ICEIRD 2014
The lack of inflow of foreign direct investments in NMS, which could be a major engine of growth in less developed countries, had an impact on the decreasing speed of their convergence with EU-15. The conclusion is obvious, cohesion policy is extremely important in economies with slower development and low accumulation of capital. Conversely, it is a valuable incentive for a dynamic economy because it directs resources to disadvantaged regions or activities in these regions. Our work has shown that the Cohesion Fund resources were not used properly in the period 2007-2013 but will gain in significance in less developed NMS in the next financial period until 2020. The reduction of regional disparities will be one of the key goals of the Cohesion Policy. The future cohesion programmes should put particular emphasis on growth-enhancing and job creating-investments in order to reduce regional disparities and unemployment rates. This is why the Commission is proposing to concentrate resources on a few, important areas such as employment (particularly for young people), training and education, social inclusion, innovation and SMEs, energy efficiency and a low carbon economy and is open to expand it to ICT infrastructures and digital growth measures. However, the problem of creating capacity for the withdrawal of funds from the Cohesion Fund remains highlighted, in particular in those NMS that so far have not significantly participated in the program for the promotion of competitiveness and employment. Governments of NMS with slower real GDP growth have a large task in fostering co-finance of those projects which are of the highest economic interest to a particular country and have a greater impact on growth, especially after the crisis in order to support competitiveness. The practice has shown that EU funds are sometimes directed at investments into non-profit projects. These types of projects are certainly needed, but only after the conditions for growth of the economy as a whole have been created.
References
(1) Jovančević, R (2005), Ekonomski učinci globalizacije i EU, Mekron promet d.o.o., Zagreb.
(2) European Commission (2011), Investing in European's future. Fifth Report on economic , social and territorial cohesion, (22 December 2011).
(3) European Commission (2013) Council Regulation COM 347. (4) European Commission (2009) Five years of Enlarged EU-Economic Achievements
and Challenges. European economy, economic and financial affair. (5) Piatkowski M. (2013) Poland’s New Golden Age Shifting from Europe’s Periphery to
Its Center. Policy Research Working Paper 6639, World Bank. (6) European Commission 2013, Report from the Commission, Urban and Regional
Dimension of the Crisis, June 2013. (7) Jovančević, R.; Globan, T. (2013) The Impact of FDI Flows on Economic
Convergence in Central and Eastern Europe. Economic Integrations, competition and cooperation - Accession of the Western Balkan Countries to the European Union Conference Proceedings. Kandžija, V.; Kumar, A. (eds.). Rijeka : University of Rijeka, Faculty of Economics, pp. 79-93
(8) Eurostat (2013) http://epp.eurostat.ec.europa.eu/portal/page/portal/eurostat/home (9) Jovančević, R. (2012) Izazovi kohezijske politike Europske unije, 2014-2020.
Razvojna strategija malog nacionalnog gospodarstva u globaliziranom svijetu, Družić, G.; Družić, I. (eds.). Zagreb: Croatian Academy of Science and Art, pp. 179-207.

394 Proceedings of International Conference for Entrepreneurship, Innovation and Regional Development
ICEIRD 2014
ICEIRD2014: Family-friendliness and regional competitiveness. Family-friendliness: Best practice Sviatlana Prakapiuk1, Prof. Dr. Christopher Stehr2, Prof. Dr. Martina Eckardt 3
1 German Graduate School of Management and Law, Bildungscampus 2, Heilbronn, Germany, [email protected] 2 German Graduate School of Management and Law, Bildungscampus 2, Heilbronn, Germany, [email protected] 3Andrassy University Budapest, Pollack Mihály tér 3, Budapest, Hungary, [email protected] This paper deals with increasing the attractiveness of a region, in terms of labour market, by improving their family-friendline ss approach. The aim of this paper is to analysis definitions of “family”, “fami ly-friendliness” in terms of regional competitiveness. The method of the theoret ical foundation is used to develop a list of relevant indicators during this a nalyse. These indicators might improve family-friendliness in the region and make the region more attractive for high skilled migrants and successful enterprise s not only in terms of work but in terms of living conditions as well. Key words Family, Family-Friendliness, Globalization, Indicators, Regional Competitiveness. 1. Research problem In today´s modern globalized world, demographic change is an inevitable phenomenon. Ever increasing trends of free movement of people, services and capital, and innovative communication systems affect the world population one way or another. A reason is found in the definition of the term "globalization“: „Globalization refers to those processes that are at work worldwide, cut national boundaries, communities and organizations in new space-time connections integrate in and Establishing a relationship and the world real as in the experience stronger connect" [1]. By using different sources of information people get more knowledge about a huge variety of professional, cultural, political, social and academic opportunities around the world [2].This motivates people to get more experience in new fields [3]. As a result, this tendency might have a significant impact on the regional and international job market. Looking for decent living conditions with promising jobs, people move and change their original place of residence for economically stable and successful regions, cities and countries [2].By decision-making such “soft” factors as family-friendliness shouldn´t be overlooked. Improving family-friendliness may prove essential not only in attracting but also retaining high skilled migrants and their families and the establishment of innovative enterprises as well into a specific region.

395 Proceedings of International Conference for Entrepreneurship, Innovation and Regional Development
ICEIRD 2014
The central focus of this paper deals with increasing the attractiveness of a region, in terms of labor market, by improving their family-friendliness approach. This paper will focus in a case study carried out in the region of Heilbronn-Franken, Germany. The research questions are formulated as follows: • How could be the “family-friendliness” evaluated in a region using the case study of the
Region Heilbronn-Franken? Which indicators are important by this evaluation? Looking at the analysis of terms “regional competitiveness”, “family”, “family-friendliness” and collecting data of the most important indicators for family-friendliness the answer on this question will be presented in this paper. This current work in progress paper is designed as follows: First, the theoretical foundation of regional competitiveness, family, family-friendliness and a short overview of studies in this research field as well. Subsequently, the methodology will be explained and the first insights on data analysis will be provided. Afterwards, we will provide the findings and conclusions.
2. Theoretical background
2.1 Regional Competitiveness
The meaning of regional competitiveness will be presented in the very beginning of this paper with the reason to show the connection of “regional competitiveness” and “family-friendliness” in the region. Even though nowadays there is no standardized definition of such a term we will try to find the links between these two terms. In order to define “regional competitiveness”, Snieška and Bruneckienė deal with two separate terms – “region” and “competitiveness”. In terms of “region”, they define it as part of a lager economic social space, which differs from other surrounding territories in economic, social, demographic, cultural, natural, and infrastructure systems connected by material and informational relations [4]. As for “competitiveness” it is a very difficult term to define, because of complexity of the concept, plenty and variety of factors of competitiveness process. In their research they concentrate on regional competitiveness. They define this term as “an ability to use factors of competitiveness in order to make a competitive position and maintain it” [4].Besides Meyer-Stamer deals with the term “competitiveness”. According to him there are three different approaches to define it: a macroeconomic, mesoeconomic or microeconoic [5]. This paper concentrates on the mesoeconomic definition according to which the “regional competitiveness” is “the ability of a locality or region to generate high and rising incomes and improve the livelihoods of the people living there” [5].There are many indicators and factors which impact the level of regional competitiveness [6].We can find them in models of regional competiveness such as the “Diamond Model” of Porter (1998), the “Double Diamond” model of Rugman (2002), or the “Regional competitiveness hat” model of Martin (2011), among others [6].Regarding these models, the “family-friendliness” factor as part of the whole complex of competitive advantages of the region will be assumed in this paper with a reason to develop a list of relevant indicators, which might improve family-friendliness in the region.

396 Proceedings of International Conference for Entrepreneurship, Innovation and Regional Development
ICEIRD 2014
2.2 Family
The central element of family-friendliness is family. It is not easy to define this term. To understand better the meaning and the complexity of “family” several approaches (sociological, legal, biological-genealogical, statistical, psychological, etc.) should be taken into account here: • Sociological: Family is a network of people that live together in one or more family ties
across generations in interconnected households [7]; • Legal: Family is small entity of modern style, where parents and children live together
[8]; • Biological/genealogical: Family is a consanguinity [9]; • Statistical: Families are communities living and doing their business together. It could be
people living together and individuals as well [9]; • Psychologic: Families are intimate relationship systems which are characterized by
definition (two or more people share their lives in mutual relatedness), privacy (the intimate relationship allows people to have a narrow habitat, durability (longer time perspective of relationships, reciprocal obligations) and proximity (physical , mental and emotional intimacy are permitted in these relationships) [10].
Considering all these definitions and using an extra definition from the German „Siebten Familienbericht“ [11] we found out an operational definition for the analysis. Families are biologically, socially or legally interconnected individuals; at least they include two generations and pursue specific purposes. Families qualify as producers of socially relevant goods (such as the decision to have children, upbringing and education) and as producers of private goods, which are aimed at the satisfaction of individual and relationship-specific needs (such as security and intimacy). As units comprising several people and several generations, families exist in the temporal sequence of two generations of couple and children and, where appropriate, sibling constellations, which consist of biological, adoptive, foster or step-parents (parental generation) having biological, adoptive, foster or stepchildren (filial generation) [10]. Supplementary we have to mention the fact, that during the years a lot of new family-types have been developed [9]. Those of them, who are doing their own performances on the labour market, will be a part of this research. 2.3 Family-friendliness
Family-friendliness is as broad term as family and is presented in many scientific fields. From the table 1 giving an overview of family definitions it can be seen, how different is the term “family-friendliness” as well as the different could be its definitions. As it is seen there are many factors and indicators that need to be taken into account in order to define family-friendliness for the regional context.
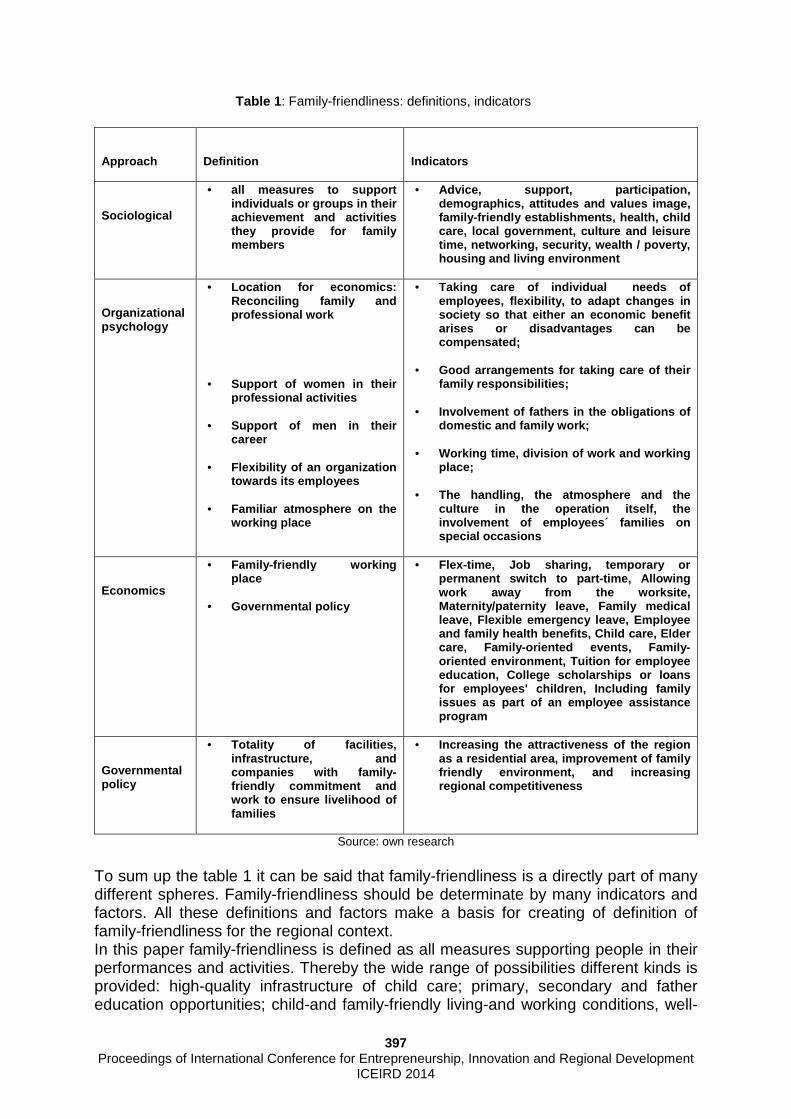
397 Proceedings of International Conference for Entrepreneurship, Innovation and Regional Development
ICEIRD 2014
Table 1 : Family-friendliness: definitions, indicators
Approach Definition Indicators
Sociological
• all measures to support individuals or groups in their achievement and activities they provide for family members
• Advice, support, participation, demographics, attitudes and values image, family-friendly establishments, health, child care, local government, culture and leisure time, networking, security, wealth / poverty, housing and living environment
Organizational psychology
• Location for economics: Reconciling family and professional work
• Support of women in their professional activities
• Support of men in their career
• Flexibility of an organization towards its employees
• Familiar atmosphere on the working place
• Taking care of individual needs of employees, flexibility, to adapt changes in society so that either an economic benefit arises or disadvantages can be compensated;
• Good arrangements for taking care of their family responsibilities;
• Involvement of fathers in the obligations of domestic and family work;
• Working time, division of work and working place;
• The handling, the atmosphere and the culture in the operation itself, the involvement of employees´ families on special occasions
Economics
• Family-friendly working place
• Governmental policy
• Flex-time, Job sharing, temporary or permanent switch to part-time, Allowing work away from the worksite, Maternity/paternity leave, Family medical leave, Flexible emergency leave, Employee and family health benefits, Child care, Elder care, Family-oriented events, Family-oriented environment, Tuition for employee education, College scholarships or loans for employees' children, Including family issues as part of an employee assistance program
Governmental policy
• Totality of facilities, infrastructure, and companies with family-friendly commitment and work to ensure livelihood of families
• Increasing the attractiveness of the region as a residential area, improvement of family friendly environment, and increasing regional competitiveness
Source: own research To sum up the table 1 it can be said that family-friendliness is a directly part of many different spheres. Family-friendliness should be determinate by many indicators and factors. All these definitions and factors make a basis for creating of definition of family-friendliness for the regional context. In this paper family-friendliness is defined as all measures supporting people in their performances and activities. Thereby the wide range of possibilities different kinds is provided: high-quality infrastructure of child care; primary, secondary and father education opportunities; child-and family-friendly living-and working conditions, well-

398 Proceedings of International Conference for Entrepreneurship, Innovation and Regional Development
ICEIRD 2014
organized leisure time, cultural and religion possibilities, family support and the reconciliation of family and working life as well. The enforcement of measures should support long-term sustainable protection of social structures. All this will contribute to regional development. 2.4 Overview of studies In this part different studies in the research field of “family-friendliness” will be presented. Firstly, it should be mentioned, that the family-friendliness is a wide research field gaining in importance in many European countries in the last few years [12]. In the literature we can find studies which deal with family-friendliness in enterprises, municipalities, regions, with comparative approach on European level as well. For this paper I chose the studies where you can find indicators which could impact the decision of families living or coming to the region to stay and to work there or to leave.
Table 2 : Studies, methodology
Study Research field
Time Aim Methology
Family-friendliness in the administrative district Elbe-Ester, Germany
municipal 2011 To create structures and services, for families with difficult constellation and to keep the district attractive for families life.
Survey with citizens of district; expert interviews with decision-makers
Familiy-friendliness in “Familienatlas” in Germany
regional 2007, 2012 To develop the catalogue of indicators, which are important for mobile families by assessment of attractiveness region and decision to come there. .
Assessment of the region according to indicators which are divided into 4 groups:
• the reconciliation of family and working life;
• Living situation; • Education; • Offers and
organization of family policy;
and supplemented by framework conditions in the region as situation on the labour market and demography.

399 Proceedings of International Conference for Entrepreneurship, Innovation and Regional Development
ICEIRD 2014
According this schema 402 districts and regions in Germany were evaluated.
Family-friendliness and indicators for its measurement
universal 2007 To implement family-friendliness in German speaking regions; to find out the indicators for measurement of family-friendliness
Survey according to 15 main indicators and several test criteria
Family-friendliness index
International comparison
2011 To find out, how could Germany the desired effects in terms of family-friendliness
Comparison of data of different countries with the family-friendliness index using the statistic data from each country.
Source: own research
As you can see there are different aims and methodology types for evaluation family-friendliness on different research levels. In following chapter I will present you the methodology I have chosen for my research project. 3. Methodology As methodology we chose descriptive statistics to present our first findings. Subsequently, for answering the research question we will use qualitative and quantitative methods. As the research objective is about examining a phenomenon within its complex real-life context and obtains in-depth understanding, a case design is the most appropriate approach considering the guidelines on qualitative data collection and analysis outlined by Yin [13]. As a case-study I will present the level of development of family-friendliness in the region Heilbronn-Franken, Germany. The region Heilbronn Franken in Germany is economically well developed industrial region, which has a lot of to offer in sense of job, services, culture. In the exploratory research I will use a combination of qualitative and quantitative methodology. Several interviews with decision-makers of the region Heilbronn-Franken, Germany and a survey of local citizens will be carried out in order to locate the most important indicators for family-friendliness in region and to get information of their satisfaction with the family-friendliness supply in the region. 4. Findings In this paper we analysed “regional competitiveness”, “family”, “family-friendliness” and found out a links between this terms. Using the findings from previous studies we

400 Proceedings of International Conference for Entrepreneurship, Innovation and Regional Development
ICEIRD 2014
presented a list of indicators, which importance for family-friendliness in the region will be tested in the survey we developed for this reason. All indicators are divided into nine groups: Group 1: Reconciliation of family and working life; Group 2: Family-friendly companies in the region; Group 3: Living situation; Group 4: Education; Group 5: Leisure time; Group 6: Infrastructure; Group 7: Culture and religion; Group 8: Enterprises, Institutions, Organisation; Group 9: Safety. Each group will be clarified with a curtain number of test factors for family-friendliness. Besides we will supplement the whole picture of indicators with the framework conditions in each region such as demography and labour market. 5. Contribution This paper in progress contributes to current status quo of the research in this field in several ways. From the literature review we can see that family-friendliness is an important issue. This research will close the gap of linking family-friendliness and attractiveness for staying, living and working in the region for people, who are active on the labour market. This project may therefore advance the field in terms of creating a catalogue of measures which allows to evaluate the family-friendliness level in a region and to take measures for its improvement. Using a case study the findings of this project contribute to the theoretical research by providing empirical data of satisfaction of different types of families with family-friendliness supply in the region. The findings of this project will provide insight for practitioners in order to improve the family-friendliness in the region using a measures catalogue. 6. Conclusions Regarding the definition of family and the indicators showed in table 1, it is noticeable how important sociological, organizational-psychological, economical and governmental factors are for the assessment of family friendliness in a region. Their improvement could contribute to enhance family-friendliness in the region and to encourage the competitiveness of a region in order to attract high skilled migrants and successful enterprises in terms of work and living conditions. References 1. Hall, S. (1999): Kulturelle Identität und Globalisierung, in: Hörning, Karl H.; Winter, Rainer
(Hg.): Widerspenstige Kulturen. Cultural Studies als Herausforderung, Frankfurt/Main
2. Breuer, M. (2006): Globalisierung bewegt Menschen:Migration in heutiger Zeit.

401 Proceedings of International Conference for Entrepreneurship, Innovation and Regional Development
ICEIRD 2014
Available from : www.fes-online-akademie.de (10.12.2013) 3. Beck-Gernsheim, E. (2006): Transnationale Heiratsmuster und transnationale
Heiratstrategien. Ein Erklärungsansatz zur Partnerwahl von Migranten, in: Soziale Welt 57 (2), 111–129, Baden-Baden
4. Bruneckienė, J.; Snieška,V. (2009): Measurement of Lithuanian Regions by Regional Competitiveness Index. Kauno technologijos universitetas. Kaunas
5. Meyer-Stamer, J. (2008): Systematic Competitiveness and Local Economic Development, Duisburg Available from http://www.meyer-stamer.de/2008/Systemic+LED_SouthAfrica.pdf (12.09.2013)
6. Drozdz, J., Volkov, A. (2012): Regional Economic Systems: competitiveness and innovative development, Lithuanian Institute of Agrarian Economics, Vilnus Available from http://leidykla.vgtu.lt/conferences/BM_2012/international_economy/351_358_Drozdz.pdf (01.02.2014)
7. Hellmann, M., Borchers, A. (2002): Familien- und Kinderfreundlichkeit. Prüfverfahren-Beteiligung-Verwaltungshandeln: ein Praxisbuch für Kommunen, Stuttgart.
8. Rüfner, W. (1989): Familie heute und alternative Lebensformen. In: Wingen, Hrsg: Familie im Wandel - Situation, Betreuung, Schlußfolgerungen, S. 58–91, München Online verfügbar unter: http://www.br-online.de/jugend/izi/text/petzold.pdf (12.12.2013)
9. Petzold, M. (2001): Sieben Typen Familienzusammenlebens. Available from https://www.familienhandbuch.de/familienforschung/demografie-und-strukturen/familien-heute (20.01.2014)
10. Schneewind, K. A. (2008):Familienpsychologie. Familienpsychologie, Stuttgart Available from http://www.oif.ac.at/fileadmin/OEIF/Working_Paper/wp_58_familienfreundlichkeit.pdf. (21.01.2014)
11. Siebter Familienbericht. Bundesministerium für Familie, Senioren, Frauen und Jugend (2006): Familie zwischen Flexibilität und Verlässlichkeit. Perspektiven für eine lebenslaufbezogene Familienpolitik., Berlin. Available from http://www.bmfsfj.de/doku/Publikationen/familienbericht/download/familienbericht_gesamt.pdf (02.12.2013)
12. Bundesministerium für Familie, Senioren, Frauen und Jugend (2010): Europäische Unternehmensmonitor Familienfreundlichkeit, Bundesministerium für Familie, Senioren, Frauen und Jugend, Berlin Available from http://www.bmfsfj.de/RedaktionBMFSFJ/Broschuerenstelle/Pdf-Anlagen/Europ_C3_A4ischer-Unternehmensmonitor-Familienfreundlichkeit-deutsch,property=pdf,bereich=bmfsfj,sprache=de,rwb=true.pdf (15.01.2014)
13. Yin, R.K. (2009): Case study research: Design and methods, Thousand Oaks, sage Publication Inc.


403
INNOVATIVE SUPPLY CHAINS, NETWORK COLLABORATION AND JOINT VENTURES


405 Proceedings of International Conference for Entrepreneurship, Innovation and Regional Development
ICEIRD 2014
ICEIRD2014: Innovative Supply Chains
Reverse Supply Chain for Remanufacturing with Uncertain Demand and Return Product Yield
Samar K. Mukhopadhyay1 1Sungkyunkwan University-GSB, 53 Myungryun-dong 3-ga, Seoul, 110-745, Korea
In this paper, we consider a supply chain with one OEM (original equipment manufacturers) and one retailer. The OEM can proces s both used and new parts for the production of new products. The yield of the us ed parts procured for remanufacturing is random. The OEM makes procuremen t and production decisions and the retailer makes ordering decisions based on their own cost/incentive structures. We study the role of uncertainties in t he quality of returns (called the “yield rate”) and the uncertain market demand on these dec isions. The two parties in the supply chain use either a push contract - where the retailer makes the inventory decision and the manufacturer makes the production decision, i.e. all inventory risk is pushed onto the retailer or a pull contract where t he manufacturer decides how much inventory to stock at the retailer and owns that in ventory. We consider both short and long manufacturing lead times. We present optimal s olutions for four different scenarios in addition to a base case scenario. We d evelop a model to obtain their optimal policies for these different scenarios depe nding on the contract type and the information the OEM has about the random yield rate . We compare the results of different scenarios and develop managerial insights . We also evaluate the supply chain performance. We fill an important gap in lite rature by examining the role of alternative supply chain contracts, namely push and pull contracts, in the uncertain yield problem in remanufacturing. Most studies in r emanufacturing assume that the lead times for remanufacturing and regular manufact uring to be equal. We, thus, design an innovative supply chain.
Keywords Supply chain management; Remanufacturing; Random yield; Supply chain contract; Game theory
1. Introduction
With increased environmental concerns and stringent environmental laws, remanufacturing is lately receiving growing attention. As can be expected, remanufacturing conserves energy, materials, and equipment. It also has the potential to reduce the OEMs’ production costs significantly in many industries. In the remanufacturing process, used products may come from various sources like customer returns and cancelled orders, products damaged during shipping, overstocks, and lease returns etc. It is logical to assume, therefore, that the quality of these returned items may vary greatly from minor flaws to significant damages. Returned products have to be inspected before they are put into the production system in order to find
406 Proceedings of International Conference for Entrepreneurship, Innovation and Regional Development
ICEIRD 2014
their conditions. Given the amount of used items procured and their conditions, the quantity of remanufacturable parts which can finally be used for production is uncertain. Traditional supply chain management has studied the problem of matching demand and supply extensively, particularly from an inventory management standpoint. However, in a closed-loop supply chain with remanufacturing as an alternative, it is not straightforward to understand how the uncertain quality of the returned items would affect the supply chain parties’ policies regarding procurement, production, ordering and so on. In this paper, we consider a decentralized supply chain comprising one OEM and one retailer. Our objective is to understand how the uncertainties in the quality of returns and the uncertain market demand would influence the optimal policies (procurement, production, and ordering) and the supply chain’s performance. The OEM manages a hybrid manufacturing-remanufacturing system. It can procure a quantity of used products and then remanufacture them. In addition, the OEM can also order new parts from external suppliers to serve as the input of the production. The fraction of remanufacturable parts recovered from the pool of used products, called the “yield rate”, is random. Moreover, lead times for manufacturing and remanufacturing operations are unequal. This paper differs from earlier studies of random yields which only model a single manufacturing system where the coordination between manufacturing and remanufacturing in terms of the procurement and lead times is not necessary. The retailer satisfies a stochastic market demand with his inventory. We consider two alternative wholesale price contracts. One is the push contract, where the retailer is fully responsible for the inventory decision whereas the OEM is fully responsible for the production decision, i.e. all inventory risk is pushed onto the retailer [1]. The other is the pull contract. One scenario represented by a pull contract is the so-called Vendor-Managed-Inventory (VMI) system. In our paper, we first study an integrated supply chain, in which the OEM and the retailer operate as a single firm. This is a case which would provide the first-best solution. For the decentralized case, depending on which contract is adopted by the firms and the lead times for manufacturing/remanufacturing, we classify four scenarios as (i) push contract with short manufacturing lead time, (ii) push contract with long manufacturing lead time, (iii) pull contract with short manufacturing lead time, and (iv) pull contract with long manufacturing lead time.
2. Literature Review
Our study is particularly related to the literature on the random yield problem in the production industry. Uncertain quality level for inputs that are product returns was studied in [2]. A model for component reuse in product design was introduced in [3]. In another study, [4] obtains optimum production quantity by solving a single-period, multi-product, downward substitution model with random yields and demand. [5] studies the random yield problem in a changing environment with a single period, multiple periods, and infinite periods. Random yield problem in remanufacturing has received interest in the literature relatively recently. [6] observes that the uncertainty in returns and demand can be a considerable obstacle to following a consequently environmental-benign recovery strategy within a reverse logistics system. [7] analyzes the effects of yield variation on the profitability of remanufacturing, benefits of delaying pricing decisions until after yield realization, and value of perfect yield rate information. [8] investigates how the profitability of reuse activities is affected by uncertainty regarding the quality of returned products. Another stream of literature relevant to our study is supply chain management with product remanufacturing. [9] addresses the problem of choosing the appropriate reverse channel structure for the collection of used products from customers. Uncertain quality of recovered

407 Proceedings of International Conference for Entrepreneurship, Innovation and Regional Development
ICEIRD 2014
parts is studied in [10] and [11]. [12] focuses on the interaction between a manufacturer’s reverse channel choice to collect postconsumer goods and the strategic product pricing decisions in the forward channel when retailing is competitive. A hybrid system like ours is studied in [13] in a dynamic setting using control theory and simulation and find that the remanufacturing process improves the system dynamics performance. [14] develops an integrated production inventory model with short life cycles and find that the critical decision making factors include new technology evolution, remanufacturing ratio and holding costs. However, the random yield problem in a decentralized supply chain with product remanufacturing has not been studied. Our paper extends the earlier literature in remanufacturing in the following respects. First, we address the yield randomness in remanufacturing in a two-level supply chain setting. Secondly, we incorporate unequal lead times for manufacturing and remanufacturing operations in our model formulation. Lastly, we examine two most commonly adopted contract types (push and pull contracts) and their effect on various optimal polices such as procurement, production, and ordering.
3. Model Structure
The basis of our framework is a model of a two-level supply chain with one OEM and one retailer. The OEM produces new products in its hybrid manufacturing/remanufacturing system which uses new parts and/or used parts as inputs. For the sake of simplicity, we assume that the new product is composed of a single part and the new products made from new parts and used parts are perfect substitutes in the market. We use γ , called the yield rate, to denote the fraction of used products that contains
remanufacturable parts.γ is a random variable with a probability distribution function )(γg .
We use a stochastically proportional yield, i.e. the procurement quantity of used products,Q,
is independent of the yield distribution )(γg . The OEM has to decide the following: (i) The quantity of used products to be procured from the market, (ii) the procurement quantity of new parts from its suppliers, and (iii) the production quantity of new products (production lot size). The retailer decides how many units to order from the OEM to satisfy a demand, denoted by x, at a retail price p . The demand x is uncertain with a probability distribution function )(xf . The wholesale price charged by the OEM is w which is assumed to be exogenous. We will use the following parameters and notations: Q: quantity of used products the OEM decides to procure.
γ : yield rate (a random variable) denoting the fraction of used parts recovered from the used products that are remanufacturable.
)(γg : probability density function (pdf) of the random yield rate.
rc and nc : acquisition cost per unit for used and new products, respectively.
nq : procurement quantity of new parts (order size).
0q : total quantity of parts processed for production (production lot size).
q : the retailer’s order quantity.
w : OEM’s wholesale price per unit p : retail price

408 Proceedings of International Conference for Entrepreneurship, Innovation and Regional Development
ICEIRD 2014
x : market demand for the products (a random variable).
)(xf : probability density function (pdf) of the random market demand.
We use superscripts M for OEM, R for retailer, and I for the integrated supply chain
4. The Model
In this section, we first present the integrated supply chain model, and then study the decentralized supply chain model. As mentioned earlier, this would give rise to four models, with two types of contracts (push and pull), and two lengths of manufacturing lead time (short and long). The Integrated Supply Chain acts as a benchmark case and will give us a first-best solution that will highlight the efficiency of supply chains which are either integrated or where strategic alliance has been formed to make centralized decisions for the benefit of the supply chain as a whole. We solve each model and obtain the optimal policies regarding procurement, production, and ordering decisions. We then compare these policies.
4.1. Model 1 - Integrated Supply Chain Model
The integrated supply chain maximizes the sum of the OEM’s profit and the retailer’s profit. The supply chain’s decisions are procurement and production quantities which can be obtained in a two-stage decision making process. Stage 1 decision variable: the procurement quantity of used productsQ.
Stage 2 decision variable: the production quantity 0q .
The expected profit for the whole supply chain in the second stage is given by:
∫∫∞+ ++−−−=0
0
0
)()()(),( 000022 q
q
pnI
q
dxxfpqdxxpxfcqQqcQEMax γγπ (1)
The first term is the cost of acquiring new parts. The second term is the total cost of manufacturing. The last two terms are the expected revenue when demand x is less than and more than the production quantity respectively. Lemma 1: For any realized yield Qγ from the first stage, the expected profit of the second
stage ),( 2 γπ QE IX is concave in 0q , the production quantity.
Proposition 1: For any realized yield Qγ from the first stage, the optimal production lot size is given as follows:
≥≤≤
≤=∗
00
00
00
0
;
;
;
qQforq
qQqforQ
qQforq
q
γγγ
γ
Where
−−= −
p
ccpFq pn
X1
0 and
−= −
p
cpFq p
X1
0
In the first stage, the supply chain’s problem is to maximize the expected profit with the expectation being taken over the random yield rate.
][)]([ 211I
rII
QEQcQEMax πππ Γ+−== (2)
s.t. 0≥Q
We now present the four cases mentioned earlier.

409 Proceedings of International Conference for Entrepreneurship, Innovation and Regional Development
ICEIRD 2014
4.2. Model 2 - Push Contract with Short Manufacturing Lead Time
With a push contract, the retailer orders q products from the OEM, pays w per unit and bears all of the supply chain’s inventory risk. Since the manufacturing lead time is short, the OEM can place an order for new parts with external suppliers after knowing the actual yield of the used parts. In this model, the OEM’s production quantity equals the retailer’s order, qq =0
. So the OEM’s
problem is a random yield problem with known demand from the retailer, and the retailer faces a standard newsvendor problem with the order quantity q as her decision. The OEM’s expected profit is
∫∫ +−−+−−=1
/
/
0)()()]([
nprM dwqgdgQqcwqqcQc γγγγγπ
(3)
Lemma 2: (i) The OEM’s expected profit is concave in Q . The optimal ∗Q
satisfies:nr
Qqccdg /)(
/
0=∫ γγγ ;
(ii) kqqQ =∗ )( , where k is a constant and is determined by rc , nc , and )(γg ;
(iii) k is increasing in nc and decreasing in rc .
The retailer’s expected profit is given by: ∫∫
∞++−=
q
qR dxxpqfdxxpxfwq )()(0
π (4)
Proposition 2: (i) The retailer’s expected profit is concave in q , the order quantity. (ii) The
optimal retailer quantity is given by:
−== −∗∗
p
wpFqq X
10
.
Note that the OEM’s optimal production quantity is also equal to ∗q , the optimal order
quantity. The total expected profit of the supply chain is RM πππ += .
4.3. Model 3 - Pull Contract with Short Manufacturing Lead Time
Instead of a push contract, the OEM and the retailer can adopt a pull contract, which also has a single wholesale price w . However, with a pull contract, the OEM makes the production and inventory decisions for the supply chain and owns the products until they are sold. The retailer pulls inventory from the OEM and leaves the OEM with all inventory risk, i.e. the retailer buys from the OEM, who is like a newsvendor that faces the stochastic demand. The OEM’s problem can also be analyzed using a two-stage decision-making process. Stage 1 decision variables: the procurement quantities of new and used parts Q
and nq ( nq can be determined after observing the actual yield rate).
Stage 2 decision variables: the production quantity 0q .
For the OEM, given the realized yield Qγ of used parts, the second-stage problem maximizes the expected profit from the sale of products under demand uncertainty. ∫∫
∞+ ++−−−=0
0
0
)()()(),( 00002 q
q
pnM
Xq
dxxfwqdxxwxfcqQqcQEMax γγπ
(5)

410 Proceedings of International Conference for Entrepreneurship, Innovation and Regional Development
ICEIRD 2014
Lemma 3: For any realized yield Qγ from the first stage, the expected profit of the second
stage ),( 2 γπ QE MX
is concave in 0q , the production quantity.
Proposition 3: For any realized yield Qγ from the first stage, the optimal production quantity is given as follows:
≥≤≤
≤=∗
00
00
00
0
;
;
;
qQforq
qQqforQ
qQforq
q
γγγ
γ
Where
−−= −
w
ccwFq pn
X1
0
and
−= −
w
cwFq p
X1
0
The retailer’s profit with pull contract is different from that with push contract. With pull contract the OEM may stock inventory at the retailer with consignment, in which case the retailer bears no inventory risk. Therefore for each new product sold in the market, the retailer receives a fixed profit margin wp − . The retailer’s expected profit can be written as:
+−= ∫∫
∞
0
0
)()()( 00 q
qR dxxfqdxxxfwpπ (7)
The retailer’s profit Rπ is concave in the OEM’s production quantity 0q .
The total expected profit of the supply chain of pull contract with short manufacturing lead time is RM πππ += .
4.4. Model 4 - Push Contract with Long Manufacturing Lead Time
In this situation, the relatively long manufacturing lead time does not allow the OEM to meet potential shortages in used parts with last-minute orders of new parts from external suppliers. Thus, the quantity of new parts to be procured from suppliers must be decided at the beginning of the production planning and before the realization of the yield rate. The OEM can process all of new and used parts procured or only what is needed to satisfy the demand which is the order placed by the retailer. Similarly, with a push contract, the retailer orders q products from the OEM and pays w per unit. The retailer now acts as a newsvendor because she bears all of the supply chain’s inventory risk. However, the OEM’s production quantity is not always equal to the retailer’s order since the OEM procures new parts without observing the realized yield rate. There could, therefore, be a mismatch between production and order size, giving rise to overage or underage cost. The OEM’s problem is to maximize the expected profit
∫∫ −
−−++−+−−=
1
/)(
/)(
0,)()()())((
Qqq p
Qqq
npnnrM
qQ n
n
n
dqgcwdgqQcwqcQcMax γγγγγπ
The first-order derivatives are
∫−
−−=∂
∂ Qqq
rp
Mn
cdgcwQ
/)(
0)()( γγγπ (8)
∫
−−−=
∂∂ Qqq
npn
Mn
cdgcwq
/)(
0)()( γγπ (9)
Using Equations (8) and (9), we can derive the optimal used part procurement quantity as a two-part function given in the next proposition.

411 Proceedings of International Conference for Entrepreneurship, Innovation and Regional Development
ICEIRD 2014
Proposition 4: In a push contract with long manufacturing lead time, the OEM’s optimal procurement quantities of new parts and used products Q and nq are given as follows:
>==
<==∗∗
∗∗
)()(,0
)()(0,)(
nn
nn
qZQZforqqQ
qZQZforqQZ
Where
1
)(
−=
Q
qQZ
qn
and
2
)(
−=
Q
qZ
qq n
n
are from equating Equation (8) and (9) to zero as the
FOC respectively. They are the critical yield rates that maximize the expected profit function. Due to the long manufacturing lead time, the OEM cannot determine the procurement quantity of new parts before the yield rate is realized. Therefore, once a nq is selected, the
remaining demand )( nqq − will have to be satisfied by remanufacturing used parts, an
uncertain source. Proposition 4 gives an interesting guideline. It shows that the OEM either uses only used parts and no new parts (in case the expected procurement cost for remanufacturing is lower than that for manufacturing), or it only uses new parts and no used parts otherwise. Next, we consider a situation where the OEM has some remanufacturable used parts already in stock, denoted by Q̂ which however is less than the optimal quantity ∗Q .
Lemma 4: Let )()( nqZQZ < . If ∗=<< Q
QZ
qZ
q
n )(ˆ
)(, then it is still not optimal to order new parts
from external suppliers. If ∗=<<< QQZ
q
qZ
n )()(ˆ0 , then the OEM’s optimal profit is achieved at
)](ˆ,ˆ[ nqZQqQ ⋅− where Q̂ is the amount of remanufacturable used parts in stock and )(ˆnqZQq ⋅−
is the amount of new parts from external suppliers. The above result has very interesting implications. It suggests that when the shortage of used parts is not sufficiently large, the OEM should not procure new parts from suppliers. Instead, the OEM should make up the shortage by procuring only used products. However, if the stock level of used parts is low enough, then procuring all new parts is optimal for the OEM.
4.5. Model 5 - Pull Contract with Long Manufacturing Lead Time
This scenario is similar to that in 4.3 except that the OEM has to procure new parts before obtaining actual yield rate information. We employ a two-stage decision process to analyze the problem. The OEM’s problem can be summarized as follows: Stage 1 decision variables: the procurement quantities of new parts and used productsQ
and nq ( nq must be determined before observing the actual yield rate).
Stage 2 decision variables: the production quantity 0q .
Given the realized yield Qγ of used parts and the new parts nq , the OEM maximizes the
expected profit from the sale of products under demand uncertainty in the second stage.
∫∫∞
++−=0
0
0
)()(),,( 0004 q
q
pnM
Xq
dxxfwqdxxwxfqcqQEMax γπ
s.t. nqQq +≤ γ0

412 Proceedings of International Conference for Entrepreneurship, Innovation and Regional Development
ICEIRD 2014
Proposition 5: For any realized yield Qγ and procurement quantity of new parts from the first stage, the optimal production quantity is given as follows:
≥+≤++
=∗
00
00 ,
,
qqQforq
qqQforqQq
n
nn
γγγ
Where
−= −
w
cwFq p
X1
0
Stage 1 maximizes the expected profit )],([ 1 nM qQE πΓ from procuring Q and nq units of used
products and new parts simultaneously, which is equal to the expected profit of the second stage over yield uncertainty, ),,( 2 n
M qQE γπ , less the total acquisition costs of used products
and new parts, nnr qcQc + . Thus the Stage 1 problem is:
][)],([ 21,
Mnnrn
M
qQEqcQcqQEMax
n
ππ ΓΓ +−−=
s.t. 0,0 ≥≥ nqQ
Similarly for each new product sold in the market, the OEM transfers a fixed profit margin wp − to the retailer. Therefore the retailer’s expected profit can be written as:
+−= ∫∫
∞
0
0
)()()( 00 q
qR dxxfqdxxxfwpπ
Rπ can also be shown as concave in 0q .
The total expected profit of the supply chain of pull contract with short manufacturing lead time is RM πππ += .
5. Model Comparison and Discussion
Based on the results obtained in section 4, we make some interesting observations on integrated and decentralized models. The numbers in parentheses in this section represent different models considered in Section 4.
Lemma 6: For any fixed pairs of Qand nq , the OEM’s optimal production quantities are
related as follows:
)2()1( 00∗∗ ≥ qq ;
)3()1( 00∗∗ ≥ qq ;
If
−−≥ −
w
ccwFq pn
Xn1 , then )3()5( 00
∗∗ ≥ qq .
The integrated model leads to a higher production quantity than either in Model 2 or in Model 3. This makes sense because with a push contract in Model 2, the OEM faces a fixed demand and can take advantage of it. In other words, the OEM can process more accurate quantity of parts for production than the integrated model where the firm faces a stochastic demand. With a pull contract in Model 3, even though the OEM bears the demand uncertainty like the firm does in the integrated model, it only generate a revenue w for each unit sold rather than p in the integrated model. Therefore the production quantity in Model 3 is smaller than that in the integrated model. Lemma 6 (iii) is counterintuitive. The OEM is subject to greater uncertainty in Model 5 compared to Model 3, since it lacks information on the yield before determining the procurement quantity of new parts. However, the OEM does not necessarily produce more new products in Model 5. Only if the condition in Lemma 6 is satisfied, then the production quantity in Model 5 outnumbers that of Model 3.

413 Proceedings of International Conference for Entrepreneurship, Innovation and Regional Development
ICEIRD 2014
Lemma 7: If )()( nqZQZ < , then )4()2( ∗∗ < QQ ; otherwise )4()2( ∗∗ > QQ .
Under the push contract with short manufacturing lead time, the OEM has the incentive to rely more on the source which is certain, (i.e., new parts because the decision about the procurement quantity of new parts is made after the yield is realized). This means the OEM procures less used products and more new parts in Model 2. With long manufacturing lead time (in Model 4), the OEM tends to procure more used products than Model 2 because it cannot place last-minute order for new parts if there is any significant shortage in used parts.
Lemma 8: )4()2( ∗∗ = qq .
With the assumption that the wholesale price and retail price are exogenous, the retailer’s optimal order quantities in both Model 2 and 4 are solely determined by the stochastic demand in a Newsvendor. Therefore the retailer orders same quantity of products from the OEM in both models.
6. Conclusions
When returns of products and remanufacturing options have to be taken into consideration in the production process, additional sources of complexity appear due to the following factors. First, the recovered yield of returns is uncertain and the impact of this uncertainty will need to be considered. Secondly, a second mode of parts supply, namely new parts from suppliers, needed so the length of lead times with regular manufacturing needs to be considered. Moreover, the demand itself is uncertain. In this paper, we address these issues in a decentralized supply chain comprising one OEM and one retailer. We develop a model where the decision variables are procurement quantities of new parts and used product and production quantity for the OEM, and the order quantity of finished products for the retailer. We present optimal solutions for four different scenarios in addition to a base case scenario. Our paper makes a number of contributions to the existing literature. The first contribution is that it develops a model for the uncertain yield problem in remanufacturing in a decentralized setting. We determine the optimal decisions for the supply chain parties and show how the random yield may impact their decisions in such a setting. Secondly, we fill an important gap in literature by examining the role of alternative supply chain contracts, namely push and pull contracts, in the uncertain yield problem in remanufacturing. Unlike most studies in remanufacturing which assume the lead times for remanufacturing and regular manufacturing to be equal, we consider a more realistic situation where the two lead times differ. In further research, several assumptions made in this paper can be relaxed to develop a more general understanding of the random yield problem in remanufacturing. We have assumed that there is only a single retailer in the model. It would be interesting to investigate the case of multiple competing retailers. In our framework, the retail price and wholesales price are assumed to be exogenous since they are not the focus of our paper. Future research can incorporate them as decision variables to see how they interplay with other decisions and the channel. A formal empirical analysis would be an interesting extension of the paper.
References

414 Proceedings of International Conference for Entrepreneurship, Innovation and Regional Development
ICEIRD 2014
1. Cachon, P.G. The allocation of inventory risk in a supply chain: push, pull, and advance-purchase discount contracts. Management Science, 2004; 50: 222-238.
2. Denizel, M., Ferguson, M. Souza, G. G. C. Multiperiod Remanufacturing Planning With Uncertain Quality of Inputs. IEEE Transactions on Engineering Management ,2010; 57: 394.
3. Mangun, D., Thurston, D. L. Incorporating component reuse, remanufacture, and recycle into product portfolio design. IEEE Transactions on Engineering Management , 2002; 49: 479-490 .
4. Hsu, A., Bassok, Y. Random yield and random demand in a production system with downward substitution. Operations Research, 1999; 47: 277-290.
5. Erdem, A. S., Ozekici, S. Inventory models with random yield in a random environment. Int. J. of Production Economics, 2002; 78: 239-253.
6. Inderfurth, K. Impact of uncertainties on recovery behavior in a remanufacturing environment. Inter. J. Physical Distribution & Logistics Mgmt, 2005; 35: 318-336.
7. Bakal, S.I., Akcali, E. Effects of random yield in remanufacturing with price-sensitive supply and demand. Production and Operations Management, 2006; 15: 407-420.
8. Tagaras, G., Zikopoulos, C. Impact of uncertainty in the quality of returns on the profitability of a single-period refurbishing operation. Europ. J. Oper. Res., 2007; 182: 205-225.
9. Savaskan, R.C., Bhattacharya S., van Wassenhove, L.N. Closed-loop supply chain models with product remanufacturing. Mgmt. Sci., 2004; 50: 239-252.
10. Mitra, S. Revenue management for remanufactured products. Omega, 2007; 35: 553-562. 11. Mukhopadhyay, S. K., Ma, H. Joint procurement and production decisions in remanufacturing
under quality and demand uncertainty. Int. J. Prod. Econ., 2009; 120: 5-17. 12. Savaskan, R. C., van Wassenhove, L.N. Reverse channel design: the case of competing
retailers. Mgmt. Sci., 2006; 52: 1-14. 13. Zhou, L., Naim, M.M., Tang, O., Towill, D.R. Dynamic performance of a hybrid inventory
system with a Kanban policy in remanufacturing process. Omega, 2006; 34: 585-598. 14. Chung, C-J., Wee, H-M. Short life-cycle deteriorating product remanufacturing in a green
supply chain inventory control system,” Int. J. Prod. Econ., 2011; 129: 195-203.

415 Proceedings of International Conference for Entrepreneurship, Innovation and Regional Development
ICEIRD 2014
Comparative Electricity Demand Generation Forecast, Applying a Grey Analysis Model in Correlation with Monte Carlo Simulation in Discretized Time Frames.
Moyses Moyseos1, Stefanos Katsavounis2 , Nikolaos Patsianis3 1Democritus University of Thrace, Polytechnic School, Dept. of Production and Management Engineering, 12 Vas. Sofias Str., Xanthi, Greece, [email protected]
2Democritus University of Thrace, Polytechnic School, Dept. of Production and Management Engineering, 12 Vas. Sofias Str., Xanthi, Greece, [email protected]
3Democritus University of Thrace, Polytechnic School, Dept. of Production and Management Engineering, 12 Vas. Sofias Str., Xanthi, Greece, [email protected]
Economic crisis, rapidly developing economies of As ia, geopolitical changes and the unstable environment of the Middle East, confer hig h levels of uncertainty and imminent risk in formulating energy strategies who demand long-term scheduling. Energy Policies are the key objective for any reput able statehood, who wants to be energy-self-sufficient and independent in order to establish alliances and of course maintain its critical functions and operations in t imes of crisis. The implementation of those serious tasks embodies the critical stage of planning and anticipation of upcoming hazards. In this paper Grey Analysis Model (GM) and Monte Ca rlo Forecasting Simulation are applied at first in real power generation data from the Cyprus Electricity Authority (CEA) database, in order to produce future predicti ons of generation demand, comparing and validating simultaneously existing fo recasting models. Secondly the correlation of the time discretization sensitivity of the input data is examined. Power generation data is accumulated into different time series to be applied in GM(1,1) Model and Monte Carlo Simulation. More spec ifically hourly raw data of power generation are accumulated into daily and monthly d ata series respectively, aiming to control the forecast response and reach the most ef fective and efficient level of discretization.
Keywords Demand Forecasting, GM(1,1), Grey Analysis , Monte Carlo Simulation, Power Generation, Sensitivity Correlation
1. Introduction
The natural world is structured over mathematical sequences and principles. Although computational procedures and algorithmic approaches are rapidly expanding in various technological fields, there is a variety of problems that are still uncontrolled. As a result we try to predict systems’ behavior under the current circumstances, by occasion. Grey Systems theory, which was first proposed by Professor J. Deng in 1982, is the state-of-the-art in this field of research and avoids the inherent defects of conventional statistical methods, only requiring a limited amount of data to estimate the behavior of an uncertain system. Grey Theory focuses on the relation between the construction of the analysis model, e.g.,

416 Proceedings of International Conference for Entrepreneurship, Innovation and Regional Development
ICEIRD 2014
GM(1,1), and circumstances such as: uncertainty, multi-data input, discrete data and insufficient data through predicting and decision making [1]. Prediction models, as a key tool for Grey Analysis, are grounded on the notion that known past data can be mirrored to the corresponding future frame. The present paper utilizes this concept and its corresponding mathematical and algorithmic procedure to estimate and predict present and future states of the examined system, related to energy issues [5]. On the other hand, Monte Carlo methods are well respected and valid in applied statistics. They are generally used for comparing competing statistics for small samples under realistic data conditions and to provide implementations of hypothesis tests that are more efficient that exact tests. Monte Carlo methods are also a compromise between approximate randomization and permutation tests.
2. Mathematical Background
2.1 GM(1,1) Grey Model
• We define { }= K
(0) (0) (0) (0)(1), (2), , ( )X x x x n be a sequence of raw data, consisting of
suitable time points [3], depending on the nature of the case. In our scenario, monthly and daily series of raw data is used in each case separately.
• The GM(1,1) model can only be used in positive data sequences [2]. Since our raw data values are positive, this model can be used to forecast the future values [3].
• We calculate the new accumulating generator
• { }= − = K
(1) (1) (1)1( ), ( 1), 2,3 ,
2Z x k x k k n where
=
= =∑ K
(1) 0
1
( ), 1, 2, ,k
i
X x i k n
• We calculate { }= K
(1) (1) (1) (1)(2), (3), , ( )Z z z z n where
• { }= − = K
(1) (1) (1)1( ), ( 1), 2,3, ,
2Z x k x k k n is a new sequence of data created by the
adjacent neighbor means.
• Knowing that ( )− =
1T TaB B B Y
b, where matrices ,Y B
include the corresponding input data, we compute the
whitenization equation [3] (image or least square estimation equation) :
+ =
(1)(1)dx
ax bdt
(1)
• We calculate the time response function :
x̂(1)(k +1) = x(0)(1)− b
a
e−at + b
a, k =1,2,� ,n (2)
and the inverse accumulation operator:

417 Proceedings of International Conference for Entrepreneurship, Innovation and Regional Development
ICEIRD 2014
x̂(0)(k) = x̂(1)(k) − x̂(1)(k −1) (3)
which is used to calculate the GM(1,1) estimation of known values and can also predict the unknown.
2.2 Monte Carlo Simulation
Monte Carlo simulation uses numerical methods by generating samples of random numbers to compute quantities of interest. Then simulates and tabulates the samples using its mean and variance to construct probabilistic estimates. By defining the distribution of the given data we set the distribution’s parameters. Although many well-known distributions are suitable to fit the raw data, Log-Normal distribution is the most appropriate to be applied, being important in the description of natural phenomena [4]. In many natural processes of growth, the growth rate is independent of size as occurs in electricity demand. After estimating the two parameters of the Log-Normal distribution, we generated random numbers based on the distribution of the given parameters. After sufficient amount of iterated simulations we set the average mean of all simulations and refer to it as the Monte Carlo Simulation series to be compared with the actual given data.
3. Data Methodology - Empirical Results
The pre-processing phase of the implementation process accomplishes the calculation of monthly sums of electricity generation data, using quarter hour measurements for the following sequence of years: 2007-2008-2009. This data was obtained from CEA online database. Aiming to investigate three main objectives, GM(1,1) model was applied on monthly generation values. These objectives are:
• The comparison of the predicted energy generation, which refers to the corresponding month of the next year, with the actual generation data, concerning the corresponding month of the year that follows.
• The calculation of the total sum of all monthly predicted generation values and its comparison to the actual annual generation. In a nutshell, the conclusion to be drawn is the deviation between what GM(1,1) predicts (or even estimates) and the actual energy generation.
• The comparison between actual (a) annual, (b) predicted and (c) predicted by the CEA generation.
More specifically, using monthly actual generation we materialize the first objective. The prediction of the energy generation for January 2008, was based on real data concerning January 2007, so it was feasible to compare GM(1,1) predicted generation referring to 2008, to the actual generation of 2008. The same reasoning stands for predicted and real values in the second section of Table 1, corresponding to year 2009. More analytically, using the (2) function in the first section of Table 1, (0)(1)X is the actual
generation of January 2008 and k depicts the corresponding month. To this extent =1k stands for January 2007 and = 24k corresponds to December 2008. Applying this sequence we obtain 24 output values. The first 12 values correspond to the estimated values of the input raw data of the 12 months of 2007. The remaining 12 values referring to 13, ,24k = K
indicate the predicted output values given, for January 2008 ( )= 13k until December 2008
( )= 24k . There have been no calculation assumptions and the difference between February

418 Proceedings of International Conference for Entrepreneurship, Innovation and Regional Development
ICEIRD 2014
2007 (28 days) and February 2008 (29 days) has been taken into consideration, meaning that all the appropriate manipulations in case of leap years have been made. Furthermore, concerning the Monte Carlo simulation, Log-Normal distribution was applied over monthly power generation sums in order to obtain the necessary parameters to implement the simulation. After ten simulated iterations we summed up the results and calculated the average number of every single month to be compared with the actual generation values and GM(1,1) predictions. As a result the corresponding plot is constituted of three curves for Monte Carlo, GM(1,1) and actual power generation respectively. The numerical results computed by GM(1,1) model are not close enough to CEA real data for year 2008. A difference, about 10%, in annual generation prediction, comparing to CEA, is a non-negligible quantity, since it corresponds to thousands of Wh of generated energy. Under this notion and explanation, the relative error should be as small as possible. Comparing the corresponded monthly values, the situation is obviously against GM(1,1) model, providing, under the circumstances, unreliable information. These observations are easily proved by plotting the results. The GM(1,1) curve shows an average generation value in a very slight upward trend, and fails to approach the actual values and to trace the actual distribution, leading to the conclusion that the sensitivity of monthly changes is fictitious. On the contrary following to the same procedure, Monte Carlo’s response was more accurate. Monte Carlo traced the curves’ trend for the most part, approximating the critical peaks and power generation demands with error indications showing a range between 1% to 10% unlike GM(1,1) method that demonstrates significant deviations, reaching sometimes percentage errors close to 30%. Table 1 Comparison between Actual Monthly Generation applied in GM(1,1) and Monte Carlo Simulation using monthly data. Monte Carlo GM(1,1)
ACTUAL 2008(×105) Monthly( ×105) Error (%) Monthly( ×105) Error (%)
4.56 4.09 10.36 4.27 6.36
4.08 3.53 13.44 4.33 6.13
3.36 3.43 2.08 4.39 30.65
3.17 3.11 2.04 4.46 40.69
3.50 3.46 1.19 4.52 29.14
4.31 4.23 1.91 4.59 6.50
5.40 5.27 2.33 4.66 13.70
5.38 5.09 5.42 4.73 12.08
4.57 4.22 7.64 4.80 5.03
3.67 3.74 1.81 4.87 32.70
3.31 3.36 1.60 4.94 49.24
3.80 3.87 1.87 5.01 31.84
49.1 47.4 3.49 55.6 13.15

419 Proceedings of International Conference for Entrepreneurship, Innovation and Regional Development
ICEIRD 2014
Table 2 Comparison between Actual Monthly Generation applied in GM(1,1) and Monte Carlo Simulation using monthly data.
Monte Carlo GM(1,1)
ACTUAL 2009(×105) Monthly( ×105) Error (%) Monthly( ×105) Error (%)
4.24 4.54 7.17 4.20 0.94
3.76 4.09 8.81 4.23 12.50
3.88 3.37 13.04 4.25 9.54
3.19 3.15 1.34 4.28 34.17
3.63 3.48 4.22 4.31 18.73
4.56 4.37 4.17 4.33 5.04
5.03 5.46 8.59 4.36 13.32
5.37 5.40 0.65 4.39 18.25
4.52 4.58 1.24 4.41 2.43
4.12 3.68 10.75 4.44 7.77
3.57 3.31 7.17 4.47 25.21
4.09 3.81 6.86 4.50 10.02
50.0 49.2 1.43 52.2 4.42
Figure 1 Actual Electricity Generation (MWh) in 2008 and 2009 compared to GM(1,1) Predicted and Monte Carlo Simulated values.
The results for 2009 follow the same qualitative approach, although the computed prediction values are closer to CEA actual data. According to the objectives, it is apparent that using monthly electricity generation data, as an input to GM(1,1) model, leads to non-accurate numerical results. The GM(1,1) prediction that uses monthly approach (green-color curve in Figure 1) does not provide satisfactory values, failing to predict the electricity generation in an acceptable manner. In a matter of generation of thousands of Wh, our purpose is to achieve the accuracy of the model as high as it can be, close to the actual generation. So we come easily to the conclusion that this approach is inaccurate and inapplicable in practice. On the other hand, Monte Carlo simulation still provides satisfactory output values but follows a slight upward increment trend. Furthermore, it is remarkable that the daily approach simulation for both methods led to reduction of the error percentage. Monte Carlo simulation improved the overall model for the amount of 0,5% and GM(1,1) retrieved the spectacular 10% error percentage from the previous approach.

420 Proceedings of International Conference for Entrepreneurship, Innovation and Regional Development
ICEIRD 2014
4. Sensitivity Correlation The output results prompted the interest of further investigation especially for the GM(1,1) model in order to validate daily power generation forecasts. Six new objectives emerged: • Monthly energy generation prediction based on the actual generation data of the previous
month. At this step the input of the GM(1,1) model was daily and not monthly. The last step is to compare the results to the values of the previous method, where the time base was monthly.
• The aggregation of all the monthly predicted generation values, comparing the deviation of the actual annual generation, using again daily information on the GM(1,1) model.
• The comparison of both GM(1,1) outputs, emphasizing on the sensitivity of information given as raw data to be applied, daily and monthly.
• The comparison of both GM(1,1) outputs to the actual generation values. • Application of actual daily power generation values in Monte Carlo in order to produce
forecast simulation on daily basis. • Comparison of both Monte Carlo output results and actual annual generation. The following Table 3 constitutes an indicative example of the information used to calculate the day-by-day prediction of the next month, using the corresponding information from the previous one –concerning the GM(1,1) simulation. As for Monte Carlo Simulation all data should be investigated in order to be validated on a statistical distribution, specifically Log-Normal. Without loss of generality and in order to avoid displaying redundant numerical calculations we selected a "high temperature season" month for 2008 and a "low temperature season" month in 2009. For GM(1,1) model, all the calculations are based on the (2) function. (0)(1)X is the actual
daily generation of May 1st, 2008 and k is the series number for days. = K1, ,61k , from May
1st, 2008 until June 30th. As for February 2009 "low temperature" scenario, k is the series number for days. = K1, ,59k , from January 1st, 2009 until February 28th. The difference in month durations (days) is individually calculated in every case scenario. As previous, values for = K1, ,31k are estimation values for the actual raw data given as
input for May 1st = K32, ,61k and values are referred to the predicted daily values for June
1st ( )32k = 2008 to June 30th ( )61k = . In the same manner for = K1, ,31k values
correspond to estimation data for January 2009 and values for = K32, ,59k are predicted daily values for February 2009. Figure 2, conveys that the second approach, based on daily data information, approximates the actual values of energy generation for both methods respectively. In order to have a better overview of the two approaches, and as well as to compare the results with EAC actual data, Tables 3, 4 and Figure 2 summarize the outcome of the results providing a consolidated overview. The improved efficiency of the second methodology (using daily data), compared to the first approach, is obviously more related to the actual data than the first one’s (using monthly data). According to this situation Monte Carlo demonstrates significant accuracy. Ten out of twelve simulations showed error percentage between 1 to 6% which is very encouraging and easily acceptable to be considered as a considerable forecasting method.

421 Proceedings of International Conference for Entrepreneurship, Innovation and Regional Development
ICEIRD 2014
Table 3 Comparison Overview between Actual Daily Power Generation, Monte Carlo Simulation and GM(1,1) using daily data. Monte Carlo GM(1,1)
ACTUAL 2008( ×105) Daily( ×105) Error (%) Daily( ×105) Error (%)
4.56 4.10 10.17 4.40 3.51
4.08 3.53 13.38 4.51 10.54
3.36 3.46 2.83 4.25 26.49
3.17 3.08 2.97 2.80 11.67
3.50 3.44 1.61 3.11 11.14
4.31 4.22 2.11 4.32 0.23
5.40 5.30 1.81 6.25 15.74
5.38 5.12 4.85 5.37 0.19
4.57 4.30 5.89 5.63 23.19
3.67 3.80 3.51 3.33 9.26
3.31 3.37 1.87 3.23 2.42
3.80 3.89 2.26 3.93 3.42
49.1 47.6 3.07 51.1 4.11
Table 4 Comparison Overview between Actual Daily Power Generation, Monte Carlo Simulation and GM(1,1) using daily data. Monte Carlo GM(1,1)
ACTUAL 2009( ×105) Daily( ×105) Error (%) Daily( ×105)
Error (%)
4.24 4.59 8.16 4.62 8.96
3.76 4.11 9.32 3.72 1.06
3.88 3.39 12.52 4.88 25.77
3.19 3.20 0.32 3.67 15.05
3.63 3.56 1.83 3.24 10.74
4.56 4.41 3.26 4.29 5.92
5.03 5.46 8.63 5.93 17.89
5.37 5.38 0.27 4.21 21.60
4.52 4.56 0.79 5.02 11.06
4.12 3.71 10.01 3.42 16.99
3.57 3.31 7.38 3.90 9.24
4.09 3.97 2.91 3.88 5.13
50.0 49.7 0.61 50.8 1.64
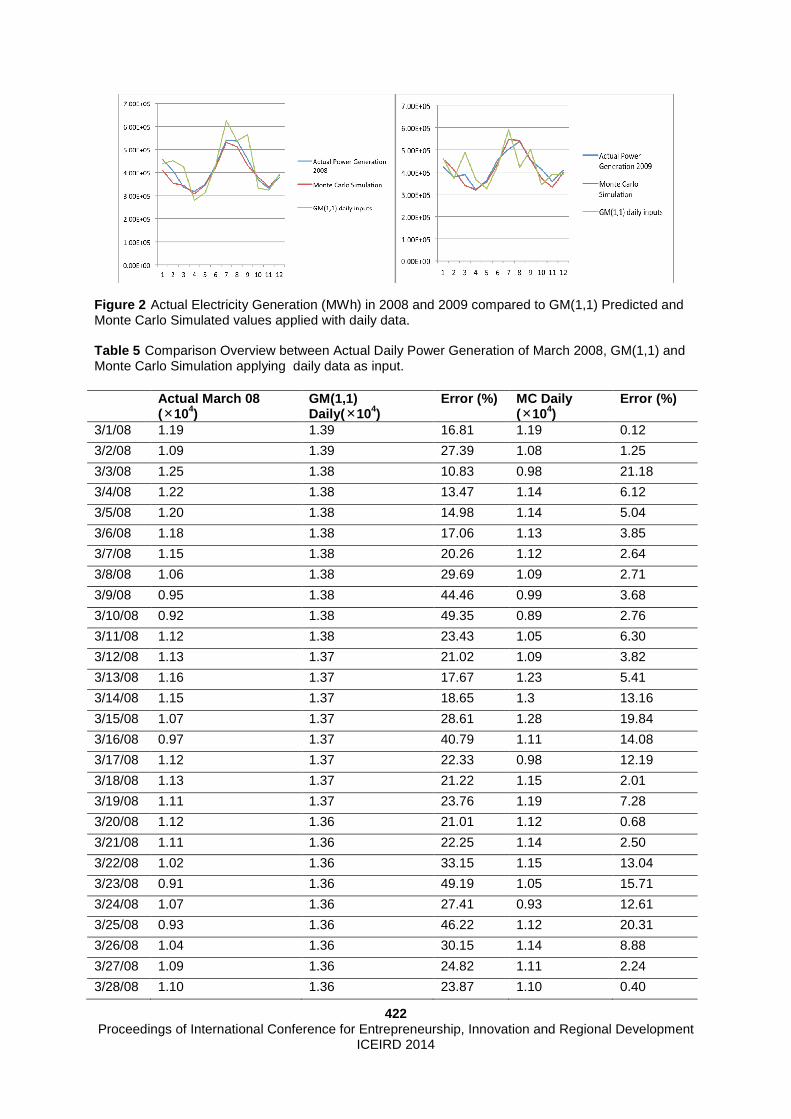
422 Proceedings of International Conference for Entrepreneurship, Innovation and Regional Development
ICEIRD 2014
Figure 2 Actual Electricity Generation (MWh) in 2008 and 2009 compared to GM(1,1) Predicted and Monte Carlo Simulated values applied with daily data. Table 5 Comparison Overview between Actual Daily Power Generation of March 2008, GM(1,1) and Monte Carlo Simulation applying daily data as input. Actual March 08
(×104) GM(1,1) Daily( ×104)
Error (%) MC Daily (×104)
Error (%)
3/1/08 1.19 1.39 16.81 1.19 0.12
3/2/08 1.09 1.39 27.39 1.08 1.25
3/3/08 1.25 1.38 10.83 0.98 21.18
3/4/08 1.22 1.38 13.47 1.14 6.12
3/5/08 1.20 1.38 14.98 1.14 5.04
3/6/08 1.18 1.38 17.06 1.13 3.85
3/7/08 1.15 1.38 20.26 1.12 2.64
3/8/08 1.06 1.38 29.69 1.09 2.71
3/9/08 0.95 1.38 44.46 0.99 3.68
3/10/08 0.92 1.38 49.35 0.89 2.76
3/11/08 1.12 1.38 23.43 1.05 6.30
3/12/08 1.13 1.37 21.02 1.09 3.82
3/13/08 1.16 1.37 17.67 1.23 5.41
3/14/08 1.15 1.37 18.65 1.3 13.16
3/15/08 1.07 1.37 28.61 1.28 19.84
3/16/08 0.97 1.37 40.79 1.11 14.08
3/17/08 1.12 1.37 22.33 0.98 12.19
3/18/08 1.13 1.37 21.22 1.15 2.01
3/19/08 1.11 1.37 23.76 1.19 7.28
3/20/08 1.12 1.36 21.01 1.12 0.68
3/21/08 1.11 1.36 22.25 1.14 2.50
3/22/08 1.02 1.36 33.15 1.15 13.04
3/23/08 0.91 1.36 49.19 1.05 15.71
3/24/08 1.07 1.36 27.41 0.93 12.61
3/25/08 0.93 1.36 46.22 1.12 20.31
3/26/08 1.04 1.36 30.15 1.14 8.88
3/27/08 1.09 1.36 24.82 1.11 2.24
3/28/08 1.10 1.36 23.87 1.10 0.40

423 Proceedings of International Conference for Entrepreneurship, Innovation and Regional Development
ICEIRD 2014
3/29/08 1.01 1.35 33.32 1.11 9.48
3/30/08 0.91 1.35 47.09 1.09 19.06
3/31/08 1.06 1.35 27.43 0.97 7.86
33.6 42.5 26.47 34.2 1.86 Table 6 Comparison Overview between Actual Daily Power Generation of Αugust 2009, GM(1,1) and Monte Carlo Simulation applying daily data as input. Actual Aug 09
(×104) GM(1,1) Daily (×104)
Error (%) 09 Monte Carlo Daily ( ×104)
Error (%)
8/1/09 1.49 1.48 0.69 1.87 25.78
8/2/09 1.93 1.47 23.67 1.85 3.83
8/3/09 1.76 1.46 16.91 1.70 3.31
8/4/09 1.62 1.45 10.64 1.54 5.32
8/5/09 1.91 1.45 23.96 1.85 3.10
8/6/09 1.66 1.44 13.15 1.84 10.81
8/7/09 1.97 1.43 27.55 1.81 8.13
8/8/09 1.96 1.42 27.59 1.85 5.81
8/9/09 1.87 1.41 24.70 1.86 0.60
8/10/09 1.66 1.41 14.96 1.70 2.79
8/11/09 1.50 1.40 6.83 1.54 2.39
8/12/09 1.74 1.39 20.29 1.73 0.60
8/13/09 1.78 1.38 22.60 1.68 5.62
8/14/09 1.73 1.37 20.59 1.60 7.45
8/15/09 1.70 1.36 20.20 1.65 2.94
8/16/09 1.65 1.36 17.73 1.47 10.97
8/17/09 1.54 1.35 12.28 1.52 1.02
8/18/09 1.50 1.34 10.86 1.48 1.28
8/19/09 1.64 1.33 18.81 1.76 7.61
8/20/09 1.70 1.33 21.86 1.79 5.46
8/21/09 1.74 1.32 24.33 1.79 2.82
8/22/09 1.79 1.31 26.74 1.86 4.11
8/23/09 1.83 1.30 29.04 1.87 1.93
8/24/09 1.74 1.30 25.28 1.76 0.98
8/25/09 1.64 1.29 21.15 1.62 1.11
8/26/09 1.74 1.28 26.56 1.88 8.07
8/27/09 1.84 1.27 30.94 1.93 4.76
8/28/09 1.76 1.27 27.99 1.92 8.82
8/29/09 1.76 1.26 28.22 1.99 13.63
8/30/09 1.80 1.25 30.63 1.93 7.21
8/31/09 1.70 1.24 27.13 1.73 1.43
53.7 42.1 21.51 54.4 1.36

424 Proceedings of International Conference for Entrepreneurship, Innovation and Regional Development
ICEIRD 2014
Figure 3 : Actual Electricity Generation (MWh) in March 2008 and August 2009 compared to GM(1,1) Predicted and Monte Carlo Simulated values applying daily data.
5. Conclusions
Forecasting models in electricity generation are of great importance, due to their catalytic influence in economy and environment. New approaches have to deal with a variety of parameters, usually crunching large amount of data, aiming to predict the market demand over the time. In this paper two forecasting approaches are developed, to validate, check and improve CEA predictions for electricity generation. The methodology uses the GM(1,1) model of Grey Analysis and Monte Carlo simulation taking into account series of real data as an input, in daily and monthly basis, to investigate their influence. The most important observation is achieved, by increasing the sensitivity of information given, since GM(1,1) provides improved predicted output in correlation with the actual data and Monte Carlo simulation provides significant accuracy reducing error losses below ten percent. Using monthly data, as a sum to the annual electricity generation compared to the actual data, was relatively accurate for GM(1,1) and satisfactory for Monte Carlo. However, when the daily data approach applied on GM(1,1) and Monte Carlo simulation the predicted values showed improved accuracy, even more accurate than the CEA predictions on annual level, achieving to closely trace the demand variability. Future work will investigate the sensitivity of the proposed methodology as a matter of time (6-hour generation data level, 1-hour generation data level) for GM(1,1) and also examine the behavior of Monte Carlo under several statistical distribution circumstances, in order to increase the performance accuracy. Since we are still energy-depended in electricity generation production by using inner drain combustion technologies - for the most part, COx, NOx emissions are a major field that should be taken into account. The environmental effect and the economic taxing bounce of COx, NOx emissions in industrial, commercial or even domestic use could be avoided to an extent by using significant predictive methods of electricity generation without spending at the same time precious raw material.
References
1. Moyseos M, Katsavounis S, Chatzimichailidou M M. Forecasting Electricity Demand Generation Applying a Grey Analysis Model, XI Balkan Conference of Operational Research, Belgrade, Zladibor; 2013; 441-447.
2. Deng, J. Introduction of Grey System Theory. Journal of Grey Systems; 1989; 1: 1-24. 3. Liu S.F, Lin Y.Grey Systems Theory and Applications, Springer Verlag Berlin 2010. 4. Kathleen A.C, Forecasting Electricity Demand using Regression and Monte Carlo Simulation Under
Conditions of Insufficient Data, Morgantown, West Virginia, 1999. 5. Personal communication and discussion with Transmission System Operator Cyprus (April 2014)

425 Proceedings of International Conference for Entrepreneurship, Innovation and Regional Development
ICEIRD 2014
Data mining in customer profitability analysis
Dražena Gašpar1, Ivica Ćorić2, Mirela Mabić3 1University of Mostar, Trg Hrvatskih velikana 1, Mostar, Bosnia and Herzegovina, [email protected]
2HERA, K.P. Krešimira IV bb, Mostar, Bosnia and Herzegovina, [email protected]
3University of Mostar, Trg Hrvatskih velikana 1, Mostar, Bosnia and Herzegovina, [email protected]
The aim of this paper is a presentation of data min ing model that could be used for the measurement of current and forecasting of the futur e customer profitability. The purpose of this model is forecasting activities of individual customers in the future, and values that company could expect in doing busin ess with them. Modern customer profitability analysis shows that product costs are only one part of the relation enterprise-customer. A general framework for defini ng customer profitability, besides pure financial items, has to include a lot of non-l inear and non-financial elements. Data mining methods do not use conventional learnin g methods that suffer from imperfections such as inability to explicitly trans fer the knowledge from experts to machines or nonexistence of experts’ will for knowl edge transfer. Data mining can identify and adopt patterns and rules that exist in historical data stored in databases and/or data warehouses. It could work equally well with nonlinear and nonfinancial elements of environment which have influence on pro fitability results. Neural networks approved their capability for approximate description of any continuous function. Together with robust methods of genetic a lgorithms used in the learning process of networks, they make a good choice in the process of selecting methods for forecasting customer profitability. The proposed mo del for the forecasting of the customer profitability uses two data mining methods : neural networks and genetic algorithm . The paper presents results of empirical research re lated to forecasting of customer determination to specific segment made in a company which produces and distributes products like dry fruits, nuts, seeds and cereals f or the market of South-East Europe.
Keywords Customer profitability, data mining, genetic algorithm, neural network
1. Introduction
Analysis of business operations shows that product costs are only one part of the relation enterprise-customer. This relation is burdened with other different costs generated by business activities like inbound logistics, administration of customer orders, sale, marketing and post-sales services. Customers, consistent with their own characteristics, differ a lot in the allocation of these costs. The first theoretical analysis related to this issue has started with work of [1], [2] and [3] in 1990s. The main contribution of all these works is that each monetary unit of revenue does not participate in profit in the same way. So, the focus has been changed on a particular customer and measurement of the revenue’s monetary unit “value” emerged from doing business with this customer. This value is represented by the difference between revenue and costs that arise from doing business with the customer.

426 Proceedings of International Conference for Entrepreneurship, Innovation and Regional Development
ICEIRD 2014
While revenue presentation is a relatively simple, presentation of costs is a complex problem. Calculation of customer profitability starts with a deduction of product costs and proceeds with the recognition and deduction of other types of costs which strain on this business transaction. Modern customer profitability analysis (CPA) refers to trends in business profitability research, measured at the customer level. Van Triest [4] distinguishes costs related to physical product delivery, targeted customer costs and the costs that could not be allocated to the individual customer. Shapiro [1] divides costs to the costs before sale, production costs, distribution costs and costs for post-sale service. Calculation of individual/group customer profitability gives a basis for a detailed analysis of customer profitability distribution inside a company. Some empirical researches [3], [5], [6], [7] have results that make this field very interesting from the point of analysis and management of customer distribution. Management of unprofitable, but also of profitable customers, is a natural continuation of these researches. Correct and exact calculation of customer costs and identification of profitability dispersion, make the basis for defining of strategy for management of unprofitable customers and establishing the corresponding infrastructure for its implementation. Repeated evaluation of customer relationship, customer education, renewed negotiation about sales conditions, customers’ migration, and as a final step, termination of business relations with the customer, are only some of the activities of the highly intensive process of customer management [8]. Enforcement of strategic customer management based on retrospective analysis has become insufficient for survival on the global market. One different approach to profitability, view on prospective customer profitability, brings a completely new knowledge important for decision making process. Prospective customer analysis forecasts elements of business relationship with the customer during its future lifetime (as the customer of the company), finding basis for forecasting in the retrospective analysis. Data mining methods, as neural networks and genetic algorithms, are especially suitable for this type of analysis. Neural networks do not use conventional learning methods that suffer from imperfections such as inability to explicitly transfer of knowledge from experts to machines or nonexistence of experts’ will for knowledge transfer. On the contrary, the knowledge stored in historical cases makes the basis for neural network learning. It means that instead of request that expert articulates knowledge and then enables the machine to absorb such articulated knowledge, neural networks are capable to identify and absorb hidden knowledge and patterns of behavior that are stored in historical data of retrospective customer analysis. They could work equally well with nonlinear and nonfinancial elements of environment which have influence on profitability results. Neural networks approved their capability for approximate description of any continuous function. That characteristic makes them a good choice in the process of selecting methods for forecasting customer profitability. This paper presents results of empirical research, based on neural networks and genetic algorithm, related to forecasting of customer determination to specific segments.
2. Analysis of Customer Profitability
Business subjects present the profitability of their business using aggregate values. Measures like market share, relative market share, market penetration, brand penetration, customer satisfaction, total revenue, total costs, marketing costs and so on, show the way how company works with their customers as a whole. Continuous management tendency for improving the business results lead to necessity of analyzing individual customers. From that perspective, it is not enough anymore that company is agile and efficient in its business. The company should have to be the part of the value chain and to have suppliers and customer that will not decrease its profit margin. Results of customer profitability analysis presented in this paper, shows that every customer is not equally valuable, i.e. profitable, for company. That is the reason why it is not enough for a company to rely on detail analysis of existing

427 Proceedings of International Conference for Entrepreneurship, Innovation and Regional Development
ICEIRD 2014
customer data, but it should be focused on proactive and predictive customer management. Prerequisites for that are big volumes of quality data (data warehouse) and understanding of data mining methods.
2.1 Individual Customer Value
Customer profitability is represented by the difference between revenue and costs that arise from doing business with the customer in a defined period of time. The most of empirical phenomena, including sale, are following Pareto’s rule 20-80: 20% of products or customers realize 80% of sales. But, detailed analysis of customer profitability phenomenon denied Pareto’s rule. Kaplan [9] in his explanations mentioned “whale curve” which made the relation between cumulative profit and customers (Figure 1.). If there are on x-coordinate customers ordered by the profit they make, curve gives an interesting result: 20% of the most profitable customers generate 150-300% of total profit, next 70% are around break even and last 10% generate the loss of 50-200% of total profit, leading cumulative profit at the level of realized profit (curve ended in the point of 100% profit). So, “whale curve” once again point out that not all customers are of equal value. According to the results of “whale curve” the customers should be divided into three different layers [10]:
1. Top segment customers: The most valuable and loyal customers. The company should do everything that can keep that customer and have to devote to them more attention and award them for their loyalty.
2. The second segment customers: Customers with average-small profit. Those customers have potential for growth and transition into top segment customers.
3. The third segment customers: Customers whose servicing cause loss for company.
Figure 1 Cumulative customer profitability - „whale curve“ [9]
Total result of company could be improved by actions customized to different customer segments. Kaplan [9], according to their nature, classifies those actions into three groups:
1. Process improvement 2. Price decisions

428 Proceedings of International Conference for Entrepreneurship, Innovation and Regional Development
ICEIRD 2014
3. Modify relationships with customers. The third group opens the room for the possibility of improvement of customer loyalty and profitability measurement in order to represent and the forecast relationship between individual customers and company. The quantity and characteristics of the parameters of customer profitability point to the complexity of problem, measurement and forecast. Generally, the profitability is presented as financial item. But, a lot of nonfinancial factors like customer satisfaction, loyalty or reputation, have an important influence on the financial performance of the company, especially on long term. So, per example, customer satisfaction is preceding customer loyalty, while the result of customer loyalty is his profitability. The important place in research of customer profitability belongs defining and measuring of customers’ costs.
3. Forecasting of Segmentation
The data source for research related to customer segmentation was a data warehouse of the company which produces and distributes products like dry fruits, nuts, seeds and cereals for the market of South-East Europe and for the period 2008 - 2013.
Table 1 Data used in customer segmentation
No. Data Description Input/Output variable
1 Year Year to which data refers N/A 2 Customer Customer to which data
refers N/A
3 Cost Total costs of business with customer in observed year
N/A
4 Revenue Total revenue realized by the customer in observed year
Input
5 No of deliveries
Total number of deliveries to customer in observed year
Input
6 No of products Total number of different products in customer trade in observed year
Input
7 No of delivery places
Total number of different places where products were delivered to customers in observed year
Input
8 Net margin Net margin realized in customer trade in observed year
N/A
9 No of returns Total number of returns of good in customer trade in observed year
Input
10 Value of returns
Total value of returns of good in customer trade in observed year
Input
11 Value of discount
Total value of the discount given to customers in customer trade in observed year
Input

429 Proceedings of International Conference for Entrepreneurship, Innovation and Regional Development
ICEIRD 2014
12 Customer segment
Determination to segment based on realized customer business results in observed year
Output
All customers are, according to data from Table 1., classified into corresponding segments (defined in the previous paragraph). The combination of data mining methods, neural networks and genetic algorithm, was used during research in two different ways. The first way of use (Application 1) should confirm the capacity of classification of used data mining methods related to aligning of customers in the adequate segment. In that process, input values of the network were not variables used for direct calculation of net profit, nor net profit as base indicator for defining determination of customer to a particular segment. The output network variable was determined to segment. The second way of use (Application 2) should present predictive capacity of combination of neural network and genetic algorithm. The starting point was the same data set, but limited by time. Namely, the idea was to use the same indicators from former example, but limited to first quarter. The main hypothesis was: If network shows the ability to predict correct determination to customer segment that will be at the end of the year, based on value of input variables for the first quarter, it means that network has predictive capacity. Proven hypothesis means that customer management could get mechanism for better defining a course of action related to correcting customers’ behavior and directing of customers into the preferred segment. In the both ways of usage, the input set of data (revenue, number of products, number of delivery places, number of deliveries, values of returns, number of returns and discount value) was divided to: • Training data (60%), • Cross Validation data (15%) and • Testing data (25%). As a software tool was used NeuroSolutions for Excel version 6.20 of company NeuroDimension. Tool Express Builder was used for comparison of results of different types of neural network: MLP-Multi Layer Perceptron, LR-Linear Regression, PNN-Probabilistinc Neural Network, RBF-Radial Basis Function, MLPPCA-Multi Layer Perceptron with Principle Component Analysis, SVM- Classification Support Vector Machine, GFF- Generalized Feedforward, TDNN- Time-Delay Network, TLRN- Time-Lag Recurrent Network and RN- Recurrent Network. The number of epochs was 100. Test results of the first set of data, which were used for testing classification ability of the model, were declared architecture of TLR-1-B-L network as the best (Figure 2). It is Time-Lag Recurrent network with one hidden layer, back-propagation algorithm for calculating weight factors with Levenberg Marquardt learning rule. Performances of winning network are given in tables 2 and 3. Moving of MSE through epochs during the learning process of the network is shown on Figure 4. The network had a minimal error in the case of the training set in 100 epochs, while in the case of validation set network reached the best result in 60 epochs.

430 Proceedings of International Conference for Entrepreneurship, Innovation and Regional Development
ICEIRD 2014
Test results of the second data set, which were used for testing predictive ability of the model, were again declared TLR-1-B-L network (Figure 3) as the optimal one.
Figure 2 Summary of all Networks for Application 1
Table 2 Metrics of Best-Performing networks for Application 1.
Training Cross Val. Testing # of Rows 1119 280 466 MSE 0.063364 0.072902 0.10821 Correlation (r) 0.834589 0.859821 0.721165 # Correct 1000 255 417 # Incorrect 116 25 49 % Correct 89.37% 91.07% 89.48%
Table 3 Final and Minimum MSE for Application 1.
Best Networks Training Cross Validation Epoch # 100 60 Minimum MSE 0.081282197 0.096099236 Final MSE 0.081282197 0.112787966
The results of Time-Lag Recurrent network with one hidden layer, back-propagation algorithm and Levenberg Marquardt learning rule are presented in tables 4 and 5. Moving of MSE through epochs during the learning process of the network is shown on Figure 5. In the case of the training set network had a minimal error in 67 epoch, while in the case of validation set network reached the best result in 18 epoch.
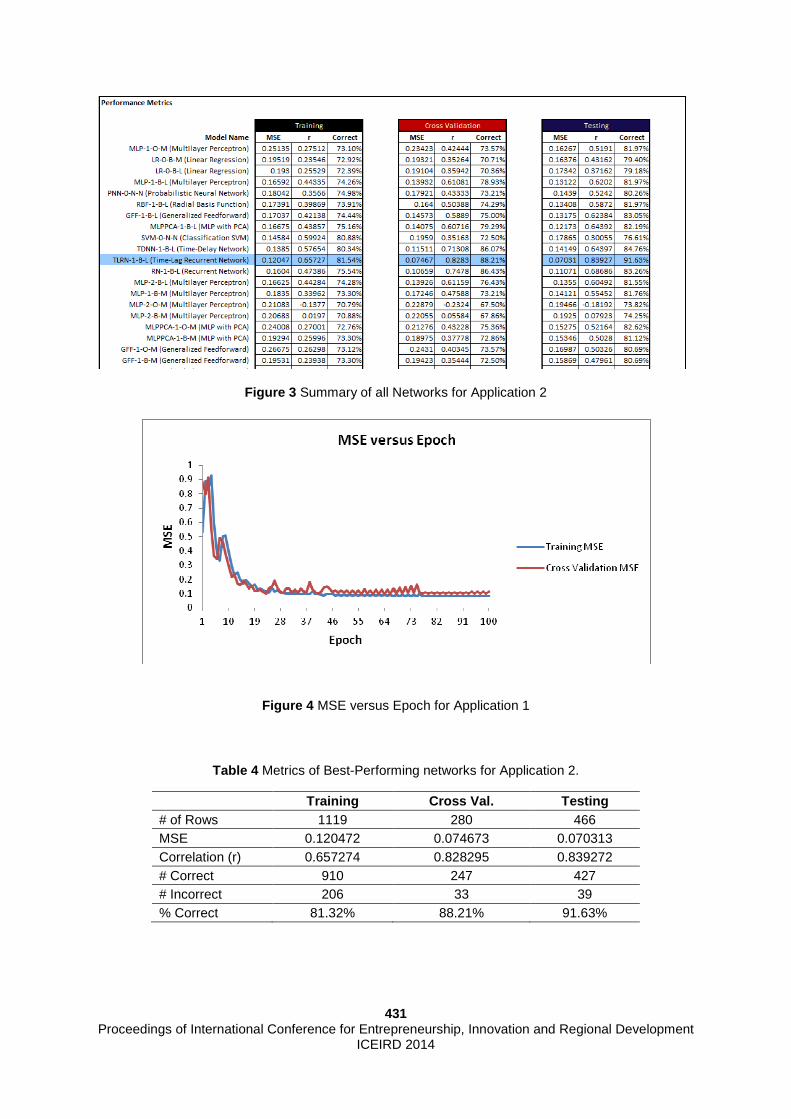
431 Proceedings of International Conference for Entrepreneurship, Innovation and Regional Development
ICEIRD 2014
Figure 3 Summary of all Networks for Application 2
Figure 4 MSE versus Epoch for Application 1
Table 4 Metrics of Best-Performing networks for Application 2.
Training Cross Val. Testing # of Rows 1119 280 466 MSE 0.120472 0.074673 0.070313 Correlation (r) 0.657274 0.828295 0.839272 # Correct 910 247 427 # Incorrect 206 33 39 % Correct 81.32% 88.21% 91.63%
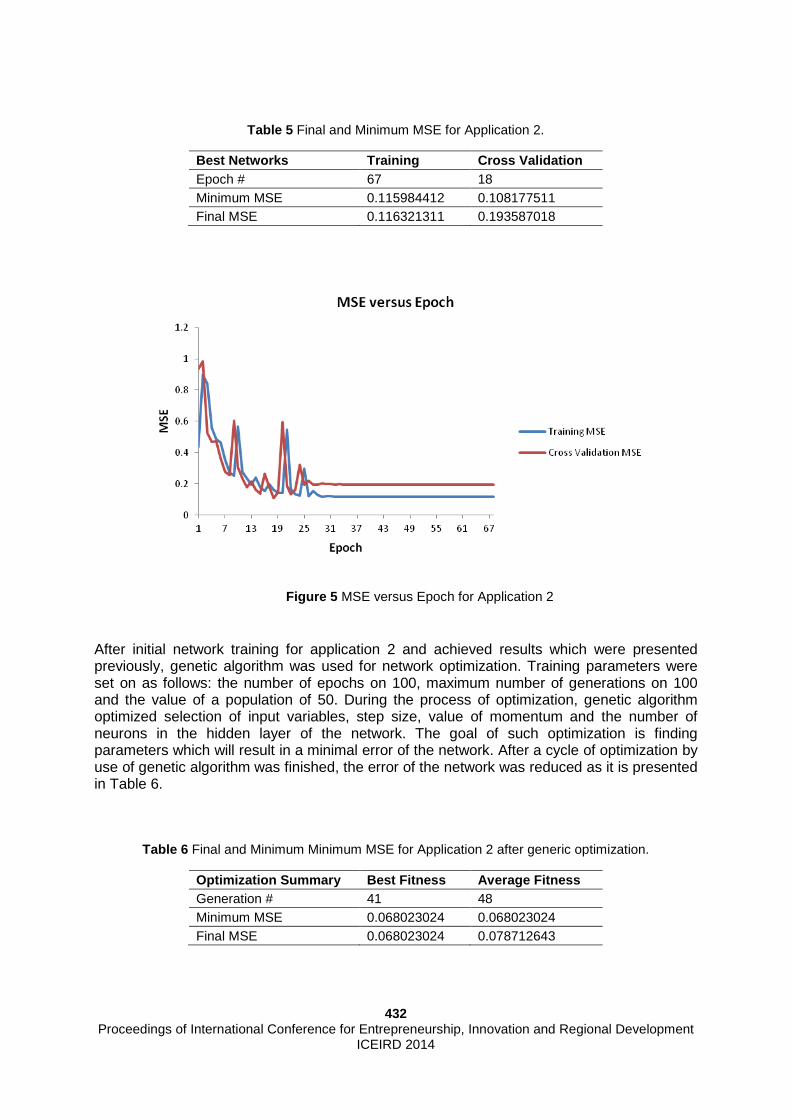
432 Proceedings of International Conference for Entrepreneurship, Innovation and Regional Development
ICEIRD 2014
Table 5 Final and Minimum MSE for Application 2.
Best Networks Training Cross Validation Epoch # 67 18 Minimum MSE 0.115984412 0.108177511 Final MSE 0.116321311 0.193587018
Figure 5 MSE versus Epoch for Application 2
After initial network training for application 2 and achieved results which were presented previously, genetic algorithm was used for network optimization. Training parameters were set on as follows: the number of epochs on 100, maximum number of generations on 100 and the value of a population of 50. During the process of optimization, genetic algorithm optimized selection of input variables, step size, value of momentum and the number of neurons in the hidden layer of the network. The goal of such optimization is finding parameters which will result in a minimal error of the network. After a cycle of optimization by use of genetic algorithm was finished, the error of the network was reduced as it is presented in Table 6.
Table 6 Final and Minimum Minimum MSE for Application 2 after generic optimization.
Optimization Summary Best Fitness Average Fitness Generation # 41 48 Minimum MSE 0.068023024 0.068023024 Final MSE 0.068023024 0.078712643

433 Proceedings of International Conference for Entrepreneurship, Innovation and Regional Development
ICEIRD 2014
4. Conclusions
The results of presented research showed that classification based on neural networks and genetic algorithm - used for defining network weight factors - could be the efficiency used in customer segmentation. This combination of neural networks and genetic algorithm approved its applicability with classification precision of 89.37 - 91.07% and with prediction precision of 81.32 – 91.63% in the conducted research. The further research should include new variables into model, taking into account the number of parameters that defined customer profitability. Since neural networks have the ability to equally well process financial and nonfinancial factors like customer satisfaction or loyalty, it opens new possibilities for more complex applications of these methods, all with a main goal to ensure data necessary for decision making process related to customer management.
References
1 Shapiro P, Rangan K, Moriarty R, Ross E. Manage Customers for Profits (Not Just Sales). Harvard Bussines Review September-October 1987.
2 Howell R A, Soucy S R. Customer profitability; as critical as product profitability. Managment Accounting, October 1990: 43-47.
3 Foster G, Gupta M , Sjoblom L. Customer profitability analysis: Challenges and new directions. Journal of Cost Management (Spring 1996): 5-17.
4 Triest S. Customer size and customer profitability in non-contractual relationships. Journal of Business & Industrial Marketing 2005, 20/3: 148-155.
5 Cooper R, Kaplan R. Profit Priorities from Activity-Based Costing. Harward Bussines Review 1991.
6 Storbacka E K. Segmentation based on customer profitability: retrospective analysis of retail bank customer bases. Journal of Marketing Management 1997, Vol. 13 No. 5:479-92.
7 Krakhmal V. Customer profitability analysis in service industries. BAA Annual Conference 11-13 Apr 2006, Portsmouth, UK.
8 Mittal V, Sarkees M, Murshed F. The right way to manage unprofitable customers. Harvard Business Review April 2008
9 Kaplan R, Narayanan V G.Measuring and managing customer profitability. Journal of Cost Management 2001, 15(5): 5–15.
10 Farris P W, Bendle N T, Pfeifer P E, Reibstein D J. Marketing metrics, Wharton School
Publishing, USA, 2006

434 Proceedings of International Conference for Entrepreneurship, Innovation and Regional Development
ICEIRD 2014
A Methodological Approach for the Enhancement of Solar Thermal Market in South East Europe
Athanasios Kalogeras1, Gino Verrocchi2 1Industrial Systems Institute – Research Centre ATHENA, Stadiou Str, Platani, Patras, Greece, [email protected]
2Vega Form Srl, via S. Michele 1/a, Giulianova, Teramo, Italy, [email protected]
This paper presents a methodological approach desig ned for the enhancement and widening of the solar thermal market in the geograp hical area of South East Europe, focusing mainly on domestic hot water heating syste ms and applications. The presented methodological approach deals with the th ree axes that are considered essential for the development of this market, which are the policy axis, the market operator axis and the public awareness axis. The me thodological approach deals with the different phases that a solar thermal project h as to go through: the assessment phase, the project preparation phase and the projec t implementation phase and details the different guidelines that have to be fo llowed in each phase. The assessment phase comprises the Framework Assessment Guideline, the Cost Effectiveness Analysis Guideline, and the Stakehold er Involvement Guideline. The project preparation phase consists of the Project S pecification Guideline and the Quality Assurance and Risk Management Guideline. Fi nally, the project implementation phase is built upon the Participatio n and Awareness Guideline, the Financial Incentives Guideline, the Training and Su pport Guideline and the Project Evaluation Guideline. The presented methodological approach has been pivotally applied in different countries of the South East Eu rope area, which presents a high degree of diversity with reference to the solar the rmal market development and maturity level. The paper presents experiences and lessons learned from the application of the methodological approach in South East Europe. The work that is presented in this paper has been financed in the fr amework of the WidetheSEEbySuccMod project of the South East Euro pe Transnational Cooperation Programme and is supported by the KRIPIS VISETAK pr oject.
Keywords Guidelines, Methodological approach, Renewable Energy Sources, Solar thermal market.
1. Introduction
European solar thermal market has a high potential for growth as exhibited by the low installed solar thermal capacity per inhabitant in the different European countries [1], [2]. The top 5 European countries with reference to installed solar thermal capacity per 1000 inhabitants are Cyprus, Austria, Greece, Switzerland and Germany. In fact they are the only countries with installed solar thermal capacity in operation greater than 100 kWth at the end of 2010, the rest of Europe being well below this figure. The European framework is supportive for the market growth and development and this could be beneficial for the citizens, the environment and the local economies. The citizens can find in solar thermal solutions a way to reduce their overall energy costs as getting

435 Proceedings of International Conference for Entrepreneurship, Innovation and Regional Development
ICEIRD 2014
domestic hot water from the sun can reduce their dependence on conventional fuels or electricity. The reduction in conventional fuels or electricity for domestic hot water provision also reduces the Green House Gases emissions contributing to a cleaner environment and helping reverse the climate change process. Finally, local economies can benefit both directly through the development of a highly dynamic sector and the creation of new jobs as well as indirectly reducing their dependence of imports of conventional fuels. Different barriers and constraints exist that inhibit the growth of the solar thermal market in South East Europe. With the exception of Austria and Greece that are leading the European solar thermal market in terms of installed capacity per capita, the rest of the countries in the area have a long way to go in order to reach similar levels of capacity in operation. Three areas of intervention are necessary to overcome the shortcomings of the market and lead to its overall growth: the area of subvention and financial aid policies, the area of market operator qualifications and the area of House Owner Market enhancement. Distinct Guidelines relevant to the three aforementioned areas detailing the needed actions to be taken are presented in this paper. These Guidelines stem out of a common methodology proposed for the preparation, design and implementation phases of any Solar Thermal Project. Chapter 2 presents the Methodological Approach followed and its individual steps. Chapter 3 presents lessons learned and suggestions from the application of the Methodological Approach in different countries of the South East Europe area. Finally Chapter 4 presents Discussion and Conclusions.
2. Methodological Approach
The differences presented by European states with reference to the utilisation of solar thermal energy as well as the high potential presented for the European economy by the widening of this market, present a challenge for Europe in general and the South East Europe area in particular. The proposed Methodological Approach [3] aims at contributing in the overall problematic on how to address this challenge. This contribution is derived from successful experiences that have been identified and assessed. Any solar thermal energy project undergoes in general three phases: the assessment phase, the project preparation phase and the project implementation phase. The assessment phase is relevant to the elaboration of a “business plan” of the project. This phase needs to first of all investigate the overall framework for the development of the project in terms of applicable laws that vary from country to country and potentially from region to region, as well as identify the barriers set by this framework. Secondly, a cost effectiveness analysis needs to be performed taking into account the market potential for the exploitation of solar thermal energy in the framework of the project as well as the associated payback period. Thirdly, stakeholder involvement is necessary right from the assessment phase, including end-users for the identification of the market needs and their requirements, experts for the project specifications, and entrepreneurs and potential financiers for the project financing. The project preparation phase is relevant to the overall project study that will guide the implementation phase. This phase includes the detailed project specification, including the processes involved and different activities associated with its implementation, the relevant quality assurance mechanisms and risk management. The project implementation phase needs to deal with different issues ranging from participatory processes and awareness campaigns for making the scope of the project well known and understood by the target audiences, the application or utilisation of financial incentives both for the adoption of the project by the end users and the necessary investments, the training services as well as support services associated with the overall

436 Proceedings of International Conference for Entrepreneurship, Innovation and Regional Development
ICEIRD 2014
project and the overall evaluation of the project implementation in order to address possible risks that could jeopardise the overall project implementation. The Methodological Approach is built around specific Guidelines related to the above phases that may be utilised by the different target audiences in order to ensure an efficient project implementation and the resulting widening of the SEE solar thermal market.
Pre
para
tion
Pha
se
Imple
men
tatio
n
Pha
se
Asse
ssm
en
t
Ph
ase
Figure 1 Methodological Approach
2.1 Solar Thermal Project Assessment phase
The Project Assessment phase is quite important in order to identify whether there is a potential for a successful project in an area or not. It is actually the phase of the elaboration of a “business plan” for the specific project and needs to be undertaken in order to be possible to showcase the anticipated benefits from its implementation. It comprises the Framework Assessment, the Cost Effectiveness Analysis and the Stakeholder Involvement Guidelines. The purpose of the Framework Assessment Guideline is to investigate the overall framework for the development of the project in terms of applicable laws that vary from country to country and potentially from region to region, as well as identify the barriers set by this framework. In this context a clear and concise report should be built for the overall framework related to the specific project. The report should comprise the relevant legal framework, the potential barriers set by this framework that could influence the project implementation, and the relevant regulatory framework. This report actually describes the current status from the legislative and regulatory point of view and may dictate the need for framework condition changes. The purpose of the Cost Effectiveness Analysis Guideline is to investigate the cost effectiveness of the project, determining the potential market as well as the pay back period of the project implementation. In this context a clear and concise report should be built on the

437 Proceedings of International Conference for Entrepreneurship, Innovation and Regional Development
ICEIRD 2014
cost effectiveness of the project that would analyse the project benefits from the economical point of view. This report should analyse the status of the solar thermal market in the area of the project and sector of the project implementation, the potential for the solar thermal market growth in the area and the potential applications, the results of the market growth in terms of economic growth and employment, the results of the market growth in terms of energy savings and money savings, the results of the market growth in terms of fossil fuel and electricity independence and environmental friendliness, the investment costs associated with the project, the operative and other costs associated with the project, the available subsidies that could be utilized and the payback period of the project and return of investment. At the end of this step the Framework Assessment and the Cost Effectiveness Analysis provide the Solar Thermal Project “Business Plan”. The purpose of the Stakeholder Involvement Guideline is to involve the different stakeholders that are relevant to the project and get feedback that is necessary for the finalization of the project requirements. In this context the project requirements should be elaborated. They document should comprise: a) Feedback from the end-users of the project on the expected benefits and services from the project implementation. Depending on the project type and target audience, this feedback should come from home owners, the industry, local authorise, etc. b) Feedback from experts related to the state-of-the-art and state-of-research associated with the project implementation. Experts could come from the technical world, the academic / research world as well energy agencies and similar organisations. Results on the collaboration of experts with technology providers / installers / trade associations and also local authorities could be also useful. c) Feedback from investors and entrepreneurs associated with the project financing. Such bodies would provide input on the feasibility of the necessary investments. d) Feedback from policy makers and market operators with reference to the definition of adequate subsidy measures and policies that could enhance the solar thermal technology market.
2.2 Solar Thermal Project Preparation phase
The project preparation phase is relevant to the overall project study that will guide the implementation phase. This phase includes the detailed project specification, including the processes involved and different activities associated with its implementation, and the relevant quality assurance mechanisms and risk management. It comprises the Project Specification and the Quality Assurance and Risk Management Guidelines. The purpose of the Project Specification Guideline is to provide the detailed specification of the project. In this context a clear and concise project specification should be built, providing the details of the project implementation and the necessary processes. It should comprise the potential framework adjustments and new regulations required, the overall policy package associated with the project and its interdependencies with the legal framework at a local / regional, national and European level, the specifications of the different actions that will comprise the bundle of activities envisaged in order to both address the end-user requirements, the state-of-the-art in the market and the investment expectations, the individual sets of applications envisaged in the framework of the project as well as their expected targets, the expected solar thermal energy utilisation as a result of the project implementation. Pilot installations of solar thermal systems should point the way. The purpose of the Quality Assurance and Risk Management Guideline is to address quality assurance and risk management issues of the project implementation. In this context it should address a number of quality assurance issues and risk management concerns. Quality and risk management are quite critical for the overall trust of the targeted end-users in the adoption of solar thermal technologies. Their lack could actually jeopardize the development of the market as the example in Italy showcases. Quality assurance and risk management should identify a set or rules that should be easily understandable, immediately enforceable or enforceable after a specific compliance period, conformant with existing

438 Proceedings of International Conference for Entrepreneurship, Innovation and Regional Development
ICEIRD 2014
standardisations, with a priority to European standards, concise and comprehensive, life-cycle oriented, integrating the different implementation phases from the installation, to the operation, maintenance, and replacement or recycling, and finally service oriented in terms or required services for the overall life cycle management of the project.
2.3 Solar Thermal Project Implementation phase
The project implementation phase needs to deal with different issues ranging from participatory processes and awareness campaigns for making the scope of the project well known and understood by the target audiences, the application or utilisation of financial incentives both for the adoption of the project by the end users and the necessary investments, the training services as well as support services associated with the overall project and the overall evaluation of the project implementation in order to address possible risks that could jeopardise the overall project implementation. It comprises the Participation and Awareness Guideline, the Financial Incentives Guideline, the Training and Support Guideline and the Project Evaluation Guideline. The purpose of the Participation and Awareness Guideline is to promote the project principles towards the targeted audiences as well as to involve the stakeholders in an area. In this context a solid communication strategy for the project is needed identifying the communication objectives, the targeted audiences, the communication message, the communication events, the communication calendar, the overall communication principles. The information provided by the communication events of the project should be accurate, identifying the actual situation with reference to solar energy technologies and presenting the real overall potential of these technologies. The purpose of the Financial Incentives Guideline is to utilise the available financial tools for project financing and relevant investments as well as to establish new tools in order to promote the widening of the market. In this context it should communicate the existing mechanisms for the financing of the needed investments relevant to the solar thermal energy technologies and make them known to the targeted audiences. Such mechanisms might include loans, tax deductions, increase in depreciation rates, ESCOs, third party financing. These mechanisms could be applicable at a local, regional or national level. Projects involving policy makers could utilise subsets of such mechanisms in order to mix and match them into financing mechanism bundles applicable in their regions and associated with the individual profile of their citizens. The purpose of the Training and Support Guideline is to identify the needed services in terms of professional training and support towards the end users of solar thermal energy technologies. In this context it should deal with the training of professionals in the market. Training should review or supplement the regulatory framework, promote standardisation, promote certification of professionals and be lifelong so that professionals are regularly updated on new technologies and the state-of-the-art. Furthermore training should be provided towards the different stakeholders associated with the solar thermal market. This includes local authorities, policy makers, end users, etc. They should be trained on the overall framework of the solar thermal technology market as well as on the different tools that may be used for its adoption. Training professionals on one hand and the different stakeholders involved in the promotion and adoption of solar thermal energy applications on the other is expected to generate the needed bundle of services for the life cycle support of solar thermal systems towards the end users. Finally the Project Evaluation Guideline is relevant to the evaluation of the project implementation in terms of specific quantitative and qualitative results. In this context it should create a mechanism that could evaluate the overall project effectiveness. The evaluation should be related to the overall energy and money savings, the overall end user satisfaction, the targeted audience involvement, the environmental impact of the project, the impact of the project to the economic growth of an area.

439 Proceedings of International Conference for Entrepreneurship, Innovation and Regional Development
ICEIRD 2014
3. Lessons Learned and Suggestions
The aforementioned methodology was enforced in the South East Europe area through specific actions in different South East Europe countries [4]. Installation Campaigns took place in Italy, Romania and Hungary. Training Campaigns took place in Italy, Romania, Hungary, Slovenia, Ukraine and Croatia. Awareness Campaigns tool place in Italy, Romania, Hungary, Slovenia, Ukraine and FYROM. The Methodology alongside the necessary training, installation and awareness material as well as developed ICT tools such as the “Solar Thermal Calculator”, a web-enabled tool allowing the calculation of conventional fuel energy savings and GHG emissions avoided by the installation in a specific area of a solar thermal system, constitute the DHW Beneficiary Framework that was utilized for the implementation of the aforementioned Campaigns in the different countries. The campaign results validated the Methodology. Based on this validation some hints are presented on what is noteworthy in a future Solar Thermal Project.
3.1 Framework Assessment
The framework assessment should integrate policies at all levels: EU, national, regional and local. Different available tools such as the Covenant of Mayors or Energy Action Plans could help speed up framework assessment activities. Administrative barriers have been identified in many countries of the SEE area. Interminable approval procedures present a big problem, mainly attributed to the involvement of several administration offices to different steps of the approval procedure. One possible solution could be the establishment of one-stop-shop centralized control mechanism bearing the overall responsibility for the overall procedure. Knowledge on the different procedures and opportunities associated with the solar thermal market is scattered; an inventory of procedures per country could be helpful.
3.2 Cost Effectiveness Analysis
Utilization of energy cost estimation IT tools by the public could be helpful. Such a tool has been developed in the framework of the project (Solar Calculator Tool). Stakeholders like energy agencies could develop and utilize such tools offering a calculation of the cost effectiveness of solar thermal energy. Financial incentives have to be ascertained in developing and low GDP per capita countries providing subsidies to the general population so that the solar thermal market may be enhanced. Similarly, financial incentives focusing on low income families should be provided for more developed countries. There is a significant difference with reference to the affordability of solar thermal technologies by the ordinary citizen in the different countries of South East Europe. In most countries (Croatia, Ukraine, Romania) the cost is not affordable making subsidy policies mandatory. In other counties like Italy the cost is affordable, yet financial mechanisms are supportive. A key of success for financial incentives is their continuity, especially in the case of tax deductions. Consumer behaviour plays quite an important role in the selection of potentially smaller and more cost effective solar thermal systems, and should thus be taken into account in cost effectiveness analysis. Different tools could be utilized for financing training or awareness campaigns on solar thermal technologies. European Solar Days, a campaign initiative financed by the Intelligent Europe program, could be such a tool.

440 Proceedings of International Conference for Entrepreneurship, Innovation and Regional Development
ICEIRD 2014
3.3 Stakeholder Involvement
Involvement of the large mass of end users is critical. It should enhance their sense of ownership of the project through an adequate participatory process and not just an information campaign. It should raise their ecological consciousness so that the environmental impact of the project is addressed further to its pure economic impact. Growing conventional fuel prices and economic crisis combined with ecological consciousness could create the needed motivation for widening the market. The utilization of social media could be utilized so that a participatory process and not just an awareness / information campaign is launched. Utilizing the “collective intelligence” on the issue could provide valuable feedback and make citizens part of the solution. Involvement of the technical world is also mandatory, so that they are lifelong trained and kept aware of evolutions in the market as well as new advanced in technology that their clients could benefit from. Most of the SEE countries have a solid professional base with reference to solar thermal which has nevertheless to be enhanced. Involvement of municipalities and local authorities should be also sought as they represent an important stakeholder for the development of regional energy strategies and are a proper partner for demonstration projects. Involvement of educational and vocational training organizations which will train the professionals on new technologies and practices on the installation of solar thermal systems should be also sought. In this concept, training certificates could be valuable markers for the successful selection of technical stakeholders. The current status of individual markets related to solar thermal market development has to be taken into account. The more developed a market is the more space exists for promotion of technologies to deal with further end user needs such as space heating, space cooling, pool heating, etc or even power production. On the other hand developing markets should place their entire focus on more conventional applications.
3.4 Project Specification
The potential framework should integrate European / Regional and Local Policies and also address financial incentive issues for the promotion of solar thermal technologies towards local communities. Commitment of Local Authorities is essential. Especially in most of the East Europe countries, a certification system for the quality of solar thermal infrastructure installation represents a major need and will strengthen the Local Policies and ensure the energy gain goals. Most countries in the South East Europe area have adjusted their legislation to the legislation of the EC or are in the route of doing so (e.g. Ukraine). This adjustment has to be followed by specific lasting implementing measures that will make this framework sufficient for enhancing the market opening and enlargement. Even in major EC countries a need for change in measures is identified for the purpose of not having all subsidies absorbed for instance by a few projects. Some useful pilot examples that could serve as promoters are: solar thermal systems to produce hot sanitary water in an eco-sustainable holiday farm, in a sport structure for showers, in the hotels along the coast and in the bathhouses.
3.5 Quality Assurance and Risk Management
The overall framework to support quality in the utilisation of solar thermal technologies should comprise Quality Specifications, Certification of Installers, Training and Technical Assistance.

441 Proceedings of International Conference for Entrepreneurship, Innovation and Regional Development
ICEIRD 2014
Tools for the support of risk assessment and management include: Individual Seals of quality for separate components of solar thermal systems, Adaptation of guarantee certificates (Solar Keymark or national level certificates like Solar Pass in Italy), Placing the Target towards the overall certification of the entire system, Analysis and comparison of “do-it-yourself constructions” versus “Plug & Play” systems, the creation of a Quality Assurance Guideline and a Technical Handbook to ensure efficient solar thermal systems, Lifecycle guarantee specifications, Payment of subsidies after and only if the efficiency of the system is guaranteed.
3.6 Participation and Awareness
The nature of the solar thermal dissemination theme is both favorable for wide dissemination in the general public as well as for targeted awareness campaigns focusing on specific audience segments. A right mix of wide dissemination and targeted awareness activities should be sought. A special audience segment should be that of schools. Being the citizens of tomorrow, the young pupils are an ideal audience for any action that needs a medium – long term attendance. Focusing on schools for the promotion of energy related issues and especially solar thermal technologies provides an interesting theme that is quite appealing for pupils and their teachers, and could help develop a positive attitude toward solar thermal technologies. Emphasis should be put on specific elements such as raising ecological consciousness of the wide public, showing the people the advantages of the possibility for particulate independency from energy imports, enhancing the sense of ownership of the project by the public (participatory process), raising awareness on cost effectiveness of Solar Thermal Energy through special IT tools, providing adequate Information to house owners (basic technological information, template for economical assessment); outline the benefits of solar thermal technologies: independency, environmental friendliness, economical efficient. Pilot demonstration projects could actively promote Solar Thermal technologies in existing buildings and for new uses of Solar Thermal technologies: e.g. cooling, pool heating. Information activities at a demonstration plant could provide some “look & feel” event to the target audience. Participation in exhibitions can be quite successful. Aligning with companies / industry can be quite beneficial also providing the necessary equipment (solar thermal technology exhibits) to attract many people. Advertisement is also critical in order to involve a large audience. Appearances on press or on mass transport media of positive messages may change the overall attitude of the population towards energy issues in general and solar thermal energy in particular.
3.7 Financial Incentives
An analysis of the subsidy funds and procedures in each country has to be performed. This knowledge should be communicated to the targeted audiences. Hysteresis in funding mechanisms / schemes has to be effectively addressed. Subsidies for solar thermal systems have to be created / revised in many countries of the SEE area. Some usable potential for their financing could come from e.g. the taxation of fossil fuels. Successful incentives that could widen the solar thermal market include: incentives for local authorities to offer RES services (altering bureaucratic model of buildings management), incentives for rural areas / agriculture / rural tourism to exploit RES, incentives for installation of RES in new buildings (example Greek regulation that 60% of hot water production in new buildings should be attributed to RES), incentives to promote Solar Thermal technologies in existing buildings, and in the case of developed markets for new uses of Solar Thermal

442 Proceedings of International Conference for Entrepreneurship, Innovation and Regional Development
ICEIRD 2014
technologies: e.g. Cooling, pool heating, tax deduction of the installation solar thermal infrastructure, funding programs for residential installation of solar thermal systems.
3.8 Training and Support
Services that need to be supported include Quality Specifications, Certification of Installers, Training and Technical Assistance. Collaboration of experts (energy agencies / engineers) with installers / companies / trade associations and also local authorities is also important. Individual education in solar thermal techniques could be provided by designers in each country, capitalizing on their expertise and know-how. Education towards young people that become thus acquainted with solar thermal technologies could be promising for their future adoption of such technologies as citizens. The need to train professionals is profound. Although the technical base exists and is considered sufficient in different countries of the SEE, there is a need to offer lifelong training so that they may cope with the change of technologies and efficiently contribute to the opening of the market. Training public employees dealing with solar thermal technology issues is also deemed of very high importance, as bureaucracy poses a major threat for the development of the market. Making public employees in energy agencies or regional / local energy offices or local administration aware of the importance of solar thermal technologies is a first step towards designing adequate policies for widening the market in SEE. Altering public procurement could be also affected through public employee training. Certification is also an important issue that is absent from many countries. Certification and energy labelling could also help towards improving the market in SEE.
3.9 Project Evaluation
Energy agencies with enhanced activities could be of help, evaluating the potential of solar thermal systems for individual customers (house owners, companies, ect) and retaining the data of each system for further use. Tools could be utilized in order to support the evaluation of the solar thermal projects with reference to e.g. cost effectiveness. The evaluation team must involve experts from all the involved technological and administration fields during the installation of the project. Thus, experienced engineers on the installation of solar thermal systems must cooperate with financial consultants and experts on policy strategies at different levels (European, national and local levels).
4. Conclusions
A methodological approach for elaborating solar thermal projects is detailed divided into three phases: the assessment phase, the project preparation phase and the project implementation phase. Each phase is supported by a number of specific guidelines. The methodology has been validated in a number of pilot activities in different countries of the South East Europe area. Specific suggestions and lessons learned out of this validation are presented. The aim of the methodology is to provide the involved stakeholders in the solar thermal market development effort with the necessary guidelines so that the market is enlarged in the area of South East Europe. Home owner awareness, training of professionals and financial incentives setting up are the three essential pillars that could tear down the existing barriers for the wider development of the solar thermal market.

443 Proceedings of International Conference for Entrepreneurship, Innovation and Regional Development
ICEIRD 2014
References
1 EGL (2012), Maps of European Energy: Infrastructures, Volumes and Regulatory Framework. 2 EUROPEAN COMMISSION (2011), A resource-efficient Europe – Flagship initiative under the
Europe 2020 Strategy (COM(2011) 21). 3 WidetheSEEbySuccMod project – Methodological Guide for Widening the Solar Thermal Market 4 WidetheSEEbySuccMod project – Solar DHW Green Paper


445
INNOVATION PROCESSES IN SERVICES


447 Proceedings of International Conference for Entrepreneurship, Innovation and Regional Development
ICEIRD 2014
REDUCING SKILLS MISMATCH AS A KEY FOR INCREASING THE REGIONAL COMPETITIVENESS OF WOMEN ENTREPRENEURS IN SEE
Bojan R. Jovanovski1, Igor Nikoloski2, Radmil Polenakovik3, Trajce Velkovski4, Emilija Nikoloska5, 1Faculty of Mechanical Engineering, Ss. Cyril and Methodius University in Skopje, Karposh 2 b.b.,1000 Skopje, Macedonia, [email protected]
2South East European Centre for Entrepreneurial Learning, Selska Cesta 217/IV, Zagreb, Croatia, [email protected]
3Faculty of Mechanical Engineering, Ss. Cyril and Methodius University in Skopje, Karposh 2 b.b.,1000 Skopje, Macedonia, [email protected]
4Faculty of Mechanical Engineering, Ss. Cyril and Methodius University in Skopje, Karposh 2 b.b.,1000 Skopje, Macedonia, [email protected]
5Centre for Adult Education, Ministry of Education and Science of Republic of Macedonia, Vasil Gjorgov 35, 1000 Skopje, Macedonia, [email protected]
This paper is presenting a verified methodology for conducting comparative analysis of the skills mismatch in companies owned and manag ed by women entrepreneurs in South East Europe. The research was conducted in Al bania, Bosnia and Herzegovina, Croatia, Kosovo, Macedonia, Moldova, Montenegro, Se rbia and Turkey, collecting data on the networking activities, access to finance and human resource development of 1856 companies. The results present a benchmark bet ween the countries and offer a comparison of the characteristics of companies with different sizes functioning in different sectors of operation. The main focus of t his paper is set at the gap between the existing skills, the required ones and the skil ls expected in the future of both the business leaders and the other employees as one of the key factors for increasing the competitiveness of the companies in the region. The presented outcomes offer analysis of women’s entrepreneurs’ perception for t he business impact areas, the importance of the training topics, and the future p laned areas for development presented by country, company size and sector of op eration. This paper also stresses that creating and obtaining human capital equipped with new knowledge, skills to introduce new methods and flexibility to adapt in n ew environment is crucial for supporting companies’ growth and development, prese nting the training and skills development strategy as an indispensable path. This paper concludes with the importance of the training needs analysis for achie ving greater system efficiency, focusing resources to the crucial topics for develo pment.

448 Proceedings of International Conference for Entrepreneurship, Innovation and Regional Development
ICEIRD 2014
Keywords
women entrepreneurship, training needs analysis, skills mismatch, increasing competitiveness, human resource development
1. Introduction
The development of the Small and Medium sized Enterprise (SME) sector is the backbone of every economy. This sector represents more than 99% of all enterprises in the EU economy [1]. The European Commission recognises that entrepreneurship and small businesses are a key source of new jobs, business dynamism and innovation, and that promoting entrepreneurship is a clear objective for achieving the Lisbon goals (to make EU the most competitive and dynamic knowledge-based economy in the world capable of sustainable economic growth). Women entrepreneurship is also important to the EU for both gender equality and economic growth. ”In terms of policy recommendations, stakeholders underline the importance of more reliable data on which to base policies, as well as the reinforcement of support structures for female entrepreneurs such as the provision of information and training, business networks, business support services, and facilitating access to both human and financial capital for women” [2]. The Global Entrepreneurship Monitor has shown that an average entrepreneur is twice more likely to be male than female [3], which indicates that it is necessary to address women entrepreneurs as a specific target group in order to provide custom made support for starting and growing of their businesses. According to the study undertaken by the European Commission in 2008 on women innovators and entrepreneurs [4] three types of women's obstacles to innovative entrepreneurship were identified:
1. Contextual obstacles: educational choices, traditional views and stereotypes about women, science and innovation;
2. Economic obstacles: innovation sector requiring substantial investment and women being seen less credible financially than men;
3. Soft obstacles: lack of access to technical scientific and general business networks, lack of business training, role models and entrepreneurial skills;
Based on this, the third group, soft obstacles, plays an important role in lacking the women willing to foster and expand businesses. Due to this, according to the EU Small Business Act for Europe [5], the skills mismatch is going to stay very high in the EU agenda, which was confirmed in the EU 2020 Strategy documents. By renewed emphasis by current European Commission policies for a more entrepreneurial Europe and for women entrepreneurship as a priority pillar within the SBA (Small Business Act), ensuring policy alignment, monitoring systems and support frameworks for women's entrepreneurship requires a concerted commitment by all pre-accession countries to bring forward and ensure improvements in women's employment and participation in the economy.
2. Research methodology and sample
The research has been conducted for the needs of the South East European Centre for Entrepreneurial Learning, in the nine countries in the region by the regional working group. The research methodology including the survey questionnaire have been developed based on the examination of good practices training needs analysis (TNA) such as the Training Needs Analysis for SMEs – Western Balkans and Turkey Experience providing experience for sampling in the region [6]. The designed methodology and sampling procedure was verified by the working group.

449 Proceedings of International Conference for Entrepreneurship, Innovation and Regional Development
ICEIRD 2014
The data was collected through online survey, which was translated into the targeted countries’ languages. Each working group member, in cooperation with women business support organizations in the respective country, promoted and supervised the implementation of the survey process. In total 1856 acceptable questionnaires were filled in the data base, with the following distribution per country: Albania 201 questionnaires, Bosnia and Herzegovina 136, Croatia 282, Kosovo* 202, Macedonia 209, Moldova 206, Montenegro 182, Serbia 203 and Turkey 235 questionnaires.
Table 1 Number of SMEs per country and NACE sectors
NA
CE
Sec
tors
(ve
rsio
n 2)
Agr
icul
ture
, for
estr
y an
d fis
hing
Min
ing
and
quar
ryin
g
Man
ufac
turin
g
Ele
ctric
ity, g
as, s
team
and
air
cond
ition
ing
supp
ly
Man
agem
ent a
nd r
emed
iatio
n ac
tiviti
es
Con
stru
ctio
n
Who
lesa
le a
nd r
etai
l tra
de; r
epai
r of
mot
or v
ehic
les
and
mot
orcy
cles
Tra
nspo
rtat
ion
and
stor
age
Acc
omm
odat
ion
and
food
ser
vice
ac
tiviti
es
Info
rmat
ion
and
com
mun
icat
ion
Fin
anci
al a
nd in
sura
nce
activ
ities
Rea
l est
ate
activ
ities
Pro
fess
iona
l, sc
ient
ific,
tech
nica
l an
d su
ppor
t ser
vice
act
iviti
es
Edu
catio
n
Hea
lth
Art
s, e
nter
tain
men
t and
rec
reat
ion
Tot
al
ALB 11 2 28 1 5 7 16 4 20 15 8 6 23 18 19 18 201 Micro 5 6 3 11 4 8 9 5 4 12 5 14 15 101 Small 6 2 9 1 5 4 4 10 6 3 2 10 11 5 3 81 Medium 13
1 2 1 2 19
BIH 10 24 1 2 6 22 3 9 13 8 4 13 9 3 9 136 Micro 7 8 1 4 16 1 7 6 4 2 9 8 3 8 84 Small 3 11 2 2 6 1 2 6 4 2 3 1 43 Medium 5 1 1 1 1 9 HRV 8 16 1 1 20 43 3 12 22 24 4 82 14 12 20 282 Micro 6 10 1 1 16 38 3 11 20 23 4 72 12 7 20 244 Small 4 4 4 1 2 1 10 2 5 33 Medium 2 2 1 5 KOS 30 28 1 43 17 4 1 1 37 17 17 6 202 Micro 29 28 1 42 15 4 1 1 36 17 17 6 197 Small 1 1 2 1 5 MKD 12 2 12 2 1 8 33 10 14 19 10 7 30 11 17 21 209 Micro 8 1 5 1 2 27 5 8 16 10 6 25 6 12 19 151 Small 4 1 7 1 1 6 4 5 6 3 1 5 4 4 2 54 Medium 2 1 1 4 MDA 22 1 23 2 11 53 5 25 7 4 2 16 14 12 9 206 Micro 13 11 1 2 31 2 10 5 4 2 14 10 6 6 117 Small 8 1 11 1 8 15 3 15 2 2 4 5 3 78 Medium 1 1 1 7 1 11 MNE 2 11 10 37 4 10 10 16 18 24 8 26 6 182 Micro 2 9 8 30 3 9 10 15 18 23 6 23 6 162 Small 2 2 6 1 1 1 1 2 3 19 Medium 1 1 SRB 14 21 2 2 11 35 10 14 16 10 5 30 12 7 14 203 Micro 11 6 1 6 26 5 6 9 10 4 26 7 2 12 131 Small 3 12 2 2 4 5 7 3 1 2 5 3 2 51 Medium 3 1 5 3 1 4 2 2 21 TUR 7 5 41 4 2 28 19 5 16 12 16 5 16 19 21 19 235 Micro 2 2 10 1 15 13 1 6 6 14 4 13 5 15 11 118 Small 5 2 14 3 2 9 5 2 8 6 2 1 3 10 5 8 85 Medium 1 17 4 1 2 2 4 1 32 Total 116 10 204 11 15 102 301 44 137 118 97 52 271 122 134 122 1856
* This designation is without prejudice to positions on status, and is in line with UNSCR 1244 and the ICJ Opinion on the Kosovo Declaration
of independence

450 Proceedings of International Conference for Entrepreneurship, Innovation and Regional Development
ICEIRD 2014
The surveyed companies have been classified according to the sector of their main activities in line with the Statistical classification of economic activities (NACE rev. 2). The sample has been classified in the following way: 16% of all participants are coming from the Wholesale and retail trade, repair of motor vehicles and motorcycles, followed by Professional, scientific, technical and support service activities (15%) and Manufacturing sector (11%). Companies from Mining and quarrying, Electricity, gas, steam and air conditioning supply and Water supply, sewerage, waste management and remediation activities were least present, with representation of only 2% for the three sectors together. There was no sector which was not represented in the survey. It is evident that most of women entrepreneurs operate in traditional sectors such as sales and trade, manufacturing and tourism sectors. Micro enterprises from SEE countries are mainly active in Sale and retail sector (18%), Professional, scientific, technical and support service activities sector (18%) and Arts, entertainment and recreation (8%). In small enterprises, the most representative sector among women entrepreneurs is Manufacturing (16%), followed by Hospitality sector (12%) and Sale and trade (11%). The analysis of the medium sized enterprises owned and managed by female entrepreneurs show that the most representative sector is Manufacturing (38%), followed by Wholesale and retail trade (16%), and Construction sector (10%). The size of a country always plays role when it comes to different group sizes of the enterprises. In other words, in smaller countries, the representation of micro enterprises is larger (Kosovo*, Macedonia** and Montenegro), compared to larger countries where number of medium enterprises is larger (Turkey and Serbia).
3. Key finings
The analysis of the respective variables has shown that in significant part of the surveyed companies, the identified problems in the business development are not respectively addressed by organized or/and planned training activities of the management or the staff of the companies. These finding were compared with specific country’s results from a research conducted in 2010, confirming the consistency in the dominant problematic areas and areas of interest for the women entrepreneurs [7]. The key findings regarding this issue will be presented in this part of the paper. The women entrepreneurs have stressed (Figure 1) that the increase of competition, the need of improvement of quality, the attitudes and working behaviour of the employees and the access to finance and capital are the most important areas with the strongest impact on the enterprise operation. On the other hand, they have stated that the change of top management, adaptation to environmental factors, the increase of industrial accidents and the technological changes do not influence the business performance at all compared to other factors/areas.
* This designation is without prejudice to positions on status, and is in line with UNSCR 1244 and the ICJ Opinion on the Kosovo Declaration
of independence **
the former Yugoslav Republic
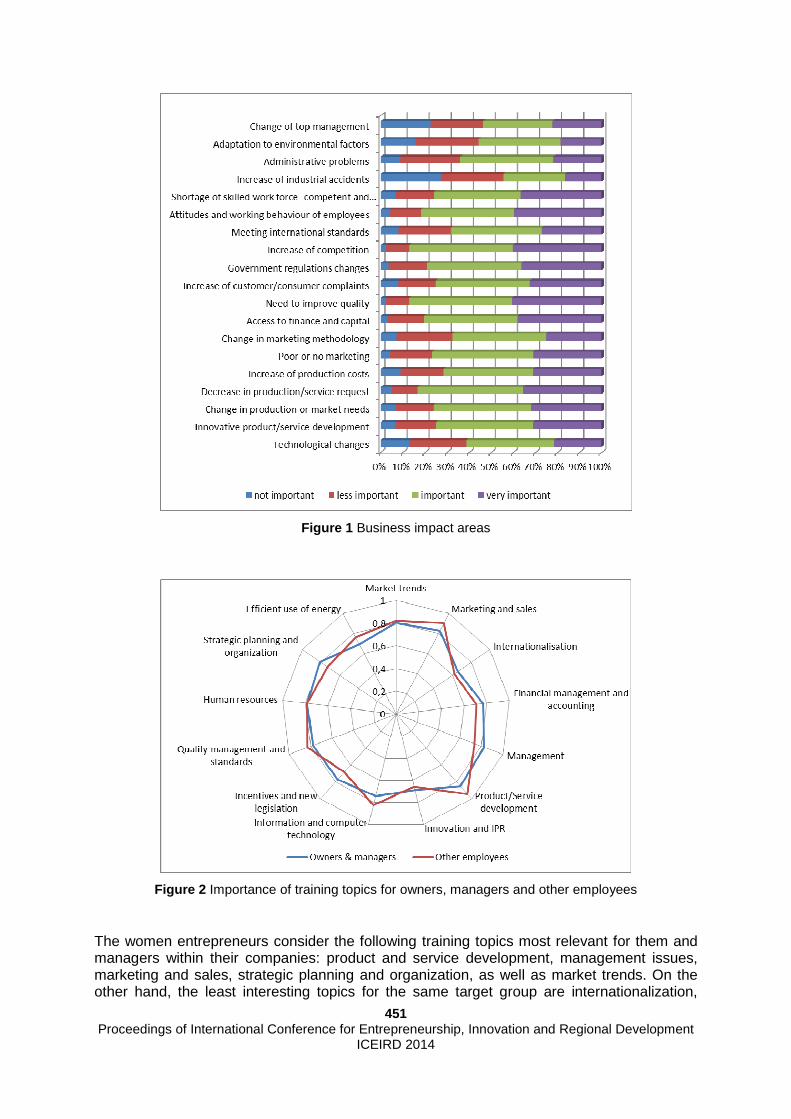
451 Proceedings of International Conference for Entrepreneurship, Innovation and Regional Development
ICEIRD 2014
Figure 1 Business impact areas
Figure 2 Importance of training topics for owners, managers and other employees
The women entrepreneurs consider the following training topics most relevant for them and managers within their companies: product and service development, management issues, marketing and sales, strategic planning and organization, as well as market trends. On the other hand, the least interesting topics for the same target group are internationalization,

452 Proceedings of International Conference for Entrepreneurship, Innovation and Regional Development
ICEIRD 2014
innovation and intellectual property rights, and efficient use of energy. This confirms that the most important training topics for owners and managers concern the general development of the company, by improving the strategic and critical thinking and the managerial skills in order to be able to run the company. Trainings focusing on development of specific skills are not the main interest for the management of the companies. On the other hand, the respondents consider the trainings in product and service development, marketing and sales and market trends as the most important for the development of their employees. As less important topics they identified the following: internationalization, financial management and accounting, management, as well as trainings regarding incentives and new legislation. The comparison between these two categories of employees (owners and managers vs. other employees) shows that apart from the trainings for human resources, for all other trainings there is a difference in the importance of the topics for the managerial and non-managerial staff. The largest deviation is evident in case of trainings on the management and the information and computer technology. The main organizational benefits acquired through training programmes are the following - received useful/applicable information, increased quality, improved skill level, increased competitiveness, etc. Increasing the foreign market share has been rated as the least important benefit, followed by setting up a business plan, increased employment opportunities and increased environmental consequences.
Figure 3 Required training for development of owners, managers and other employees
Women owners and managers have rated all proposed topics as very important, especially customer oriented services (93%), leadership and motivation (90%) and presentation skills (87%), except the mathematical-numerical skills, which is rated as least important. On the other hand, the respondents consider that the skills of their employees regarding customer oriented services are the most important for business development. Development skills programmes related to EU legislation and directives; mathematical-numerical skills;

453 Proceedings of International Conference for Entrepreneurship, Innovation and Regional Development
ICEIRD 2014
finance, accounting and controlling, as well as organization and management, are considered as the least important topics. This shows that employees are also interested in how to approach the customers and how to provide them with what they need. The reason is simple: if the customers are satisfied, the company will remain in business and employees will continue working in that company: otherwise, they would have to look for other employment opportunities. Mathematical and numerical skills have been identified as least important by both groups.
Figure 4 Most important functional areas for development of owners and managers in the near future
per country
The women owners and managers are mainly interested in training topics that can improve their own company development and the development of other managers. The regional overview shows that women entrepreneurs are interested in different skills development programmes in different countries. Although owners and managers from all countries have confirmed that improvement of management skills (organization and management, leading and motivating) and presentation skills are the most important for them, still women entrepreneurs from Bosnia and Herzegovina, Kosovo* and Serbia are less interested in participating in some skills development programmes compared to entrepreneurs in Croatia, Macedonia** and Moldova. This shows that awareness among women entrepreneurs in these (last group of) countries is on the higher level and compared to other countries, entrepreneurs from Croatia, Macedonia** and Moldova have experienced more benefits using the skills development programmes. It can be also argued that quality of training providers and services in these countries is above the regional average level.
* This designation is without prejudice to positions on status, and is in line with UNSCR 1244 and the ICJ Opinion on the Kosovo Declaration
of independence **
the former Yugoslav Republic **
the former Yugoslav Republic

454 Proceedings of International Conference for Entrepreneurship, Innovation and Regional Development
ICEIRD 2014
Table 2 Most important functional areas for development in the near future per country and company size
Size First priority Second priority Third priority
ALB
Micro Services and maintaining oriented towards customer
Leading and motivating Presentational skills
Small Leading and motivating Services and maintaining oriented towards customer
Conflict and problem solving
Medium Information, knowledge and skills
Services and maintaining oriented towards customer Leading and motivating
BIH
Micro Leading and motivating Finance, accounting and controlling
Organisation and management
Small Leading and motivating Organisation and management Finance, accounting and controlling
Medium Information, knowledge and skills
Finance, accounting and controlling
Leading and motivating
HRV
Micro Information knowledge and skills
Information and general culture Services and maintaining oriented towards customer
Small Leading and motivating Finance, accounting and controlling
Following national legislation
Medium Services and maintaining oriented towards customer
Following EU legislation and directives
Organisation and management
KOS Micro Presentational skills
Services and maintaining oriented towards customer
Leading and motivating
Small Leading and motivating Finance, accounting and controlling
Organisation and management
MKD
Micro
Services and maintaining oriented towards customer
Organisation and management Presentational skills
Small Services and maintaining oriented towards customer
Organisation and management Written/oral communication on foreign language
Medium Information, knowledge and skills
Written/oral communication on mother language
Leading and motivating
MDA
Micro Services and maintaining oriented towards customer
Administrative knowledge and skills
Finance, accounting and controlling
Small Leading and motivating Organisation and management Administrative knowledge and skills
Medium Administrative knowledge and skills
Following national legislation Finance, accounting and controlling
MNE
Micro Services and maintaining oriented towards customer
Organisation and management Leading and motivating
Small Finance, accounting and controlling
Services and maintaining oriented towards customer
Leading and motivating
Medium Following EU legislation and directives
Written/oral communication on mother language
Finance, accounting and controlling
SRB
Micro Services and maintaining oriented towards customer
Information knowledge and skills
Organisation and management
Small Organisation and management
Presentational skills Information knowledge and skills
Medium Leading and motivating Finance, accounting and controlling
Organisation and management
TUR
Micro Conflict and problem solving Leading and motivating
Services and maintaining oriented towards customer
Small Leading and motivating Organisation and management Following national legislation
Medium Leading and motivating Conflict and problem solving Organisation and management

455 Proceedings of International Conference for Entrepreneurship, Innovation and Regional Development
ICEIRD 2014
The training programmes also differ depending on the size of the enterprise. In five countries (Albania, Macedonia**, Moldova, Montenegro and Serbia), the area related to services and maintaining oriented towards customer has been identified as the most important for the future among micro sized women owned businesses. This shows that micro enterprises indeed are mainly operating in sectors related to services and maintaining and that in the future they will have to improve their skills in order to cope with the customers’ needs and requirements. When it comes to the small enterprises, leading and motivating area has been identified as the most important among women entrepreneurs in six countries. As companies grow and they start to employ new staff, their priorities shifts as well. In the future, micro enterprises should work more on the development of their characteristics as leaders in the market and to learn how to introduce new programmes and incentives to motivate their employees. Finally, the area related to information, knowledge and skills development has been identified as the most prioritised by medium women owned enterprises in the region. Sharing and acquiring the needed information (i.e. different markets, internationalisation, etc.), increasing of knowledge and skills development are identified as the future’s most needed areas of intervention, since those skills will help medium companies become more competitive and compete with other players on domestic and foreign markets.
3. Conclusions and recommendations
Training is a fundamental element in fostering the competitiveness of women entrepreneurs and an instrument which supports companies’ growth and development [8]. The system analyses of the training needs are essential in order to design the training in such a manner that is tailored specifically to the existing enterprises’ needs. This eliminates provision of training which is overabundant and increases provision of training which is lacking - thus resulting in greater system efficiency. Women entrepreneurs’ perception of the importance of the trainings and human resource development activities is much higher for the managing staff, than for the other employees. This is partially because of the lack of awareness of the importance of the strategy for human resource development for the achievement of the company’s overall strategy. Most of the companies do not have official human resources development strategy, or it is not based on a systematic approach that integrates all company aspects. Although the most problematic area, “increase of competition”, has been tackled by planned respective trainings by most of the respondents, problematic areas such as “need of improvement of quality” and “access to finance and capital” are still far from the skills development agendas of the companies in the targeted region. If companies in the region plan to compete outside of their local and national markets (especially those which expect to be considered as an equal competitor at the European level), they have to:
• set human resources development strategy as a part of the general strategy of the company
• develop short, middle and long terms human resources plans • change the perception and realise that investment in skills and knowledge is not a
cost, but rather an increase of the intangible assets of the company • implement system of systematization of new knowledge and its dissemination around
the company. In a chaining global environment, only companies equipped with human capital which are capable to adopt changes, acquire new knowledge and introduce new methods, will be able to compete and survive in the market. **
the former Yugoslav Republic

456 Proceedings of International Conference for Entrepreneurship, Innovation and Regional Development
ICEIRD 2014
Acknowledgement:
The authors are expressing sincere gratitude to the South East European Centre for Entrepreneurial Learning (SEECEL) for the support and guidance during the implementation of this research. This activity was part of the project Women Entrepreneurship: A Job Creation Engine for South East Europe implemented by SEECEL and Gender Task Force, funded by the Swedish International Development Agency and coordinated by Regional Cooperation Council.
References
1 http://ec.europa.eu/enterprise/policies/sme/facts-figures-analysis/, 2013 September 2 http://libraryeuroparl.wordpress.com/2013/05/15/womens-entrepreneurship-in-the-eu/, 2013
September 3 Lazarevska T, Nedanoski L, Mihailovski G, Polenakovik R, Kurciev A, Jovanovski B, Velkovski T,
Jovanoski B. ENTREPRENEURSHIP in Macedonia: part of the Global Entrepreneurship Monitor, Macedonian Enterprise Development Foundation, 2008
4 Creating an enabling environment for female entrepreneurship in the EU pre-accession region, Istanbul indicators, European Training Foundation, 2008
5 Communication from the commission to the council, the European Parliament, the European Economic and Social Committee and the Committee of the Regions: “Think Small First” - A “Small Business Act” for Europe, Commission of the European Communities, 2008
6 Heder E, Ljubic M. Training Needs Analysis for SMEs – Western Balkans and Turkey Experience, South East European Centre for Entrepreneurial Learning, 2013; 18-26 and 108
7 Polanakovik R, Jovanovski B, Velkovski T, Delovska B, Gotovska E. Research on women entrepreneurship in Republic of Macedonia – Women Entrepreneurs in Republic of Macedonia, National Centre for Development of Innovation and Entrepreneurial Learning, 2010, 71 - 77
8 Jovanovski B, Nikoloski I, Polenakovik R, Velkovski T, Nikoloska E. Training Needs of Women Entrepreneurs in the Western Balkans, Turkey and Moldova, Mechanical engineering – scientific journal, accepted to be published in volume 32, 2014

457 Proceedings of International Conference for Entrepreneurship, Innovation and Regional Development
ICEIRD 2014
Tires recycling
Rados Vorkapic, Rade Vorkapic Rados Vorkapic, Zivka Davidovica 87, Belgrade, Serbia, [email protected] Rade Vorkapic, Ivana Dzaje 8, Belgrade, [email protected]
Abstract
Control of waste tires utilization in Serbia is an issue that has not been solved up to now as
the bulk of the used tires is used as the fuel in cement factories. Furthermore, recycling
processes in use nowadays worldwide, are not adequate from the standpoint of protection
and preservation of the environment as well as profitability of the processes itself. Detailed
researches have been performed in order to improving the existing pyrolitic recycling
processes for the waste tires in a safe and environmental friendly way.
This process allows significantly higher liquid hydrocarbon yield, i.e. 40 to 45% wt, to other
known recycling tires process.
Furthermore, this process enables complete rubber decomposition to the commercial
components. Process itself is safe for the environment as no gas or liquid by/products are
sent to the air and/or waste water system. At the outlet of this new technological process for
rubber recycling, the following products are obtained: Fuel gas, Naphtha, Light Gas Oil,
Industrial carbon black, and Steel metal waste. Developed process is thermally almost
independent, which means that necessary energy is provided from process itself.
Researches and all relevant technical-technological data regarding this process are checked
at the constructed pilot plant.
Results of these researches in the form of new developed technological process for complete
decomposition of waste tires into valuable commercial components are shown. Besides
environmental effectiveness characteristics, erection of the plant for waste tires recycling as
per this technology, would contribute to achieving the significant economic efficiency
Keywords Development, , Entrepreneurship, Innovation, Recycling, R&D, 1. Introduction Tons of waste rubber and plastic are disposed on waste-dumps as well as all over
the environment on the territory of Serbia. Solving this problem presents both
environmental and financial challenge. This paper will show new process for waste

458 Proceedings of International Conference for Entrepreneurship, Innovation and Regional Development
ICEIRD 2014
rubber recycling up to the commercial components (fuel gas, naphtha, diesel fraction,
industrial carbon black and steel metal waste) in safe and environmental friendly way.
Research and all relevant technical – technological data related to this process are checked
at constructed pilot plant. Investments in construction of the unit for spent rubber recycling
are justified, which will be pointed out by executed financial plan for construction and
commissioning of such unit at municipal territory of Belgrade, near the city waste-dumps in
Vinca.
Detailed researches have been performed in order to improve the existing way of spent
rubber recycling in a safe and friendly environmental way. Results of those researches in the
form of new developed technological process for complete decomposition of waste rubber
into high commercial components are shown. Besides environmental benefits, construction
of the unit for waste rubber recycling in Serbia (and other countries) would contribute to
achieving the economic efficiency.
2. Spent rubber recycling process 2.1 The As/is Situation Technological processes of rubber and plastic recycling, which are used today, basically
start with rubber shredding. Material, i.e. rubber and/or tires is cut into small pieces.
Obtained pieces are sent through the series of granulators, where their size continues to
reduce in accordance with their intended usage. Usage of cut pieces of rubber and plastic is various. So, for example, rubber pieces can be
used as filler in civil engineering and building construction. Fine-pulverized and screened
rubber mixed with polyurethane, can be used as base on children playgrounds. Granules
can be used for improved quality asphalt, while rubber mixed with polyurethane can be used
for setting-up the athletic tracks. Also, it is possible to integrate the rubber parts with soil, i.e.
grassy surfaces. In that way the water flow through the soil is improved and the need for
water, fertilizers and pesticides is reduced within 25 to 50 years. Rough pieces of rubber can
be used for obtaining the energy in furnaces for cement production, paper production, etc. It
should be emphasized that rubber is, nowadays, frequently burnt while still in large pieces,
by which the costs of pulverization are avoided, but on the other hand, the costs of storage
and transportation are increased followed by inevitable negative effects on the environment.

459 Proceedings of International Conference for Entrepreneurship, Innovation and Regional Development
ICEIRD 2014
2.2 Process Innovation In this paper an improved technological process, which is based like the most others tires
recycling process’s on pyrolitic effect, is presented. This process enables complete rubber
decomposition to the commercial components. Process itself is safe for the environment as
no gas or liquid by/products are sent to the air and/or waste water system. Developed
process is thermally almost independent, which means that necessary energy is provided
from process itself. Researches and all relevant technical-technological data regarding this
process are checked at the constructed pilot plant.
Main advantages of the new tire recycling process in relation to processes that are in use
nowadays are:
• increase of liquid hydrocarbon fraction yield up to 45% from previous 18%;
• decrease of capital investment for the construction and current maintenance
of stationary reactor;
• wide process capacity change without further investment or influence at
process productivity;
• once in operation thermally independent to the outside fuel supply.
2.3. Process description Recycling of waste tires and/or rubber into the commercial products (see figure 2) is enabled
by continuous process under mild vacuum and low-temperature in the stationary reactor.
Raw material (rubber and/or tires) is prepared in section for shredding by cutting into approx
50x50 mm pieces. Rubber pieces, prepared in this way, are introduced to the reactor, where
under mild vacuum and increased temperature a pyrolysis process takes place. Solid residue from tires, carbon black and metal cord, is discharged from the reactor bottom
and sent to the storage area. Gas pyrolysis products are liquidized and produced naphtha
and diesel fraction are transferred by pump to the storage. Uncondensed gas hydrocarbon
phase is sent to the firebox, where necessary heat, for the reaction, is obtained. At the outlet of this new technological process for rubber recycling, the following products
are obtained: 1. Fuel gas; 2. Naphtha; 3. Light Gas Oil; 4. Industrial carbon black; and 5. Steel metal waste.

460 Proceedings of International Conference for Entrepreneurship, Innovation and Regional Development
ICEIRD 2014
Fuel gas is used as a fuel for its own consumption, which enables energetic optimization and
closing of the technological process.
Naphtha can be used as the auxiliary fluid in rubber industry. Light Gas Oil fraction can be used as a fuel oil for the regional public utility companies,
systems of smaller capacity central heating, industries, mechanization and dryers in
agriculture. By the change of process parameters in recycling process, it is possible to
change basic physical-chemical characteristics of naphtha and diesel fraction, for example
initial and end boiling point of distillation, ignition point, and to get the appropriate quality in
that way. Also, certain cuts can be derived by distillation which can be used as basic oil in
rubber industry. Industrial carbon black, which is basically pure carbon, can be used as reduction medium in
metallurgic process in steel industry, coke substitute and as a fuel in cement factories and
foundries. Yield of industrial carbon black is about 40%. Steel metal waste can be used as a secondary raw material in steel industry. The amount of
scrap metal is approx 8 %.
3. Financial plan for construction the first facility
The plan for construction and commissioning (putting plant into operation) the plant at hand is consisted out of 5 main stages. All of these stages must be taken into account when putting whole financial construction into the picture. The five stages are as following:
1. Legal and license preparation 2. Manufacturing of the equipment and assembling (this activation period is projected to
be six months) 3. Instrumentation (regulation and process control) and electro-energetic phase 4. Men power plan (Work
force)
• Process training
• Fire fighting training • Process safety training
5. Start up and testing
The technological life of the facility is projected to be 10 years, with the balance sheet
projection made for the first 5 years in which the results were positive and the project was
assessed as financially justified. Assessment of the project justification was conducted in two
ways: static project evaluation and dynamic assessment. The objective of static approach is
to present a rough insight into the project efficiency. The static assessment presents the
project efficiency analysis based on only one reference business year.
Detailed analysis of the beforehand introduced stages showed that the necessary

461 Proceedings of International Conference for Entrepreneurship, Innovation and Regional Development
ICEIRD 2014
investment for the plant with the daily capacity of 2.75 tons of material processed should be
400.000,00 €. Furthermore, the analysis has shown that with the potential this project has,
economic conditions, law regulation and the support this field has in Serbia, total revenue
after first business year of production should be 421.250,00 €. The model afterwards
showed an annual increase of 15% in revenue. Total expenditure encompasses expenses
for materials, cost of energies and fuel, amortization, labour cost, cost for research and
development, marketing cost, and taxes. In the first business year total expenditure is about
291.250 €, and every consequent year there will be an increase in relation with projected
inflation for 5%.
The investment profitability represents the profit ratio, after taxes, (net profit) to the sales
revenue. The general requirement for profitability criterion is that it should be as high as
possible. The result shows the profitability of 31%. Therefore, 31 % of income is the profit of
the company after taxes. Furthermore, the annual net effect shows that on every 1 € of
investment, 1.05 € is made.
The internal rate of return is the discount rate at which the net present value criterion is zero,
i.e. at which the current value of net positive income in the project economic flow becomes
equal to the present value of negative net income. The internal rate of return indicates the
average annual increase in property value. In operational sense, this means that the project
investment will increase the property value at the average annual rate within the internal rate
of return. In this case, the internal rate of return shows the maximum interest rate, at which
the funds for this project could be provided. The project is acceptable if the internal rate of
return is equal to, or higher than the discount rate, the credit real interest rate (in this
particular case, the interest rate is 8%). Since the internal rate of return is 42 %, it can be
concluded that the project is cost effective and that project investments are justified.

462 Proceedings of International Conference for Entrepreneurship, Innovation and Regional Development
ICEIRD 2014
3.1. Investment volume per phase
1. Legal and license preparation 2. Manufacturing of the equipment
and assembling I. Process
equipment
a) Reactor b) Furnace c) Liquid phase separator 40-50% of the investment d) Final liquid product pump e) Gas vacuum pump f) Pump-line
II. Raw material preparation a) Raw material depot / waste tires b) Schroeder / cutter c) Warehouse for the prepared tires for the next phase 20% of the investment d) Transport of the prepared tires / conveyers
3. Electro - energetic requirements
a) 220/380 V, all engines (3) and the lighting 10% of the investment b) 15 kW, Schroeder / cutter
4. Workforce
a) Project is a 24h per day, 365 days per year process b) 2 operators per shift 10% of the investment c) process training projected at 10 days
5. Start-up and testing 15-20% of the
investment

463 Proceedings of International Conference for Entrepreneurship, Innovation and Regional Development
ICEIRD 2014
4. Conclusion Construction of the unit for complete decomposition of waste rubber and plastic to
commercial products (fuel gas, naphtha, diesel fraction, industrial soot and steel
metal waste) enables solving the problem regarding waste rubber and plastic in
Serbia (and other interested countries) in the effective and efficient way. Investments
in the construction and commissioning of such units, besides contribution to
protection and preservation of the environment, are also justified in connection to
expectations regarding achievement of positive economic results in designed
technological lifetime of the unit. Challenges, which lie ahead in future period, are
related to providing necessary financial means for construction and commissioning
of such units for waste rubber and plastic recycling

Proceedings of International Conference for Entrepreneurship, Innovation and Regional Development
ICEIRD 2014
464
Innovation as a business model for SMEs
Sorin Mircea AXINTE1, Gabriela IVANUS2 1 Romanian Association for Innovation, 126A Erou Iancu Nicolae Str., Bucharest, Romania, [email protected]
2 University POLITEHNICA of Bucharest, 313 Splaiul Independentei, Bucharest, Romania, [email protected]
Applying overtly linear thinking to innovation stra tegy leads us to a kind of post hoc ergo propter hoc world, which goes something like t his: “Look, this (company, geography or organization) is innovative. These are the things that seem to be different about them. So, let’s do those ‘different things’ the same way, and we’ll be innovative too!” Then, various mixes of components and features of innovative cultures are identified, extracted, and sprinkled i nto non-innovative organizations, stirred around and . . . well, usually, organizatio ns just keep on operating more or less the way they did before they attempted innovation. We may refer to this as the “law of innovation inertia.
Keywords Business model, business model canavas, business model design, innovation, value creation
1. Introduction
Everything, it seems we work towards in business, is for seeking out new value creation, for new growth, for wealth creation, for providing improved returns on the investments we have been making. To achieve this we consciously have to set about the value capture and what contributes to its realization. This is where innovation plays such a vital part. If we don’t build our innovation capital we will certainly have a much harder, perhaps even impossible time of realizing new value. We are more than likely to just maintain our existing value or see it steadily decline. Value-adding activities need to be central in nearly all of our decisions. The how we can turn our resources into being more productive, more creative is increasingly becoming one our biggest strategic areas of future investment decision. Our resources are those all-inclusive assets, capabilities and processes that make up the Enterprise. Yet it is clear management is spending far more of their discussion time and focus on the „harder assets” that are made up of land, buildings, equipment and machinery – the „heavy” financial capital investment decisions. Any new investment in IT, processes, software are usually well identified in the accounting or discussed within the narratives that support the reported numbers. We constantly report on these in our annual reports to validate and justify management’s decision. Firstly the Macro events- those outside our own control but happening now.
1. Key Trends – the foresight part. Society, Technology, Socioeconomic are all shifting or altering shape. We use technology more, we are being challenged more in society and the rapid behavioural interactions of individuals and groups through social capital and social “markets.” The formation around the new social norms of Facebook, twitter and numerous other social media is disrupting much of the existing norms
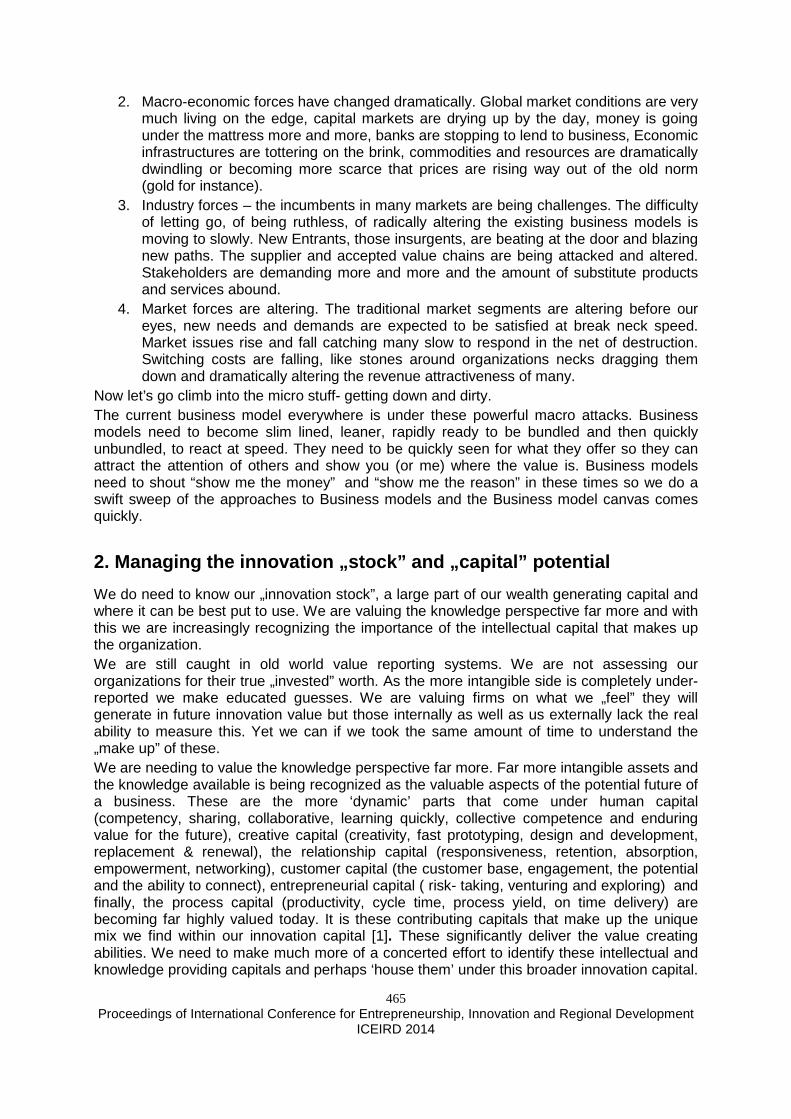
Proceedings of International Conference for Entrepreneurship, Innovation and Regional Development
ICEIRD 2014
465
2. Macro-economic forces have changed dramatically. Global market conditions are very much living on the edge, capital markets are drying up by the day, money is going under the mattress more and more, banks are stopping to lend to business, Economic infrastructures are tottering on the brink, commodities and resources are dramatically dwindling or becoming more scarce that prices are rising way out of the old norm (gold for instance).
3. Industry forces – the incumbents in many markets are being challenges. The difficulty of letting go, of being ruthless, of radically altering the existing business models is moving to slowly. New Entrants, those insurgents, are beating at the door and blazing new paths. The supplier and accepted value chains are being attacked and altered. Stakeholders are demanding more and more and the amount of substitute products and services abound.
4. Market forces are altering. The traditional market segments are altering before our eyes, new needs and demands are expected to be satisfied at break neck speed. Market issues rise and fall catching many slow to respond in the net of destruction. Switching costs are falling, like stones around organizations necks dragging them down and dramatically altering the revenue attractiveness of many.
Now let’s go climb into the micro stuff- getting down and dirty. The current business model everywhere is under these powerful macro attacks. Business models need to become slim lined, leaner, rapidly ready to be bundled and then quickly unbundled, to react at speed. They need to be quickly seen for what they offer so they can attract the attention of others and show you (or me) where the value is. Business models need to shout “show me the money” and “show me the reason” in these times so we do a swift sweep of the approaches to Business models and the Business model canvas comes quickly.
2. Managing the innovation „stock” and „capital” po tential
We do need to know our „innovation stock”, a large part of our wealth generating capital and where it can be best put to use. We are valuing the knowledge perspective far more and with this we are increasingly recognizing the importance of the intellectual capital that makes up the organization. We are still caught in old world value reporting systems. We are not assessing our organizations for their true „invested” worth. As the more intangible side is completely under-reported we make educated guesses. We are valuing firms on what we „feel” they will generate in future innovation value but those internally as well as us externally lack the real ability to measure this. Yet we can if we took the same amount of time to understand the „make up” of these. We are needing to value the knowledge perspective far more. Far more intangible assets and the knowledge available is being recognized as the valuable aspects of the potential future of a business. These are the more ‘dynamic’ parts that come under human capital (competency, sharing, collaborative, learning quickly, collective competence and enduring value for the future), creative capital (creativity, fast prototyping, design and development, replacement & renewal), the relationship capital (responsiveness, retention, absorption, empowerment, networking), customer capital (the customer base, engagement, the potential and the ability to connect), entrepreneurial capital ( risk- taking, venturing and exploring) and finally, the process capital (productivity, cycle time, process yield, on time delivery) are becoming far highly valued today. It is these contributing capitals that make up the unique mix we find within our innovation capital [1]. These significantly deliver the value creating abilities. We need to make much more of a concerted effort to identify these intellectual and knowledge providing capitals and perhaps ‘house them’ under this broader innovation capital.
Proceedings of International Conference for Entrepreneurship, Innovation and Regional Development
ICEIRD 2014
466
As it is innovation that renders that different, unique set of value outcomes far more. Surely it is this innovation capital that is at the core for future wealth, that value creation potential. Innovation capital must be treated as the essential strategic asset and is it is central it needs to be far more reported upon by the management of organizations. Of course it constantly gets mentioned within the narratives by management today but often lacks quantifiable and substantive validation. For years there has been this call for a far more integrated reporting mechanism, one that „accounts” for identifying the intellectual capital to provide this better understanding. The struggle with this argument is it still seems to be a „pipe dream”as management seemingly fails to understand the mechanisms within these. Can this change, if so how?
2.1 Reframe the measuring of intangibles differentl y
Today we are operating in business environments that are highly diverse, specific and subject to rapid change. This reacting to this volatility and our ability to spot new opportunities is what is often keeping management up at night and certainly giving the investors equally sleepless nights, trying to second guess organization performance so as to make the decision to continue to invest or begin to divest. The value creation being created simply needs articulating better. Markets and investors need the value generating perspective far better framed and explained. Today this is often random, ad hoc, left to individual interpretation in their presentation; it needs some form of uniformed framework to bring this together to allow for clearer, more transparent comparison and judgement of real value. It does need a more integrated framework of value creation.
2.2 The focus should be on value creation through t he business model
The Business Model, this is the place for us to gauge measure and gather a real sense of the dynamics that are making up the organization. Today there is certainly far more of an emphasis upon understanding the business model, so why not make this even more central to reporting? The quality of the business models is paramount to the value proposition to the customer and this triggers even more of value identification within the value proposition, so central to the Business model canvas. Within the business model we need to gain a real sense of the dynamics that make this up. Where is the intellectual capital being applied to create new innovation, where are the new business opportunities? It is the abilities to „connect” these, in how we acquire, combine and utilize those unique and valuable resources with the business idea. It is this dynamic „combination effect” that delivers the value (proposition) to the customer. The Business model is the new unit of analysis for evaluating future value. Arguably the business model is holistic and is becoming increasingly the new unit of analysis, that spans the organization and „articulates” its capital and strategic value capturing parts. Can we achieve a more integrated set of disclosures that combine the Business model, its strategic approach, what makes this up and clarifying its value creating process? This potential approach does need to place a much heavier emphasis on the innovation capital and all the knowledge creating aspects that make up intellectual capital. It would need a significant shift in management’s understandings as they would need to articulate the critical components far more, they would have to find a common communicating language. Where better than the „heavier” use of the business model canvas or the layering structures that makes this understood? Externally we can also judge far more the potentials within the stated „interactions” between the critical components of the business model. Management does not have to „give the store

Proceedings of International Conference for Entrepreneurship, Innovation and Regional Development
ICEIRD 2014
467
away” in their competitive position to its competitors but they certainly can do a better job to convey much of the dynamics that make this up, in better, thoughtful ways. Make this more financial contingent for future investments. Beyond narrative reporting, we need to push further. Narrative reporting has been suggested as the step for this to happen. To make the business model an essential mandatory part of the management reporting. I think this can even be pushed further. Whenever management has been „pushed” by regulatory forces it has taken the time to learn and understand the parts that make this up. Our intellectual capitals are part of this learning as equally knowing the „dynamics” that make up the innovation capital becomes essential. The business model, the intellectual capital and the innovation capital simply make up such a significant part of the Value Creation process. Realization of this „make up” and understanding its critical connections is needed far more today to understand. Knowing these can move us towards value our organizations far better than we can do at present.
2.3 Communicating the value creation and business m odel is critical today
Today and in the future, it is the ones that can articulate and ‘point towards’ what makes up the value creation will attract and command investors premium. Those that can describe how they are setting about sensing and seizing opportunities by knowing the more dynamic „interactions” will be in a far better shape to exploit and capitalize on them. The organizations that understand their unique mix of capitals and how it is made up in this broader sense, will be able to deploy their innovation capital towards the „value proposition points” far better. These will will be through constantly evolving business models, to convert opportunity to their gain, repeatedly by directing their innovation capital far more effectively. The key today is they need to know what to invest into as the critical resources and this is far less the „hard” assets but more the softer competencies, capabilities and capacity parts that are made up through knowing what contributes into the innovation capital.
2.4 Business Models should be about explicit choice s.
Before we get into thinking about new business models, there is a lot of essential links or decoupling to be thought through within large organizations. Do you ever have blank canvases in large organizations? Maybe but the majority of decisions based on new business models might come with some form of organizational baggage. My blank canvas moments in large organizations always held some constraints. These come in many different guises: there are both clear strategies (or should be) and much conflicting interpretations at each level within organizations, there are significant heritage and legacy issues to evaluate, there is a current set of operating models that might conflict or compliment any new business model design and then we can never ignore the detailed organizational design itself. Here We talking about the make-up of IT, structure options available or achievable, the processes, governance, metrics, cultural, talent available and the organization-wide clarity on its priorities. Many of these actually „hold the business to ransom” and if the CEO or board are not totally comfortable and have not thoroughly discussed it, new business models have a very hard time to work within the constraints known as well as hidden. Then you have the outside forces at work, the ones that are most probably forcing the re-think or need for a new business model. These are the forces at work, have the context of markets changes or likely too, what are our present or emerging competitors doing differently than we are, what new capabilities and competencies are coming to bear and the whole context thing (macro, trends and technologies).

Proceedings of International Conference for Entrepreneurship, Innovation and Regional Development
ICEIRD 2014
468
So the CEO or board are central to BMI’s to get off the ground and this must be the primary focal spot for discussing and educating around the Business Model. The vital message here is designing the pre-work to BM’s is the „sweet spot” to get well designed and recognized, then more into the actual BM constructs and what is needed. So what motivates change by considering new business models? IBM conducted a survey some time back of the CEO’s ranking for exploring new business models. These were four „stand out” ones of : 1) Cost Reduction, 2) Strategic Flexibility, 3) Focus and Specialization, and 4) Rapidly Exploiting New Market or Product Opportunities. There were two more but these were the big four. These four certainly have huge scope behind when you think about them and can start any business model development discussions. One way to explore these four „stand outs” regarded by the CEO as the most important If one takes a concept from a A D Little report [2] on their view on business models I like their idea of their archetypes approach. A launching point within any business model discussions within large organizations is to apply these „archetypes” to the above four CEO needs. The five outlined in A D Little’s report were asking open questions to see potential or not:
• Share the cake differently (novel ways, challenging traditional approaches, partnering)
• Supplant someone (they suggested the middleman in the report) • Shift the cost curve structurally (deploying different asset bases) • Redefine the customer experience (exploiting uniqueness and new values) • Convert product into service or combine them.
Now I think possibly working through the four needs of CEO’s and the five archetypes you really can get into exploring new business models in meaningful productive ways. A 4 x 5 matrix perhaps. The emphasis points within these discussions changes and the depth of conversation determines next steps. Getting the framing right is the best argument for chang. CEO’s and boards We believe always listen to well-argued cases where you can pin point failure or lost opportunity or new sources of potential revenue and growth. Getting this framing right in the first place, knowing what and why you believe you need a new business model becomes more valuable, a real catalyst to change and this is the powerful enabler to unite behind. Surely this going back to getting the „need for” is far more valuable initially to lay in the foundation than working through the principles and typical pros and cons of one design or approach over another. I think we can get caught up with this rush to justify and validate one specific business model or another? Is this the „cart before the horse?” Or just enterprise kicking in? Sell the compelling reason for making change by identifying a real need, work through if this can or cannot be completed through an existing design, and then throw yourself into all the „delights” of what makes up the components of business model design.
2.5 Are we starting in the right place or diving in by layering on more BM design?
Just a bit of a Monday morning reaction perhaps, but reading the different activity going on within cracking the business model code for adoption within large organizations that seems

Proceedings of International Conference for Entrepreneurship, Innovation and Regional Development
ICEIRD 2014
469
to be buzzing within the Business Model Community at present. We would suggest there needs to be some great care, otherwise we kills the goose, not fatten it up by building the right thinking and value proposition for what it could really offer large organizations! Are we stepping back far enough and giving this the „helicopter” treatment before we launch into further solutions, courses and seminars, maybe just fitting the existing frameworks into something without the real stepping back this might need? Often a potential problem is to do with it’s positioning- for the BM is it:
• Need to draw in a fellow BM disciple, who could focus and spread the message to the larger organization as his „patch”.
• Is it also because it might be hard to imagine that you can capture a complex picture within a one page canvas? Within large organizations you deal in pages of business plans, marketing plans, briefing papers and countless justifications. Could a business model be captured so easily? Well actually yes, if anyone is wondering.
• Is it partly because the Business model does not have enough of a blueprint of proven techniques or follows a more (comfortable) descriptive process, yet to be fully established. Perhaps it now requires a more radical „layered” supporting structure that underpins the canvas? Or you simply shout “get on the train, it is about to leave without you”
• Or more than likely, it is far more to do with that classic „lead and lag”. Larger organizations are slower in adoption; it is just a matter of course. Be this in new technology, new processes, social media or a host of new things they tread more cautiously, they are slower to adapt. Those that get „it” internally spend often frustrating months, sometimes years, trying to convince others to make a change, to change a process, a planning structure, even a widget within an established product that often holds it back. Irrespective of the answer to any of the above, my question here is: “can they afford to keep on ignoring a brilliant tool? One that will help them ‘galvanize’ the understanding of their business model and provide an amazing tool to explore other potential ones?
We would argue to the large organization “simplicity can sometimes be deceptive” and just find the time and really focus upon the potential that lies within the Business model canvas. It is a powerful tool in the right hands. Let me suggest a number of reasons here: So the BM Canvas and its value to large organizations[3]. BMI provides an increasing value, our opening set of arguments.
1. It can help discover new perspectives on challenges, also new perspectives on solutions.
2. These perspectives can be new insights, new customers, new resources and new channels.
3. Framing BMI in the canvas approach can underpin the Business Case through the nine building block analysis and provide a great one page justification.
4. It can define needs- needs in the market, needs required from solutions and their impact. It can compliment ‘jobs-to-be-done especially.
5. It can investigate value propositions (ranking, impact, capability, competition). 6. It can help investigate higher impact propositions (value- based, enhanced economic,
applications etc) to stimulate internal thinking and greater generation of potential BMI’s.
7. It can form the basis of any model for showing where the money lies in potential profit, the possible costs and the resources needed.
8. It can help in evaluating competition or watching for new entrants if ‘it’ or you understand the needs of the customer and where opportunities might lie.

Proceedings of International Conference for Entrepreneurship, Innovation and Regional Development
ICEIRD 2014
470
9. It can explore and explain consumer thinking (pre and post discovery and execution) in easy visual ways.
10. It can be used as a neutral observer, uncovering opportunities or validating them in other industries that today may not be relevant but need to have a ‘watch’ placed upon them.
Other powerful argument lies in the yet to be fully explored multiple uses: • To simply explore new business models as the book originally sets out in the how,
what and where of doing this through the canvas approach. • To ‚map’ changes to existing business models as they evolve or need to pivot
differently. This is not exclusive to the entrepreneur, where they have tended to focus but much of their thinking can be applied to the larger organization to learn, understand and gain. Just spend some real time on these two sites, it is time well worth spending to learn and challenge your current thinking on many approaches to your market and knowing the different value generation points in any engagement with your customers.
• To sketch out competitors positions to explore possible opportunity gaps should be one of those consistent ‘habits’ that so many large organizations often have a real blind spot to undertake and then get caught out and surprised when they see their share slipping away. The BM Canvas can spot and track competitors.
• To use it as a dashboard for innovations that have an impact on existing business models. Whenever you have any major BM change you capture it on your BM Canvas so all above and below can see the change. This can apply also as a „trigger” point for communicating significant changes happening, up and down the organization[3].
• Use it to compare business model components across countries where different models are being applied to build businesses. This enables all involved to quickly focus on the differences on these operating models and market formations to get quickly at strategic discussions. This gives the visitor clarity and draws out critical ‘talking points.’ for allowing the visiting fireman to actually say more than “how can we help” but “let me show you ways to be safe.” It brings everyone onto the same value proposition and to rapidly explore the different options far more quickly than through those countless power point slides we have all endured, explaining each of the factors within the market. It gives business reviews a template.
• When you are pitching for funds it provides the top picture that others can quickly see and appreciate the why and how- they „see” the value and the money potential, Again this has been grasped by some of the more enlightened venture capital investors, just wanting to know where the money is coming from, and then when the changes occur, as they always do, why the ones running the business made the changes from the original BM proposition. This offers „intelligent enquiry” not getting involved in the running of the business but supporting owners or business managers with appropriate experience to compliment theirs.
• To have ready alternative scenario’s for volatile business conditions as ‘early ready’ that have mapped out potential changing conditions and where and how the business model might be adjusted or radically changed. The earlier ‘warning system’ pays in volatile times and we are all facing those at present.
• Rapid concept brainstorming to move into prototyping evaluation and market testing. Testing many different variations in small bite sized bets is rapid prototyping, do this through the effective use of the business model canvas. Testing fast in the actual market place new business models and then learning from them to improve the approach is absolutely critical. Get the customer involved.
Find a common language is simply needed

Proceedings of International Conference for Entrepreneurship, Innovation and Regional Development
ICEIRD 2014
471
We do think the Business Model Canvas is about to go through a (further) tipping point, that crossing the chasm into mainstream adoption. Finding a common language is one of the critical tenets. To find this common language and recognizing the value of this tool in many different situations can be valuable [4]. Gaining this common voice to the business model, so all those around can understand it easily and quickly, is a major advance on what we presently use in having to explain our business models. For me there is something intuitive about the BMC approach. But to then empower everyone, to go out and seek increased value from new ones seen, that can then be communicated on one page, well that’s the real power of the Business Model Canvas, for any organization, large or small.
3. Conclusion
Most of our existing organizations are searching for the mechanisms to reinvent their business models, through identifying, designing and executing differently from the existing ones, where they tend to simply be ‘locking themselves into’ repeating patterns, possibly opening themselves up to new forces of disruption. There is a sense of urgency that is growing at the corporate level, to master this ability to design different business models and then set about executing them, to combat the multiple ‘disruptive forces’ swirling around in the present and near term business environment.
1. Business models need a common language, they need to be easily described and here is the fundamental value of the BMC – it can set about supporting a common understanding, it can be used to describe in multiple ways.
2. Today the BMC is discussed more as the blank canvas to start new ideas and concepts and its present focus has been in its use for start-ups and entrepreneurs. From these opening sketches the canvas does a great initial job to describe these ‘emerging’ concepts. We need to change this emphasis point.
3. Make the Business model canvas as a multiple describing and communicating tool. We should shift our thinking and open our minds up to its (BMC) greater value within the larger organizations
4. To simply explore new business models as the book, the Business model generation, originally sets out, in the how, what and where of doing this through the business model canvas approach. To experiment with all the advice, tools and experiences that have been built up since this book first appeared.
5. The business model needs to be constantly tested for its potential in its recurring value, and it needs a canvas to constantly challenge its present position and worth. There are multiple ways the business model canvas can be explored in exciting new visual ways so as to describe effectively in a common format and capture the wealth of different opportunities. To invent, to communicate and explore the ‘richness’ within the potential value that is simply laying underneath the different components that make up a business model.
6. The Business model needed a common voice, a common language. 7. For developing and experimenting with new business models that transform how a
company delivers value (while continuing to drive the performance of your current business model) as this is one of those real exceptionally difficult points.
The argument is to compete in a world where the “shelf life” of business models is shortening, leaders need the tools, skills, and experience to envision, test, and implement new business models. Moreover, successful organizations will establish an ongoing process to explore new models for delivering value—even those that are disruptive to current operation.

Proceedings of International Conference for Entrepreneurship, Innovation and Regional Development
ICEIRD 2014
472
References
1. Beattie V , Smith S J. Value Creation and Business Models: Refocusing the Intellectual Capital Debate. The British Accounting Review, Volume 45, Issue 4, December 2013, Pages 243–254
2. Reinvent business model-Creating, delivering and capturing value in innovative ways, http://sixpathsconsulting.com/services/business-model-innovation 2014
3. Cowan A, Business Model Canavas, http://www.alexandercowan.com/business-model-canvas templates_a
4. The Business Model Canavas, http://www.businessmodelgeneration.com/canvas 2012
Proceedings of International Conference for Entrepreneurship, Innovation and Regional Development
ICEIRD 2014
473
Science and Technology Park-a tool in promoting and sustaining innovation
in SMEs
Sorin Mircea AXINTE1, Alexandru MARIN2,Gabriela IVANUS3 1 Sciece and Technology Park for Micro and Nanotechnology MINATECH-RO, 126A Erou Iancu Nicolae Str., Bucharest, Romania, [email protected]
2 University POLITEHNICA of Bucharest, 313 Splaiul Independentei, Bucharest, Romania, [email protected]
3 University POLITEHNICA of Bucharest, 313 Splaiul Independentei, Bucharest, Romania, [email protected]
This essay is actually a study on the innovation de gree of 15 different resident companies of the Romanian STP “MINATECH.RO”. It aim s to reveal the way in which innovation was stimulated by research results comin g from the University “Politehnica” of Bucharest and from the National In stitute of Microtechnology, through technology transfer structures belonging to the Off ices of Technology Transfer of the university and research institute. The study highlights that the common need of fundin g - so STP entities can start developing innovation activities- and the necessity of new, innovative products on the marketplace have significantly contributed to an in crease of innovation inside the residential companies. Obtaining funds for implementing research results, belonging both to the university and to the institute, combined with company researc h, have led to the implementation of 10 products and 5 new technologies, which have s ubsequently contributed to the increase of competitiveness between resident compan ies.
Keywords Implementation, innovation, research results, technology transfer
1. Introduction
In this environment, competitiveness at the company level depends crucially on the speed with which new products can be brought to the market place and new cost-saving improvements made. Similarly, the creation of wealth and employment depends to a very large extent on the speed with which scientific and technological breakthroughs are converted into practical and attractive solutions. Innovation – the ability to reap the rewards of scientific achievement – requires much more than the ability to turn a new idea into a working product. Efficient flows of technology are not enough – ready supplies of finance and of business skills are also needed. There must be accessible protection for intellectual property, and adequate incentives for entrepreneurial drive.

Proceedings of International Conference for Entrepreneurship, Innovation and Regional Development
ICEIRD 2014
474
In short, what is needed is a dynamic, self-sustaining culture of innovation. Critical to such a culture of innovation are the small and medium-sized enterprises (SMEs) which have in recent years proved themselves to be the engines of economic growth, and the principle sources of new employment. SMEs account for over 99% of all European businesses, and in many fields provide the channels along which new technologies develop. In fact, in sectors such as biotechnology and information technology, relatively small numbers of new, technology-based firms (NTBFs) are also key suppliers of new technologies. Their ability to exploit new technologies, and to respond quickly to changing market needs, give SMEs a pivotal role in the success of the European economy. Support for the creation of new ventures and spin-offs from research institutions and large companies, as well as the removal of barriers to their rapid growth and support for the transfer of know-how, also deserve to be accorded the highest priority[1].
2. Concept and Definition
What is a science and technology park? The first science and technology park was created on the campus of Stanford University more that 50 year ago. It has transformed the Silicon Valley area from one of the poorest regions in the USA into a global centre of technology, finance, education and research. Since the inception of Silicon Valley, the high-tech cluster phenomenon has seized the imagination of public policy makers. Hundreds of similar high-tech clusters have been created in various parts of the world, and their numbers continue to grow as the cluster formation is increasingly adopted as an important economic development tool and as an integrated part of the national or regional innovation system. The cluster is attractive for many reasons. It catalyses economic transformation, drives growth, enhances stability and looks a good bet for economic success. Several official definitions of science and technology park have been adopted by different organizations. The official definition adopted by the International Association of Science Parks (IASP) in February 2002 goes as follows. A science park is an organization managed by specialised professionals, whose main aim is to increase the wealth of its community by promoting the culture of innovation and the competitiveness of its associated businesses and knowledge-based institutions[2]. To enable these goals to be met, a science park stimulates and manages the flow of knowledge and technology amongst universities, R&D institutions, companies and markets; it facilitates the creation and growth of innovation-based companies through incubation and spin-off processes; and provides other value-added services together with high quality space and facilities. IASP’s definition also goes on to say that the expression “science park” may be replaced in this definition by the expressions “technology park”, “technopole” or “research park”[2]. According to the United Kingdom Science Park Association (UKSPA), a science park is a business support and technology transfer initiative that:
• Encourages and supports the start-up and incubation of innovation-led, high-growth, knowledge-based businesses.
• Provides an environment where larger and international businesses can develop specific and close interactions with a particular centre of knowledge creation for their mutual benefit.
• Has formal and operational links with centres of knowledge creation such as universities, higher education institutes and research organisations.

Proceedings of International Conference for Entrepreneurship, Innovation and Regional Development
ICEIRD 2014
475
The American Association of University Research Parks defines research parks as property-based ventures, yet its definition is more explicit about a number of features of its parks, and includes the following elements:
• They are master planned property and buildings designed primarily for private/public research and development facilities, high technology and science based companies, and support services.
There is: o A contractual, formal or operational relationship with one or more
science/research institutions of higher education. o A role in promoting the university's research and development through
industry partnerships, assisting in the growth of new ventures and promoting economic development.
o A role in aiding the transfer of technology and business skills between university and industry teams.
o A role in promoting technology-led economic development for the community or region[2].
The term "science and technology park" encompasses any kind of high-tech cluster such as: technopolis, science park, science city, cyber park, hi tech (industrial) park, innovation centre, R&D park, university research park, research and technology park, science and technology park, science city, science town, technology park, technology incubator, technology park, technopark, technopole and technology business incubator. However, it is worth noting that there are slight differences between some of these terms. For example, experience suggests that there is difference between a technology business incubator, science park or research park, science city, technopolis and regional innovation system. Some might argue that discussing definitions is an exercise in semantics, but a fuller understanding of the different variants of parks (as well as the type and size of the tenant companies that these might attract) is important in considering physical planning. For example, if it is a realistic possibility that a park will attract a large facility of a substantial corporation, then the master plan should reflect this scenario. Also, if a park with an incubator is located close to a centre of research (rather than in a remote location), there is a good chance of a number of spin off companies being formed. In this case, it would be sensible to provide “grow on space” so that successful companies can move on and release space for new entrants while retaining their existing links with supplier and customer networks. In terms of size, parks range from those which are essentially city centre incubators to large tracts of urban or suburban land which not only offer incubation space, but also accommodation for companies at very different stages of maturity. Further variety exists in the technologies they support, with some focusing on one technology while others cover most. On-site management can vary from a lone manager to a full team of experts; however, the larger the team, the greater the overhead and, unless these costs are subsidized, this kind of burden can make a park an unattractive location for cost-conscious companies. The AURP also notes that “a park may be a not-for-profit or for-profit entity owned wholly or partially by a university or a university related entity. Alternatively, the park may be owned by a non-university entity but have a contractual or other formal relationship with a university, including joint or cooperative ventures between a privately developed research park and a university”[2]. Again, this acknowledges a breadth of interests in these projects. Despite this variety in the type and nature of science and technology parks, these projects tend to be on relatively discrete sites; however, their activities can have a significant regional impact. In contrast to these local initiatives, some regions and cities have taken the much wider view of trying to create wealth from science and technology by re-branding their location and putting in place policies and development strategies in response to the

Proceedings of International Conference for Entrepreneurship, Innovation and Regional Development
ICEIRD 2014
476
technological revolution, the global economy and the importance of information in the economy.
3. Innovation in STPs
Science Parks play an important role in transferring scientific and technological knowledge. Science Parks belong to a setoff political instruments that ideally focus on reindustrialization and regional development as well cater for the promotion and development of new high-tech businesses incubators. One of the most significant roles of the Science Park is to transform basic science at Universities into commercial innovation. The goals of Science and Technology Parks are to :
� Promote R&D by the University in partnership with industry � Assist inthr growth of new ventures � Promote economic development � Facilitate the creation and growth of innovation-based companies � Stimulate and manage the flow of knowledge and technology among universities,
R&D institutions, companies and markets;and � Provide an environment where knowledge-based enterprises can develop close
interactions with a center of knowledge for their mutual benefit. Science & Technology Parks as Centers of Excellence in the Knowledge-Society
� Scientific Knowledge and information are considered as key resources in the production process, along with physical capital, labor, natural resources and other factors in determining economic growth
� The use of knowledge to innovate is not only determinate of wealth, it is also the basis of competitive advantage> STPs also participate in innovation, development of new ideas, employments of new technology, manufacturing of new products and delivery of new services.
� STPs bring with it formidable adjustment challenges whit implications for firms, individuals, educational institution and governments. These adjustment challenges may happen in every aspect of organistional structure, management, employment, investment training, policies and regulations.
� STPs regard human resources as a key source of development, simply because knowledge is embedded in people, and human beings are the creators of knowledge[3]
Promoting innovation through university-industry pa rtnership The application of (science and technology) S&T is an agent of industrial, economic and social development. The promotion of cooperation between the S&T knowledge producers in universities and R&D institutions and the users in industry and in the private sector is vital in the process of innovation and commercialization of R&D. This is especially important at a time of globalization and changing work organization in engineering, science and technology. In recent years several concepts have found their way in literature regarding innovation infrastructure support for high growth firms, notably the notion of ‘embedding’ and the idea of a favorable environment or culture for innovative activities, and more recently the emphasis on community development (see, for example, Cooke & Morgan 1998; Enright 1998; Seline 2005). It has been argued that the promotion of these concepts can enhance the regions’ competitiveness and can help businesses to foster an identity in a cluster market. Innovation infrastructure support such as Science and Technology Parks (STPs) are physical aspects of promoting these notions and developing specialized clusters and infrastructures in an
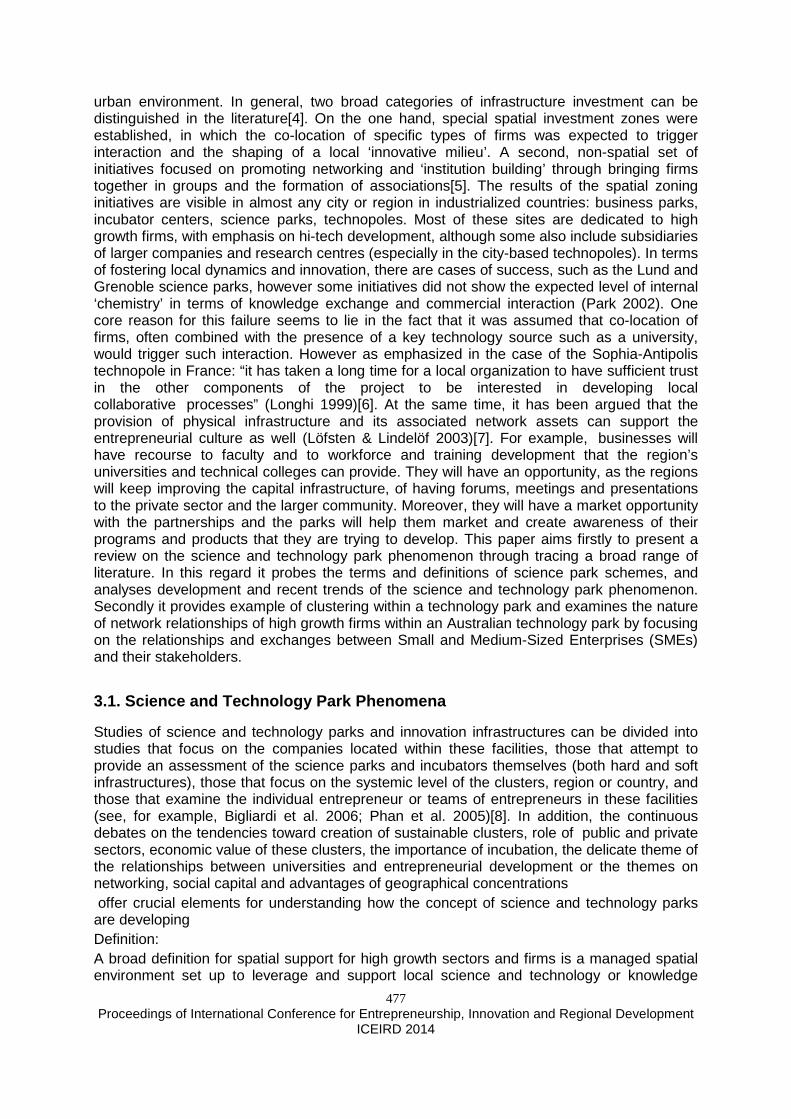
Proceedings of International Conference for Entrepreneurship, Innovation and Regional Development
ICEIRD 2014
477
urban environment. In general, two broad categories of infrastructure investment can be distinguished in the literature[4]. On the one hand, special spatial investment zones were established, in which the co-location of specific types of firms was expected to trigger interaction and the shaping of a local ‘innovative milieu’. A second, non-spatial set of initiatives focused on promoting networking and ‘institution building’ through bringing firms together in groups and the formation of associations[5]. The results of the spatial zoning initiatives are visible in almost any city or region in industrialized countries: business parks, incubator centers, science parks, technopoles. Most of these sites are dedicated to high growth firms, with emphasis on hi-tech development, although some also include subsidiaries of larger companies and research centres (especially in the city-based technopoles). In terms of fostering local dynamics and innovation, there are cases of success, such as the Lund and Grenoble science parks, however some initiatives did not show the expected level of internal ‘chemistry’ in terms of knowledge exchange and commercial interaction (Park 2002). One core reason for this failure seems to lie in the fact that it was assumed that co-location of firms, often combined with the presence of a key technology source such as a university, would trigger such interaction. However as emphasized in the case of the Sophia-Antipolis technopole in France: “it has taken a long time for a local organization to have sufficient trust in the other components of the project to be interested in developing local collaborative processes” (Longhi 1999)[6]. At the same time, it has been argued that the provision of physical infrastructure and its associated network assets can support the entrepreneurial culture as well (Löfsten & Lindelöf 2003)[7]. For example, businesses will have recourse to faculty and to workforce and training development that the region’s universities and technical colleges can provide. They will have an opportunity, as the regions will keep improving the capital infrastructure, of having forums, meetings and presentations to the private sector and the larger community. Moreover, they will have a market opportunity with the partnerships and the parks will help them market and create awareness of their programs and products that they are trying to develop. This paper aims firstly to present a review on the science and technology park phenomenon through tracing a broad range of literature. In this regard it probes the terms and definitions of science park schemes, and analyses development and recent trends of the science and technology park phenomenon. Secondly it provides example of clustering within a technology park and examines the nature of network relationships of high growth firms within an Australian technology park by focusing on the relationships and exchanges between Small and Medium-Sized Enterprises (SMEs) and their stakeholders.
3.1. Science and Technology Park Phenomena
Studies of science and technology parks and innovation infrastructures can be divided into studies that focus on the companies located within these facilities, those that attempt to provide an assessment of the science parks and incubators themselves (both hard and soft infrastructures), those that focus on the systemic level of the clusters, region or country, and those that examine the individual entrepreneur or teams of entrepreneurs in these facilities (see, for example, Bigliardi et al. 2006; Phan et al. 2005)[8]. In addition, the continuous debates on the tendencies toward creation of sustainable clusters, role of public and private sectors, economic value of these clusters, the importance of incubation, the delicate theme of the relationships between universities and entrepreneurial development or the themes on networking, social capital and advantages of geographical concentrations offer crucial elements for understanding how the concept of science and technology parks are developing Definition: A broad definition for spatial support for high growth sectors and firms is a managed spatial environment set up to leverage and support local science and technology or knowledge

Proceedings of International Conference for Entrepreneurship, Innovation and Regional Development
ICEIRD 2014
478
resources to enhance a region’s economic base. These specialised managed work spaces have grown rapidly in industrialized nations and are found in increasing numbers in developing economies. This may involve science and technology parks (STPs), research parks, innovation centers or technology/innovation precincts, which all have become an established part of the innovation infrastructure in those economies. They are an economic development tool that is particularly suited to developing regional knowledge economies. In appropriate regional environments, these spatial developments can provide a specialist mechanism to promote and stimulate commercial and industrial innovation, encourage re-industrialization and foster sustainable regional development infrastructure options. However, looking for a uniform description of a definition it seems necessary to report some of the most considered definitions given by national and international organizations related with the science and technology parks (STPs)[9]. This is because the term Science and Technology Park refers to a range of innovation infrastructures, with common characteristics. For example, as defined by the IASP (International Association of Science Parks) “a science/technology park is a property-based Initiative which:
1. has operational links with Universities, Research Centers and other Institutions of Higher Education;
2. is designed to encourage the formation and growth of knowledge-based industries or high value-added tertiary firms, normally resident on site; and
3. has a steady management team actively engaged in fostering the transfer of technology and business to tenant organizations”[10].
3.2. STP MINATECH-RO(MIRO)-Study case
For analysis the degree of willingness and commitment to knowledge exchange and economic advancement within MIRO, we asked the inside company if they believed that friendly contacts with other firms in MIRO were an important asset for their firm; approximately 68% of respondents indicated a perceived value in their relationships within MIRO. Some uncertainty as to the source of this value, however, was evident, as indicated in the following interview extract: It’s difficult to say just what the advantage will be but as I just said there are advantages. To discover that someone’s got some products that you can use, or even that you can manufacture the product that the other guy wants to do, we’ve got software here, you’ve got developers, we’ve got testers and graphic parts, if a small company grabs that, there has got to be advantages. In this way, there is an evident recognition of the potential benefits of relationships within MIRO, particularly given knowledge of other people and their products; however, due to the uncertainty of the advantages to be derived from relationships within the park, trust (or a ‘leap of faith’) is required to take steps to seek these advantages. Interestingly, when asked if they felt they could achieve the same outcomes if located outside of the park), 72% of respondents believed they could. This finding is particularly noteworthy, given the emphasis in the literature on the difficulties faced by SMEs operating autonomously; one explanation of this finding is that several of the interviewed firms were branches of existing firms, which may be capable of providing them with the required support for innovation. As well as stressing the importance of a cooperative or collective orientation, the literature also indicates that the structural aspects and operation characteristics of a cluster type arrangement such as a STP as to be essential for collective learning. In this regard, the optimal structure combines both stability and variety. Arriving at such an optimal structural mix generally requires oversight and direction setting of a governance model or framework. Based on this, in order to gain insights into the type of the mechanisms and structures that may provide effective integration strategies respondents were asked to rate the importance of possible mechanisms for the successful integration of a cluster like MIRO. Specifically the

Proceedings of International Conference for Entrepreneurship, Innovation and Regional Development
ICEIRD 2014
479
respondents were asked to indicate those linking structures and/or processes that may assist in the way the MIRO network functions MIRO Board always felt that technology diffusion, technology transfer and finding funding should represent main activities for this park companies to achieve their goal. Monthly meetings Polytechnic University Transfer Office and Technology Transfer Centre of the Institute of Microtechnology allowed concerns knowledge and research results of two of the consortium member institutions that make up the park . With such a mirror of the results, the Park Board selects for different areas of activity of firms in the park (physically present but also for virtual incubator) research results of interest that the firm's know-how can be put into practice in the time. Once construction partnerships (between companies and departments that research universities and institutes) and the adjustment of the financial effort required to obtain demonstrator , pilot product range , depending on the type of project and the ultimate goal of the project is determined type of financing required and starts writing project financing for presentation in competitions of the National Plan for Research, Horizont 2020 Structural Funds, and organizations invested venture capital or business angel. So in the last 2 years the results of the research provided by the two entities mentioned were performed 10 products and 5 technologies using structural funds for start-ups and spin-of and product development for innovative SMEs Funds national innovation, but private funds usually invest in innovation made by resident companies.
3.3. STPs- a tool for the Knowledge Economy
Throughout the developed industrial economies (and increasingly in developing industrial countries), there has been a great increase in recent years in policy and programmatic initiatives to promote the diffusion of technology. The effective deployment of technology has been associated with industrial competitiveness, productivity and efficiency, economic development, business growth, business flexibility, quality, the maintenance of high-wage jobs, and the support of further rounds of innovation. Attention has been paid not only to specific policy measures that might accelerate technology diffusion and tighten links between technology developers and users, but also to the creation and nurturing of supportive systems and infrastructures for technology diffusion[11]. Lessons Learned STPs: a growing phenomenon – where are we?
• STPs role in the changing innovation process – what is needed are not more, more but better
• better STPs � Better planned � Better managed � Better linked to “Universities”
A few key lessons - not always being applied for a variety of reasons: local context, poor management, limited sharing of experience. Which are the characteristics of a well planned STP?
� Suitable location � Availability or capability to attract skilled workers � R&D intensity � Economic environment
Regional/national policy in support of innovation • Clear long-term vision, shared by sponsors and management

Proceedings of International Conference for Entrepreneurship, Innovation and Regional Development
ICEIRD 2014
480
� Careful selection policy � Self- evaluation of performance
• Flexible physical facilities � Design � Multiphase development
What do we mean by a well managed STP? • A professional management team:
� With a business background and an understanding of the areas in which on-park
� Companies are operating � A proactive marketing strategy � Focused on providing high value –added services � Smart networker � Regional � Internationa
Whe does the link with University work? • Necessary? Definitely not sufficient!
� – Co-location (i.e. on-campus vs. off-campus) � – Presence in the shareholding structure of the STP � – Active participation in the management of the STP
• So what matters? � – A research oriented University with an entrepreneurial culture � – Careful selection of tenant companies � – An incubator well integrated within the STP
4. Conclusion
As mentioned, the STP models vary widely in industrialized countries according to the levels of the economy and the National S&T strategy to promote technology intensive and knowledge based enterprises. They are operating mostly as integrated organizations within hi-tech zones, innovation centers, and university/R&D institutions. The emphasis is on enterprise development with the focus on hi-tech ventures and high growth technology based SMEs. Therefore within the broad tapestry of economic development tools, the special and unique role that the STPs perform is to:
• recruit and co-locate new and established knowledge-based companies; • promote innovation based on ‘smart’ technology; • provide an interface or shared research environment for research organizations and
private industry; and, • leverage local knowledge resources to enhance a region’s economic base. Also as
mentioned there are advantages of networking within a cluster such as a techno park. In addition to an expansion of the available resources to the parks and clusters themselves, networking enables firms in each cluster to expand their access to knowledge and resources from broader range of sources. It becomes clear that a broad-based cluster/network-based system may have a strong impact in specific areas such as the following, which identified critical in this study:
• Access to new markets and marketing strategies.

Proceedings of International Conference for Entrepreneurship, Innovation and Regional Development
ICEIRD 2014
481
• Access to capital: integrated access to services such as financial planning, support for obtaining grants, opportunities for access to venture, development, and seed-capital.
• Expansion of inter-firm linkages: a networked approach is ideal for maximizing the impact of programs and projects, such as partnerships, alliances, and linkages to outside suppliers.
• Technological support: access to services such as technology assessment and forecasting, assistance on technological choices, marketing assessment of innovative projects and assess to outside technical information.
• Technology transfer opportunities: networks may be used to stimulate investment in Science and Technology, R&D, technology transfer and spin-offs.
• Access to talent and know-how: networks may help in the process of identifying and hiring skilled people across regional boundaries.
• Strengthening local cluster governance structures: the establishment of linkages with other clusters/parks would enable a better understanding of stakeholder needs and markets and may be used to disseminate best practices in technology parks to improve the performance of firms in each cluster/park.
• Optimizing and sharing facilities: the operational support infrastructure may be optimized and many facilities could be shared over the network, including incubators, prototype centres, pilot plants, test laboratories, and online conferencing facilities. Finally, it is important to consider the main critical factors of innovation success in the context of institutional linkages and cluster/technology park theory. In fact, although knowledge clusters are highly individual and differentiated, it is helpful to identify some common factors of success and, in particular, their innovative capability, linked to continuous learning at level of single firm and at the level of the systems of firms which refer to collective learning and learning by interacting. Some of these factors are mentioned in below. These factors can be grouped as ‘favourite location factors’, ‘strategic micro-management’ and ‘supportive macro-management.
• Favourite location factors: This set of factors generally influence selection of business location for knowledge-based firms. As mentioned before they include availability of advanced IT infrastructure, R&D facilities, skilled and skilled labor force. Some of the factors also relate to the quality of the work inside and outside of the park such as access to the airport and business image.
• Strategic micro-management factors: These factors relate to the professional management of park and also to have a clear park objective. For this purpose, it is important to have a tenant-oriented management style. Park management team has to be aware of their tenants’ needs so as to assist them when required. Besides, it is necessary to have a clear target about park achievements such as; number of R&D successes; tenants’ growth, contribution to regional economy or number of technology transfers.
• Supportive macro-environment: Cooperative networks and support from various related and supporting industries and sectors are important for a technology park to achieve success. Linkages and cooperation can enhance firms’ innovative capacity and effectiveness, and lead to their long-term competitiveness. Government also is a key player in constructing such a supportive environment. As emphazise in literature and through interview with tenants it is especially decisive for government to provide support in such aspects as securing an attractive park site; providing financial support not only for park establishment and development also for channel firms to park through incentives and supports; and providing tenants with access to legal and technological support services. Government also can call on related and supporting industries to provide cooperation and support to knowledge-based firms within park.

Proceedings of International Conference for Entrepreneurship, Innovation and Regional Development
ICEIRD 2014
482
REFERENCES
1. Asheim E, Bjørn T, Coenen L., Knowledge bases and regional innovation systems: Comparing Nordic clusters. Research Policy. 2005, 34 (8):1173-1190.
2. Bigliardi B, Alberto I D., Nosella A., Petroni G. Assessing science parks' performances: directions from selected Italian case studies. Technovation. 2006,26 (4):489-505.
3. Bart C, Wright M, Lockett A, Van de Velde E, Vohora A., Spinning out new ventures: a typology of incubation strategies from European research institutions. 2005, Journal of Business Venturing, 20 (2):183-216.
4. Cooke P, Morgan K, The Associational Economy: Firms, Regions and Innovation.1998, Oxford University Press, Oxford England.
5. Hung-bin D, Abetti P, The Entrepreneurial Success of Taiwan: Synergy between technology, social capital and Institutional Support. Advances in the Study of Entrepreneurship, Innovation, & Economic Growth. 2005, 14: 91-123.
6. Longhi C, Networks, Collective Learning and Technology Development in Innovative High Technology Regions: The Case of Sophia-Antipolis. 1999, Regional Studies. 33 (4):333-342.
7. Löfsten H, Lindelöf P, Determinants for an entrepreneurial milieu: Science Parks and business policy in growing firms. 2003,Technovation, 23 (1):51-64.
8. Phan P H, et al. Science parks and incubators: observations, synthesis and future research. 2005, Journal of Business Venturing, 20 (2):165-182.
9. Hansson F, Husted K, Vestergaard J, Second generation science parks: from structural holes jockeys to social capital catalysts of the knowledge society. 2005, Technovation, 25 (9):1039-1049.
10. Koh F., Koh W, and Tschang F T, An analytical framework for science parks and technology districts with an application to Singapore. 2005, Journal of Business Venturing, 20 (2):217-239.
11. May Z Y, The science park phenomenon: development, evolution and typology. 2005, International Journal of Entrepreneurship and Innovation Management, 5, 138-154

483 Proceedings of International Conference for Entrepreneurship, Innovation and Regional Development
ICEIRD 2014
Challenges in developing online business networking competencies for Albanian and Estonian business students
Oliana Sula 1, Tiit Elenurm 2
1UAMD, Lagjia Currila 1., Durres, Albania , [email protected]
2EBS, Lauteri 3 ., Tallinn, Estonia , [email protected]
Online business networking competencies are essenti al in the global digital village. The effective use of social media is one of the mos t trending topics of actuality debates, some will argue that social media is usele ss and a waste of time but we cannot deny the importance of social media in the t ransformation of the ways of doing business and recognizing business and entrepreneuri al opportunities. The power of social media is continually increasing, especially online social networks are creating new inter-regional entrepreneurship opportunities e ven in Eastern European countries where this concept seemed an utopia two decades bef ore. Students in Eastern Europe are enthusiastic and active users of online social networks but they have limited networking competencies for finding the best online business networks and using effectively online social networks in order to iden tify business opportunities. This paper maps online social networking priorities for students and reveals gaps barriers in online social business networking competencies. Online social networking orientation of Albanian and Estonian business stude nts is compared taking in consideration their entrepreneurial orientation and business ambition. Pilot questionnaires were conducted to 90 bachelor and MB A students in Management at the Faculty of Economy at the University of Tirana in Tirana, Albania and at Estonian Business School in Tallinn, Estonia. The results of the pilot questionnaires were discussed at the end of lectures in order to receiv e feedback from the students. Content based analysis of pilot questionnaires was the main research tool. Results show that students in both countries are involved in online social networking but the lack of trust in virtual networks, the physical dis tance , the quality of information, the challenges of knowledge sharing and the absence of real time feedback prevent them from an effective use of those networks. Estonian s tudents are more involved in Google+ and Albanian students are more active Insta gram users. There are no major differences in the results between bachelor student s in two countries, but there are some differences between the answers of bachelor an d MBA students. It is a consequence of work, business or entrepreneurial ex periences of MBA students in two different business environments. A list of sug gested online networking competencies for students is elaborated for further action research on building entrepreneurial virtual teams of Albanian and Eston ian business students.
Keywords Business Opportunity, Inter-regional Co-operation, Networking Competencies, Social Media, Young Entrepreneurs

484 Proceedings of International Conference for Entrepreneurship, Innovation and Regional Development
ICEIRD 2014
1. Introduction
Global market is the main consequence of globalization, it means new cross-border business opportunities. The technological revolution brought social media tools which facilitated socializing and networking opportunities all over the world. Business students from former command economies, including Albanian and Estonian business students, are part of this globalization generation Y that is used to online communication but they do not always have clear virtual networking priorities for business development [1]. Knowledge acquisition and learning through networks are important for successful entrepreneurial initiatives [2]. Student Entrepreneurship is a challenge for higher education institutions, for policy makers as entrepreneurship is a way of accessing to employment. In the global digital village students can find business opportunities everywhere in the world. Online social business networking is a tool of business and entrepreneurial international network building. The two main research question of this paper are:
• What are the principal perceptions and gaps in online social business networking of Albanian and Estonian business students?
• What online social networking competencies are needed for entrepreneurs and to recognize business opportunities?
In section 2 an overview the literature on the importance of networking competencies in the entrepreneurial process is presented. The research methodology and its outcomes are treated in section 3 and section 4. We conclude by setting a typology of online business competencies for business students which can help actors who are involved student entrepreneurship and youth policies but also it can serve as basis for a further research in effectively using those competencies in virtual teams building.
2. Networking competencies and the entrepreneurial process
Network building in business is influenced by social structures or the holistic perception of networks [3], human action is a key factor for the development of networks [4]. Networks and especially innovative networks add an original dimension to business and to entrepreneurship. Networks are a particular conceptualization of entrepreneurship where different actors can participate and exchange [5] [6], they incorporate formal and informal relationships. Entrepreneurship in one hand is characterized by independence and individualism but in the other hand when it comes to networks entrepreneurs should deal with some notions such as dependent ties of trust and cooperation. Entrepreneurs with collaborative goals tend to be more successful than those who do not have cooperative goals [7]. Entrepreneurs can bring and can have benefits from networks such as resources, equipment and competencies [8]. With the adoption of online social networks finding business opportunities, business partners, making contacts, exchanging knowledge can be handled virtually [9]. Business online social networking compared to social face-to-face networking for business implies not only exchanging knowledge and building trust but also managing to continue in the long term online social networking [10]. Networking among young people and especially among student is formally influenced by the enrolment in higher education institutions or other formal networks that target youth [11]. It is also intensified by interpersonal and personal relationships that students have. Culture plays an important role, in some cultures students are attached and live with their families, in some others they are more independent. Networking competencies are very important for entrepreneurs as entrepreneurship is itself “network-oriented”. Networking competencies include knowledge, skills and attributes of an individual to fulfil a role through networking. Ezumah [12] presents survey results of US

485 Proceedings of International Conference for Entrepreneurship, Innovation and Regional Development
ICEIRD 2014
college students demonstrating the dominant position of Facebook, raising popularity of Twitter and low popularity of LinkedIn. 32% of respondents answered that they had never heard of LinkedIn. 98% of respondents mentioned keeping in touch with friends as the number one reason for using social media networking sites. Making professional and business contacts were mentioned only by 27% and learning by 26% of respondents. A challenge of the 21st century is to find the right combination of face to face and online networking competencies and to enhance skills of students for finding these online networking tools that support them as independent professionals and entrepreneurs.
3. Parallel research sessions in Estonia and Albani a
During the period from October 2013- December 2013 pilot questionnaires were distributed to 55 bachelor students in Business Administration and MBA students at the Faculty of Economy at the University of Tirana and to 45 bachelor and MBA students at Estonian Business School. The questionnaires were distributed during classes that were related to the questions of the questionnaire so the students would be familiar with the topics. In Albania questionnaires were distributed during the classes of Entrepreneurship and SME Management for bachelor students and Management Skills for MBA students. In Estonia questionnaires were distributed during the classes of Entrepreneurship for Bachelor students and of International Business Opportunities for MBA students. Pilot questionnaires were elaborated in order to collect qualitative and quantitative data with perspective of a future action research. Students had to answer Likert scaled questions about their involvement in face- to-face business networks and with whom they discuss their business ideas. In the questionnaire there were also two open questions about student's perception about online social networking as business tool and their involvement in online social business networks. The size of the groups was small. It allowed discussing the survey results at the end of the lectures and getting student's feedback.
4. Comparison of networking priorities and networki ng challenges of Albanian and Estonian business students
There are three main issues related to the online networking tools and content based on the analysis of two open questions: preference for online social networks with social profiles such as Facebook or Instagram, a skeptical perception of online social networks as business networking tools, an alternative use of other social media such as blogs for entrepreneurial knowledge sharing and recognizing business opportunities.
4.1 Online social networks with social profiles versus online social networks with business profiles.
1. Facebook (www.facebook.com): 80% of the students in both countries seem to be oriented to get involved in online social networks such as Facebook and Instagram for business purposes and for sharing business knowledge. During the discussions most of them stated that they prefer an all in one online social network profile and they would prefer also not to have several online social network profiles. Students in Albania also considered that using Facebook through the page creation option is an excellent tool to manage at the same the personal online social profile at the same time a real time management of your business activities that are Facebook pages. Through Facebook pages 60% of the students in both countries get also business information and through comments on specific business or civic pages their share and exchange knowledge. Especially MBA students because of their other engagements find time consuming being in many virtual networks.

486 Proceedings of International Conference for Entrepreneurship, Innovation and Regional Development
ICEIRD 2014
2. Instagram (www.instagram.com): 37.5% of Albanian bachelor students mention Instagram as a source of business information. When the results were discussed in class, at a first time it was perceived as a paradox to think about Instagram as an online social network that you can be used for business opportunities, but one student who was involved in the photography business affirmed that most of time he could find new clients or new places to photograph though Instagram and especially through the right hashtags. This shows that bachelor students are continually more updated about new trends in online social networking.
3. Online national or regional social networks with a social profile: they are not cited in the answers of the students as a source where they can get business information and recognize business or entrepreneurial opportunities.
4. Other online social networks with a social profile: Youtube (www.youtube.com) is cited only by 4% of the students and Google+ (plus.google.com) only by 10% in both countries. There was view that Youtube can be only used effectively for business by expert online video tutorials or the so called how-to videos. Google+ is cited mostly by Estonian students. Albanian students argued that they hardly use Google+ and they are not so interested to know how it works. One Albanian MBA student with Turkish origin pointed out A Small World (www.asmallworld.com) as very effective and private for business and also Internations (www.internations.org) as a networking tool for expatriates.
4.2 Online Social Networks with a Business Profile
• LinkedIn (www.linkedin.com): in both countries bachelor students are not very active on LinkedIn, only 15% of the Albanian bachelor students is involved in LinkedIn but during the discussions they stipulated that they do not use LinkedIn a lot as they are still students and do not work. 25% of the Estonian Bachelor students considers LindkedIn important for business connections. During the discussions with Estonian MBA students which are more active users of LinkedIn than Albanian MBA students and seem to know the dynamics of this networks better, students stipulated that the use of LinkedIn in Estonia cannot be compared with the use of this in countries such as Sweden were users have benefits in their jobs or businesses. Some MBA students in Albania stated that they had a LinkedIn profile because they were obliged by the company where they work. The rudimentary use of LinkendIn in both countries shows that students in both countries do not consider this platform important for business or for their profession.
• Other online social networks with a business profile: Xing (www.xing.com) where participants can promote themselves in the venue and participate to groups which are topic oriented, Ryze(wbo-network.ryse.com) is a business online networking who enables participants to create special networks following the logic of special groups, Eacademy (www.eacademy.com) is a business network who allows to seek business experts. All those networks but especially XING which is most known worldwide seem to not be considered by students as a possible source of networking.
• Some MBA students stressed the importance of such business platforms as Zoominfo(www.zoominfo.com) or Spoke(www.spoke.com) which create business profiles without human input.
4.3 Blogging as a tool of recognizing business opportunities
20% of bachelor students in Albania and 15% of bachelor students in Estonia find following different blogs as a powerful source of getting information about business. They follow blogs of international specialized magazines such as the Economist or blogs of famous persons, in

487 Proceedings of International Conference for Entrepreneurship, Innovation and Regional Development
ICEIRD 2014
the questionnaires they do not specify names. Following blogs, commenting and engaging in discussions can lead to a first stage of network building.
4.4 Business networking gaps in online social networks
Student's perception about the barriers of online social networking for business are similar in both countries. Online networking building for business opportunities and entrepreneurship seems to be blocked by these factors:
• The lack of trust in business relationships that can emerge from those networks: students are not very comfortable to talk with strangers. They fear the absence of physical contact and the fact that someone can have a double personality; they can build an online personality which can be very different from their real personality. 2 Estonian MBA student and 1 Albanian MBA student consider themselves as more a face-to-face person in business. It is challenging to see how a face-to-face person can be transformed to an online person in business with the adequate online networking competencies.
• Physical distance and technical problems: students consider that physical distance and technical problems can cause problems in receiving feedback in real time.
• Communication problems: Conflicts are very difficult to be resolved online. The absence of non-verbal communication can be time consuming. Verbal communication is never the same as in face-to-face networking. Students need to develop communication skills for social networks.
• The quality of information and of knowledge shared: Students do not rely fully on the information in online social networks. They feel that sometimes are overloaded with information and some other times they have to little information on important topics. Bachelor Students in both countries seem to use online social networks especially Facebook Group tool for knowledge sharing with their colleagues and friends.
5. Mapping online networking competencies for busi ness and entrepreneurship
The active virtual networker is defined as a dedicated networker which spends most of the time working online [13] while the social networker spend most of its time in building relationships and the inquisitive networker will be focused in recognizing opportunities from information. The effective business networking in online social networks for students requires a combination of the qualities of the virtual networker and of the social networkers. Universities and especially mentors, coaches, fields projects, business networking courses in the curriculum play a crucial role in developing online social networking competencies .
5.1 The typology of online social business networking competencies
The main online networking competencies suitable for students are:
1. Technical competencies: they are influenced by the operational configuration of the network and by its infrastructure. Students should be able to develop some basic technical skills that specific for social media and online social networks such where to use different elements and where to use them such as links, tags or hashtags. They

488 Proceedings of International Conference for Entrepreneurship, Innovation and Regional Development
ICEIRD 2014
should be able to understand the difference between different platforms for example: Facebook and LinkedIn.
2. Creative competencies: they are required to personalize business or entrepreneurial profiles. Some basic technical creative skills mostly in graphic design are sometimes needed. Students should be able to balance creativity with ethical concerns and optimize between transparency and privacy.
3. Storytelling competencies: they can help students to promote themselves and their ideas. Storytelling in a online social network in order to be attractive has to be short and catchy without being victims of the blogging's style.
4. Effective communication competencies: online social networks require immediate reaction through responding quickly but saying a little.
5. Relationship building competencies: long term contact building process based in trust in online social networks in challenging. Too many contacts can usually be a good thing, but students should be able to filter them periodically and constantly. It is not only important to have contacts but also to know and be willing to discover what opportunities are associated with them. You cannot build business relationships or identify business or entrepreneurial opportunities especially online without taking risks and without willing to learn and exchange information.
6. Interpersonal competencies: empathy will determine the impact of interpersonal competencies in building not only business relationship based on trust but also will allow you to build your own networking capability. The first step of building interpersonal skills is the identification of the personal behavioral style.
7. Monitoring competencies: contacts and information should be monitored and filtered on a regular basis. Students should learn also how to deal with myths and misconceptions about online social networks such as for example: proximity with LinkedIn contacts is good business but the proximity with Facebook contacts is bad for business.
6. Conclusions
Online social networks are not still viewed as a tool for business and entrepreneurial opportunity recognition. The students of our sample come from two different national background but their perception about the effective use online social networks for business is similar, the result of the gaps online business social networking skills and networking barriers in online social networks confirm it. There are differences in the networking competencies of bachelor and MBA students. Bachelor students lack knowledge for the effective use of business online networking competencies and business relationships. MBA students are older and because of their family and work obligations less active in online social networking. Even if they have experience in network relationship building and interpersonal competencies, they prefer face-to-face networking because of the absence of time and trust. There is a need for developing effective communication skills than combine online and face-to-face networking opportunities. Bachelor students, who are part of this young generation evolving, use effectively technical competencies and creative competencies but they lack monitoring competencies and relationship building competencies. In order to be a successful online social networker with entrepreneurial and business intentions students. The map of networking competencies can help students, educators, trainers, mentors and policy makers who are interested in building online virtual teams or who want to train and mentor online virtual teams. This paper can serve as base for further research in building entrepreneurial virtual teams of Albanian and Estonian students. Further research should also take into consideration the social background of the students and their professional or entrepreneurial experience in

489 Proceedings of International Conference for Entrepreneurship, Innovation and Regional Development
ICEIRD 2014
order to determine their influence in the process of online business networking competencies building. The sample can include also high school students considering that programs such as Junior Achievement are active in both countries.
References
1 Bolton, R. N., Parasuraman, A., Hoefnagels, A., Migchels, N., Kabadayi, S., Gruber, T., Solnet, D.
Understanding Generation Y and their use of social media: a review and research agenda. Journal of Service Management; 2013; 24(3), 245-267.
2 Ruiz-Arroyo, M., Fuentes-Fuentes, M., Bojica, A., Rodríguez-Ariza, L. (2012) “Innovativeness and performance in women-owned small firms: the role of knowledge acquisition”, Journal of Small Business and Entrepreneurship; 2012; 25(3); 307-326.
3 Håkansson H ,Snehota I. Developing Relationships in Business Networks, London: Thompson;1995
4 Conway S.,Steward F. Mapping Innovation Networks. International Journal of Innovation Management;1998; 2 (2);165-196.
5 Freeman C. Networks of Innovators: A Synthesis of Research Issues, Research Policy;1991; 20; 499-514.
6 Jack S , Dodd, S D. Anderson A R. Change and the development of entrepreneurial networks over time: A processual perspective. Entrepreneurship & Regional Development: An International Journal;2001; 20(2);125-59.
7 Tjosvod D,Weicker D .Cooperative and competitive networking by entrepreneurs: A critical incident study. Journal of Small Business Management;1993;January; 11-21.
8 Burt S R. A note on social capital and network content. Social Capital;1997;19;355-373 9 Gassman O, Von Zedtwitz M. (2003) Trends and determinants of managing virtual R&D teams,
R&D Management;2003;33(3);243-62. 10 Hardwick J , Cruickshank D, Anderson R A. Innovation in small business: comparing face-to-face
with virtual networking. Journal of Business Strategy;2012;33(5);51-58. 11 Elenurm T. Entrepreneurial Knowledge Sharing about Business Opportunities in Virtual Networks.
Proceedings of the 8th European Conference on Knowledge Management; 2007; 285 - 290. 12 Riddle D .Networking Successfully International Trade Forum; ABI/INFORM Global; 1998;
3;13. 13 Ezumah, B.A. College students’ use of social media: Site preferences, uses and gratification,
International Journal of Business and Social Science; 2013; 4(5); 27-34.


491
AUTHOR INDEX A
Abad C. ............................................................. 3 Aguirre J. ........................................................ 42 Álvarez P.......................................................... 3 Anagnostopoulos C. ...................................... 329 Anisic Z. .......................................................... 13 Antic Z. .......................................................... 265 Arafa Y. ......................................................... 344 Aschenbrenner S. ........................................... 53
B Badida M. ...................................................... 145 Bala G. .......................................................... 336 Baresel-Bofinger A. ....................................... 306 Baruah B. ...................................................... 229 Bogetic S............................................... 133, 265 Boldyreff C. ................................................... 344 Borocki J. ........................................................ 13 Borzillo S. ...................................................... 315
C Caragea A. .................................................... 315 Cardrazco M. . ........................................ 42, 220 Carmona-Martínez M. ..................................... 53 Ciocanel B..................................................... 336 Cockalo D. .................................................... 133 Coric I. .......................................................... 425
D Dabic M. ........................................................ 200 Deaconu A. ....................................................... 3 Decman N. ...................................................... 73 Diaconescu T. ................................................. 22 Dordevic D. ................................................... 133 Dötsch J. ......................................................... 97 Dragičević M. ................................................ 183 Drazic M. ....................................................... 259 Durica M........................................................ 265
E Eckardt M. ..................................................... 394 Elenurm T. .................................................... 483 Eremeeva E. ................................................. 286 Espinoza A. ....................................................... 3
F Fadiloglu M. .................................................. 107 Filiopoulou E. .................................................. 83
G Gašpar D. ...................................................... 425 Gedminaite-Raudone Z. ................................ 365 Globan T. ....................................................... 384 Gusarova S. .................................................. 191 Gosteva E. ..................................................... 286
H Hadžić M. ...................................................... 160 Herceg T. ....................................................... 200 Heupel T. ......................................................... 53
I Ivanovic M. .................................................... 265 Ivanus G. ............................................... 464, 473
J Janevska D. ................................................... 123 Ježovita A. ..................................................... 150 Jinaru A. ........................................................ 315 José Ayala M. .................................................... 3 Jovančević R. ................................................ 384 Joy Morris M. ................................................. 344
K Kalogeras A. .......................................... 329, 434 Kandiliari F. ................................................... 306 Katsavounis S. .............................................. 415 Ketikidis P. ............................................... 32, 306 Kralikova R. ................................................... 145 Kukolj D. ........................................................ 259
L Lalevic-Filipovic A. ......................................... 210 Lansdale D. ....................................................... 3 Lilja K. ............................................................ 117
M Mabic M. ........................................................ 425 Mamić Sačer I. .............................................. 249 Marin A .......................................................... 473 Matkovic P. ...................................................... 22 Melkas H. ...................................................... 374 Mettouris C. ................................................... 296

492
Michalakelis C. ................................................ 83 Mircea Axinte S. ............................ 336, 464, 473 Mitropoulou P. ................................................. 83 Moyseos M. ................................................... 415 Mukhopadhyay S. ......................................... 405 Müllerleile A. ................................................. 277 Müllerleile T. .................................................. 277
N Nikoloska E. .................................................. 447 Nikoloski I...................................................... 447 Novak A. ......................................................... 73
O Obadić A. ...................................................... 183 Oikarinen T. .................................................. 374 Orcik A. ........................................................... 13
P Papadopoulos G. .......................................... 296 Patsianis N. ................................................... 415 Pavlović P. .................................................... 160 Peci F. ........................................................... 170 Polenakovik R ....................................... 123, 447 Prakapiuk S. .................................................. 394
R R. Jovanovski B. ........................................... 447 Radovic M. .................................................... 210 Rinkinen S..................................................... 374 Rodionov I. .................................................... 286 Rojas D. ............................................................ 3 Rueda G.................................................. 42, 220
S S. Lojpur A. ................................................... 210 Sakal M. .......................................................... 22 Schrammel T. ................................................ 239 Semenov A. .................................................. 286 Seppänen S. ................................................. 117 Sever I........................................................... 249 Sever Mališ S. ............................................... 150 Sobotova L. ................................................... 145 Solomon A. ..................................................... 32 Staiou E. ............................................... 107, 357 Stehr C. ......................................................... 394 Stojkov G. ..................................................... 123 Stolz T. .......................................................... 239 Straub T. . ..................................................... 315 Sula O. .......................................................... 483
T Taneva T. ........................................................ 32 Tekic Z. .................................................... 13, 259 Tumbas P.. ...................................................... 22
V Velkovski T. ................................................... 447 Verrocchi G. .................................................. 434 Vitas M. ......................................................... 259 Vlajcic D. ....................................................... 200 Voicu-Dorobantu R. ....................................... 315 Vorkapic Rade ............................................... 457 Vorkapic Radoš ............................................. 457
W Ward A. ......................................................... 229 William Joenssen D. ...................................... 277
Y Yeralan S. .............................................. 107, 357
Z Zabijakin Chatleska V. ..................................... 64 Zaharis N. ...................................................... 306 Zager K. ........................................................... 73 Žager L. ......................................................... 150 Zelitchenko A. ................................................ 349

493
The 8th International Conference for Entrepreneurship, Innovation and Regional
Development www.iceird2015.com
June 2015, University of Sheffield, UK Bouncing Forward: Economic Resilience, Smart
Growth and Competitiveness As European economies gradually emerges from crisis and recessions, it is more important than ever that entrepreneurship and innovation are fostered. How successfully nations and regions navigate away from the crisis will determine their long-term resilience, competitiveness and wealth. Critically it is not bouncing back, it is about bouncing forward. This conference provides a forum to engage with the latest research, policy and practice relating to the support and promotion of entrepreneurship and innovation. This conference will draw together academics, key decision makers from government, and economic development practitioners to discuss strategies for future
growth. The ICEIRD 2015 conference will feature: keynote speakers, parallel tracks, roundtable discussions and practitioner workshops. For further information, please email: [email protected]