icafis - case study of impact of climate change on marine fish cage aquaculture in cat hai district,...
TRANSCRIPT
International Collaborating Centre for Aquaculture and Fisheries Sustainability - ICAFIS 1
Case study of impact of climate change on marine fish cage
Aquaculture in Cat Hai district, Hai Phong city, Vietnam
Nguyen Thi Ngoc Trang1, Tuong Phi Lai1, Trinh Quang Hieu1, Pham Thi Thu Thao1 (1) International Collaborating Centre for Aquaculture and Fisheries Sustainability.
Email: [email protected]
Abstract Extreme weather events can have serious impacts on aquaculture in Cat Hai district, Hai
Phong province, Vietnam. This report studied the perception of fish farmers in Cat Ba island on how climate change impacts fish production, as well as tested a new structural material (cooper alloy) for cage production which can better stand up to changing environmental conditions. The study demonstrated that more than 70% of farmers identified aqua-disease outbreak, increased frequency/severity of storms and typhoons, unpredictable rainfall and increased temperatures as key issues of climate change having a negative impact on marine aquaculture in Cat Ba. The loss of farmed fish due to climate change effects is estimated to represent about 30-40% of the incomes of households surveyed, and more than 80% of the infrastructure costs for marine-fish farming (cage, temporal watch camp, houses) are due to climate change effects. Also, the study examined how copper alloy cages minimize negative environmental effects of climate change on marine-cage aquaculture in Cat Ba island. Using copper alloy cages will not only will resist destruction from storms and strong wave/currents better than the traditional nylon cages, but also may improve fish growth rate and survival. The feed conversion rate (FCR) is higher than for the traditional nylon cage, therefore the cooper alloy cage can provide a more secure income and livelihood for fish-farmers. Finally, it is recommended that marine fish farmers diversify the number of species farmed, relocate cages into more stable areas during the storm season, consolidate cages and apply best practices to improve the resilience of their livelihoods to changing conditions associated with climate change.
Keywords: marine aquaculture, grouper, climate change, copper alloy mesh cages, nylon
cages.

International Collaborating Centre for Aquaculture and Fisheries Sustainability - ICAFIS 2
1. Introduction
1.1. Overview of climate change globally and within Vietnam Climate change, including global warming and sea level rise, is one of the biggest
challenges faced by humanity in the 21st century. Vietnam has been identified as one of the top-five countries most influenced by climate change (World Bank 2008), especially in the frequency and severity of storms, as well as sea level rise. The report of IPCC 2007 stressed that average sea level would increase from 43 cm to 81 cm in year 2100 and average temperature will rise by 1,4 to 4C (4). According to climate change models for Vietnam, by the end of this century, the average temperature will rise about 2 to 3 C (compared to the 1990-1999 average) and sea level will climb by 57 to 73 cm. According to the predictions of the Ministry of Environment and Natural Resources (2012), compared to 50 years ago, the average temperature in Vietnam has increased by 0.5C (10,7) and there has been a 20% increase in the number of floods. Rainfall trends predict a reduction in the North and an increase in the South of Vietnam (12). These changes have direct ecosystem effects, causing many species to disappear or to migrate elsewhere (3).
Table 1: Top-ten countries affected by climate change over the next 10 years
TT
Flood (inundation)
Drought Storm Sea Level Rise
1 Malawi Bangladesh Philippines All Low-Lying Island States
2 Ethiopia China Bangladesh Vietnam
3 Zimbabwe India Madagascar Egypt
4 India Cambodia Vietnam Tunisia
5 Mozambique Mozambique Moldova Indonesia
6 Niger Laos Mongolia Mauritania
7 Mauritania Pakistan Haiti China
8 Eritrea Srilanka Samoa Mexico
9 Sudan Thailand Tonga Myanmar
10 Chad Vietnam China Bangladesh Source: World Bank, 2008
It is predicted that approximately 10 to 12% of the Vietnamese population will experience direct effects of climate change and GDP will decrease by about 10% (7). These effects will hamper progress made in poverty reduction and sustainable development. According to the United Nations Development Programme (UNDP 2007), if sea level rises about 1m in

International Collaborating Centre for Aquaculture and Fisheries Sustainability - ICAFIS 3
Vietnam, 5% of land area will be lost, 11% of the population will lose their homes and 7% of agricultural output will be lost (11).
Climate change is seriously affecting the aquaculture industry. Calculations from GSO show that marine surface area utilized by aquaculture practices has decreased over time. The average annual growth in aquaculture surface area for the period 2001 to 2005 was 5,98%, from 2006 to 2011, 2,17%, and lastly, from 2001 to 2011, 3,71%.
Table 2. Forecasting trends in aquaculture surface area coverage (Vietnam Institute of Economics and Planning, 2012)
No Area Scale of Vulnerability
(1-4, with 1 being less vulnerable, 4 being
extremely vulnerable)
Land area 2012 - 2015
(ha)
Land area 2020 (ha)
1 Northeast 4 1.169 1156 2 468.096 466.834 3 17.325 16.750
2 Northwest 4 674.913 622.749 2 3.457 3.096 3 1.522 1.542
3 Red river delta
4 15.586 15.018 3 31.909 30.634 3 23.641 23.104 1 14.464 14.964
4 Central North
3 26.326 23.832 4 17.093 16.168
5 Central South
3 147.740 157.156 4 14.306 14.189
6 Central Highlands
3 791.100 726.718 4 8.563 7.092
7 Southeast 3 6.858 7.211 1 369.954 367.583
8 Mekong delta
3 104.930 96.621 4 437.830 416.296
Due to increasing temperatures favorable for the growth of harmful microorganisms,
animal diseases within aquaculture productions will increase. Fluctuations in temperature and precipitation can have major impacts on the quality of aquaculture as well. The combined effects of unseasonal rain and pro-longed heat will dramatically change the environment, especially pH, temperature and salinity. These rapid changes in environment, place additional stressors on cultivated species that negatively affect their development.

International Collaborating Centre for Aquaculture and Fisheries Sustainability - ICAFIS 4
Storms and tropical low pressure systems can cause extensive damage to aquaculture systems. The loss in aquaculture production caused by storms and floods in the North and North Central Vietnam was 78.771.147 billion VND from 2000 to 2010. Storms and floods swept away and destroyed 1.171 and 11.326 fishing boats, respectively, with 22.146.94 hectares of aquaculture flooded; 1.263.1 tons of fish swept away and 38.920m3 shrimp ponds destroyed (8).
Cat Hai district is an archipelago located about 60 kilometers southeast of Hai Phong city. The total natural area is 345km2. Natural terrain boundaries of Cat Hai district divide it into two separate areas; the Cat Ba consists of 366 large islands in the island system of South Ha Long Bay and Lan Ha Bay belongs to Cat Hai district. These are unique natural conditions due to the formation and distribution of rocky islands, shallow average depth (5-10m) and stable salinity (25 to 28% in the rainy season, 30 to 33% in the dry season) (2). The aquaculture industry has been rapidly growing in this region and cage fishing has emerged as a new trend. Before the year 2000, the number of fish cages were few, however by 2013 the number of fishing boats was 488 and the number of cages up to7.795, with annual production reaching 4.539 tons. The high economic value species include; Epinephelus spp and Lujanus campechanus.
In recent times however, marine farm areas have been negatively affected by disease, with a lack of clear solutions identified. Through a joint effort between the International Center Collaborating Centre for Fisheries and Aquaculture Sustainability (ICAFIS) and the International Copper Alliance (ICA), a pilot study was designed and implemented in Cat Ba island. The main objective of the project was to transfer marine fish cage technology and study the feasibility of using copper cages in Cat Ba island, Vietnam. The study also evaluated whether using copper alloy marine fish cage has economic benefits, environmental impacts and its ability to ensure food safety and quality. Testing of water quality was also an important component of the study.
Since Jan 2015, through the financial support of MCD, ICAFIS conducted an additional study to understand how copper alloy reduces negative impacts of climate change on the marine environment. This study was conducted through a combination of scientific data and local knowledge collected by the participatory rural appraisals (PRA) approach of which includes the involvement of local farmers and agencies.
2. Materials and methods
2.1 Study location and duration The study was conducted in Cat Ba island, Cat Hai district, Hai Phong province, between
Jan 25th 2015 to 30th June 2015.

International Collaborating Centre for Aquaculture and Fisheries Sustainability - ICAFIS 5
Figure 1: Studying location (red spot is studying location)
2.2 Methods
2.2.1 Primary data collection included field based staff observation, water tests, in-depth interviews and questionnaire surveys.
a) Perception study design The perception study was conducted using a household questionnaire survey, group
discussions, Venn diagrams, seasonal Calendar techniques of PRA and SWOT with the fishing community. In total, there were 111 households engaged in the perception survey, and 90 people engaged in PRA exercises (fish-farmers, local people) and informal interviews (Government, mass-organizations, academia, private sectors).
b) Test design of copper alloy cage and nylon cage (control): This test was designed to evaluate fish growth rate, survival rate and FCR of cultivated
fish species between copper alloy and nylon cages (control). The experiment was conducted with six cage-units in two farms (Mr. Toan and Mr. Luyen). There were 3 copper alloy cages per farm, measuring 3x3x3m square (Mr.Toan’s farm) and 2x2.5x3m square (Mr. Luyen’s farm) and the same number and sizes applied for control cages (nylon material).
Data was collected by field staff of ICAFIS (simple water test, field observation, fish weight and count, FCR and mortality) based on water and fish tests conducted by Lab staff of the Research Institute for Aquaculture No 1 (RIA1).

International Collaborating Centre for Aquaculture and Fisheries Sustainability - ICAFIS 6
Table 3. Cage descriptions at stocking
PARAMETER Farm of Mr. Luyen
Farm of Mr. Toan
Cage Unit (CAM and control): Length x Width x Height
2.0x2.5x3.0
3.0x3.0x3.0
Water depth (m) (no tide) 3.5-4 7
Water depth (m) (tide) 7-8 10
Bottom type mud Mud
Number of stocking events (no. of fingerling* per m3) *Fingerling size (30-40 fish/kg)
≈35
≈35
Harvested fish* (kg) per cage
400-500 200-300
c) Sample collection: water and fish sampling The study team collected more than 360 fish for fish tests over the 12 month experiment
(fish growth, parasites, toxins in fish muscle). More than 30 water samples were collected for the evaluation of temperature, pH, salt, coliform, NO2, NH4, Zu, Cu, BOD, COD5, in the copper alloy and control cages at 500m and 5000m from the cage site (2).
3. Results and discussions
3.1. Overview of marine cage aquaculture in Cat Ba island, Hai Phong province Cat Ba is one of the largest marine fish production sites in Hai Phong province, Vietnam.
Today, fish cages are mainly concentrated in areas such as; Cat Ba Bay (16 farms, 123 cage units); Ben Beo Bay (309 farms, 5419 cage units), Lan Ha Bay (120 Farms, 1868 cage units), Tra Bau Bay (12 farms, 84 cage units; 130 mollusk raft cages), and finally in Gia Luan commune and Thoi Island (16 farms, 72 cage units; 150 mollusk raft cages). Currently, the total number of marine farms in the area is over 473; 7566 cage units and and 280 mollusk raft-cages, with an annual production of over 2.000 tons (9).

International Collaborating Centre for Aquaculture and Fisheries Sustainability - ICAFIS 7
3.2. Perception of fish-farmers on climate change effects in Cat Ba island, Hai Phong, Vietnam
Table 4: Climate change effects (within the last 10 years) perceived by the local fishing community in Cat Ba Island (% responses)
Unit: %
Climate change impacts (within the last 10 years)
Very clear (%)
Slightly (%) No Change (%)
Other
Sea level rise 12,2 14,2 68,6 5
Temperature increase 21,4 15,3 48,1 15,1
Increase in monsoon frequency 17,3 20,5 50 12,2
Increase in rainfall 13,6 14,5 58,2 13,7
Increase in the occurance of frost 24,8 15,4 51,1 8,7
Increase in the number of thunderstorm, tropical depressions and typhoons 45,3 33,6 11,2 9,9
Extreme weather increase 88,4 5,3 3,5 2,8
Extreme environemental events (over spring tide, marine current changes) increase 16,3 24,7 53,5 5,5
Source: ICAFIS (Interview local fishing community, 2015)
In some communes within Cat Ba, there is a clear sense of climate change impacts. Despite existing as a relatively closed bay, Cat Ba is often affected by typhoons and tropical low pressure systems, rain and whirlwinds, especially in the period of July to September. In addition, the impact of sea rise level, acidification and changes in temperature could affect ocean currents. Every year, the area is directly affected by 1 to 2 storms/tropical depressions. Wind storms usually grade 9-10 (75-102 km/h) in shock level, but in some cases higher than 11-12 (103-118 km/h).
In 1999, a tornado occurred on 06/6 as a cruise ship, five fishing vessels, fishing boats sank 1; 8 people dead. 2004: 26/8 whirlwind day in northern Cua Luc do capsize, 16 people were killed. 2006: 17 people dead, 2 cranes at port broken .year 2008 :. Nearly 80% of cage aquaculture has lost, damage estimated at more than 50 billion .. 2009: 03 storms directly influence the fishing village in Halong Bay. The storm capsize in 8 deaths. In 2010, damage caused by Typhoon Conson small not for the Bat Cave: 27 vessels sank, 20 cage aquaculture completely destroyed; estimated losses of up to several billion. In 2012, super typhoon No. 8 hit the northern coastal provinces such as Hai Phong, Quang Ninh has caused heavy casualties, 10 people were killed and dozens of fish cages in Cat Hai district drifted. 2013,

International Collaborating Centre for Aquaculture and Fisheries Sustainability - ICAFIS 8
Typhoon No. 2 occurred in June as a ship was wrecked and 2,352 ha of aquaculture being overflowed causing damage dozen billionIn the National inform for Climate Change in Vietnam, climate change scenarios are summaried as follows:
Table 5. National Communication on Climate Change in Vietnam (compared to 1990)
Year Temperature (0 C) Sea level rise (cm) 2010 0,3-0,5 9 2050 1,1-1,8 33 2100 1,5-2,5 45
Source: Nguyễn Khắc Hiếu, 2008
Table 6. Temperature increases in the Northeast, North Delta and national average (compared to 1990)
Year Northeast North Delta National Average 2050 1,66 1,44 1,36 2100 4,38 3,71 3,35
Source: Nguyễn Khắc Hiếu, 2008 Temperature increases due to climate change are predicted to be greater in the Northeast,
than the national average. Temperature increases are associated with disease growth in aquatic species.
Table 7. Sea level rise predictions in Vietnam (measured in centimetres) Scenarios /year 2050 2100
A1F1 13,7 39,7 A2 12,5 33,1
A1B 13,3 31,5 B2 12,8 28,8
A1T 12,7 27,9 B1 13,4 26,9
Source: Nguyễn Khắc Hiếu, 2008 From this analysis we can see that the effects of climate change, including natural disasters
such as; storms, tropical depressions, whirlwinds, rain and prolonged heat waves are likely to increase with severity, having a major influence on the residents of Cat Ba floating villages in the future. The livelihoods of the people here depend entirely on marine resources.
In recent years, the expression of climate change is increasingly evident in Vietnam in general and in particular Halong and Cat Ba. When combined with resource depletion, environmental pollution and fewer livelihood options, fishing communities may not be able to cope with the synergistic effects of these impacts.
Due to the decline of aquatic resources in coastal areas, the amount of wild fish available to provide feed for aquaculture operations has undergone serious declines, causing the price of trashfish to increase. This trend has led to an increasing scarcity of fish farming operations due to increased operating costs.
According to Le Thanh Tuyen, manager of Biosphere Reserve Cat Ba, in the last decade temperature has increased by 0,12 0C on average compared to the years 1991-2007, and by 0,4

International Collaborating Centre for Aquaculture and Fisheries Sustainability - ICAFIS 9
0C compared to the years 1961-1990. The frequency of tropical cyclones is greatest on the Northern coast, which is where Cat Ba Island is located.
According to the Institute of Natural Resources Marine Environment, in the early 20th century within a 50 year period, sea level has risen 20 cm in Hai Phong. In the last 10 years the average temperature in the winter months has been higher than the overall average, and the average annual rainfall is decreasing.
3.2. Assessment on the impact of climate change on fishers' livelihood in Cat Ba Table 8. Climate change negative impact severity on aquaculture (% responses)
Unit: % Great
impact Moderate impact
Minimal impact
No impact
Damage to fish farm infrastructure 15,3 55,9 21,6 7,2 Life endangerment of the farm workers and/or manager 23,4 62,2 2,7 11,7 Loss of fish through escapment (e.g due to net break) 72,1 12,6 4,5 10,8 Disease and mortality 85,6 5,4 2,7 6,3 Increased costs to consolidate the farms/cage nets 58,6 23,4 10,8 7,2 Increased costs to stock the bigger fingerlings 27 45,9 25,2 1,8 Increased costs to move the farm to new areas in poor weather conditions 36,9 35,1 18,9 0
According to hydrometerology data, in recent years, the weather and climate in Vietnam
will become more complex, with natural disasters and floods occuring successively (6). Hai Phong is a coastal city where ecosystems and residents are affected by the impacts of
climate change. Typhoon and storms are becoming more difficult to predict. Heat waves are increasing in intensity, frequency and duration whereas the numbers of cold days causing damage has decreased. According to the statistics collected by Cat Hai district (1), the primary cause of damage is from the effects of storms and tropical low pressure systems.
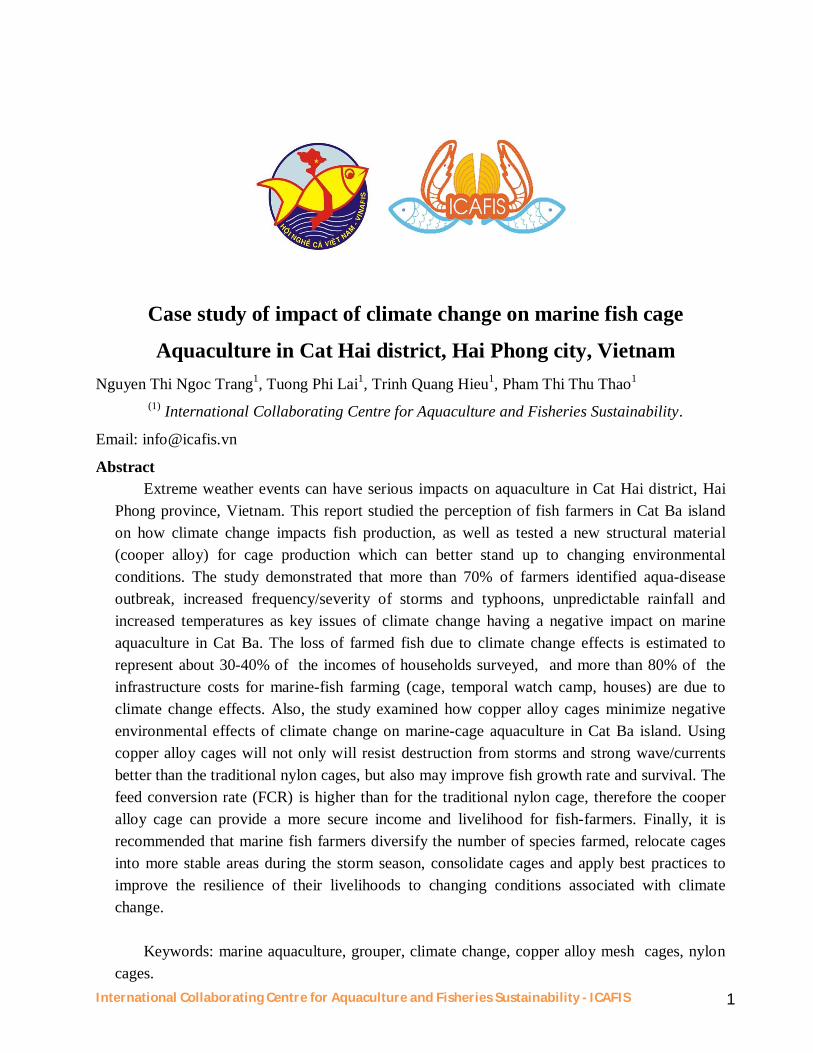
Table 9. Natural disasters from
2005-2014 in Cat Ba Year Number of Storms Number of Typhoons 2005 09 04
International Collaborating Centre for Aquaculture and Fisheries Sustainability - ICAFIS 10
2006 09 02 2007 07 04 2008 08 02 2009 11 02 2010 06 02 2011 07 02 2012 04 03 2013 08 01 2014 02 02
The effects of sea level rise are considered one of the most critical factors, affecting the
livelihood of people in coastal areas. According to a study by the Research Institute for the Management of Seas and Islands (2003) conducted in Hai Phong, the rate of annual sea level rise is 3,1 mm/year since 1993, representing the greatest impact of climate change (2). More specifically, the tides in Cat Ba in recent years are:
2012: Highest elevation of +4,4, lowest elevation of + 0,4m and average water level of 2,19m.
2013: Highest elevation of +4,5; lowest elevation of 0,3m and average water level of 2.,06m.
According to annual data, tidal flows in the Cat Ba area range from 0.4 to 1 m/s. Tides often move in a parallel direction with respect to the shore, except in the estuary, where flow direction changes depending on creek water movement. Maximum tidal speed at high tide is 50 cm/s, and at low tide 50-70 cm/s.
Based on a household survey, seawater salinity is increasing annually. The report from Cat Ba Agriculture Department in 2013, stated that salinity increased by 3%, compared to 0% in 2000. This increase in salinity will lead to a significant impact on aquaculture activities within the research area. Sea surface temperature demonstrated an increasing tend, by 1 to 1,5 0 C.
Through climate change impacts, Cat Ba must endure annual losses caused by natural disasters. Over an 8 year period (2005 to 2012) Cat Ba town suffered many devastating storms, especially, in 2005, 2008 and 2014. Respectively, 54, 60 and 15 billion VND was lost due to the effects of 9 hurricanes and tropical low pressure systems.
Storm intensity determines the amount of damage incurred. If the storm is very intense, damage will cost in the billions, where as if the storm is is light with preparatory plans in place, the cost may be in the range of 10-20 million.

International Collaborating Centre for Aquaculture and Fisheries Sustainability - ICAFIS 11
Figure 2. Typhoon impacts in Cat Ba
In the last 5-10 years, typhoons have caused property damage but no casualities. Every year, there are many the vessels lost due to storms. In 2008, storm no.8 caused 270 vessels to be lost and 261 boats (3.941 cages) damaged.
Table 10. Number of cage from 2008 to 2014
No Contend Year
2008 2010 2013 2014 1 Raft 571 568 473 463 2 Cage 10.409 9.458 7.600 7.395
The number and area of fish cages are decreasing on an annual basis. This is a result of
climate change impacts, gradually reducing aquaculture surface area. Damage caused by floods is not of interest for those involved in fish farming.
3.3. The adaptation of cage farms to climate change in Cat Ba 3.3.1. Community adaptive measures
Results from interviews with farmers and government in the fishing village of Cat Ba generated some solutions in terms of challenges associated with climate change.
Table 11. Solutions for coping with climate change
Climate change impact
Sector
Solution
Temperature increase
Capture fisheries and aquaculture Marine ecosystems Health of floating village
Close monitering of weather, air and sea temperature Fisheries and aquaculture sustainability, culture more disease resistant organisms and those less sensitive to environmental
9%
68%
23%
Household <10 10-20 >20

International Collaborating Centre for Aquaculture and Fisheries Sustainability - ICAFIS 12
temperature changes; form a conservation area and breeding ground within the bay. Conservation of marine ecosystems and coastal areas, especially coral reefs and mangroves
Sea level rise and salinization
Capture fisheries and Aquaculture, fisheries logistics Marine ecosystems and coastal habitats (including coral reefs, mangroves) Heritage area Public health of fishing village Tourism infrastructure
* Master Plan and sector planning for rising sea level and other climatic factors that are subject to change Methods to cope with climate effects including; cage design, set up, relocation, changing water flow
Typhoon and storms
Human life and property Capture fisheries, Aquaculture and fishery logistics Marine ecosystems and coastal habitats, including coral reefs and mangroves Heritage area Public health of fishing village Tourism infrastructure
Coping strategies including cage design, set up and relocation with sea rise, change in water flow Adaptive management to minimize risk Strengthen warning systems and forecast reliability
General solution for the farmers Diversification of income sources such as farming of environemtanlly friendly aquatic species, job transition through vocational training Developing tourism services such as; homestay, recreational fishing, selling souvenirs to visitors, tourist passenger boat rentals, etc. - Partition planning of the cultured area, exploitation and conservation of the bay - Participation in projects and campaigns to raise awareness regarding environmental protection and combatting climate change
Source: Consultant group, 2010 According to a survey regarding cage farms in Cat Ba, cages are directly affected by
climate change impacts. In adapting to climate change, farmers have some mitigation measures such as changing the cultivated species to those that are best suited to the change of

International Collaborating Centre for Aquaculture and Fisheries Sustainability - ICAFIS 13
environment. Typically, the farmers have cultivated seabass and fish bowl, but in recent years, due to flow and temperature changes, disease has led to high mortality rates of these species. Subsequently, the farmers have switched their cultivated species to fine redtail catfish, grouper (Epinephelus spp) and snapper.
Since 2008, the aquaculture industry in the region has experienced considerable losses from 6 hurricanes, requiring fish farmers to continuously move their cages. Climate change affects the ecosystem surrounding the aquaculture sites as well as the production itself. According to a survey of farmers, bait fish used as feed has decreased compared to previous years. In the past, the spatial distribution of cages has extended inland as far as Monkey Island or the Wind Area, but more recently, people have begun to focus their production in more sheltered coastal waters.
Because of the complex evolution of weather changes, stocking time has been altered from late March, to 1-2 months later to avoid storms and a rapidly changing environment.
Every year, costs required to repair fish cages range from 15 to 20 million (interview in April 2015). Measures for damage reduction are therefore very important.
There are many models which can be launched from the project to support farmers in further developing their livelihoods to cope with climate change activities. In particular, the use of copper alloy cages is one way to increase livlihood resilence fish farmers to climate change impacts.
Cat Hai is a district in Haiphong city which is taking the lead in aquaculture development. Fisheries production per capita has increased more than 10% and production is at 4,539 metric tons per year.
Cage fish farming is one of the key sectors in Cat Ba Island. Different species are farmed including; Cobia (Rachycentron canadum), Pompano (Stromateoides argenteus), groupers (Epinephelus spp) and snappers. These species are popular due to their high economic value. Fish cage farming however has recently encountered difficulties, such as over–development without sufficient planning leading to difficulties in controlling environmental conditions, diseases and other negative impacts. Extreme weather has also contributed to negative effects facing aquaculture. Storm devastation has negative effects on oyster cultivation, with seaweed clinging to the edge cage and making them heavier and easier to damage. Water warming combined with a lack of oxygen has resulted in a disease boom. In addition, climate change affects the ecosystem surrounding aquaculture sites. According to a survey of farmers, catching bait fish to feed farmed fish has decreased compared to previous years.
ICAFIS conducted an experiment with copper alloy cage fish farming in two farms in Cat Ba. The benefits of this type of cage is that it reduces water flow between cages and improves fish health through the reducton of disease spread including pathogens and parasites.
3.3.2 Climate smart marine aquaculture material: copper alloy vs nylon cage 3A. TECHNICAL PERFORMANCE
a. Fish growth Fish growth depends on several factors, with feed intake and farming conditions (stress) as
two of the most important. In this test, we found that fish farmed in CAM cages grew larger than in the traditional nylon cage (control).

International Collaborating Centre for Aquaculture and Fisheries Sustainability - ICAFIS 14
Table 11: Fish growth rate in CAM and CONTROL
Farm Cage Unit Weight (gr/pc)
Mr Toan's farm
CAM 1(hybrid) 628,5 ±186,4 CAM 2 378,4 ±149,8 CAM 3 322,5 ±107,6
Nylon 1 (hybrid) 620,2 ±194,5 Nylon 2 233,8 ±61,7 Nylon 3 220,4 ±67,1
Mr Luyen's farm
CAM 4 347,3 ±92,6 CAM 5 327,5 ±94,8 CAM 6 321,2 ±107,7 Nylon 4 203,2 ±71 Nylon 5 214,2 ±80,7 Nylon 6 208,6 ±66,9
Table 12 shows fish growth was greater in the CAM cages compared to the nylon control
cage, using combined results of both farms.
Figure 3: Fish Growth ratio by weight during 12 months of aquaculture (gram/fish) Fish growth for the first six months was similar between fish reared in CAM and control
cages. Six months later however, growth was greater for fish reared within CAM cages on average compared to controls. Water exchange within the control nylon cage was limited and this likely led to a reduction in feed intake and an increase in fish stress, reducing fish growth rate. In addition, the nylon cages needed to be cleaned each month due to biofouling, requiring farmers to move fish out of the cages for the cleaning duration. This transport likely influenced fish stress and injury, further reducing feed intake.
0.0
50.0
100.0
150.0
200.0
250.0
300.0
350.0
400.0
450.0
Jul Aug Sep Oct Nov Dec Jan Feb Mar Apr May Jun
CAM
Time
Gram/pc

International Collaborating Centre for Aquaculture and Fisheries Sustainability - ICAFIS 15
These result are similar to those of Gonzales et al. (2012) cultivating Atlantic Salmon in Chile. Salmon in CAM cages had higher growth rates versus nylon cages.
b. Survival/Mortality rate (CAM and control) Table 12: Average Survival rate of fish farmed in CAM and Nylon (%)
FARM CAM Nylon Mr. Toan 40,7% 35,7%
Mr. Luyen 26,8% 19,4%
Average 29,2% 18,2%
Survival rates of fish in CAM and nylon cages were different in both farms (Table 4).
Survival rates in CAM cages were on average higher (29.2%) than in nylon control cages (18.2%). Fish within CAM cages did not experience transport required for cleaning, therefore injuries were minimized and the risk of mortality was lower compared to the nylon cages which were cleaned on a monthly basis. In addition, CAM cages had better water exchange than the nylon cages, resulting in healthier fish and enhanced fish survival. The CAM cages also minimized parasite infection due to the availability of Cu++ ions.
Survival rates of fish in both farms in Cat Ba Island were low compared to fish farming operations in other parts of Vietnam (e.g. Khanh Hoa, Ba Ria Vung Tau provinces). Water quality is thought to be low in Cat Ba compared to others parts of the country, due to pollution which may explain the overall low survival rates.
Table 13: Survival rates of farmed fish in CAM and Nylon cages (%)
Farmer Cage Unit
No. Stocking fingerlings (fish
#)
Survival fish (fish #) Survival rate (%)
Mr. Toan
CAM 1 (hybrid) 1000 567 56,7
CAM 2 1000 337 33,7
CAM 3 1000 317 31,7
NYLON 1 (hybrid) 1000 742 74,2
NYLON 2 1000 148 14,8
NYLON 3 1000 182 18,2
Mr. Luyen
CAM 4 500 103 20,6
CAM 5 500 147 29,4
CAM 6 500 152 30,4
NYLON 4 500 96 19,2
NYLON 5 500 114 22,8
NYLON 6 500 81 16,2

International Collaborating Centre for Aquaculture and Fisheries Sustainability - ICAFIS 16
Survival rate of hybrid grouper were more rapid (65,45%) compared to normal grouper
(23.7%) as they were more resistance for the disease (3 disease outbreaks, very few hybrid fish were dead) as higher immunity.
c. Food Conversion Ratio (CAM and nylon control) Table 14: Food Conversion Ratio of CAM versus nylon control
FARM CAM NYLON Mr. Toan 8,6 14,9
Mr. Luyen 9,6 15,6 Average 9,1 15,2
The FCR in CAM cages was lower (9.1) than in nylon control cages (15.2) (Table 6), thus
the CAM cag provides a more economic use of feed for the production of grouper. The lower FCR observed with CAM also means that these cages are more environmentally friendly as they reduce feed waste and marine pollution. The CAM cages have smaller mesh-size compared to the nylon net, so un-eaten feed is deposited into the bottom of the cage rather than dropping to the sea floor. Slower groupers, especially weak and smaller fish, have a better opportunity to consume un-eaten feed collected in the bottom of the CAM cage, compared to in the nylon cage where these fish may not have the opportunity to feed, being outcompeted by stronger, larger fish. Thus, despite intraspecific competition, feed availability is greater for fish in the CAM cages, leading to greater average survival and fish growth.
FCR in Cat Ba was higher than in other parts of Vietnam, due to the low winter temperature experienced in northern Vietnam, and a longer farming period. In addition, the most common feed used for grouper farming in Vietnam is trash-fish caught via capture fisheries.
d. Disease/Parasite (CAM and control) In Cat Ba island, fish diseases were prevalent from July to September, 2014 and led to
mass mortalities of marine fish including grouper. The cause of death however has not been confirmed. Disease eepidemics occurred on grouper regularly over this period with mortalities reaching 70 to 80%. Very often, disease occurred when environment indicators suggested poor conditions (i.e. low oxygen, high NH3 and H2S, extreme weather etc.). Fish infected by disease moved slowly, exhibited flesh wounds, enlarged swim bladders and did not feed.
* For slot CAM 1 and NYLON 1 (hybrid grouper), fewer fish disease occurred. Fish disease led to great mortalities within the CAM and nylon cages, but was lower
(49,4%) for CAM cages compared to nylon (75,2%). For the hybrid grouper, mortalities were 43,3 % and 25,8 for the CAM1 and Nylon 1 cages respectively.
In terms of fish parasites, parasite infections in CAM fish were lower than those of the nylon net: 49.8% versus 72.3% respectively.

International Collaborating Centre for Aquaculture and Fisheries Sustainability - ICAFIS 17
Table 16. Parasite Infections level in CAM and Nylon
Months Site ID Sample Parassites (%)
0 CAM 1 41 67 0 Nylon 1 42 33 0 CAM 2 51 33 0 Nylon 2 52 67 6 CAM 1 41 33 6 CAM 2 41 33 6 CAM 3 41 34 6 Nylon 1 42 67 6 Nylon 2 42 67 6 Nylon 3 42 67 6 CAM 4 51 33 6 CAM 5 51 33 6 CAM 6 51 35
12 CAM 1 41 100 12 CAM 2 41 33 12 CAM 3 41 33 12 Nylon 1 42 67 12 Nylon 2 42 33 12 Nylon 3 42 100 12 CAM 4 51 33 12 CAM 5 51 67 12 CAM 6 51 33 12 Nylon 4 52 67 12 Nylon 5 52 67 12 Nylon 6 52 100
3B. ECONOMIC PERFORMANCE In aquaculture, profitability depends on many factors such as; growth rate, survival rate,
production cost, market price, epidemics and natural disasters. Gonzales et al. (2012) demonstrated that CAM cages supported greater fish growth than
nylon cages. Fish survival rate was 20% higher and FCR 10% lower than the nylon cage. Profits were higher in CAM versus the nylon cage.
Our study showed that, grouper farmed in CAM had higher growth rate and profitability compared to the nylon cage. After 12 months of farming, the profits earned by CAM was 65% higher compared to the nylon cage.

International Collaborating Centre for Aquaculture and Fisheries Sustainability - ICAFIS 18
Table 17: Analysis of economic efficiency of CAM and Nylon control Unit: VND
Content CAM Nylon
Initial investment
Net construction cost (depreciation 10 years) 36.600.000 3.300.000
Worker (cleaning cages) 112.500 1.020.000
Fingerling cost 135.000.000 135.000.000
Feed cost 51.445.590 38.157.000
Cost of feeding, fish care and protection services 7.500.000 7.500.000
Medicine 1.606.000 4.854.000
Operation costs 195.664.090 186.531.000
Fish value (after 12 month aquaculture)
Revenue 341.610.000 263.810.000
Net-Profit 109.345.910 73.979.000
The cost of CAM cage construction was high compared to the nylon cage (15.25 times higher, Table 9). Operational cost of CAM was abit higher than Nylon cages. However, cleaning cost of CAM was abit lower than Nylon cage. For commercialization of the CAM it is suggested that farmers are given the opportunity to rent, rather than construct cages to reduce their initial costs. Cost of CAM materials accounts for 76% of cage construction costs, thus as a cost saving measure, an increase in CAM mesh size is suggested (8cm to 20cm). This will reduce material, construction, transportation and installation costs. Bigger mesh-size of CAM also helps improve water exchange and oxygen concentration.
3C. ENVIRONMENTAL PERFORMANCE
Table 18. Concentration of some selected water quality parameters

International Collaborating Centre for Aquaculture and Fisheries Sustainability - ICAFIS 19
Parameter Average
Max
Min
Vietnam Standard for Aquaculture
CAM CONT CAM CONT CAM CONT
NH3 (mg/L) 0,099 0,096 0,596 0,667 0,002 0,003 0,3
NH4 (mg/L) 1,289 1,349 1,75 2,63 0,54 1,01 <0,1
NO2 (mg/L) 0,011 0,009 0,027 0,018 0,003 0,004 <0,35
NO3 (mg/L) 0,188 0,206 0,39 0,45 0,11 0,12 <5
COD (mg/L) 6,4 6,6 7,3 8,2 5,1 5,1 <100
BOD (mg/L) 3,4 3,2 4,5 3,6 2,5 2,3 <30
Above table showed most of water quality parameters have met Vietnamese
standards for aquaculture. Only NH4 was higher and in some extreme conditions, NH3 was higher. This can be considered as organic pollution related to high nutrients.
a. Coliform Coliform in cages study area is shown in Table 19, the value 9 – 1450 MNP
Table 19: Coliform concentrations in grouper aquaculture
5km 500m Compare
Farm 1 Model Farm 2 Model
Nylon Cage
Copper Cage
Nylon Cage
Copper Cage
Before 6 9 10 1450 170 320 2 Weeks 14 293 147 83 121 1 Month 9 107 39 343 920 4 Months 4 65 9 77 57 6 Months 9 10 43 29 96 77 8 Months 27 707 227 807 763 12 Months 0 0 0 0 0 0
Criteria
0 CFU (USA) 1000 CFU (Vietnam Gov.t Standard)
70 MNP/100ml (Philippines)
Over the 12 month monitoring program, coliform levels in the two farms were below the government issued national standard (1000 CFU). In only one case, tests indicated that

International Collaborating Centre for Aquaculture and Fisheries Sustainability - ICAFIS 20
coliform levels exceeded the national standard, however this was before the installation of the CAM and nylon control cages.
b. Nutrients In table 20 describes types of nutrient in marine fish cage include ammonia (NH4+-N,
TAN); nitrit (NO2--N); nitrat (NO3--N) và ammoniac (NH3). Ammonia (unionized NH3, ionized NH4+-N) is the major substance excreted by fish
eating protein foods. It is excreted through the gills and kidneys. The optimal temperature range for ammonification is 30-35°C (Oana, 1994). In aquaculture systems, water exchange, bacterial nitrification, and uptake by algae are the three main routes for ammonia disposal. Ammonia can be strongly adsorbed by colloidal and other particles, especially with high pH and high dissolved humic levels (Oana, 1994).
Increased ammonia in culture water can lead to retention of ammonia in the fish and possibly uptake from the water (Moe, 1989). Excess internal ammonia apparently interferes with oxygen transport by hemoglobin. Unionized ammonia (NH3 = dissolved ammonia gas) is hought to be the form most toxic to fish, because it easily goes through gill membranes. The ammonium ion (NH4+-N) is thought to be relatively non-toxic, but this is not certain. The proportion of unionized ammonia rises with pH and so does toxicity, but factors other than the NH3 increase could be contributing (Meade, 1985); (Russo, 1985); (Spotte, 1992); (Handy and Poxton , 1993). In addition, NH4+-N does seem to exhibit some toxicity. The concentration of unionized ammonia can be calculated from TAN if pH and temperature are known (ionic strength of the solution is a third but minor factor). An increase of one pH unit increases the amount of nionized ammonia by a factor of about ten. Low dissolved oxygen levels further stress the fish and increase the chance of hypoxia (insufficient oxygen) resulting from gills damaged in the presence of ammonia.
The proportion of NH3 increases with pH, but a given concentration of NH3 can be more toxic with lower pH (Russo and Thurston, 1991). Toxicity increases when dissolved oxygen is reduced. Toxicity of ammonia plus copper or zinc was additive. Ammonia could be more toxic in salt water than in fresh water because the pH is higher. Levels as low as 10 µg.l-1 NH4+ - N (µg.l-1 NH3) can affect feeding, growth. or survival of sensitive species or stages.
Nitrite (N - NO2-) also is toxic and should not be allowed to accumulate. It binds with hemoglobin to form methemoglobin, thus interfering with oxygen transport to tissues and causing brown-blood disease (additional causes are possible, such as stress, hypoxia, hypercapnia, copper, sulfite, tricaine methanesulfonate; (Russo, 1985), (Wells et al, 1997). Low dissolved oxygen increases the problem. When affected channel catfish were transferred from water containing nitrite, methemoglobin was reduced to a normal level in 24-48 h; however, in Sea bass, nitrite poisoning caused severe anemia from loss of hemoglobin that persisted for 24 d ( (Scarano et al, 1984); (Lewis et al, 1986). Sublethal exposure might lead to some increased tolerance after several days. At least for sea bass, decreasing temperature can reduce nitrite toxicity (Saroglia et aI., 1981). Nitrite is less toxic in salt water than in fresh water because of the other ions present. Mainly chloride and calcium ions provide protection in seawater, but bromide, bicarbonate, sulfate, phosphate, and nitrate also can help (Russo and

International Collaborating Centre for Aquaculture and Fisheries Sustainability - ICAFIS 21
Thurston, 1991; Tomasso, 1994). Lowered pH tends to increase nitrite toxicity by raising the proportion of nitrous acid (HNO2). Marine fish kept in fresh water are at increased risk. With a mature biofilter, nitrite should not build up, unless the filter becomes overloaded or the water flow is too slow. Recommended limits for nitrite are 0.1 mg/L for larvae and 1 mg/L for older fish, but zero is better.
Nitrate (NO3--N) is relatively non-toxic but could promote the growth of disease organisms. Sublethal effects could include weakened immune response and haematological and biochemical alterations. Largemouth bass and channel catfish seem to tolerate up to 400 mglL. Some marine fish can stand 300 mg.l-1, but 100 mg.l-1 reduced growth and survival of common juveniles (Frakes and Hoff, 1982).

International Collaborating Centre for Aquaculture and Fisheries Sustainability - ICAFIS 22
Table 20: Nutrient nitrogens values in test model farm 1 Copper cage
Farm 1 Model
N - NO2- (µg.l-1) N - NO3
- (mg.l-1) NH3 (mg.l-1) N - NH4+ (mg.l-1)
5km 500m Nylon Cage
Copper Cage 5km 500m
Nylon Cage
Copper Cage 5km 500m
Nylon Cage
Copper Cage 5km 500m
Nylon Cage
Copper Cage
Before 72 48 71 137 0.161 0.223 0.290 0.371 0.354 0.444 0.271 0.185 1.042 1.305 0.796 0.543 2 Weeks 61 47 190 0.233 0.262 0.130 0.137 0.079 0.143 1.205 1.380 1.251 1 Month 73 109 98 0.240 0.157 0.267 0.085 0.105 0.057 1.301 2.477 1.334 4 Months 64 87 125 0.415 0.214 0.194 0.011 0.015 0.017 0.922 1.291 1.401 6 Months 48 58 105 37 0.145 0.111 0.146 0.180 0.009 0.012 0.015 0.017 0.881 1.158 1.546 1.748 8 Months 88 78 65 0.193 0.167 0.126 0.433 0.280 0.348 1.082 0.933 1.160 12 Months 84 111 0 113 0.139 0.205 0.171 0.054 0.075 0.100 0.094 0.905 1.249 1.669 1.565
Table 21: Nutrient nitrogens values in test model farm 2 Coper cage
Farm 2 Model
N - NO2- (µg.l-1) N - NO3
- (mg.l-1) NH3 (mg.l-1) N - NH4
+ (mg.l-1)
5km 500m Nylon Cage
Copper Cage 5km 500m
Nylon Cage
Copper Cage 5km 500m
Nylon Cage
Copper Cage 5km 500m
Nylon Cage
Copper Cage
Before 72 48 88 61 0.161 0.223 0.261 0.298 0.354 0.444 0.117 0.108 1.042 1.305 1.555 1.888 2 Weeks 61 88 61 0.233 0.261 0.298 0.000 0.137 0.117 0.108 1.205 1.555 1.888 1 Month 73 126 79 0.240 0.409 0.091 0.000 0.085 0.074 0.054 1.301 1.752 1.263 4 Months 64 101 134 0.415 0.198 0.261 0.000 0.011 0.016 0.014 0.922 1.366 1.203 6 Months 48 58 45 125 0.145 0.111 0.210 0.206 0.009 0.012 0.015 0.015 0.881 1.158 1.528 1.543 8 Months 88 61 85 0 0.193 0.183 0.172 0.000 0.433 0.377 0.323 1.082 1.255 1.078 12 Months 84 111 89 97 0 0.139 0.194 0.217 0.054 0.075 0.074 0.088 0.905 1.249 1.241 1.466

International Collaborating Centre for Aquaculture and Fisheries Sustainability - ICAFIS
23
Un-ionized ammonia (NH3) is toxic to fish, but the ammonium ion ( NH4
+ -N) is not toxic (Downing & Merkens, 1955; (Boyd, 1982). According to EIFAC (1973), toxic levels of NH3 for short-term exposure usually lie between 0,6 and 2,0 mg.l−1. Others consider the maximum tolerable concentration to be 0,1 mg l−1(Tiews, 1981), the preferred level being below this. Un-ionized ammonia becomes more toxic in low oncentrations of dissolved oxygen, but this is of little importance in pond farms as the toxicity decreases with increasing carbon dioxide concentration, which is usually the case when the dissolved oxygen is high.
Available information on safety limits of nitrites (NO2--N) is very
limited, although studies indicate that nitrite may be a significant factor in channel catfish ponds. The suggested maximum level for prolonged exposure in hard fresh water is 0.1 mg.l−1. Suggested nitrate (NO2
--N) levels are below 100 mg.l−1.
Acute toxicity values for several commonly used insecticides range from 5 to 100 mg.l−1 (Cope, 1964), and on longer exposure even lower concentrations may be toxic. Even when they do not cause mortality of the species under culture, they may affect the growth of food organisms and thus reduce their growth and productivity. Aquaculture farms, therefore, take all possible precautions to prevent pesticide contamination. If the farms have to be treated with pesticides to eradicate pests or predators, care is taken to protect the stock from exposure to the pesticides. Generally, the stock is released back into rearing units only after the water is no longer toxic.
c. Zinc and Copper The United States (EPA, 1984) Ambient Water Quality Criteria report
indicates that copper toxicity in aquatic environments is related to the concentration of cupric (Cu2+) ions. The cupric ion is highly reactive and forms various copper complexes and precipitates which are significantly less toxic than the cupric ion (Knezovich, 1981 ) and (Sundra, 1987). The chemical forms of copper in aquatic environments are maintained in a dynamic state of equilibrium that depends on salinity, temperature, pH, alkalinity, dissolved oxygen, sediment physicochemical characteristics, and the presence of other inorganic and organic molecules.
Copper is also important contaminants of food products, but there appear to be no reports of any significant bioaccumulation of these in aquaculture products. Copper is of low toxicity to mammals and found in most aquatic organisms is principally organic in nature. Concentrations of norganic arsenic in aquatic species is very low (generally below 0.5g.g−1wet weight) and are thus of little toxicological effect.

International Collaborating Centre for Aquaculture and Fisheries Sustainability - ICAFIS
24
Usually, toxicity is increased with younger fish, smaller fish, higher temperature, lower oxygen, lower water hardness or alkalinity, lower salinity, lack of chelating agents, starvation, and greater parasite load. Increasing pH usually increases toxicity but not always (e.g., with copper).
Table 22: Zinc and Copper concentration in water models test CAM (farm 1)
Farm 1- Model
ZINC (µg/l) COPPER (µg/l)
5km 500m
Compare Nylon Cage
Copper Cage
5km 500m
Compare Nylon Cage
Copper Cage
Before 15 24 38 33 5 13 13 12 2 Weeks 19 27 28 2 11 12 1 Month 26 24 40 13 10 13 4 Months 22 37 44 5 17 29 6 Months 6 6 10 26 44 22 37 47 8 Months 7 12 11 44 30 33 12 Months 9 11 15 15 44 44 47 52
Criteria
Vietnam criteria < 25
Vietnam criteria < 50
Consider safe < 25 (Huguenin &
Colt, 1989);
Vietnam criteria < 8
US EPA < 4,8
Consider safe < 3 (Huguenin & Colt,
1989); < 20 (Blaxter, 1981)
Copper concentrations range from about 0.025 µg/l in the open ocean to about 176 µg/l in polluted coastal waters. Copper is less dangerous in seawater than in freshwater because its toxicity is moderated by other ions and chelators. Behavior can be affected with more than 4 µg/l Cu (Sorensen, 1991). Behavioral signs of toxicity include avoidance, disorientation, hyperactivity, hypoactivity, and abnormal schooling. Copper can alter blood chemistry, enzyme activity, respiratory physiology, and cardiac physiology. It can cause damage to gills, eyes, nerves, brain, kidneys, liver, hematopoietic tissue, mechanoreceptors, and chemoreceptors. Other effects include decreased or increased oxygen uptake, decreased tolerance to handling or salinity changes, reduced disease resistance, decreased growth, and mortality. Strong interference with reproduction can occur at 10-30 flg/L Cu (Sorensen, 1991).

International Collaborating Centre for Aquaculture and Fisheries Sustainability - ICAFIS
25
Table 23: Zinc and Copper concentration in water models test CAM (farm 2)
ZINC (µg/l) COPPER (µg/l)
Farm 2 - Model
5km 500m Compare
Nylon Cage
Copper Cage 5km
500m Compare
Nylon Cage
Copper Cage
Before 15 24 27 24 5 13 11 13
2 Weeks 19 27 24 2 11 13
1 Month 26 20 24 13 10 26
4 Months 22 30 33 5 29 40
6 Months 6 6 11 44 44 22 30 33
8 Months 7 14 18 44 38 22
12 Months 9 11 14 14 44 44 37 47
Criteria
Vietnam criteria < 25
Vietnam criteria < 50
Consider safe < 25 (Huguenin & Colt,
1989);
Vietnam criteria < 8
US EPA < 4,8
Consider safe < 3 (Huguenin & Colt,
1989); < 20 (Blaxter, 1981)
Toxicity of mixtures of zinc and copper to marine fish . When zinc concentration was high, lead uptake by marine fish was more rapid. Water rarely contains more than 40 µg/L zinc; however, contamination can raise zinc to 99 mg/L in water and 118 g/kg in sediments (Eisler, 1993).
Zinc and Copper are difficult to remove and should not be present in harmful concentrations. If justified economically, activated carbon can be placed in the system as a precaution, but using contaminated water is dangerous.
c. Copper and Zinc in fish In this study, Copper values ranged from 0,12 – 13,95 µg Cu.g-1 and
were similar to those detected in deploy CAM, lower than some reports other studied and criteria. Zinc values ranged from 0,52 to 9,07 µg.g-1 Zn, the same copper, Zn lower critaria (Table 24)

International Collaborating Centre for Aquaculture and Fisheries Sustainability - ICAFIS
26
Table 24: Copper and Zinc in fish
Months Site Copper (µg.g-1) Zinc (µg.g-1)
Muscle Skin Liver Muscle Skin Liver
0 CAM 1 0,01 0,01 0,23 2,46 12,07 1,41 0 Nylon 1 0,01 0,00 0,06 2,26 6,63 0,85 0 CAM 2 0,00 0,00 0,06 3,67 15,83 1,85 0 Nylon 2 0,01 0,01 0,07 1,52 7,33 1,01 6 CAM 1 0,18 0,17 0,90 4,63 9,07 0,93 6 CAM 2 0,18 0,20 0,75 4,20 6,67 1,06 6 CAM 3 0,15 0,18 0,74 3,87 6,80 0,85 6 Nylon 1 0,12 0,06 0,10 1,83 6,97 0,95 6 Nylon 2 0,13 0,01 0,11 3,03 6,83 0,38 6 Nylon 3 0,12 0,02 0,11 2,17 6,00 0,22 6 CAM 1 0,25 0,14 0.,58 2,97 5,67 0,72 6 CAM 2 0,18 0,12 0,52 3,43 7,07 1,37 6 CAM 3 0,28 0,14 0,62 3,97 8,93 1,17
12 CAM 1 0,19 0,20 0,86 3,37 9,13 1,11 12 CAM 2 0,06 0,07 0,29 1,12 3,04 0,37 12 CAM 3 0,18 0,19 0,85 3,83 7,77 0,63 12 Nylon 1 0,19 0,23 0,87 3,37 8,97 0,85 12 Nylon 2 0,19 0,16 0,75 3,37 9,50 0,84 12 Nylon 3 0,19 0,19 0,74 4,23 9,53 0,83 12 CAM 4 0,12 0,15 0,59 5,20 7,77 0,77 12 CAM 5 0,13 0,16 0,54 4,47 10,83 0,48 12 CAM 6 0,12 0,15 0,50 4,97 10,80 0,69 12 Nylon 4 0,12 0,15 0,53 4,77 9,67 0,61 12 Nylon 5 0,12 0,18 0,64 4,70 9,80 0,55 12 Nylon 6 0,14 0,17 0,50 4,43 10,03 0,67
Criteria
30 (FAO/WHO, 1989)
10 (EU, 2001)
10 – 100 Range International Standard (Yamazaki, 1996)
40 (FAO/WHO, 1989)
-
40 – 100 Range International Standard (Yamazaki, 1996)
Zinc bioconcentration: Bioconcentration of metals from water and biomagnification of metal concentrations through food chains is a factor of exposure time, exposure concentration, size of the organism, water hardness, acclimation, feeding level, and trophic level. (Sorensen, 1991) reviewed zinc accumulation in fish and reported bioconcentration factors of 2.8–5.1. Unlike

International Collaborating Centre for Aquaculture and Fisheries Sustainability - ICAFIS
27
copper, which is sequestered primarily in the liver, zinc accumulation was greatest in the eye, followed in order by decreasing concentrations found in the kidney, bone, skin, gill and liver. Very little zinc was found in muscle. (Sauer and Watabe, 1984) observed significant zinc deposition in the scales of mummichogs (Fundulus heteroclitus) exposed to varying concentrations of zinc (210–7880 μg Zn.l-1). Their study suggested that scales take up zinc actively, rather than passively. They observed zinc biomagnification factors (relative to the amount of zinc in the phytoplankton) of 40 in the post-larval fish fed to satiation on brine shrimp, and of 5 in the mummichogs fed a reduced diet of post-larval fish. These data suggested that zinc does not significantly bioconcentrate in aquatic organisms, and that it does not biomagnify in food chains. It is cause injury to fingerling, especially juveniles.
d. Copper concentration in sediment Table 25: Copper concentration in Sediment
COPPER (µg/g) 5km 10m
upstream from CAMs
Under CAMs 10m downstream from CAMs
Before 0,43 0,38 0,28 0,24 6 months 0,51 1,51 0,62 0,76
12 months 0,46 0,57 0,47 0,59
USA standards 16 16 16 16
Canada Standard
197 197 197 197
The table above shown copper concentration in sediment of Cat Ba has met
USA and Canadian Standard for sediment. Please not that Vietnam has no standard for toxics of marine sediment.
e. Biofounling in net mesh CAM cages have many advantages compared to nylon cages. They have a
solid structure which holds up better during storms and resists biofouling of aquatic organisms such as the bivalves and cnidarian and aquatic seaweeds. No biofouling was observed on CAM cages over the 11 months. Sea-acorn and oyster appeared frequently on nylon cages. Fish farmers were required to change nylon cages for cleaning every 30-60 days.

International Collaborating Centre for Aquaculture and Fisheries Sustainability - ICAFIS
28
Nylon cage after one month of aquaculture
CAM cage after six months of aquaculture
Figure 3. CAM cages and nylon cages after 1 month aquaculture
Table 26. Estimates of Biofouling weight in mesh-net of CAM and Nylon accumulation
CAM CAGE BIOFOULINGWEIGHT (KG)
NYLON CAGE
BIOFOULING WEIGHT (KG)
CAM 1 12 NYLON 1 222
CAM 2 13 NYLON 2 259
CAM 3 12.5 NYLON 3 259
CAM 4 14 NYLON 4 240
CAM 5 14 NYLON 5 240
CAM 6 16 NYLON 6 240
This study validated the ability of CAM cages in minimizing the attachment
of biofouling organisms. Biofouling is a big challenge in marine aquaculture as it reduces water movement between the outside environment and within cages and can cause cage deformation leading to fish escapement.
After this 12 month study, there was no biofouling (oyster, microorganisms, and bivalves) of CAM cages, but a considerable amount observed for nylon cages. Although the nylon cages were painted with anti-biofouling chemicals, this treatment was only effective for a short time. After cage cleaning, biofouling growth would return within a period of two months. During the spring tide or strong wave action, nylon mesh stretches and can tear leading to fish escapement. Small bivalves (e.g. oyster) prevent water flow and reduced oxygen content causing injury to fingerling, especially juveniles.

International Collaborating Centre for Aquaculture and Fisheries Sustainability - ICAFIS
29
4. DISCUSSIONS
The project was designed under collaborative manners with farmers hence we could not control completely of the test as we provide nothing to farmers except the CAM. During the test, we faced problems of storm attack, and disease outbreak so Mr. Toan had to move cages (Nylon) to new areas of 40 km far from original sites and then Mr. Luyen moved all the CAMs and Nylon cages to new areas of 2 km far from original sites. This movement affected to the test result and the reducing the confidence of the study in some certain extent. In additional, confounding factors of both mesh and material differences between cage types, low sample size also interfering the test.
It is recommended for further study is needed with more samples and longer time as well as better control all factors. In addition, the test will not just water quality and sediment analysis but also the species composition of bottom ecosystem, through photographs and chemical analyses.
5. CONCLUSION AND RECCOMENDATIONS
The fish farming model using the copper alloy cage has been tested in this study and has shown promising results in reduce impacts of climate change. This model aids the aquaculture producer in adapting to impacts of climate change. The cages made of copper alloy are more resistant to extreme weather than the traditional nylon cages. Bio-fouling is reduced so farmers are able to move them more easily with rising sea level and storms. The survival rate of fish is higher and the micro-environment within cages are improved. This study and the use of copper alloy cages has helped increase awareness on the impacts of climate change.
5.1 Conclusion
5.1.1 Growth rate e.g. length and weight Growth rate of fish in CAM was higher than in nylon cages. Average fish
weight in CAM was 26,5% higher than in the nylon cages. The CAM cages enhance fish growth.
5.1.2 Survival/mortality rate (CAM and control) Survival rate of fish in CAM cages was higher than in the nylon cages.
Average survival rate in CAM was 18,5% higher than in the nylon cages. CAM cages enhance fish survival rate.
5.1.3 FCR (CAM and control) FCR of fish in CAM cages was lower than for nylon: 9,1 versus 15,2
respectively. The average FCR in CAM was 40% lower than in the nylon cage.

International Collaborating Centre for Aquaculture and Fisheries Sustainability - ICAFIS
30
CAM cages enhance fish FCR and saves feed. However, using trash-fish to feed the grouper in this study, with high FCR was not environmentally friendly and it is recommended that farmers use pellets with lower FCR and reduce their feed costs.
5.1.4 Disease/Parasite (CAM and control) CAM indirectly reduced disease risk through providing a healthy
environment for fish. Biofouling was reduced and greater water exchange with the outside environment was possible than with nylon cages. In addition, the need for fish transport was eliminated, reducing stressors on fish compared with nylon cages.
5.1.5 Toxic factors e.g. Cooper and Zinc (CAM and control) in water and fish The amount of copper and zinc in fish was within acceptable limits. There
was no significant difference between the copper content within the fish before and after being housed in a copper alloy cage.
5.1.6 The ability effect storms and can moving. CAM can limit the negative effects of storms and able to move to other
locations when environment become disadvantage. This can be seen as another strong point/advantage of copper alloy cage.
5.1.7 Economic efficiency Profits of CAM was 165% higher than with nylon cages, however
construction costs were 15.25 times higher.
Recommendations Recommendation No 1: CAM has a lot of advantages but also some
disadvantages. The main disadvantage is the high cost of CAM material. Therefore, reducing the cost for farmer is recommended, for example allowing farmers to be able to rent CAM cages instead of having to purchase them outright.
Recommendation No 2: CAM cages can be assembled differently to save costs (i.e. parts can be purchased separately and assembled at the farm). In additional cost saving measure is to replace expensive imported screws with copper fibre for the purpose of conjoining cage sides.
Recommendation No 3: Increase mesh size for the CAM cage from 8mm to 20mm to reduce costs. This measure could reduce costs by 60%, through reduction of the amount of material required for construction as well as transportation and installation costs.
Recommendation No 4: Another disadvantage of the CAM cage is that it is very difficult to capture fish for the treatment of parasite infections and for final

International Collaborating Centre for Aquaculture and Fisheries Sustainability - ICAFIS
31
harvesting, compared to the nylon net. There needs to be more research on how to effectively capture fish within the CAM cages.
Recommendation No 5: CAM has shown success in grouper farming so now it is important to expand CAM studies to other aquaculture species such as lobster, cobia, seabass etc. as these species are also very high in economic value. In the future, a high demand for CAM cages is likely, especially under the context of climate change.
Recommendation No 6: It is recommended that the Directorate of Fisheries, Ministry of Agriculture and Rural development, consider the possibility of mainstreaming CAM into a national guideline for marine aquaculture, and develop of policies promoting CAM application.
Recommendation No 7: It is recommended that commercial banks such as AgriBank or BIDV set up a loan system for fish farmers to facilitate the purchasing of CAM cages from ICA as the cost is very high for purchasing on their own .
Recommendation No 8: It is recommended that farmers continue to collect data for the study until fish harvested of after two more years.
REFERENCE
1. Cat Hai District People Committee (2013). Annual Report of Agriculture Development in Cat Hai District 2013. Cat Hai District Agricultural Department 2013.
2. ICAFIS. (2014). Study on technical-economic performance of using Copper Alloy Mesh (CAM) in marine aquaculture in Vietnam (Progress).
3. Intergovermental Panel on Climate Change. (2007). Climate Change 2007: Synthesis Report-Summary for policymarkets. Cambridge University Press.
4. Khanh Tran Luu, Phuc Nguyen Xuan (2012). Study the impact of the storm and the accompanying phenomena for Aquaculture systems in Northern and North Central. Research Institute for Marine Fisheries.
5. Ky Nguyen Minh. (2014). Study the impact of Climate Change to livelihoods and adaption of community in Thua Thua Hue. Science of Hue University
6. Ministry of Natural Resources and Environment (2011). Report on Climate change scenario and sea level rise for Vietnam.
7. Ministry of Natural Resources and Environment(2007). National Targe Programme to Respond to Climate Change.

International Collaborating Centre for Aquaculture and Fisheries Sustainability - ICAFIS
32
8. PCU of IMOLA Project. (2010). The final report IMOLA Project. Thua Thue-Hue. Thua Thue-Hue Department of Agricultural and Rural Development.
9. Quyen., Cao Le, Lai., Tuong Phi, Phuong.Luu The, Lap., Dinh Xuan (2013). Building the model community pelagic fishermen village in Halong bay adapt to climate change. Vietnam institution of Fisheries Economic and Planting
10. Sena S. De Silva, Doris Soto (2009). Climate change and aquaculture potential impacts, adaptation and mitigation
11. Tan Phan Van, Thanh Ngo Duc (2013). Climate change in Vietnam: Some research findings, challenges and opportunities of global integration. Meteorology, Hydrology and Oceanography Department , University of Science, Vietnam National University, Hanoi.
12. Thuc Tran, Huong Huynh Thi Lan, Trang Dao Minh (2012). Integrating the issues about climate change into development planning socioeconomic. The Vietnam Institute of Meteorology, Hydrology and Environment.