ibisworld industry report j7100...
TRANSCRIPT

2 About this Industry2 Industry Definition
2 Main Activities
2 Similar Industries
2 Additional Resources
3 Industry at a Glance
4 Industry Performance4 Executive Summary
4 Key External Drivers
5 Current Performance
8 Industry Outlook
11 Industry Life Cycle
14 Products & Markets14 Supply Chain
14 Products & Services
16 Demand Determinants
17 Major Markets
18 International Trade
19 Business Locations
21 Competitive Landscape21 Market Share Concentration
21 Key Success Factors
22 Cost Structure Benchmarks
24 Basis of Competition
25 Barriers to Entry
26 Industry Globalisation
28 Major Companies28 Telstra Corporation Limited
31 SingTel Optus Pty Limited
32 Vodafone Hutchison Australia Pty Limited
37 Operating Conditions37 Capital Intensity
38 Technology & Systems
41 Revenue Volatility
42 Regulation & Policy
45 Industry Assistance
46 Key Statistics46 Industry Data
46 Annual Change
46 Key Ratios
47 Jargon & Glossary
IBISWorld Industry Report J7100Telecommunications Services in AustraliaMay 2012 Craig Shulman
Wired to wireless: Growth is expected as next generation networks are adopted
www.ibisworld.com.au | (03) 9655 3881 | [email protected]

www.IbISwOrLd.COM.Au Telecommunications Services in Australia May 2012 2
Telecommunications companies provide telecommunication services to businesses and consumers using wire, cable, wireless and satellite infrastructure. Not all sector participants
own and operate telecommunications infrastructure. Telecommunications resellers purchase network capacity and then retail services to businesses and consumers.
The primary activities of this industry are
Wired telecommunication service provision
Mobile telecommunications service provision
Internet service provision
Satellite communication service provision (except mobile telephones)
Television relay station operation
Radio relay station operation
Industry definition
Main Activities
Similar Industries
Additional resources
The major products and services in this industry are
Fixed internet services
Mobile services
Resellers
Satellite, TV and radio relay
Wired services
About this Industry
E ConstructionCompanies in this industry lay cable, construct transmission lines or towers and install or repair telephone or telegraphic equipment.
P Cultural and recreational ServicesEnterprises in this industry operate radio or television broadcasting services.
L7800 business Services in AustraliaBusinesses in this industry operate telephone answering services or message delivery services.
X0016 Integrated Logistics in AustraliaFirms in this industry deliver freight items but not letters and mail-type articles.
For additional information on this industry
www.abs.gov.au Australian Bureau of Statistics
www.acma.gov.au Australian Communications and Media Authority
www.accc.gov.au Australian Competition and Consumer Commission

www.IbISwOrLd.COM.Au Telecommunications Services in Australia May 2012 3
Market ShareTelstra Corporation Limited 52.5%
SingTel Optus Pty Limited 22.5%
Vodafone Hutchison Australia Pty Limited 11.1%
Key External driversreal household disposable incomeNumber of businessesInternet connectionsLegislative compliance requirements for communication servicesNumber of householdsdemand from free to air television services
Key Statistics Snapshot
Industry at a GlanceTelecommunications Services in 2011-12
revenue
$40.8bnProfit
$6.1bnwages
$4.7bnbusinesses
617
Annual Growth 12-17
3.0%Annual Growth 07-12
-0.9%
Industry Structure Life Cycle Stage Decline
Revenue Volatility Low
Capital Intensity High
Industry Assistance Medium
Concentration Level High
Regulation Level Heavy
Technology Change High
Barriers to Entry High
Industry Globalisation Medium
Competition Level Medium
FOR ADDITIOnAL STATISTICS AnD TIME SERIES SEE THE APPEnDIx On PAGE 46
% c
hang
e
10
−2
0
2
4
6
8
1604 06 08 10 12 14Year
Real household disposable income
SOURCE: WWW.IBISWORLD.COM.AU
% c
hang
e
6
−6
−4
−2
0
2
4
1804 06 08 10 12 14 16Year
Revenue Employment
Revenue vs. employment growth
Employment distribution
22,015NSW
865ACT
17,070VIC
865TAS
680NT
10,700QLD
5,810WA
3,835SA
SOURCE: WWW.IBISWORLD.COM.AU
p. 28
p. 4
SOURCE: WWW.IBISWORLD.COM.AU

www.IbISwOrLd.COM.Au Telecommunications Services in Australia May 2012 4
Key External drivers Real household disposable incomeHouseholds’ consumption of telecommunications services depends in part on disposable income. This is particularly the case for spending on the sector’s latest services such as mobile internet, GPRS, IPTV and super fast fixed internet. Spending on the sector’s more traditional service offerings such as voice and messaging are relatively insensitive to disposable income changes.
Number of businessesBusinesses are an important market for telecommunication companies. Businesses depend on telecommunications services when
producing and distributing goods and services. An increase in the number of businesses in Australia will boost sector demand and revenue. Moreover, an increase in the output of businesses (i.e. GDP growth) will be in part dependent on higher telecommunications consumption. So an improvement in economic conditions will be accompanied by an expansion in businesses’ telecommunications use.
Internet connectionsDemand for internet services depends on the number of internet connections, which is influenced by computer and 3G mobile penetration rates. For ISPs,
Executive Summary
The explosion in connectivity has entrenched telecommunications as a vital part of the day-to-day functioning of Australian businesses and has changed the way Australians interact, with social networking moving online. Despite the increased demand to communicate over these pathways, IBISWorld forecasts that revenue for the Telecommunications Services sector will decline by 2.0% to $40.8 billion in 2011-12.
Industries within the Telecommunications Services sector have
experienced contrasting results. Overall sector revenue has remained stable, and is expected to record an annualised decline of just 0.9% in the five years through 2011-12. However, over the past five years there has been an increased demand and use of telecommunications services. Despite the increased demand, intense intra-industry and intra-sector competition has created a fiercely competitive environment. This has meant that growth in demand has been achieved at the expense of other, more profitable, telecommunications services. In
particular, the Mobile Telecommunication Carriers industry has been succeeding thanks to wired-to-wireless substitution and thus has made inroads into the internet service provider market, in addition to the voice market. The Wired Telecommunications Carriers industry has thus suffered a collapse in access lines and usage, and will continue to recede into the future.
The overriding factor driving this shift in demand has been price-based competition and as such the demand has shifted to lower priced services that benefit the consumer, which is occurring at the expense of overall sector revenue, as well as sector profitability. In an attempt to underpin margins, telecommunications companies (telcos) have looked to improve efficiency by reducing employee numbers. IBISWorld expects the sector labour force will have declined by 2.9% per annum over the five years through 2011-12 to 60,618 people, with wages exhibiting a similar fall.
IBISWorld forecasts that sector revenue will return to growth in the coming five years to increase by an average 3.0% per annum to $47.2 billion in 2016-17. Growth will be the result of advances in technology, expanding network coverage and network infrastructure upgrades.
Industry PerformanceExecutive Summary | Key External drivers | Current Performance Industry Outlook | Life Cycle Stage
The expansion and acceleration of a wired-to-wireless shift has pressured prices

www.IbISwOrLd.COM.Au Telecommunications Services in Australia May 2012 5
Industry Performance
Current Performance
The appetite for constant connectivity and the blossoming of data are the two major stories of the past five years. Mobile network infrastructure in Australia advanced with third generation (3G) networks assuming dominance. The next generation of mobile technology enabled significant enhancements to the quality of service offered and, when combined with increased affordability, resulted in extra push behind the fixed-to-mobile substitution trend. This trend has resulted in mobile service revenue
usurping all fixed-line revenue (wired and ISP) for the first time ever in 2009-10, with mobile revenue expected to break the $20 billion barrier this year.
The preference for mobility is at the expense of wired services, which traditionally generate high margins. IBISWorld forecasts that fixed-line telecommunication services will contract by an annualised 8.6% over the five years through 2011-12 to $10.2 billion. However, this does not signal the death of wired infrastructure. The current
Key External driverscontinued
demand depends on the number of fixed-line connections while for mobile carriers it depends on mobile connections. The number of fixed connections has actually been declining as wireless internet as grown in popularity. Consumption on internet services also depends on connection speeds with faster connections facilitating more usage and revenue. Connection speeds are accelerating as users migrate to faster services.
Legislative compliance requirements for communication servicesThis sensitivity represents the federal and state government policies and regulations for the telecommunications industries and new network user industries, such as online services, broadcasting (including pay-TV) multimedia and computing
industries. Changes to local government planning regulations with respect to the construction of new telecommunications infrastructure also apply. A decrease in the regulatory burden of this industry will increase competition, placing pressure on pricing and stimulating demand.
Number of householdsAn increase in the number of households represents an expansion in the potential market for wired telecommunications carriers, resellers and ISPs.
Demand from free to air television servicesDemand for free-to-air services influences demand for satellite and television relay operations.
% c
hang
e
7
2
3
4
5
6
1705 07 09 11 13 15Year
Number of businesses
SOURCE: WWW.IBISWORLD.COM.AU
% c
hang
e
10
−2
0
2
4
6
8
1604 06 08 10 12 14Year
Real household disposable income

www.IbISwOrLd.COM.Au Telecommunications Services in Australia May 2012 6
Industry Performance
Current Performancecontinued
environment is conducive to mobile infrastructure, as the maturity of 3G technology is coinciding with the decline of copper and its associated internet access technologies. However, IBISWorld expects that fixed and mobile communication infrastructures will coexist in harmony in the future.
The overall outcome for the Telecommunications Services sector is one of treading water. The growth of mobile revenue is cancelled out by the decline in wired revenue, ultimately resulting in an annualised revenue decline of 0.9% in the past five years. The decline may seem astounding considering booming
telecommunications services consumption. However, the increased price-based competition and new technologies have resulted in sizeable price declines. IBISWorld estimates that telecommunications services prices have fallen by 4.9% per annum over the past five years, or 22.4% in total. Telcos have generally enacted price cuts by offering greater usage for the same plan payment. Importantly, the price decline represents the sector’s traditional services’ long-term shift toward a utility service, where the provision of data will eventually mirror electricity, gas and water utilities. Sector revenue is forecast to increase by 2.8% in 2012-13 to $41.9 billion.
rising competition Over the past five years, the industry has been largely defined by its three biggest players – Telstra, dominating half of the sector, Singtel Optus, holding around a quarter and Vodafone Hutchison Australia (VHA). While Telstra and Singtel Optus participate in all areas of the sector, VHA’s business is heavily focused on mobile telecommunications. Furthermore, the company was only formed via a merger in 2009, making it a relatively new major player.
Remaining sector participants operate on a much smaller scale, with the next-largest grouping classified as second-tier telcos. Second-tier telcos are characterised as having market share of 1.0% to 2.0% and tend to be pushing through the new technologies and products that are absorbing the traditional telecommunications revenue. The best example is iiNet. Through service innovation, pushing naked digital subscriber lines (DSL) and unique marketing, iiNet became Australia’s second-largest ISP in 2010-11.
Competition has been intensifying as mobile networks, a market in which Telstra faces the stiffest competition and has the least-dominant market share, become the dominant revenue generator.
This is extremely important in terms of industry dynamics, as Optus and VHA, own full coverage mobile networks. To encourage the migration to mobile, VHA’s predecessors and Optus instigated aggressive price competition. This began with the introduction of capped plans and has extended to larger handset subsidies. The fixed-line providers, carriers and resellers responded by slashing their prices, particularly for long-distance calls. The consumer has been the big winner, according to IBISWorld forecasts that telecommunications service prices have collapsed by 22.4% in the past five years.
The Internet Service Providers industry has exhibited similar price contractions, as access and price per bit have tumbled. This can be attributed to operators such as iiNet and TPG embarking on aggressive campaigns designed to win market share. However,
The wired-to-wireless trend is forecast to result in mobile service revenue usurping fixed-line revenue

www.IbISwOrLd.COM.Au Telecommunications Services in Australia May 2012 7
Industry Performance
rising competitioncontinued
price has not been the sole competitive weapon employed; service innovation has also been critical. Naked DSL and VoIP are new services bringing benefits to
smaller operators and hurting the dominant infrastructure owners by absorbing existing revenue streams
The demand to communicate
The demand for communication services has grown strongly in the five years through 2011-12. The consumer has been the big winner of the intensifying sector competition, which is delivering considerable benefits to households and businesses. Lower prices are the most immediate benefits and have enabled much higher use of telecommunication services. This is particularly the case in the mobile and ISP spaces. The price declines have placed pressure on margins, which has caused telcos to introduce innovative value-added services, in addition to the traditional offerings, to encourage further usage and to protect margins. This is further embedding telecommunications into the daily lives of businesses and consumers as it makes telecommunication networks the backbone to an ever-growing number of services.
The changes in the mobile space over the past five years exemplify this trend. Mobile phones originally focused on mobile voice services but now provide voice, messaging, e-mail, internet browsing, mapping, GPS and modem services (via tethering). Such service
breadth is making household and business subscribers incredibly dependent on their mobiles. The all-encompassing product range is allowing a growing number of consumers, sole proprietors and small businesses to rely solely on wireless services for delivering all their communication needs. Such dependency is facilitating a boom in mobile usage.
Likewise, high-speed fixed-line broadband connections have enabled a growing selection of data-intensive services to flourish, such as social networking, content sharing, sophisticated online shopping, e-finance and video content. For businesses, a growing number of productivity boosting applications are internet dependent. Many of the latest applications are cloud-like solutions that depend on continuous connections and are therefore particularly data intensive. Usage is booming as fixed connections become an increasingly important service gateway. This, however, was attempted to be quashed by the media industry via the Australian Federation Against Copyright Theft (AFACT) who
Telecommunication subscribers
yearFixed lines
(’000)Mobile connections
(’000)Fixed internet
(’000)Mobile internet
(’000)
2004-05 11,460 18,423 5,984 502005-06 11,250 19,760 6,306 1502006-07 10,920 21,360 6,779 2202007-08 11,000 22,120 6,442 7852008-09 10,670 24,220 6,459 1,9612009-10 10,460 26,600 6,130 2,8002010-11 10,260 29,200 6,090 3,400
SOURCE: IBISWORLD

www.IbISwOrLd.COM.Au Telecommunications Services in Australia May 2012 8
Industry Performance
The demand to communicatecontinued
sued iiNet for being responsible for their customer’s copyright theft. After many appeals, iiNet suceeded in winning the High Court judgment in April 2012,
avoiding the potential loss of customers and rise in operational costs that would have affected the whole industry.
Industry Outlook
The next five years will be an exciting period for the Telecommunications Services sector as Australia’s digital economy landscape begins to take shape. IBISWorld expects that sector revenue will return to growth, increasing at an average 3.0% per annum to be worth $47.2 billion in 2016-17. There will be further advancements in network infrastructure technologies, the rollout of advanced fibre-to-the-home (FTTH) services and 4G mobile networks will be of particular importance. As the advanced networks expand their coverage, new telecommunication-enabled smart applications for the utility, transport, health, education, commerce and retail sectors will be developed, creating new revenue streams for telcos. IBISWorld expects the most significant sector growth to occur after 2013, as this is when the next generation networks will
begin to be adopted by the masses. Advances in network infrastructure will enable the adoption of emerging services such as VoIP, naked DSL, IPTV (TV over the internet) and mobile tethering to become mainstream services.
Fixed-to-mobile substitution
The most significant trend in the past five years has been fixed-to-mobile substitution. The switch is being fuelled by rapid advances in mobile technology, which, in combination with a greater contraction in mobile prices in comparison to wired services, has created a value gap between mobile telephone services and wired services. An added incentive fuelling the substitution has been the increased demand for the constant connectivity that mobile services deliver. Mobile services have become so attractive that many households have hung up their traditional phone and disconnected their landline altogether. Telstra reports that access lines in service have fallen from over 10 million in 2005 to just 8.8 million in December 2009. Fixed-to-mobile substitution has served to weaken Telstra’s sector dominance, while
providing valuable gains for various competitors in growth segments of the telecommunications market. In particular, VHA’s sector market share increase by 4.5 percentage points since 2005.
The shift to mobile has been best exemplified by the divergent directions in subscriber numbers. Over the five years through 2010-11, IBISWorld estimates the number of mobile connections and mobile internet subscribers increased by an annualised 8.1% and 86.7% respectively. Meanwhile, fixed-line connections are estimated to have decreased by 1.8% annually, while fixed-line internet subscribers grew by an anaemic 0.5% per annum. Mobile revenue will exhibit an annualised increase of 6.2%, while wired revenue contracts by 7.7% per annum.
% c
hang
e
6
−6
−4
−2
0
2
4
1804 06 08 10 12 14 16Year
Industry revenue
SOURCE: WWW.IBISWORLD.COM.AU

www.IbISwOrLd.COM.Au Telecommunications Services in Australia May 2012 9
Industry Performance
Industry Outlookcontinued
IBISWorld expects the heightened merger and acquisition activity will continue as the second-tier telcos look to boost competitiveness, which is obtained through greater scale. The recent announcement that NBN Co, the company created to administer the national broadband network (NBN), will look at acquiring telcos as part of the network expansion. This will add another dimension to the merger and acquisition activity. External competitive threats will
also emerge from other fields and beyond Australia’s borders as the convergence trend in media and communications continues. IBISWorld expects that once the NBN rollout occurs there will be a spate of new retail service providers looking to enter the market, which will ensure that sector enterprise numbers return to expansion, with a forecast 0.3% per annum increase in sector enterprises for the five years through 2016-17.
Capacity constraints Mobile networks have prospered recently because of the constant connectivity advantage in comparison to the traditional wired carrier market. The mobile networks have been able to cope with the demand that the initial
applications have placed on the network. However, the increasing penetration of data-hungry and internet enabled devices will create challenges for mobile networks and will place incredible capacity constraints on the mobile
National broadband Network
The most significant development faced by the Telecommunications Services sector in the near term and throughout the next five years will be the Federal Government’s $43 billion FTTH NBN initiative. This project is the modern-day equivalent of the Snowy Mountains River scheme. As the NBN is interconnected with an already established 4G rollout, the Australian economy will be ushered into the digital age. Wired and mobile connectivity of 100+ megabits per second (Mbps) will facilitate mass-market adoption of VoIP and IPTV, smart grids, true e-health and e-learning, innovative online shopping and many other applications. The establishment of 4G
networks and the NBN will increase consumer and business reliance on telecommunications services.
In April 2009, the Federal Government outlined a plan to build a $43 billion, 100+ megabits per second (Mbps) FTTH broadband network to cover 93% of the Australian population. The remaining 7.0% of citizens are to get at least 12 Mbps connectivity using a combination of mobile and satellite technology. The plan involves the establishment of a company, NBN Co., legislated to be at least 51% government owned until at least five years before the completion of the build, to act as the wholesale entity.
Telecommunication subscriber forecast
yearFixed lines
(‘000)Mobile connections
(‘000)Fixed internet
(‘000)Mobile internet
(‘000)
2011-12 10,140 29,400 6,160 3,7602012-13 9,990 30,200 6,380 4,0602013-14 9,840 31,300 6,915 4,2502014-05 9,760 32,400 7,530 4,6002015-16 9,420 33,300 8,100 5,500
SOURCE: IBISWORLD

www.IbISwOrLd.COM.Au Telecommunications Services in Australia May 2012 10
Industry Performance
Capacity constraintscontinued
networks. As a result, the later part of the coming five-year period is expected to yield resurgent growth in the number of fixed internet connections. This move will be further encouraged by the recent hybrid fibre-coaxial (HFC) upgrades to DOCSIS 3.0 technology, combined with the move to FTTH, will deliver super high-speed connectivity and will re-establish the utility of fixed connections.
As the penetration of high-speed connections further advances, the prices per byte will begin to erode, but the explosion in usage will ensure a return to
double-digit revenue growth for the Internet Service Providers industry. By 2016-17, IBISWorld expects that fixed internet access services will comprise 22% of sector revenue. Strong growth in the mobile and ISP markets will offset continued revenue decay in the Wired Telecommunications Carriers industry and anaemic growth from the Satellite, Television and Radio Relay Operations industry. The latter industry will face some difficulties in the final years of the period as analogue TV services are switched off.
Competition Assuming a smooth NBN rollout, towards the end of next five years the 4G-FTTH world will be a land of opportunity for the Telecommunications Services sector. Given that the future of communication will become more data-centric, the distinction between ISP and telecommunications carriers will eventually disappear as the services become one and the same. In addition, the global trend is that companies that previously operated in non-telecommunication industries such as cable operators, mobile-TV technology providers, content owners and search providers will look to move into the Telecommunications Services sector. To gain greater control over the supply chain and a larger portion of the spoils, major market participants will want to fully integrate and operate across key distribution channels. This will necessitate that the wired and mobile markets coexist within the media, IT and communications sectors.
Ultimately, it will be important for telcos to diversify their operations from traditional telecommunications provision. The wireless segment’s
traditional product offering (voice and messaging) is becoming a commodity business with high volumes and low profits, reflected by falling average revenue per user. If the segment doesn’t evolve, it will trend further towards becoming a low-margin commodity type segment, where operators become dumb pipe providers that deliver data (i.e. content) from producers to consumers.
One way that industry players can differentiate themselves is through service integration and cross-selling, marketing and service innovation. Cross-selling is already gaining greater emphasis, with product bundling becoming more prominent through its ability to cross sell and retain customer commitment for longer periods of time. Cost control will also be important in ensuring competitive pricing, but the future of internet access will be low margin, so cost control will simply be a competitive necessity. Furthermore, a greater focus on digital service provision is gaining greater attention as Optus’ parent company Singtel restructures its entire operations towards pursuing this revenue stream.
www.IbISwOrLd.COM.Au Telecommunications Services in Australia May 2012 11
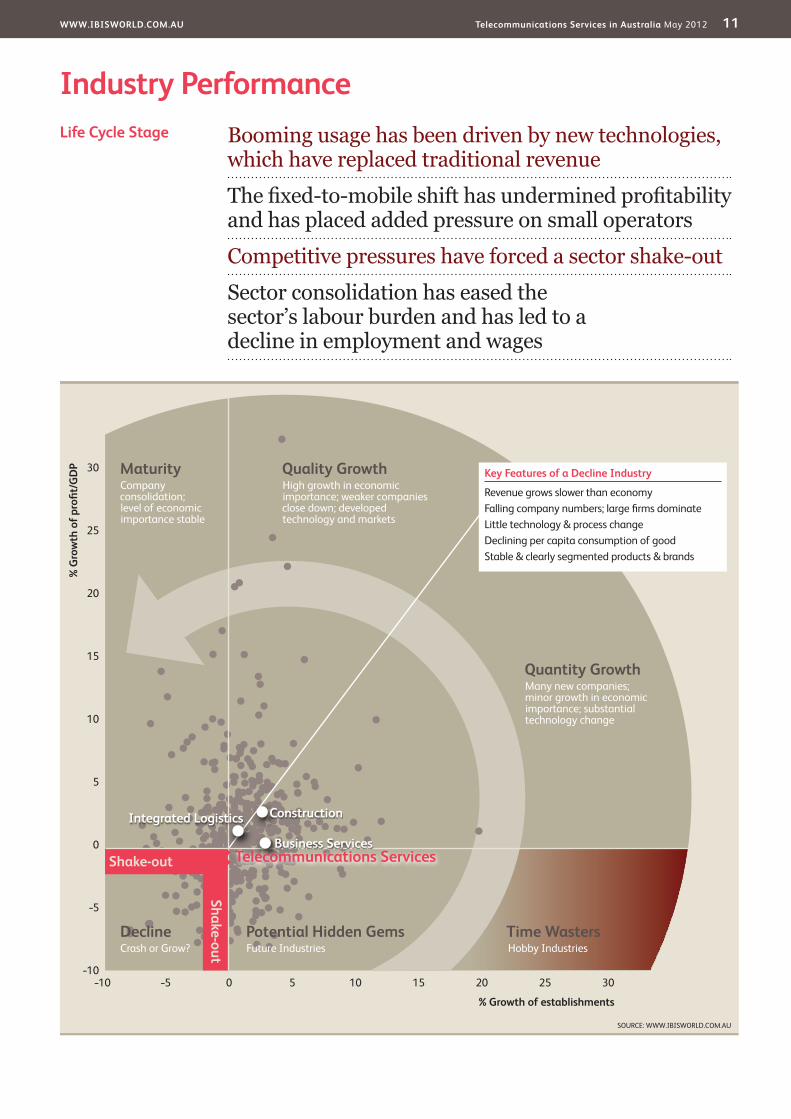
Industry PerformanceBooming usage has been driven by new technologies, which have replaced traditional revenue
The fixed-to-mobile shift has undermined profitability and has placed added pressure on small operators
Competitive pressures have forced a sector shake-out
Sector consolidation has eased the sector’s labour burden and has led to a decline in employment and wages
Life Cycle Stage
SOURCE: WWW.IBISWORLD.COM.AU
30
25
20
15
10
5
0
–5
–10–10 100 20–5 155 25 30
% G
row
th o
f pro
fi t/G
dP
% Growth of establishments
declineCrash or Grow?
Potential Hidden GemsFuture Industries
Quality GrowthHigh growth in economic importance; weaker companies close down; developed technology and markets
Time wastersHobby Industries
MaturityCompany consolidation;level of economic importance stable
Shake-out
Shake-out
Quantity GrowthMany new companies; minor growth in economic importance; substantial technology change
Key Features of a decline Industry
Revenue grows slower than economyFalling company numbers; large fi rms dominateLittle technology & process changeDeclining per capita consumption of goodStable & clearly segmented products & brands
Construction
business Services
Integrated Logistics
Telecommunications Services

www.IbISwOrLd.COM.Au Telecommunications Services in Australia May 2012 12
Industry Performance
Industry Life Cycle The initial perception of Australia’s Telecommunications Services sector is one of growth, as information and communication services are becoming increasingly important in the day-to-day lives of business and consumer. However, the initial perception does not reveal the whole truth and by looking a little closer it is clear that the Telecommunications Services sector is actually in the decline stage of its economic life cycle.
The last few years have been marked by some landmark events in the Telecommunications Services sector. In 2007-08, for the first time in its history, the Internet Service Providers industry witnessed a decline in the number of fixed-line internet connections. This mirrors the decline in fixed voice telecommunications, where overall decline in fixed networks has been a result of improvements in mobile network speeds and affordability, have made mobile internet connectivity a viable option for a growing number of businesses and consumers. As a result, the 2009-10 year was predicted to be the first time the sector earns more revenue from mobile infrastructure than fixed, with proportions forecast at 46% and 45.3% respectively. Such a development ultimately represents another step closer to the end for the dominant fixed-line technology, copper. For much of the early 2000s, the life cycle of copper was prolonged by internet services. However, with advanced HFC, 4G and then FTTH networks on their way, the revenue decline for this piece of ageing infrastructure is set to accelerate.
Technology advances, service introductions and price declines have made it convenient and cost effective for consumers to disconnect their land lines to rely solely on their mobiles. As more users and traffic have moved onto mobile networks, further price cuts have become possible. This has ensured the fixed-to-mobile shift has meant a net revenue loss to the sector. In addition to the substitution threat posed by wireless services, fixed revenue has been undermined by service innovations such
as naked DSL and VoIP. These new services deliver internet access and fixed voice at a much lower cost to users, in effect absorbing operator revenue. The new technologies have been pioneered by small telcos who are yet to have an established subscriber base and have developed business models around the new technology. Dominant providers are remiss to offer new technology as they greatly reduce the life cycle of traditional, high margin, telecommunications services. Industry blended ARPU has declined over the last five years, as the price of services across all infrastructures has reduced as operators compete to retain subscriber share.
The sizable declines in pricing have placed pressure on margins. To ease the load, many companies have engaged in merger and acquisition activity to build scale and realise efficiencies. Infrastructure owners have purchased wholesale clients, Vodafone and Hutchison merged and some resellers have bought infrastructure owners. Alternatively, many small operators have exited the sector as margin pressures have taken their toll. In all, the sector has been through a significant shakeout that has improved its productiveness. A larger number of medium-to-large operators eased the sector’s labour burden. By the end of 2010-11, sector employment is expected to be down 15.2% on 2005-06, which has dropped the total wage cost 18.4% lower.
Telcos have continued their investment in additional and upgraded infrastructure over the past five years. However, the majority of investment was undertaken early in the period, prior to the economic downturn. Infrastructure upgrades have included investment in DSLAMs, 3G technology and fixed-network builds. While Telstra has just finished upgrading its HFC network with Optus to follow, the bulk of depreciation charges will be felt from 2010-11. Ultimately, a marginal slowdown in investment in recent years caused depreciation as a percentage of revenue contract by 0.6 percentage points to
This industry is declining

www.IbISwOrLd.COM.Au Telecommunications Services in Australia May 2012 13
Industry Performance
Industry Life Cyclecontinued
16.2% over the five years.With profit, wages and depreciation
all on the slide, the sector’s economic contribution will have contracted over the five-year period. IBISWorld expects the decline in sector value added will average 1.0% per annum. This will compare with annualised GDP growth of 2.9% and will see the sector’s share of the economy slide to 1.39% in 2010-11. The divergent direction in sector value added and GDP is indicative of a sector in decline.
Over the coming five years, the Telecommunications Services sector will
shift back into growth. Sector revenue gains will increase as demand booms with the arrival of the latest network technologies – 4G and FTTH. Skyrocketing demand will necessitate an increase in sector employment and wages. Greater infrastructure investment will yield higher depreciation as a share of revenue. While margins from traditional services will decline, absolute profit will increase and there will be a multitude of new value-added services, which will give many telcos the opportunity to reinvent their business model to improve margins.

www.IbISwOrLd.COM.Au Telecommunications Services in Australia May 2012 14
Products & Services Mobile carriers usurped wired carriers as the dominant industry within the Telecommunications Services sector in 2007. Since that time, mobile services have continued to assert their dominance in the overall sector, forecast to account for 46.6% of total revenue in 2011-12. The mobile market has benefited from the changing behaviour and preference of consumers as they have shifted consumption from wired to mobile voice. This trend has been driven by the greater convenience of mobility and rapid declines in prices for mobile voice. It has become cheaper for many consumers to disconnect their landlines and rely solely on their mobiles for voice services. The fixed-to-mobile substitution trend that has accelerated the decline of the Wired Telecommunications Carriers industry is also being felt in the internet space. Since 2007-08, the number of fixed internet connections has declined as mobile internet surged and stole some of the market.
Despite the continual decline in
demand for wired voice services, the wired services segment still accounts for a sizeable portion of telecommunications consumption. For 2011-12, the wired services will account for 29.6% of sector revenue, a 14 percentage point drop from the 44% proportion in 2005. This is because this service segment includes line access and fixed data services. Line access still generates a lot of revenue, forecast to account for 36% of wired revenue, because the majority of fixed internet connections depend on a wired access line. However, line access revenue is set to crash over the next few years as naked internet connections become more common. Fixed data services are becoming an increasingly important part of the wired services segment as businesses become more dependent on data networks for running their daily operations.
The provision of fixed internet services is the next-largest service segment in the Telecommunications Services sector. The fixed internet services market enjoyed
KEy buyING INduSTrIES
G5000 Consumer Goods retail in Australia Retailers are becoming more reliant on telecommunication services in running both brick-and-mortar and online channels.
K7300 Finance in Australia Finance companies are big consumers of telecommunication services. This is demonstrated by the sizable contracts signed by the big banks (e.g. $100 million per annum).
L7800 business Services in Australia The property and business service industries are a key user of services provided by the various components of the Telecommunications sector.
N Education Australia’s education institutions are becoming increasing dependant on telecommunications in delivering services.
O8600 Health Services in Australia Currently, health providers are only small consumers of telecommunications services. However, the establishment of next generation networks will unlock a plethora of e-health applications.
X0016 Integrated Logistics in Australia Logistics operators use telecommunications services in performing a number of functions including fleet management and load tracking.
KEy SELLING INduSTrIES
J7100 Telecommunications Services in Australia Industry participants are heavily dependent upon the infrastructure and services provided by other participants.
Products & MarketsSupply Chain | Products & Services | demand determinants Major Markets | International Trade | business Locations
Supply Chain

www.IbISwOrLd.COM.Au Telecommunications Services in Australia May 2012 15
Products & Markets
Products & Servicescontinued
rapid growth in the decade through 2007-08; its revenue proportion increased from just 2.0% in 1998 to 14.5% of total sector revenue in 2008. However, toward the end of the five years through 2010-11, revenue growth slowed, improving by just 0.6 percentage points to 15.1% of total revenue in 2011-12. The subdued revenue growth is a result of the increased substitution threat from advanced 3G wireless internet. In 2007-08 and 2008-09, the number of wireless subscribers jumped 3.7% and 2.4% respectively. Meanwhile, the number of fixed connections contracted 0.8% and 4.0% in these years. Big improvements in wireless network speeds have made it possible for many consumers and small businesses to rely on a mobile internet connection. Mobile connections are much more convenient than fixed connections, as not only do they enable mobility but they are portable (i.e. when a consumer moves house they do not have to move the connection).
The fixed versus mobile internet battle is set to heat up over the next five years as the availability of mobile tethering increases. The upside of tethering is that it gives consumers and small businesses the opportunity to access all
telecommunications services via one contract and device. The outcomes are greater convenience and cost savings. Once 4G services arrive, consumers and small businesses will get access to super-fast connectivity, making mobile internet a more attractive offering to a larger portion of the market. The one problem with mobile internet is the capacity constraints faced by the network. This means the usage prices for mobile connections increase much faster than fixed. Thus, for heavy internet users, a fixed connection will always be more cost effective.
The remainder of sector revenue is derived from telco resellers and satellite, TV and radio relay providers. Both segments are becoming niche players in the overall Telecommunications Services sector. Resellers have seen their sector revenue share deteriorate as infrastructure owners have focussed on increasing their own subscriber bases, where previously they had been happy to resell a higher proportion of unprofitable consumers. This has resulted in resellers’ market share contracting by 2.7 percentage points, forecast to account for just 6.9% of total telecommunications revenue in 2011-12.
Products and services segmentation (2011-12)
Total $40.8bn
46.6%Mobile services
29.6%Wired services
15.1%Fixed internet services
6.9%Resellers
1.8%Satellite, TV and radio relay
SOURCE: WWW.IBISWORLD.COM.AU

www.IbISwOrLd.COM.Au Telecommunications Services in Australia May 2012 16
Products & Markets
demanddeterminants
Demand determinants outline the various factors that stimulate or reduce the demand for services supplied by this sector.
Each industry within the Telecommunications Services sector has its demand influenced by the over-riding economic conditions. Consumer demand is largely a function of employment levels, household disposable incomes, taxes and interest rates. An increase in household disposable income is likely to result in an increase in household consumption for telecommunications services, with mobile telecommunications carriers and internet service providers having the greatest capacity to absorb an increase in demand given that consumers can move to higher and more expensive usage plans. The overall consumer demand for telecommunications services is relatively resistant to the economic conditions, but it is the service mix of the demand that is influenced. The correlation of higher income to increased demand in other telecommunication industries, such as wired telecommunications, is not as high.
Business demand is largely a function of economic activity, the state and health of the industry in which the company operates in and company profitability. A general increase in economic activity tends to correlate with increased demand for telecommunications services. A company that is performing well is also more likely to invest in more advanced telecommunications such as dedicated high-speed internet services, IP-based digital phone systems and in some cases, satellite telecommunications, which offer ubiquitous coverage as opposed to terrestrially based networks.
Perceived valuePrice is a key demand determinant for household users of telecommunications services. Lower, or falling, prices lead to an increase in consumer demand and are the key reason in the increased Australian mobile penetration over the last five years. A new service is initially priced at premium rates but as the
service gains subscribers the price contracts until a critical point is reached that fosters mass adoption amongst consumers. Similarly, with entry level broadband prices having fallen considerably over the past five years there has been rapid substitution from dial-up to broadband services within the existing subscriber market as well as the uptake of broadband internet by new customers. Overall this has seen strong internet subscriber growth over the last five years.
Business customers are less sensitive to price reductions, though it is important, particularly for those companies that have a large workforce. Business customers favour the level and quality of service as opposed to price, the inferior quality of initial VoIP offerings in comparison with traditional voice mediums has been the major factor in businesses not adopting the cheaper VoIP product.
Advanced technologyTechnological advances enable the introduction of new, or advancements in existing services. The continual improvement to services flows through to increase demand across all key market segments. The introduction of ADSL2+ services, which offer broadband internet speeds of up to 24 Mbps, has resulted in an increase in demand in the Internet Service Providers industry, whilst the Mobile Telecommunications Carriers industry growth has been re-invigorated by the introduction of 3G services. The Mobile Telecommunications Carriers industry is heavily marketing advanced 3G services, whilst the once dominant second generation technology is somewhat forgotten and will be phased out in the future. Enhancements of
Demand is affected by the introduction of new services and enhancement of existing services

www.IbISwOrLd.COM.Au Telecommunications Services in Australia May 2012 17
Products & Markets
existing services and technologies such as moving from PABX phone systems to digitally-based services and video conferencing as opposed to telephone hook-ups will also result in increased demand for sector services. The Satellite, Television and Radio Relay Operations industry has benefited from the concurrent transmission of digital and analogue services; however the ideal environment will come to an end in 2013 when analogue TV transmission ceases.
Availability of servicesDemand for telecommunications services is also a function of supply. Presently, not all Australians have access to broadband internet services and a smaller proportion of the population are not covered by any of the terrestrially-based mobile telecommunications networks. Although availability of services may depend on investment principles or government assistant, an increase in coverage will increase demand.
demanddeterminantscontinued
Major Markets Households are estimated to account for 67.7% of the total market for telecommunication services. The overall market share accounted for by households varies considerably between industries. Households are the major market in the wired, mobile and ISP industries. In contrast, households are reported to account for only a small proportion of the market for telecommunication resellers and satellite, TV and radio relay operators.
Corporate clients are expected to account for 27.5% of sector revenue. This largely includes demand for services from a broad range of divisions such as Finance and Insurance, Manufacturing, Retail Trade, Wholesale Trade and
Property and Business Services. Analysis suggests that satellite, TV and radio relay operators rely heaviest on the corporate market. This is because their industry is upstream from telecommunication carriers and broadcasters and therefore gains a large proportion of its revenue from businesses.
Government is expected to account for 4.8% of the demand for services provided by this sector. Satellite, TV and radio relay operators depend on the government market for a sizeable share of their revenue. Their industry provides services to the ABC and SBS in particular. The government segment is usually fairly stable.
Major market segmentation (2011-12)
Total $40.8bn
67.7%Households
27.5%Corporate clients
4.8%Government
SOURCE: WWW.IBISWORLD.COM.AU

www.IbISwOrLd.COM.Au Telecommunications Services in Australia May 2012 18
Products & Markets
International Trade Domestic and international markets examine the import source and export destination for services supplied by this sector. For the Telecommunications Services sector, it represents the value of termination fees incurred by domestic carriers overseas and foreign carriers domestically. Increased competitiveness has put downward pressure on prices. So while international traffic volumes have
increased, the value of exports and imports is believed to have changed little over the past decade. IBISWorld anticipates that the current trend of low trade levels for services provided by this sector will persist over the next five years. Ultimately, the Telecommunications Services sector provides services to the Australian economy so international trade is not a focus of operators.

www.IbISwOrLd.COM.Au Telecommunications Services in Australia May 2012 19
Products & Markets
SOURCE: WWW.IBISWORLD.COM.AU
TAS1.4
wA9.4
QLd17.3
VIC27.6
NSw35.6
NT1.1
SA6.2
ACT1.4
Employment (%)
Cold Zone (<10) <25 <50 Hot Zone (<100) Not applicable
business Locations 2011-12

www.IbISwOrLd.COM.Au Telecommunications Services in Australia May 2012 20
Products & Markets
business Locations The geographic distribution of the Telecommunications Services sector is relatively consistent with the population distribution of the nation, although there are some notable contrasts. The biggest divergence between employment share and population share is in New South Wales. It is expected that New South Wales is to account for about 35.6% of total sector employment compared to a population share of 32.4%, implying higher employment on a per capita basis. Employment share in New South Wales has been declining due to higher sector employment in Queensland and Western Australia. Despite this, sector employment in these states will still be lower than their respective population shares. This is because the head offices of telecommunications companies tend to be in Victoria and New South Wales.
A greater concentration of head offices means Victoria and New South Wales exhibit a disproportionately high share of wages. This is because higher earning roles such as senior management and executives are located at head offices. So a higher average wage means a greater overall share of wages. IBISWorld
believes Western Australia has the lowest average wage. This is particularly notable given that state had the lowest unemployment level in the country, which generally puts upward pressure on wages. Ultimately, it suggests the majority of employment within Western Australia is focused on customer service, sales and administration functions instead of head-office tasks.
Perc
enta
ge
40
0
10
20
30
WA
ACT
NSW N
T
QLD SA TA
S
VIC
EmploymentPopulation
Distribution of employment vs. population
SOURCE: WWW.IBISWORLD.COM.AU

www.IbISwOrLd.COM.Au Telecommunications Services in Australia May 2012 21
Key Success Factors Having an extensive distribution/collection networkAn exhaustive distribution network (or access to it), via an extensive infrastructure network, is a key factor to the success of the organisation.
Development of new productsDeveloping value-added products beyond the traditional market is critical in retaining and growing market share.
Ability to raise revenue from additional sourcesThe traditional products and markets are entering decline, so large telcos will need to reinvent themselves and look to new revenue streams.
Understanding government policies and their implicationsRegulations and government policies relating to the industry have changed and are changing significantly. This
affects many variables, including competition and pricing.
Economies of scaleFor industry participants, gaining economies of scale helps to reduce the cost of doing business, which contributes to higher profit margins.
Having contacts within key marketsThe development of strategic alliances with major end user industries, such as pay-TV, electronic commerce providers and other online service providers, is important.
Undertaking technical research and developmentBusinesses need to undertake research and development to ensure the organisation meets world best practice in operational efficiency and delivering the service.
Market Share Concentration
The Telecommunications Services sector has a high level of concentration with the top three major companies accounting for over 80% of revenue. The sector previously had four major players, but the third and fourth largest players, Vodafone and Hutchison, merged operations in 2009. There is a large gulf between the next level of second tier telcos. The high level of concentration can largely be attributed to Telstra, which has held onto around 50% of the market over the last five years. The challenger, Optus, has market share less than half of Telstra’s.
Telstra’s sector dominance ultimately lies in the company’s incumbency. Being an integrated service provider with ownership over the PSTN has placed the telco at considerable advantage. This is why Telstra’s share of the sector has remained virtually unchanged over the past five years, despite the best efforts of a host of competitors.
While the sector as a whole is regarded as highly concentrated, levels do vary between various industries. For example, the Telecommunications Resellers industry has a low level of concentration, especially as Optus gradually exits the industry. Alternatively, the Mobile Telecommunications Carriers industry has an extremely high level of concentration, with the top three players accounting for over 99% of revenue.
Competitive LandscapeMarket Share Concentration | Key Success Factors | Cost Structure benchmarks basis of Competition | barriers to Entry | Industry Globalisation
Concentration by industry
IndustryTop four share
(%)Concentration
(index)
Wired 93.7 HighMobile 99.6 HighResellers 31.5 LowISPs 63.4 MediumSatellite & other 88.8 High
SOURCE: IBISWORLD
Level Concentration in this industry is High
IBISWorld identifies 250 Key Success Factors for a business. The most important for this industry are:

www.IbISwOrLd.COM.Au Telecommunications Services in Australia May 2012 22
Competitive Landscape
Cost Structure benchmarks
The Telecommunications Services sector cost structure largely reflects that of the infrastructure owners. The industries are dominated by the infrastructure owners and as such the overall sector mirrors the infrastructure performance, in that the sector achieves a high profit margin and incurs considerable depreciation and interest expense. The only industry in the sector that does not own and operate infrastructure is the relatively small Telecommunications Resellers industry. Resellers purchase wholesale capacity on the networks of other industries to then resell services to businesses and consumers. So for resellers, depreciation, interest and profit tend to represent a small share of revenue.
ProfitabilityTelecommunications companies require, and have been able to achieve, impressive profit margins due to the significant risk that they take on via the substantial initial, and the ongoing, investment in building, operating, maintaining and upgrading network infrastructure. Such investment comes with a high level of risk not only because the sums invested, but also the long return timeliness. This substantial investment risk then attracts a relatively high weighted average cost of capital (WACC), which necessitates sizeable profit margins. This year, IBISWorld expects the Telecommunications Services sector to achieve a profit margin of 14.9%, with a tax bill of 4.2% of revenue. The profit margin will be down 0.25 percentage points on the previous year and will reflect profit erosion in both wired and mobile services. In line with its low capital investment, the Telecommunications Resellers industry tends to generate the lowest margins at about 5.0%.
Access chargesThe largest expense for Telecommunications Services sector participants is the cost of services. This cost represents access charges, interconnection fees, USO fees and termination charges. This year, this is
expected to account for 31.4% of sector revenue. Resellers spend the most on the cost of services because they have to purchase network capacity. ISPs also spend heavily on this item as they must pay for using a carrier’s network (e.g. the PSTN and internet backbone). This is important considering that 95% of ISPs do not own infrastructure.
DepreciationThe sector’s heavy investment in infrastructure means it incurs large depreciation costs. Network investment is ongoing because operators must upgrade their networks with the latest technology developments. This is particularly the case in the mobile and internet services markets where there has been rapid technology innovation. Over the past decade, telcos have also invested in IT systems to automate a large number of administrative and processing functions. IBISWorld expects depreciation charges to account for 16.5% of revenue. Over the next decade, the sector’s proportional depreciation expense is expected to increase in line with the NBN roll out, expected 4G network builds and ongoing HFC investments.
Finance costsThe substantial costs associated with network builds are generally facilitated by debt. This means the sector has considerable costs allocated to the financing of said debt. This year, the sector’s interest expense will decrease by 0.4 percentage points to an expected 3.1% of revenue as major players benefit from the reduced interest rates and halt in investment that occurred as a result of the economic downturn. The biggest spenders on financing are the satellite and radio relay operators. These companies are particularly dependant on debt for financing their investment activities. Alternatively, resellers spend the least on interest because they only have small investment requirements.

www.IbISwOrLd.COM.Au Telecommunications Services in Australia May 2012 23
Competitive Landscape
Cost Structure benchmarkscontinued
Labour forceDespite being capital intensive, success in the Telecommunications Services sector relies on a large labour force and as such labour remains a key cost to the sector. Critical functions such as sales, marketing, customer service, accountant administration and network maintenance depend on labour. However, over the past decade the labour intensiveness of a number of these functions (e.g. accounts and customer service) has fallen due to investment in automation technology. Moreover, ongoing merger and acquisition activity has facilitated more productive use of labour. Consequently, sector employment has declined and this
has seen the sector’s proportional wage expense fall.
Other expensesAdvertising expenses vary between competitors and varies from 1.0% to 4.0% of revenue. Big spenders on marketing include iiNet, SP Telemedia (owner of Soul and TPG), VHA, Telstra and Optus. While Telstra and Optus spend the most, these companies get to spread this spending over a much larger revenue base. Other operating expenses that are significant include purchase costs, repairs and maintenance, legal expenses, bad debts, leasing expenses, vehicle and travelling expenses and tax.
Sector vs. Industry Costs
■ Profi t■ rent■ utilities■ depreciation■ Other■ wages■ Purchases
Average costs of all industries in
sector (2011-12)Industry costs
(2011-12)
0
20
40
60
Perc
enta
ge o
f rev
enue
80
100
12.2
9.2
15.0
47.3
14.40.51.4
14.9
6.611.6
46.6
16.51.52.3
SOURCE: WWW.IBISWORLD.COM.AU

www.IbISwOrLd.COM.Au Telecommunications Services in Australia May 2012 24
Competitive Landscape
basis of Competition Over the past five years, competition within the Telecommunications Services sector has greatly intensified. The commoditisation of key industry services has lead to price being the major competition basis. Because competition is primarily price-based, it has become increasingly important for companies in the sector to have large-scale operations in order to remain profitable. This was the catalyst for a spate of merger and acquisition activity within the Internet Service Providers industry that has seen the number of second-tier players expand with the emergence of SP Telemedia and iiNet. The merger and acquisition activity and creation of a number of larger players with more scale has further fuelled competition in the growing ISP market. Meanwhile, the Vodafone-Hutchison (VHA) merger in the Mobile Telecommunications Carriers industry means that the top three carriers will be able to compete due to their large scale of operations. The Wired Telecommunications Carriers industry, historically dominated by Telstra’s PSTN will also face increased competition once the National Broadband Network arrives; competition in wired will be transformed.
The major basis in which telecommunication companies compete is on the basis of price. The fixed-to-mobile substitution shift has been primarily driven by improved pricing position offered by mobile carriers. However, service quality in the form of coverage and product innovation in the form of value-added services has become increasingly important. Price is the critical factor because it is often difficult to differentiate between services that are becoming commoditised. The most common form of pricing strategy, initially implemented by mobile carriers but later adopted across the board, is the cap (or bucket) plan. These plans offer users a defined usage limit for a particular monthly fee. In the past five years, the value of the caps has increased to attract additional subscribers. So pricing changes can be a change in the cap service value or in the cap price.
The primary means for differentiating services is on quality: speed, coverage and reliability. Speed is increasing in importance as the sector transitions towards a digital data-based network. Subscribers have changed the product preference and now prefer to access more sophisticated web content and services such as video, IPTV, social networking, online gaming and innovative e-commerce. These applications require greater downlink speeds to attain usability, but at the same time they place a much larger strain on the overall network performance. Telcos are set to place even greater emphasis on speed (and network capacity) over the next five years as more services become IP based. High speed, high capacity networks will be necessary for enabling the multitude of innovative, web-based services that are being developed for businesses.
Advancements in network and device technology are enabling rapid product and service innovation. For telcos, being first to market with innovation can represent a significant competitive advantage. Optus’ iPhone play exemplifies this dynamic where it was able to leverage the success of the iPhone as a means of increasing its mobile market share. Also, iiNet is attempting to win with a first to market product-service innovation bundle in the ISP market with the release of ‘BoB’ (i.e. broadband in a box). The building of the NBN and eventual move to 4G will further intensify internal competition as the boundaries between historically distinct services are removed. The Telecommunications Services is trending toward a utility type service, high volume but low margin, which will see service innovation become the key to differentiation and to the ability of a participant to maintain strong margins.
Novel marketing and service packaging
Level & Trend Competition in this industry is Medium and the trend is Increasing
Competition between service providers is primarily based on price

www.IbISwOrLd.COM.Au Telecommunications Services in Australia May 2012 25
Competitive Landscape
basis of Competitioncontinued
is also becoming an increasingly significant competitive point as players offer integrated combinations of the latest products and services to encourage customers to become multi-product users. Marketing strategies that focus on cross selling products can enable players to make the most of their subscriber base. A number of players have also cited the
importance of branding as a means of achieving differentiation. For example, Optus, an established telecommunications player, has invested substantial resources into developing the Optus brand, believing it to be a significant variable in customer acquisition and retention across most customer segments.
barriers to Entry Barriers to entry outline the factors that limit a company from entering the market. Key barriers to entry to the Telecommunications Services sector include economies of scale, capital intensity, service differentiation, distribution networks and licences. The barriers to entry in the Telecommunications Services sector are high, despite extensive deregulation of the past 15 years.
Despite the radical changes that have occurred in the regulatory backdrop of the Telecommunications Services sector, there still exists a number of barriers to entry that are inherent characteristics of the telecommunications market. For example, a network operator must build, upgrade and maintain network infrastructure. Doing so is very capital intensive and involves an extremely high level of sunk costs. The potential for new network operators is limited to well capitalised firms.
Other barriers revolve around the established position of the previous statutory monopoly. As has been found in a number of other countries that have recently liberalised their telecommunication sectors, these incumbents still maintain a large market share in many facets of the sector despite the regulatory changes that have occurred. For example, incumbents enjoy considerable cost advantages arising from economies of scale and scope. They also in effect still maintain control of essential or bottleneck facilities. Telstra and Singtel Optus are still thought to account for over 90% of fixed-line service revenue and more than 70% of the
mobile market. The issue of access rights and declared services for new entrants is of paramount importance.
Barriers to entry will vary between the various segments of the Telecommunications Services sector. For example, barriers to entry for switched service providers in the IDD (international direct dialling) market segment are lower than the local call market as a result of lower interconnection costs and more concentrated call patterns. There has also been a creation of new niches in the reseller market.
A significant issue determining the ease of entry into mobile markets is the availability of spectrum. Importantly, spectrum availability determines the number of carriers that can be licensed. With the merging of Vodafone and Hutchison, there are now just three network operators that account for over 99% of the Mobile Telecommunications Carriers industry. The potential for new entrants within the industry is limited to niche satellite services. The scarcity of available spectrum is flowing through as an increased barrier to the Telecommunications Resellers industry. Previously, network operators had wholesaled excess spectrum to resellers who would be able to better service particular markets, but as bandwidth use intensifies mobile operators are buying out mobile virtual network operators and amalgamating the subscriber base onto their own networks.
Entry into the Internet Service Protocol industry was historically relatively easy, evidenced the
Level & Trend Barriers to Entry in this industry are High and Steady

www.IbISwOrLd.COM.Au Telecommunications Services in Australia May 2012 26
Competitive Landscape
Industry Globalisation
Globalisation measures the extent to which this sector operates on a global scale. IBISWorld classifies the Telecommunications Services sector as operating at a medium level of globalisation. This is mainly because foreign operators are heavily involved within the domestic telecommunications market.
Foreign ownership concentration has increased over the past decade. Of the top ten players, five are foreign owned: Optus, VHA, TCNZ (AAPT), Primus and Broadcast Australia. The first three of these companies represent the three largest operators in the Telecommunications Services sector behind Telstra. Combined, these telcos are expected to account for 36.2% of sector revenue.
Telstra remains the dominant telecommunications provider. Telstra is majority Australian owned and the
government still holds a sizable stake via the Future Fund. Telstra will remain Australian given that there are foreign ownership restrictions in place. Many of the smaller sector enterprises are domestically owned and operated.
A number of industries in this sector support Australian owned operators that earn the majority of their sales from domestic activity. The dominant telecommunication provider in Australia, Telstra, has operations in New Zealand and some Asian countries. However, revenue derived from these businesses account for less than 10% of Telstra’s
barriers to Entrycontinued
comparatively low level of industry concentration and high number of small ISPs operating in the market. However, becoming a financial success and winning subscribers from well-established players such as Telstra and Optus is difficult. As competition intensifies in this industry, the need for innovative marketing and pricing campaigns to win subscribers is increasing. Effective marketing can be resource intensive and the success of material price cuts ultimately depends on providing quality customer service in order to reduce subscriber churn (i.e. to retain won customers). There are significant scale economies that can be realised in the provision of customer service, which gives large ISPs a significant advantage and this has resulted in the level of competition within the industry increase. Smaller players are merging operations to give themselves a fighting chance of competing with the major ISPs.
With convergence being a major characteristic of the
Telecommunications Services sector in general, there is a growing need for business alliances and strategic partnerships to take advantage of convergence trends. To attract partners to deliver inter-connected information and communication services, telcos must be provide the partner with access to a large enough group of profitable customers that the investment in the partnership is worthwhile. Again this favours the larger telcos, many of which have already established alliances and strategic partnerships with information and communication companies.
barriers to Entry checklist Level
Competition MediumConcentration HighLife cycle stage DeclineCapital intensity HighTechnology change HighRegulation and policy HeavyIndustry assistance Medium
SOURCE: WWW.IBISWORLD.COM.AU
Most operators derive little revenue in foreign markets, but three of the four biggest telcos are foreign-owned
Level & Trend Globalisation in this industry is Medium and the trend is Increasing

www.IbISwOrLd.COM.Au Telecommunications Services in Australia May 2012 27
Competitive Landscape
Industry Globalisationcontinued
total company revenue. Other players also have operations in foreign countries, however, these business also account for only a small portion of company revenue.
In analysing the level of globalisation in the Telecommunications Services sector, it is important to note the worldwide trend towards cross-border
investments in global telecommunications. In accordance with the WTO’s General Agreement in Trade in Services, a number of countries have liberalised markets and investment in telecommunications. In the short term, IBISWorld anticipates the level of sector globalisation will continue to rise.
www.IbISwOrLd.COM.Au Telecommunications Services in Australia May 2012 28
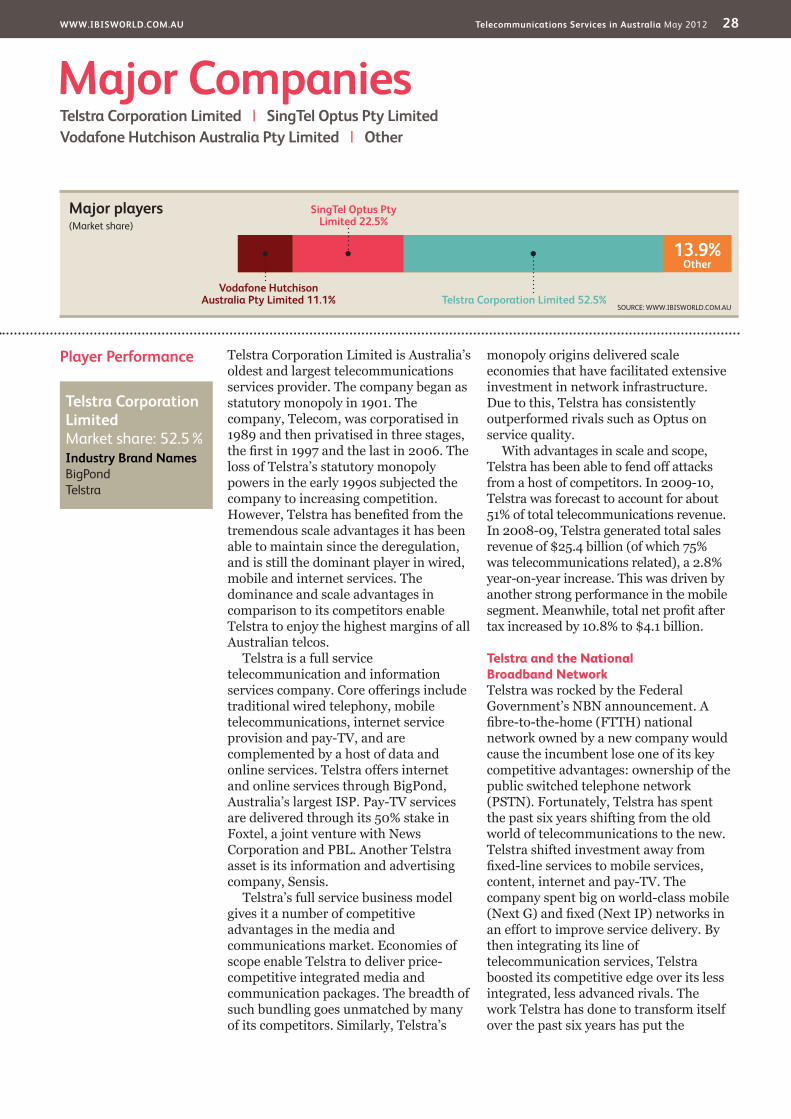
Player Performance Telstra Corporation Limited is Australia’s oldest and largest telecommunications services provider. The company began as statutory monopoly in 1901. The company, Telecom, was corporatised in 1989 and then privatised in three stages, the first in 1997 and the last in 2006. The loss of Telstra’s statutory monopoly powers in the early 1990s subjected the company to increasing competition. However, Telstra has benefited from the tremendous scale advantages it has been able to maintain since the deregulation, and is still the dominant player in wired, mobile and internet services. The dominance and scale advantages in comparison to its competitors enable Telstra to enjoy the highest margins of all Australian telcos.
Telstra is a full service telecommunication and information services company. Core offerings include traditional wired telephony, mobile telecommunications, internet service provision and pay-TV, and are complemented by a host of data and online services. Telstra offers internet and online services through BigPond, Australia’s largest ISP. Pay-TV services are delivered through its 50% stake in Foxtel, a joint venture with News Corporation and PBL. Another Telstra asset is its information and advertising company, Sensis.
Telstra’s full service business model gives it a number of competitive advantages in the media and communications market. Economies of scope enable Telstra to deliver price-competitive integrated media and communication packages. The breadth of such bundling goes unmatched by many of its competitors. Similarly, Telstra’s
monopoly origins delivered scale economies that have facilitated extensive investment in network infrastructure. Due to this, Telstra has consistently outperformed rivals such as Optus on service quality.
With advantages in scale and scope, Telstra has been able to fend off attacks from a host of competitors. In 2009-10, Telstra was forecast to account for about 51% of total telecommunications revenue. In 2008-09, Telstra generated total sales revenue of $25.4 billion (of which 75% was telecommunications related), a 2.8% year-on-year increase. This was driven by another strong performance in the mobile segment. Meanwhile, total net profit after tax increased by 10.8% to $4.1 billion.
Telstra and the National Broadband NetworkTelstra was rocked by the Federal Government’s NBN announcement. A fibre-to-the-home (FTTH) national network owned by a new company would cause the incumbent lose one of its key competitive advantages: ownership of the public switched telephone network (PSTN). Fortunately, Telstra has spent the past six years shifting from the old world of telecommunications to the new. Telstra shifted investment away from fixed-line services to mobile services, content, internet and pay-TV. The company spent big on world-class mobile (Next G) and fixed (Next IP) networks in an effort to improve service delivery. By then integrating its line of telecommunication services, Telstra boosted its competitive edge over its less integrated, less advanced rivals. The work Telstra has done to transform itself over the past six years has put the
Major CompaniesTelstra Corporation Limited | SingTel Optus Pty LimitedVodafone Hutchison Australia Pty Limited | Other
Major players(Market share)
13.9%Other
Telstra Corporation Limited 52.5%
SingTel Optus Pty Limited 22.5%
Vodafone Hutchison Australia Pty Limited 11.1%
SOURCE: WWW.IBISWORLD.COM.AU
Telstra Corporation Limited Market share: 52.5% Industry brand Names BigPond Telstra

www.IbISwOrLd.COM.Au Telecommunications Services in Australia May 2012 29
Major Companies
Player Performancecontinued
company in the best position to deal with arrival of the NBN.
The announcement of the NBN forced Telstra to change its adversarial tact. The new CEO, David Thodey, has outlined Telstra’s intention to engage constructively with the government and the new NBN Co. in finding a solution that is in the best interests of the nation, while maintaining value for Telstra shareholders. Telstra and NBN Co. have released statements that show that the two organisations are in agreement that the PSTN will be phased out over time and replaced by the fibre network. This presents an interesting dilemma for Telstra because it will end up with only retail access to the NBN. With the finer details of the separation currently being worked out, David Thodey has shifted the focus to a fight about the value of the Telstra network rather than a fight about the structure of the company.
The NBN process has affected Telstra’s fixed-line investment strategy. In March 2009, Telstra announced it would spend $300 million over the year to upgrade its entire hybrid fibre-coaxial (HFC) network to deliver speeds of up to 100 Mbps. This followed the news the company had been excluded from the original NBN process. Importantly, 100 Mbps connectivity will match that of the NBN, with scope to accelerate speeds with further upgrades to 200 Mbps. Because such an investment could jeopardise the viability of the NBN, the Federal Government
considered coercing Telstra into divesting its HFC network and Foxtel. This would be a bold move as it would affect Telstra’s standing as an integrated telecommunications provider. Telstra then announced in October 2009 that it would no longer invest in ADSL2+ technology. This followed the 1,856th exchange upgrade to ADSL2+, extending these services to the majority of the population.
Fixed internet servicesTelstra BigPond is Australia’s largest ISP, with total fixed internet subscribers of 4.3 million in December 2009. Telstra’s fixed internet subscribers are dominated by broadband subscribers, 2.2 million out of its 4 million broadband subscribers are Telstra retail clients, with the remainder wholesaled to other ISPs.
Telstra’s average revenue per user (ARPU) for broadband services has been increasing since 2006-07, despite declining connection costs. To enjoy new web content and services, consumers have been migrating to premium high-speed ADSL2+ or super-fast cable plans with larger download limits.
The NBN will eventually erode Telstra’s speed and coverage advantages. There is the possibility that Telstra will cease to be an infrastructure owner altogether if the government forces it to sell its HFC assets. Telstra’s integrated retail business and significant telecommunications expertise would still
Telstra Corporation Limited (Australian telecommunication services segments) – fi nancial performance
yearrevenue ($ billion) (% change)
Operating Profi t ($ billion) (% change)
2006-07 20.4 n/C 4.9 n/C
2007-08 21.5 5.4 5.1 4.1
2008-09 21.8 1.4 5.5 7.8
2009-10 21.2 -2.8 5.4 -1.8
2010-11 21.8 2.8 4.8 -11.1
SOURCE: AnnUAL REPORT AnD IBISWORLD

www.IbISwOrLd.COM.Au Telecommunications Services in Australia May 2012 30
Major Companies
Player Performancecontinued
give the telco a broad-based competitive advantage. However, the playing field from an operational perspective would be levelled.
Mobile servicesTelstra is the largest mobile carrier, with almost 10.4 million subscribers. However, the company is losing share as rivals Optus and VHA fight desperately to win a larger share of the most lucrative telecommunications market. The loss of subscriber share is of great concern to Telstra, as it means the telco has fewer customers to immediately target with new services. This is significant considering the rapid rate of innovation in the mobile space. Telstra’s loss of market share has been most dramatic in the past two years. This was due to Optus’s iPhone play. Optus is rapidly acquiring subscribers by heavily subsidising the iPhone handset. This is undermining the profitability of Optus’s mobile operations, but in an industry where customer market share is critical, it is worth taking the hit. However, Telstra does have economies of scale and enhanced profitability in comparison to competing telcos.
Telstra has been funnelling the majority of its capital expenditure toward its mobile network. The company’s Next G 3G W-CDMA network is the fastest in the world at 21 Mbps. Telstra has stated it will increase this to 84 Mbps. This is important as speed is quickly becoming a critical point of differentiation in the mobile space. Faster wireless connectivity is enabling consumers to rely solely on wireless internet access, which is why fixed internet connections declined in
2007-08 and 2008-09. Telstra has the opportunity to out manoeuvre Optus on emerging wireless services, all of which depend on network speeds.
Wired voice servicesTelstra holds a particularly dominant position in wired voice telecommunications thanks to the PSTN, with a market share in excess of 70%. However, wired services are in decline and this is bad news for Telstra. The wired decline is being driven by mobile substitution, as consumer behaviour has shifted towards the always-on connectivity and increasing affordability offered by mobile services. This is causing consumer telecommunications consumption to shift from an industry Telstra dominates to one where the company has a much lower share. Consequently, Telstra is realising a net loss in customers and revenue as a result of service substitution.
Mobile substitution is the outcome of price and is being magnified by the convenience of mobility. Price-competitive bucket mobile plans are making it viable for Telstra’s customers to disconnect their landlines and rely solely on their mobile for their communication needs. In addition, Telstra’s competitors are ceasing to resell Telstra’s wired services as they build their own networks. Telstra lost 343,000 access lines in 2008-09 to total just over 9.0 million lines, with wholesale lines accounting for over 60% of the line loss. This caused Telstra’s mobile revenue to exceed PSTN revenue for the first time in the company’s history, with PSTN declining 4.9% to 6.3 billion, while mobile jumped 7.3% to $6.9 billion.

www.IbISwOrLd.COM.Au Telecommunications Services in Australia May 2012 31
Major Companies
Player Performance SingTel Optus Pty Limited (previously Cable & Wireless Optus) is Australia’s second-largest telecommunications company. The company is a fully integrated telco, offering mobile services, fixed telephony, business network services, internet access, satellite services and subscription TV. Over the past few years, Optus has invested billions of dollars in its four networks: fixed, mobile, broadband and satellite.
Optus was formed in 1991, becoming Australia’s first privately owned fixed and mobile carrier. This first private licence was offered by the government as the first stage of telecommunications deregulation. In 2001, Optus (then known as Cable & Wireless Optus) was purchased from a UK telecommunications group by the Singaporean telecommunications group SingTel.
Optus operates under four business units: mobile, business, wholesale, and consumer and small-to-medium business, with its mobile unit generating the majority of revenue at around 60%.
Over the last few years, Optus has shifted its organisational focus from the traditional wired voice telecommunications product, re-positioning itself as a leading provider of integrated communication services. In fixed-line services, the company’s strategy centres on boosting on-net traffic, which is resulting in its exit from the reseller space. In mobile, Optus’s strategy is to win 3G subscribers and to grow data revenue, even though this is negatively affecting current margins. This move is paying dividends, with the company gradually winning share since 2007.
The company’s emphasis on building iPhone subscriptions has attracted a large number of post-paid subscribers, evidenced by the 34.5% surge in equipment revenue. With more 3G enabled handsets, data revenue jumped 29.4% and propelled the revenue increase. However, this cost the company, as it heavily subsidised the popular handset to facilitate iPhone adoption. In the end, the strategy blew away 4.8 percentage points in margins.
The upside, however, was a market share gain of 1.4 percentage points on subscriber basis to 34.1%.
Optus is currently upgrading its 3G network to cover regional and rural areas, and is doing so using high-speed downlink packet access (HSDPA) technology. Network coverage will mirror that of its 2G network and, more importantly, will provide some competition for Telstra’s Next G network. While this may only represent an increase in population coverage of a few percentage points, it does represent an increase in Optus’s potential subscriber market size of about 600,000 people. The network rollout commenced in April 2007 and will require 2,000 to 2,500 new 3G base stations. Furthermore, in May 2012 an agreement between Optus and Vodafone until 2016 to share infrastructure has been struck in preparation for 4G mobile.
In March 2012, parent company Singtel announced a significant change in the company’s strategic approach, and has decided to restructure the entirety of its operations among functional rather than geographic lines. A new emphasis will be placed on digital services in recognition of the success of tech giants Apple, Facebook and Google all gaining significant amounts of revenue utilising their infrastructure, when they have the potential to perform the task better due to a greater ability to customise the offering to the customer through greater knowledge of their customer’s activities.
SingTel Optus Pty Limited Market share: 22.5% Industry brand Names Optus
Singtel Optus – fi nancial performance
year*revenue ($ billion) (% change)
2006-07 7.6 n/C
2007-08 7.8 2.6
2008-09 8.4 7.7
2009-10 9.0 7.1
2010-11 9.4 4.4
*year end MarchSOURCE: AnnUAL REPORT

www.IbISwOrLd.COM.Au Telecommunications Services in Australia May 2012 32
Major Companies
Player Performancecontinued
The immediate expectation of this change is that the company intends to bring its own mobile advertising to its customers. Furthermore, despite building the long term inroads in its mobile operations, Optus has been forced to cut staff in response to the restructure.
The move has also brought into greater focus its legal battle between Telstra, the NRL and AFL over its new service of allowing its customers to record free to air TV programs on mobile devices with the ability to playback within minutes of the actual broadcast. The company has lost the case at a federal level, but it is yet to be seen whether the company will bring the case to the High Court.
Internet servicesOver the past five years, Optus has battled intensely to win a larger share of the ISP market. It has taken a small toll on the company, with falling ARPU undermining profitability. ARPU took a hit as the company slashed prices to counter Telstra’s aggressive price competition. Luckily, the struggles of taking on a superior competitor are nearing an end for the telco. The Federal
Government’s NBN project levels the ISP playing field. As an integrated telco, Optus will be in a realistic position to attack Telstra’s dominance. The long-term outlook is positive for Optus as an ISP and a telco in general.
WiredDuring the five years through 2009-10, Optus’ wired segment underwent some significant changes. In the beginning of the period, Optus’ fixed line segment was dominated by voice revenue and a large share of revenue was generated from reselling Telstra’s service as part of its off-net segment. However, over the five years, data was the boom growth product and there was a decline in wholesale revenue as Optus transferred customers onto its own network. The strategic decision to move customers to its own network had two benefits: to increase its own margins and to reduce revenue that Telstra is able to earn from the resale of its network. The success of this strategy is evidenced by an expected 5.0 percentage-point increase in Optus’ wired telco industry revenue share over the five years through 2009-10.
Player Performance In February 2009, Vodafone and Hutchison announced an agreement to merge their telecommunications businesses in Australia. Both Vodafone and Hutchison have an equal ownership of 50% in the joint venture, which was renamed Vodafone Hutchison Australia Pty Limited (VHA). The joint venture was given the green light by the Australian Competition and Consumer Commission in May 2009. This move was a positive step for both companies. Previously, the efforts of Vodafone and Hutchison undermined each other’s profitability, as neither possessed enough scale to compete effectively with the much larger Telstra and Optus. With resources pooled, the playing field has been levelled, as the merged entity has the scale to compete effectively. Upon merger, VHA had a
customer base of about 6.0 million users with combined total revenue of over $4.0 billion. In the short term VHA set its sights on overhauling Optus to become the nation’s second-largest mobile service provider. VHA markets its products and
Vodafone Hutchison Australia – fi nancial performance
year*revenue ($ billion) (% change)
2008 1.6 n/C
2009 3.4 112.5
2010 4.8 41.2
2011 4.6 -4.2
*year end decemberSOURCE: IBISWORLD
Vodafone Hutchison Australia Pty Limited Market share: 11.1% Industry brand Names 3 Mobile Vodafone

www.IbISwOrLd.COM.Au Telecommunications Services in Australia May 2012 33
Major Companies
services under the Vodafone brand, but retained exclusive rights to use the 3 brand in Australia during a transition period and thereafter.
The May 2009 merger of operations was a necessity for both organisations to begin to compete with Telstra. Vodafone was losing market share and Hutchison was struggling to turn a profit. Competing with each other meant that neither company was going to be successful in the Telecommunications Services industry. Both organisations realised that to compete they needed to combine forces to realise operational efficiencies and leverage the combined scale advantages.
Since the merger, revenue levels have had to endure significant setbacks due to the global financial crisis (happening the
same year as the merger), and in 2011, Vodafone’s mobile network fell under strong criticism which led to an exodus of many customers. The company, however, still accounts for over 10% of total sector revenue. While this is still somewhat behind market shares of Telstra and Optus, VHA is still in the process of merging its operations completely under the Vodafone brand name, and subsequently has the potential to generate greater synergies and consequently greater revenue levels. Furthermore, with its focus on the Mobile Telecommunications Services industry, it has an advantage of being in a strong growth area within the industry, which creates greater potential towards raising its revenue growth rates above the sector average.
Player Performancecontinued
Other Companies There is a large gap between the three major telecommunications companies and the rest. Second tier companies including Telecom NZ, iiNet, M2 and TPG all hold around 1-2% market share. A large number of companies then follow, each tending to focus on servicing specific markets.
Telecom NZ Estimated market share: 1.8%In 2000, Telecom NZ acquired the Australian company AAPT. AAPT was established in 1991 by AAP Information Services, the first privately owned satellite network operator in Australia. AAPT operates an integrated business that provides a range of voice and data services to the business, corporate, government and residential markets. AAPT provides coverage to approximately 85% of Australian businesses in metropolitan areas along the east coast of Australia and was the first carrier to deliver mid-band Ethernet at speeds up to 45 megabits per second over existing copper lines. Growing via an increase in sales and by acquisition, in 2010 AAPT was Australia’s third-largest
wired telecommunications carrier.In November 2006, AAPT finalised a
comprehensive network access services agreement with Australian network operator PowerTel. In May 2007, Telecom NZ announced its 100% acquisition of PowerTel, bringing together Australia’s second-largest telecommunications network infrastructure provider with the number three telecommunications player, AAPT.
AAPT has been hit hard by the substitution trend away from fixed service lines. In 2008-09, AAPT’s wired segment revenue decreased by 9.5% to $506 million. AAPT reported overall financial losses in 2006 and 2008, as the company failed to adjust to weaker margins and mass customer losses. The losses were particularly evident in the consumer segment, as customers embraced wireless devices and reduced usage of the traditional fixed phone. AAPT’s access lines and calling minutes tumbled during the five years through 2009-10. These decreases were exacerbated by intensifying price-based competition, which weighed on margins.
The overall performance of AAPT

www.IbISwOrLd.COM.Au Telecommunications Services in Australia May 2012 34
Major Companies
would have been much worse than a 5.6% per annum decline if it had not acquired PowerTel in 2007. The industry was in decline and the company’s figures were inflated in 2007-08 by the acquisition and consolidation of PowerTel’s revenue into the accounts. However, on an underlying basis, AAPT’s wired services recorded significant revenue reductions during 2008. The poor performance resulted in a market share decline, even after adding in PowerTel revenue since the acquisition.
Due to this continual struggle in the Australian market, the company has sold its consumer business to iiNet in July 2010 for $60 million. The company is still interested in selling the rest of its Australian operations, particularly as the industry undergoes further industry consolidation.
M2 Telecommunications Group Estimated market share: 1.8%M2 Telecommunications was established in 1999 and is the largest reseller of fixed line, mobile and data telecommunications that uses infrastructure from a number of different carriers including Telstra, Optus and Telecom New Zealand (PowerTel). M2 targets the commercial market, particularly small to medium enterprises. M2 operates two main business divisions: M2 Telecom and M2 Wholesale. The company is headquartered in Melbourne and was listed on the Australian Securities Exchange in October 2004.
M2 Telecom business division offers bundled telecommunications services and value added offerings targeted principally at the small business market. M2 Wholesale supplies wholesale telecommunications services to small and medium size telecommunications service providers and ISPs.
In December 2008, M2 reached an agreement with People Telecom to acquire the company through a scheme of arrangement. The $17 million deal was completed in April 2009. In June 2009, M2 Telecommunications completed the acquisition of Commander’s SMB
business segment for $19 million. These two acquisitions are expected to push the company’s reseller revenue up to about $400 million. This will make M2 the largest player in the Telecommunications Resellers industry.
M2 continues to pursue expansion through acquisition, as evidenced by the April 2010 acquisition of business assets of Clever Communications Australia.
In April 2012, the company increased its market share significantly by acquiring US company Primus’ Australian operations, in a bid to become a major contender over the next five years through broadening its customer base towards residential consumers and increase its overall scale. However, since Primus was involved in mostly different markets previously, the costs of synergy of not yet fully known. At this stage, the company expects the synergies generated to be worth $5 million a year.
iiNet Estimated market share: 1.7%Western Australia-based iiNet was established in 1993 and listed on the Australian Stock Exchange in 1999. The ISP has achieved growth via a series of strategic acquisitions; since 1998, the company has acquired in excess of 30 ISPs. Major acquisitions include OzEmail and its 47,000 broadband subscribers in early 2005, and Westnet and its 138,000 broadband subscribers in mid-2008. The Westnet acquisition helped iiNet boost its internet subscribers to almost 488,000 at the end of 2008-09. This made iiNet the third-largest ISP in Australia. The company has also engaged in the wired telecommunications market since the acquisition of AAPT’s consumer business and subsequently PowerTel (acquired by AAPT in 2007).
The company is one of a handful of ISPs that have invested in their own digital subscriber line access multiplexers (DSLAMs), with about 300 housed in Telstra exchanges. This investment means iiNet customers residing close to an exchange get internet access at speeds of more than 20 megabits per second using
Other Companiescontinued

www.IbISwOrLd.COM.Au Telecommunications Services in Australia May 2012 35
Major Companies
ADSL2+ technology. By investing in DSLAMs, iiNet bypasses a resale relationship with another ISP and is only bound to pay the regulated ULL charge to Telstra. In doing so, the company achieves a higher margin than many of its competitors.
Furthermore, iiNet was the first national provider of naked DSL, with ADSL2+ broadband delivered without the need for a phone service. This means iiNet customers do not have to pay phone line rental. This service began in late 2007 and in the first nine months, the company activated 25,000 naked DSL subscriptions. The company also rolled out a VoIP service, which had 120,000 customers in 2008-09.
In 2010, iiNet made three acquisitions. One was the $60 million takeover of AAPT’s consumer business, made in anticipation of the NBN rollout in an attempt to gain greater market share. AAPT’s consumer business is expected to deliver 113,000 broadband subscribers to iiNet. However, the natural churn rate will limit the potential gain. The company expected the acquisitions to lead to revenue growth and an increase in profits. iiNet’s market share of the Internet Service Providers industry was expected to increase to 12.5%, and it acquired 4.0% of the Wired Telecommunications Carriers industry.
Since 2008, the company has been battling against the Australian Federation Against Copyright Theft (AFACT) in the courtroom over who is responsible for copyright theft, with AFACT suggesting iiNet should cut off internet access to customers who are involved with copyright theft. The case found its way to the High Court, with a judgment handed down in April 2012 in favour of iiNet. The win for iiNet is significant, preventing potentially large operational costs in tracking such behaviour as well as being forced to reduce its customer numbers.
TPG Estimated market share: 1.4%The company, currently trading under the name TPG, is an Australian-based publicly
listed telecommunication company. TPG Telecom targets all markets. The strategy in the consumer market is to offer an integrated communications package including broadband internet, VoIP and landline phones, IPTV and resale mobile services. Within the business, government and wholesale markets, TPG offers a large number of wireline services such as voice and data. Voice services include local, long distance and international calling while data services include internet access (dial-up and broadband) and virtual private networks using a range of technologies such as xDSL, ATM and ISDN.
In 2010, the company purchased broadband wholesaler and operator of urban fibre-optic networks, PIPE Networks Limited. This acquisition brought welcome new capacity to TPG, and crucially granted it control of one of the only three physical international network linkages between Australia and the rest of the world. As such, the deal was strongly pursued by TPG as a strategic move to strengthen the company’s overall market position.
In April 2008, SP Telemedia merged with TPG Holdings Limited, creating a combined entity that generated $500 million per annum. In a further expansion, the company acquired Pipe Networks in late 2009. The acquisition added an additional 1.0 million metres of fibre-optic network to TPG’s network and approximately $50 million of wired telecommunications revenue. TPG is pursuing an aggressive growth strategy, releasing an unlimited broadband package, in addition to a home-phone bundle package, where the monthly line rental is just $1.00 per month.
In December 2009, the company officially changed its name from SP Telemedia to TPG Telecom Limited. In 2008-09, IBISWorld estimates the company achieved industry revenue share of 3.5% and accounted for 6.8% of subscribers. Soul’s voice and data network features 333 DSLAM exchanges with a further 63 exchange builds in progress. Much of the expansion plans
Other Companiescontinued

www.IbISwOrLd.COM.Au Telecommunications Services in Australia May 2012 36
Major Companies
focus on Western Australia: the home turf of booming ISP iiNet. Soul is following the lead of iiNet in upgrading its DSLAM network to support new voice products.
Frequency Infrastructure Estimated market share: 0.9%In June 2009, Macquarie Communications Infrastructure Group (MCG) was acquired by the Canada Pension Plan Investment Board (CPPIB). In July, the assets of MCG were subsequently rolled into a company named CPPIB Communications Infrastructure Limited. The crown jewel of these assets is Frequency Infrastructure (FI), which operates the most extensive broadcast transmission infrastructure network in Australia.
FI provides TV and radio transmission services, offering a range of services to national, commercial and community broadcasters as well as to telecommunications companies and emergency services communication providers. FI’s transmission infrastructure network reaches over 99% of the Australian population.
The services offered by FI – and the wider industry – are very capital intensive. FI has a high fixed-cost business model, in which FI incurs significant annual depreciation and interest costs, regardless of business volume. As a result, the company bottom line is very sensitive to changes in revenue. To reduce the operating risk such a model possess, FI requires its customers to sign contracts that range up to 20 years.
In 2009, the provision of terrestrial broadcast services accounted for 72% of the $304 million in total FI revenue. This is down from an 85% share of the revenue in 2001, reflecting an increase in the number clients in addition to the lucrative, long-term contracts signed with the ABC and SBS.
Importantly, FI’s willingness to embrace the digital revolution and invest heavily in digital-based infrastructure is paying off. During the past five years, FI has been trialling digital radio,
infocasting and mobile TV. In fact, many of BA’s key contract wins over the past five years have been for the delivery of digital transmission services. And, IBISWorld expects the provision of digital services will be the basis for continued revenue growth in 2010-11.
In general, the higher business volume has enabled the company to improve its operational earnings. This is consistent with the company’s high fixed-costs business model- higher business volume on average leads to increased profitability. But when taking into account depreciation and financing costs, the news has not been great. In recent years FI’s bottom line has weakened considerably under the weight of high financing and depreciation costs. In 2008-09, the company incurred a net loss of almost $225 million, up from a loss of more than $15 million the previous year. For 2008-09, depreciation expense increased more than 50% and financing costs jumped more than 80%. Such are the hazards of a capital intensive industry.
NBN Co. LimitedIn April 2009, the Australian Government announced it would establish a new company to invest up to $43 billion over eight years delivering superfast broadband to Australian homes and workplaces. To achieve this goal, a new company was established, NBN Co. Limited, to build and operate the network.
The network managed by NBN Co. will be an open-access, wholesale-only network. One of the driving forces behind the move is to enhance the competitive environment by removing the large economies of scale that Telstra has previously enjoyed. It is the NBN Co.’s intention to give each provider equal access to the network, which will ultimately lead to increased innovation and choice throughout the market. Thus, the ultimate winner will be the end user who will have the power to choose the service and service provider that best suits their needs.
Other Companiescontinued

www.IbISwOrLd.COM.Au Telecommunications Services in Australia May 2012 37
Capital Intensity The Australian Telecommunications Services sector exhibits a high level of capital intensity. There are significant initial investment costs that are associated with the formation and entry into the sector. The sector is becoming more capital intensive as it sheds employees in an attempt to improve operational efficiency, whilst concurrently investing heavily in new technologies and infrastructure upgrades (including the likes of fibre optic cables and advanced third generation mobile technologies). Initially, sector participants undertook significant headcount reductions in the aftermath of the global telecommunications downturn that persisted during the early 2000s. More recently, a spate of merger and acquisition activity has seen further job cuts. The biggest cuts have come from the VHA deal with 870 people made redundant: 320 due to role duplication
and a further 450 positions shifted offshore to India. IBISWorld expects for the five years through 2011-12 the annual employment decline will average 2.9%.
Telecommunications companies employee staff to deliver services to a range of markets from corporate and
Operating ConditionsCapital Intensity | Technology & Systems | Industry Volatilityregulation & Policy | Industry Assistance
Tools of the trade: Growth strategies for success
SOURCE: WWW.IBISWORLD.COM.AU
Labo
ur In
tens
ive Capital Intensive
Change in Share of the Economy
New Age Economy
recreation, Personal Services, Health and Education. Firms benefi t from personal wealth so stable macroeconomic conditions are imperative. Brand awareness and niche labour skills are key to product differentiation.
Traditional Service Economy
wholesale and retail. Reliant on labour rather than capital to sell goods. Functions cannot be outsourced therefore fi rms must use new technology or improve staff training to increase revenue growth.
Old Economy
Agriculture and Manufacturing. Traded goods can be produced using cheap labour abroad. To expand fi rms must merge or acquire others to exploit economies of scale, or specialise in niche, high-value products.
Investment Economy
Information, Communications, Mining, Finance and real Estate. To increase revenue fi rms need superior debt management, a stable macroeconomic environment and a sound investment plan.
Consumer Goods retailbusiness Services
Education
Telecommunications Services
Level The level of capital intensity is High
Capital intensity
2.00
0.00
0.40
0.80
1.20
1.60
SOURCE: WWW.IBISWORLD.COM.AUDotted line shows a high level of capital intensity
Capital units per labour unit
Telecommuni-cations Services
Communication Services
Economy
www.IbISwOrLd.COM.Au Telecommunications Services in Australia May 2012 38
Operating Conditions
Technology& Systems
The rapid evolution of the Telecommunications Services sector continues to be driven by technology developments. The life cycle of the copper wire network is finally nearing an end, as Telstra and the NBN Co. have come to an in principle agreement that the FTTH NBN will eventually replace this ancient piece of infrastructure. Meanwhile, 3G technology has hit maturity but will not stay there for long with the introduction of 4G technology and services only three
or four years away, the closure of analogue televisions will release spectrum that will be used for 4G services. Once FTTH and 4G technology becomes integrated and entrenched within the economy, Australia will be able to transition to a digital economy. Full convergence will be achieved within the media and communications space with each network being capable of delivering the same services using the same devices. This will see
Capital Intensitycontinued
government users through to households. Major activities include marketing and sales, account administration and support, web and software development and hardware and network engineering. Over the past decade a large number of lower-paid administrative tasks have been automated, with a large number of jobs being replaced by far fewer database administration positions. The sector’s wage expense is expected to be $4.7 billion in 2011-12, with the Wired Telecommunications Carriers industry accounting for the largest proportion of wage costs.
While jobs have been falling, Australian telecommunications companies have been investing heavily in network infrastructure and IT systems. The three major mobile carriers continue to splash out on their networks in an effort to squeeze greater speed out of 3G technology. The ISPs (e.g. iiNet, Optus and SP Telemedia) have been spending big on ADSL2+ exchanges to enhance service coverage and speed in the hope of competing against the dominant incumbent, Telstra. Meanwhile, Telstra has spent $750 million on upgrading its HFC network to deliver 100 Mbps connectivity. This blows ADSL2+ out of the water and will bring the network in direct competition with the NBN. Over the next decade the Federal Government will spend (via NBN Co.) $43 billion on building the fibre-to-the-home NBN. Fundamentally, infrastructure is an effective means for competing in the
telecommunications space. Continuous investment is necessary due to the rate of change in technologies.
IBISWorld uses depreciation expense as a proxy for capital investment and uses wage expenses as a proxy for labour. At the end of fiscal 2012, it is forecast that the sector will exhibit a capital to labour ratio of 1:0.70, which means that for every dollar spent on depreciation, the sector spends $0.70 on labour. This is considered a high level of capital intensity. The contrasting trends in employment and infrastructure investment have meant that the Telecommunications Services sector has become more capital orientated over the last five years, as the ratio was 1:0.90 in 2006.
However, not all industries within the Telecommunications Services sector invest heavily in network infrastructure and so exhibit a high level of capital intensity. The Telecommunications Resellers industry is the least capital intensive of the sector because resellers purchase wholesale network access from carriers to then on-sell services. This means, resellers do not own and operate infrastructure and so bypass network investment and the associated risk. However, this does mean resellers realise much lower margins as they essentially have less investment and risk to achieve a return on. Resellers generally spend about $8.80 on labour for every dollar they absorb in depreciation, which indicates low capital intensity.
Level The level of Technology Change is High

www.IbISwOrLd.COM.Au Telecommunications Services in Australia May 2012 39
Operating Conditions
Technology& Systemscontinued
telecommunications become a utility and as critical to business success as electricity.
Over the last 15 years a lot has changed in the Telecommunications Services sector. The shift from analogue to digital technology enabled the transmission of voice, images and data through the same network. Investment in fibre-optic cable boosted transmission capacity and speed, facilitating the delivery of new services such as high-quality video transmissions. The transition through mobile generational technologies presented telcos with the opportunity to expand beyond the traditional voice service to the new world of mobile broadband. These technology developments have altered the mix of products offered by the sector. In 2009-10, the delivery of mobile services generated as much revenue as wired and fixed internet combined. It was only five years ago that revenue from these two services was almost 50% greater than mobile.
Wireline technology – copper, HFC and fibreWires and cables were the original medium for telecommunications. Copper wires have formed the basis of the Public Switched Telephone Network (PSTN) over most of its history, though fibre optic cables are continuing to make rapid inroads. The advent of commercial fibre-optic cables in the mid-1970s revolutionised the carrying of telecom traffic by boosting speeds and capacity. High-capacity submarine fibre-optic cables successfully increased capacity on international routes to record levels, thereby reducing carrying costs. Telcos with optical-fibre transmission infrastructure include the likes of Telstra, SingTel Optus and PowerTel. Other cable types include coaxial cable, which is used by cable television operations. Players with HFC networks include Telstra, SingTel Optus, WindyTide and Broadcast Engineering Services. HFC networks can carry data and voice services to consumers.
Given the capital intensity in building
a fibre network in Australia, recent technological developments have focused on extending the functionality of the copper wire local loop to cope with consumer and carrier need for increased carrying speeds. This has been done using compression technologies such as xDSL (digital subscriber lines) that allow ordinary copper lines to carry digital content at high speed using higher frequencies. The x refers to the numerous variants of the technology. By using copper wire as a conduit for a wider range of services (e.g. high speed internet, video and multiple channel voice) technologies such as DSL have extended the life of the existing copper infrastructure. However, the building of the $43 billion FTTH NBN will represent a revolution in Australian wireline technology and render the copper PSTN obsolete. It will ultimately see all voice become IP based and see network speeds jump from 24 Mbps to 100 Mbps for 90% of the Australian population.
VoIPThe development of voice over internet protocol (VoIP) technology will directly challenge the way wired communications operate as it is a potential substitute to the traditional fixed call. Compared with PSTN fixed-voice, VoIP is generally cheaper, has a more efficient call process and offers additional functions. VoIP technology allows calls to be made in digital form as voice calls are converted into binary code and then converted back to sound at the receiving end.
The broadband infrastructure developments will continue to increase the availability of VoIP to Australian consumers, and VoIP will significantly transform the Australian fixed-voice market. VoIP services offer benefits in
Key technologies that are transforming and driving sector growth include digital and fibre optics

www.IbISwOrLd.COM.Au Telecommunications Services in Australia May 2012 40
Operating Conditions
Technology& Systemscontinued
terms of cost reductions to users, there is considerable potential for VoIP to eat into traditional fixed-line service customers in the same way that mobile services have done. VoIP technology will force wired telecommunication carriers to rethink their pricing strategies, as the tradition voice call will come under increasing pressure due to price substitution. VoIP technology will actually cannibalise existing revenue streams and for this reason the large telcos are remiss to offer the service, it is small participants that are championing the technology and once it reaches critical mass it will have to be adopted on mass by the major telcos.
Mobile technologyThe first generation of mobile technology was the advanced mobile phone system (AMPS). The AMPS only had voice functionality and was first established in Australia by Telstra in 1987. The system was inefficient in its use of spectrum and the network was closed in 2000. The second generation of mobile technology (2G) is now in decline. In 2008-09, 2G services accounted for about 50% of all mobile services compared with more than 90% in 2005-06. In 2008-09, 3GSM enabled mobile handset accounted for over 60% of total mobile subscriptions. 2G is in decline because of its limited data functionality.
2G (and 2.5G) services are provided on two networks; global system for mobiles (GSM) and code division multiple access (CDMA). GSM supports voice, data and text messaging and allows roaming between different networks. The technology was first introduced into the Australian market in 1993 and all carriers operate GSM networks using 900 MHz and 1800 MHz spectrum. CDMA technology is no longer used in the Australian market. Hutchison shut down its network, which partly relied on Telstra’s, in August 2006. Telstra then shut down its CDMA network in April 2008.
The 2.5G technology refers to the increased functionality of 2G and is a
stepping stone between 2G and 3G as it offers enhanced data services such as wireless application protocol (WAP) and MMS. WAP offers mobile-internet connectivity, albeit at slower speeds. WAP services failed to take-off on 2.5G networks due to slow data speeds. General packet radio service (GPRS) allows faster transmission speeds of voice and data than original GSM technology and supplements short message service (SMS) technologies. All three incumbents had GPRS capability since 2002-03, but Telstra was first to market in early 2001.
Enhanced data rates for GSM evolution (EDGE) is an update of GPRS technology used on the GSM network. By using EDGE, operators can handle three times more subscribers than GPRS; triple their data rate per subscriber, or add extra capacity to their voice communications. EDGE, similar to CDMA2000, offers slightly superior performance relative to GPRS but is not considered 3G technology.
3G technology was first offered in Australia by VHA, as Hutchison’s 3 in 2003. Until 2005, 3 was the only carrier in Australia to offer third generation mobile telephony services. Now all three major carriers are entrenched in the market and with the recent introduction of the smartphone, penetration will continue to increase as content, services and prices improve. 3G technology offers services such as music and video downloads, improved internet connectivity and a host of data intensive services. All carriers rely on wideband code division multiple access (W-CDMA) technology to deliver 3G services.
The confusing terms 3.5G and 3.75G simply refer to enhanced 3G services that do not reach the agreed parameters for services classified as 4G. 3.5G typically refers to high speed downlink packet access (HSDPA) whereas 3.75G refers to enhanced HSDPA (eHSDPA). HSDPA is UMTS compatible and offers downlink speeds of up to 14.4 Mbps. HSDPA is an advancement on W-CDMA and Telstra was expected to upgrade their HSDPA network to eHSDPA to accommodate

www.IbISwOrLd.COM.Au Telecommunications Services in Australia May 2012 41
Operating Conditions
revenue Volatility The Telecommunications Services sector is becoming less volatile as its services become more entrenched within the daily lives of businesses and consumers. Moreover, instability in specific industries is generally caused by competition from other telecommunications industries, but the underlying demand for telecommunications services remains. As such when looking at the big, sector-wide picture, volatility is reduced. For example, the shift in wired to mobile is inducing downside volatility for wired and upside volatility for mobile.
IBISWorld estimates that sector revenue volatility for the five years through 2011-12 will remain at a level considered low. IBISWorld forecast that
sector volatility will remain low during the next five years. The industries within the sector that will exhibit moderate revenue volatility will be the growth industries: mobile and ISPs.
Sector-wide profitability volatility has been at a moderate level over the last five years. The high fixed-cost nature of the sector magnifies small changes in demand. Also the shift in the product mix is much more influential to the margin, as margins are much higher in the Wired Telecommunications Carriers industry when compared to the remainder of the sector. Another effect on profitability has been the life-cycle transition of mobile technologies, as they transition through their life cycle the margins vary greatly.
Technology& Systemscontinued
downlink speeds of up to 42 Mbps by the end of 2009.
4G services (as determined by the International Telecommunication Union) will be those that support transmission speeds of up to 100 Mbps for downlinks when a user is travelling at high speeds and 1 Gbps when travelling at low speeds. Such speeds will realise total convergence of devices such that on-demand media will be able to be played and viewed on a handheld device, mobile or laptop utilising a 4G data card. It is widely acknowledged that NTT DoCoMo is the major proponent of 4G technology with aims of introducing the service in 2010. IBISWorld does not expect a commercial rollout of a 4G network until sometime between 2013 and 2015. This is because the four carriers are yet to achieve sufficient returns on their 3G networks.
Wi-Fi and WiMaxWi-Fi and WiMax are not technologies but confirmation that equipment makers have met a strict set of rules and interoperability tests for the standards governed by the Institute of Electrical and Electronic Engineers (IEEE). These standards allow wireless internet access for a broad range of products that include
laptops, PDAs and cells.Super 3G wireless infrastructure has
facilitated a significant improvement in wireless data, with flow on effects in services, usage and revenue. Data revenue is presently one of the sector’s major growth drivers. However, the price and efficiency of data streaming to customers over super 3G infrastructure is not as cost competitive as the delivery of data services over Wi-Fi or WiMax standard technology. Building 3G cell sites (i.e. base stations) is much more expensive than establishing Wi-Fi or WiMax infrastructure, with approximately 75% of the expense associated with land, construction and maintenance. This will be the same for LTE 4G.
Wi-Fi is reliant on proximity, which makes national blanket coverage nigh on impossible. However, because of its low capital and operating costs, Wi-Fi hotspots are commonplace in locations where wireless access adds value (e.g. airports, cafes and libraries). However, WiMax provides service to an area between three and ten kilometres without line-of-site requirements and with superior capacity and speed. This is why WiMax has been described as a future technology for years.
Level The level of Volatility is Low

www.IbISwOrLd.COM.Au Telecommunications Services in Australia May 2012 42
Operating Conditions
regulation & Policy Historically, the dominating feature of the Telecommunications Services sector was a publicly controlled monopoly protected from competition via legislation. The last 15 years has seen considerable liberalisation of telecommunications. Governments (here and abroad) began by introducing competition through granting new entrants access via a controlled licensing system and then moved to a more open and competitive market regime with an emphasis on industry self-regulation. The primary drivers of this development included various technological advances, the move to a more service-based economy and the associated demand for high-speed electronic information transfers and general dissatisfaction with the existing monopolistic structure.
The move towards deregulation in Australia began with the Telecommunications Act 1989, by which the Federal Government introduced competition into the Telecommunications Services sector. In 1991, the passing of the Telecommunications Act 1991 signalled the second step, enabling the introduction of limited infrastructure competition and full resale of telecommunications services. A regulatory climate promoting open
competition was achieved in July 1997 with the institutionalisation of the Telecommunications Act 1997. This signalled a new era in the Telecommunications Services sector. The main objectives of this new legislation was to provide a regulatory framework that promoted the long-term interests of consumers, as well as the efficiency and international competitiveness of the Australian Telecommunications Services sector. Overall, the deregulation of the sector has been successful in improving services and decreasing prices over the last decade. However, the incumbent operator, Telstra, still dominates the sector still accounting for almost 50% of total revenue and still benefiting from largest scale benefits.
Industry bodies and regulatorsUnder the new regulatory framework, three main types of industry operators are subject to regulation. The first, carriers, own specified infrastructure facilities and must hold a carrier licence granted by the Australian Media and Communications Authority (ACMA) under the Telecommunications Act 1997. There are no longer any limits on the number of carriers that can be licensed to operate in the local market. The second, carriage
revenue Volatilitycontinued
SOURCE: WWW.IBISWORLD.COM.AU
Volatility vs Growth
reve
nue
vola
tility
* (%
)
1000
100
10
1
0.1
Five year annualised revenue growth (%)–30 –10 10 30 50 70
Hazardous
Stagnant
rollercoaster
blue Chip
* Axis is in logarithmic scale
Telecommunications Services
A higher level of revenue volatility implies greater industry risk. Volatility can negatively affect long-term strategic decisions, such as the time frame for capital investment.
When a fi rm makes poor investment decisions it may face underutilised capacity if demand suddenly falls, or capacity constraints if it rises quickly.
Level & Trend The level of Regulation is Heavy and the trend is decreasing

www.IbISwOrLd.COM.Au Telecommunications Services in Australia May 2012 43
Operating Conditions
regulation & Policycontinued
service providers, supply certain carriage services using network units and include internet service providers. Carriers may also be carriage service providers. Under the 1997 Act carriage service providers were granted many of the same access rights, as well as obligations, as carriers. Finally, content service providers deliver broadcasting and online services. Access rights are granted under the Trade Practices Act 1974, whilst content is regulated by the ACMA.
Regulatory control over the sector resides with the ACMA, Australian Competition and Consumer Commission (ACCC) and Federal Department of Communications, Information Technology and the Arts. However, the Telecommunications Act 1997 allowed for an increased scope for self regulation, particularly in areas such as access, interconnection standards, technical standards and consumer and customer service standards. The primary avenues for self-regulation include the Communications Alliance (formerly the ACIF and SPAN), the Australian Communications Access Forum (ACAF) and the Telecommunications Industry Ombudsman (TIO).
Legislation applicable to the Telecommunications Services sector that goes beyond the Telecommunications Act 1997, includes the Australian Communications Authority Act 1997, the Radiocommunications Act 1992, the Telecommunications (Transitional Provisions and Consequential Amendments) Act 1997, the Trade Practices Amendment (Telecommunications) Act 1997 and the Telecommunications (Consumer Protection and Services Standards) Act 1999. The latest piece of legislation to be introduced is the Telecommunications Competition Act 2002.
Declared servicesAccess rights are an all important issue within the Telecommunications Services sector given that competitors must use each other’s networks. The Trade Practices Amendment
(Telecommunications Act 1997) controls anti-competitive conduct by telecommunications carriers and carriage service providers and deals with access to telecommunication services. Under this ACCC administered Act, carriage services can be declared whereupon carriage service providers supplying these services are under an obligation to supply the services to requesting service providers. Thus, once a service has been declared, it is essentially under the control of the regulatory framework. Declared services to date include those relating to the PSTN, the ISDN, local telecommunication services, inter-city and inter-capital transmission services, digital data access services (DDAS), the domestic global system for mobiles (GSM) and broadcasting services.
Carriers and carriage service providers of declared services are generally required to provide interconnection with, and access to those services, on reasonable terms and conditions, to any access seeker. The approach taken by the legislative regime is based on commercial negotiation of access terms and conditions between the parties in the first instance, supported by a requirement for arbitration of disputes by the ACCC if the negotiations fail.
Price controls and restrictions have been one of the government’s main regulatory instruments, primarily as a means of preventing abuse of market power. Thus over the years the government has set various retail price controls on some of Telstra’s (and its predecessors, Telecom and OTC) telephony and data services, particularly within the PSTN market. In recent times, Telstra has been pricing services under the proposed prices set by the ACCC, a sign that the Telecommunications Services sector is actually extremely competitive and that the deregulation is working as the sector is self-regulating.
Customer service guarantees (CSGs) are an important legislative consumer safeguard with regards to the fixed service network. Commencing on 1 January 1998 the CSG imposed a level of

www.IbISwOrLd.COM.Au Telecommunications Services in Australia May 2012 44
Operating Conditions
regulation & Policycontinued
performance on carriage service providers of standard telephone services in line with the government’s efforts to improve the quality of specified services such as fault rectification and new service connections. It also compensates consumers in the instances where the performance standards are not met. A new CSG Standard was introduced in July 2000, the Telecommunications (Customer Service Guarantee) Standard 2000 (no 2), replacing the previous standard.
Universal service obligations (USOs) have been a cornerstone of the Australian telecommunications framework. USOs are used as a regulatory means for social policy reasons. A USO is the obligation placed upon the designated universal service provider to ensure that defined telecommunications services are reasonably accessible to all people in Australia on an equitable basis, wherever they reside or carry on business. The enforcement of the USO ensures that certain service standards for all telecommunications users are met. USO subsidies for 2008-09 amounted to $145 million, which was consistent with the previous year.
Telstra is the primary universal service provider (USP), though the Federal Government has sought to introduce USO contestability on a number of occasions. In 2008 the government’s latest effort to increase contestability, Broadband Connect, failed. This was as the government terminated its contract with Opel (a joint venture between Optus and Elders) to build a regional broadband network to provide coverage to under-serviced premises.
Interconnection costs (otherwise known as PSTN originating and terminating charges) are also regulated by the ACCC. These are the charges levied by Telstra on other telecommunications carriers for Domestic PSTN Originating and Terminating Access services and represent a considerable proportion of the costs incurred by service providers in supplying long distance, fixed-to-mobile and mobile-to-fixed calls to consumers.
The price of interconnections costs has come down over the past decade, which has benefited competing telcos at Telstra’s expense.
National Broadband NetworkIn April 2009, the Federal Government outlined a plan to build a $43 billion, 100 Mbps fibre-to-the-home (FTTH) NGN to cover 93% of the Australian population. The remaining 7.0% of citizens are to get 12 Mbps connectivity using a combination of mobile and satellite technology. The plan involves the establishment of an NBN company (NBN Co.), which will be at least 51% government controlled, to oversee the network build and act as the wholesale entity. NBN Co. will sell network access and capacity to telecommunication companies for retail to businesses, consumers and government agencies.
In September 2009, The Australian Government released a Telecommunications Regulatory Reform document, with the main design being to address Telstra’s high level of integration. It is the government’s desire for Telstra to voluntarily structural separate. Telstra and the NBN Co. appear to be on the same page, with both releasing statements that the NBN fibre network will gradually replace, not coexist, with the PSTN. This signals a change in tact for Telstra, moving away from the provocative stance taken under Sol Trujillo, having stated its desire to cooperate with the government whilst ensuing that the interests of its many shareholders are also looked after. Both Telstra and the government want to come to an agreed result, but the crux of the issue going to be around negotiations regarding the future value of Telstra’s network assets, the government has valued Telstra’s network at about $20 billion.
Plenty of sticking points remain with the proposed plan. Telstra and other telcos have raised concerns at the proposed privatisation of the NBN Co. within five years of network rollout completion. The telcos were already unhappy with the announcement that the

www.IbISwOrLd.COM.Au Telecommunications Services in Australia May 2012 45
Operating Conditions
Industry Assistance Import tariffs do not apply to the Telecommunications Services sector. Following the 1997 removal of regulatory barriers to entry, Australia now has a liberalised telecommunication services market that is open to foreign participation. The Federal Government actively encourages foreign investment in the Telecommunications Services sector, in line with the WTO’s General Agreement in Trade in Services (GATS), which contains an annex on telecommunications. Under the annex, governments must ensure that foreign service suppliers are given access to the public telecommunications networks without discrimination.
Over the last decade the government has provided a number of packages to improve the provision of telecommunication services within Australia. Examples include the $250 million ‘Networking the Nation’ program, the ‘Framework for the Future’ project and the numerous initiatives aimed at improving the provision of telecommunication services in remote Australia. One such program is the Universal Service Obligation (USO). The ACMA states the USO is the obligation placed on universal service providers to ensure that standard telephone services, payphones and prescribed carriage services are reasonably accessible to all people in Australia on an equitable basis, wherever they reside or carry on business. Telstra is currently the sole universal
service provider and in 2008-09 the subsidy paid to support Telstra in meeting the USO was $145 million.
In January 2006, the Federal Government commenced the Broadband Connect initiative, which is an $878 million initiative of the Australian Government to provide registered internet service providers with incentive payments to supply higher bandwidth services in regional, rural and remote areas of Australia at prices comparable to those available in metropolitan areas. Broadband Connect is part of the Government’s $1.1 billion Connect Australia program, which also included $50 million for the Metropolitan Broadband Connect initiative.
Industry assistance in the Telecommunications Services sector will increase over the next five years under the Federal Government’s NBN initiative. The government will invest $43 billion in establishing the FTTH NBN. However, the NBN Co. will not be just another telco and it will be positioned to have trans-sector benefits instead of focusing solely on the Telecommunications Services sector.
regulation & Policycontinued
NBN Co. will also have the propensity to offer direct retail services to government agencies. The two factors could combine to create a new communications monopoly that is even more powerful and better resourced than the existing Telstra.
The government is in a tough situation as it at pains to point out that the NBN must be positioned to best benefit the Australian economy in its entirety and this can often be opposed to what is best for key stake holders in the sector.
Sector assistance is set to surge as the government spends $43 billion on a new national network
Level & Trend The level of Industry Assistance is Medium and the trend is Increasing

www.IbISwOrLd.COM.Au Telecommunications Services in Australia May 2012 46
Key Statisticsrevenue
($m)
Industry Value Added
($m) Establishments Enterprises Employment Exports Importswages ($m)
domestic demand
2002-03 42,528.6 20,692.2 1,536 791 70,420 -- -- 5,968.6 n/A2003-04 42,944.3 20,590.7 1,736 920 71,834 -- -- 6,031.7 n/A2004-05 43,036.2 20,698.4 1,833 927 74,172 -- -- 6,142.5 n/A2005-06 42,606.6 19,296.7 1,708 711 72,846 -- -- 6,049.7 n/A2006-07 42,627.5 19,423.5 1,772 685 70,081 -- -- 5,804.5 n/A2007-08 42,415.8 19,277.0 1,823 643 67,791 -- -- 5,554.2 n/A2008-09 42,585.5 18,741.4 1,909 627 64,765 -- -- 5,309.7 n/A2009-10 43,182.9 17,712.4 1,953 611 62,785 -- -- 5,219.2 n/A2010-11 41,617.7 18,244.6 2,066 610 61,737 -- -- 4,904.3 n/A2011-12 40,787.5 18,025.8 2,133 617 60,618 -- -- 4,715.5 N/A2012-13 41,935.1 18,475.8 2,135 637 60,238 -- -- 4,795.1 n/A2013-14 43,202.2 18,745.9 2,128 655 60,115 -- -- 4,827.2 n/A2014-15 44,980.7 19,415.2 2,076 643 59,880 -- -- 4,892.4 n/A2015-16 46,720.9 20,377.5 2,022 629 59,560 -- -- 4,968.4 n/A2016-17 47,166.7 20,694.2 2,012 626 59,040 -- -- 4,983.0 n/A
IVA/revenue (%)
Imports/demand (%)
Exports/revenue (%)
revenue per Employee
($’000)wages/revenue
(%)Employees
per Est.Average wage
($)
Share of the Economy
(%)2002-03 48.65 n/A n/A 603.93 14.03 45.85 84,757.17 1.992003-04 47.95 n/A n/A 597.83 14.05 41.38 83,967.20 1.902004-05 48.10 n/A n/A 580.22 14.27 40.46 82,814.27 1.852005-06 45.29 n/A n/A 584.89 14.20 42.65 83,047.80 1.682006-07 45.57 n/A n/A 608.26 13.62 39.55 82,825.59 1.632007-08 45.45 n/A n/A 625.68 13.09 37.19 81,931.23 1.562008-09 44.01 n/A n/A 657.54 12.47 33.93 81,984.10 1.492009-10 41.02 n/A n/A 687.79 12.09 32.15 83,128.14 1.382010-11 43.84 n/A n/A 674.11 11.78 29.88 79,438.59 1.402011-12 44.19 N/A N/A 672.86 11.56 28.42 77,790.43 1.332012-13 44.06 n/A n/A 696.16 11.43 28.21 79,602.58 1.312013-14 43.39 n/A n/A 718.66 11.17 28.25 80,299.43 1.282014-15 43.16 n/A n/A 751.18 10.88 28.84 81,703.41 1.292015-16 43.62 n/A n/A 784.43 10.63 29.46 83,418.40 1.322016-17 43.87 n/A n/A 798.89 10.56 29.34 84,400.41 n/A
Figures are inflation-adjusted 2012 dollars. Rank refers to 2012 data.
revenue (%)
Industry Value Added
(%)Establishments
(%)Enterprises
(%)Employment
(%)Exports
(%)Imports
(%)wages
(%)
domestic demand
(%)2003-04 1.0 -0.5 13.0 16.3 2.0 n/A n/A 1.1 n/A2004-05 0.2 0.5 5.6 0.8 3.3 n/A n/A 1.8 n/A2005-06 -1.0 -6.8 -6.8 -23.3 -1.8 n/A n/A -1.5 n/A2006-07 0.0 0.7 3.7 -3.7 -3.8 n/A n/A -4.1 n/A2007-08 -0.5 -0.8 2.9 -6.1 -3.3 n/A n/A -4.3 n/A2008-09 0.4 -2.8 4.7 -2.5 -4.5 n/A n/A -4.4 n/A2009-10 1.4 -5.5 2.3 -2.6 -3.1 n/A n/A -1.7 n/A2010-11 -3.6 3.0 5.8 -0.2 -1.7 n/A n/A -6.0 n/A2011-12 -2.0 -1.2 3.2 1.1 -1.8 N/A N/A -3.8 N/A2012-13 2.8 2.5 0.1 3.2 -0.6 n/A n/A 1.7 n/A2013-14 3.0 1.5 -0.3 2.8 -0.2 n/A n/A 0.7 n/A2014-15 4.1 3.6 -2.4 -1.8 -0.4 n/A n/A 1.4 n/A2015-16 3.9 5.0 -2.6 -2.2 -0.5 n/A n/A 1.6 n/A2016-17 1.0 1.6 -0.5 -0.5 -0.9 n/A n/A 0.3 n/A
Annual Change
Key ratios
Industry data
SOURCE: WWW.IBISWORLD.COM.AU

www.IbISwOrLd.COM.Au Telecommunications Services in Australia May 2012 47
Jargon & Glossary
bArrIErS TO ENTry Barriers to entry can be High, Medium or Low. High means new companies struggle to enter an industry, while Low means it is easy for a firm to enter an industry.
CAPITAL/LAbOur INTENSITy An indicator of how much capital is used in production as opposed to labour. Level is stated as High, Medium or Low. High is a ratio of less than $3 of wage costs for every $1 of depreciation; Medium is $3-$8 of wage costs to $1 of depreciation; Low is greater than $8 of wage costs for every $1 of depreciation.
CONSTANT PrICES The dollar figures in the Key Statistics table, including forecasts, are adjusted for inflation using 2011-12 as the base year. This removes the impact of changes in the purchasing power of the dollar, leaving only the ‘real’ growth or decline in industry metrics. The inflation adjustments in IBISWorld’s reports are made using the Australian Bureau of Statistics’ implicit GDP price deflator.
dOMESTIC dEMANd The use of goods and services within Australia; the sum of imports and domestic production minus exports.
EArNINGS bEFOrE INTErEST ANd TAX (EbIT) IBISWorld uses EBIT as an indicator of a company’s profitability. It is calculated as revenue minus expenses, excluding tax and interest.
EMPLOyMENT The number of working proprietors, partners, permanent, part-time, temporary and casual employees, and managerial and executive employees.
ENTErPrISE A division that is separately managed and keeps management accounts. The most relevant measure of the number of firms in an industry.
ESTAbLISHMENT The smallest type of accounting unit within an Enterprise; usually consists of one or more locations in a state or territory of the country in which it operates.
EXPOrTS The total sales and transfers of goods produced by an industry that are exported.
IMPOrTS The value of goods and services imported with the amount payable to non-residents.
INduSTry CONCENTrATION IBISWorld bases concentration on the top four firms. Concentration is identified as High, Medium or Low. High means the top four players account for over 70% of revenue; Medium is 40 –70% of revenue; Low is less than 40%.
INduSTry rEVENuE The total sales revenue of the industry, including sales (exclusive of excise and sales tax) of goods and services; plus transfers to other firms of the same business; plus subsidies on production; plus all other operating income from outside the firm (such as commission income, repair and service income, and rent, leasing and hiring income); plus capital work done by rental or lease. Receipts from interest royalties, dividends and the sale of fixed tangible assets are excluded.
INduSTry VALuE AddEd The market value of goods and services produced by an industry minus the cost of goods and services used in the production process, which leaves the gross product of the industry (also called its Value Added).
INTErNATIONAL TrAdE The level is determined by: Exports/Revenue: Low is 0-5%; Medium is 5-20%; High is over 20%. Imports/Domestic Demand: Low is 0-5%; Medium is 5-35%; and High is over 35%.
LIFE CyCLE All industries go through periods of Growth, Maturity and Decline. An average life cycle lasts 70 years. Maturity is the longest stage at 40 years with Growth and Decline at 15 years each.
NON-EMPLOyING ESTAbLISHMENT Businesses with no paid employment and payroll are known as non-employing establishments. These are mostly set-up by self employed individuals.
VOLATILITy The level of volatility is determined by the percentage change in revenue over the past five years. Volatility levels: Very High is greater than ±20%; High Volatility is between ±10% and ±20%; Moderate Volatility is between ±3% and ±10%; and Low Volatility is less than ±3%.
wAGES The gross total wages and salaries of all employees of the establishment.
Industry Jargon
IbISworld Glossary
AVErAGE rEVENuE PEr uSEr (ArPu) A key performance indicator in telecommunications and indicates whether revenue is due to increased customers or phone usage. ARPU is revenue divided by the average number of subscribers.
brOAdbANd A term used to denote any always-on, high data rate internet connection, in excess of 265kilo bytes per second.
FIbrE-TO-THE-HOME (FTTH) An internet connection where fibre reaches the boundary of the living space, such as a box on the outside wall of a home.
INTErNET SErVICE PrOVIdEr (ISP) Provides internet access via fixed lines using dial-up and fixed broadband connections. ISPs may also offer a number of internet based support services.
POST-PAId A contract-based mobile phone service that is paid for after use. Subscribers receive a bill that is based on their use of mobile phone services for the month.
PrE-PAId A mobile phone service that is purchased prior to use. The subscriber purchases credit to use on a mobile phone network and in doing so, avoids ongoing billing.
PSTN Stands for public switched telecommunications network. The PSTn is provided with a digital core network, or an Integrated Services Digital network.
TELCO Abbreviated form of telecommunications company.

disclaimer
This product has been supplied by IBISWorld Pty Ltd. (‘IBISWorld’) solely for use by its authorised licenses strictly in accordance with their license agreements with IBISWorld. IBISWorld makes no representation to any other person with regard to the completeness or accuracy of the data or information contained herein, and it accepts no responsibility and disclaims all liability (save for liability which cannot be lawfully disclaimed) for loss or damage whatsoever suffered or incurred by any other person resulting from
the use of, or reliance upon, the data or information contained herein. Copyright in this publication is owned by IBISWorld Pty Ltd. The publication is sold on the basis that the purchaser agrees not to copy the material contained within it for other than the purchasers own purposes. In the event that the purchaser uses or quotes from the material in this publication – in papers, reports, or opinions prepared for any other person – it is agreed that it will be sourced to: IBISWorld Pty Ltd
At IBISWorld we know that industry intelligence is more than assembling factsIt is combining data with analysis to answer the questions that successful businesses askIdentify high growth, emerging & shrinking marketsArm yourself with the latest industry intelligenceAssess competitive threats from existing & new entrantsbenchmark your performance against the competitionMake speedy market-ready, profit-maximising decisions
who is IbISworld?We are strategists, analysts, researchers, and marketers. We provide answers to information-hungry, time-poor businesses. Our goal is to provide real world answers that matter to your business in our 500 Australian industry reports. When tough strategic, budget, sales and marketing decisions need to be made, our suite of Industry and Risk intelligence products give you deeply-researched answers quickly.
IbISworld MembershipIBISWorld offers tailored membership packages to meet your needs.
Copyright 2012 IBISWorld Pty Ltd
www.ibisworld.com.au | (03) 9655 3881 | [email protected]